Embed Size (px)
Citation preview

Solid State Storage (SSS) Performance Test Specification (PTS)
Version 2.0 Revision 0.7
Abstract: This Working Draft describes a solid state storage device-level performance test methodology, test suite and reporting format intended to provide an accurate,
repeatable and reliable comparison of NAND Flash-based solid state storage products of various form factors, protocols and interfaces used in Client and Enterprise applications.
Publication of this Working Draft for review and comment has been approved by the Solid State Storage (SSS) TWG. This draft represents a "best effort" attempt by the SSS TWG to reach preliminary consensus, and it may be updated, replaced, or made obsolete at any time. This document should not be used as reference material or cited as other than a "work in progress." Suggestion for revision should be directed to http://www.snia.org/feedback/.
Working Draft
February 10, 2017

SSS PTS Version 2.0-Revision 0.7 Working Draft 2
Revision History
Revision Release Date Originator Comments
May-2009 Jonathan Thatcher
• Initial proposal in SSS TWG • Initial Draft Outline
Jun-2009 Eden Kim • Added material re: Definitions, Reference Platform, Test
Definitions/Procedures, etc. • Content contributions from Eden Kim, Phil Mills, Easen Ho, Dave
Landsman, Steven Johnson
0.0.0 Jul-7-2009 Dave Landsman
• Major restructure to get overall document sections/styles in place for serious editing and 1st full committee review.
• Incorporated Calypso material. • Added section on Performance Index • Re-wrote Scope & Introduction
0.0.1 Jul-15-2009 Dave Landsman • Merged Jonathan Thatcher draft. • Merged Chuck Paridon definitions • Merged Chuck Paridon test flow (Annex) • Further general restructuring/editing.
0.0.2 Aug-4-2009 Dave Landsman • Updated Pre-conditioning and Test sections per Jul 20-22 F2F. • Integrated Logical/Physical Address conventions into Definitions. • Other general stylistic and editorial changes.
0.1 Sep-23-2009 Dave Landsman
• Changed versioning to x.y, from x.y.z • Miscellaneous edits in Sections 3 & 4 • Revised Section 5 (Pre-conditioning) for clarity • Flipped “for loop” in IOPS test (Sec. 6.2) • Added QD=1for IOPS test (Sec. 6) • Edited “Alternative Extended IOPS Test” (Section 6.6) • Added graphic for RPT spec (Annex A) • Added rough latency example to sample report (Annex B)
0.3 Dec-2-2009 Dave Landsman
• Based on slide version of spec (2009-10-23). No revision marks due to major restructure; this is clean version.
• Removed previous Pre-conditioning sections. • Restructured tests with suite of Client (Sections 6-8) and Enterprise
(Sections 9-11) tests. • Removed “Idle Test”. • Revised general flow of tests, plus types of reports. • Added new section (Section 5) to provide informative overview of test
flow, and other key concepts/definitions.
0.4 Dec-12-2009 Dave Landsman
• Clean version; no change bars • Changed “Active Use State” to “Steady State” • Completely revised Section 5 for better flow. • Added new 6 & 7 as prefaces to actual test sections. • Changed basic test flow to incorporate methodology where
convergence to Steady State must be detected AND maintained for duration of test.
• Updated Latency test loop parameters and report proposal per discussions w/ Gary Kotzur.
0.5 Feb-27-2010 Dave Landsman
Incorporated TWG changes from V0.4 • Updated section 1.2 for better background • Updated 1.4 with notes on App Testing and Reference Platform • Updated 2.1 with new/modified definitions (steady state, OIO, etc.) • Updated 4, in particular 4.2 with test tools requirements. • Completely rewrote/restructured Informative Section 5, including notes
on Data Patterns and IO demand (QD/TC). More complete explanations of Steady State, Detecting Steady State, etc.
• Rewrote Section 6 to provide better intro to detailed test flow. • Edited all tests per comments in TWG. • Deleted sample test report in appendix because need to remove
company identification from the sample and a Word bug made it impossible to remove just the name/logo. Will add back later.

SSS PTS Version 2.0-Revision 0.7 Working Draft 3
0.6 Mar-20-2010 Dave Landsman
• Integrated all changes from Mar-8-2010 TWG F2F • Rewrote material on IO Demand • Updated/Deleted/Checked definitions, & validated per SNIA Dictionary • Added “Test Parameters” to required reporting (Sec 3) • Revised Section 4 to better address platform requirements • Created new IOPS and Throughput Plots
0.7 Apr-23-2010 Dave Landsman
• Made all changes per comment resolution of V.06e (commentable) • Tried to make “shall”, “may”, etc. more explicit throughout spec • Re-ordered Reporting and Platform requirements sections for flow • Revised “Reporting Requirements” to be more clear. • Added Informative Annex B – PTS Platform Example • Added Informative Annex C – Synthetic Application Workloads • Restructured sections for flow.
0.7a May-19-2010 Dave Landsman • Integrated changes from V0.7 comment resolution, up through, and including Section 8, Client IOPS test.
0.8 June-07-2010 Dave Landsman
• Major update to get to final test structure, report formats, etc. • Integrated changes from V0.7a comment resolution. • Updated all test sections to new uniform structure. • ALL new graphs/charts/tables. • Inserted draft Annex A
0.9 June-22-2010 Dave Landsman • Continued cleanup. • First real edits of Annex A and B, mostly for formatting.
0.98 Nov-11-2010 Dave Landsman
• Removed Client sections and updated to make it “Enterprise” only. • Added Write Saturation Test • Changed block size to be the outer loop for Throughput test. • Added explanation of pseudo code in “Conventions” • Deleted “Test Overview”, no longer needed since Enterprise only. • Added Client and Enterprise to “Definitions” • Modified reporting requirement for when Steady State not reached. • Updated references.
0.99 Nov-17-2010 Dave Landsman
• Added cache requirements (Sec 3.7 and definitions) • Revised definition of Latency (definitions) • Updated all tables to go from low-to-high block sizes and 100% Writes
(R/W Mix % = 0/100) to 100% Reads (R/W Mix = 100/0) • Removed “Workload Independent Pre-conditioning” step from the
Throughput test.
1.0 Nov-19-2010 Dave Landsman • Updated Annex A
1.1(a) Nov-21-2011 Eden Kim
• Updated to PTS-E 1.1 from TWG F2F comments 12SEP11 • Consolidate / harmonize introduction w/ PTS-C v 1.1(a) • Consolidate Definitions w/ PTS-C v 1.1(a) • Addition of PTS-E 1.1 Tests for initial review
1.1(b)(2) Dec-28-2011 Eden Kim
• Updated Normative Annex A PTS Sample Report Format • Updated reference to KiB Base 2 • Test Example Plots replaced with Annex Normative plots • Added Section 10: WSAT Optional Test • Harmonized PTS-C 1.1 with PTS-E 1.1
1.1(c) Jan-25-2012 Eden Kim • Harmonize w/ PTS-C 1.1(c)
1.1(d) Feb 20-2012 Eden Kim • Harmonize w/ PTS-C 1.1(d) • Update pseudo code HIR, Cross Stim Rec • Addition table of figures & table of plots
1.1(e) Jul-07-2012 Eden Kim • PTS-E 1.1(e) – TWG comment integration – clean rev (e)
1.1(f) Jul-09-2012 Eden Kim Easen Ho • ECW & DIRTH pseudo code & plots update
1.1 (g) Mar-8-2013 Marilyn Fausset • Editorial work to publish a Working Draft for ballot 1.1 (h) Mar-12-21-2013 Marilyn Fausset
Eden Kim • Added new plots to main sections and Annex A, minor revisions

SSS PTS Version 2.0-Revision 0.7 Working Draft 4
1.1 (i) July 19, 2014 Eden Kim • Edits per TWG review of Fall of 2013
2.0 v0.1 Nov. 3, 2016 Eden Kim • Consolidation PTS-C v1.2 and PTS-E v 1.1 through page 27 • Edit of Preamble to update and include new SSD embodiments
2.0 v0.2 Nov. 7, 2016 Eden Kim
• Update IOPS section 7 Descriptive Note • Update IOPS for optional metrics (5 9s Response Times) • IOPS 3 Steady State Variables; PTS-C AR=75, WCE • Update TP section 8 – consolidation PTS-C & PTS-E • Update LAT section 9 – addition of reporting of IOPS; addition of
reporting 5 9s Response Times • Update WSAT section 10 – addition of optional workloads (Read
Intensive, Write Intensive, Mixed/OLTP, VOD, Meta Data); Addition of WSAT Response Time Histogram – Confidence Level Plot
• WSAT Optional RTs & IOPS v Drive Fills: ART, 5 9s, MRT with • Updates through Section 10 page 54
2.0 v0.3 Nov. 21, 2016 Eden Kim • S3 TWG Concall – Line by Line group edit review 2.0 v0.4 Dec. 19, 2016 Eden Kim • Through section 12 pg 65 XSR
2.0 v0.5 Dec. 20, 2016 Eden Kim
• Complete consolidation through all sections • Tables added to XSR and HIR • BW v Total OIO added to ECW and DIRTH • Annex A – Updated with PTS v2.0- Enterprise IOPS Report • Annex A – reports deleted for all except IOPS as redundant • Annex B updated to RTP 4.0 & 5.0 with links to SSSI RTP listings • RTP Components updated consistent with SSSI RTP listings
2.0 v0.6 Jan. 19, 2017 Eden Kim
• S3 TWG F2F Line by Line • Typographical corrections • Update to Scope 1.4 (Real World Workloads and Application
Workloads added as ‘Future Work Items’) • Update to Not in Scope 1.5 (Application Workloads deleted) • Additions to IOPS Descriptive Note Re: rationale for removing
Segmentation and Active Range Amount • IOPS Descriptive Note Re: rationale for adding two more SS Variables • Change of ECW (Enterprise Composite Workload) to CBW (Composite
Block Size Workload) due to addition of test for Client PTS-C • Update to list of contributors
2.0 v0.7 Feb. 10, 2017 Eden Kim
• Updated cover page date to February 10, 2017 • Added words ‘performance’ and ‘protocols’ to abstract on cover page • Corrections to Table of Figures • Added ‘U.2’ to Preamble list of future embodiments & settings • Find and replace ‘preconditioning’ with ‘pre-conditioning’ • Correct typos, formatting when compared with pdf document • Changed K to KiB in IOPS and WSAT Descriptive Notes • Changed ECW to CBW in WSAT Test section Descriptive Notes

SSS PTS Version 2.0-Revision 0.7 Working Draft 5
Contributors The SNIA SSS Technical Work Group, which developed and reviewed this standard, would like to recognize the contributions made by the following members:
Company Contributor AmerNet, Inc. Khaled Amer Calypso Eden Kim Calypso Easen Ho Calypso Mike Peeler Coughlin Assoc Tom Coughlin Dell Dell
Gary Kotzur Drew Tipton
EMC EMC
Don Deel David Sun
Fusion-IO Jonathon Thatcher Hitachi Data Systems Mel Boksenbaum Hitachi Global Storage Technologies Dan Colegrove Hewlett-Packard Enterprise Hewlett-Packard Enterprise
Chuck Paridon Keith Orsack
hyperI/O Tom West Huawei-Symantec Mike Ko IBM Phil Mills Intel Intel
Brady Foster Jiaram Kalyanasundaram
Intel Terry Yoshii Intel Harry Pon LSI Harry Mason LSI Jack Hollins Marvell Semiconductor Paul Wassenberg Micron Technology Doug Rollins Objective Analysis Jim Handy Oracle Ron Emerick Pliant Mike Chenery PMC-Sierra Martin Harris Samsung Samsung
Steven Peng Bill Martin
Samsung Jiho Hwang SandForce Jeremy Werner SanDisk Dave Landsman SanDisk Spencer Ng Seagate Marty Czekalski Seagate SK Hynix SK Hynix
Alvin Cox Santosh Kumar Prakash Giri
Smart Modular Esther Spanjer SNIA Arnold Jones Toshiba TAIS Toshiba TAEC
Sumit Puri Mark Carlson Patrick Kang
Western Digital Western Digital
Gary Drossel Martin Czekalski

SSS PTS Version 2.0-Revision 0.7 Working Draft 6
Usage The SNIA hereby grants permission for individuals to use this document for personal use only, and for corporations and other business entities to use this document for internal use only (including internal copying, distribution, and display) provided that:
1. Any text, diagram, chart, table or definition reproduced shall be reproduced in its entirety with no alteration.
2. Any document, printed or electronic, in which material from this document (or any
portion hereof) is reproduced shall acknowledge the SNIA copyright on that material, and shall credit the SNIA for granting permission for its reuse.
Other than as explicitly provided above, you may not make any commercial use of this document, sell any or this entire document, or distribute this document to third parties. All rights not explicitly granted are expressly reserved to SNIA. Permission to use this document for purposes other than those enumerated above may be requested by e-mailing [email protected]. Please include the identity of the requesting individual and/or company and a brief description of the purpose, nature, and scope of the requested use.
Disclaimer The information contained in this publication is subject to change without notice. The SNIA makes no warranty of any kind with regard to this specification, including, but not limited to, the implied warranties of merchantability and fitness for a particular purpose. The SNIA shall not be liable for errors contained herein or for incidental or consequential damages in connection with the furnishing, performance, or use of this specification.
Contacting SNIA SNIA Web Site Current SNIA practice is to make updates and other information available through their web site at http://www.snia.org SNIA Address Requests for interpretation, suggestions for improvement and addenda, or defect reports are welcome. They should be sent via the SNIA Feedback Portal at http://www.snia.org/feedback/ or by mail to the Storage Networking Industry Association, 500 Sansome Street, Suite #504, San Francisco, CA 94111, U.S.A. Suggestions for revisions should be directed to http://www.snia.org/feedback/.
Intended Audience This document is intended for use by individuals and companies engaged in the development of this Specification and in validating the tests and procedures incorporated herein. After approvals and release to the public, this Specification is intended for use by individuals and companies engaged in the design, development, qualification, manufacture, test, acceptance and failure analysis of SSS devices and systems and sub systems incorporating SSS devices.

SSS PTS Version 2.0-Revision 0.7 Working Draft 7
Changes to the Specification Each publication of this Specification is uniquely identified by a two-level identifier, comprised of a version number and a release number. Future publications of this specification are subject to specific constraints on the scope of change that is permissible from one publication to the next and the degree of interoperability and backward compatibility that should be assumed between products designed to different publications of this standard. The SNIA has defined three levels of change to a specification:
• Major Revision: A major revision of the specification represents a substantial change to the underlying scope or architecture of the specification. A major revision results in an increase in the version number of the version identifier (e.g., from version 1.x to version 2.x). There is no assurance of interoperability or backward compatibility between releases with different version numbers.
• Minor Revision: A minor revision of the specification represents a technical change to
existing content or an adjustment to the scope of the specification. A minor revision results in an increase in the release number of the specification’s identifier (e.g., from x.1 to x.2). Minor revisions with the same version number preserve interoperability and backward compatibility.
Copyright © 2009-2017 Storage Networking Industry Association.

SSS PTS Version 2.0-Revision 0.7 Working Draft 8
Contents
Contributors ............................................................................................................................................................... 5 Usage 6 Disclaimer .................................................................................................................................................................... 6 Contacting SNIA......................................................................................................................................................... 6 Intended Audience ..................................................................................................................................................... 6 Changes to the Specification .................................................................................................................................... 7
List of Figures, Plots, and Tables ............................................................................................... 11 Introduction ................................................................................................................................. 13
1.1 Preamble ............................................................................................................................................................. 13 1.2 Purpose ............................................................................................................................................................... 14 1.3 Background ......................................................................................................................................................... 14 1.4 Scope ................................................................................................................................................................... 15 1.5 Not in Scope ...................................................................................................................................................... 15 1.6 Disclaimer ........................................................................................................................................................... 15 1.7 Normative References..................................................................................................................................... 15 1.7.1 Approved references ...............................................................................................................15 1.7.2 References under development ............................................................................................16 1.7.3 Other references ......................................................................................................................16
2 Definitions, symbols, abbreviations, and conventions ....................................................... 17 2.1 Definitions .......................................................................................................................................................... 17 2.2 Acronyms and Abbreviations ......................................................................................................................... 18 2.3 Keywords ............................................................................................................................................................ 19 2.4 Conventions ....................................................................................................................................................... 19 2.4.1 Number Conventions ..............................................................................................................19 2.4.2 Pseudo Code Conventions ....................................................................................................20
3 Key Test Process Concepts .................................................................................................. 21 3.1 Steady State ........................................................................................................................................................ 21 3.2 Purge .................................................................................................................................................................... 21 3.3 Pre-conditioning ................................................................................................................................................ 22 3.4 ActiveRange ........................................................................................................................................................ 22 3.5 Data Patterns ..................................................................................................................................................... 22 3.6 Multiple Thread Guideline .............................................................................................................................. 23 3.7 Caching ................................................................................................................................................................ 23
4 Overview of Common Test Flow ........................................................................................ 24 5 Common Reporting Requirements ..................................................................................... 25
5.1 General ................................................................................................................................................................ 25 5.2 Test System Hardware .................................................................................................................................... 25 5.3 Test System Software ...................................................................................................................................... 25 5.4 Device Under Test ........................................................................................................................................... 25
6 Test Tool Guidelines ............................................................................................................. 26 7 IOPS Test ............................................................................................................................... 27
7.1 IOPS Descriptive Note.................................................................................................................................... 27 7.2 IOPS Pseudo Code ........................................................................................................................................... 27 7.3 Test Specific Reporting for IOPS Test ......................................................................................................... 28 7.3.1 Purge Report .............................................................................................................................29 7.3.2 Pre-conditioning Report .........................................................................................................29 7.3.3 Steady State Convergence Report .......................................................................................29 7.3.4 Steady State Verification .........................................................................................................30 7.3.5 Steady State Measurement Window ....................................................................................31

SSS PTS Version 2.0-Revision 0.7 Working Draft 9
7.3.6 Measurement Window Report .............................................................................................33 8 Throughput Test ................................................................................................................... 36
8.1 Throughput (TP) Descriptive Note.............................................................................................................. 36 8.2 TP Pseudo Code ............................................................................................................................................... 36 8.3 Test Specific Reporting for Throughput Test ............................................................................................ 37 8.3.1 Purge Report .............................................................................................................................37 8.3.2 Pre-conditioning Report .........................................................................................................37 8.3.3 Steady State Convergence Report - Write ........................................................................38 8.3.4 Steady State Convergence Report - Read ..........................................................................39 8.3.5 Steady State Verification Report ...........................................................................................39 8.3.6 Steady State Measurement Window ....................................................................................39 8.3.7 Measurement Window Report .............................................................................................41
9 Latency Test .......................................................................................................................... 44 9.1 Latency (LAT) Descriptive Note .................................................................................................................. 44 9.2 LAT Pseudo Code ............................................................................................................................................ 44 9.3 Test Specific Reporting for Latency Test .................................................................................................... 45 9.3.1 Purge ...........................................................................................................................................45 9.3.2 Pre-conditioning Report .........................................................................................................45 9.3.3 Steady State Convergence Report .......................................................................................46 9.3.4 Steady State Verification Report ...........................................................................................47 9.3.5 Steady State Measurement Window ....................................................................................47 9.3.6 Measurement Window Report .............................................................................................48
10 Write Saturation Test .......................................................................................................... 50 10.1 Write Saturation (WSAT) Descriptive Note ......................................................................................... 50 10.2 WSAT Pseudo Code .................................................................................................................................... 50 10.3 Test Specific Reporting for Write Saturation Test ............................................................................... 51 10.3.1 Purge Report .............................................................................................................................51 10.3.2 Steady State Measurement .....................................................................................................51 10.3.3 Measurement Report ...............................................................................................................52
11 Host Idle Recovery ................................................................................................................ 55 11.1 Host Idle Recovery (HIR) Descriptive Note .......................................................................................... 55 11.2 HIR Pseudo Code ......................................................................................................................................... 56 11.3 Test Specific Reporting for Host Idle Recovery Test .......................................................................... 58 11.3.1 Purge Report .............................................................................................................................58 11.3.2 Measurement Report ...............................................................................................................58
12 Cross Stimulus Recovery ...................................................................................................... 62 12.1 Cross Stimulus Recovery (XSR) Descriptive Note: ............................................................................. 62 12.2 XSR Pseudo Code ........................................................................................................................................ 62 12.3 Test Specific Reporting for Cross Stimulus Recovery Test................................................................ 63 12.3.1 Purge Report .............................................................................................................................63 12.3.2 Measurement Report ...............................................................................................................63
13 Composite Block Size Workload ........................................................................................ 66 13.1 Composite Block Size Workload (CBW) Descriptive Note: ............................................................ 66 13.2 CBW Pseudo Code ...................................................................................................................................... 67 13.3 Test Specific Reporting for CBW Test .................................................................................................... 70 13.3.1 Purge Report .............................................................................................................................70 13.3.2 Measurement Report ...............................................................................................................70
14 Demand Intensity / Response Time Histogram ................................................................. 80 14.1 Demand Intensity / Response Time Histogram (DIRTH) Descriptive Note: ................................. 80 14.2 DIRTH Pseudo Code ................................................................................................................................... 81 14.3 Test Specific Reporting for DIRTH Test ................................................................................................. 83 14.3.1 Purge Report .............................................................................................................................83

SSS PTS Version 2.0-Revision 0.7 Working Draft 10
14.3.2 Measurement Report ...............................................................................................................83 Annex A (normative) Sample Test Report ............................................................................ 93
A.1 Sample IOPS Test Report Pages ................................................................................................................... 93 Annex B (Informative) Reference Test Platform Example ................................................ 102

SSS PTS Version 2.0-Revision 0.7 Working Draft 11
List of Figures, Plots, and Tables Figure 1-1 – NAND-based SSS Performance States for 8 Devices (RND 4KiB Writes) ............................ 15 Figure 3-1 – ActiveRange Diagram ............................................................................................................. 22 Figure 4-1 – Basic Test Flow ...................................................................................................................... 24 Plot 7-1 - IOPS SS Convergence Report .................................................................................................... 30 Plot 7-2.1 - IOPS SS Measurement Window RND 4K RW0 ....................................................................... 31 Plot 7-3 - IOPS Measurement Window Tabular Data ................................................................................. 33 Plot 7-4 - IOPS Measurement Plot – 2D ..................................................................................................... 33 Plot 7-5 - IOPS Measurement Plot – 3D ..................................................................................................... 34 Table 7-6 - IOPS Measurements – Optional Secondary Metrics ................................................................ 35 Plot 8-1 - TP SS Convergence Report Write .............................................................................................. 38 Plot 8-2 - TP SS Convergence Report Read .............................................................................................. 39 Plot 8-3 - TP SS Measurement Window ..................................................................................................... 40 Plot 8-4: TP Measurement Window Tabular Data – 1024KiB ..................................................................... 41 Plot 8-5 - TP Measurement Window Tabular Data – 128KiB ..................................................................... 42 Plot 8-6 - TP Measurement Plot – 2D SEQ 1024KiB .................................................................................. 42 Plot 8-7 - TP Measurement Plot – 2D SEQ 128KiB .................................................................................... 43 Plot 9-1 - LAT SS Convergence Report ...................................................................................................... 46 Plot 9-2 - LAT SS Measurement Window ................................................................................................... 47 Plot 9-3 - LAT Measurement Window Tabular Data ................................................................................... 48 Plot 9-4 – Response Time Histogram - Confidence Level Plot ................................................................... 49 Plot 10-1 - WSAT IOPS v Time ................................................................................................................... 52 Plot 10-2 - WSAT IOPS v TGBW ................................................................................................................ 53 Plot 10-3 - WSAT IOPS v Total Drive Writes/Fills ...................................................................................... 53 Plot 10-4 - WSAT Response Time Histogram – Confidence Level Plot ..................................................... 54 Plot 10-5 – Optional - WSAT Response Times & IOPS v Drive Fills – ART, 5 9s, MRT ............................ 54 Plot 11-1 - HIR IOPS v Time ....................................................................................................................... 59 Plot 11-2 - HIR IOPS v Time ....................................................................................................................... 60 Plot 11-3 - IOPS vs. Time for All Wait States .............................................................................................. 60 Table 11-4 – HIR Secondary Metrics - Optional ......................................................................................... 61 Plot 12-1 - XSR TP vs. Time ....................................................................................................................... 64 Plot 12-2 – Throughput, ART & MRT v Time .............................................................................................. 64 Plot 12-3 – XSR Table: TP, ART, MRT & BW Recovery Time ................................................................... 65 Plot 12-4 – Optional Secondary Metrics ..................................................................................................... 65 Table 13-1 – CBW Block Size Access Probabilities ................................................................................... 67 Table 13-2 – CBW Access Range Distribution Restrictions ....................................................................... 68 Table 13-3 – CBW Measurement Plots ...................................................................................................... 71 Plot 13-4 - Pre Conditioning IOPS Plot ....................................................................................................... 72 Plot 13-5 - PC Steady State Plot ................................................................................................................. 73 Plot 13-6 - Between-Round Prewrites ......................................................................................................... 73 Plot 13-7 - DV IOPS Plot, TC=Tracking ...................................................................................................... 74 Plot 13-8 - DV Steady State Plot, Tracking Variable .................................................................................. 74 Plot 13-9 - Demand Variation Plot .............................................................................................................. 75 Plot 13-10 - Demand Intensity Plot ............................................................................................................. 75 Plot 13-11 - CPU Utilization Plot ................................................................................................................. 76 Plot 13-12 - MaxIOPS Prewrites ................................................................................................................. 76 Plot 13-13 - MaxIOPS Histogram ................................................................................................................ 77 Plot 13-14 - MidIOPS Prewrites .................................................................................................................. 77 Plot 13-15 - MidIOPS Histogram ................................................................................................................. 78 Plot 13-16 - MinIOPS Prewrites .................................................................................................................. 78 Plot 13-17 - MinIOPS Histogram ................................................................................................................. 79 Plot 13-18 – IOPS v Total OIO .................................................................................................................... 79 Table 14-1 – DIRTH Measurement Plots .................................................................................................... 83

SSS PTS Version 2.0-Revision 0.7 Working Draft 12
Plot 14-2 - Pre-Conditioning IOPS Plot ....................................................................................................... 85 Plot 14-3 - Pre-Conditioning Steady State Plot ........................................................................................... 86 Plot 14-4 - Between Round Pre Writes ....................................................................................................... 86 Plot 14-5 - DV IOPS Plot, TC=Tracking ...................................................................................................... 87 Plot 14-6 - DV Steady State Plot, Tracking Variable .................................................................................. 87 Plot 14-7 - Demand Variation Plot .............................................................................................................. 88 Plot 14-8 - Demand Intensity Plot ............................................................................................................... 88 Plot 14-9 - System CPU Utilization Plot ..................................................................................................... 89 Plot 14-10 - Max IOPS Pre Writes .............................................................................................................. 89 Plot 14-11 - Max IOPS Histogram ............................................................................................................... 90 Plot 14-12 - Mid IOPS Pre Writes ............................................................................................................... 90 Plot 14-13 - Mid IOPS Histogram ................................................................................................................ 91 Plot 14-14 - Min IOPS Pre Writes ............................................................................................................... 91 Plot 14-15 - Min IOPS Histogram ................................................................................................................ 92 Plot A.1 – IOPS Steady State Convergence Plot - All Block Sizes ............................................................ 94 Plot A.2 – IOPS Steady State Measurement Window ................................................................................ 95 Plot A.3 – IOPS Steady State Measurement Window - RND/4KiB ............................................................ 96 Plot A.4 – IOPS - Steady State Measurement Window - RND/64KiB RW65 ............................................. 97 Plot A.5 – IOPS - Steady State Measurement Window - RND/1024KiB RW100 ....................................... 98 Plot A.6 – IOPS - All RW Mix & BS - Tabular Data .................................................................................... 99 Plot A.7 – IOPS – Table BS / RW Mixes ................................................................................................... 100 Plot A.8 – IOPS -All RW Mix & BS - 3D Columns ..................................................................................... 101

SSS PTS Version 2.0-Revision 0.7 Working Draft 13
Introduction 1.1 Preamble This Performance Test Specification (PTS) is a revision to, and consolidation of, the Enterprise Performance Test Specification (PTS-E) v1.1 and the SNIA Solid State Storage Client Performance Test Specification (PTS-C) v1.2. This Performance Test Specifications v2.0 (PTS v2.0) is intended to be used to obtain reliable and comparative measurement of NAND Flash based solid state storage devices (SSDs). In this PTS, the tests and methodologies are designed to use a synthetic, or known and repeatable, test stimulus applied to a solid state storage product at the device level. "Device level" refers to measurement of block IO at the physical device level as opposed to file system IO in the host Operating System. However, additional provisions are made herein (and provided for in future versions hereto), to accommodate novel test methodologies and tests intended for application to new embodiments of SSDs including, but not limited to, data center SSDs, real world storage workloads (from IO Captures), memory mapped storage (in-memory byte addressable storage), protocol specific test settings for NVMe, NVDIMM SSDs, U.2, M.2 and others. This PTS is based on test and preparation methodologies developed by the SNIA SSS TWG for performance test of NAND based solid state storage. NAND Flash based solid state storage (SSS) performance tends to be highly dependent on the write history of the SSS device, the type of stimulus applied to the SSS device, as well as the test environment (both hardware and software) in which the test stimulus is applied and measurements taken. Much of the pre-conditioning, test condition set up and parameters take these SSS behaviors into consideration. These PTS do not require the use a specific test environment, but test tool requirements, capabilities and examples are set forth in the specification. Care should be taken by the test operator to ensure that the test hardware does not bottleneck the SSS device performance, that the OS or test software tool has minimal contribution to test measurements, and that the same hardware and software test combination is used when comparing performance results of different SSS devices. A recommended Reference Test Platform (RTP) is defined herein and elsewhere in SNIA Solid State Storage Initiative (SSSI) documentation and is intended to provide a recommended hardware and software test environment that can be used to normalize the impact of hardware and software on the performance measurement of SSDs using this PTS specification. The PTS tests and settings differ for Enterprise and Client SSDs in the preparation of the Device Under Test (DUT) for steady state performance measurement and in the amount and type of test stimulus applied to the DUT. For example, pre-conditioning LBA ranges may be limited in the Client PTS to less than 100% of the available LBAs and the write cache setting may be set to ‘write cache enabled’ (WCE). The use of limited pre-conditioning and WCE are meant to provide test stimuli that share more characteristics with empirically observed Client workloads. Each test section herein will list device applicability (Enterprise or Client SSD or other SSD embodiments as referenced above), default Enterprise test process flow and test settings with alternative settings for Client SSDs or other SSDs. Example PTS test results are posted on the SNIA SSSI website http://www.snia.org/forums/sssi. Recommend Reference Test Platform (RTP) hardware and software used for official PTS testing is listed in Annex B hereto and at http://www.snia.org/forums/sssi/rtp. While other Operating Systems, hardware and software can be used to run the PTS, any PTS results must disclose any and all hardware, software, test settings or test steps that differ from those listed in this PTS specification.

SSS PTS Version 2.0-Revision 0.7 Working Draft 14
Readers and industry members are encouraged to participate in the further SNIA SSS TWG works and can contact the TWG at its website portal at http://www.snia.org/feedback/.
1.2 Purpose Manufacturers need to set, and customers need to compare, the performance of Solid State Storage (SSS) devices. This Specification defines a set of device level tests and methodologies intended to enable comparative testing of SSS devices in Enterprise (see 2.1.6) and Client systems (see 2.1.7).
Note: While the tests defined in this specification could be applied to SSS devices based on any technology (RAM, NAND, etc.), the emphasis in this specification, in particular regarding Pre-conditioning and Steady State, is oriented towards NAND.
1.3 Background A successful device level performance test isolates the device being tested from the underlying test platform (HW, OS, Tools, Applications) so the only limiting variable in the test environment is the device being tested. To achieve this goal with NAND-based SSS devices, in addition to typical system/device isolation issues, the test, and test methodologies, must address attributes unique to NAND-based flash media. NAND-based SSS device controllers map Logical Addresses (LBA) to Physical Blocks Addresses (LBA) on the NAND media, in order to achieve the best NAND performance and endurance. The SSS device manages this LBA-to-PBA mapping with internal processes that operate independently of the host. The sum of this activity is referred to as “flash management”. The performance of the flash management during a test, and hence the overall performance of the SSS device during the test, depends critically on:
1) Write History and Pre-conditioning: The state of the device prior to the test 2) Workload Pattern: Pattern of the I/O (R/W mix, block size, access, etc.) written to device
during test 3) Data Pattern: The actual bits in the data payload written to the device
The methodologies defined in the SSS Performance Test Specification (SSS PTS) attempt to create consistent conditions for items 1-3 so that the only variable is the device under test.
Note: Descriptive notes precede each test section to explain the test rationale and examples of possible interpretations of test results. These notes are informative only and are set forth as “Descriptive Note” for the reader’s convenience.
The importance of the SSS PTS methodologies on SSS performance measurement is shown in Figure 1-1. A typical SSS device, taken Fresh-Out-of-the-Box (FOB), and exposed to a workload, typically experiences a brief period of elevated performance, followed by a transition to Steady State performance. The SSS PTS ensures that performance measurements are taken in the Steady State region, representing the device’s performance during its normal working life.

SSS PTS Version 2.0-Revision 0.7 Working Draft 15
Figure 1-1 – NAND-based SSS Performance States for 8 Devices (RND 4KiB Writes)
1.4 Scope 1) Pre-conditioning methods 2) Performance tests 3) Test reporting requirements 4) Application Workload tests - To be considered in future work items 5) Real World Storage Workloads – To be considered in future work items
1.5 Not in Scope 1) Test Platform (HW/OS/Tools) 2) Certification/Validation procedures for this specification 3) Device reliability, availability, or data integrity
1.6 Disclaimer Use or recommended use of any public domain, third party or proprietary software does not imply nor infer SNIA or SSS TWG endorsement of the same. Reference to any such test or measurement software, stimulus tools, or software programs is strictly limited to the specific use and purpose as set forth in this Specification and does not imply any further endorsement or verification on the part of SNIA or the SSS TWG.
1.7 Normative References 1.7.1 Approved references These are the standards, specifications and other documents that have been finalized and are referenced in this specification.
• IDEMA Document LBA1-02 -- LBA Count for IDE Hard Disk Drives Standard

SSS PTS Version 2.0-Revision 0.7 Working Draft 16
• JEDEC JESD218 – Solid-State Drive (SSD) Requirements and Endurance Test Method • JEDEC JESD219 – Solid-State Drive (SSD) Endurance Workloads
1.7.2 References under development • ATA/ATAPI Command Set - 2 (ACS-2) – INCITS/T13 2015-D
1.7.3 Other references • None in this version

SSS PTS Version 2.0-Revision 0.7 Working Draft 17
2 Definitions, symbols, abbreviations, and conventions 2.1 Definitions 2.1.1 ActiveRange: Specified as ActiveRange(start:end), where “start” and “end” are
percentages. ActiveRange (AR) is the range of LBA’s that may be accessed by the pre-conditioning and/or test code, where the starting LBA# = start%*MaxUserLBA and the ending LBA# = end%*MaxUserLBA.
2.1.2 Cache: A volatile or non-volatile data storage area outside the User Capacity that may contain a subset of the data stored within the User Capacity.
2.1.3 Client: Single user desktop or laptop system used in home or office. 2.1.4 CPU Usage: amount of time for which a central processing unit (CPU) is used for
processing instructions. CPU time is also measured as a percentage of the CPU's capacity at any given time.
2.1.5 Data Excursion: As used in the definition of Steady State, shall be measured by taking the absolute value of the difference between each sample and the average.
2.1.6 Enterprise: Servers in data centers, storage arrays, and enterprise wide / multiple user environments that employ direct attached storage, storage attached networks and tiered storage architectures.
2.1.7 Client: laptop or desktop computers used in small office, home, mobile, entertainment and other single user applications.
2.1.8 Fresh Out of the Box (FOB): State of SSS prior to being put into service. 2.1.9 IO Demand: Measured # of OIOs executing in the host. 2.1.10 Logical Block Address (LBA): The address of a logical block, i.e., the offset of the
block from the beginning of the logical device that contains it. 2.1.11 Latency: The time between when the workload generator makes an IO request and
when it receives notification of the request’s completion. 2.1.12 MaxUserLBA: The maximum LBA # addressable in the User Capacity. 2.1.13 Measurement Window: The interval, measured in Rounds, during which test data is
collected, bounded by the Round in which the device has been observed to have maintained Steady State for the specified number of Rounds (Round x), and five Rounds previous (Round x-4).
2.1.14 Nonvolatile Cache: A cache that retains data through power cycles. 2.1.15 Outstanding IO (OIO): The number of IO operations issued by a host, or hosts, awaiting
completion. 2.1.16 OIO/Thread: The number of OIO allowed per Thread (Worker, Process) 2.1.17 Over-Provisioned Capacity: LBA range provided by the manufacturer for performance
and endurance considerations, but not accessible by the host file system, operating system, applications, or user.
2.1.18 Pre-conditioning: The process of writing data to the device to prepare it for Steady State measurement. (a) Workload Independent Pre-conditioning (WIPC): The technique of running a prescribed workload, unrelated to the test workload, as a means to facilitate convergence to Steady State. (b) Workload Dependent Pre-conditioning (WDPC): The technique of running the test workload itself, typically after Workload Independent Pre-conditioning, as a means to put

SSS PTS Version 2.0-Revision 0.7 Working Draft 18
the device in a Steady State relative to the dependent variable being tested.
2.1.19 Pre-conditioning Code: Refers to the Pre-conditioning steps set forth in this Specification.
2.1.20 Purge: The process of returning an SSS device to a state in which subsequent writes execute, as closely as possible, as if the device had never been used and does not contain any valid data.
2.1.21 Round: A complete pass through all the prescribed test points for any given test. 2.1.22 Queue Depth: Interchangeably refers to the OIO/Thread produced by the Workload
Generator. 2.1.23 Slope: As used in the definition of Steady State, shall mean the slope of the “Best Linear
Fit Line.” 2.1.24 Steady State: A device is said to be in Steady State when, for the dependent variable
(y) being tracked: a) Range(y) is less than 20% of Ave(y): Max(y)-Min(y) within the Measurement Window
is no more than 20% of the Ave(y) within the Measurement Window; and b) Slope(y) is less than 10%: Max(y)-Min(y), where Max(y) and Min(y) are the maximum
and minimum values on the best linear curve fit of the y-values within the Measurement Window, is within 10% of Ave(y) value within the Measurement Window.
2.1.25 Test Code: Refers to the measurement steps set forth in the test sections contained in this Specification.
2.1.26 Transition Zone: A performance state where the device’s performance is changing as it goes from one state to another (such as from FOB to Steady State).
2.1.27 Thread: Execution context defined by host OS/CPU (also: Process, Worker) 2.1.28 Thread Count (TC): Number of Threads (or Workers or Processes) specified by a test. 2.1.29 Total OIO: Total outstanding IO Operations specified by a test = (OIO/Thread) * (TC) 2.1.30 User Capacity: LBA range directly accessible by the file system, operating system and
applications, not including Over-Provisioned Capacity. 2.1.31 Volatile Cache: A cache that does not retain data through power cycles.
2.2 Acronyms and Abbreviations 2.2.1 IOPS: I/O Operations per Second 2.2.2 DUT: Device Under Test 2.2.3 DI: Demand Intensity (aka Total OIO) 2.2.4 FOB: Fresh Out of Box 2.2.5 OIO: Outstanding IO 2.2.6 TOIO: Total Outstanding IO 2.2.7 R/W: Read/Write 2.2.8 SSSI: Solid State Storage Initiative 2.2.9 SSS TWG: Solid State Storage Technical Working Group 2.2.10 TC: Thread Count 2.2.11 ART: Average Response Time 2.2.12 QD: Queue Depth

SSS PTS Version 2.0-Revision 0.7 Working Draft 19
2.2.13 TP: Throughput 2.2.14 LAT: Latency 2.2.15 WSAT: Write Saturation 2.2.16 HIR: Host Idle Recovery 2.2.17 XSR: Cross Stimulus Recovery 2.2.18 ECW: Enterprise Composite Workload 2.2.19 DIRTH: Demand Intensity / Response Time Histogram
2.3 Keywords The key words “shall”, “required”, “shall not”, “should”, “recommended”, “should not”, “may”, and “optional” in this document are to be interpreted as:
2.3.1 Shall: This word, or the term "required", means that the definition is an absolute requirement of the specification.
2.3.2 Shall Not: This phrase means that the definition is an absolute prohibition of the specification.
2.3.3 Should: This word, or the adjective "recommended", means that there may be valid reasons in particular circumstances to ignore a particular item, but the full implications must be understood and weighed before choosing a different course.
2.3.4 Should Not: This phrase, or the phrase "not recommended", means that there may exist valid reasons in particular circumstances when the particular behavior is acceptable or even useful, but the full implications should be understood and the case carefully weighed before implementing any behavior described with this label.
2.3.5 May: This word, or term “optional”, indicates flexibility, with no implied preference.
2.4 Conventions 2.4.1 Number Conventions Numbers that are not immediately followed by lower-case b or h are decimal values. Numbers immediately followed by lower-case b (xxb) are binary values. Numbers immediately followed by lower-case h (xxh) are hexadecimal values. Hexadecimal digits that are alphabetic characters are upper case (i.e., ABCDEF, not abcdef). Hexadecimal numbers may be separated into groups of four digits by spaces. If the number is not a multiple of four digits, the first group may have fewer than four digits (e.g., AB CDEF 1234 5678h). Storage capacities and data transfer rates and amounts shall be reported in Base-10. IO transfer sizes and offsets shall be reported in Base-2. The associated units and abbreviations used in this specification are:
• A kilobyte (KB) is equal to 1,000 (103) bytes. • A megabyte (MB) is equal to 1,000,000 (106) bytes. • A gigabyte (GB) is equal to 1,000,000,000 (109) bytes. • A terabyte (TB) is equal to 1,000,000,000,000 (1012) bytes. • A petabyte (PB) is equal to 1,000,000,000,000,000 (1015) bytes • A kibibyte (KiB) is equal to 210 bytes. • A mebibyte (MiB) is equal to 220 bytes. • A gibibyte (GiB) is equal to 230 bytes. • A tebibyte (TiB) is equal to 240 bytes. • A pebibyte (PiB) is equal to 250 bytes

SSS PTS Version 2.0-Revision 0.7 Working Draft 20
2.4.2 Pseudo Code Conventions The specification uses an informal pseudo code to express the test loops. It is important to follow the precedence and ordering information implied by the syntax. In addition to nesting/indentation, the main syntactic construct used is the “For” statement. A “For” statement typically uses the syntax: For (variable = x, y, z). The interpretation of this construct is that the Test Operator sets the variable to x, then performs all actions specified in the indented section under the “For” statement, then sets the variable to y, and again performs the actions specified, and so on. Sometimes a “For” statement will have an explicit “End For” clause, but not always; in these cases, the end of the For statement’s scope is contextual. Take the following loop as an example:
For (R/W Mix % = 100/0, 95/5, 65/35, 50/50, 35/65, 5/95, 0/100) For (Block Size = 1024KiB, 128KiB, 64KiB, 32KiB, 16KiB, 8KiB, 4KiB, 0.5KiB)
- Execute random IO, per (R/W Mix %, Block Size), for 1 minute - Record Ave IOPS(R/W Mix%, Block Size)
This loop is executed as follows: Set R/W Mix% to 100/0 >>>>> Beginning of Loop 1 Set Block Size to 1024KiB Execute random IO… Record Ave IOPS… Set Block Size to 128KiB Execute… Record… … Set Block Size to 0.5KiB Execute… Record… >>>>> End of Loop 1 Set R/W Mix% to 95/5 >>>>> Beginning of Loop 2 Set Block Size to 1024 KiB Execute… Record… …

SSS PTS Version 2.0-Revision 0.7 Working Draft 21
3 Key Test Process Concepts The performance of an SSS device is highly dependent on its prior usage, the pre-test state of the device and test parameters. This section describes key SSS test methodology concepts.
3.1 Steady State SSS devices that are Fresh Out of the Box (FOB), or in an equivalent state, typically exhibit a transient period of elevated performance, which evolves to a stable performance state relative to the workload being applied. This state is referred to as a Steady State (Definition 2.1.24). It is important that the test data be gathered during a time window when the device is in Steady State, for two primary reasons:
1) To ensure that a device’s initial performance (FOB or Purged) will not be reported as “typical”, since this is transient behavior and not a meaningful indicator of the drive’s performance during the bulk of its operating life.
2) To enable Test Operators and reviewers to observe and understand trends. For
example, oscillations around an average are “steady” in a sense, but might be a cause for concern.
Steady State may be verified:
• by inspection, after running a number of Rounds and examining the data; • programmatically, during execution; or • by any other method, as long as the attainment of Steady State, per Definition 2.1.24, is
demonstrated and documented.
Steady State as defined in Definition 2.1.24 shall meet the Steady State Verification criteria as set forth in each test. Steady State reporting requirements are covered in the respective test sections.
3.2 Purge The purpose of the Purge process (Definition 2.1.18) is to put the device in a consistent state prior to pre-conditioning and testing, and to facilitate a clear demonstration of Steady State convergence behavior. Purge shall be run prior to each pre-conditioning and testing cycle. If the device under test does not support any kind of Purge method, and the Test Operator chooses to run the PTS, the fact that Purge was not supported/run must be documented in the test report. The Test Operator may select any valid method of implementing the Purge process, including, but not limited to, the following:
a) ATA: SECURITY ERASE, SANITIZE DEVICE (BLOCK ERASE EXT) b) SCSI: FORMAT UNIT c) NVMe: FORMAT namespace d) Vendor specific methods
The Test Operator shall report what method of Purge was used.

SSS PTS Version 2.0-Revision 0.7 Working Draft 22
3.3 Pre-conditioning The goal of pre-conditioning is to facilitate convergence to Steady State during the test itself. The SSS PTS defines two types of pre-conditioning:
• Workload Independent Pre-conditioning (Definition 2.1.16.1); and • Workload Dependent Pre-conditioning (Definition 2.1.16.2)
Note: While Workload Based Pre-conditioning is not a distinct step in the test scripts (it occurs as part of running the core test loop in each test), it is critically important to achieving valid Steady State results.
3.4 ActiveRange It is desirable to be able to test the performance characteristics of workloads that issue IO across a wide range of the LBA space vs. those which issue IO across only a narrow range. To enable this, the SSS Performance Specification defines ActiveRange. (Definition 2.1.1) The test scripts define required and optional settings for ActiveRange. Figure 3-1 show two examples of ActiveRange.
ActiveRange (0:100) ActiveRange (0:75)
Figure 3-1 – ActiveRange Diagram
3.5 Data Patterns All tests shall be run with a random data pattern. The Test Operator may execute additional runs with non-random data patterns. If non-random data patterns are used, the Test Operator must report the data pattern.

SSS PTS Version 2.0-Revision 0.7 Working Draft 23
Note: Some SSS devices look for and optimize certain data patterns in the data written to the device. It is not feasible to test for all possible kinds of optimizations, which are vendor specific and often market segment specific. The SSS TWG is still trying to characterize “how random is random enough” with respect to data patterns.
3.6 Multiple Thread Guideline If the Test Operator wishes to run a test using multiple Threads, it is recommended that OIO/Thread, or Queue Depth, for all Threads be equal, so Total OIO is equal to (OIO/Thread) * (Thread Count). This will enable more direct comparisons. While the Test Operator may select a given OIO for a test, the Test Operator shall use the same Thread Count and OIO/Thread for all steps of a given test.
3.7 Caching All tests should be run with all volatile write caches disabled (WCD) for Enterprise SSDs and write cache enabled (WCE) for Client SSDs. The cache state shall be reported for drives that cannot have write cache disabled.

SSS PTS Version 2.0-Revision 0.7 Working Draft 24
4 Overview of Common Test Flow The Steady State tests in the SSS PTS (IOPS, Throughput and Latency) use the same general steps and flow, described in Figure 4-1. Test-specific parameter settings, reports, and other requirements are documented in the test sections themselves.
Basic Test Flow: For (ActiveRange = the specified values)
1) Purge the device Note: Test Operator may use any values for ActiveRange and Test Parameters for this step; no parameter reporting is required.
2) Run Workload Independent Pre-conditioning Note: Test Operator shall use specified ActiveRange (“For ActiveRange =”), but may choose other Test Parameter values to optimize this step, and shall report them.
3) Run Test (includes Workload Based Pre-conditioning): a) Set Test Parameters (OIO/Thread, Thread Count, Data Pattern, etc.) as specified
in the test script. b) Run test loop until Steady State reached, or a maximum of 25 Rounds.
Accumulate/Record intermediate data, as specified in test, for each Round. 4) Post process & plot the Rounds data:
a) If Steady State is reached by Round x=25, where the Measurement Window is Round (x-4):x, the Test Operator shall: i) Plot Rounds 1:x per “Steady State Convergence Plot”; ii) Plot Rounds (x-4):x per “Steady State Verification Plot”; and iii) Plot Rounds (x-4):x per “Measurement Plot”.
b) If Steady State is not reached by Round x=25, the Test Operator shall either: i) Continue at 3b until Steady State reached (x>25), and then report per 4a(i-iii); or ii) Stop at Round x and report per 4a(i-iii).
End “For ActiveRange”
The Test Operator may re-run the entire “For ActiveRange” loop with alternate test parameters, which may be optional or required, depending on the test.
End “Basic Test Flow”
Figure 4-1 – Basic Test Flow Note: Steps (2) and (3) must each be run with no interruptions, and there must be no delay between Step (2) and Step (3), to maintain consistent test conditions for all devices. Note: With respect to the reports in Step (4):
• The Steady State Convergence Plot shows general visual convergence to Steady State by plotting the dependent variable(s) (IOPS, Throughput, etc.) for each Round.
• The Steady State Verification Plot shows, via either graph or table, that the device has reached Steady State per definition 2.1.24, by examining dependent variable behavior within the Measurement Window.
• The Measurement Plot is not one, but a set of, plots/reports, which summarize the test data in the Measurement Window, for the metric being measured.
• The content of these plots, and other test-specific reporting, is specified in each test. • Examples of these plots are set forth in Annex A.

SSS PTS Version 2.0-Revision 0.7 Working Draft 25
5 Common Reporting Requirements The following items, common to all tests, shall be included in the final test report. These items only need to be reported once in the test report. Test-specific report items are defined in the relevant test sections themselves. A sample test report can be found in Annex A.
5.1 General 1) Test Date 2) Report Date 3) Test Operator name 4) Auditor name, if applicable 5) Test Specification Version
5.2 Test System Hardware 1) Manufacturer/Model # 2) Mother Board/Model # 3) CPU 4) DRAM 5) Host Bus Adapter 6) Device Interposer Card 7) Primary Storage 8) Peripherals
5.3 Test System Software 1) Operating System Version 2) File System and Version 3) Test Software
5.4 Device Under Test 1) Manufacturer 2) Model Number 3) Serial Number 4) Firmware Revision 5) User Capacity 6) Interface/Speed 7) Form Factor (e.g., 2.5”) 8) Media Type (e.g., MLC NAND Flash) 9) Optional: Other major relevant features (e.g., NCQ, Hot plug, Sanitize support, etc.)

SSS PTS Version 2.0-Revision 0.7 Working Draft 26
6 Test Tool Guidelines The SSS PTS is platform (HW/OS/Tool) agnostic. A sample hardware and software platform is outlined Annex B and updated and maintained at www.snia.org/forums/sssi/rtp. SW tools used to test SSS devices pursuant to this PTS shall have the ability to:
1) Act as workload stimulus generator as well as data recorder 2) Issue Random and Sequential block level I/O 3) Restrict LBA accesses to a particular range of available user LBA space 4) Test Active Range – shall be able to limit “total unique LBAs used” to a specific value 5) Ability to randomly distribute a number of equally sized LBA segments across the test
active range. 6) Set R/W percentage mix % 7) Set Random/Sequential IO mix % 8) Set IO Transfer Size 9) Generate and maintain multiple outstanding IO requests. Ensure that all steps in the test
sequence can be executed immediately one after the other, to ensure that drives are not recovering between processing steps, unless recovery is the explicit goal of the test.
10) Provide output, or output that can be used to derive, IOPS, MB/s, maximum latency and average response time (latency if OIO=1) within some measurement period.
The random function for generating random LBA #’s during random IO tests shall be:
1) seedable; 2) have an output >= 48-bit; and 3) deliver a uniform random distribution independent of capacity.

SSS PTS Version 2.0-Revision 0.7 Working Draft 27
7 IOPS Test 7.1 IOPS Descriptive Note General Purpose: Enterprise IOPS test is intended to measure the test SSD IOPS at a range of Random Block Sizes and Read/Write mixes. This IOPS test is intended to emulate characteristics of Enterprise and Client workloads. PTS-E Enterprise workload tests use WCD and AR=100 while PTS-C Client workload tests use WCE and AR=75. PTS 2.0 Update: The PTS 2.0 consolidates the previous PTS-C v1.2 and PTS-E v1.1 specifications into one PTS 2.0 specification. The IOPS test below sets forth the PTS v2.0 test flow and requirements. PTS-E v1.1 has been changed to increase the number of Steady State (SS)Tracking variables from one (RND 4KiB 100% Writes) to three (RND 4KiB 100% Writes, RND 64KiB 65:35 RW mix and RND 1024KiB 100% Reads). Note: Additional BS/RW mix SS Variables are added because newer and higher capacity SSDs can show optimizations for RND 4KiB Writes which can cause the RND 4KiB Write BS/RW to come to SS before other BS/RW combinations. RND 64KiB RW65 and RND 1024KiB RW100 were added to bracket BS/RW from small block to large block and 100% Write to 100% Reads. The user may select other or additional SS BS/RW mix variables but shall disclose such in reporting. The PTS-C v1.2 IOPS test has been changed to remove both the Segmentation and Active Range Amount variables and the associated two-step Steady State check. PTS-C v2.0 IOPS is the same as PTS-E v2.0 IOPS with a single WDPC Steady State check except that the PTS-C v2.0 has an ActiveRange=75% and write cache set to WCE. Note: Segmentation and Active Range Amount were originally included to emulate client use cases. However, these settings were removed to make the tests consistent with other PTS tests that are based on synthetic corner case workloads. Future real world workload tests may revisit client and enterprise use case settings and test methodologies. Test Flow: The IOPS test makes use of: 1) a pre-conditioning range of 100% LBAs (Section 2.1); 2) a one-step Workload Independent PC (Section 2.1.18 a) consisting of 128KiB SEQ W for 2X (twice) the user capacity; and 3) a one-step Workload Dependent PC (WDPC) (Section 2.1.18 b) consisting of the IOPS
loop using the ActiveRange until Steady State, as defined, is achieved. Test Results: The test results captured during steady state measurement window shall be tabulated and plotted as specified in section 7 and are intended to present the IOPS performance over the 56 element matrix of Read/Write Mixes (aka the "outer loop") and Block Sizes (aka the "inner loop"). Optional Secondary Metrics may be reported (see example tables below). Test Interpretation: A higher value (more IOPS) is better. Lower/faster Response Times (as reported in optional secondary metrics tables) are better. Lower power consumption and lower CPU Usage % and CPU IO Wait % are better.
7.2 IOPS Pseudo Code For PTS-E, WCD and AR=100. For PTS-C, WCE and AR=75.
1 Purge the device. (Note: ActiveRange (AR) and other Test Parameters are not

SSS PTS Version 2.0-Revision 0.7 Working Draft 28
applicable to Purge step; any values can be used and none need to be reported.)
2 Run Workload Independent Pre-conditioning
2.1 Set and record test conditions:
2.1.1 Device volatile write cache PTS-E WCD, PTS-C WCE. 2.1.2 OIO/Thread (aka Queue Depth (QD)): Test Operator Choice
(recommended PTS-E QD=32; PTS-C QD=16)
2.1.3 Thread Count (TC): Test Operator Choice (recommended PTS-E TC=4; PTS-C TC=2)
2.1.4 Data Pattern: Required = Random, Optional = Test Operator
2.2 Run SEQ Workload Independent Pre-conditioning - Write 2X User Capacity with 128KiB SEQ writes, writing to the entire ActiveRange without LBA restrictions.
3 Run Workload Dependent Pre-conditioning and Test stimulus. Set test parameters and record for later reporting
3.1 Set and record test conditions:
3.1.1 Device volatile write cache PTS-E WCD, PTS-C WCE. 3.1.2 OIO/Thread: Same as in step 2.1 above. 3.1.3 Thread Count: Same as in step 2.1 above. 3.1.4 Data Pattern: Required= Random, Optional = Test Operator Choice.
3.2 Run the following test loop until Steady State (SS) is reached, or maximum of 25 Rounds:
3.2.1 For (R/W Mix % = 100/0, 95/5, 65/35, 50/50, 35/65, 5/95, 0/100) 3.2.1.1 For (Block Size = 1024KiB, 128KiB, 64KiB, 32KiB, 16KiB,
8KiB, 4KiB, 0.5KiB)
3.2.1.2 Execute RND IO, per (R/W Mix %, Block Size), for 1 minute
3.2.1.2.1 Record Ave IOPS (R/W Mix%, Block Size) 3.2.1.2.2 Use IOPS Steady State Tracking Variables (R/W Mix% =
0/100, Block Size = 4KiB, R/W Mix%=65:35, Block Size = 64KiB, R/W Mix%=100/0, Block Size=1024KiB) to detect Steady State where all Steady State Tracking Variables meet the Steady State requirement.
3.2.1.2.3 If Steady State is not reached by Round x=25, then the Test Operator may either continue running the test until Steady State is reached, or may stop the test at Round x. The Measurement Window is defined as Round x-4 to Round x.
3.2.1.3 End “For Block Size” Loop
3.2.2 End “For R/W Mix%” Loop
4 Process and plot the accumulated Rounds data, per report guidelines in 7.3. End (For ActiveRange)0 loop
Note: It is important to adhere to the nesting of the loops as well as the sequence of R/W Mixes and Block Sizes.
7.3 Test Specific Reporting for IOPS Test 7.3.1 through 7.3.6.3 list the reporting requirements specific to the IOPS test. Reporting requirements common to all tests are documented in Section 5. See also Annex A. If Steady State was reached at Round x, the Test Operator shall, for each SS Variable: Plot Rounds 1:x per “IOPS Steady State Convergence Plot”;

SSS PTS Version 2.0-Revision 0.7 Working Draft 29
Plot Rounds (x-4):x per “IOPS Steady State Verification Plot”; and Plot Rounds (x-4):x per “IOPS Measurement Plot.” If Steady State was not reached for any of the SS Variables, then the Test Operator may report results per above, picking the average of the last five Rounds run as Round x. In the case where Steady State was not reached, the Test Operator must state this fact in the final report.
7.3.1 Purge Report The Test Operator shall report the method used to run the Purge operation.
7.3.2 Pre-conditioning Report The Test Operator shall report both Workload Independent and Workload Dependent pre-conditioning information as shown in the Report Headers that follow.
Note on Headers: The individual Report Headers are the same for all pages of the report, except for reference to a specific test ID number if more than one test is used to generate the SNIA Report Header. The plots in the following sections show the test Report Header for the first plot example only. Test Report Headers are omitted for subsequent report pages for the same test report in order to provide more clarity for the related plot or graph.
7.3.3 Steady State Convergence Report The Test Operator shall generate a Steady State Convergence plot as shown in Plot 7-1, including the test set-up and parameters set forth in the Report Header. See Annex A.

SSS PTS Version 2.0-Revision 0.7 Working Draft 30
Plot 7-1 - IOPS SS Convergence Report
7.3.4 Steady State Verification The Test Operator shall document the following for Steady State Verification, using Ave RND 4KiB Write, Ave RND 64K R/W% 65:35 and Ave RND 1024K Read IOPS as the dependent variables:
IOPS Test - Steady State Verification
Dependent Variables = Ave RND RK RW0, RND 64K RW65, RND 1024K RW100 IOPS
ActiveRange = (x,y); OIO/Thread = x; Thread Count = x; Data Pattern = x

SSS PTS Version 2.0-Revision 0.7 Working Draft 31
• Measurement Window: Start __; End __ • Ave. value in Measurement Window: __ • Calculated allowed range in Measurement Window (+-10% of Ave.): Max__; Min __ • Measured range in Measurement Window: Max __; Min __ (pass/fail) • Slope of best linear fit in Measurement Window (must be <= 10%): __% (pass/fail) • Correlation coefficient for best linear fit: __
7.3.5 Steady State Measurement Window The Test Operator shall include a plot showing the Steady State Measurement Window, as shown in Plot 7-2.1 – 7.23, including the test set up and parameters set forth in the Report Header (see Annex A to see Report Header).
Plot 7-2.1 - IOPS SS Measurement Window RND 4K RW0

SSS PTS Version 2.0-Revision 0.7 Working Draft 32
Plot 7-2.2 - IOPS SS Measurement Window RND 64K RW65
Plot 7-2.3 - IOPS SS Measurement Window RND 1024K RW100

SSS PTS Version 2.0-Revision 0.7 Working Draft 33
7.3.6 Measurement Window Report The results for the test shall be reported in the following series of tables and graphs (7.3.6.1 - 7.3.6.3) that record and report the data from the Steady State Measurement Window. 7.3.6.1 IOPS Measurement Window Tabular Data The Test Operator shall include a plot showing an IOPS Tabular Data, as shown in Plot 7-3, including the test set up and parameters set forth in the Report Header. See Annex A.
Plot 7-3 - IOPS Measurement Window Tabular Data Each entry in the table is the average of the values in the five Rounds comprising the Steady State Measurement Window, for the selected (R/W Mix%, Block Size) element. 7.3.6.2 IOPS Measurement Plot – 2D The Test Operator shall include a plot showing an IOPS 2D Plot, as shown in Plot 7-4, including the test set up and parameters set forth in the Report Header. See Annex A to view Header.
Plot 7-4 - IOPS Measurement Plot – 2D

SSS PTS Version 2.0-Revision 0.7 Working Draft 34
7.3.6.3 IOPS Measurement Plot – 3D The Test Operator shall include a plot showing an IOPS 3D Plot, as shown in Plot 7-5, including the test set up and parameters set forth in the Report Header. See Annex A to view Header.
Plot 7-5 - IOPS Measurement Plot – 3D

SSS PTS Version 2.0-Revision 0.7 Working Draft 35
7.3.6.4 IOPS Measurement Tables – Optional Secondary Metrics The Test Operator may optionally include tables showing Average Response Times, 5 9s Response Times, Maximum Response Times, CPU System Usage %, CPU IO Wait %, Average Power Consumption and other secondary metrics, as shown in Plot 7-5 below.
Table 7-6 - IOPS Measurements – Optional Secondary Metrics

SSS PTS Version 2.0-Revision 0.7 Working Draft 36
8 Throughput Test 8.1 Throughput (TP) Descriptive Note General Purpose: PTS v2.0 Throughput test is intended to measure the test SSD Throughput (TP) at two Block Sizes (128KiB and 1024KiB) at Sequential Read/Write (100/0, 0/100) during Steady State. This TP test is intended to present the test SSD data transfer rate in MB/s for the prescribed R/W Mixes and Block Sizes. The intent of the TP test is to determine how fast the test SSD can transfer Sequential data without limitation from the IO Bus. PTS 2.0 Update: Client and Enterprise tests are consolidated. TP test Thread Count (TC) is changed from Test Operator Choice to Required TC=1 to ensure sequential IOs and no outstanding concurrent RND IOs. Test Flow: The TP tests are separate tests for each Block Size and makes use of:
1) a pre-conditioning LBA ActiveRange of (PTS-E AR=100. PTS-C AR=75) (section 2.1); 2) a one-step Workload Independent PC (section2.1.18 a) consisting of 128KiB SEQ W, or
1024KiB for the 1024KiB TP test, for 2X (twice) the user capacity; and 3) a one-step Workload Dependent PC (WDPC) (section2.1.18 b) consisting of the test
stimulus at each Block Size over the ActiveRange until Steady State, as defined, is achieved.
Test Results: The test results captured during steady state measurement window shall be tabulated and plotted as specified in Section 8. Test Interpretation: A higher value (greater MB/s) is better.
8.2 TP Pseudo Code For PTS-E, WCD and AR=100. For PTS-C, WCE and AR=75. For (Block Size = 128KiB, 1024KiB)
1 Purge the device. (Note: ActiveRange Amount and other Test Parameters are not applicable to Purge step; any values can be used and none need to be reported.)
2 Workload Independent Pre-conditioning 1.1. Set and record parameters for later reporting.
2.1.1 Volatile Write cache: PTS-E WDC, PTS-C WCE 2.1.2 Thread Count: TC=1. 2.1.3 OIO/Thread: Test Operator Choice* (recommended QD=32) 2.1.4 Data Pattern: Required = Random, Optional = Test Operator Choice
2.2 Run SEQ WIPC - Write 2X User Capacity with 128KiB SEQ writes for SEQ 128KiB test and write 2X User Capacity with 1024KiB writes for the 1024KiB TP test, to the entire ActiveRange Run Workload Dependent Pre-conditioning and Test Stimulus
2.3 Set parameters and record for later reporting

SSS PTS Version 2.0-Revision 0.7 Working Draft 37
2.3.1 Volatile Write cache: PTS-E WCD, PTS-C WCE. 2.3.2 Thread Count: Same as in step 2.1 above. 2.3.3 OIO/Thread: Same as in step 2.1 above. 2.3.4 Data Pattern: Required = Random, Optional = Test Operator Choice
2.4 Run the following until Steady State is reached, or maximum of 25 Rounds
2.4.1 For (R/W Mix % = 100/0, 0/100)
2.4.1.1 Execute SEQ IO, per (R/W Mix%, Block Size) for 1 minute
2.4.1.2 Record Ave MB/s (R/W Mix%, Block Size)
2.4.1.3 Use Ave MB/s (RW Mix%, Block Size) to detect Steady State.
2.4.1.4 If Steady State is not reached by Round x=25, then the Test Operator may continue running the test until Steady State is reached, or may stop the test at Round x. The Measurement Window is defined as Round x-4 to Round x.
2.4.1.5 Note that the sequential accesses shall be continuous and use the entire ActiveRange between test steps.
2.4.2 End (For R/W Mix%) Loop
3 Process and plot the accumulated Rounds data, per report guidelines in Section 8.3, based on current values of ActiveRange, etc.
End (For ActiveRange) loop
8.3 Test Specific Reporting for Throughput Test Sections 8.3.1 through 8.3.7 list the reporting requirements specific to the Throughput test. Reporting requirements common to all tests are documented in Section 5. See also Annex A. If Steady State was reached at Round x, the Test Operator shall:
• Plot Rounds 1:x per “Throughput Steady State Convergence Plot”; • Plot Rounds (x-4):x per “Throughput Steady State Verification Plot”; and • Plot Rounds (x-4):x per “Throughput Measurement Plot.”
If Steady State was not reached then the Test Operator may report results per above, picking the last Round run as Round x. In the case where Steady State was not reached, the Test Operator must state this fact in the final report.
8.3.1 Purge Report The Test Operator shall report the method used to run the Purge operation.
8.3.2 Pre-conditioning Report The Test Operator shall report both Workload Independent and Workload Dependent pre-conditioning information as shown in the Report Headers that follow.
Note on Headers: The individual Report Headers are the same for all pages of the report, except for reference to a specific test ID number if more than one test is used to generate the SNIA Report Header. The plots in the following sections show the test Report Header for the first plot example only. Test Report Headers are omitted for subsequent report pages for the same test report in order to provide more clarity for the related plot or graph.
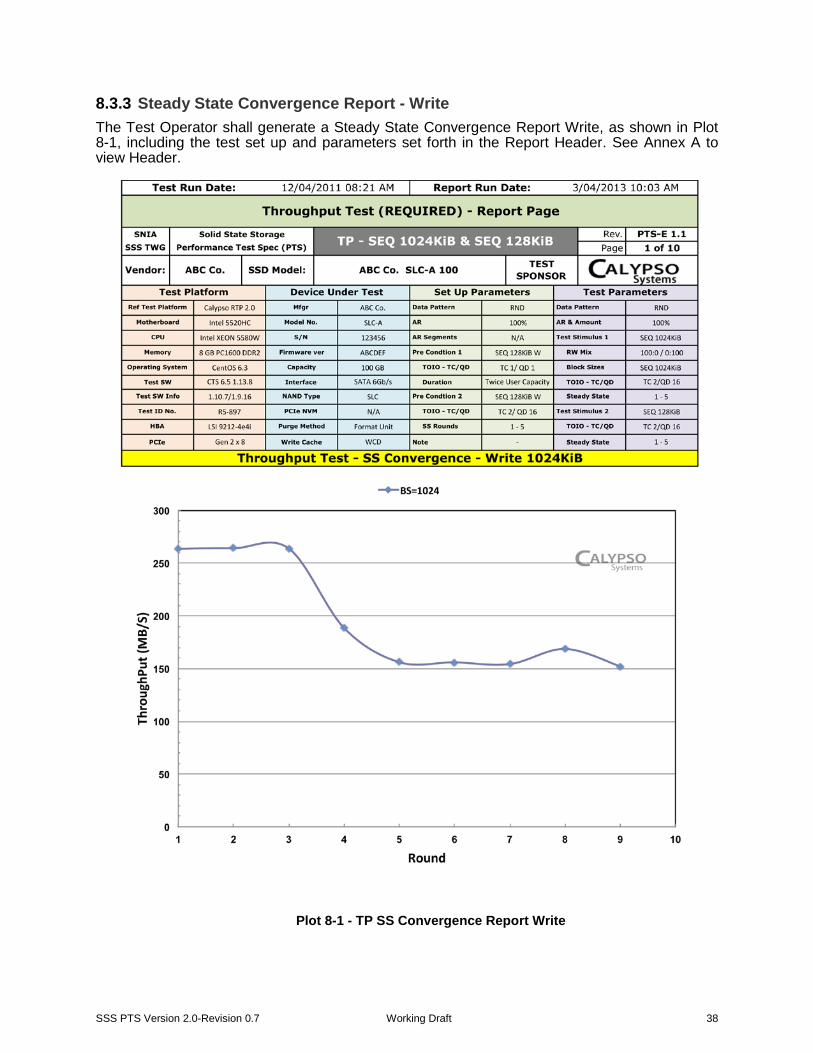
SSS PTS Version 2.0-Revision 0.7 Working Draft 38
8.3.3 Steady State Convergence Report - Write The Test Operator shall generate a Steady State Convergence Report Write, as shown in Plot 8-1, including the test set up and parameters set forth in the Report Header. See Annex A to view Header.
Plot 8-1 - TP SS Convergence Report Write

SSS PTS Version 2.0-Revision 0.7 Working Draft 39
8.3.4 Steady State Convergence Report - Read The Test Operator shall include a plot showing the Steady State Convergence Report Read, as shown in Plot 8-2, including the test set up and parameters set forth in the Report Header. See Annex A to view Header.
Plot 8-2 - TP SS Convergence Report Read
8.3.5 Steady State Verification Report The Test Operator shall document the following for Steady State Verification, using, depending on the test Block Size, Ave 128KiB or 1024KiB Sequential Write MB/s as the dependent variable:
• Measurement Window: Start __; End __ • Ave. value in Measurement Window: __ • Calculated allowed range in Measurement Window (+-10% of Ave.): Max__; Min __ • Measured range in Measurement Window: Max __; Min __ (pass/fail) • Slope of best linear fit in Measurement Window (must be <= 10%): __% (pass/fail) • Correlation coefficient for best linear fit: __
8.3.6 Steady State Measurement Window The Test Operator shall include a plot showing the Steady State Measurement Window, as shown in Plot 8-3, including the test set up and parameters set forth in the Report Header. See Annex A to view Header. .

SSS PTS Version 2.0-Revision 0.7 Working Draft 40
Plot 8-3 - TP SS Measurement Window

SSS PTS Version 2.0-Revision 0.7 Working Draft 41
8.3.7 Measurement Window Report The results for the test must be reported in the following series of tables and graphs (Plot 8-4 through Plot 8-7) that record and report the data from the Steady State Measurement Window. 8.3.7.1 TP Measurement Window Tabular Data - 1024KiB The Test Operator shall include a plot showing a Throughput Tabular Data, as shown in Plot 8-4, including the test set up and parameters set forth in the Report Header. See Annex A to view Header. .
Plot 8-4: TP Measurement Window Tabular Data – 1024KiB Each entry in the table is the average of the values in the five Rounds comprising the Steady State Measurement Window, for the selected (R/W Mix%, Block Size) element. 8.3.7.2 Measurement Window Summary Data Table 128KiB The Test Operator shall include a plot showing a Throughput 2D Plot for Block Size 128KiB, as shown in Plot 8-5, including the test set up and parameters set forth in the Report Header. See Annex A.

SSS PTS Version 2.0-Revision 0.7 Working Draft 42
Plot 8-5 - TP Measurement Window Tabular Data – 128KiB Each entry in the table is the average of the values in the data series Average_MB/s(x,y), recorded in the per-Round MB/s matrices within the Measurement Window, for the selected (R/W Mix%, Block Size) pair. 8.3.7.3 TP Measurement Plot - 2D SEQ 1024KiB The Test Operator shall include a plot showing a Throughput 2D Plot for Block Size 1024KiB, as shown in Plot 8-6, including the test set up and parameters set forth in the Report Header. See Annex A to view Header.
.
Plot 8-6 - TP Measurement Plot – 2D SEQ 1024KiB

SSS PTS Version 2.0-Revision 0.7 Working Draft 43
8.3.7.4 Measurement Plot SEQ 128KiB– 2D The Test Operator shall include a plot showing a Throughput 2D Plot for Block Size 128KiB, as shown in Plot 8-7, including the test set up and parameters set forth in the Report Header. See Annex A to view Header.
Plot 8-7 - TP Measurement Plot – 2D SEQ 128KiB

SSS PTS Version 2.0-Revision 0.7 Working Draft 44
9 Latency Test 9.1 Latency (LAT) Descriptive Note General Purpose: PTS Latency test is intended to measure the test SSD response time at 3 Block Sizes (8KiB, 4KiB and 0.5KiB) and 3 Read/Write mixes (100/0, 65/35, 0/100) using 100% pre-conditioning and Test ActiveRange AR=100 or AR=75. This Latency test is intended to observe how well the test SSD handles a single OIO without the benefit of queuing. This Latency test is intended to present Average, five nines (5 9s) and Maximum Response Times (Latency) at a total outstanding IO of 1 (one Thread and a single OIO/Thread (Queue Depth)). The Latency measurement is inherently dependent on the treatment of the outstanding IOs by the host hardware and software test platform. An OIO of 1 is set to normalize the impact of the test system (as OIO >1 may be treated differently by different test hardware). PTS 2.0 Update Client and Enterprise LAT tests are consolidated. Settings for PTS-E are AR=100, WCD. Settings for PTS-C are AR=75, WCE. Three items are added to LAT test: 1. Reporting of IOPS for the selected BS/RW elements at TC=1, QD=1, 2. Reporting of Average ‘five nines’ (5 9s) Response Times, and 3. Inclusion of Response Time Quality of Service (QoS) Histogram. Test Operator may optionally run the post SS Window histogram to report higher or lower number of nines response times and shall ensure that the duration of the histogram is sufficient to capture the requisite number of IOs required for the desired number of nines response time measurement. Test Flow: The Latency test makes use of: 1) pre-conditioning to the LBA ActiveRange (section 2.1.1); 2) a one step Workload Independent PC (section 2.1.8a) consisting of 128KiB SEQ W for
2X (twice) the user capacity for SEQ 128KiB W for 2X (twice) the user capacity; and 3) a one step Workload Dependent PC (WDPC) (section 2.1.8b) consisting of the Latency
loop over the LBA ActiveRange until Steady State, as defined, is achieved. Test Results: The test results captured during steady state measurement window shall be tabulated and plotted as specified in section 9.3. Test Interpretation: A lower value Response Time (lower mSec) and higher value IOPS (higher IOPS) is better.
9.2 LAT Pseudo Code For PTS-E, WCD and AR=100. For PTS-C, WCE and AR=75.
1 Purge the device. (Note: Active Range and other Test Parameters are not applicable to Purge step; any values can be used and none need to be reported.)
2 Run Workload Independent Pre-conditioning
2.1 Set test parameters and record for later reporting
2.1.1 Device volatile write cache PTS-E WCD, PTS-C WCE 2.1.2 OIO/Thread: 1 2.1.3 Thread Count: 1 2.1.4 Data Pattern: Required = Random, Optional = Test Operator Choice

SSS PTS Version 2.0-Revision 0.7 Working Draft 45
2.2 Run SEQ Workload Independent Pre-conditioning - Write 2X User Capacity w/ 128KiB or 1024KiB sequential writes (depending on the test), writing to the entire ActiveRange.
3 Run the Workload Dependent Pre-conditioning test loop until Steady State is reached, or maximum of 25 Rounds:
3.1 For (R/W% = 100/0, 65/35, 0/100)
3.1.1 For (Block Size = 8KiB, 4KiB, 0.5KiB) 3.1.1.1.1 Execute RND IO per (R/W%, Block Size), for 1 minute
3.1.1.2 Record Max and Ave Latency (R/W%, Block Size) 3.1.1.3 Use Ave Latency (R/W Mix%=0/100, Block Size=4KiB) to detect
Steady State.
3.1.1.4 If Steady State is not reached by Round x=25, then the Test Operator may either continue running the test until Steady State is reached, or may stop the test at Round x. The Measurement Window is defined as Round x-4 to Round x
3.1.2 End (For Block Size) Loop
3.2 End (For R/W Mix %) Loop
3.3 For (R/W% = 0/100 4KiB)
3.3.1 Execute RND IO for 20 minutes 3.3.2 Record Ave, 5 9s, Max Response Times and IOPS 3.3.3 Optional – record higher number of nines (e.g. 6, 7 or 8 9s)
Response Time. IO rate shall be first calculated and the execution duration adjusted to ensure the required number of IOs will occur to meet the statistical requirement of the number of nines selected. For example, for 9 nines, at least 1,000,000,000 IOs must occur within the duration period. It is recommended to run at least 1.5X the minimum number of IOs required to meet the statistical nines desired.
4 Process and plot the accumulated Rounds data, per report guidelines in next section.
End “For ActiveRange” loop
9.3 Test Specific Reporting for Latency Test Sections 9.3.1 through 9.3.6 list the reporting requirements specific to the Latency test. Reporting requirements common to all tests are documented in Section 5. See also Annex A. If Steady State was reached at Round x, the Test Operator shall:
• Plot Rounds 1:x per “Latency Test Steady State Convergence Plot”; • Plot Rounds (x-4):x per “Latency Test Throughput Steady State Verification Plot”; and • Plot Rounds (x-4):x per “Latency Test Measurement Plot.”
If Steady State was not reached then the Test Operator may report results per above, picking the last Round run as Round x. In the case where Steady State was not reached, the Test Operator must state this fact in the final report.
9.3.1 Purge The Test Operator shall report the method used to run the Purge operation.
9.3.2 Pre-conditioning Report The Test Operator shall report both Workload Independent and Workload Dependent pre-conditioning information as shown in the Report Headers that follow.

SSS PTS Version 2.0-Revision 0.7 Working Draft 46
Note on Headers: The individual Report Headers are the same for all pages of the report, except for reference to a specific test ID number if more than one test is used to generate the SNIA Report Header. The plots in the following sections show the test Report Header for the first plot example only. Test Report Headers are omitted for subsequent report pages for the same test report in order to provide more clarity for the related plot or graph. 9.3.3 Steady State Convergence Report The Test Operator shall generate a Steady State Convergence plot, as shown in Plot 9-1, including the test set up and parameters set forth in the Report Header. See Annex A.
Plot 9-1 - LAT SS Convergence Report

SSS PTS Version 2.0-Revision 0.7 Working Draft 47
9.3.4 Steady State Verification Report The Test Operator shall document the following for Steady State Verification, using Ave 4KiB Random Write Latency (mS) as the dependent variable:
• Measurement Window: Start __; End __ • Ave. value in Measurement Window: __ • Calculated allowed range in Measurement Window (+-10% of Ave.): Max__; Min __ • Measured range in Measurement Window: Max __; Min __ (pass/fail) • Slope of best linear fit in Measurement Window (must be <= 10%): __% (pass/fail) • Correlation coefficient for best linear fit: __
9.3.5 Steady State Measurement Window The Test Operator shall include a plot showing the Steady State Measurement Window, as shown in Plot 9-2, including the test set up and parameters set forth in the Report Header. See Annex A to view Report Header. .
Plot 9-2 - LAT SS Measurement Window

SSS PTS Version 2.0-Revision 0.7 Working Draft 48
9.3.6 Measurement Window Report The results for the test must be reported in the following series of tables and graphs (Plot 9-3 through 4) that record and report the data from the Steady State Measurement Window. 9.3.6.1 LAT Measurement Window Tabular Data The Test Operator shall include a plot showing a Latency Tabular Data, as shown in Plot 9-3, including the test set up and parameters set forth in the Report Header. See Annex A to view Report Header.
Plot 9-3 - LAT Measurement Window Tabular Data Each entry in the Average table is the average values in the five Rounds comprising the Average Latency Steady State Measurement Window, for the selected (R/W Mix%, Block Size) element. Each entry in the 99.999% table is the average values in the five Rounds comprising the 5 9s Latency Steady State Measurement Window, for the selected (R/W Mix%, Block Size) element.
Each entry in the Maximum table is the maximum value in the five Rounds comprising the Maximum Latency Steady State Measurement Window, for the selected (R/W Mix%, Block Size) element. Each entry in the IOPS table is the average value in the five Rounds comprising the IOPS recorded during the Latency Steady State Measurement Window, for the selected (R/W Mix%, Block Size) element.

SSS PTS Version 2.0-Revision 0.7 Working Draft 49
9.3.6.2 LAT Response Time Histogram – Confidence Level Plots: Average, 5 9s, Maximum Response Times & IOPS
The Test Operator shall include a plot showing a Latency Response Time Histogram – Confidence Level Plot (RT CLP) for the RND 4K RW0 20 minute histogram as shown in Plot 9-4, including the test set up and parameters set forth in the Report Header. The RT CLP shall set forth RND 4K IOPS, average response time (ART), 5 9s response time (5 9s or 99.999%) and maximum response time (MRT) and associated confidence levels. The RT CLP may optionally set forth BS/RW mix, OIO in TC and QD and 3 and 4 9s (or other) response times as well as RT CLP for other BS/RW mix elements. See Annex A to view Report Header.
Plot 9-4 – Response Time Histogram - Confidence Level Plot

SSS PTS Version 2.0-Revision 0.7 Working Draft 50
10 Write Saturation Test 10.1 Write Saturation (WSAT) Descriptive Note
General Description: The WSAT test is designed to observe how the test SSD responds to a continuous stimulus (e.g. RND 4KiB Writes) from a PURGED FOB state. This test is intended to demonstrate how the SSDs performance characteristics evolve over TIME, Total Drive Writes/Fills and Total GB Written (TGBW) to WSAT Steady State. PTS 2.0 Update WSAT test is amended to include optional workloads that meet commonly accepted industry definitions for:
Write Intensive (RND 4KiB RW0) Read Intensive (RND 4KiB RW100) Mixed or OLTP (RND 8KiB RW65) VOD – Video On Demand (SEQ 128KiB RW90) Meta Data (SEQ 0.5KiB RW50) CBW –Composite Block Size Workload (mixed/composite BS/RW)
Additional reporting is added for normalization to SSD user capacity with plots for Total Drive Writes/Fills. The time period for WSAT is optional to allow the test operator to appropriately modify the test duration to account for DUT user capacity (for example increasing duration for 1 TB SSDs). Reporting 5 9s Response Time Quality of Service is optional with IOPS and Bandwidth vs Time, TGBW and Drive Fills plots. Test Flow: The WSAT test makes use of: 1) a device PURGE, followed by 2) continuous RND 4KiB Writes (or other optional workloads) for 6 hours, other defined
time period or some multiple of the user capacity, whichever occurs first. Test Results: The test results captured for the designated time or user capacity shall be tabulated and plotted as specified in section 10.3.
Note: the user may optionally run the WSAT test to Steady State using the average five-round steady state window defined in 2.1.24 using 1-minute test periods separated by 30 minutes of test stimulus.
Test Interpretation: The test operator is encouraged to observe the initial peak IOPS values and associated length of the FOB plateau, the shape and length of the Transition Zones, the level of IOPS at the “WSAT Steady State” and the oscillation, or amount of amplitude, in IOPS. Less drop off from peak FOB IOPS and a more level settled state with a smaller amplitude variation is better. The test operator should also monitor response times and pay particular attention to the occurrence of response time peaks.
10.2 WSAT Pseudo Code For PTS-E, WCD and AR=100. For PTS-C, WCE and AR=75.
1 Purge the device. (Note: Active Range and other Test Parameters are not applicable to Purge step; any values can be used and none need to be reported.)

SSS PTS Version 2.0-Revision 0.7 Working Draft 51
2 Run Test stimulus. Set test parameters and record for later reporting
2.1 Set and record test conditions:
2.1.1 Device volatile write cache PTS-E=WCD, PTS-C=WCE. 2.1.2 OIO/Thread (aka QD): Test Operator Choice, recommended PTS-E
QD=32, PTS-C QD=16.
2.1.3 Thread Count (TC): Test Operator Choice (recommended PTS-E TC=4, PTS-C TC=2).
2.1.4 Data Pattern: Required= Random, Optional = Test Operator Choice.
2.2 Run the following test stimulus until 4X user Capacity is written, 6 hours, or five round steady state as defined in 10.3.2, whichever occurs first.
2.2.1 Execute RND IO (R/W Mix 100% W, Block Size 4KiB)per 2.2 above 2.2.2 Record Ave IOPS, Max, 5 9s and Ave Latency 2.2.3 Optional workloads:
2.2.3.1 RND 4KiB RW100 (aka Read Intensive)
2.2.3.2 RND 4KiB RW0 (aka Write Intensive)
2.2.3.3 RND 8KiB RW65 (aka Mixed or OLTP)
2.2.3.4 SEQ 128KiB RW90 (aka VOD)
2.2.3.5 SEQ 0.5KiB RW50 (aka Meta Data)
2.2.3.6 Enterprise Composite Workload – ECW (aka Composite)
2.3 Process and plot the accumulated Rounds data, per report guidelines in next section.
2.4 Run Response Histogram - Time Confidence Level Plot for workloads in 2.2 above
2.4.1 Execute RND IO for 20 minutes 2.4.2 Record Ave, 5 9s, Max Response Times and IOPS 2.4.3 Optional – record higher number of nines (e.g. 6, 7 or 8 9s)
Response Time. IO rate shall be first calculated and the execution duration adjusted to ensure the required number of IOs will occur to meet the statistical requirement of the number of nines selected. For example, for 9 nines, at least 1,000,000,000 IOs must occur within the duration period. It is recommended to run at least 1.5X the minimum number of IOs required to meet the statistical nines desired.
End “For ActiveRange” loop
After generating report data for current parameter values, the Test Operator may re-run “For ActiveRange” loop with alternate Test Parameters, if specified in (2), and may also run the entire test again with an optional value (or values) of ActiveRange.
10.3 Test Specific Reporting for Write Saturation Test Sections 10.3.1 and 10.3.3 list the reporting requirements specific to the Write Saturation test. Reporting requirements common to all tests are documented in Section 5. See also Annex A.
10.3.1 Purge Report The Test Operator shall report the method used to run the Purge operation.
10.3.2 Steady State Measurement The test operator shall run the stimulus for the capacity or time set forth in the pseudo code Section 10.2 above OR until Steady State is achieved by calculating a five Round average as defined in 2.1.24 using one-minute test periods separated by 30 minutes of stimulus.

SSS PTS Version 2.0-Revision 0.7 Working Draft 52
10.3.3 Measurement Report The Test Operator shall generate Measurement Plots for WSAT plotting IOPS v Time, IOPS v TGBW and IOPS v Total Drive Writes and should follow the format shown in Plot 10-1 – Plot 10-2 Measurement Plots may optionally be presented for WSAT plotting Bandwidth v Time, Bandwidth v TGBW and Bandwidth v Total Drive Writes.
Note on Headers: The individual Report Headers are the same for all pages of the report, except for reference to a specific test ID number if more than one test is used to generate the SNIA Report Header. The plots in the following sections show the test Report Header for the first plot example only. Test Report Headers are omitted for subsequent report pages for the same test report in order to provide more clarity for the related plot or graph.
Plot 10-1 - WSAT IOPS v Time

SSS PTS Version 2.0-Revision 0.7 Working Draft 53
Plot 10-2 - WSAT IOPS v TGBW
Plot 10-3 - WSAT IOPS v Total Drive Writes/Fills

SSS PTS Version 2.0-Revision 0.7 Working Draft 54
10.3.4 WSAT Response Time Histogram – Confidence Level Plots: Average, 5 9s, Maximum Response Times & IOPS
The Test Operator shall include a plot showing a WSAT Response Time Histogram Confidence Level Plot (RT CLP) for the RND 4KiB RW0 20 minute histogram as shown in Plot 9-4, including the test set up and parameters set forth in the Report Header. The RT CLP shall set forth RND 4KiB IOPS (or selected BS/RW mix element), average response time (ART), 5 9s response time (5 9s or 99.999%) and maximum response time (MRT) and associated confidence levels. The RT CLP may optionally set forth BS/RW mix, OIO in TC and QD and 3 and 4 9s (or other) response times as well as RT CLP for other BS/RW mix elements. See Annex A to view Report Header.
Plot 10-4 - WSAT Response Time Histogram – Confidence Level Plot
Plot 10-5 – Optional - WSAT Response Times & IOPS v Drive Fills – ART, 5 9s, MRT

SSS PTS Version 2.0-Revision 0.7 Working Draft 55
11 Host Idle Recovery 11.1 Host Idle Recovery (HIR) Descriptive Note
General Description: SSD background processes, such as Garbage Collection (GC), may take advantage of Host Idle times to improve performance. The Host Idle Recovery (HIR) Test applies a sequence of Host Idle times interspersed between periods of RND 4KiB Writes in order to observe if the introduction of Host Idle time results in an improvement in the test SSD IOPS performance. Note: “Idle” in “Host Idle Test” refers to a period of no commands generated by the host system (sandwiched between periods of Random 4KiB writes) and is to be distinguished from an OS hibernation or other system software timeout. “Host” refers to the OS, application software and hardware that generate IOs to the test SSD. PTS 2.0 Update: The HIR test shall be run for both PTS-E and PTS-C with the test settings as indicated below. Test Flow: The Host idle Recovery test makes use of test settings for PTS-E of WCD and AR=100 and for PTS-C of WCE and AR=75 with the following test steps: 1. An initial PURGE of the device, followed by 2. Application of RND 4KiB until Steady State is achieved, followed by 3. Wait State 1 Segment:
a. A cycle - consisting of RND 4KiB writes for 5 seconds followed by 5 seconds of no host writes - is repeated 360 times followed by
b. a Return to baseline by executing 1800 seconds of continuous RND 4KiB writes followed by
4. Wait State 2 Segment: a. A cycle - consisting of RND 4KiB writes for 5 seconds followed by 10 seconds of no
host writes - is repeated 360 times followed by b. a Return to baseline by executing 1800 seconds of continuous RND 4KiB writes
followed by 5. Wait State 3 Segment:
a. A cycle - consisting of RND 4KiB writes for 5 seconds followed by 15 seconds of no host writes - is repeated 360 times followed by
b. a Return to baseline by executing 1800 seconds of continuous RND 4KiB writes followed by
6. Wait State 5 Segment: a. A cycle - consisting of RND 4KiB writes for 5 seconds followed by 25 seconds of no
host writes - is repeated 360 times followed by b. a Return to baseline by executing 1800 seconds of continuous RND 4KiB writes
followed by 7. Wait State 10 Segment:
a. A cycle - consisting of RND 4KiB writes for 5 seconds followed by 50 seconds of no host writes - is repeated 360 times followed by
b. a Return to baseline by executing 1800 seconds of continuous RND 4KiB writes followed by
8. Plotting of the results as set forth in section 11.1.
SSS PTS Version 2.0-Revision 0.7 Working Draft 56
Test Results: Test output graph – a graph shall present succeeding Host Idle “wait states” and any increase in performance associated therewith. The graph will present as either a relatively straight line or one with stair-step periods of varied IOPS performance. Test output table – a table that sets forth IOPS and optional secondary metrics for the baseline RND 4KiB RW0 Steady State IOPS and each Wait State period. Test Interpretation: The test operator should first consider the baseline Steady State IOPS measurement of the test SSD and compare this to the RND 4KiB RW0 Write Saturation IOPS measurements. Second, the test operator should examine the plot and table for the following Wait States and look for any enhancements relative to the “return to baseline” results that would indicate the test SSD is taking advantage of Host Idle Times for performance enhancement. A relatively flat line response graph could be interpreted as though there is no impact on the test SSD IOPS performance because: 1) the test SSD is sufficiently limited in performance (low IOPS) that no introduction of Host
Idle times will results in meaningful enhancement, or 2) the test SSD has high performance (IOPS) and an advanced Garbage Collection
algorithm / SSD design that does not need/use additional wait states to improve performance. However, examination of the y-axis value for IOPS can distinguish between a “low performing” SSD (with low IOPS) vs. an “advanced” SSD (with high IOPS).
An increasing staircase graph (ignoring the “return to baseline” portion) could indicate that the test SSD is using the idle periods to invoke “Garbage Collection” (GC) or other background processes that allow for improvement in IOPS performance. The height of the maximum staircase compared to the “return to baseline” portion indicates the amount of enhancement in performance due to the introduction of Host Idle times. The amount of amplitude for each Wait State indicates how much improvement has occurred due to GC – a flatter or “cleaner” line with less amplitude indicates more recovery whereas a large amount of amplitude indicates the inability to sustain the recovery after some initial writes.
11.2 HIR Pseudo Code For PTS-E, WCD and AR=100. For PTS-C, WCE and AR=75.
1 Purge the device. (Note: Active Range and other Test Parameters are not applicable to Purge step; any values can be used and none need to be reported.)
2 Set test parameters and record for later reporting
2.1 Volatile device write cache: PTS-E Required=Disabled, Optional = Enabled. PTS-C Required=Enabled, Optional = Disabled.
2.2 OIO/Thread: Test Operator Choice. Recommended PTS-E T4Q32, PTS-C T2Q16.
2.3 Thread Count: Test Operator Choice, Recommended PTS-E T4, PTS-C T2.
2.4 Data Pattern: Required = Random, Optional = Test Operator Choice
3 Pre-conditioning using the BS=4KiB, 100% random, R/W Mix=0%, using the required PTS-E AR=100 or PTS-C AR=75.
3.1 Record elapsed time, IOPS, Average Response Time (ART) and Maximum Response Time (MRT) every 1 minute.
3.2 Using the first 1 Minute IOPS, along with subsequent 1 Minute IOPS

SSS PTS Version 2.0-Revision 0.7 Working Draft 57
results that are 30 Minutes apart (these IOPS results are called the Tracking Rounds), run Access Pattern until Steady State (see 2.1.24) is reached, or until the maximum number of Rounds=25 has been reached at which point the test shall be stopped as Steady State has not been reached.
4 Wait State 1 Segment Including Return To Baseline: 100% Write, Random, Block Size of 4KiB
4.1 Execute R/W Mix=0/100%, Block Size=4KiB for 5 seconds (Access A), followed by 5 seconds without access activity (Access B). Log Elapsed Time, IOPS, Average Response Time and Maximum Response Time at the end of each Access A period. Repeat (Access A + Access B) combination 360 times.
4.2 Execute R/W Mix=0/100%, Block Size=4KiB for 5 seconds. Repeat 360 times for a total of 5*360=1800 seconds (Access C) to re-establish RND 4KiB baseline.
5 Wait State 2 Segment Including Return To Baseline: 100% Write, Random, Block Size of 4KiB
5.1 Execute R/W Mix=0/100%, Block Size=4KiB for 5 seconds (Access A), followed by 10 seconds without access activity (Access B). Log Elapsed Time, IOPS, Average Response Time and Maximum Response Time at the end of each Access A period. Repeat (Access A + Access B) combination 360 times.
5.2 Execute R/W Mix=0/100%, Block Size=4KiB for 5 seconds. Repeat 360 times for a total of 5*360=1800 seconds (Access C) to re-establish RND 4KiB baseline.
6 Wait State 3 Segment Including Return To Baseline: 100% Write, Random, Block Size of 4KiB
6.1 Execute R/W Mix=0/100%, Block Size=4KiB for 5 seconds (Access A), followed by 15 seconds without access activity (Access B). Log Elapsed Time, IOPS, Average Response Time and Maximum Response Time at the end of each Access A period. Repeat (Access A + Access B) combination 360 times.
6.2 Execute R/W Mix=0/100%, Block Size=4KiB for 5 seconds. Repeat 360 times for a total of 5*360=1800 seconds (Access C) to re-establish RND 4KiB baseline.
7 Wait State 5 Segment Including Return To Baseline: 100% Write, Random, Block Size of 4KiB
7.1 Execute R/W Mix=0/100%, Block Size=4KiB for 5 seconds (Access A), followed by 25 seconds without access activity (Access B). Log Elapsed Time, IOPS, Average Response Time and Maximum Response Time at the end of each Access A period. Repeat (Access A + Access B) combination 360 times.
7.2 Execute R/W Mix=0/100%, Block Size=4KiB for 5 seconds. Repeat 360 times for a total of 5*360=1800 seconds (Access C) to re-establish RND 4KiB baseline.
8 Wait State 10 Segment Including Return To Baseline: 100% Write, Random, Block Size of 4KiB
8.1 Execute R/W Mix=0/100%, Block Size=4KiB for 5 seconds (Access A), followed by 50 seconds without access activity (Access B). Log Elapsed Time, IOPS, Average Response Time and Maximum Response Time at the end of each Access A period. Repeat (Access A + Access B) combination 360 times.
8.2 Execute R/W Mix=0/100%, Block Size=4KiB for 5 seconds. Repeat 360 times

SSS PTS Version 2.0-Revision 0.7 Working Draft 58
for a total of 5*360=1800 seconds (Access C) to re-establish RND 4KiB baseline.
9 Process and plot the accumulated data, per report guidelines in Section 11.3.
11.3 Test Specific Reporting for Host Idle Recovery Test Sections 11.3.1 and 11.3.2 list the reporting requirements specific to the Host Idle Recovery test. Reporting requirements common to all tests are documented in Section 5, See also Annex A.
Note on Headers: The individual Report Headers are the same for all pages of the report, except for reference to a specific test ID number if more than one test is used to generate the SNIA Report Header. The plots in the following sections show the test Report Header for the first plot example only. Test Report Headers are omitted for subsequent report pages for the same test report in order to provide more clarity for the related plot or graph.
11.3.1 Purge Report The Test Operator shall report the method used to run the Purge operation.
11.3.2 Measurement Report The Test Operator shall generate Pre-conditioning Plot, Pre-conditioning Steady State Measurement Plot, and Measurement Plots for IOPS for each Wait State plus their corresponding Return To Baselines. The Test Operator may also report optional Secondary Metrics in a table as set forth in Table 11.2.3.4 below.

SSS PTS Version 2.0-Revision 0.7 Working Draft 59
11.3.2.1 Pre-conditioning IOPS Report A Pre-conditioning IOPS Report (HIR IOPS v Time) is shown in Plot 11-1.
Plot 11-1 - HIR IOPS v Time

SSS PTS Version 2.0-Revision 0.7 Working Draft 60
11.3.2.2 Pre-conditioning Steady State Measurement Plot A Pre-conditioning Steady State Measurement Plot is shown in Plot 11-2.
Plot 11-2 - HIR IOPS v Time 11.3.2.3 IOPS vs. Time for All Wait States An IOPS vs. Time for All Wait States Plot is shown in Plot 11-3.
Plot 11-3 - IOPS vs. Time for All Wait States

SSS PTS Version 2.0-Revision 0.7 Working Draft 61
11.3.2.4 HIR Secondary Metrics Optionally Secondary Metrics may be reported as in TablePlot 11-3.
Table 11-4 – HIR Secondary Metrics - Optional

SSS PTS Version 2.0-Revision 0.7 Working Draft 62
12 Cross Stimulus Recovery 12.1 Cross Stimulus Recovery (XSR) Descriptive Note: General Description: Cross Stimulus Recovery (XSR) is designed to observe how the test SSD handles transitions from large block sequential writes to small block random writes and returning to large block sequential writes. This test is intended to demonstrate the interaction between two close proximity workloads on a device, such as different workload demands in a virtualized environment. PTS 2.0 Update: The XSR test shall be run for both PTS-E and PTS-C with the test settings as indicated below. Additional tables of measurements are added. Test Flow: The Cross Stimulus Recovery test makes use of:
1. An initial PURGE of the device followed by 2. An initial sequence of SEQ 1024 KiB Writes for (8) hours, followed by 3. A sequence of RND 8 KiB Writes for (6) hours, followed by 4. A sequence of SEQ 1024 KiB Writes for (8) hours. 5. Plotting of the results as set forth in Section 11.1
Test Results: Test output graph – the graph shall present three sustained stimulus measurement segments and the transition between those stimuli. The reader should observe the ART and MRT at the transition from the first to second segments, from the second to third segments and the time required for Bandwidth (BW) to fully recover from the first to third segments. Test output table – the table presents numeric values for peak ART, MRT and Bandwidth for each of the segments and the time to full BW recovery from the end of the second segment to the BW peak in the third segment. The OIO setting may be selected and reported by the test operator. However, a larger OIO setting may better emulate an extreme demand environment from which a meaningful transition may be observed. The test operator should choose (and report) a different optimal OIO for each stimulus. Test Interpretation: The test operator is encouraged to observe the shape and length of the transition zones (rather than looking for a some type of “steady state” zone), the amplitude of the BW, spikes in ART and MRT and the time it takes and the amount of BW recovery from the first to third segments. The test operator is further encouraged to vary the length of sustained stimulus to highlight performance zones of interest.
12.2 XSR Pseudo Code For PTS-E, WCD and AR=100. For PTS-C, WCE and AR=75.
1 Purge the device. (Note: Active Range and other Test Parameters are not applicable to Purge step; any values can be used and none need to be reported.)
2 Access Group 1: 100% Write, Sequential, Block Size of 1024KiB
2.1 Set test parameters and record for later reporting
2.1.1 Volatile Device write cache PTS-E WCD, PTS-C WCE. 2.1.2 OIO/Thread: Test Operator Choice, recommended T1Q32.

SSS PTS Version 2.0-Revision 0.7 Working Draft 63
2.1.3 Thread Count: Test Operator Choice, recommended T1. 2.1.4 Data Pattern: Required = Random, Optional = Test Operator Choice
2.2 Execute R/W Mix=0/100, Block Size=1024KiB for a minimum of 8 Hours, with logging of Elapsed Time, IOPS, Average Response Time and Maximum Response Time at 1 minute interval.
3 Access Group 2: 100% Write, Random, Block Size of 8KiB
3.1 Set test parameters and record for later reporting
3.1.1 Volatile Device write cache = Disabled 3.1.2 OIO/Thread: Test Operator Choice 3.1.3 Thread Count: Test Operator Choice 3.1.4 Data Pattern: Required = Random, Optional = Test Operator Choice
3.2 Execute R/W Mix=0/100, Block Size=8KiB for a minimum of 6 Hours, with logging of Elapsed Time, IOPS, Average Response Time and Maximum Response Time at 1 minute interval.
4 Access Group 3: 100% Write, Sequential, Block Size of 1024KiB
4.1 Set test parameters and record for later reporting
4.1.1 Volatile Device write cache = Disabled 4.1.2 OIO/Thread: Same as 2.1.2 above 4.1.3 Thread Count: Same as 2.1.3 above 4.1.4 Data Pattern: Required = Random, Optional = Test Operator Choice
4.2 Execute R/W Mix=0/100, Block Size=1024KiB for a minimum of 8 Hours, with logging of Elapsed Time, IOPS Average Response Time and Maximum Response Time at 1 minute interval.
5 Process and plot the accumulated data, per report guidelines in next section.
12.3 Test Specific Reporting for Cross Stimulus Recovery Test Sections 12.3.1 and 12.3.2 list the reporting requirements specific to the Cross Stimulus Recovery test. Reporting requirements common to all tests are documented in Section 5: Common Reporting Requirements. See also Annex A. Note on Headers: The individual Report Headers are the same for all pages of the report, except for reference to a specific test ID number if more than one test is used to generate the SNIA Report Header. The plots in the following sections show the test Report Header for the first plot example only. Test Report Headers are omitted for subsequent report pages for the same test report in order to provide more clarity for the related plot or graph.
12.3.1 Purge Report The Test Operator shall report the method used to run the Purge operation.
12.3.2 Measurement Report The Test Operator shall generate Measurement Plots for Cross Stimulus Recovery for each Access Group, along with enlarged plots of the two transitions from SEQRND and RNDSEQ. The Test Operator shall also generate a table showing ART, MRT and BW for each segment along with the total time for BW recovery from segment two to segment three.
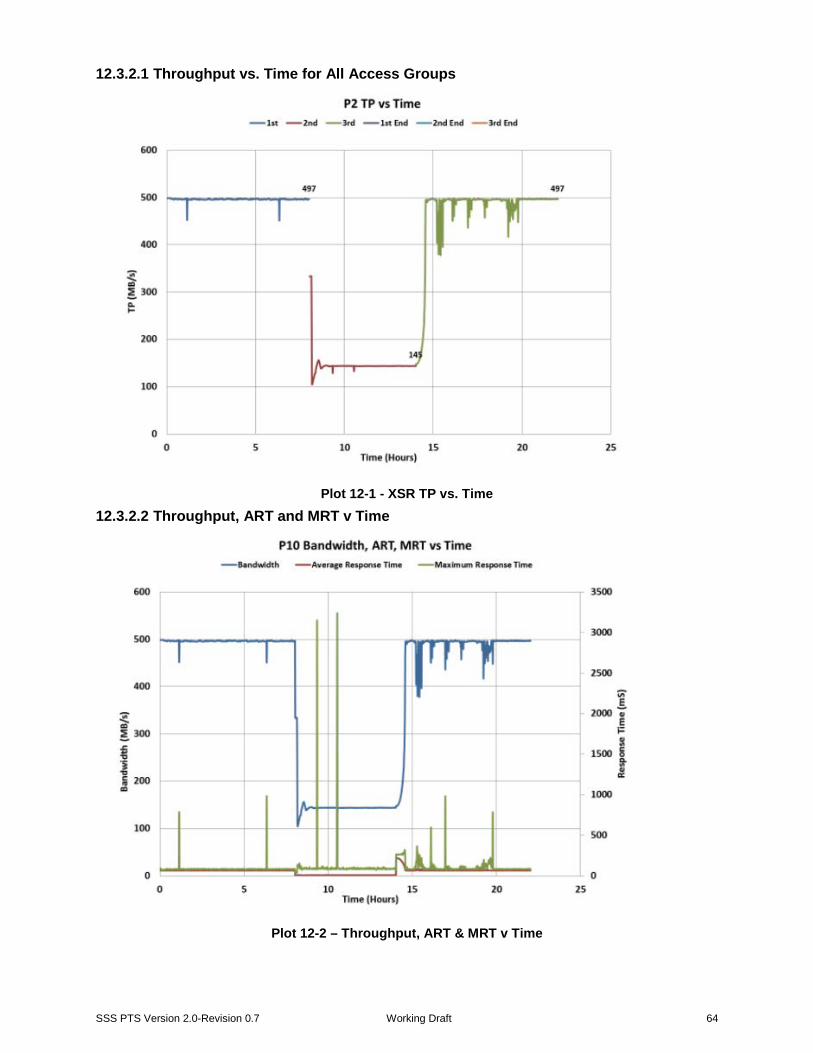
SSS PTS Version 2.0-Revision 0.7 Working Draft 64
12.3.2.1 Throughput vs. Time for All Access Groups
Plot 12-1 - XSR TP vs. Time 12.3.2.2 Throughput, ART and MRT v Time
Plot 12-2 – Throughput, ART & MRT v Time

SSS PTS Version 2.0-Revision 0.7 Working Draft 65
12.3.2.3 XSR Table: TP, ART, MRT and BW Recovery Time
Plot 12-3 – XSR Table: TP, ART, MRT & BW Recovery Time 12.3.2.4 Optional Secondary Metrics Table
Plot 12-4 – Optional Secondary Metrics

SSS PTS Version 2.0-Revision 0.7 Working Draft 66
13 Composite Block Size Workload 13.1 Composite Block Size Workload (CBW) Descriptive Note: General Description: The workload, transfer size distributions and random data payload consists of random data distributed across an SSD in a manner similar to Industry endurance test workload traces that are publicly available. The purpose of this test is to understand Response Times in a mixed IO workload. PTS 2.0 Update: The name of this test is changed to Composite Block Size Workload test to reflect usage for both client and enterprise applications. The word ‘Enterprise’ is deleted from the test name. Additional measurement plots for IOPS & BW v Total OIO are added. Test Flow: The Composite Block Size Workload test makes use of:
1. An initial PURGE of the device followed by 2. Pre-conditioning to the entire LBA ActiveRange (Section2.1);
1) a one step Workload Independent PC (Section 2.1.18 a) consisting of 128KiB SEQ writes for 2X (twice) the user capacity; and
2) a one step Workload Dependent PC (WDPC) (Section 2.1.18 b) consisting of the Composite Access Pattern of mixed Block Sizes applied with relative block size probabilities and ActiveRange distribution restrictions at an overall R/W mix of 100% write over the LBA ActiveRange until Steady State, as defined, is achieved.
3. Running the Composite Access Pattern while varying the Total Outstanding IOs by applying an outer loop of High to Low Thread Count by an inner loop of High to Low Queue Depth with the application of an inter loop Pre Write between each TOIO loop until Steady State, as defined, is reached for the TOIO tracking variable. Note that Queue Depth here refers to the application Queue Depth, or sometimes also referred to as Outstanding IOs issued by a particular application process.
4. Using the Steady State data, plot ART v IOPS and CPU Usage v Thread Count for all the Thread Count settings used.
5. Selecting a MAX IOPS point representing an operating point where the IOPS is maximum while achieving a reasonable ART; select a MIN IOPS point where TC=1 and QD=1; and select a minimum of 1 additional MID IOPS point(s), using the (Thread Count, OIO/Thread) operating points obtained during the test run such that their IOPS values lie between and equally divides the IOPS value between MinIOPS and MaxIOPS.
6. Plotting Response Time Histograms for each of the MAX, MIN and MID IOPS points. Test Results: The test output graph will present a plot of Response Time v Composite IO Rate and CPU Utilization v Composite IO Rate. Test Interpretation: The test operator can observe a typical Response Time at a given IO Rate and to observe the performance curve and the “knee” (saturation point). Some drives may show a linear relationship between Response Time and IO Rate whereas other drives may show cpu saturation if processes are loaded to the host cpu. The test operator can also observe the optimal Average Response Time relative to the IO Rate before saturation as well as the range of performance by viewing IOPS or BW versus the range of applied OIO (e.g. a plot showing BW v Total OIO).
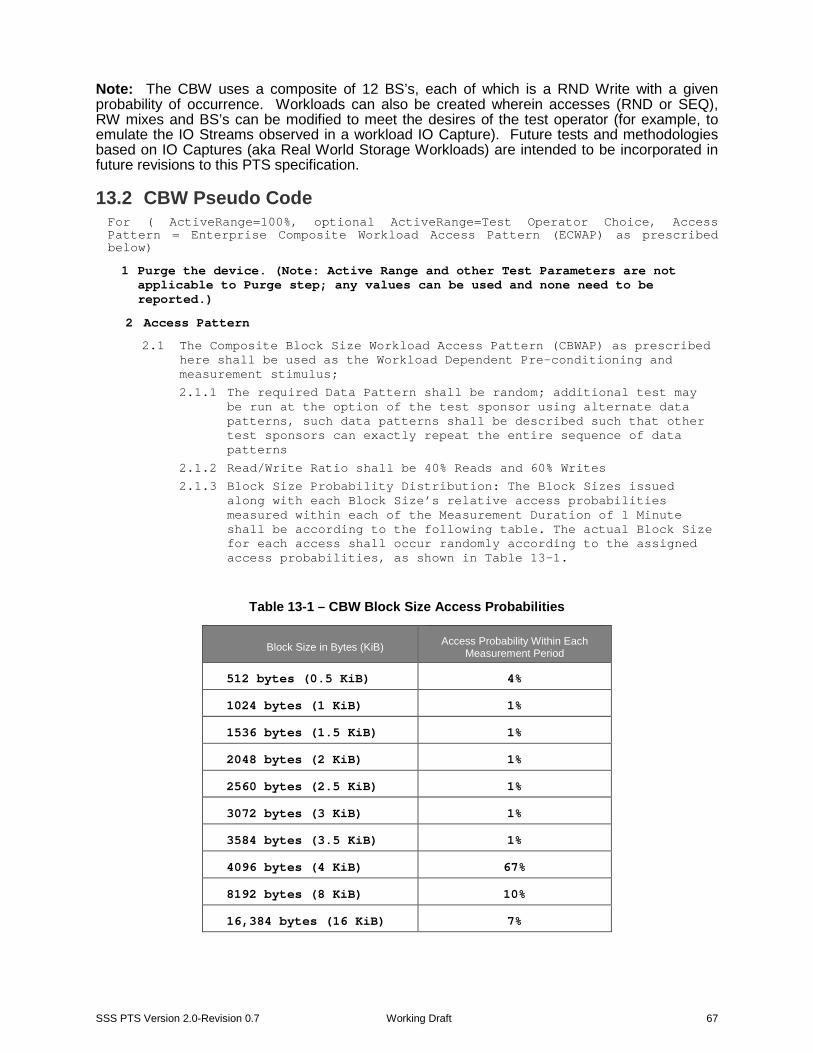
SSS PTS Version 2.0-Revision 0.7 Working Draft 67
Note: The CBW uses a composite of 12 BS’s, each of which is a RND Write with a given probability of occurrence. Workloads can also be created wherein accesses (RND or SEQ), RW mixes and BS’s can be modified to meet the desires of the test operator (for example, to emulate the IO Streams observed in a workload IO Capture). Future tests and methodologies based on IO Captures (aka Real World Storage Workloads) are intended to be incorporated in future revisions to this PTS specification.
13.2 CBW Pseudo Code For ( ActiveRange=100%, optional ActiveRange=Test Operator Choice, Access Pattern = Enterprise Composite Workload Access Pattern (ECWAP) as prescribed below)
1 Purge the device. (Note: Active Range and other Test Parameters are not applicable to Purge step; any values can be used and none need to be reported.)
2 Access Pattern
2.1 The Composite Block Size Workload Access Pattern (CBWAP) as prescribed here shall be used as the Workload Dependent Pre-conditioning and measurement stimulus;
2.1.1 The required Data Pattern shall be random; additional test may be run at the option of the test sponsor using alternate data patterns, such data patterns shall be described such that other test sponsors can exactly repeat the entire sequence of data patterns
2.1.2 Read/Write Ratio shall be 40% Reads and 60% Writes 2.1.3 Block Size Probability Distribution: The Block Sizes issued
along with each Block Size’s relative access probabilities measured within each of the Measurement Duration of 1 Minute shall be according to the following table. The actual Block Size for each access shall occur randomly according to the assigned access probabilities, as shown in Table 13-1.
Table 13-1 – CBW Block Size Access Probabilities
Block Size in Bytes (KiB) Access Probability Within Each Measurement Period
512 bytes (0.5 KiB) 4%
1024 bytes (1 KiB) 1%
1536 bytes (1.5 KiB) 1%
2048 bytes (2 KiB) 1%
2560 bytes (2.5 KiB) 1%
3072 bytes (3 KiB) 1%
3584 bytes (3.5 KiB) 1%
4096 bytes (4 KiB) 67%
8192 bytes (8 KiB) 10%
16,384 bytes (16 KiB) 7%
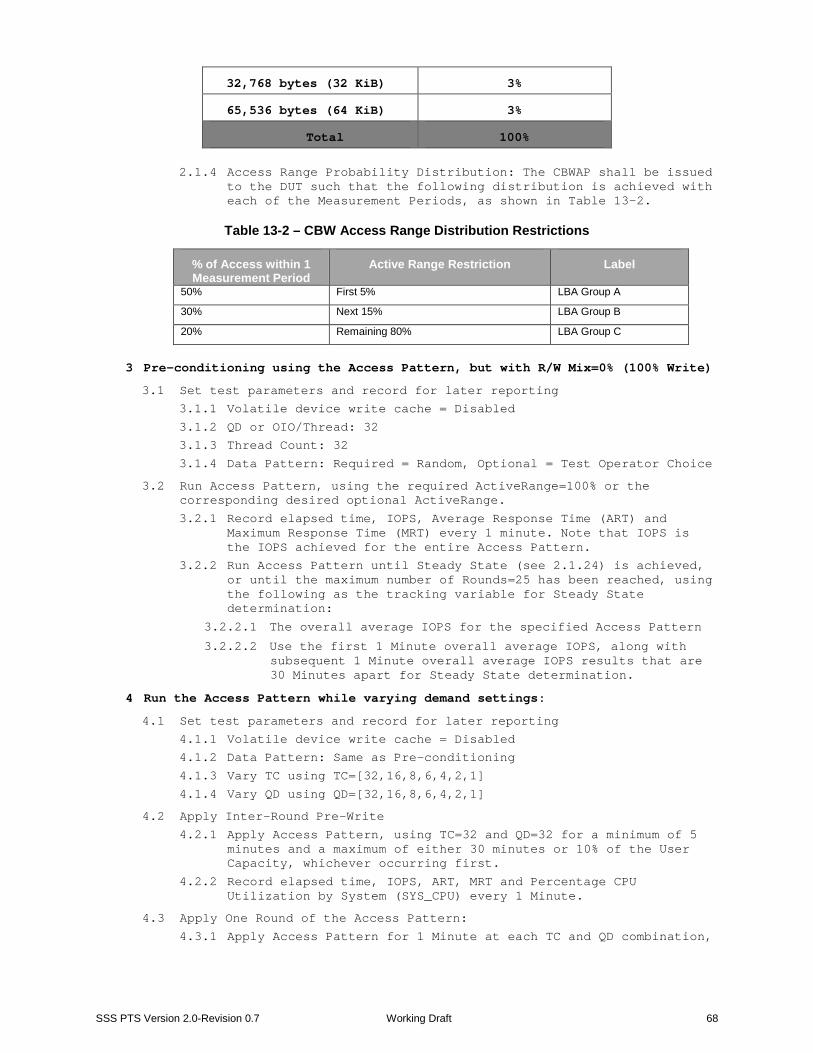
SSS PTS Version 2.0-Revision 0.7 Working Draft 68
32,768 bytes (32 KiB) 3%
65,536 bytes (64 KiB) 3%
Total 100%
2.1.4 Access Range Probability Distribution: The CBWAP shall be issued
to the DUT such that the following distribution is achieved with each of the Measurement Periods, as shown in Table 13-2.
Table 13-2 – CBW Access Range Distribution Restrictions
% of Access within 1 Measurement Period
Active Range Restriction Label
50% First 5% LBA Group A
30% Next 15% LBA Group B
20% Remaining 80% LBA Group C
3 Pre-conditioning using the Access Pattern, but with R/W Mix=0% (100% Write)
3.1 Set test parameters and record for later reporting
3.1.1 Volatile device write cache = Disabled 3.1.2 QD or OIO/Thread: 32 3.1.3 Thread Count: 32 3.1.4 Data Pattern: Required = Random, Optional = Test Operator Choice
3.2 Run Access Pattern, using the required ActiveRange=100% or the corresponding desired optional ActiveRange.
3.2.1 Record elapsed time, IOPS, Average Response Time (ART) and Maximum Response Time (MRT) every 1 minute. Note that IOPS is the IOPS achieved for the entire Access Pattern.
3.2.2 Run Access Pattern until Steady State (see 2.1.24) is achieved, or until the maximum number of Rounds=25 has been reached, using the following as the tracking variable for Steady State determination:
3.2.2.1 The overall average IOPS for the specified Access Pattern
3.2.2.2 Use the first 1 Minute overall average IOPS, along with subsequent 1 Minute overall average IOPS results that are 30 Minutes apart for Steady State determination.
4 Run the Access Pattern while varying demand settings:
4.1 Set test parameters and record for later reporting
4.1.1 Volatile device write cache = Disabled 4.1.2 Data Pattern: Same as Pre-conditioning 4.1.3 Vary TC using TC=[32,16,8,6,4,2,1] 4.1.4 Vary QD using QD=[32,16,8,6,4,2,1]
4.2 Apply Inter-Round Pre-Write
4.2.1 Apply Access Pattern, using TC=32 and QD=32 for a minimum of 5 minutes and a maximum of either 30 minutes or 10% of the User Capacity, whichever occurring first.
4.2.2 Record elapsed time, IOPS, ART, MRT and Percentage CPU Utilization by System (SYS_CPU) every 1 Minute.
4.3 Apply One Round of the Access Pattern:
4.3.1 Apply Access Pattern for 1 Minute at each TC and QD combination,

SSS PTS Version 2.0-Revision 0.7 Working Draft 69
in the order of decreasing TOIO from 1024 (32x32) to 1, using all of the TC/QD combinations that can be generated from TC/QD values given in Sections 4.1.3 and 4.1.4. When multiple TC/QD combinations give rise to equal TOIO values, apply TC/QD combination with the higher TC first.
4.3.2 Record elapsed time, IOPS, ART and MRT and Percentage CPU Utilization by System (SYS_CPU).
4.3.3 Repeat 4.2 and 4.3 until Steady State (see 2.1.24) is reached, using the overall average IOPS for the Access Pattern with TC=32 and QD=32 as the tracking variable, or until the maximum number of Rounds=25 has been reached.
5 Using Steady State data (or if Steady State not reached, data from the Measurement Window):
5.1 Plot ART versus IOPS using all of the (Thread Count, OIO/Thread) operating points, plotting 1 series per Thread Count setting for all Thread Count settings used.
5.2 Plot CPU_SYS versus Thread Count and OIO/Thread for all data.
6 Determine MaxIOPS, MinIOPS and a minimum of 1 MidIOPS operating point:
6.1 A MaxIOPS point shall be chosen from the (Thread Count, OIO/Thread) operating points, such that:
6.1.1 The MaxIOPS point should be chosen to represent the operating point where the IOPS are highest while achieving a reasonable ART.
6.1.2 The ART for such MaxIOPS point shall be below 5 mS.
6.2 The MinIOPS point is defined to be the operating point where Thread Count=1 and QD=1.
6.3 Choose a minimum of 1 additional MidIOPS point(s), using the (Thread Count, OIO/Thread) operating points obtained during the test run such that their IOPS values lie between and, as much as possible, equally divides the IOPS value between MinIOPS and MaxIOPS.
7 Response Time Histogram at Maximum IOPS:
7.1 Select a (Thread Count, Queue Depth) operating point that yields maximum IOPS using the lowest number of Total Outstanding IO (TOIO=Thread Count x Queue Depth)
7.2 Run Pre-Writes
7.2.1 Execute the Access Pattern as prescribed, but with R/W Mix=0/100 for 60 minutes. Log elapsed time, IOPS, ART and MRT every 1 minute.
7.3 Execute the Access Pattern as prescribed, for 10 minutes. Capture all individual IO command completion times such that a response time histogram showing count versus time can be constructed. The maximum time value used in the capture shall be greater or equal to the MRT encountered during the 10 minute capture.
8 Response Time Histogram at Minimum IOPS:
8.1 Select a (Thread Count=1, Queue Depth=1) operating point
8.2 Run Pre-Writes
8.2.1 Execute the Access Pattern as prescribed, but with R/W Mix=0/100 for 60 minutes. Log elapsed time, IOPS, ART and MRT every 1 minute.
8.3 Execute the Access Pattern as prescribed for 10 minutes. Capture all individual IO command completion times such that a response time

SSS PTS Version 2.0-Revision 0.7 Working Draft 70
histogram showing count versus time can be constructed. The maximum time value used in the capture shall be greater or equal to the MRT encountered during the 10 minute capture.
9 Response Time Histogram at one or more chosen MidIOPS operating points:
9.1 Select a (Thread Count, Queue Depth) operating point that yields an IOPS result that lies approximately halfway between Maximum IOPS in (6) above, and the Minimum IOPS in (7) above.
9.2 Run Pre-Writes:
9.2.1 Execute the Access Pattern as prescribed, but with R/W Mix=0/100 for 60 minutes. Log elapsed time, IOPS, ART and MRT every 1 minute.
9.3 Execute the Access Pattern as prescribed for 10 minutes. Capture all individual IO command completion times such that a response time histogram showing count versus time can be constructed. The maximum time value used in the capture shall be greater or equal to the MRT encountered during the 10 minute capture.
10 Process and plot the accumulated data, per report guidelines in next section.
13.3 Test Specific Reporting for CBW Test Sections 13.3.1 and 13.3.2 list the reporting requirements specific to the Composite BS Workload test. Reporting requirements common to all tests are documented in Section 5.
13.3.1 Purge Report The Test Operator shall report the method used to run the Purge operation.
13.3.2 Measurement Report The Test Operator shall generate Measurement Plots for CBW for Pre-conditioning; Steady State Determination; Between Round Pre Writes; Demand Variation IOPS Plots for Thread Count tracking; Steady State for OIO Tracking Variable; Demand Variation Plot; Demand Intensity Plot; CPU Utilization Plot; MAX IOPS Pre Write Plot; MID IOPS Pre Write Plot; MIN IOPS Pre Write Plot; and Response Time Histograms for MAX IOPS, MIN IOPS and MID IOPS using the Ranges, Ordinates and Plot Types are listed in Table 13-3. Plots are shown in Sections 13.3.2.1 through 13.3.2.14.

SSS PTS Version 2.0-Revision 0.7 Working Draft 71
Table 13-3 – CBW Measurement Plots Plot Plot Title Range Ordinate Plot Type Description 1 PC IOPS Plot IOPS Round 2D, x-y-spline IOPS v Tracking Round for the
tracking variable for Pre-conditioning using Access Pattern
2 PC Steady State Plot IOPS Round 2D, x-y-spline IOPS v Rounds for the tracking variable showing Steady State details
3 Btw-Round Prewrites Plot
IOPS Time 2D, x-y-scatter IOPS v Time showing Between Round Pre-Writes
4 DV IOPS Plot, TC=Tracking
IOPS Round 2D, x-y-spline IOPS v Round for TC of Tracking Variable, ALL QD as separate Series
5 DV Steady State Plot, Tracking Variable
IOPS Round 2D, x-y-spline IOPS v Round for Tracking Variable, showing Steady State details
6 Demand Variation Plot IOPS QD 2D, x-y-spline IOPS v QD for all TCs as separate series for Steady State results
7 Demand Intensity Plot Time IOPS 2D, x-y-spline Time (mS) v IOPS for all TC/QD Combinations, each TC plotted as a Series for Steady State results. MaxIOPS MidIOPS(s) MinIOPS points labeled.
8 System CPU Utilization Plot
% TC,QD 3D, x-y-z-bar CPU_SYS (%) v TC & QD for all Steady State results
9 MaxIOPS Prewrites IOPS Time 2D, x-y-spline MaxIOPS Prewrite: IOPS v Time for Prewrite preceding MaxIOPS Histogram Capture
10 Max IOPS Histogram Count Time 2D, x-y-bar MaxIOPS Histogram: Count (A.U.) v Time (mS), Legend should indicate MRT for the Histogram Capture
11 MidIOPS Prewrites IOPS Time 2D, x-y-spline MidIOPS Prewrite: IOPS v Time for Prewrite preceding MidIOPS Histogram Capture
12 Mid IOPS Histogram Count Time 2D, x-y-bar MidIOPS Histogram: Count (A.U.) v Time (mS), Legend should indicate MRT for the Histogram Capture
13 MinIOPS Prewrites IOPS Time 2D, x-y-spline MinIOPS Prewrite: IOPS v Time for Prewrite Preceding MinIOPS Histogram Capture
14 Min IOPS Histogram Count Time 2D, x-y-bar MinIOPS Histogram: Count (A.U.) v Time (mS), Legend should indicate MRT for the Histogram Capture
15 IOPS or BW v Total OIO IOPS or Bandwidth
Total OIO
2D, x-y-bar IOPS or BW v TOIO showing Average BW over the range of Total QD x TC.
Note on Headers: The individual Report Headers are the same for all pages of the report, except for reference to a specific test ID number if more than one test is used to generate the SNIA Report Header. The plots in the following sections show the test Report Header for the first plot example only. Test Report Headers are omitted for subsequent report pages for the same test report in order to provide more clarity for the related plot or graph.

SSS PTS Version 2.0-Revision 0.7 Working Draft 72
13.3.2.1 PC IOPS Plot
Plot 13-4 - Pre Conditioning IOPS Plot

SSS PTS Version 2.0-Revision 0.7 Working Draft 73
13.3.2.2 PC Steady State Plot
Plot 13-5 - PC Steady State Plot 13.3.2.3 Btw-Round Prewrites Plot
Plot 13-6 - Between-Round Prewrites

SSS PTS Version 2.0-Revision 0.7 Working Draft 74
13.3.2.4 DV IOPS Plot, TC=Tracking
Plot 13-7 - DV IOPS Plot, TC=Tracking 13.3.2.5 DV Steady State Plot, Tracking Variable
Plot 13-8 - DV Steady State Plot, Tracking Variable

SSS PTS Version 2.0-Revision 0.7 Working Draft 75
13.3.2.6 Demand Variation Plot
Plot 13-9 - Demand Variation Plot 13.3.2.7 Demand Intensity Plot
Plot 13-10 - Demand Intensity Plot

SSS PTS Version 2.0-Revision 0.7 Working Draft 76
13.3.2.8 CPU Utilization Plot
Plot 13-11 - CPU Utilization Plot 13.3.2.9 MaxIOPS Prewrites
Plot 13-12 - MaxIOPS Prewrites

SSS PTS Version 2.0-Revision 0.7 Working Draft 77
13.3.2.10 Max IOPS Histogram
Plot 13-13 - MaxIOPS Histogram 13.3.2.11 MidIOPS Prewrites
Plot 13-14 - MidIOPS Prewrites

SSS PTS Version 2.0-Revision 0.7 Working Draft 78
13.3.2.12 Mid IOPS Histogram
Plot 13-15 - MidIOPS Histogram 13.3.2.13 MinIOPS Prewrites
Plot 13-16 - MinIOPS Prewrites

SSS PTS Version 2.0-Revision 0.7 Working Draft 79
13.3.2.14 Min IOPS Histogram
Plot 13-17 - MinIOPS Histogram 13.3.2.15 IOPS v Total OIO
Plot 13-18 – IOPS v Total OIO
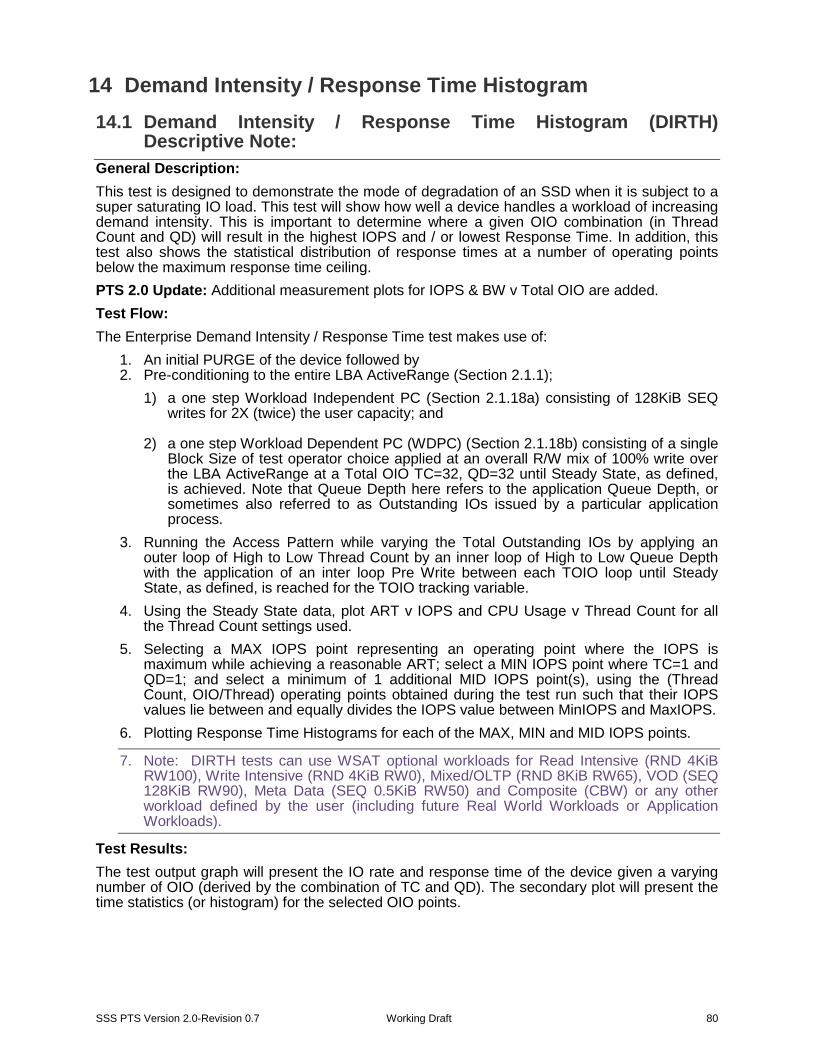
SSS PTS Version 2.0-Revision 0.7 Working Draft 80
14 Demand Intensity / Response Time Histogram 14.1 Demand Intensity / Response Time Histogram (DIRTH)
Descriptive Note: General Description: This test is designed to demonstrate the mode of degradation of an SSD when it is subject to a super saturating IO load. This test will show how well a device handles a workload of increasing demand intensity. This is important to determine where a given OIO combination (in Thread Count and QD) will result in the highest IOPS and / or lowest Response Time. In addition, this test also shows the statistical distribution of response times at a number of operating points below the maximum response time ceiling. PTS 2.0 Update: Additional measurement plots for IOPS & BW v Total OIO are added. Test Flow: The Enterprise Demand Intensity / Response Time test makes use of:
1. An initial PURGE of the device followed by 2. Pre-conditioning to the entire LBA ActiveRange (Section 2.1.1);
1) a one step Workload Independent PC (Section 2.1.18a) consisting of 128KiB SEQ writes for 2X (twice) the user capacity; and
2) a one step Workload Dependent PC (WDPC) (Section 2.1.18b) consisting of a single
Block Size of test operator choice applied at an overall R/W mix of 100% write over the LBA ActiveRange at a Total OIO TC=32, QD=32 until Steady State, as defined, is achieved. Note that Queue Depth here refers to the application Queue Depth, or sometimes also referred to as Outstanding IOs issued by a particular application process.
3. Running the Access Pattern while varying the Total Outstanding IOs by applying an outer loop of High to Low Thread Count by an inner loop of High to Low Queue Depth with the application of an inter loop Pre Write between each TOIO loop until Steady State, as defined, is reached for the TOIO tracking variable.
4. Using the Steady State data, plot ART v IOPS and CPU Usage v Thread Count for all the Thread Count settings used.
5. Selecting a MAX IOPS point representing an operating point where the IOPS is maximum while achieving a reasonable ART; select a MIN IOPS point where TC=1 and QD=1; and select a minimum of 1 additional MID IOPS point(s), using the (Thread Count, OIO/Thread) operating points obtained during the test run such that their IOPS values lie between and equally divides the IOPS value between MinIOPS and MaxIOPS.
6. Plotting Response Time Histograms for each of the MAX, MIN and MID IOPS points.
7. Note: DIRTH tests can use WSAT optional workloads for Read Intensive (RND 4KiB RW100), Write Intensive (RND 4KiB RW0), Mixed/OLTP (RND 8KiB RW65), VOD (SEQ 128KiB RW90), Meta Data (SEQ 0.5KiB RW50) and Composite (CBW) or any other workload defined by the user (including future Real World Workloads or Application Workloads).
Test Results: The test output graph will present the IO rate and response time of the device given a varying number of OIO (derived by the combination of TC and QD). The secondary plot will present the time statistics (or histogram) for the selected OIO points.

SSS PTS Version 2.0-Revision 0.7 Working Draft 81
Test Interpretation: The DI curve shows the Average Response times. To see Maximum Response Times, the histogram will show time statistics (response times and distributions) at the selected OIO maximum IOPS point. In general, the test operator should view the Response Time histogram with regard to the clustering of response times (tighter grouping is better), response times of the measurements (faster is better), the maximum response times and number of slow response time “outliers.”
14.2 DIRTH Pseudo Code For (ActiveRange=100%, optional ActiveRange=Test Operator Choice, Access Pattern = (R/W Mix=RW1, Block Size=BS1, Random)
1 Purge the device. (Note: Active Range and other Test Parameters are not applicable to Purge step; any values can be used and none need to be reported.)
2 Pre-conditioning using the Access Pattern, but with R/W Mix=0%
2.1 Set test parameters and record for later reporting
2.1.1 Volatile device write cache = Disabled 2.1.2 QD or OIO/Thread: 32 2.1.3 Thread Count: 32 2.1.4 Data Pattern: Required = Random, Optional = Test Operator Choice
2.2 Run Access Pattern, using the required ActiveRange=100% or the corresponding desired optional ActiveRange.
2.2.1 Record elapsed time, IOPS, Average Response Time (ART) and Maximum Response Time (MRT) every 1 minute.
2.2.2 Using the first 1 Minute IOPS, along with subsequent 1 Minute IOPS results that are 30 Minutes apart, run Access Pattern until Steady State (see 2.1.24) is reached, or until the maximum number of Rounds=25 has been reached.
3 Run the Access Pattern while varying demand settings:
3.1 Set test parameters and record for later reporting
3.1.1 Volatile device write cache = Disabled 3.1.2 Data Pattern: Same as Pre-conditioning 3.1.3 Vary TC using TC=[32,16,8,6,4,2,1] 3.1.4 Vary QD using QD=[32,16,8,6,4,2,1]
3.2 Apply Inter-Round Pre-Write
3.2.1 Apply Access Pattern, using TC=32 and QD=32 for a minimum of 5 minutes and a maximum of either 30 minutes or 10% of the User Capacity, whichever occurring first.
3.2.2 Record elapsed time, IOPS, ART, MRT and Percentage CPU Utilization by System (SYS_CPU) every 1 Minute.
3.3 Apply One Round of the Access Pattern:
3.3.1 Apply Access Pattern for 1 Minute at each TC/QD combination, in the order of decreasing TOIO from 1024 (32x32) to 1, using all of the TC/QD combinations that can be generated from TC and QD values given in Sections 3.1.3 and 3.1.4. When multiple TC/QD combinations give rise to equal TOIO values, apply TC/QD combination with the higher TC first.
3.3.2 Record elapsed time, IOPS, ART and MRT and Percentage CPU Utilization by System (CPU_SYS).
3.3.3 Repeat 3.2 and 3.3 until Steady State (see 2.1.24) is reached, using IOPS values for TC=32, QD=32 and Block Size and R/W Mix as

SSS PTS Version 2.0-Revision 0.7 Working Draft 82
specified in the Access Pattern as the tracking variable, or until the maximum number of Rounds=25 has been reached.
4 Using Steady State data (or if Steady State not reached, data from the Measurement Window):
4.1 Plot ART versus IOPS using all of the (Thread Count, OIO/Thread) operating points, plotting 1 series per Thread Count setting for all Thread Count settings used.
4.2 Plot CPU_SYS versus Thread Count and OIO/Thread for all data.
5 Determine MaxIOPS, MinIOPS and a minimum of 1 MidIOPS operating point:
5.1 A MaxIOPS point shall be chosen from the (Thread Count, OIO/Thread) operating points, such that:
5.1.1 The MaxIOPS point should be chosen to represent the operating point where the IOPS are highest while achieving a reasonable ART.
5.1.2 The ART for such MaxIOPS point shall be below 5 mS.
5.2 The MinIOPS point is defined to be the operating point where Thread Count=1 and OIO/Thread=1.
5.3 Choose a minimum of 1 additional MidIOPS point(s), using the (Thread Count, OIO/Thread) operating points obtained during the test run such that their IOPS values lie between and, as much as possible, equally divides the IOPS value between MinIOPS and MaxIOPS.
6 Response Time Histogram at Maximum IOPS:
6.1 Select a (Thread Count, Queue Depth) operating point that yields maximum IOPS using the lowest number of Total Outstanding IO (TOIO=Thread Count x Queue Depth)
6.2 Run Pre-Writes
6.2.1 Execute R/W Mix=0/100, Random, Block Size=BS1 for 60 minutes. Log elapsed time, IOPS, ART and MRT every 1 minute.
6.3 Execute R/W Mix=RW1, Random IO, Block Size=BS1 KiB for 10 minutes. Capture all individual IO command completion times such that a response time histogram showing count versus time can be constructed. The maximum time value used in the capture shall be greater or equal to the MRT encountered during the 10 minute capture.
7 Response Time Histogram at Minimum IOPS:
7.1 Select a (Thread Count=1, Queue Depth=1) operating point
7.2 Run Pre-Writes
7.2.1 Execute R/W Mix=0/100, Random, Block Size=BS1 for 60 minutes. Log elapsed time, IOPS, ART and MRT every 1 minute.
7.3 Execute R/W Mix=RW1, Random IO, Block Size=BS1 KiB for 10 minutes. Capture all individual IO command completion times such that a response time histogram showing count versus time can be constructed. The maximum time value used in the capture shall be greater or equal to the MRT encountered during the 10 minute capture.
8 Response Time Histogram at one or more chosen MidIOPS operating points:
8.1 Select a (Thread Count, Queue Depth) operating point that yields an IOPS result that lies approximately halfway between Maximum IOPS in (6) above, and the Minimum IOPS in (7) above.
8.2 Run Pre-Writes:
8.2.1 Execute R/W Mix=0/100, Random, Block Size=BS1 KiB for 60 minutes. Log elapsed time, IOPS, ART and MRT every 1 minute.

SSS PTS Version 2.0-Revision 0.7 Working Draft 83
8.3 Execute R/W Mix=RW1, Random IO, Block Size=BS1 KiB for 10 minutes. Capture all individual IO command completion times such that a response time histogram showing count versus time can be constructed. The maximum time value used in the capture shall be greater or equal to the MRT encountered during the 10 minute capture.
9 Process and plot the accumulated data, per report guidelines in next section.
14.3 Test Specific Reporting for DIRTH Test The following sub-sections list the reporting requirements specific to the Demand Intensity / Response Time Histogram test. Reporting requirements common to all tests are documented in Section 5.
Note on Headers: The individual Report Headers are the same for all pages of the report, except for reference to a specific test ID number if more than one test is used to generate the SNIA Report Header. The plots in the following sections show the test Report Header for the first plot example only. Test Report Headers are omitted for subsequent report pages for the same test report in order to provide more clarity for the related plot or graph.
14.3.1 Purge Report The Test Operator shall report the method used to run the Purge operation.
14.3.2 Measurement Report The Test Operator shall generate Measurement Plots for DIRTH for Pre-conditioning; Steady State Determination; Between Round Pre Writes; Demand Variation IOPS Plots for Thread Count tracking; Steady State for OIO Tracking Variable; Demand Variation Plot; Demand Intensity Plot; CPU Utilization Plot; MAX IOPS Pre Write Plot; MID IOPS Pre Write Plot; MIN IOPS Pre Write Plot; and Response Time Histograms for MAX IOPS, MIN IOPS and MID IOPS using the Ranges, Ordinates and Plot Types listed in Table 14-1 and shown in plots in Sections 14.3.2.1 through 14.3.2.14.
Table 14-1 – DIRTH Measurement Plots Plot Plot Title Range Ordinate Plot Type Description 1 PC IOPS Plot IOPS Time 2D, x-y-spline IOPS v Time for tracking variable for Pre-
conditioning using Access Pattern 2 PC Steady State Plot IOPS Round 2D, x-y-spline IOPS v Rounds for the tracking variable
showing Steady State details 3 Inter-Round Pre Writes
Plot IOPS Time 2D, x-y-scatter IOPS v Time showing Between Round
Pre-Writes 4 DV IOPS Plot,
TC=Tracking IOPS Round 2D, x-y-spline IOPS v Round for TC of Tracking Variable,
ALL QD as separate Series 5 DV Steady State Plot,
Tracking Variable IOPS Round 2D, x-y-spline IOPS v Round for Tracking Variable,
showing Steady State details 6 Demand Variation Plot IOPS QD 2D, x-y-spline IOPS v QD for all TCs as separate series
for Steady State results 7 Demand Intensity Plot Time IOPS 2D, x-y-spline Time (mS) v IOPS for all TC/QD
Combinations, each TC plotted as a Series for Steady State results. MaxIOPS MidIOPS(s) MinIOPS points labeled.
8 CPU Utilization Plot % TC,QD 3D, x-y-z-bar CPU_SYS (%) v TC & QD for all Steady State results
9 MaxIOPS Prewrites IOPS Time 2D, x-y-spline MaxIOPS Prewrite: IOPS v Time for Prewrite preceding MaxIOPS Histogram Capture
10 Max IOPS Histogram Count Time 2D, x-y-bar MaxIOPS Histogram: Count (A.U.) v Time (mS), Legend should indicate MRT for the Histogram Capture
11 MidIOPS Prewrites IOPS Time 2D, x-y-spline MidIOPS Prewrite: IOPS v Time for Prewrite preceding MidIOPS Histogram
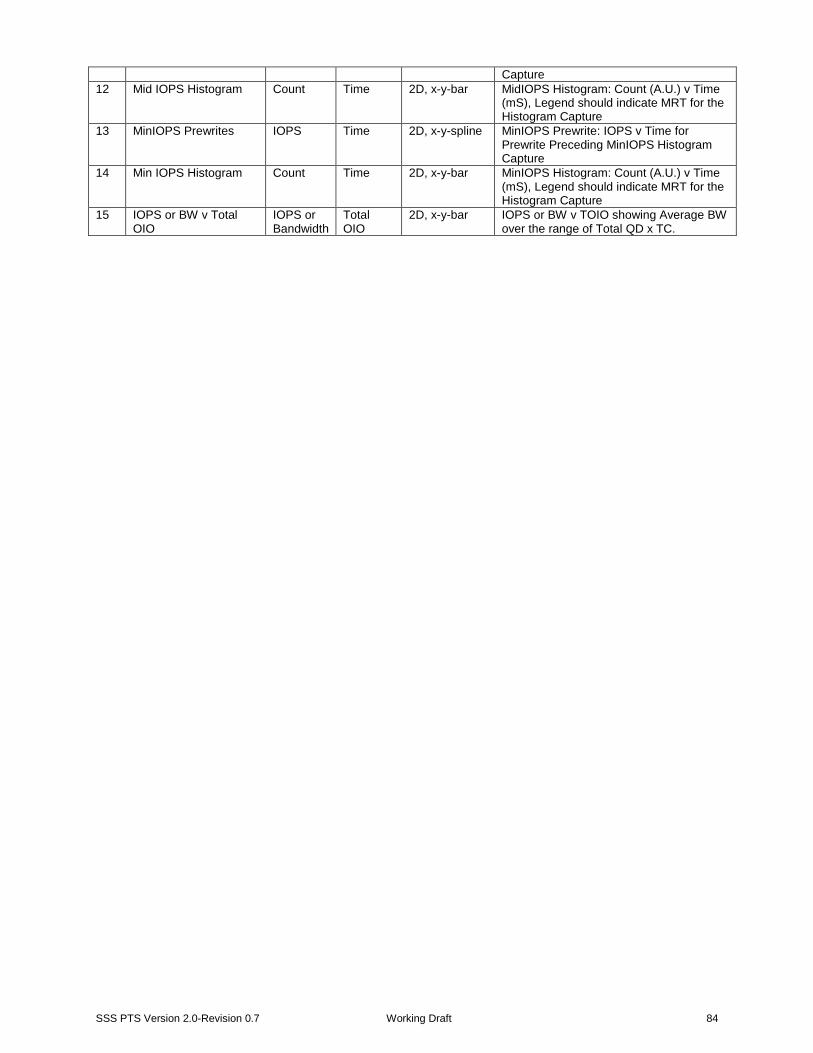
SSS PTS Version 2.0-Revision 0.7 Working Draft 84
Capture 12 Mid IOPS Histogram Count Time 2D, x-y-bar MidIOPS Histogram: Count (A.U.) v Time
(mS), Legend should indicate MRT for the Histogram Capture
13 MinIOPS Prewrites IOPS Time 2D, x-y-spline MinIOPS Prewrite: IOPS v Time for Prewrite Preceding MinIOPS Histogram Capture
14 Min IOPS Histogram Count Time 2D, x-y-bar MinIOPS Histogram: Count (A.U.) v Time (mS), Legend should indicate MRT for the Histogram Capture
15 IOPS or BW v Total OIO
IOPS or Bandwidth
Total OIO
2D, x-y-bar IOPS or BW v TOIO showing Average BW over the range of Total QD x TC.

SSS PTS Version 2.0-Revision 0.7 Working Draft 85
14.3.2.1 Pre Conditioning Plot
Plot 14-2 - Pre-Conditioning IOPS Plot

SSS PTS Version 2.0-Revision 0.7 Working Draft 86
14.3.2.2 Pre Conditioning Steady State
Plot 14-3 - Pre-Conditioning Steady State Plot
14.3.2.3 Inter Round Pre Writes
Plot 14-4 - Between Round Pre Writes

SSS PTS Version 2.0-Revision 0.7 Working Draft 87
14.3.2.4 Demand Variation IOPS
Plot 14-5 - DV IOPS Plot, TC=Tracking 14.3.2.5 Demand Variation Steady State
Plot 14-6 - DV Steady State Plot, Tracking Variable

SSS PTS Version 2.0-Revision 0.7 Working Draft 88
14.3.2.6 Demand Variation IOPS v QD
Plot 14-7 - Demand Variation Plot 14.3.2.7 Demand Intensity
Plot 14-8 - Demand Intensity Plot

SSS PTS Version 2.0-Revision 0.7 Working Draft 89
14.3.2.8 CPU Utilization
Plot 14-9 - System CPU Utilization Plot 14.3.2.9 Max IOPS Pre Writes
Plot 14-10 - Max IOPS Pre Writes

SSS PTS Version 2.0-Revision 0.7 Working Draft 90
14.3.2.10 Max IOPS Histogram
Plot 14-11 - Max IOPS Histogram 14.3.2.11 Mid IOPS Pre Writes
Plot 14-12 - Mid IOPS Pre Writes

SSS PTS Version 2.0-Revision 0.7 Working Draft 91
14.3.2.12 Mid IOPS Histogram
Plot 14-13 - Mid IOPS Histogram 14.3.2.13 Min IOPS Pre Writes
Plot 14-14 - Min IOPS Pre Writes
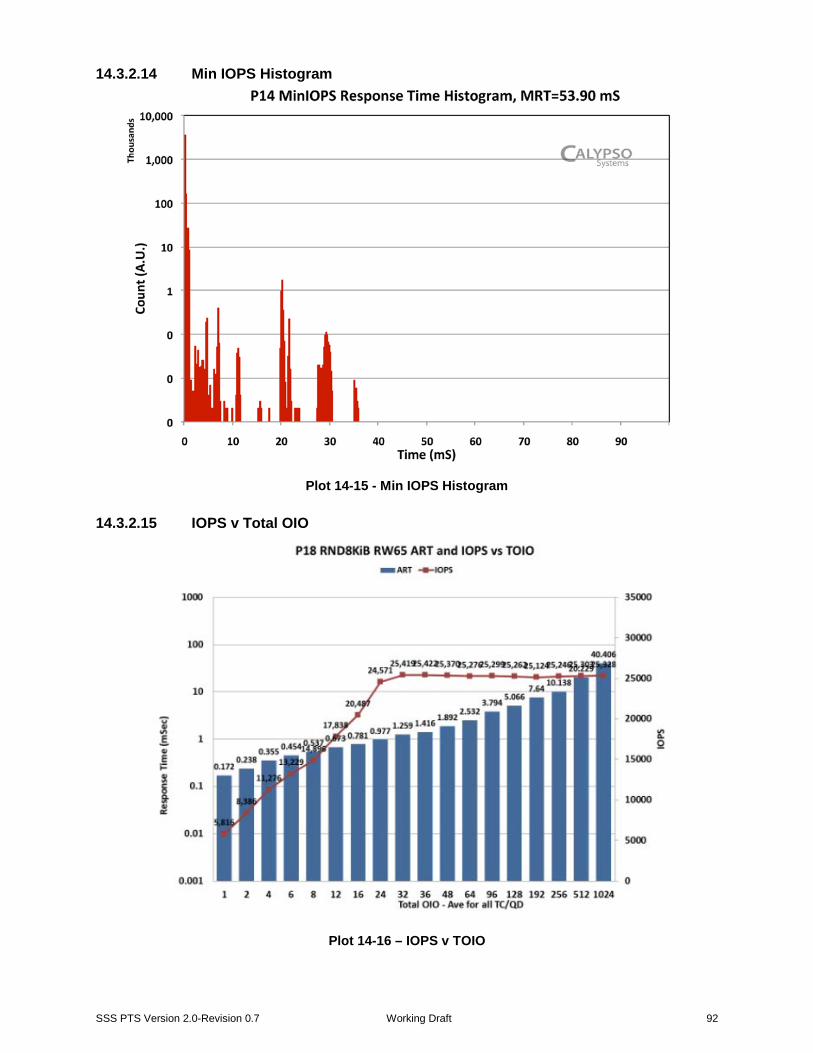
SSS PTS Version 2.0-Revision 0.7 Working Draft 92
14.3.2.14 Min IOPS Histogram
Plot 14-15 - Min IOPS Histogram
14.3.2.15 IOPS v Total OIO
Plot 14-16 – IOPS v TOIO

SSS PTS Version 2.0-Revision 0.7 Working Draft 93
Annex A (normative) Sample Test Report This annex displays a sample PTS-E version 1.1 SNIA Test Report (displayed in Plot A.1 through Plot A.8). Normative Individual Report Pages contain mandatory Report Headers on each page that set forth required reporting information pertinent to the tests presented on the particular page(s).
A.1 Sample IOPS Test Report Pages The sample IOPS Test Report pages are shown in Plot A.1 through A.8.

SSS PTS Version 2.0-Revision 0.7 Working Draft 94
Plot A.1 – IOPS Steady State Convergence Plot - All Block Sizes

SSS PTS Version 2.0-Revision 0.7 Working Draft 95
Plot A.2 – IOPS Steady State Measurement Window
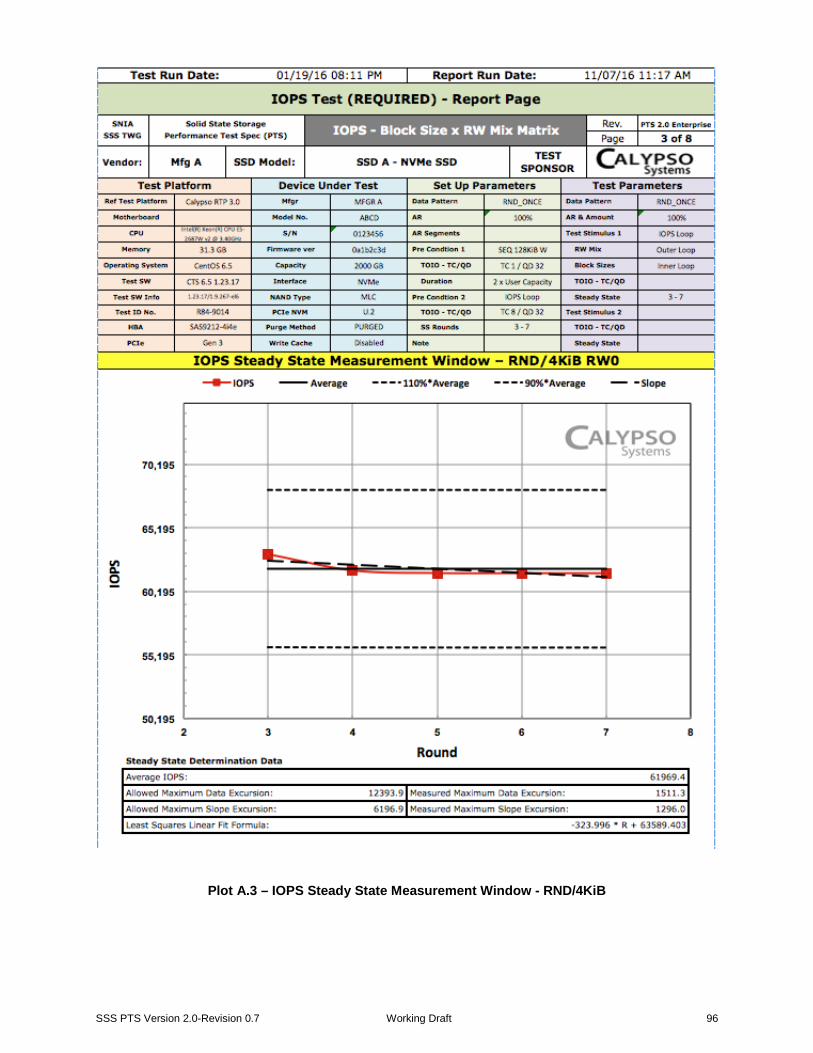
SSS PTS Version 2.0-Revision 0.7 Working Draft 96
Plot A.3 – IOPS Steady State Measurement Window - RND/4KiB

SSS PTS Version 2.0-Revision 0.7 Working Draft 97
Plot A.4 – IOPS - Steady State Measurement Window - RND/64KiB RW65
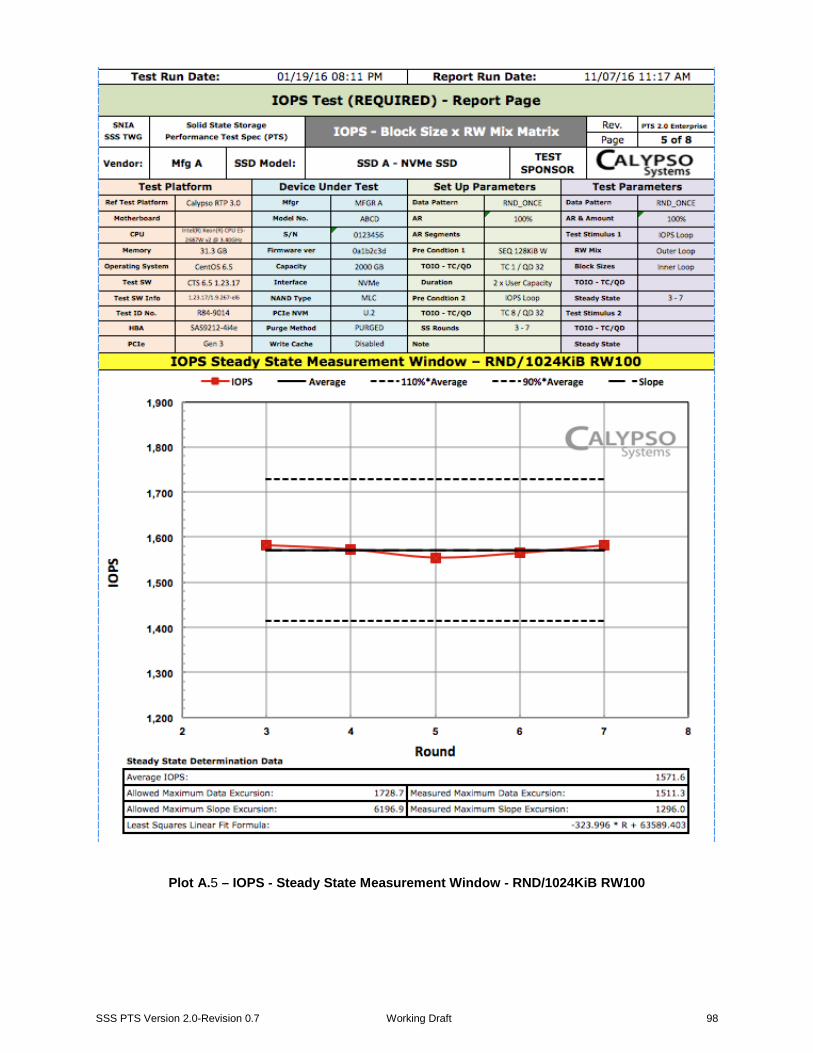
SSS PTS Version 2.0-Revision 0.7 Working Draft 98
Plot A.5 – IOPS - Steady State Measurement Window - RND/1024KiB RW100

SSS PTS Version 2.0-Revision 0.7 Working Draft 99
Plot A.6 – IOPS - All RW Mix & BS - Tabular Data

SSS PTS Version 2.0-Revision 0.7 Working Draft 100
Plot A.7 – IOPS – Table BS / RW Mixes

SSS PTS Version 2.0-Revision 0.7 Working Draft 101
Plot A.8 – IOPS -All RW Mix & BS - 3D Columns

SSS PTS Version 2.0-Revision 0.7 Working Draft 102
Annex B (Informative) Reference Test Platform Example This annex describes the hardware/software Reference Test Platform (RTP) that was used by the SSS TWG to do the bulk of the research and validation of the SSS PTS. The RTP is not required to run the SSS PTS tests; it is an example of a platform that was used to run the PTS. The RTP listing is updated from time to time by the SSSI TechDev Committee. The most recent RTP listing can be viewed at http://www.snia.org/forums/sssi/rtp.
In addition to the RTP, several other hardware/software platforms and software tools were used in the development and refinement of the PTS, such as Calypso CTS, IOmeter, Vdbench and in-house stimulus generators running on various versions of the Windows and Linux OS.
The RTP/CTS is used to test SSDs to the PTS and publish results on the SNIA SSSI website http://www.snia.org/forums/sssi. Other Operating Systems (e.g. Windows, FreeBSD, etc.), test hardware and software can be used but results will differ from the RTP/CTS. Use of different OS, test software or hardware shall be disclosed with any published PTS test results.