Embed Size (px)
Citation preview
State Guide Plan Element 171
Report #
SOLID WASTE 2038
Rhode Island Comprehensive Solid Waste Management Plan
Preliminary Draft: September, 2014
Rhode Island Department of Administration
Division of Planning One Capitol Hill
Providence, Rhode Island 02908
www.planning.ri.gov
State Guide Plan 171 Preliminary Draft: September, 2014
i
The Rhode Island Statewide Planning Program, Division of Planning, Department of
Administration is established by § 42-11-10, Statewide Planning Program, of the Rhode Island General
Laws as the central planning agency for Rhode Island. The State Planning Council, comprised of federal,
state, local, public representatives, and other advisors, guides the work of the Program. The objectives of
the Program are to:
- prepare Guide Plan Elements for the State, - coordinate activities of the public and private sectors within the framework the State
Guide Plan, - assist municipal governments with planning, and - advise the Governor and others on physical, social, and economic planning related topics.
Further, the Division of Planning is authorized by § 23-19-11 of the Rhode Island General Laws, to cooperate with the Rhode Island Resource Recovery Corporation so that this comprehensive solid waste and statewide resource recovery system development plan is consistent with the State Guide Plan.
This publication is based upon publicly supported research and may not be copyrighted. It may
be reprinted, in part or full, with credit acknowledged to the Division of Planning. Copies of this
information are also available in a format for the physically challenged and digital format on the Division
of Planning World Wide Web site. http://www.planning.ri.gov Contact the Division of Planning, One
Capitol Hill, Providence, RI, 02908, and (401) 222-7901 for further information.
State Guide Plan 171 Preliminary Draft: September, 2014
ii
Abstract
TITLE: Solid Waste 2038
SUBJECT: Management of the disposal of solid waste in the State of Rhode Island
DATE: Adopted by the State Planning Council on XXXXXX
AGENCY: Division of Planning
Rhode Island Department of Administration
One Capitol Hill
Providence, RI 02908 (401) 222-7901
www.planning.ri.gov
PROJECT: Work Task # 2070, Fiscal Years 2013-2015
SERIES: Report Number XXX; State Guide Plan Element 171
NUMBER OF PAGES: 104 pages plus abstract, glossary, and appendices
ABSTRACT:
Solid Waste 2038 updates the State Guide Plan Element 171 adopted in 2007. It is intended to guide the activities of the Rhode Island Resource Recovery Corporation and the Department of Environmental Management. It also serves to meet the need for a solid waste management plan as required by the Federal Resource Conservation and Recovery act of 1976. This plan describes existing practices, programs, and activities in all major solid waste management areas and develops recommendations specific to each. It is intended to advance the effectiveness of public and private stewardship of the State’s disposal of solid waste. As an element of the State Guide Plan, this Plan sets forth goals and policies that must, under state law, be reflected in future updates of comprehensive community plans.
State Guide Plan 171 Preliminary Draft: September, 2014
iii
State Planning Council
INSERT LIST OF NAMES WHEN ADOTPED
State Guide Plan 171 Preliminary Draft: September, 2014
iv
Technical Committee
INSERT LIST OF NAMES WHEN ADOTPED

State Guide Plan 171 Preliminary Draft: September, 2014
v
Solid Waste Management Plan Advisory Committee
INSERT LIST OF NAMES WHEN ADOTPED
State Guide Plan 171 Preliminary Draft: September, 2014
vi
Acknowledgements
The Plan was developed through a Memorandum of Understanding involving, the Rhode Island
Resource Recovery Corporation (RIRRC), the Department of Environmental Management (DEM), and the
Division of Planning of the Department of Administration. The Board of Commissioners of the RIRRC at
the time the Plan was adopted were:
INSERT LIST OF BOARD MEMBERS AT ADOPTION
A working group guided the development of the Plan and coordinated the review of the Plan by
the Advisory Committee, the DEM, the Board of Commissioners and the State Planning Council and its
Technical Committee. The members of the working group were:
Division of Planning
Land Use & Natural Resources Unit:
Nancy Hess, Supervising Planner
Jeff Davis, Principal Planner
Paul Gonsalves, Senior Planner
Jared Rhodes, Chief Statewide Planning Program
RIRRC
Mike OConnell, Executive Director Mike McGonagle, Director of Information Systems and Business Analysis Sarah Kite-Reeves, Director of Recycling Services
DEM – Office of Waste Management
Terry Gray, Assistant Director for Air, Waste & Compliance Laurie Grandchamp, Supervising Engineer Alyson Brunelli, Commercial Recycling Coordinator
State Guide Plan 171 Preliminary Draft: September, 2014
vii
Table of Contents
Page No.
Abstract ii
State Planning Council iii
Technical Committee iv
Solid Waste Management Plan Advisory Committee v
Acknowledgements vi
Table of Contents vii
List of Tables & Figures ix
Executive Summary ES-1 Part 1 Introduction & Vision 1-1 Issues Addressed
Vision Statement
Part 2 Overview of Solid Waste in RI 2-1 What is Solid Waste & Recycling?
Where Does Our Solid Waste Go? Where Could it Go?
Options for Managing Wastes
Opportunities for Increased Recovery
Construction & Demolition Debris
Who Does What?
Providing for Recycling and Disposal
Financing
Municipal Facilities & Operations
Town of Johnston
Private Sector
Recycling
Commercial
Roles & Responsibilities
Common Misconceptions
Obstacles to Improvement
Markets for Disposal & Recycling - Yesterday, Today and the Future
Economics of Managing Waste
Financing facilities, Planning and Flow Control
Climate Change & Transportation Impacts
Part 3 Issues, Strategies & Options for Solid Waste Planning 3-1
Issue #1: Funding Issue #2: Reduce solid waste volumes and preserve landfill life Issue #3: Post Central Landfill Disposal Options
State Guide Plan 171 Preliminary Draft: September, 2014
viii
Page No.
Part 4 Recommended Actions 4-1 Implementation Matrix: Recommended Actions
Appendices
A. Glossary of Terms & Acronyms
B. Central Landfill & MRF
C. Statewide Resource Recovery System Development Plan
D. Rhode Island Resource Recovery Background Information.
E. Outreach & Equity
Tables
Table 1, Rhode Island Solid Waste Materials Managed (tons)
Table 2, Estimates of Current and Required Recovery for Refuse by Source
Table 3, Permitted Composting Facility Capacities
Table 4, Permitted RI Solid Waste Transfer Stations and Residential Drop-Off Facilities
Table 5, Average Prices Paid for RIRRC MRF Commodities by Year
Table 6, RI Market Dominated by WTF
Table 7, NE Solid Waste Disposal Capacity
Figures Figure 1A, Total MSW Generation (by material) 2011
Figure 1B, Total MSW Generation (by category) 2011
Figure 2, 2013 Disposition of RI Wastes
Figure 3, Required Disposition of RI Refuse (K tons) Figure 4, RI Solid Waste Facilities Figure 5, 2013 Municipal Waste Management Data
Figure 6, Historical Recycling Received by RIRRC
Figure 7, Thirty Years of Refuse Delivered to RIRRC
Figure 8, RIRRC Commercial Refuse Disposal and Pricing
State Guide Plan 171 Preliminary Draft: September 2014
ES - 1
This 20-year Solid Waste Management
Plan is Rhode Island’s most crucial
one ever. Why? Because time is
running out.
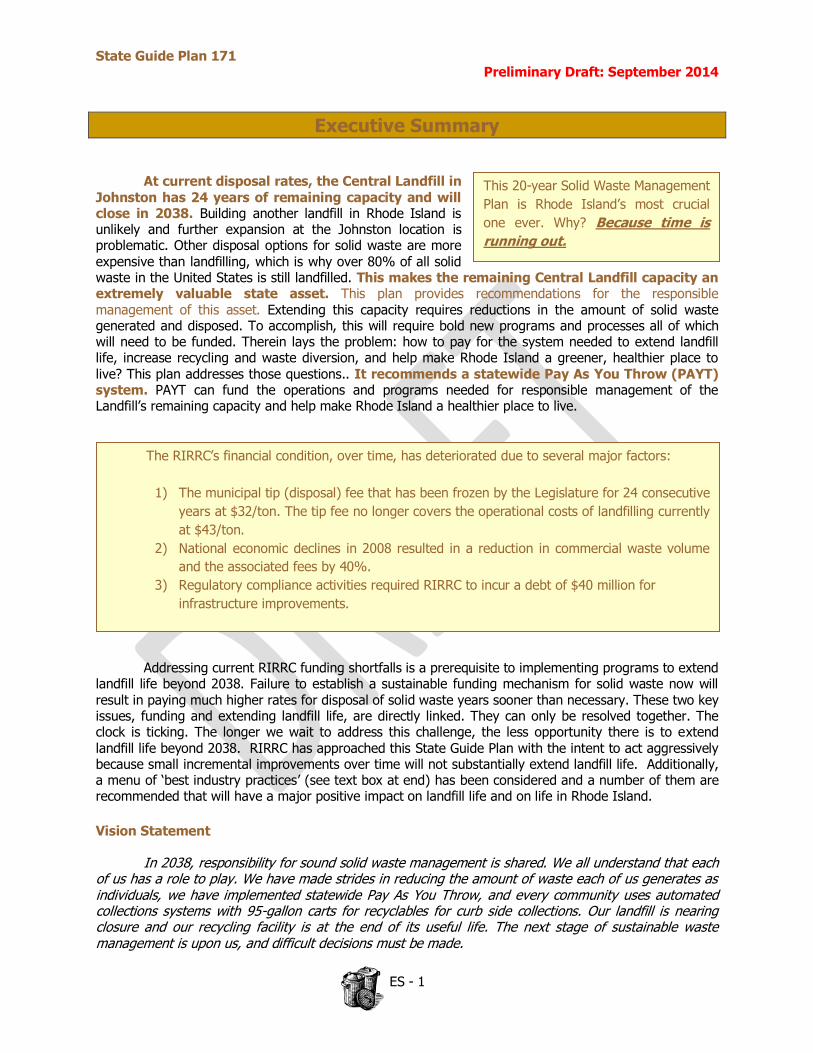
The RIRRC’s financial condition, over time, has deteriorated due to several major factors:
1) The municipal tip (disposal) fee that has been frozen by the Legislature for 24 consecutive
years at $32/ton. The tip fee no longer covers the operational costs of landfilling currently
at $43/ton.
2) National economic declines in 2008 resulted in a reduction in commercial waste volume
and the associated fees by 40%.
3) Regulatory compliance activities required RIRRC to incur a debt of $40 million for
infrastructure improvements.
Executive Summary
At current disposal rates, the Central Landfill in Johnston has 24 years of remaining capacity and will close in 2038. Building another landfill in Rhode Island is unlikely and further expansion at the Johnston location is problematic. Other disposal options for solid waste are more
expensive than landfilling, which is why over 80% of all solid waste in the United States is still landfilled. This makes the remaining Central Landfill capacity an extremely valuable state asset. This plan provides recommendations for the responsible management of this asset. Extending this capacity requires reductions in the amount of solid waste generated and disposed. To accomplish, this will require bold new programs and processes all of which will need to be funded. Therein lays the problem: how to pay for the system needed to extend landfill life, increase recycling and waste diversion, and help make Rhode Island a greener, healthier place to live? This plan addresses those questions.. It recommends a statewide Pay As You Throw (PAYT) system. PAYT can fund the operations and programs needed for responsible management of the Landfill’s remaining capacity and help make Rhode Island a healthier place to live.
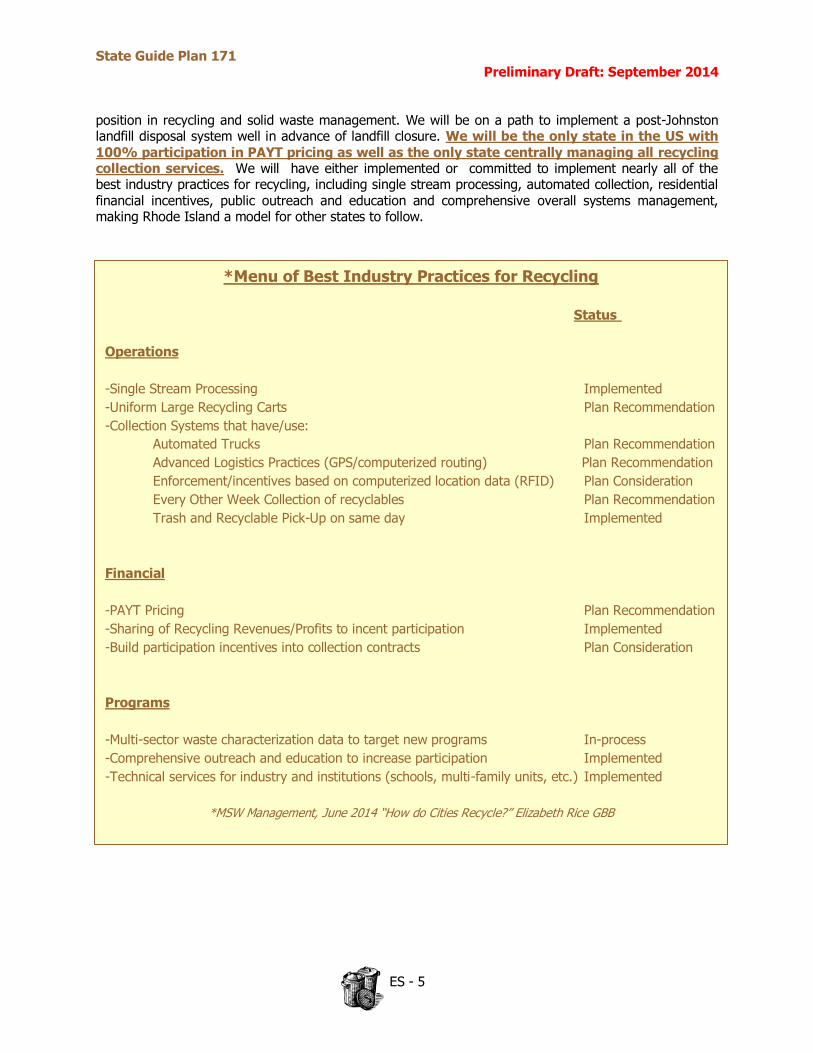
Addressing current RIRRC funding shortfalls is a prerequisite to implementing programs to extend landfill life beyond 2038. Failure to establish a sustainable funding mechanism for solid waste now will result in paying much higher rates for disposal of solid waste years sooner than necessary. These two key issues, funding and extending landfill life, are directly linked. They can only be resolved together. The clock is ticking. The longer we wait to address this challenge, the less opportunity there is to extend landfill life beyond 2038. RIRRC has approached this State Guide Plan with the intent to act aggressively because small incremental improvements over time will not substantially extend landfill life. Additionally, a menu of ‘best industry practices’ (see text box at end) has been considered and a number of them are recommended that will have a major positive impact on landfill life and on life in Rhode Island.
Vision Statement
In 2038, responsibility for sound solid waste management is shared. We all understand that each of us has a role to play. We have made strides in reducing the amount of waste each of us generates as individuals, we have implemented statewide Pay As You Throw, and every community uses automated collections systems with 95-gallon carts for recyclables for curb side collections. Our landfill is nearing closure and our recycling facility is at the end of its useful life. The next stage of sustainable waste management is upon us, and difficult decisions must be made.
State Guide Plan 171 Preliminary Draft: September 2014
ES - 2
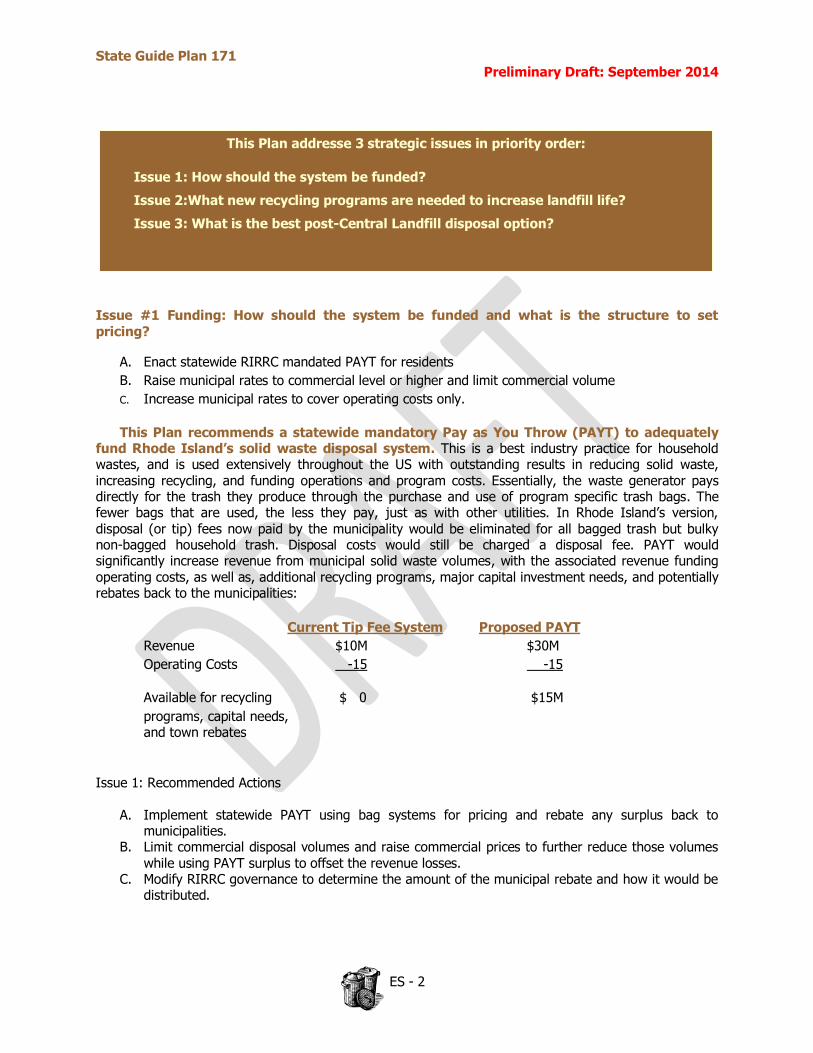
This Plan addresse 3 strategic issues in priority order:
Issue 1: How should the system be funded?
Issue 2:What new recycling programs are needed to increase landfill life?
Issue 3: What is the best post-Central Landfill disposal option?
Issue #1 Funding: How should the system be funded and what is the structure to set pricing?
A. Enact statewide RIRRC mandated PAYT for residents
B. Raise municipal rates to commercial level or higher and limit commercial volume
C. Increase municipal rates to cover operating costs only.
This Plan recommends a statewide mandatory Pay as You Throw (PAYT) to adequately fund Rhode Island’s solid waste disposal system. This is a best industry practice for household wastes, and is used extensively throughout the US with outstanding results in reducing solid waste, increasing recycling, and funding operations and program costs. Essentially, the waste generator pays directly for the trash they produce through the purchase and use of program specific trash bags. The fewer bags that are used, the less they pay, just as with other utilities. In Rhode Island’s version, disposal (or tip) fees now paid by the municipality would be eliminated for all bagged trash but bulky non-bagged household trash. Disposal costs would still be charged a disposal fee. PAYT would significantly increase revenue from municipal solid waste volumes, with the associated revenue funding operating costs, as well as, additional recycling programs, major capital investment needs, and potentially rebates back to the municipalities:
Current Tip Fee System Proposed PAYT
Revenue $10M $30M
Operating Costs -15 -15
Available for recycling $ 0 $15M
programs, capital needs, and town rebates
Issue 1: Recommended Actions
A. Implement statewide PAYT using bag systems for pricing and rebate any surplus back to municipalities.
B. Limit commercial disposal volumes and raise commercial prices to further reduce those volumes while using PAYT surplus to offset the revenue losses.
C. Modify RIRRC governance to determine the amount of the municipal rebate and how it would be distributed.
State Guide Plan 171 Preliminary Draft: September 2014
ES - 3
The commercial Sector represents
450,000 tons annually or 60% of the
solid waste volume disposed at
RIRRC.
The municipal sector generates
approximately 300,000 tons/annually
or 40% of current disposal volumes at
RIRRC.
Issue #2 New Programs: What is the overall strategy to further reduce solid waste and extend the life of the Land Fill?
A. Maintain Status Quo B. Invest in new programs and policies to significantly
reduce waste. C. Manage primarily as a municipal disposal facility
Issue 2 Recommendation Actions:
A. Conduct a waste characterization study of RI solid waste B. Implement a RIRRC mandated Statewide PAYT program. C. Consider centralized management of recycling services by RIRRC
D. Shift additional commercial volumes to out-of–state locations through price increases and PAYT E. Identify under-performing municipalities and barriers to improvement F. Expand Producer Responsibility (EPR) Programs. G. Improve paper and packing recycling in the commercial sector. H. Support food waste diversion. I. Continue to provide public education and technical services. J. Employ new and expanded public outreach programs. K. Identify underperforming school programs and barriers to improvement.
These programs are expected to be implemented over the next five years and deliver a 20% or greater reduction in the volume of disposed municipal solid waste. Two of these programs, PAYT and centralizing responsibility for all municipal recycling collection services with RIRRC, are unique opportunities for a small state like Rhode Island. Centralized management would facilitate standardization of best industry practices including the use of uniform large carts for recycling, every other week collection of recyclables, and the opportunity to use more sophisticated collection data to improve effectiveness and enforcement. When these new programs are implemented and combined with existing ones, Rhode Island would instantly become a national leader in municipal recycling systems being the only state in the US with 100% PAYT participation and centralized management of all municipal recycling collection services.
The commercial sector: This sector, unlike the municipal, is free to take their waste to the disposal site of their choice. While statutorily required to recycle, enforcement by DEM has always been impractical, requiring extensive funding to be effective. Nevertheless, businesses will recycle when
legislation compels them or when economics make it attractive. The two programs recommended in this Plan to increase commercial recycling are:
1) Providing more technical support to businesses to improve paper and packaging recycling. 2) Increase support behind legislation that encourages commercial food waste diversion.
These programs target what is believed to be the largest two components in the commercial waste stream—paper and packaging, and organics. Since this sector is motivated largely by market forces and their own economics, it is difficult to estimate the impact and timing of the above programs. A far quicker and more impactful way to reduce this sector’s solid waste volume would be to shift more

State Guide Plan 171 Preliminary Draft: September 2014
ES - 4
commercial trash to out of state landfills and incinerators by increasing RIRRC commercial tip fees. As long as the volume (revenue) loss could be absorbed by the PAYT revenue stream, this tactic could be
implemented in short order. It is assumed that increasing commercial prices to market levels or higher would incent an additional 200,000-250,000 tons of commercial solid waste to move out of state. The revenue loss from these 200,000 tons, estimated at $5 to $8 million net of further operational savings, would need to be offset from PAYT surpluses.
Combining both municipal and commercial solid waste reduction programs, it is expected that Rhode Island’s solid waste volumes will decline by 1/3 from 750,000 tons per year down to below 500,000 tons annually. When implemented, this would add 12 to 15 years of additional life to the Central Landfill, extending closure beyond 2050.
Not to be overlooked, PAYT funding offers the possibility to eliminate an additional 250,000 tons or all remaining commercial volume which would extend landfill life for municipalities from 2050 to 2087 or an additional 37 years. Such a significant action would need to be carefully considered from a policy, financial, and governance perspective and would require using all of the projected PAYT surpluses to offset revenue losses from the entire commercial sector. While it is premature to suggest such a policy change in this Plan, it should be given serious consideration once PAYT is implemented and underway. Should passage of legislation for PAYT be unsuccessful, these volume reductions and extension of landfill life will not be achieved. Revenues would be unavailable to fund new investments to increase recycling or to offset revenue losses if commercial volumes were shifted from the Central Landfill to out of state facilities. Landfill life expectancy would remain at 24 years with only modest opportunity to extend past the expected 2038 closure. Planning for the post-Central Landfill option would become the highest priority.
Issue #3 What Happens when the Central Landfill closes in 2038? Very soon, Rhode Island will need to decide the State’s best disposal option to replace the Central Landfill when it eventually closes. The final recommendation for the new disposal system will be included in the next update of this Plan. If the recommended action requires construction of a processing facility, it would take another 5 – 10 years for permitting and construction. That brings the expected planning timeline to 10 - 15 years, making it 2025 at the earliest before RI sees the new disposal option or options fully functional. Our intent is to explore the following options over the next 3 years:
1) Transport/dispose of Rhode Island municipal waste out of state. 2) Use technology to turn Rhode Island waste into energy. 3) Adopt ” Zero Waste” objectives 4) Explore additional landfill expansion in Rhode Island.
Issue 3 Recommendation Actions:
Evaluate the four options and recommend best option by 2017 Begin implementation as early as 2021.
This Solid Waste Management Plan is Rhode Island’s most critical ever…because time is running out to preserve landfill capacity. The choice is to either to fix the funding issue now in order to implement programs that will extend landfill life for the long term benefit of Rhode Islanders or to continue with the status quo and see the landfill close in 2038 with much higher disposal costs in the future. This Plan offers a number of bold recommendations that when implemented will not only add years of landfill life beyond 2038, but will vault Rhode Island into a nationally prominent leadership
State Guide Plan 171 Preliminary Draft: September 2014
ES - 5
*Menu of Best Industry Practices for Recycling
Status
Operations
-Single Stream Processing Implemented
-Uniform Large Recycling Carts Plan Recommendation
-Collection Systems that have/use:
Automated Trucks Plan Recommendation
Advanced Logistics Practices (GPS/computerized routing) Plan Recommendation
Enforcement/incentives based on computerized location data (RFID) Plan Consideration
Every Other Week Collection of recyclables Plan Recommendation
Trash and Recyclable Pick-Up on same day Implemented
Financial
-PAYT Pricing Plan Recommendation
-Sharing of Recycling Revenues/Profits to incent participation Implemented
-Build participation incentives into collection contracts Plan Consideration
Programs
-Multi-sector waste characterization data to target new programs In-process
-Comprehensive outreach and education to increase participation Implemented
-Technical services for industry and institutions (schools, multi-family units, etc.) Implemented
*MSW Management, June 2014 “How do Cities Recycle?” Elizabeth Rice GBB
position in recycling and solid waste management. We will be on a path to implement a post-Johnston landfill disposal system well in advance of landfill closure. We will be the only state in the US with
100% participation in PAYT pricing as well as the only state centrally managing all recycling collection services. We will have either implemented or committed to implement nearly all of the best industry practices for recycling, including single stream processing, automated collection, residential financial incentives, public outreach and education and comprehensive overall systems management, making Rhode Island a model for other states to follow.
State Guide Plan 171 Preliminary Draft: September 2014
1- 1
Key Points:
A plan for the current and future management of solid waste for the State of Rhode Island
It provides direction for the RIRRC, DEM and municipalities
3 key Issues are addressed:
o Funding our solid waste system
o Reducing waste and extending the life of the Central Landfill
o Post Central Landfill disposal options
Vision Statement
Goals
Part 1 Introduction & Vision
What is this plan?
This plan updates the Solid Waste Management Plan of
2007 and will ensure that the State of Rhode Island has a comprehensive and coordinated plan to provide cost effective and environmentally compliant waste management and recycling services for residents, businesses, industry, and municipalities. It is intended to guide activities of the Rhode Island Resource Recovery Corporation (RIRRC) and the Department of Environmental Management (DEM). This plan describes existing practices, programs, and activities in all major solid waste management areas and develops recommendations specific to each area. It also describes potential avenues for solid waste management in Rhode Island post-closure of the Central Landfill.
What is its Purpose?
• It serves as the long-range policy and program guidance document for the RI Resource Recovery Corporation and other State agencies.
• It functions as the Statewide Resource Recovery System Development Plan containing 20-year
projections of waste generation, recycling, and disposal compared with capacity. • It guides the activities of Department of Environmental Management and serves as the state
solid waste management plan as required by the Federal Resource Conservation and Recovery Act of 1976.
• It serves as the solid waste management element of the State Guide Plan that in turn guides municipal Comprehensive Community Plans.
State Guide Plan 171 Preliminary Draft: September 2014
1- 2
What issues does it seek to address? ISSUE #1: Funding - How should Rhode Island fund its Solid Waste Disposal and Recycling facilities and their related programs managed by RIRRC? ISSUE #2: What overall strategy should be adopted now to further reduce solid waste volumes and preserve landfill life beyond the projected 2038 date? ISSUE #3: Post Central Landfill Disposal Options - What is the post Central Landfill disposal option that will provide the most environmentally sound and economically viable waste disposal services with the least amount of risk? Vision Statement
In 2038, responsibility for sound solid waste management is shared. We all understand that each of us has a role to play. We have made strides in reducing the amount of waste each of us generates as individuals, we have implemented statewide Pay As You Throw, and every community uses automated collections systems with 95-gallon carts for recyclables for curb side collections. Our landfill is nearing closure and our recycling facility is at the end of its useful life. The next stage of sustainable waste management is upon us, and difficult decisions must be made.
To be truly sustainable, RI must invest in full-scale residential composting facilities. We must
make organics, management a top statewide priority. We must continue to invest in manufacturing processes that use recyclables as feedstock and provide long-term, high-quality jobs. We must implement the best state of the art technologies and public policy practice to maximize the remaining years of the central landfill, increase the remaining usefulness of the Materials Recycling Facility (MRF), and begin the transition to the solid waste management practices that will take the State into the 22nd century.
This plan describes the path to the 22nd century, using the following goals: Goal 1: Adopt stable, long‐term funding mechanisms that provide sufficient revenue for state, regional, and local programs while providing incentives for increased waste reduction and diversion. Goal 2: Reduce the amount of Rhode Island generated solid waste requiring disposal through increased source reduction, reuse, recycling, and composting. Goal 3: Manage the solid waste that ultimately must be disposed in an efficient, equitable, safe and environmentally protective manner, consistent with the statutory solid waste hierarchy. Goal 4: Communicate proactively plan priorities and processes to municipal officials and planners for incorporation into local guidance documents. Goal 5: Identify the research and analysis that should be undertaken over the near term (3 years) in order to make informed decisions on the facilities and waste management strategies that will serve Rhode Island leading up to and beyond the final closing of the Johnston Landfill.
State Guide Plan 171 Preliminary Draft: September 2014
2 - 1
Report Terminology (See Appendix A for a larger glossary)
Solid Waste – the entirety of non-hazardous waste materials disposed and recycled by all sources
Construction & Demolition Debris (C&DD) - waste building materials resulting from construction, remodeling or repairing structures or waste generated from the razing of structures
Refuse – materials disposed and recycled from both residential and commercial sources but excluding C&DD, sludge, industrial, and agricultural wastes. What is classified by the USEPA as “municipal solid waste”
MSW (Municipal Solid Waste) – solid waste for which municipalities take responsibility for collection and disposal
CSW (Commercial Solid Waste) – solid waste generated by businesses and institutions including industrial and agricultural wastes managed by commercial haulers
Recycling – will refer to the traditional use – the conversion of discarded materials into raw materials, which are then used to make new products; this definition will
specifically not include waste to energy in this Plan
We are all responsible for managing wastes at the source, whether at home, in public areas, at work, or in school. Perhaps more important is the role we all play in determining whether solid waste is created in the first place.
Key Points:
What is solid waste & recycling Where does RI solid waste go? Options for managing wastes Opportunities for increased recovery Who does what? Providing for recycling and disposal
o Financing Municipal facilities & operations The private sector
Recycling; commercial & misconceptions Economics
o Markets & costs for disposal, composting, & recyclables Climate Change & Transportation
Part 2 Overview of Solid waste in Rhode Island

State Guide Plan 171 Preliminary Draft: September 2014
2 - 2
Figure 1B, Total MSW Generation (by
category), 2011
Figure1A, Total MSW Generation (by material), 2011
What is Solid Waste & Recycling?
Solid waste, more specifically municipal solid waste (MSW), and recycling are terms used generically that often have different meanings among professions and across jurisdictions. In Rhode Island, Solid Waste is defined by State Law (RIGL § 23-18.9-7) as “garbage, refuse, tree waste and other discarded solid materials generated by residential, institutional, commercial, industrial, and agricultural sources, and specifically excludes sewage sludge, used asphalt, and concrete”. MSW as defined in Rhode Island (RIGL § 23-19-5) is “solid waste generated by the residents of a municipality in the course of their daily living, the disposal of which the governing body of that
municipality has undertaken in the discharge of its duties to protect the health of the municipality…”, and specifically excludes solid waste generated by any manufacturing or commercial enterprise. The DEM regulations differentiate between MSW, commercial solid waste (CSW) and non-municipal residential waste in order to accommodate recycling regulations across different generators and managers of solid waste. Alternatively, the U.S. Environmental Protection Agency (USEPA) applies the combined categories of material classified in Rhode Island as MSW, CSW and non-municipal residential solid waste under the umbrella of “municipal solid waste”, specifically excluding solid waste from industrial, agricultural, and construction and demolition sources. However, in practice, solid waste disposal facilities, and in particular RCRA Subtitle D, Landfills (often called “municipal solid waste landfills”) handle solid wastes from all sources.
The term recycling is defined in Rhode Island statute as “…the reuse of recovered resources in
manufacturing, agriculture, power production, or other processes.” However, in most other jurisdictions the production of power from waste is specifically excluded from recycling. While it is common for people to use recycling to refer to the reuse of items in their original form (e.g., thrift ship donations), this is incorrect.
These different meanings cause confusion, so for the purpose of this plan we will apply the term refuse when referring to those materials classified by USEPA as municipal solid waste (along with industrial, agricultural, construction and demolition (C&DD)), and the term solid waste used on its own will mean all non-hazardous materials disposed and recycled. The terms municipal and commercial will be used when differentiating waste and recycling for which municipal governments have taken responsibility or not. We will also use the definition of recycling provided by the USEPA: “the series of activities by which discarded materials are collected, sorted, processed, and converted into raw materials and used in the production of new products; excluding the use of these materials as a fuel substitute or for energy production.” One of the recommended actions of this
State Guide Plan 171 Preliminary Draft: September 2014
2 - 3
Rhode Island’s current annual solid
waste generation, including
recycling, is estimated to be
approximately 1.5 million tons per
year, with the majority being refuse.
plan will be to harmonize, standardize, and make consistent in statute more contemporary definitions of solid waste and recycling in Rhode Island.
Where Does Our Solid Waste Go? Where Could It Go?
In RI, the majority of solid waste is processed or disposed by RIRRC at the Central Landfill in the Town of Johnston. Significant waste materials are recycled, composted, or transferred to nearby out-of-state waste to energy (WTE) facilities operated by private firms. The amount of solid waste generated in RI peaked between 2005 and 2007, dropping significantly after the economic recession in 2008. Currently, forty-five percent of our solid waste is from municipal and fifty-five percent is from commercial sources. The next largest class of RI solid waste is C&DD, which represents more
than 200,000 tons of material per year. While some C&DD is managed through municipal transfer stations, the large majority is generated, collected, and managed by the commercial sector. In addition, there are significant quantities of soils, sludge, and ash that are disposed at the Central Landfill, much of which is used beneficially in landfill construction and as alternate cover when permissible. Table 1, Rhode Island Solid Waste Materials Managed (tons), provides estimates of RI solid waste by sector responsible for collection, type of management, and broken out according to whether it is managed at RIRRC or not.
These estimates are primarily based on scale data of waste disposed at RIRRC combined with data on material composition by source of refuse from USEPA publications (US Environmental Protection Agency, 2013). However, more precise estimates will be needed for future facility planning, and those estimates must be based on understanding the detailed composition of materials in the RI waste stream. RIRRC will conduct a waste characterization study which is a thorough sampling and analysis of the RI solid waste stream, and expect the results to be available in late 2016.
State Guide Plan 171 Preliminary Draft: September 2014
2 - 4
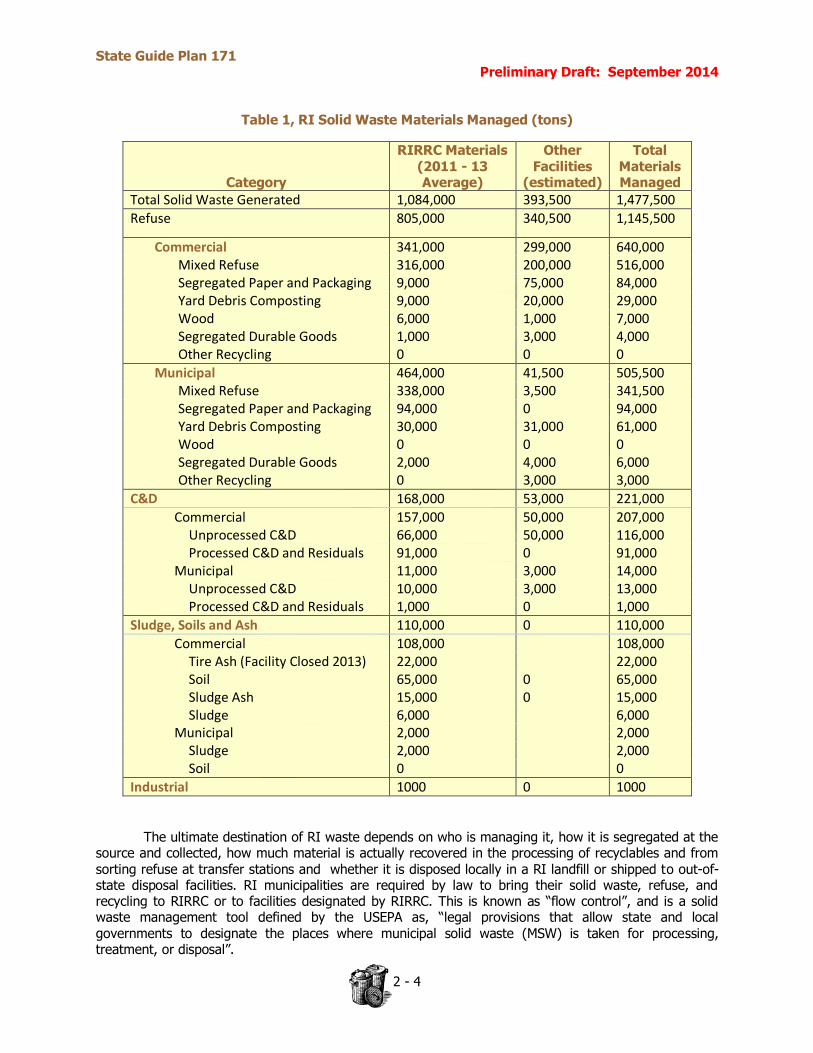
Table 1, RI Solid Waste Materials Managed (tons)
Category
RIRRC Materials (2011 - 13 Average)
Other Facilities
(estimated)
Total Materials Managed
Total Solid Waste Generated 1,084,000 393,500 1,477,500
Refuse 805,000 340,500 1,145,500
Commercial 341,000 299,000 640,000
Mixed Refuse 316,000 200,000 516,000
Segregated Paper and Packaging 9,000 75,000 84,000
Yard Debris Composting 9,000 20,000 29,000
Wood 6,000 1,000 7,000
Segregated Durable Goods 1,000 3,000 4,000
Other Recycling 0 0 0
Municipal 464,000 41,500 505,500
Mixed Refuse 338,000 3,500 341,500
Segregated Paper and Packaging 94,000 0 94,000
Yard Debris Composting 30,000 31,000 61,000
Wood 0 0 0
Segregated Durable Goods 2,000 4,000 6,000
Other Recycling 0 3,000 3,000
C&D 168,000 53,000 221,000
Commercial 157,000 50,000 207,000
Unprocessed C&D 66,000 50,000 116,000
Processed C&D and Residuals 91,000 0 91,000
Municipal 11,000 3,000 14,000
Unprocessed C&D 10,000 3,000 13,000
Processed C&D and Residuals 1,000 0 1,000
Sludge, Soils and Ash 110,000 0 110,000
Commercial 108,000 108,000
Tire Ash (Facility Closed 2013) 22,000 22,000
Soil 65,000 0 65,000
Sludge Ash 15,000 0 15,000
Sludge 6,000 6,000
Municipal 2,000 2,000
Sludge 2,000 2,000
Soil 0 0
Industrial 1000 0 1000
The ultimate destination of RI waste depends on who is managing it, how it is segregated at the
source and collected, how much material is actually recovered in the processing of recyclables and from
sorting refuse at transfer stations and whether it is disposed locally in a RI landfill or shipped to out-of-state disposal facilities. RI municipalities are required by law to bring their solid waste, refuse, and recycling to RIRRC or to facilities designated by RIRRC. This is known as “flow control”, and is a solid waste management tool defined by the USEPA as, “legal provisions that allow state and local governments to designate the places where municipal solid waste (MSW) is taken for processing, treatment, or disposal”.
State Guide Plan 171 Preliminary Draft: September 2014
2 - 5
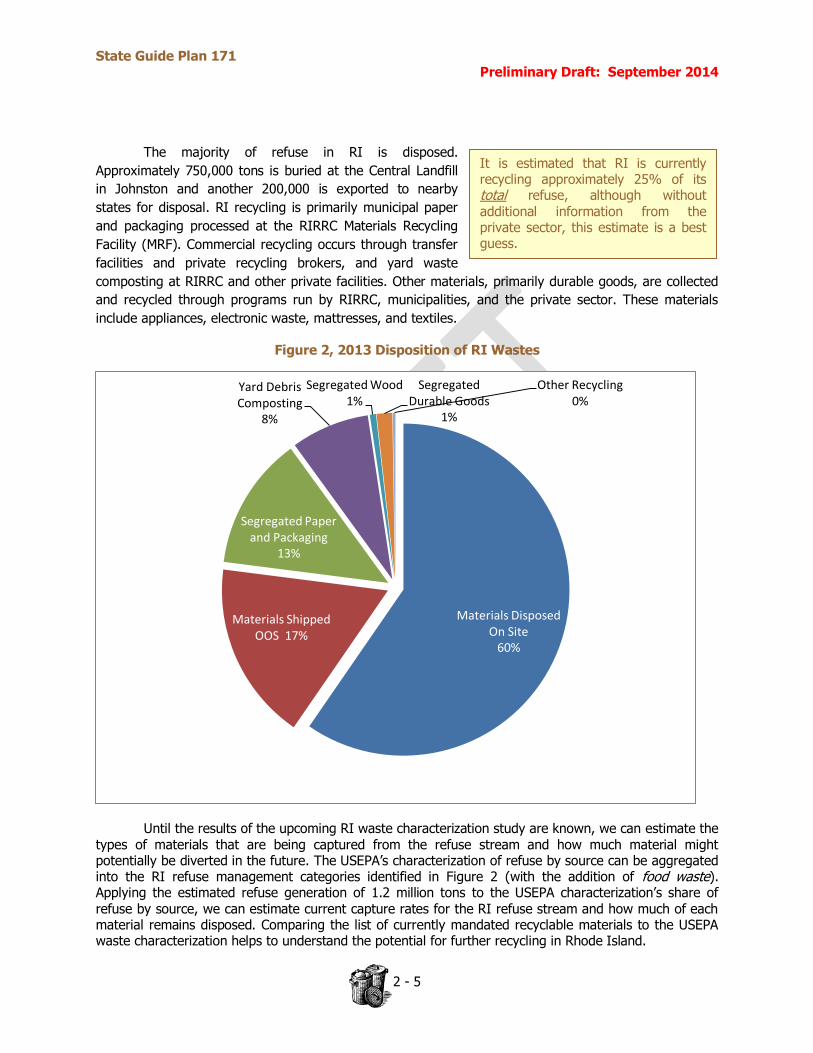
It is estimated that RI is currently recycling approximately 25% of its total refuse, although without additional information from the private sector, this estimate is a best guess.
The majority of refuse in RI is disposed.
Approximately 750,000 tons is buried at the Central Landfill
in Johnston and another 200,000 is exported to nearby
states for disposal. RI recycling is primarily municipal paper
and packaging processed at the RIRRC Materials Recycling
Facility (MRF). Commercial recycling occurs through transfer
facilities and private recycling brokers, and yard waste
composting at RIRRC and other private facilities. Other materials, primarily durable goods, are collected
and recycled through programs run by RIRRC, municipalities, and the private sector. These materials
include appliances, electronic waste, mattresses, and textiles.
Figure 2, 2013 Disposition of RI Wastes
Until the results of the upcoming RI waste characterization study are known, we can estimate the types of materials that are being captured from the refuse stream and how much material might potentially be diverted in the future. The USEPA’s characterization of refuse by source can be aggregated into the RI refuse management categories identified in Figure 2 (with the addition of food waste). Applying the estimated refuse generation of 1.2 million tons to the USEPA characterization’s share of refuse by source, we can estimate current capture rates for the RI refuse stream and how much of each material remains disposed. Comparing the list of currently mandated recyclable materials to the USEPA waste characterization helps to understand the potential for further recycling in Rhode Island.
Materials Disposed On Site
60%
Materials Shipped OOS 17%
Segregated Paper and Packaging
13%
Yard Debris Composting
8%
Segregated Wood 1%
Segregated Durable Goods
1%
Other Recycling 0%
State Guide Plan 171 Preliminary Draft: September 2014
2 - 6
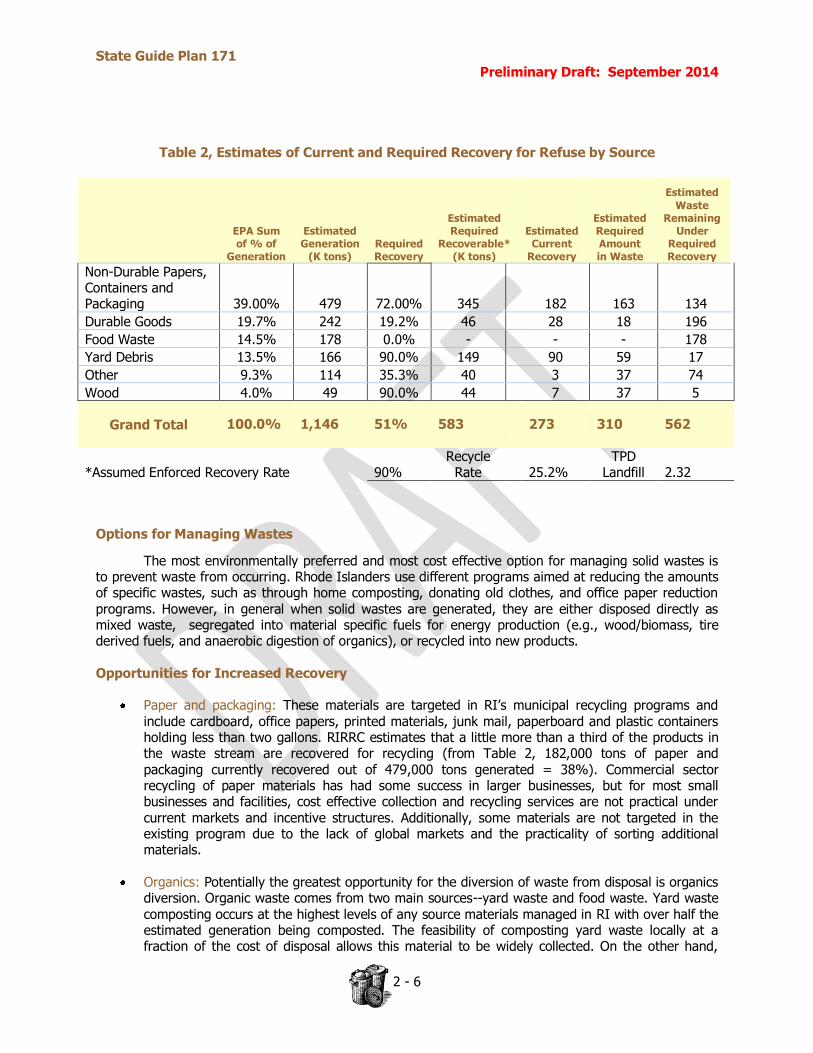
Table 2, Estimates of Current and Required Recovery for Refuse by Source
EPA Sum of % of
Generation
Estimated Generation
(K tons) Required Recovery
Estimated Required
Recoverable* (K tons)
Estimated Current
Recovery
Estimated Required Amount in Waste
Estimated
Waste Remaining
Under Required Recovery
Non-Durable Papers, Containers and Packaging 39.00% 479 72.00% 345 182 163 134
Durable Goods 19.7% 242 19.2% 46 28 18 196
Food Waste 14.5% 178 0.0% - - - 178
Yard Debris 13.5% 166 90.0% 149 90 59 17
Other 9.3% 114 35.3% 40 3 37 74
Wood 4.0% 49 90.0% 44 7 37 5
Grand Total 100.0% 1,146 51% 583 273 310 562
*Assumed Enforced Recovery Rate 90% Recycle
Rate 25.2%
TPD Landfill 2.32
Options for Managing Wastes
The most environmentally preferred and most cost effective option for managing solid wastes is to prevent waste from occurring. Rhode Islanders use different programs aimed at reducing the amounts of specific wastes, such as through home composting, donating old clothes, and office paper reduction programs. However, in general when solid wastes are generated, they are either disposed directly as mixed waste, segregated into material specific fuels for energy production (e.g., wood/biomass, tire derived fuels, and anaerobic digestion of organics), or recycled into new products.
Opportunities for Increased Recovery
Paper and packaging: These materials are targeted in RI’s municipal recycling programs and include cardboard, office papers, printed materials, junk mail, paperboard and plastic containers holding less than two gallons. RIRRC estimates that a little more than a third of the products in the waste stream are recovered for recycling (from Table 2, 182,000 tons of paper and
packaging currently recovered out of 479,000 tons generated = 38%). Commercial sector recycling of paper materials has had some success in larger businesses, but for most small businesses and facilities, cost effective collection and recycling services are not practical under current markets and incentive structures. Additionally, some materials are not targeted in the existing program due to the lack of global markets and the practicality of sorting additional materials.
Organics: Potentially the greatest opportunity for the diversion of waste from disposal is organics diversion. Organic waste comes from two main sources--yard waste and food waste. Yard waste composting occurs at the highest levels of any source materials managed in RI with over half the estimated generation being composted. The feasibility of composting yard waste locally at a fraction of the cost of disposal allows this material to be widely collected. On the other hand,

State Guide Plan 171 Preliminary Draft: September 2014
2 - 7
Rhode Island currently generates
over 200,000 tons of C&DD
annually.
commercial collection and processing of segregated food wastes is practically non-existent in RI. Current food waste diversion is occurring in the form of home composting, a few instances of
local neighborhood composting, mechanical digesting of commercial food waste, and the use of food waste as livestock feed. Current DEM regulations governing composting food wastes make it impractical to invest in on a large scale at the municipal level. The DEM has developed draft regulations to incorporate small scale composting operations into the Composting Regulations. The Regulations should be finalized by the end of 2014.
Durable goods: Approximately 20% of refuse by source, durable goods offer another opportunity
for diversion. Traditional recycling of durable goods includes large metal appliances as scrap, and until recently, the culling of tires for reuse as a tire-derived boiler fuel. Recent efforts to recycle durable goods have targeted electronic wastes and mattresses through extended producer responsibility (EPR) programs. Nonetheless, current capture rates for durable goods remain low.
Wood: Segregated wood products are primarily pallets, clean construction debris, stumps, and
large green waste. Segregated clean wood and wood chips managed by RIRRC are ground and used on site to stabilize landfill roads and for related site work. The use of clean wood as mulch or erosion control is the primary opportunity for reuse. The most likely opportunity for diversion of wood wastes from landfilling is to thermal biomass conversion as a boiler fuel.
“Other” category: The items in this category are primarily non-durable goods and other organics,
which include and are not limited to textiles, used motor oil and filters, and household hazardous waste (HHW). While there are opportunities to capture and recycle items in this category, its limited share of total refuse and the diverse nature of items covered make gains hard to achieve.
While not included in the refuse portion of waste, C&DD, sludge, soils, and ash wastes need to be
part of the discussion of management options. In practice, these other classes of solid waste are often managed in the same facilities as refuse, and may be used in a beneficial manner in landfills.
Construction & Demolition Debris (C&DD)
The C&DD waste stream offers significant opportunity for diversion from landfill disposal. Many materials in C&DD are recyclable: metal, cardboard, roofing
shingles, siding, and clean wallboard. Over the last decade in Rhode Island the face of C&DD processing has changed significantly. Historically, there were a handful of C&DD processing operations in RI serving the regional market. These facilities recovered the marketable components of the C&DD waste stream. What remained was buried in the landfill as waste with the screenings used beneficially as alternate daily cover. Just prior to 2000, RIRRC received approval to use ground C&DD debris as an alternate daily cover material for the landfill and entered the C&DD processing market.
While traditional processors significantly reduced the volume of the C&DD prior to disposal,
RIRRC’s process removed only metals, refuse, and other non-grindable components. Unable to compete with RIRRC’s vertically integrated processing with the use of material in the landfill, many of the other C&DD processors ceased operation. Others have closed due to local opposition and poor economic conditions. More recently, in 2012, the use of C&DD materials as landfill cover was prohibited by statute in response to odor issues at the Central Landfill, resulting in RIRRC ceasing operation of its C&DD processing operations. All C&DD currently received at RIRRC is buried in the landfill as waste after the metals and cardboard are removed. As of October 2013 there are two C&DD facilities in operation in RI; the J.R. Vinagro Corporation facility and the Railside Environmental Services, LLC (RES) facility located in East Providence. RES is a registered facility and can accept up to 50 tons per day (tpd) of C&DD. The
State Guide Plan 171 Preliminary Draft: September 2014
2 - 8
J.R. Vinagro facility is permitted to handle 2,000 tpd of C&DD and 500 tpd of refuse. Much of the C&DD handled at this facility is believed to be from out of state.
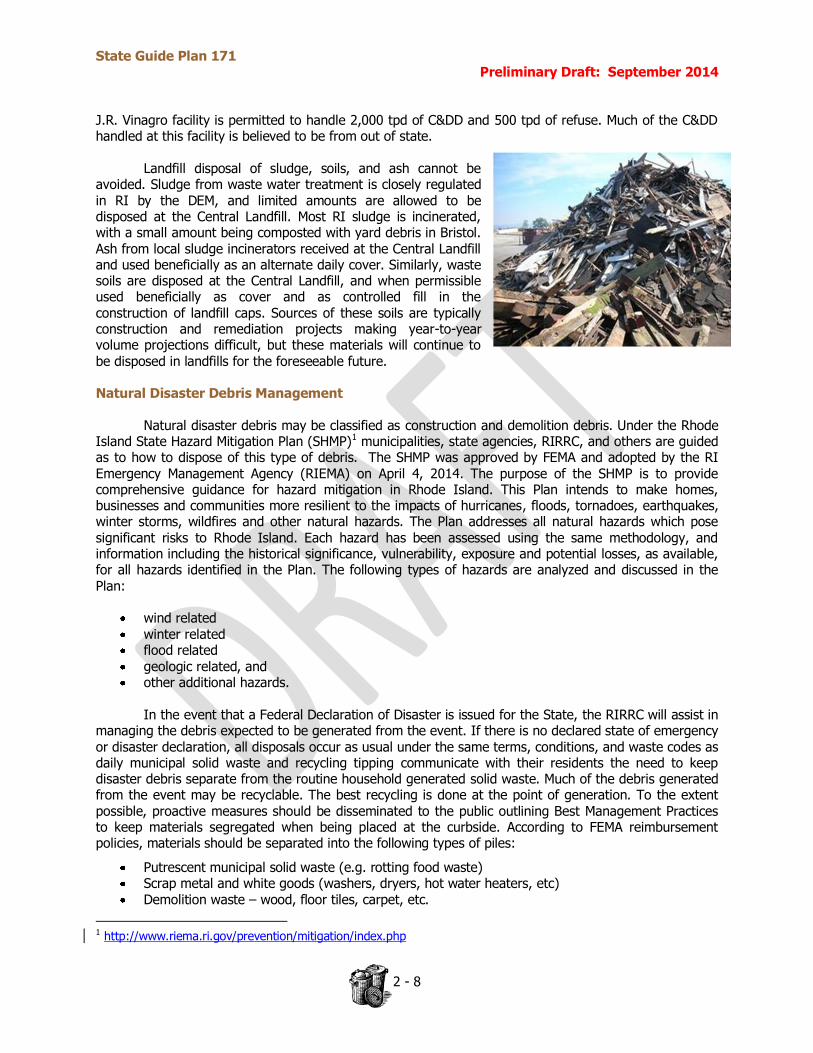
Landfill disposal of sludge, soils, and ash cannot be
avoided. Sludge from waste water treatment is closely regulated in RI by the DEM, and limited amounts are allowed to be disposed at the Central Landfill. Most RI sludge is incinerated, with a small amount being composted with yard debris in Bristol. Ash from local sludge incinerators received at the Central Landfill and used beneficially as an alternate daily cover. Similarly, waste soils are disposed at the Central Landfill, and when permissible used beneficially as cover and as controlled fill in the construction of landfill caps. Sources of these soils are typically construction and remediation projects making year-to-year volume projections difficult, but these materials will continue to
be disposed in landfills for the foreseeable future.
Natural Disaster Debris Management Natural disaster debris may be classified as construction and demolition debris. Under the Rhode Island State Hazard Mitigation Plan (SHMP)1 municipalities, state agencies, RIRRC, and others are guided as to how to dispose of this type of debris. The SHMP was approved by FEMA and adopted by the RI Emergency Management Agency (RIEMA) on April 4, 2014. The purpose of the SHMP is to provide comprehensive guidance for hazard mitigation in Rhode Island. This Plan intends to make homes, businesses and communities more resilient to the impacts of hurricanes, floods, tornadoes, earthquakes, winter storms, wildfires and other natural hazards. The Plan addresses all natural hazards which pose significant risks to Rhode Island. Each hazard has been assessed using the same methodology, and information including the historical significance, vulnerability, exposure and potential losses, as available, for all hazards identified in the Plan. The following types of hazards are analyzed and discussed in the Plan:
wind related winter related flood related
geologic related, and other additional hazards.
In the event that a Federal Declaration of Disaster is issued for the State, the RIRRC will assist in managing the debris expected to be generated from the event. If there is no declared state of emergency or disaster declaration, all disposals occur as usual under the same terms, conditions, and waste codes as daily municipal solid waste and recycling tipping communicate with their residents the need to keep disaster debris separate from the routine household generated solid waste. Much of the debris generated from the event may be recyclable. The best recycling is done at the point of generation. To the extent possible, proactive measures should be disseminated to the public outlining Best Management Practices to keep materials segregated when being placed at the curbside. According to FEMA reimbursement policies, materials should be separated into the following types of piles:
Putrescent municipal solid waste (e.g. rotting food waste) Scrap metal and white goods (washers, dryers, hot water heaters, etc) Demolition waste – wood, floor tiles, carpet, etc.
1 http://www.riema.ri.gov/prevention/mitigation/index.php
State Guide Plan 171 Preliminary Draft: September 2014
2 - 9
It is estimated that 50% of
Rhode Island refuse currently
mandated to be recycled is
recycled and composted.
Household Hazardous Waste – such as pesticides, fertilizers, batteries, paint, cleaning agents, and other chemicals. If a substance cannot be identified, it should be assumed to be HHW.
Leaf and Yard waste – leaves, plants, twigs, branches smaller than 2” in diameter Green waste –trees, limbs, shrubs (clean wood is not considered green waste or leaf and yard
waste). As the disaster debris arrives at the RIRRC facility, if self-identified as disaster debris, it is weighed in under a disaster debris waste code and directed to the appropriate receiving area for processing. Mixed waste is sent to the landfill for disposal. During debris operations, RIRRC maintains the same rules and operational practices as prior to the disaster. Loads tipped under the Disaster Debris waste codes do not count toward municipal solid waste tonnage caps or recycling rates.
What is the realistically recoverable portion of solid waste and what will it take?
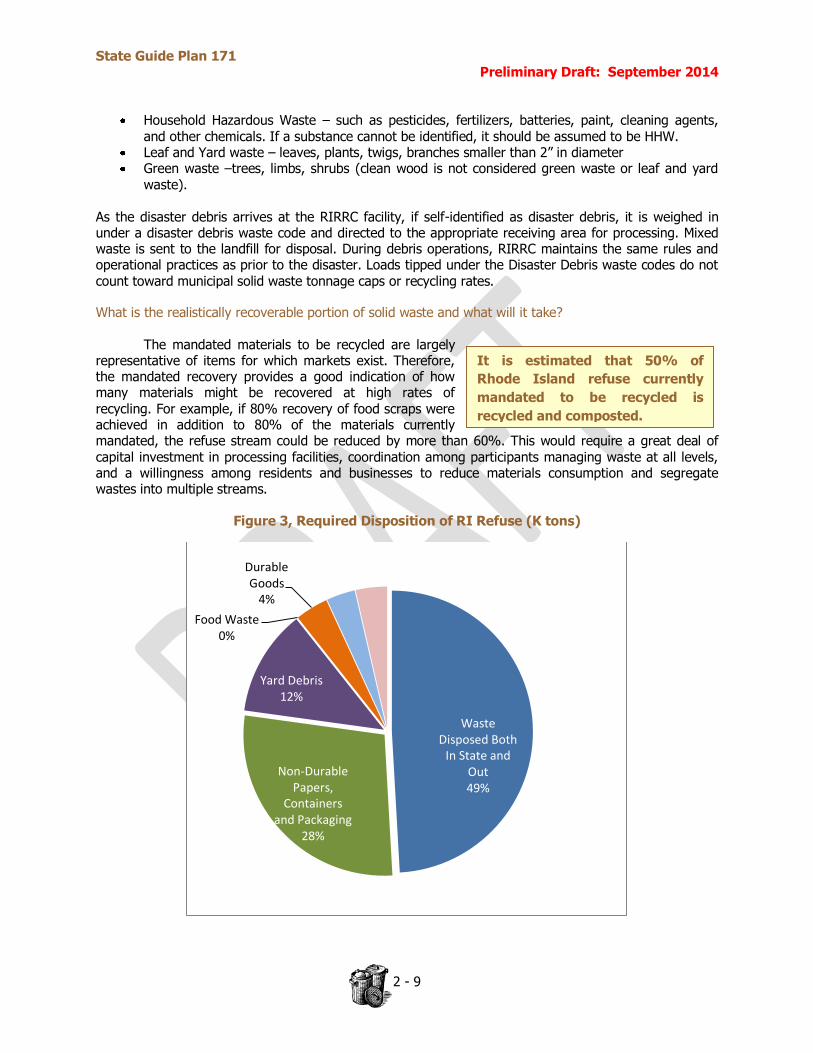
The mandated materials to be recycled are largely representative of items for which markets exist. Therefore, the mandated recovery provides a good indication of how many materials might be recovered at high rates of recycling. For example, if 80% recovery of food scraps were achieved in addition to 80% of the materials currently mandated, the refuse stream could be reduced by more than 60%. This would require a great deal of
capital investment in processing facilities, coordination among participants managing waste at all levels, and a willingness among residents and businesses to reduce materials consumption and segregate wastes into multiple streams.
Figure 3, Required Disposition of RI Refuse (K tons)
Waste Disposed Both
In State and Out 49%
Non-Durable Papers,
Containers and Packaging
28%
Yard Debris 12%
Food Waste 0%
Durable Goods
4%
Other 3%
Wood 4%
State Guide Plan 171 Preliminary Draft: September 2014
2 - 10
Paper & Packaging: Capturing 72% of paper and packaging will require a significant increase in collection of these materials, and will use the entire 150,000 ton two-shift capacity of the RIRRC MRF. Commercial
sector recycling of paper and packaging will have to expand tremendously, and additional sorting capacity for commercial materials will have to be developed. Markets will have to be fostered for the hard to process plastics, glass, and bulky goods. Yard waste: Yard waste diversion has been largely successful in RI but there still needs significant improvement to reach 80% recovery. Municipal collection programs will need to expand in underserved municipalities, and additional processing capacity will need to be permitted and developed. Preferably, yard waste will be composted locally, either at home or at neighborhood facilities, to minimize transportation and distribution costs. Food waste: Capturing 80% of RI food waste presents the biggest opportunity and perhaps the greatest challenge. Achieving large scale diversion of food waste requires the permitting and development of significant processing capacity. Comprehensive collection of food waste from both residents and
businesses will need to be implemented, changing the way solid wastes are commonly managed at the source. Durable and non-durable goods: Collection and recycling of durable and non-durable goods will also need to expand. Some of these materials can be targeted through continued expansion of extended producer responsibility programs, while others such as textiles can be improved through market development and consumer education. C&DD materials: The commercial sector is poised to increase recovery of C&DD materials for recycling and for disposal in WTE facilities. In order to increase actual recycling, C&DD market development of outlets for some materials, such as clean wallboard and roofing shingles, will need to improve. See also the discussion of markets later in this Section.
A final consideration is that the diversion of this magnitude of solid waste from land disposal will
involve some form of WTE. This may be refuse incineration, refuse derived fuel, biomass conversion of wood waste, or the anaerobic digestion of organics, and may be operated, in RI or in neighboring states.
Who Does What?
The current arrangement for solid waste management in Rhode Island is the result
of major changes over the past 30 years that expanded the role of government and centralized functions at the State level. In 1975, the State assumed responsibility for licensing solid waste management facilities. This is in contrast to most other states. Responsibility for solid waste management in Rhode Island is divided among several agencies, but principally sits with the RIRRC and DEM. More detailed information on each agency can be found at the website maintained by each agency. The major government responsibilities for solid waste management in RI are regulation, planning, programs, facility siting and the provision of facilities, financing, technical assistance, and public education. In 1986, municipalities were authorized by state law to license local collectors, haulers, and operators of transfer stations [RIGL §23-18.9-1 (b) (1)]. Under the 1968 Refuse Disposal Act cities and towns were required to regulate collection, hauling, and disposal. The 1986 legislation established requirements for the adoption of local regulations for:
the fair allocation of the Municipal Tipping Fee among privately contracted collectors of municipal refuse [RIGL §23-18.9-1(b)(3)]; and
the separation of solid waste into recyclable and non-recyclable components [RIGL §23-18.9-
1(b)(4)].
State Guide Plan 171 Preliminary Draft: September 2014
2 - 11
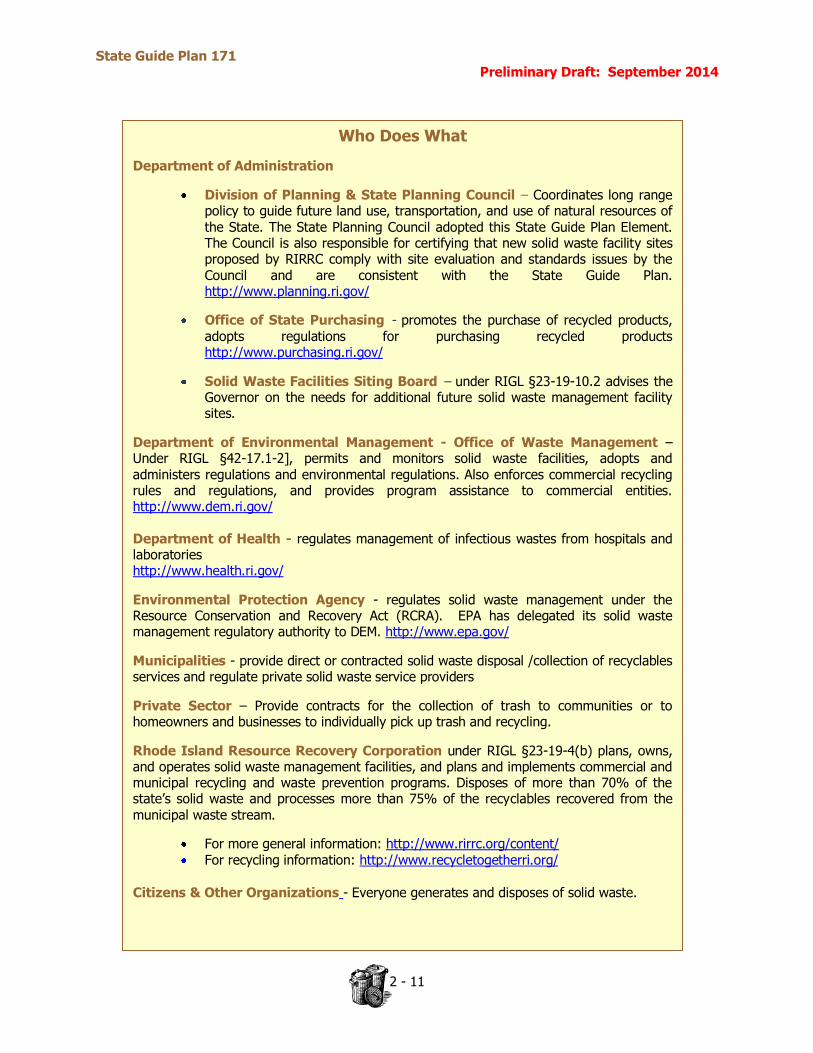
Who Does What
Department of Administration
Division of Planning & State Planning Council – Coordinates long range policy to guide future land use, transportation, and use of natural resources of the State. The State Planning Council adopted this State Guide Plan Element. The Council is also responsible for certifying that new solid waste facility sites proposed by RIRRC comply with site evaluation and standards issues by the Council and are consistent with the State Guide Plan. http://www.planning.ri.gov/
Office of State Purchasing - promotes the purchase of recycled products, adopts regulations for purchasing recycled products http://www.purchasing.ri.gov/
Solid Waste Facilities Siting Board – under RIGL §23-19-10.2 advises the Governor on the needs for additional future solid waste management facility sites.
Department of Environmental Management - Office of Waste Management – Under RIGL §42-17.1-2], permits and monitors solid waste facilities, adopts and administers regulations and environmental regulations. Also enforces commercial recycling rules and regulations, and provides program assistance to commercial entities. http://www.dem.ri.gov/ Department of Health - regulates management of infectious wastes from hospitals and laboratories http://www.health.ri.gov/
Environmental Protection Agency - regulates solid waste management under the Resource Conservation and Recovery Act (RCRA). EPA has delegated its solid waste management regulatory authority to DEM. http://www.epa.gov/
Municipalities - provide direct or contracted solid waste disposal /collection of recyclables services and regulate private solid waste service providers
Private Sector – Provide contracts for the collection of trash to communities or to homeowners and businesses to individually pick up trash and recycling.
Rhode Island Resource Recovery Corporation under RIGL §23-19-4(b) plans, owns, and operates solid waste management facilities, and plans and implements commercial and municipal recycling and waste prevention programs. Disposes of more than 70% of the state’s solid waste and processes more than 75% of the recyclables recovered from the municipal waste stream.
For more general information: http://www.rirrc.org/content/ For recycling information: http://www.recycletogetherri.org/
Citizens & Other Organizations - Everyone generates and disposes of solid waste.
State Guide Plan 171 Preliminary Draft: September 2014
2 - 12
State law requires municipalities to adopt ordinances to mandate source separation and recycling programs and allows municipalities to design and implement programs to fit local circumstances. Conditions vary greatly between rural, suburban, and urban communities.
Providing for Recycling and Disposal
Most government services in RI are provided either at the state or municipal level. Regional agencies, counties, and special districts have very limited roles of little significance for solid waste management. Rhode Island’s 39 municipalities range widely in character from densely populated, central cites to rural, largely wooded areas. These municipalities also vary widely in their capacity to plan and deliver services. In solid waste management planning, a significant distinction can be made between municipalities that have full-time and those with part-time governments.
Municipal Services The historical responsibility for solid waste disposal began to transfer from the municipalities to the State in 1974, accelerating through the 1980s as most municipal landfills closed. As of 2014, only the Town of Tiverton
continued to operate a municipal landfill. In 1992, the municipal tipping fee was set by Law at $32.00 per ton while the average commercial tipping fee has averaged $50.00 to $60.00 per ton. A 1986 amendment to the solid waste statutes further limited municipal responsibility for disposal by excluding those wastes not acceptable at an RIRRC facility, as well as hazardous wastes. Collection responsibilities of municipalities were broadened, to cover separate collection of recyclables. Municipalities are required to deliver all recyclables recovered from their solid waste to a facility determined by RIRRC. To meet this responsibility, most municipalities provide collection directly or by contracting with a hauler. In some communities, individual residents hire private haulers to collect their solid waste which may or may not be sent to RIRRC. As an incentive to encourage recycling and diversion, the General Assembly, in 1986, enacted a law saying that the discounted municipal tipping fee shall apply only to the solid waste tonnage disposed by each municipality which is less than or equal to an annual solid waste tonnage Cap established by RIRRC. All MSW in excess of a municipality’s Cap is disposed of at a CSW tipping fee, which is substantially higher than the municipal tipping fee. Tiverton Landfill - The Tiverton municipal landfill (still in operation at the time that this Plan was adopted) is the only other solid waste disposal facility in RI. Tiverton is the only municipality specifically exempted from the requirement to deliver all refuse to the Central Landfill because the Town has an active landfill. However, this landfill serves Tiverton residents exclusively and disposes of about 3,500 tons per year. It is expected that the Tiverton landfill will be at capacity by 2018 per the Tiverton DPW. When the Tiverton landfill closes, the Town will be required to send its refuse to RIRRC designated facilities. Municipal Compost operations - Ten municipalities operate yard waste composting facilities, accounting for approximately 20% of the State’s permitted composting capacity. Local processing of this waste stream reduces transportation costs. Municipal Recycling Centers - Municipally-operated recycling centers are few; however those that do exist are highly used. The cities of Warwick and Woonsocket provide the greatest level of service to their residents at their recycling centers.

State Guide Plan 171 Preliminary Draft: September 2014
2 - 13
Existing Pay as You Throw Programs (PAYT)
Charlestown Hopkinton New Shoreham North Kingstown Richmond South Kingstown Narragansett West Greenwich Partial and/or hybrid PAYT Programs
Tiverton
Central Falls North Smithfield West Warwick
Westerly
Financing
Financial assistance, both direct and indirect, by RIRRC for municipal solid waste management activities has been extensive. Municipalities tip their recycled materials free of charge at the MRF and share 50% of profits from recycling sales at the end of each fiscal year. RIRRC financed the first three years of each municipality's recycling program. RIRRC also provided each municipality, free of charge, with new blue and green recycling bins at the start of the Maximum Recycling Program. In 2001, RIRRC began providing free household hazardous waste disposal services to residents.
In 2004, the Corporation began receiving and composting leaf and yard waste from municipalities free of charge. In addition, RIRRC has made available annual grants (totaling more than $100,000 dollars over three years) to municipalities. RIRRC has provided a wide range of recycling and waste prevention-related research and innovative technology and program grants totaling more than one million dollars to municipalities. Municipal solid waste costs are generally financed by local general revenues, largely the property tax. Thirteen municipalities already have implemented some sort of a user-fee or Pay as You Throw (PAYT) program, an increase of 5 communities since the last Plan in 2007.
Table 3, Permitted Composting Facility Capacities
Composting Facilities - Solid Waste Operator
Type yd3/year Tons/Year
Barrington Compost Facility Municipal 25,000 6,250
Bristol Compost Facility Municipal 4,000 1,000
Burrillville Compost Facility Municipal 3,500 875
Charlestown Landfill and Compost Facility Municipal 4,000 1,000
Donigian LLC Compost Facility Private 15 4
East Providence Composting Facility Municipal 30,000 7,500
Jamestown T.S. and Composting Fac. Municipal 600 150
North Kingstown T.S. and Compost Facility Municipal 8,000 2,000
Pascale Landscaping Private 2,000 500
Pawtucket Compost Facility Municipal 5,000 1,250
RIRRC (Central Landfill) Compost Facility RIRRC 304,000 76,000
Richmond Sand & Stone Compost Facility Private 150,000 37,500 Site-Ready Materials and Recycling Compost Facility Private 10,000 2,500
Smithfield Peat Compost Facility Private 100,000 25,000
Swan Point Cemetery Compost Facility Private 3,000 750
Warren Compost Facility Municipal 3,700 925
Warwick Compost Facility and MRF Municipal 52,000 13,000
Total 704,815 176,204
State Guide Plan 171 Preliminary Draft: September 2014
2 - 14
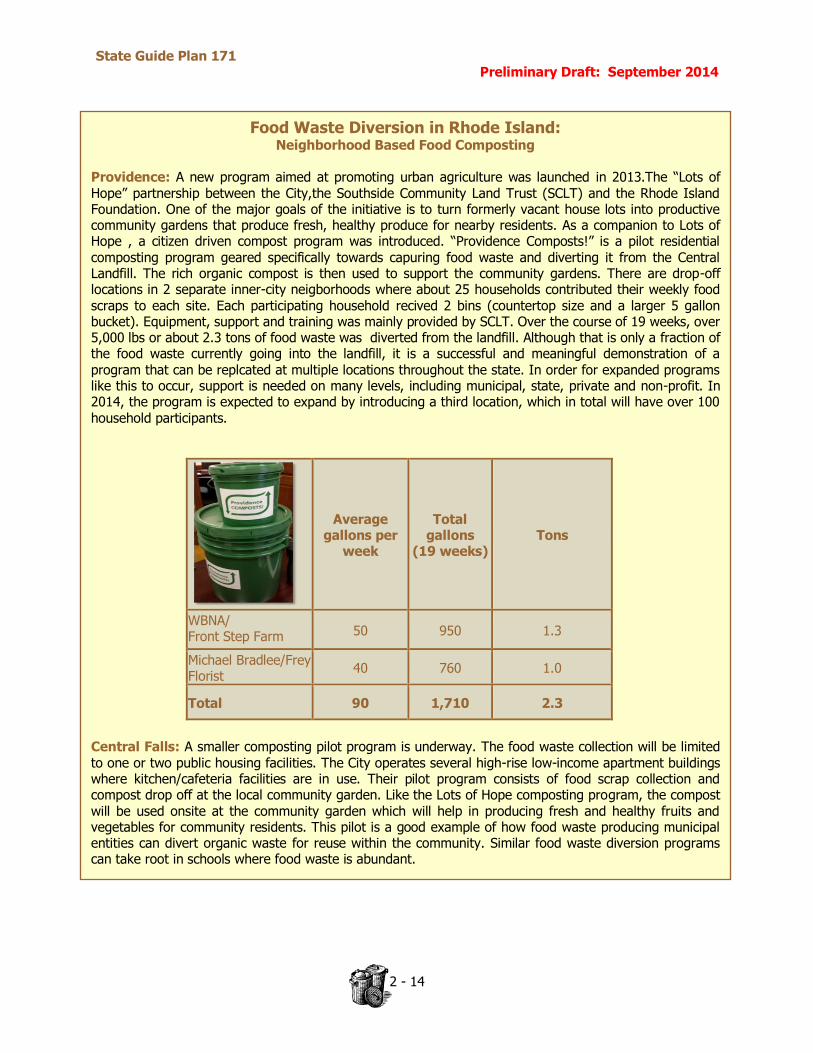
Food Waste Diversion in Rhode Island: Neighborhood Based Food Composting
Providence: A new program aimed at promoting urban agriculture was launched in 2013.The “Lots of Hope” partnership between the City,the Southside Community Land Trust (SCLT) and the Rhode Island Foundation. One of the major goals of the initiative is to turn formerly vacant house lots into productive community gardens that produce fresh, healthy produce for nearby residents. As a companion to Lots of Hope , a citizen driven compost program was introduced. “Providence Composts!” is a pilot residential
composting program geared specifically towards capuring food waste and diverting it from the Central Landfill. The rich organic compost is then used to support the community gardens. There are drop-off locations in 2 separate inner-city neigborhoods where about 25 households contributed their weekly food scraps to each site. Each participating household recived 2 bins (countertop size and a larger 5 gallon bucket). Equipment, support and training was mainly provided by SCLT. Over the course of 19 weeks, over 5,000 lbs or about 2.3 tons of food waste was diverted from the landfill. Although that is only a fraction of the food waste currently going into the landfill, it is a successful and meaningful demonstration of a
program that can be replcated at multiple locations throughout the state. In order for expanded programs like this to occur, support is needed on many levels, including municipal, state, private and non-profit. In 2014, the program is expected to expand by introducing a third location, which in total will have over 100 household participants.
Average gallons per
week
Total gallons
(19 weeks) Tons
WBNA/ Front Step Farm 50 950 1.3
Michael Bradlee/Frey Florist
40 760 1.0
Total 90 1,710 2.3
Central Falls: A smaller composting pilot program is underway. The food waste collection will be limited to one or two public housing facilities. The City operates several high-rise low-income apartment buildings where kitchen/cafeteria facilities are in use. Their pilot program consists of food scrap collection and compost drop off at the local community garden. Like the Lots of Hope composting program, the compost will be used onsite at the community garden which will help in producing fresh and healthy fruits and vegetables for community residents. This pilot is a good example of how food waste producing municipal entities can divert organic waste for reuse within the community. Similar food waste diversion programs can take root in schools where food waste is abundant.
State Guide Plan 171 Preliminary Draft: September 2014
2 - 15
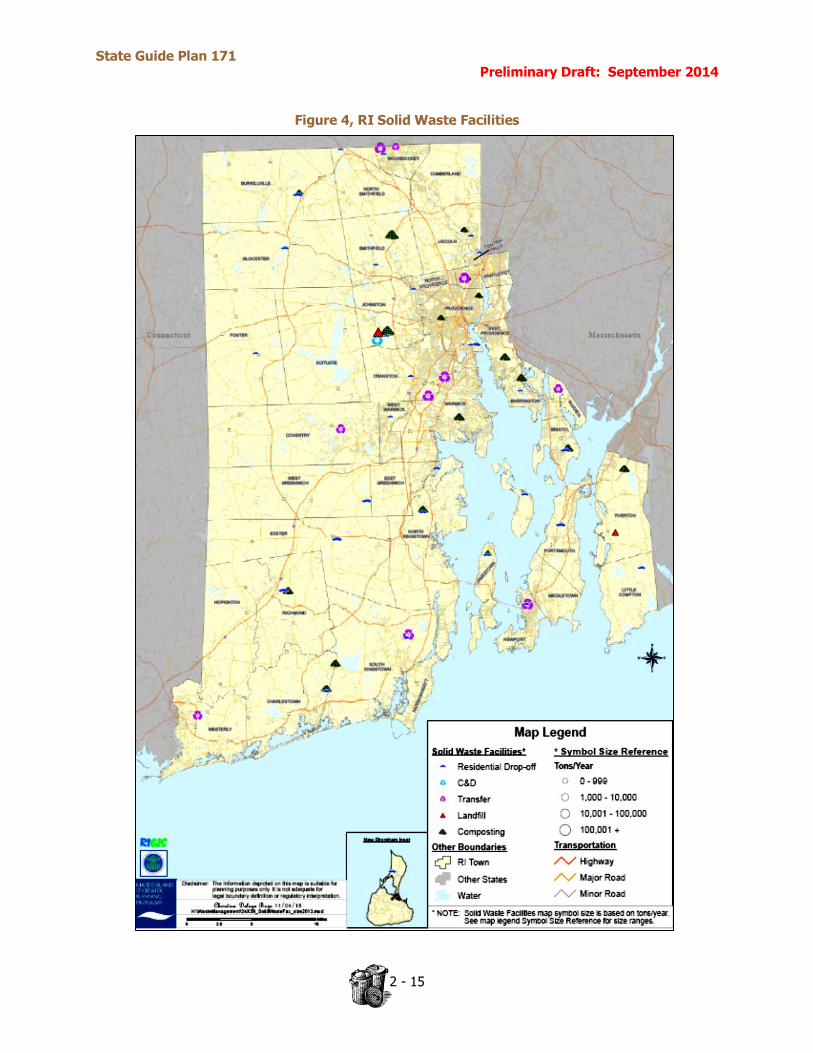
Figure 4, RI Solid Waste Facilities
State Guide Plan 171 Preliminary Draft: September 2014
2 - 16
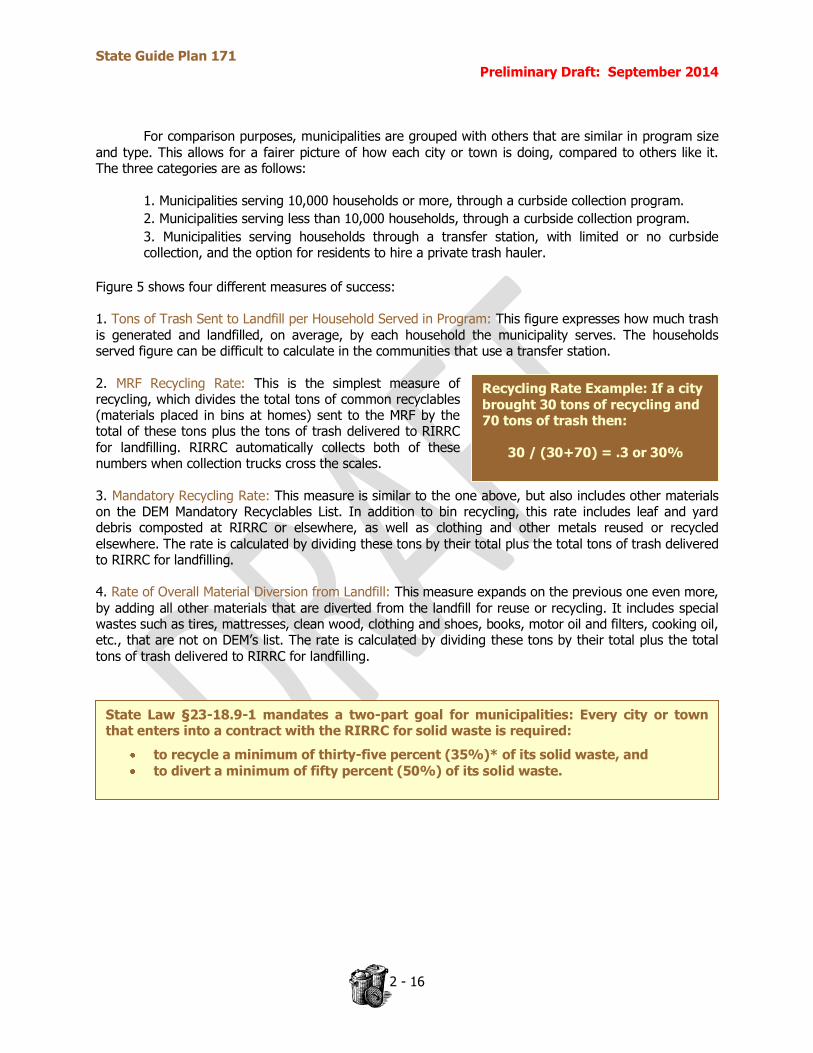
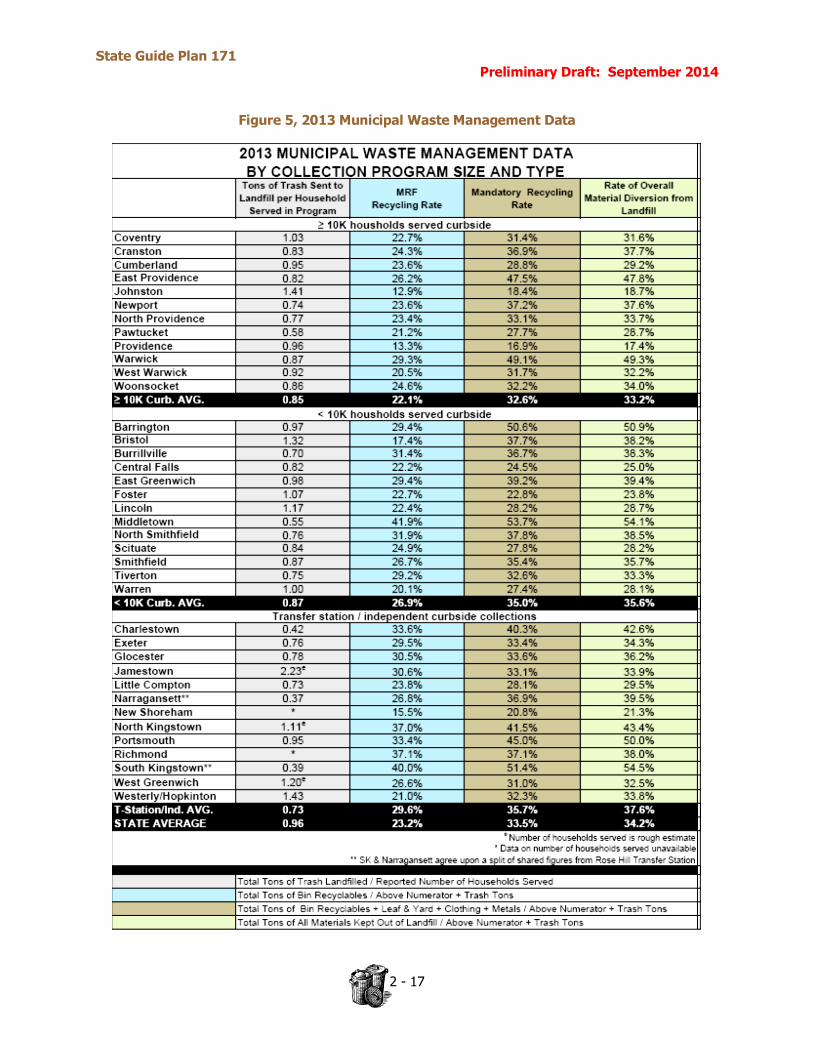
Recycling Rate Example: If a city brought 30 tons of recycling and 70 tons of trash then:
30 / (30+70) = .3 or 30%
State Law §23-18.9-1 mandates a two-part goal for municipalities: Every city or town that enters into a contract with the RIRRC for solid waste is required:
to recycle a minimum of thirty-five percent (35%)* of its solid waste, and
to divert a minimum of fifty percent (50%) of its solid waste.
For comparison purposes, municipalities are grouped with others that are similar in program size
and type. This allows for a fairer picture of how each city or town is doing, compared to others like it. The three categories are as follows:
1. Municipalities serving 10,000 households or more, through a curbside collection program.
2. Municipalities serving less than 10,000 households, through a curbside collection program.
3. Municipalities serving households through a transfer station, with limited or no curbside collection, and the option for residents to hire a private trash hauler.
Figure 5 shows four different measures of success: 1. Tons of Trash Sent to Landfill per Household Served in Program: This figure expresses how much trash is generated and landfilled, on average, by each household the municipality serves. The households served figure can be difficult to calculate in the communities that use a transfer station. 2. MRF Recycling Rate: This is the simplest measure of recycling, which divides the total tons of common recyclables (materials placed in bins at homes) sent to the MRF by the total of these tons plus the tons of trash delivered to RIRRC for landfilling. RIRRC automatically collects both of these numbers when collection trucks cross the scales. 3. Mandatory Recycling Rate: This measure is similar to the one above, but also includes other materials on the DEM Mandatory Recyclables List. In addition to bin recycling, this rate includes leaf and yard debris composted at RIRRC or elsewhere, as well as clothing and other metals reused or recycled elsewhere. The rate is calculated by dividing these tons by their total plus the total tons of trash delivered to RIRRC for landfilling. 4. Rate of Overall Material Diversion from Landfill: This measure expands on the previous one even more, by adding all other materials that are diverted from the landfill for reuse or recycling. It includes special wastes such as tires, mattresses, clean wood, clothing and shoes, books, motor oil and filters, cooking oil, etc., that are not on DEM’s list. The rate is calculated by dividing these tons by their total plus the total tons of trash delivered to RIRRC for landfilling.
State Guide Plan 171 Preliminary Draft: September 2014
2 - 17
Figure 5, 2013 Municipal Waste Management Data
State Guide Plan 171 Preliminary Draft: September 2014
2 - 18
In 2014, only 5 municipalities --
Bristol, Coventry, Lincoln, Warwick,
and West Warwick – collect trash
and/or recycling curbside using their
own staff and equipment.
Town of Johnston
In April 1996, RIRRC and the Town of Johnston ratified a Host Community Agreement. Under the agreement, RIRRC annually pays the Town a base payment of $1.5 million, 3.5 percent of RIRRC’s previous fiscal year’s gross revenues, allows a set amount of additional free tipping for Johnston residents, and methane royalty payments. In the first full year of the agreement, FY 1997, these payments totaled more than $3.2 million and have exceeded $3.2 million annually thereafter due to escalators built into the payments. The Host Community Agreement contains various “good neighbor” provisions whereby the Corporation agrees to provide in-kind services such as road sweeping and litter pickup in the vicinity of the Central Landfill. Perhaps the most important good neighbor issue is to control odors. Private Sector
As governments have assumed more responsibility
over waste management, the role of the private sector has also changed, with most municipal refuse now either collected or transported to the Central Landfill by private haulers under contract to municipalities. Communities in the southern part of the state tend to use transfer station drop-off as the residential option, or leave it to homeowners to hire private haulers. The success of most municipal recycling programs depends not only on the quality of municipal management, but also on the effectiveness and efficiency of the haulers’ operations and the relationship between the haulers and the municipalities that hire them. While municipalities have maintained an operational and/or management role in the field of municipal recycling, there is little operational involvement by state or local government in commercial recycling. Haulers
The hauling industry in Rhode Island has undergone significant transformations over the past 25 years. By 2004, after a period of consolidation during the 1990s, the RI hauling industry was dominated by two large, publicly-owned national firms, Republic Services and Waste Management, Inc. Three other RI haulers (Patriot, Waste Haulers, and Mega/MTG) have grown dramatically since 2006. Together, these five firms (the “major players”) control approximately 75% percent of the commercial solid waste business in the state. There were also roughly 35 small, local privately-owned firms active in RI in 2014. Private haulers recover large volumes of recyclable materials, particularly wood and corrugated cardboard. Some haulers specialize in processing construction and demolition debris and recovering recyclables from the C&DD stream. No private sector firm has owned a landfill in RI in the past 25 years.
The commercial waste hauling industry is segmented into three types of entities: large full service providers, small full commercial service providers, and strictly open top roll-off service. The major players all have some degree of vertical integration into transfer, processing, or disposal markets. They provide all types of collection services but dominate the dumpster front-end loader market. The smaller haulers provide both dumpster and enclosed compactor container services to commercial customers, and may also provide subscription services to residential customers in some locations. These haulers are typically localized and account for 15% of the RI commercial sector waste. The most prevalent service provided by the largest number of commercial solid waste haulers is the open top roll-off. There are about 50 small private commercial accounts that participate in a competitive roll-off container market largely servicing the construction industry. These smaller operators handle about 10% of RI commercial sector solid waste. Finally, special wastes such as sludge, medical wastes, organics, and hazardous wastes are handled by companies that specialize in these materials.
State Guide Plan 171 Preliminary Draft: September 2014
2 - 19
In 2014, almost 460,000 tons, nearly
40%, of Rhode Island’s solid waste
moves through transfer stations;
200,000 tons to out-of-state locations,
and the rest to RIRRC.
Transfer Stations
Ownership of these facilities is a mixture of public and private, with some municipally-owned transfer stations operated by private sector contractors. The majority of RI refuse transfer capacity is concentrated at a few large facilities, primarily operated by private waste haulers. These larger transfer stations receive materials from both municipal and commercial collection vehicles to facilitate the transportation of wastes over longer distances in tractor trailers trucks with hauling capacities in excess of 100 yards.
The rest of the transfer stations are relatively small, operated or owned by municipal governments, and intended to serve residential customers as a drop-off option for small quantities of refuse, recycling and special materials. These smaller facilities are predominantly located in rural
communities that often do not provide curbside collection of household refuse, or in municipalities that provide the drop-off facility as another service to residents.
State Guide Plan 171 Preliminary Draft: September 2014
2 - 20
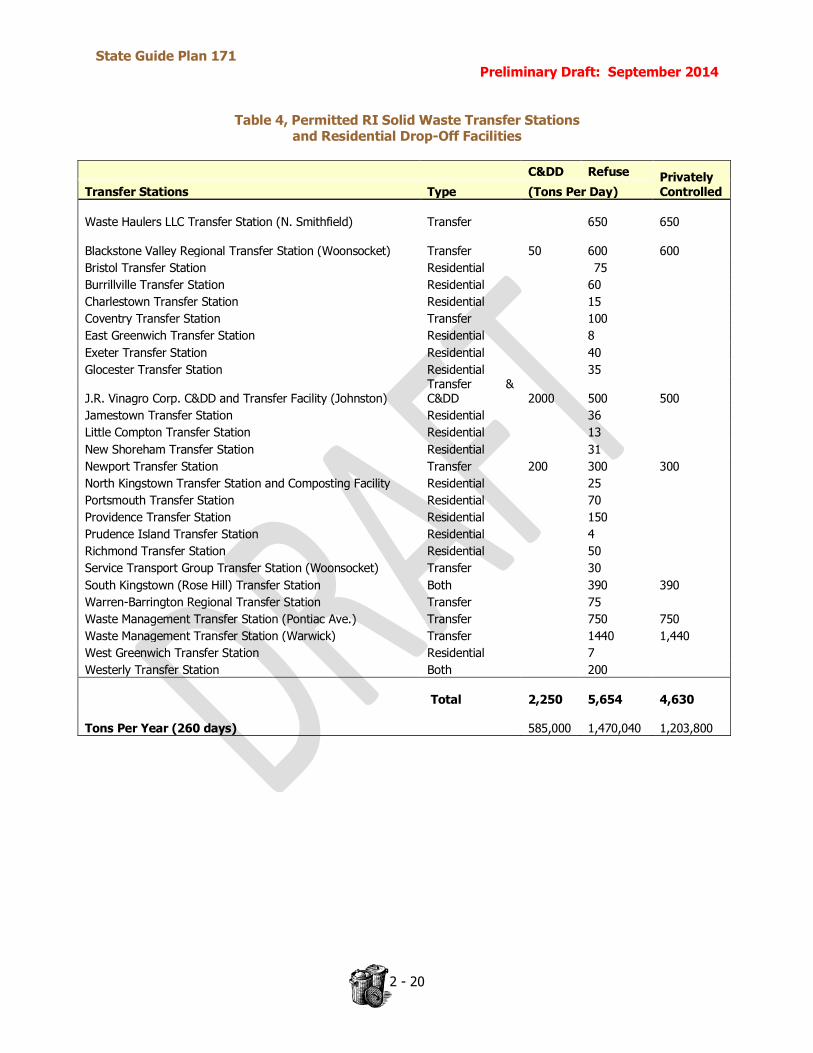
Table 4, Permitted RI Solid Waste Transfer Stations and Residential Drop-Off Facilities
C&DD Refuse Privately Controlled Transfer Stations Type (Tons Per Day)
Waste Haulers LLC Transfer Station (N. Smithfield) Transfer 650 650
Blackstone Valley Regional Transfer Station (Woonsocket) Transfer 50 600 600
Bristol Transfer Station Residential 75
Burrillville Transfer Station Residential 60
Charlestown Transfer Station Residential 15
Coventry Transfer Station Transfer 100
East Greenwich Transfer Station Residential 8
Exeter Transfer Station Residential 40
Glocester Transfer Station Residential 35
J.R. Vinagro Corp. C&DD and Transfer Facility (Johnston) Transfer & C&DD 2000 500 500
Jamestown Transfer Station Residential 36
Little Compton Transfer Station Residential 13
New Shoreham Transfer Station Residential 31
Newport Transfer Station Transfer 200 300 300
North Kingstown Transfer Station and Composting Facility Residential 25
Portsmouth Transfer Station Residential 70
Providence Transfer Station Residential 150
Prudence Island Transfer Station Residential 4
Richmond Transfer Station Residential 50
Service Transport Group Transfer Station (Woonsocket) Transfer 30
South Kingstown (Rose Hill) Transfer Station Both 390 390
Warren-Barrington Regional Transfer Station Transfer 75
Waste Management Transfer Station (Pontiac Ave.) Transfer 750 750
Waste Management Transfer Station (Warwick) Transfer 1440 1,440
West Greenwich Transfer Station Residential 7
Westerly Transfer Station Both 200
Total 2,250
5,654
4,630
Tons Per Year (260 days) 585,000
1,470,040
1,203,800
State Guide Plan 171 Preliminary Draft: September 2014
2 - 21
The question “How do we increase
commercial recycling in RI?” has been
asked, without receiving a satisfactory
answer, for more than a decade.
MAIN STREET PROGRAMS
In 2006, the Town of East Greenwich asked for permission to try a pilot program in their downtown Main Street. They wanted to see if store owners would participate in recycling if the town collected the material in curbside bins. They did, with overwhelming success. Since then, Bristol and Warren followed suit, and in 2010 a state law was passed allowing cities and towns to offer this service to commercial businesses in their community.
Recycling
The question “How do we increase commercial recycling in RI?” has been asked, without receiving a satisfactory answer, for more than a decade. The fact of the matter is that the driving force behind increasing commercial recycling is economics. When it is more advantageous to the business to recycle than to not, the business will find a way to recycle. Without significant increases in regulatory compliance enforcement, the economics of business recycling will rule. Commercial
Commercial generators are made up of businesses
and apartments or condominiums that do not have their trash picked up by a municipality. Commercial generators are required by State Law2 (1986) and DEM regulations3 (1996) to recycle. Although cities and towns are not required to collect recyclable materials from commercial generators, they are encouraged to work with local businesses to provide the service.
For businesses with 50 or greater employees, RI laws include very specific language requiring them to contract for recycling services if they already contract for
trash services4. This law is unofficially called the ‘dumpster law’ meaning that for every dumpster of trash, there should also be a dumpster of recyclable materials.
There are approximately 28,000 businesses in
Rhode Island, only a small percentage of which recycle. The DEM is responsible for enforcing this requirement. Although
there was an initial uptick in the number of companies contracting with waste haulers to recycle, as reported to DEM by various waste haulers, this initial wave faded as threat of enforcement failed to materialize. The majority of businesses with fewer than 50 employees remain unaware that recycling is mandatory or are unable to find a cost effective means to do so.
Currently, from data collected at the scales going in and out of RIRRC, it is believed that of the material processed at the MRF at RIRRC in 2013, 10% was from the commercial sector. From the data collected in the DEM annual recycling surveys, of the companies that report, the recycling rate for the commercial sector is closer to 30%. Although the recycling rate is increasing slowly, for the commercial sector it is not rising significantly enough to extend the life of the landfill. This may not necessarily be a problem however, as a significant amount of commercial waste, and commercial recycling, is processed outside of Rhode Island.
RIRRC employs a full-time Waste Prevention Coordinator who provides technical assistance to
businesses that want to start recycling or want to improve an existing program. This assistance, which is free of charge, consists of providing on-site waste assessments, program evaluation and analysis, program development assistance using industry best practices, and general public education targeted at
2 RIGL "Waste Recycling” 23-18.8-2(5) 3 Rules and Regulations for Reduction and Recycling of Commercial and non-Municipal Residential Solid Waste 4 RIGL "Waste Recycling” 23-18.8-2(13)
State Guide Plan 171 Preliminary Draft: September 2014
2 - 22
the business community. Since 2007, over 350 site visits and consultations have occurred at businesses of all sizes.
Common Recycling Misperceptions Recycling is Free
Commercial entities unlike residents must pay for recycling out-of-pocket at the time the service is provided. Because many businesses employ RI residents, and because residential trash and recycling services are largely paid for through property tax, there is the misperception by employees that recycling is, or should be, “free”.
In reality, collecting recyclable materials carries costs for both municipalities and businesses. The costs associated with collection come from an additional truck, extra workers, truck maintenance, and
fuel. Larger companies may recycle enough material to see a significant drop in waste disposal which could translate to cost savings. Small businesses will, most likely, pay more to contract for the collection of recyclable materials than they would for one bin of unsorted trash. Recyclable materials are separated from the trash at RI Resource Recovery Corporation
Because RIRRC is able to separate some recyclable materials (mostly cardboard, wood, and metal) from trash at the Tip Facility, many waste haulers have been actively misleading their customers to believe that this is true for bagged trash as well. Some waste haulers have told their customers that it is acceptable for the customers to combine their recyclable materials with their trash or for the waste hauler to combine separated recyclable materials with trash because it will be sorted at RIRRC. This is false.
The limited sorting done by RIRRC is not comparable to source separated recyclable materials.
RIRRC is only able to separate the largest of the recyclable materials such as bulky plastics, clean drywall, and appliances. Bagged trash is always buried directly in the Central Landfill without further sorting. Obstacles to Improvement Lack of staffing at State Agencies
DEM is currently the only State agency with the authority to enforce the laws and regulations requiring businesses to recycle. Presently, there is only ¼ of a full time employee (FTE) dedicated to Commercial Recycling at DEM. The legislation, i.e. ‘the dumpster law’, affords DEM very clear language to pursue enforcement. The time required to bring a company into compliance can fluctuate if requiring the issue of one letter or phone call to several over the course of a few months. DEM has not established a manner for compelling Rhode Island businesses to recycle that does not involve more Department staff. Cities and towns, facing the same understaffing difficulties, have the authority to adopt ordinances regarding commercial recycling but, with the exception of Westerly, have not done so to date.
DEM and RIRRC provide staff for waste assessments and outreach to the public. RIRRC also
forwards complaints against businesses or landlords to DEM. Even with these two agencies working together, only 10 – 15 enforcement cases are identified each year. In order to start an enforcement case,

State Guide Plan 171 Preliminary Draft: September 2014
2 - 23
the Department requires that someone files a complaint. The Department cannot take enforcement action against a business with only a cursory inspection of the visible containers outside the building.
Lack of Resources
In the past, RIRRC was able to provide recycling bins at reduced rates or as grants to schools and businesses that wanted to start recycling programs. Commercial grants are no longer provided by RIRRC. Many small businesses, schools, and apartment/condominium complexes are easily frustrated when faced with an immediate capital cost before they institute a recycling program. Lack of Knowledge in the Commercial Sector
Businesses are often willing to recycle but are confronted with impediments outside of their control. A key impediment is a lack of space for additional containers to facilitate solid waste separation. Many businesses do not have the space to put an additional dumpster or a tote outside their buildings for
recyclable materials. They mistakenly believe that the trash and recycling containers must be the same size. This is not always the case. In this situation, the only options are to work with the municipality, or to bring recyclables directly to a recycling facility.
We have some of the oldest buildings in the country. Restaurants and bars face significant challenges regarding recycling and composting just due to the age of the physical structures where they are found. Some businesses have made attempts to start recycling programs. The kitchens in restaurants and bars are not usually designed to facilitate placement of large bins that can be emptied easily when needed. The space behind a bar is limited as well. Making recycling and composting happen, through innovation and ingenuity can happen and needs to be considered in new construction as well as building retrofits for such businesses. Looking to best practices outside the state will be crucial to helping to change the business recycling culture.
RI hospitals have made great strides towards recycling but they have little free space as well. Although patients are served meals in recyclable containers, finding a place to put a bin to collect those recyclables from the tray is a challenge. Miriam Hospital in Providence is a leader in finding recycling solutions, and is modeling best practices for other hospitals to follow. Next Steps
If no additional FTEs can be hired, DEM will continue to take enforcement action when appropriate under existing staffing levels. Efforts have been made to reach out to the recycling coordinators of all cities and towns to increase enforcement. In 2013, compliance with the survey reached 70% for businesses with 50 or greater employees. DEM is on-track to introduce new recycling regulations in 2014. DEM and RIRRC will continue to work together to provide more education, outreach and waste assessments.
Education and Outreach
Widespread educational outreach informing businesses that recycling is mandatory is critical. Newspaper articles, online outreach, and mailed flyers or notices (sent with documents from other State agencies such as Division of Taxation) will be the most efficient means of communicating. Staff can also contact professional associations and chambers of commerce to do brief talks about the recycling laws. Education must contain both an explanation of how the recycling laws pertain to the businesses and the options a business can take to comply with these laws. Businesses must also be given contact names of staff that can help them start recycling.
State Guide Plan 171 Preliminary Draft: September 2014
2 - 24
Implementation
Businesses with locations that prove to be underserved by waste haulers, DEM or RIRRC staff could help facilitate the formation of co-ops. Co-ops could help provide economies of scale and space to store and transfer recyclables and with combined buying power have waste haulers bid for their services.
Enforcement
After an agreed upon time, there must be follow-through for those businesses that have not
started recycling programs. With additional staff, the Department will have the ability to enhance its enforcement efforts.
Other Private Sector Activities
In addition to the private sector waste haulers, other private businesses play important roles in reuse of waste materials, recycling, and the management of special wastes. Scrap yards and paper brokers have been an important part of the recycling industry long before the public sector began taking more responsibility of coordinated municipal recycling. The reuse industry is dominated by both for profit and non- profit entities. Consignments stores, swap shops and refurbishing businesses all foster important reuse activities that help keep goods from being prematurely discarded. In addition there are
numerous non-profit organizations (Goodwill/Salvation Army/Big Brothers, etc.) that facilitate reuse through donation of clothing and durable goods. Other non-profits specialize in redistributing surplus supplies to the arts and education (Resources for Rhode Island Education).
Some private enterprises are finding their niches as a result of Extended Producer Responsibility (EPR) laws. For example, the Electronic Waste Prevention Recycling and Reuse Act passed in 2008 has fostered the creation and growth of several firms performing collection, recycling and program
management functions surrounding the recovery of e-scrap from residents. Likewise, the recently passed EPR laws for paint and mattresses are being implemented by industry sponsored groups, PaintCare and the Mattress Recycling Council respectively.
Private sector involvement in the management of organic wastes is growing. Privately run yard waste composting facilities serve both municipal and commercial customers. Food banks and soup
kitchens redistribute surplus food, and pig farms use post-consumer food scraps as feed. There is limited farm-based composting of food scraps, and as of 2014, two pilot scale localized community food scrap collection and composting projects were operational. As of May 2014, there were two anaerobic digesters being planned, one in North Kingstown and the other in Johnston, which are awaiting permitting. Markets for Disposal and Recycling - Yesterday, Today and the Future
RI participates in regional markets for solid waste disposal. Recycled commodities recovered in RI are shipped not only regionally but also to national and international customers. Rhode Island’s size is not conducive to creating stand-alone recycling markets. On our own, we simply do not produce enough recyclable materials to be a player in the global commodities market. However, as part of the Northeast market, we benefit from the size of our neighbors. RIRRC actively participates in the Northeast Recycling Council, SWANA, and other regional groups in order to provide RI a voice in regional decisions and to learn of opportunities. This involvement has led to gains in paint, mattress, organics, and carpet recycling.
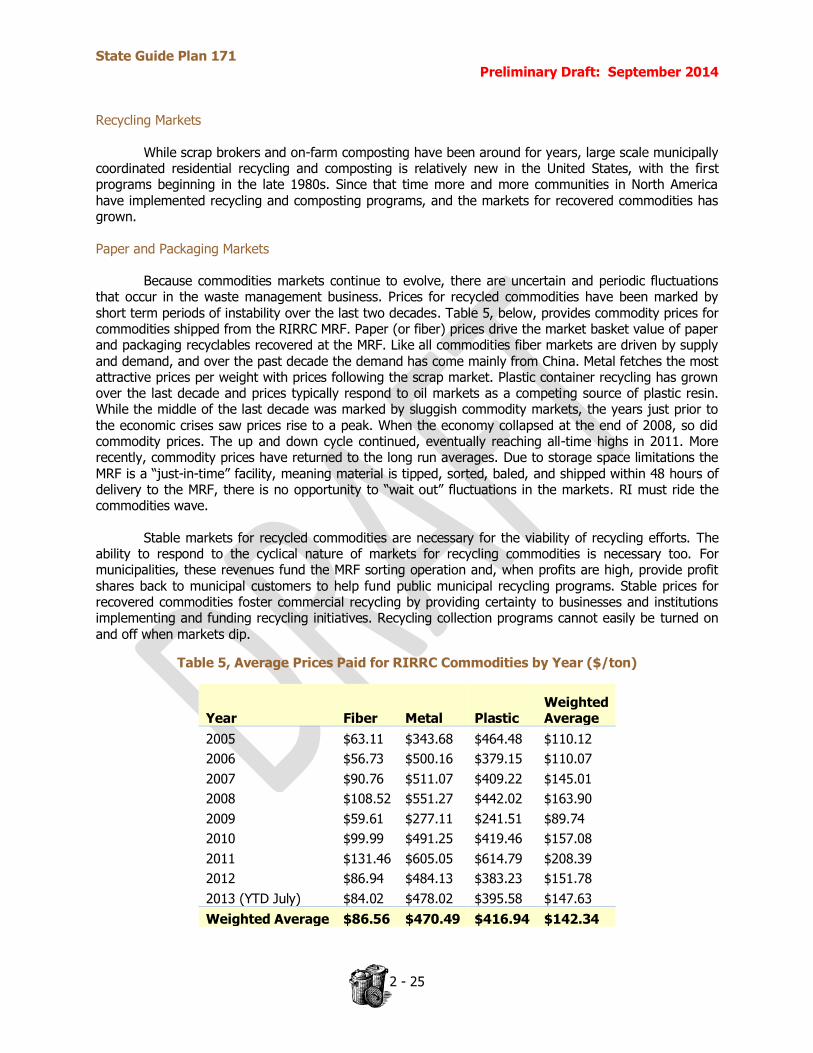
State Guide Plan 171 Preliminary Draft: September 2014
2 - 25
Recycling Markets
While scrap brokers and on-farm composting have been around for years, large scale municipally coordinated residential recycling and composting is relatively new in the United States, with the first programs beginning in the late 1980s. Since that time more and more communities in North America have implemented recycling and composting programs, and the markets for recovered commodities has grown. Paper and Packaging Markets
Because commodities markets continue to evolve, there are uncertain and periodic fluctuations that occur in the waste management business. Prices for recycled commodities have been marked by short term periods of instability over the last two decades. Table 5, below, provides commodity prices for commodities shipped from the RIRRC MRF. Paper (or fiber) prices drive the market basket value of paper and packaging recyclables recovered at the MRF. Like all commodities fiber markets are driven by supply
and demand, and over the past decade the demand has come mainly from China. Metal fetches the most attractive prices per weight with prices following the scrap market. Plastic container recycling has grown over the last decade and prices typically respond to oil markets as a competing source of plastic resin. While the middle of the last decade was marked by sluggish commodity markets, the years just prior to the economic crises saw prices rise to a peak. When the economy collapsed at the end of 2008, so did commodity prices. The up and down cycle continued, eventually reaching all-time highs in 2011. More recently, commodity prices have returned to the long run averages. Due to storage space limitations the MRF is a “just-in-time” facility, meaning material is tipped, sorted, baled, and shipped within 48 hours of delivery to the MRF, there is no opportunity to “wait out” fluctuations in the markets. RI must ride the commodities wave.
Stable markets for recycled commodities are necessary for the viability of recycling efforts. The ability to respond to the cyclical nature of markets for recycling commodities is necessary too. For municipalities, these revenues fund the MRF sorting operation and, when profits are high, provide profit shares back to municipal customers to help fund public municipal recycling programs. Stable prices for recovered commodities foster commercial recycling by providing certainty to businesses and institutions implementing and funding recycling initiatives. Recycling collection programs cannot easily be turned on and off when markets dip.
Table 5, Average Prices Paid for RIRRC Commodities by Year ($/ton)
Year Fiber Metal Plastic Weighted Average
2005 $63.11 $343.68 $464.48 $110.12
2006 $56.73 $500.16 $379.15 $110.07
2007 $90.76 $511.07 $409.22 $145.01
2008 $108.52 $551.27 $442.02 $163.90
2009 $59.61 $277.11 $241.51 $89.74
2010 $99.99 $491.25 $419.46 $157.08
2011 $131.46 $605.05 $614.79 $208.39
2012 $86.94 $484.13 $383.23 $151.78
2013 (YTD July) $84.02 $478.02 $395.58 $147.63
Weighted Average $86.56 $470.49 $416.94 $142.34
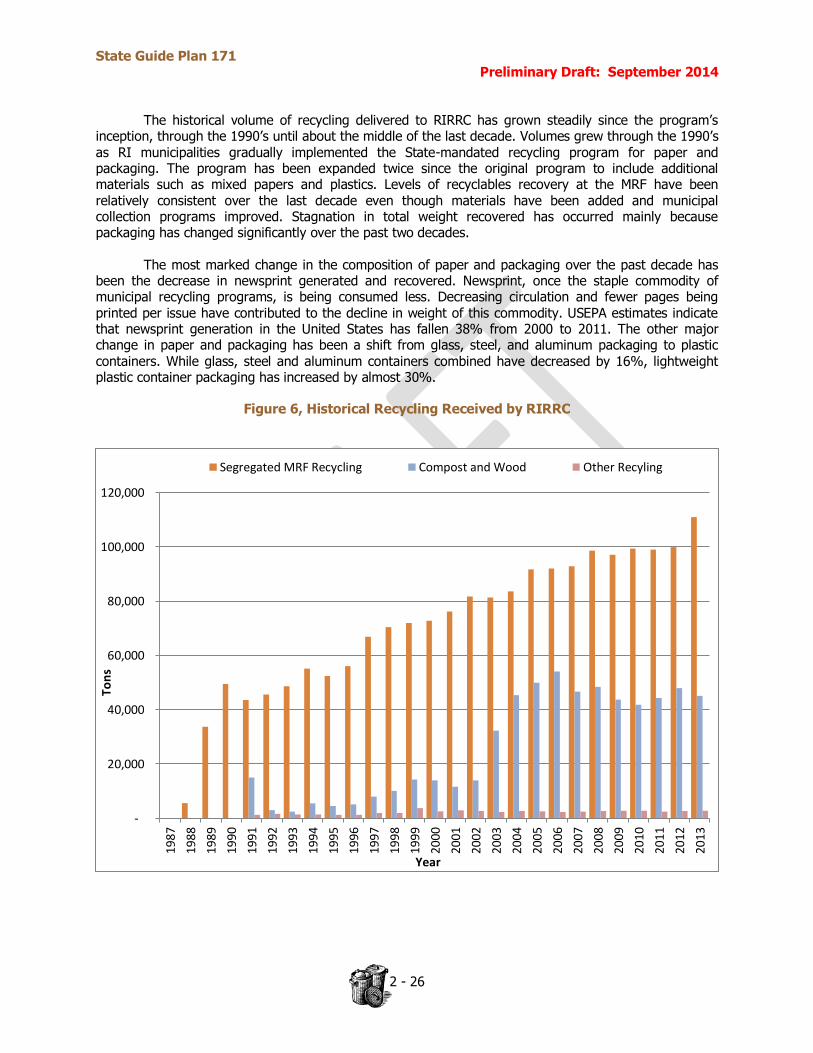
State Guide Plan 171 Preliminary Draft: September 2014
2 - 26
The historical volume of recycling delivered to RIRRC has grown steadily since the program’s inception, through the 1990’s until about the middle of the last decade. Volumes grew through the 1990’s
as RI municipalities gradually implemented the State-mandated recycling program for paper and packaging. The program has been expanded twice since the original program to include additional materials such as mixed papers and plastics. Levels of recyclables recovery at the MRF have been relatively consistent over the last decade even though materials have been added and municipal collection programs improved. Stagnation in total weight recovered has occurred mainly because packaging has changed significantly over the past two decades.
The most marked change in the composition of paper and packaging over the past decade has been the decrease in newsprint generated and recovered. Newsprint, once the staple commodity of municipal recycling programs, is being consumed less. Decreasing circulation and fewer pages being printed per issue have contributed to the decline in weight of this commodity. USEPA estimates indicate that newsprint generation in the United States has fallen 38% from 2000 to 2011. The other major change in paper and packaging has been a shift from glass, steel, and aluminum packaging to plastic
containers. While glass, steel and aluminum containers combined have decreased by 16%, lightweight plastic container packaging has increased by almost 30%.
Figure 6, Historical Recycling Received by RIRRC
-
20,000
40,000
60,000
80,000
100,000
120,000
1987
1988
1989
1990
1991
1992
1993
1994
1995
1996
1997
1998
1999
2000
2001
2002
2003
2004
2005
2006
2007
2008
2009
2010
2011
2012
2013
Ton
s
Year
Segregated MRF Recycling Compost and Wood Other Recyling

State Guide Plan 171 Preliminary Draft: September 2014
2 - 27
Compost Markets
The market for composting segregated yard leaf and yard debris in RI is composed of RIRRC’s facility, a number of municipal operations, and a handful of commercial operations including on-farm composters. The annual volumes of compost received at RIRRC have increased dramatically since 2003. However, markets had little to do with this increase. RIRRC adopted a policy (since enacted into law) to eliminate the tip fee on yard waste from municipalities in order to encourage collection from residents. The volume processed by RIRRC increased dramatically, even though the overall amount of yard waste composting in RI remained relatively stable. While collection efforts of residential yard debris did not increase, several municipalities did divert material from local and private sector composting operations to RIRRC’s facility, causing an imbalance in the RI market. RIRRC would prefer to see this trend reversed, with greater composting activities occurring closer to the sources of yard debris.
Markets for compost and wood landscape products are both local and regional. For smaller municipal sites, finished compost is often provided for free or for a small fee to residents. Other sites will
distribute to landscapers and end users directly and more compost is being marketed regionally through brokers that distribute to landscaping outlets and large site construction projects markets. Because compost products vary significantly by producer, feedstock and quality and location, valid average price data is not available. Generally, high-end composts can command $50 per yard retail. Wholesale prices paid to composters are typically much less. RIRRC sells some of its Class “A” compost directly to users for $30 per yard, and makes approximately $5 per yard wholesale. The amount of product produced varies by season (more in Spring and Fall) but generally RIRRC produces more compost than it can market. Large scale compost distribution is reliant upon local large construction projects, and the need tends to be seasonal.
Other Materials
Scrap metal and textiles have well developed markets that existed long before the expansion of coordinated municipal recycling. Markets for other waste materials, such as electronics, mattresses, and tires, are developing, partly in response to EPR initiatives. The collection programs for these “non-MRF” materials must be further developed by the private sector to encourage the growth of the respective
industries. Regional Disposal Market History
Commercial waste disposal at RIRRC has peaked and declined twice over the past two decades. Because RIRRC is prohibited from accepting wastes from out of state, the peak years for disposal are a good approximation of the RI generated refuse disposed. External forces on the RI commercial market included regional capacity issues (adding, then removing, capacity), WTE development, pricing, and “put or pay” contracts at RIRRC and in MA and CT. The economic crash in 2008 brought waste generation tumbling down and resulted in an excess supply of disposal capacity in the region. In response, commercial disposal volumes at RIRRC dropped again to historic lows bringing lucrative commercial revenues to a halt.
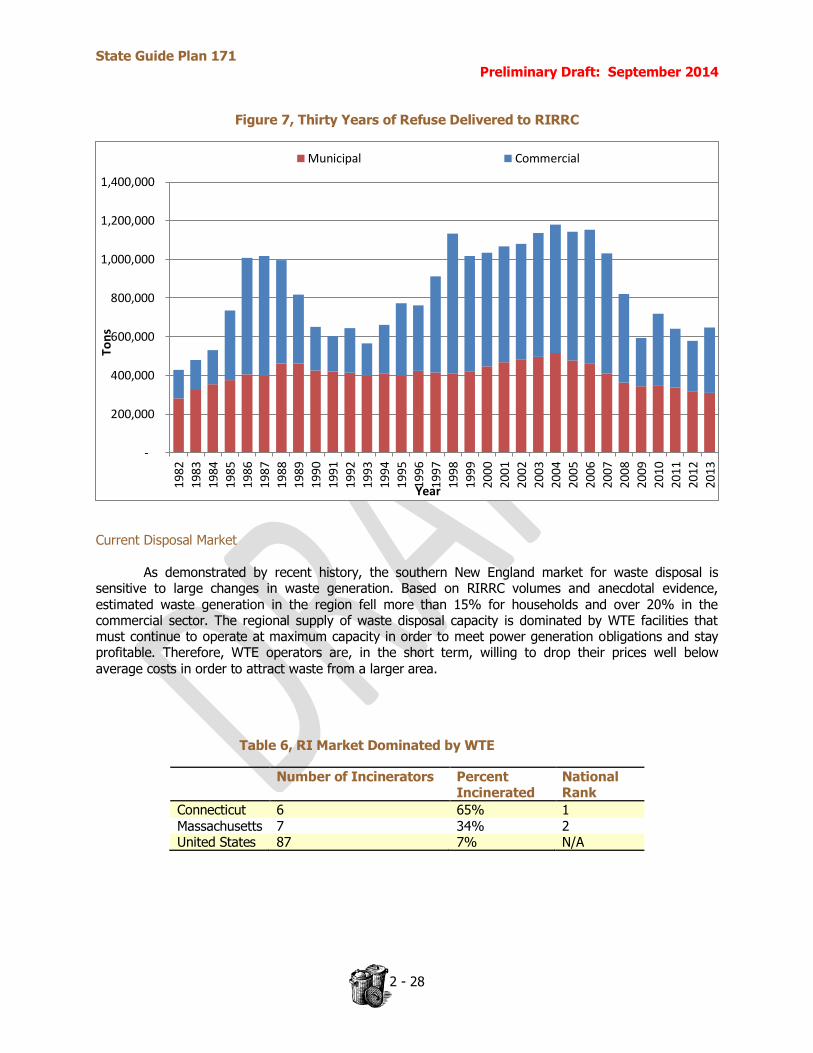
State Guide Plan 171 Preliminary Draft: September 2014
2 - 28
Figure 7, Thirty Years of Refuse Delivered to RIRRC
Current Disposal Market
As demonstrated by recent history, the southern New England market for waste disposal is sensitive to large changes in waste generation. Based on RIRRC volumes and anecdotal evidence, estimated waste generation in the region fell more than 15% for households and over 20% in the commercial sector. The regional supply of waste disposal capacity is dominated by WTE facilities that must continue to operate at maximum capacity in order to meet power generation obligations and stay profitable. Therefore, WTE operators are, in the short term, willing to drop their prices well below
average costs in order to attract waste from a larger area.
Table 6, RI Market Dominated by WTE
Number of Incinerators Percent Incinerated
National Rank
Connecticut 6 65% 1 Massachusetts 7 34% 2 United States 87 7% N/A
-
200,000
400,000
600,000
800,000
1,000,000
1,200,000
1,400,00019
82
1983
1984
1985
1986
1987
1988
1989
1990
1991
1992
1993
1994
1995
1996
1997
1998
1999
2000
2001
2002
2003
2004
2005
2006
2007
2008
2009
2010
2011
2012
2013
Ton
s
Year
Municipal Commercial
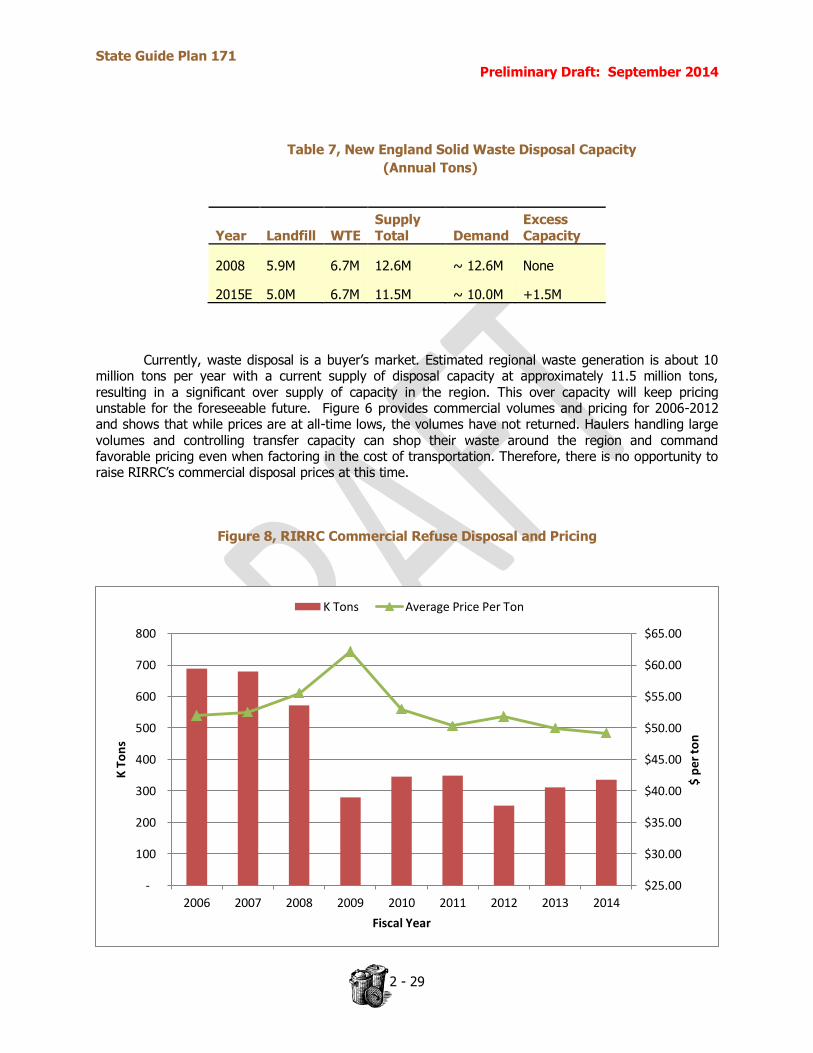
State Guide Plan 171 Preliminary Draft: September 2014
2 - 29
Table 7, New England Solid Waste Disposal Capacity
(Annual Tons)
Year Landfill WTE Supply Total Demand
Excess Capacity
2008 5.9M 6.7M 12.6M ~ 12.6M None
2015E 5.0M 6.7M 11.5M ~ 10.0M +1.5M
Currently, waste disposal is a buyer’s market. Estimated regional waste generation is about 10 million tons per year with a current supply of disposal capacity at approximately 11.5 million tons, resulting in a significant over supply of capacity in the region. This over capacity will keep pricing unstable for the foreseeable future. Figure 6 provides commercial volumes and pricing for 2006-2012 and shows that while prices are at all-time lows, the volumes have not returned. Haulers handling large volumes and controlling transfer capacity can shop their waste around the region and command favorable pricing even when factoring in the cost of transportation. Therefore, there is no opportunity to raise RIRRC’s commercial disposal prices at this time.
Figure 8, RIRRC Commercial Refuse Disposal and Pricing
$25.00
$30.00
$35.00
$40.00
$45.00
$50.00
$55.00
$60.00
$65.00
-
100
200
300
400
500
600
700
800
2006 2007 2008 2009 2010 2011 2012 2013 2014
$ p
er t
on
K T
on
s
Fiscal Year
K Tons Average Price Per Ton
State Guide Plan 171 Preliminary Draft: September 2014
2 - 30
Economics of Managing Waste
The management of solid waste is largely driven by economics. Markets, logistics, and
technology all impact our options for managing waste materials. The solid waste management industry is comprised of a vertically integrated mixture of services and commodities. Waste materials flow from the generation sources, through hauling service providers, then on to processors and disposal facilities. Materials from processing facilities can be further refined or sold as commodities for manufacture to process into new goods. Process waste residues from recycling, composting, and waste to energy
operations are sent to disposal facilities. While markets play a large role, federal, state and local policy decisions also have a major influence on the fate of our wastes. The decisions made regarding waste at all levels are ultimately based on the costs of the options available, individual knowledge and preferences, and the set of incentives facing all the actors involved in the flow of waste materials to its ultimate fate.
The overall direct cost of waste recycling and disposal is comprised of collection, transportation, and fees for disposal and processing. Sometimes the costs associated with collecting and segregating recyclable materials are offset by the sales of materials. For the casual observer, it is often puzzling why more recycling doesn’t occur when recovered materials are worth money and waste costs money to dispose. The fact is that the cost of separating, collecting, and transporting additional materials quite often does not cover the net difference in revenue from the sale of recovered materials and the savings from avoided disposal fees. Waste avoidance is the most cost effective waste management option. Participants and Incentives
The options facing waste generators are constrained by the programs and services offered by local governments and private service providers. While municipalities have a critical role in the level of service provided to residents and how it will be paid for, the specific materials that can be collected for recycling are dictated by State level policymakers. Likewise, waste haulers and recycling service providers can only provide collection of segregated recycling if there is access to processing capacity and markets for recovered goods. For many households and businesses waste prevention and recycling is done because it is “the right thing to do”. For many other households the main motivators for participating in available recycling programs are whether their neighbors do, and whether it is enforced. Often for businesses, requirements to recycle and the threat of enforcement are motivations, as is the desire to be “eco-friendly”. Similarly, municipal program managers, policymakers, and waste service providers implement programs and often provide services for recycling to satisfy mandates and the public pressure to be environmentally responsible. However, all participants respond to costs and price signals, and long term sustainable diversion of solid wastes from land disposal will require that recycling collection, processing, and alternative disposal technologies be cost effective.
Costs are distributed differently to households and businesses. For most RI households the cost of recycling and disposal collection is not paid directly, but paid collectively by the municipality through tax revenues. Therefore, most residents do not understand the costs of their waste generation. There are some municipal programs that charge households for disposal based on the amount of waste generated while providing recycling collection for no charge to incentivize participation in recycling and encourage waste prevention. Regardless, for most residents the actual costs of waste management programs are recognized by the local municipal program managers and policymakers tasked with providing a set of public services and faced with a budget constraint. The level of effort by municipal waste managers to provide and promote recycling services is a function of the associated costs, mandates from the state, and political pressure to be “eco-friendly”.
State Guide Plan 171 Preliminary Draft: September 2014
2 - 31
Because commercial waste generators pay for waste and recycling services directly, like the municipal manager, their level of recycling effort will depend largely on the net costs, but also mandates,
and the desire to be environmentally responsible. Commercial haulers will provide recycling services when revenues from materials can offset the additional costs for recycling, or when businesses are willing to pay extra for such service. However, in most instances waste hauling firms have very little incentive to promote waste reduction or the segregated collection of recyclables to their customers. Separation & Collection Costs
Source separation Logistics
Strategies for recovering materials from the refuse stream can involve varying degrees of source
separation of recycling. Most residents and businesses can adapt to some degree of sorting recyclables when provided with the proper containers and education. However, in many cases and particularly for small businesses, space constraints can hinder opportunities to source-separate recycling. More important is the impact that multiple material sorts at distributed sources has on the over-all cost of recycling collection. Collection Costs
Recyclable materials tend to have a greater volume and much lower weight than trash. A truck for recyclable materials requires more trips for the same tonnage of recyclable materials as trash. This is why adding separate recycling collection services are costly, and why RIRRC converted its MRF to a single stream facility, providing municipalities the opportunity to significantly reduce the cost of collecting recyclables. Likewise, reducing the frequency of collection reduces costs, and every other week collection of recycling is being adopted in communities nationwide. In RI, only the towns of Scituate, Foster, and North Kingstown collect recycling every other week. For collection services provided to multiple customers per route, the density of stops also plays a factor in costs. Collection costs can vary greatly depending on the type of customer served, but typically they make up the majority of the cost associated with the management of solid for households and small business. Commercial customers serviced via high volume compaction containers and C&DD open top roll-off collection containers have the lowest collection cost per ton. Collecting refuse and recycling from commercial and multi-unit residential customers provided with dumpster service costs more per ton but still less than collecting curbside from households.
Recycling collection costs are related to the program’s set out requirements (i.e., how material is to be sorted—for example, separate containers for glass,
paper, and cans), frequency of collection, and level of community participation. By adjusting the variables that affect collection costs, communities can lower these costs. According to the US EPA, in general, the per-ton or per-household costs of collecting recyclables:
Increase with the number of separately segregated commodities. Single-stream is the least costly to collect, followed by two-stream, etc.
Increase with the frequency of collection. Collecting half as frequently (e.g., every other week instead of weekly) can reduce collection costs by approximately 25 % assuming traditional two-stream set outs.
Decrease as more materials are collected by the program. If few households participate in the program and the program does not collect many commodities, the per-household cost soars, as it is costly to drive a recycling truck past household after household that have not set out recyclables.
State Guide Plan 171 Preliminary Draft: September 2014
2 - 32
Transfer and Transportation costs
Transportation is a major factor in waste management costs. More material transported per load equals lower transportation cost per ton. Collection vehicles of all types are limited in volume, with the largest running about 30 cubic yards. When the destination for collected materials is greater than 30 miles, it is more cost effective to use transfer facilities and aggregate waste into large (100+ cubic yard) tractor trailers. This creates transportation efficiency and allows more time for collection vehicles to be on route collecting. Transfer facilities offer an opportunity to screen waste, provide flexibility in choice of disposal destination, provide convenient public drop-off for refuse, and allow for the collection of special wastes.
Solid waste transfer stations are necessary for commercial haulers to move significant amounts of waste to neighboring states. Control of RI transfer capacity allows the larger private haulers the ability to shop for the best prices for their RI commercial wastes. The private firms that control RI’s transfer capacity also have an opportunity to attract other haulers and compete directly with RIRRC for RI’s
commercial waste load. Given that the existing RI solid waste transfer capacity of 1.4 million tons approximates the statewide total waste generation, the potential exists for additional commercial sector waste to move to neighboring states in this time of regional over supply. Processing and Disposal Costs
Processing waste and recyclables takes many forms: WTE, refuse-derived fuels, mixed waste processing to separate organics and inorganics, anaerobic digestion, sorting of segregated papers and packaging, and composting to name a few. Disposal takes the form of WTE processing and land disposal. Typically mixed waste and recycling processing costs are offset by revenues from the sale of recovered materials and energy. But for most processing operations for mixed wastes and organics, tip fees are needed to ensure profitability.
Sorting operations for paper and packaging and C&DD have typically been labor intensive. Over the past decade these operations have increasingly relied on automation, requiring high up-front capital costs. Processing that converts waste and segregated organics to energy have even higher initial capital costs, must run at capacity to satisfy energy agreements, and must receive sufficient tip fee revenues to cover fixed costs.
Burying unprocessed solid waste in a landfill is the least expensive method of disposal. However, the economics of landfill disposal differ from processing in that landfills are non-renewable resources with a finite capacity. The upfront costs to construct a landfill and the construction costs to cap and close a landfill once full are amortized over the entire life of the facility and remain constant for each ton landfilled, regardless of the loading rate of waste. In addition to these upfront costs there are operating costs, many of which are fixed, which include personnel, machinery, leachate collection, and landfill gas management costs. While some costs can be adjusted over the long term in response to changes in loading, others cannot. The period of time a landfill cell is open and accepting waste results in higher operational costs in order to manage leachate, gas, and erosion control. Once a cell is capped these costs gradually decline. As loading rates increase, the average cost per ton for landfilling decreases. From the standpoint of minimizing cost over the life of a landfill, all the better to fill it up, cap, and close as quickly as possible. Obviously, such a short sighted view neglects to consider the demand for disposal today and in the future. There is a trade-off between revenue today and future revenues. While RIRRC could lower

State Guide Plan 171 Preliminary Draft: September 2014
2 - 33
Flow controls are legal authorities
used by State and local
governments to designate where
MSW must be taken for processing,
treatment, or disposal. This waste
management approach requires
waste to be delivered to specific
facilities such as waste-to-energy
facilities, materials recycling
facilities, composting facilities,
transfer stations and/or landfills.
The facilities can be either publicly
or privately owned. One of the
direct effects of flow control is that
designated facilities are assured of
receiving a guaranteed amount of
refuse and/or recyclable materials.
If the designated facilities charge a
‘tipping fee’ for receipt of the
refuse/recyclables, flow control
assures a source of revenue to
meet their capital and operating
costs. (Flow Control and Municipal
Solid Waste (EPA 530-R-95-008),
1995)
its tip fees further and attract more commercial waste for disposal in the current period, it would come at the risk of higher costs per ton in the future.
Financing Facilities, Planning and Flow Control
Given the high cost of developing WTE, waste processing and recycling facilities, large amounts of capital needs to be raised to fund such projects. Unless project developers can demonstrate the ability to maintain sufficient sources of incoming materials at an adequate tip fee to cover the debt service, such projects are not feasible. Since the 1970’s more and more jurisdictions have used solid waste flow control to fund these projects and plan integrated solid waste management systems. Over the last two decades there were key legal challenges to flow control provisions that brought into the question their viability under the interstate commerce clause of the U.S. Constitution. In 2007, the U.S. Supreme Court heard its first solid waste management case in 13 years, United Haulers Association vs. Oneida-Herkimer Solid Waste Management Authority, and clarified that the local ordinance that directed locally- generated wastes to publicly-owned waste facilities did not interfere with interstate commerce.
Rhode Island Statute RIGL § 23-19-
10(40) specifically provides RIRRC authority over where all RI refuse and recycling may be delivered for processing and disposal, and RIRRC maintains and exercises control over municipal sector waste and recycling. However, challenges against flow control provisions in other states in the 1990’s brought into question the validity of such flow control provisions on RI commercial wastes. Therefore, even though specific flow control regulations were adopted by RIRRC in 1991 that would give RIRRC authority over commercial sector wastes, this authority has yet to be enforced. Given the Supreme Court ruling and the emphasis on waste diversion in this plan, a reconsideration regarding the role of flow control on commercial sector is warranted. External Costs
In addition to the direct costs associated with managing solid wastes, there are costs to society that are not recognized on financial statements or by disposal markets. These costs, known to economists as external costs, arise from factors such as odor, litter, air pollution, the risk of potential ground water contamination, and various other environmental and social impacts. While pollution abatement and environmental protection efforts at the Central Landfill continue to expand, air emissions or the risk of some future ground water contamination, common risks associated with the operation of any landfill, need to be addressed. Waste to energy, composting, and even recycling operations have associated externalities of some sort. Quantification of such external costs is difficult but not impossible. Policymakers should recognize the existence of such costs and where possible obtain estimates of the magnitude of external costs associated with different waste management options.
State Guide Plan 171 Preliminary Draft: September 2014
2 - 34
Climate Change & Transportation Impacts
The Earth's atmosphere supports a balanced variety of climates on which diverse ecosystems depend. Human activities that thicken the gaseous "greenhouse" around the planet threaten to disrupt that balance. The manufacture, distribution, and use of products-as well as management of the resulting waste-all result in greenhouse gas emissions. A landfill contributes more methane than any other waste processing technology. It is estimated that the Central Landfill emits 785 tons of methane per year. Waste prevention and recycling are ways to help mitigate climate change. Waste reduction can help slow the effects of climate change by reducing the amount of material decomposing into methane. Also since greenhouse gas (GHG) is emitted not only by the trucks entering the site, but the trucks delivering finished products to manufacturers, reducing the total number of trips required would also help reduce GHG. In the last 100 years, scientists have detected an increase of 1°F in the Earth's average surface temperature. According to the US EPA, there is international scientific consensus that human activity is responsible for some of this increase. A rise of only a few degrees in the Earth's average temperature could result in:
1. Wider fluctuations in temperatures 2. More frequent and intense storms 3. Flooding of beach, marsh, and other low-lying coastal areas 4. More precipitation in some areas and not enough in others 5. Wider distribution of certain diseases Many uncertainties remain. No one can predict the precise timing, magnitude, and regional patterns
of future climate change. Nor can anyone foretell the ability of mankind and nature to adapt to such changes. Waste prevention and recycling-jointly referred to as waste reduction-help us better manage the solid waste we generate. But preventing waste and recycling also are potent strategies for reducing greenhouse gases. Together they:
Reduce emissions from energy consumption - Recycling saves energy. That's because making
goods from recycled materials typically requires less energy than making goods from virgin materials. And waste prevention is even more effective. Less energy is needed to extract, transport, and process raw materials and to manufacture products when people reuse things or when products are made with less material. The payoff? When energy demand decreases, fewer fossil fuels are burned and less carbon dioxide is emitted to the atmosphere.
Reduce emissions from incinerators. - Diverting certain materials from incinerators through waste prevention and recycling reduces greenhouse gas emissions to the atmosphere.
Reduce methane emissions from landfills - Waste prevention and recycling (including composting) divert organic wastes from landfills, reducing the methane released when these materials decompose.
Increase storage of carbon in trees - Forests take large amounts of carbon dioxide out of the atmosphere and store it in wood, in a process called carbon sequestration. Waste prevention and recycling of paper products can leave more trees standing in the forest, continuing to absorb carbon dioxide from the atmosphere.
Facility Planning
When planning new facilities, consideration must be given to climate change effects of any new technology or locations. Additionally, closed and capped municipal landfills in areas vulnerable to sea level rises must be continually evaluated to ensure that there is no possibility of breaching the cap.
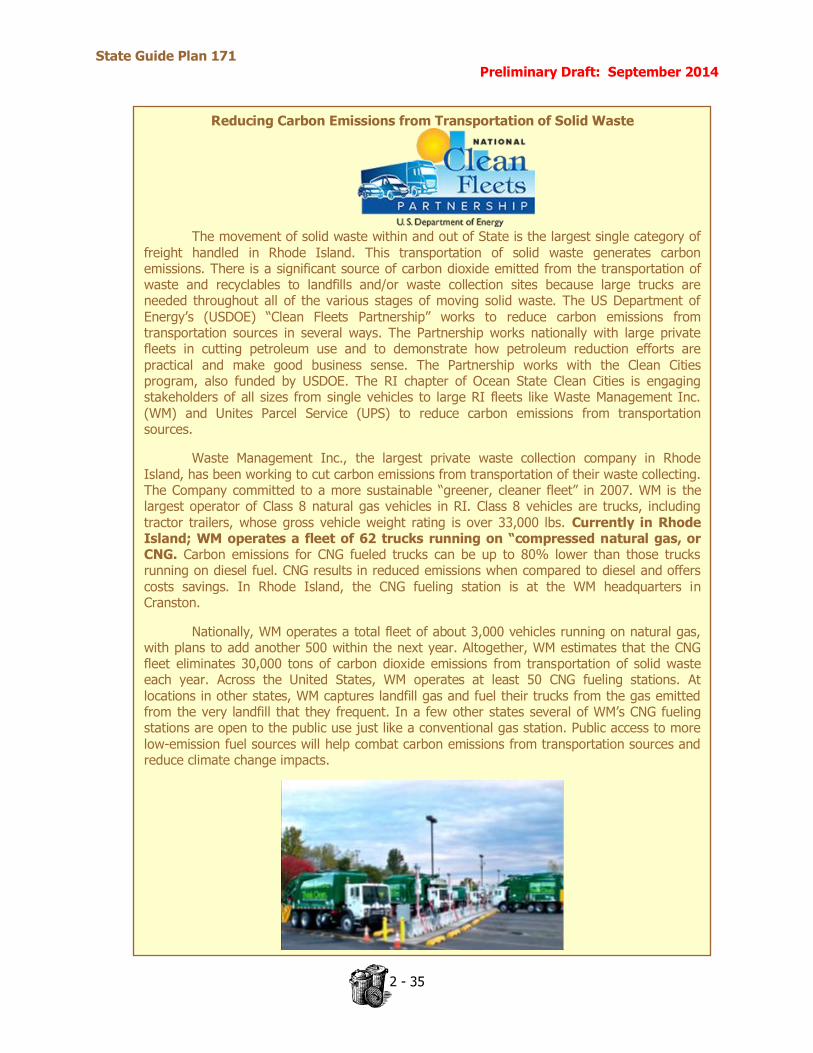
State Guide Plan 171 Preliminary Draft: September 2014
2 - 35
Reducing Carbon Emissions from Transportation of Solid Waste
The movement of solid waste within and out of State is the largest single category of
freight handled in Rhode Island. This transportation of solid waste generates carbon emissions. There is a significant source of carbon dioxide emitted from the transportation of waste and recyclables to landfills and/or waste collection sites because large trucks are needed throughout all of the various stages of moving solid waste. The US Department of Energy’s (USDOE) “Clean Fleets Partnership” works to reduce carbon emissions from transportation sources in several ways. The Partnership works nationally with large private fleets in cutting petroleum use and to demonstrate how petroleum reduction efforts are
practical and make good business sense. The Partnership works with the Clean Cities program, also funded by USDOE. The RI chapter of Ocean State Clean Cities is engaging stakeholders of all sizes from single vehicles to large RI fleets like Waste Management Inc. (WM) and Unites Parcel Service (UPS) to reduce carbon emissions from transportation sources.
Waste Management Inc., the largest private waste collection company in Rhode Island, has been working to cut carbon emissions from transportation of their waste collecting. The Company committed to a more sustainable “greener, cleaner fleet” in 2007. WM is the largest operator of Class 8 natural gas vehicles in RI. Class 8 vehicles are trucks, including tractor trailers, whose gross vehicle weight rating is over 33,000 lbs. Currently in Rhode Island; WM operates a fleet of 62 trucks running on “compressed natural gas, or CNG. Carbon emissions for CNG fueled trucks can be up to 80% lower than those trucks running on diesel fuel. CNG results in reduced emissions when compared to diesel and offers costs savings. In Rhode Island, the CNG fueling station is at the WM headquarters in Cranston.
Nationally, WM operates a total fleet of about 3,000 vehicles running on natural gas, with plans to add another 500 within the next year. Altogether, WM estimates that the CNG fleet eliminates 30,000 tons of carbon dioxide emissions from transportation of solid waste each year. Across the United States, WM operates at least 50 CNG fueling stations. At locations in other states, WM captures landfill gas and fuel their trucks from the gas emitted from the very landfill that they frequent. In a few other states several of WM’s CNG fueling stations are open to the public use just like a conventional gas station. Public access to more low-emission fuel sources will help combat carbon emissions from transportation sources and reduce climate change impacts.
State Guide Plan 171 Draft: September 2014
3 - 1
Key Issues, Strategies & Options:
Issue #1: Facility Funding - How should Rhode Island fund the system…both in the short term and long term and what should be the structure used to set pricing?
o Option A: Statewide PAYT for residential waste o Option B: Raise municipal rates to commercial levels or higher o Option C: Increase municipal rates only to cover operating costs
Issue #2: What strategy should be adopted now to further reduce solid waste volumes and preserve landfill life beyond the projected 2038 date?
o Option A: Maintain status quo o Option B: Invest in programs and policies to reduce waste
o Option C: Manage as a municipal disposal facility
Issue #3: Post Central Landfill Options - What is the post Central Landfill disposal option that will provide the most environmentally sound and economically viable waste disposal services with the least amount of risk?
o Option A: Transport most waste out of state
o Option B: Use technology to process solid waste o Option C: Pursue zero waste o Option D: Expansion of the existing landfill or siting a new landfill
Part 3 Issues, Strategies & Options for Solid Waste Planning
Issue #1: Funding
Underlying both the near term issue of reducing disposal and the long-range issue of what to do after the landfill is full is how to adequately fund Rhode Island’s key solid waste disposal and recycling facilities and their related programs operated and managed by RIRRC. One of the major barriers to increasing recycling and composting in the near term is the relatively low cost to dispose waste in RI. The $32/ton municipal fee
in RI a below cost rate and is 50% of the regional market range of $65 to $75/ton. Commercial disposal rates have been used to subsidize the below-market rate municipal fees for over two decades. Without the commercial revenue, RIRRC would be operating at a significant loss, and would be forced to seek a state subsidy.
Disposal Financials
Municipal Commercial Weighted Average
Tip Fee/Ton $32 $50 $45
Landfilling Cost/Ton $43 $43 $43
Revenue(Loss)/Ton $(11) $7 $2
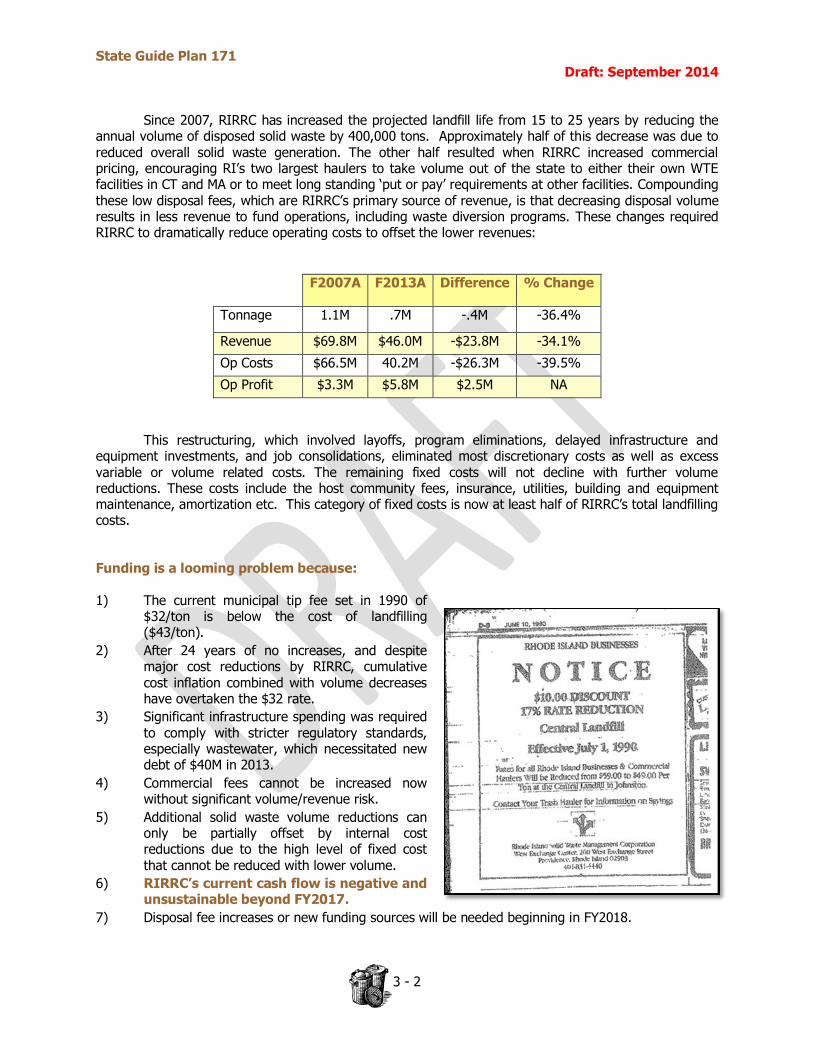
State Guide Plan 171 Draft: September 2014
3 - 2
Since 2007, RIRRC has increased the projected landfill life from 15 to 25 years by reducing the annual volume of disposed solid waste by 400,000 tons. Approximately half of this decrease was due to
reduced overall solid waste generation. The other half resulted when RIRRC increased commercial pricing, encouraging RI’s two largest haulers to take volume out of the state to either their own WTE facilities in CT and MA or to meet long standing ‘put or pay’ requirements at other facilities. Compounding these low disposal fees, which are RIRRC’s primary source of revenue, is that decreasing disposal volume results in less revenue to fund operations, including waste diversion programs. These changes required RIRRC to dramatically reduce operating costs to offset the lower revenues:
F2007A F2013A Difference % Change
Tonnage 1.1M .7M -.4M -36.4%
Revenue $69.8M $46.0M -$23.8M -34.1%
Op Costs $66.5M 40.2M -$26.3M -39.5%
Op Profit $3.3M $5.8M $2.5M NA
This restructuring, which involved layoffs, program eliminations, delayed infrastructure and equipment investments, and job consolidations, eliminated most discretionary costs as well as excess
variable or volume related costs. The remaining fixed costs will not decline with further volume reductions. These costs include the host community fees, insurance, utilities, building and equipment maintenance, amortization etc. This category of fixed costs is now at least half of RIRRC’s total landfilling costs.
Funding is a looming problem because: 1) The current municipal tip fee set in 1990 of
$32/ton is below the cost of landfilling ($43/ton).
2) After 24 years of no increases, and despite major cost reductions by RIRRC, cumulative cost inflation combined with volume decreases have overtaken the $32 rate.
3) Significant infrastructure spending was required to comply with stricter regulatory standards, especially wastewater, which necessitated new debt of $40M in 2013.
4) Commercial fees cannot be increased now without significant volume/revenue risk.
5) Additional solid waste volume reductions can only be partially offset by internal cost reductions due to the high level of fixed cost that cannot be reduced with lower volume.
6) RIRRC’s current cash flow is negative and unsustainable beyond FY2017.
7) Disposal fee increases or new funding sources will be needed beginning in FY2018.

State Guide Plan 171 Draft: September 2014
3 - 3
A fee system is needed that is fair, predictable and promotes diversion from disposal, to best serve Rhode Island’s disposal needs.
Implementing an RIRRC managed statewide Pay as You Throw system will enable and produce the greatest reduction in solid waste through more recycling and greater awareness of trash as a valuable material.
These are the challenges: Just to maintain current operations, increasing municipal fees is necessary, and pursuing environmentally attractive programs that reduce solid waste volumes (and their
corresponding revenues) to extend landfill life will require additional revenues to implement.
The General Assembly has frozen the municipal disposal rate for 24 consecutive years. In the absence of interference, RIRRC has the authority to increase the municipal disposal fee. However, given the long history of legislative involvement, attempts by RIRRC to independently increase the municipal price may meet swift resistance. Even if a rate increase makes it through the legislative process, the increase is likely to be minimal, only able to fund shortfalls in operating cost.
The problem is clear. Without a funding solution, there can be no new RIRRC investments to reduce solid waste generation. The landfill will close in 2038. Municipalities will then pay the much higher
market rates. We must find a predictable and fair fee system that will elevate prices to at least market rates, and promote diversion from disposal in the short run in order to extend landfill life in the longer run for the overall benefit of our primary customers, RI’s cities and towns.
Strategies & Options for Issue #1:
The time has come to change how Rhode Island pays for solid waste management. If the State is to divert more waste from disposal and reduce reliance on commercial waste revenues, the actual cost per ton of disposal should be paid. There are three funding solutions: Issue#1, Option A: Statewide RIRRC Managed Residential Pay As You Throw
PAYT is known by many names, but is essentially a way for the generator of solid waste (the resident) to pay directly for its disposal, through either a special bag, a special tag affixed to an ordinary trash bag, a specially designated cart, or at the scale house of a transfer station or landfill. In RI, most residents “pay” for trash and recycling services through their property taxes. There are no bills sent directly to the home. Collection services are seen, in essence, to be “free”. This perception does not create an incentive to reduce waste and recycle more. However, if the waste generator is required to purchase a special bag (which is the only bag the municipality will collect), or a special tag (without which the municipality will not collect), then waste becomes more valuable, particularly if recycling services continue to be seen as “free”. Nationwide, PAYT has been shown to increase recycling and decrease waste disposed in each community where it has been implemented.
Traditionally, PAYT programs are implemented at the local level and have various pricing mechanisms
and rates. This Plan is recommending instead a bold alternative—one system—statewide and centrally managed by RIRRC. All residents would be required to participate and use a standard refuse bag. Municipalities would be relieved from the burden of paying disposal fees for loads of bagged residential refuse. This program would not only accomplish a statewide standardized user fee system for refuse disposal, but also addresses the system’s financial crisis.

State Guide Plan 171 Draft: September 2014
3 - 4
Issue #1, Option A is the option preferred by RIRRC.
Implementing statewide PAYT would create a single, centrally managed system for residential waste generators to directly pay RIRRC for disposal
costs. Trash would be treated like other utilities whose fees are based on household usage, incentivizing more recycling which would not carry a fee. A uniform bag design would be used by all municipalities for all households. Three bag sizes could be offered with corresponding pricing to encourage maximum recycling and food scrap composting (for example: 8-gal=$0.75 ea, 13-gal=$1.25 ea, 33-gal=$2.00 ea). All municipalities would participate. Cities and towns would immediately realize savings to their trash and recycling budget. Bag revenues, which should average $10 per month per household, would be managed by RIRRC in dedicated accounts for solid waste management and program enhancement, and not be sent to the “black hole” of state or municipal general funds.
This program would significantly increase revenue from municipal solid waste volumes as compared
to the current below cost and below market rates. The fees generated from the bag sales would pay for landfill and recycling operations and programs, with any excess fees handled in two ways-some set aside for needed future solid waste infrastructure investments and some distributed back to municipalities to offset refuse collections costs:
Current Tip Fee System Proposed PAYT
Revenue $10M $30M Operating Costs -15 -15 Available for Recycling Programs, Capital, or Municipal Rebates $-5M $15M Issue #1, Option B: Raise and Maintain Municipal Tip Fees to at Least Commercial Levels and Limit/Minimize Commercial Loading.
Municipal rates would be raised from the current $32/ton to commercial rates ($54/ton in 2014)
or higher to fund operations, incentivize more recycling, and invest in new programs to reduce solid waste volumes. The higher rates, still below-market, would be combined with revenue sharing provisions so that any surplus revenues are returned to municipalities. This would allow municipalities to reap the benefit of lower than market prices longer into the future by reducing landfill loading in the present.
In addition, setting maximum commercial volumes, accompanied by automatic price increases if
this maximum is exceeded would prevent recurrence of a wholesale selloff of landfill space in the event the disposal market returns to pre-2008 volumes. This policy would also help stabilize the private sector regional disposal market by setting RIRRC expectations publically.
Should PAYT not be approved for implementation, RIRRC would support Option B as an
acceptable alternative. While Option B has the potential to reduce solid waste volume by 100,000 to 150,000 tons annually extending landfill life four to five years, this is well below the 12 to 15 years of additional life with a conservative PAYT program.
State Guide Plan 171 Draft: September 2014
3 - 5
RI diverts approximately 25% of its waste from disposal through recycling and composting.
Issue #1, Option C: Continue with Current Structure and Increase Municipal Rate to Cover Shortfalls in
Operating Costs
Under current statutory structure, RIRRC could implement a temporary municipal price increase in accordance with the Administrative Procedures Act. However, even with clear justification by RIRRC, any change would likely be incrementally small and not able to promote waste reduction or be able to fund large capital projects. Increases would need to be sought annually for RIRRC to remain solvent. Such ad hoc fee increases would result in unpredictable pricing and municipal budgeting.
RIRRC does not recommend Issue #1, Option C, as it solves neither the funding issue nor
satisfies the need to extend landfill life.
Issue #2: Reduce Solid Waste Disposal in the Central Landfill
There are several major opportunities to reduce
disposal. Recycling 90% of DEM - approved materials1 would reduce RI’s solid waste disposal by about 25%, or 200,000 tons per year. Other wastes not currently mandated for recycling including food waste and other organics, construction and demolition debris and other goods, and offer opportunities for diversion in the near term. Reaching higher levels of recycling will require public education, local champions, and financial incentives/disincentives.
Municipal programs generally do a good job recycling paper and packaging and yard debris composting, but there is room for improvement. At the household level, recycling and composting can be improved through the implementation of Pay as You Throw, user fees, provision of adequate storage capacity for recycled materials, and more education. Households served by the commercial sector, including multi-unit housing and those with subscription service, tend be less successful at recycling. This is due to the added collection cost and the lack of any coordinated enforcement of recycling mandates. This constituency should be a primary target for capturing additional mixed paper and packaging.
In terms of the commercial sector, the volume of waste deposited in the Central Landfill is principally influenced by price as haulers are free to deposit this waste at the site with the lowest delivered cost. In fact since 2008, over 200,000 tons of commercial solid waste has left Rhode Island to sites in neighboring states. Businesses will recycle when the economics are attractive or when the law dictates. Reducing commercially generated waste should therefore focus on pricing, legislation, and enforcement of existing laws.
1 Primarily paper, packaging, yard debris, and white goods.
State Guide Plan 171 Draft: September 2014
3 - 6
Strategies & Options for Issue #2:
Three broad strategies have been identified for implementation, starting in 2015. These strategies should not be seen as mutually exclusive; indeed components of each may make sense to employ together. Continuing to work towards landfill life extension is practical so as to not potentially lose ground while studying long-term options for solid waste management beyond 2038. Issue #2, Option A: Maintain Status Quo and Increase Municipal Rate only to Cover Operating Costs
Maintain current loading of 750,000 tons/year Seek incremental improvements in existing reduction/recycling programs Make minimal investments in new projects Manage facility to minimize tip fee increases
Under the “Status Quo” strategy, RIRRC would seek an immediate municipal tip fee increase to at
least $45/ton. The Corporation would not take on new major investments in system, policy, or program enhancements. Rather, the state would continue along the current path, loading the landfill at approximately 750,000 tons per year, reaching capacity in or around 2038. Incremental improvements to existing waste reduction and recycling programs could include:
Continue providing technical assistance to RI cities and towns as they seek continual
improvement; Continue providing waste reduction and waste prevention assessment services to businesses,
municipalities, and schools; Continue offering school field trips and public tours of the RIRRC facility and operations; Maintain and update as needed the educational material on RIRRC websites; and Continue providing access to safe disposal of household hazardous waste via the Eco-Depot.
New projects would be evaluated for statewide application, and projects with limited likelihood of
replication by local officials would most likely not be considered. Instead, RIRRC would recommend to local authorities that they seek outside sources of funding for projects not deemed to have statewide appeal.
Under this scenario, RIRRC would minimize tip fee increases by reducing the depth and breadth of
free programs offered. As of 2014, school field trips, public facility tours, and off-site educator presentations are all offered free of charge. This practice would be examined for efficiency and potential to raise revenue. The Eco-Depot program is also offered free of charge to Rhode Island residents, and currently operates over 45 events each year at a cost of nearly $1,000,000. No other state provides the access to HHW disposal that Rhode Island does. The need for such an extensive program would be evaluated.
Issue #2, Option A is not recommended due to its minimal opportunity to extend landfill
life beyond 2038.
State Guide Plan 171 Draft: September 2014
3 - 7
Issue #2, Option B: Invest in New Programs and Policies to Reduce Waste
Implement mandatory statewide Pay As You Throw Consider RIRRC managed statewide residential recycling collection system Continued funding of existing waste reduction and recycling programs Commercial Solid Waste loading reduced up to 200,000 tons via
pricing Increase paper and packaging recycling
Expand Extended Producer Responsibility Increase commercial recycling and begin implementation of food
waste diversion This option involves reducing landfill loading volume approximately
250,000 tons annually, mainly through implementing new programs, pricing out commercial volume, and maximizing results from existing programs.
Along with statewide PAYT, another aggressive alternative for consideration is statewide
RIRRC managed residential recycling collection service for all RI households. Through a competitive bid process, RIRRC would contract with (potentially) multiple vendors for the collection of residential recycling statewide, relieving municipalities of the burden of collecting MRF recyclables.
Municipalities would pay RIRRC a fee per ton for the recyclables collected in their city or town. These fees along with the revenue from the sale of materials from the MRF would, on average, cover the cost of the statewide collection program. This program would improve recovery of residential recycling by standardizing the collection program for all residents, facilitate implementation of best collection practices, ensure that all residents have convenient collection, and reduce overall collection costs through economies of scale in management and consolidated procurement of services. Furthermore, this
arrangement would better instill cooperation and accountability among households, collectors, and the MRF operator to maximize recovery and minimize contamination. This model may also provide a mechanism for expansion to organics collection in the future, whether RIRRC managed or not.
Implementing new diversion or recycling programs will require a study of the content of the waste
stream. The waste characterization study being commissioned by RIRRC in late summer 2014 will guide decisions regarding food waste and organics diversion, waste to energy, and additional recycling needs
and potential for recycling market development. It is anticipated the study will be complete in late 2015 or early 2016.
The results of the study will be critical in determining the feasibility of implementing full-scale food
scrap collection and processing. In June 2014, the RI General Assembly passed legislation requiring commercial food waste segregation and composting within 15 miles of a licensed food composting facility. This legislation incentivizes commercial composters to construct digester facilities and/or traditional compost sites in Rhode Island by creating a steady source of feedstock.
In June 2014, the RI General Assembly enacted legislation
(RIGL 23-18.9-7(15)) that requires large scale commercial food waste generators to segregate and divert their food waste, beginning in January 1, 2016, if they are located within 15 miles of a registered food composting/anaerobic digestion facility. This new law will incentivize commercial composters to construct digester facilities and/or traditional compost sites in Rhode Island by creating a steady source of feedstock.
State Guide Plan 171 Draft: September 2014
3 - 8
EPR laws may provide some financial relief to RIRRC, the state, and cities and towns by requiring manufacturers of targeted products to pay for the responsible disposal or recycling of their product at the
end of its useful life. Examples of existing EPR laws in Rhode Island are mercury thermostats, mercury auto switches, electronic waste, paint, and mattresses. Other products so far identified as having high potential for EPR are carpets, sharps, tires, rigid plastics, and paper and packaging.
Issue #2, Option B is recommended in conjunction with Issue #1, Option A, because with
funding from PAYT this option offers the most opportunity to increase landfill life to 2050 and beyond. Option B funded by PAYT offers the possibility to eliminate all 450,000 tons of commercial volume which would extend landfill life by 75 years to 2090. This action, essentially converting to a municipal-only facility, would need to be carefully considered from both a policy and financial perspective and would require using all of the projected PAYT surpluses to offset revenue losses from the commercial sector. Issue #2, Option C: Become primarily a Municipal Disposal Facility
Reduce commercial solid waste disposal by 250,000 tons through price increases, pushing
volume out of state Preserve landfill capacity for municipalities Municipal Tip Fees remain; PAYT not assumed
The third strategy also has potential for significant gains in landfill life, however the cost paid by
municipalities would be the highest. If all commercial solid waste was eliminated the municipal tip fee would easily exceed $100/ton but would increase landfill life from 25 years to about 75 years, with a closure date of 2090. If a more realistic 250,000 tons annually were shifted to out of state facilities, the municipal rate would have to be raised to over $60/ton and landfill life increases by 12-15 years. By using price increases to discourage most of the commercial volume, the vast majority of landfill capacity would be reserved for the cities and towns. In the long run, this may be the best use of the landfill asset. However, with commercial customers no longer subsidizing the municipal disposal fee, the cities and towns would pay the full, true cost of landfill disposal. Paying the full cost of disposal would lead municipalities to make changes to their local diversion programs and collection system, and would focus decision-makers on improving recycling.
If the Central Landfill became a primarily municipal facility, the cities and towns would more
keenly feel a sense of responsibility to maintain the asset for as long as possible, and presumably would want a louder voice in how the asset was managed. This option would require a change in the structure of the RIRRC Board of Commissioners to become more like a private sector shareholder Board of Commissioners, with municipal representatives holding seats on the Board.
This option, Issue #2, Option C, is not recommended as a doubling or greater of the
municipal tip fee without any offsetting surplus is not considered viable.
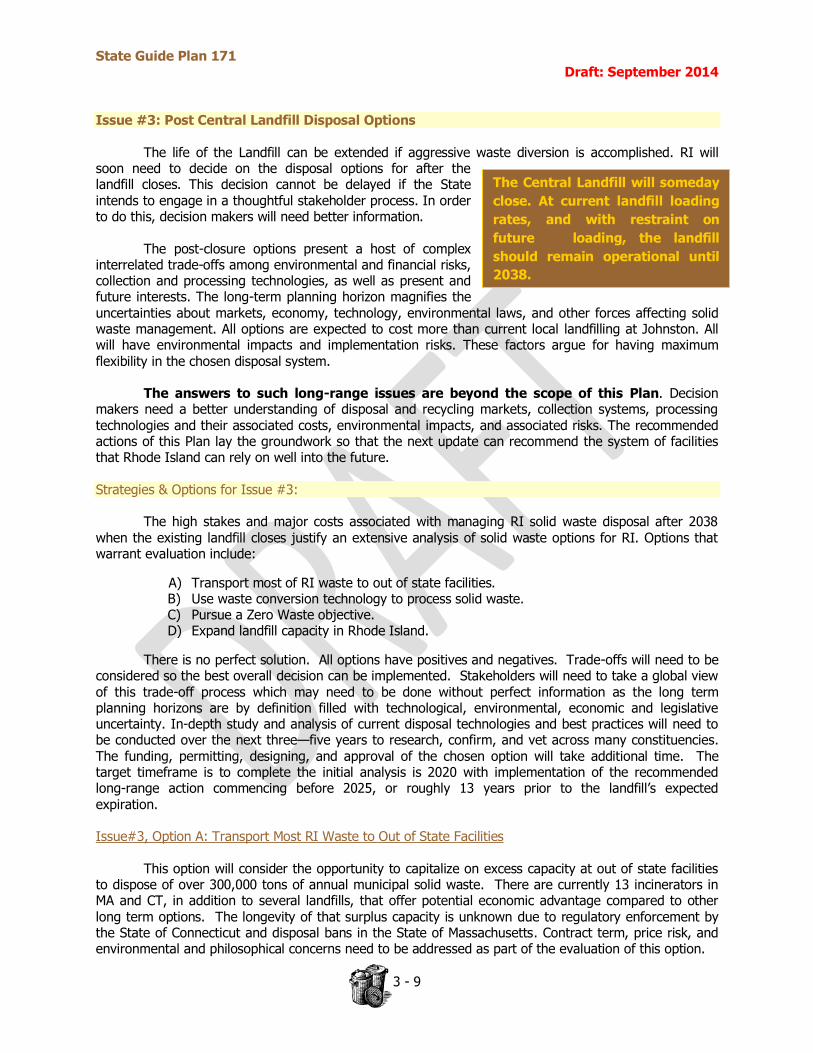
State Guide Plan 171 Draft: September 2014
3 - 9
The Central Landfill will someday
close. At current landfill loading
rates, and with restraint on
future loading, the landfill
should remain operational until
2038.
Issue #3: Post Central Landfill Disposal Options
The life of the Landfill can be extended if aggressive waste diversion is accomplished. RI will soon need to decide on the disposal options for after the landfill closes. This decision cannot be delayed if the State intends to engage in a thoughtful stakeholder process. In order to do this, decision makers will need better information.
The post-closure options present a host of complex interrelated trade-offs among environmental and financial risks, collection and processing technologies, as well as present and future interests. The long-term planning horizon magnifies the uncertainties about markets, economy, technology, environmental laws, and other forces affecting solid waste management. All options are expected to cost more than current local landfilling at Johnston. All will have environmental impacts and implementation risks. These factors argue for having maximum
flexibility in the chosen disposal system.
The answers to such long-range issues are beyond the scope of this Plan. Decision makers need a better understanding of disposal and recycling markets, collection systems, processing technologies and their associated costs, environmental impacts, and associated risks. The recommended actions of this Plan lay the groundwork so that the next update can recommend the system of facilities that Rhode Island can rely on well into the future. Strategies & Options for Issue #3:
The high stakes and major costs associated with managing RI solid waste disposal after 2038 when the existing landfill closes justify an extensive analysis of solid waste options for RI. Options that warrant evaluation include:
A) Transport most of RI waste to out of state facilities. B) Use waste conversion technology to process solid waste. C) Pursue a Zero Waste objective. D) Expand landfill capacity in Rhode Island.
There is no perfect solution. All options have positives and negatives. Trade-offs will need to be considered so the best overall decision can be implemented. Stakeholders will need to take a global view of this trade-off process which may need to be done without perfect information as the long term planning horizons are by definition filled with technological, environmental, economic and legislative uncertainty. In-depth study and analysis of current disposal technologies and best practices will need to be conducted over the next three—five years to research, confirm, and vet across many constituencies. The funding, permitting, designing, and approval of the chosen option will take additional time. The target timeframe is to complete the initial analysis is 2020 with implementation of the recommended long-range action commencing before 2025, or roughly 13 years prior to the landfill’s expected expiration.
Issue#3, Option A: Transport Most RI Waste to Out of State Facilities
This option will consider the opportunity to capitalize on excess capacity at out of state facilities to dispose of over 300,000 tons of annual municipal solid waste. There are currently 13 incinerators in MA and CT, in addition to several landfills, that offer potential economic advantage compared to other long term options. The longevity of that surplus capacity is unknown due to regulatory enforcement by the State of Connecticut and disposal bans in the State of Massachusetts. Contract term, price risk, and environmental and philosophical concerns need to be addressed as part of the evaluation of this option.
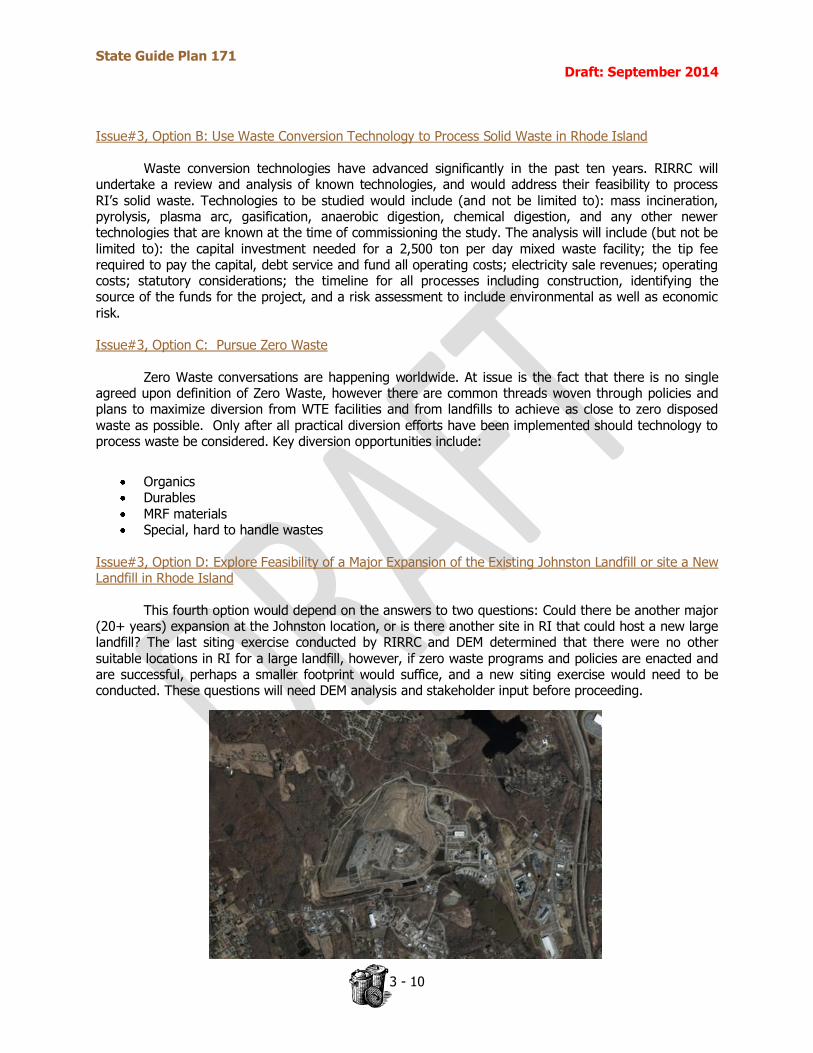
State Guide Plan 171 Draft: September 2014
3 - 10
Issue#3, Option B: Use Waste Conversion Technology to Process Solid Waste in Rhode Island
Waste conversion technologies have advanced significantly in the past ten years. RIRRC will
undertake a review and analysis of known technologies, and would address their feasibility to process RI’s solid waste. Technologies to be studied would include (and not be limited to): mass incineration, pyrolysis, plasma arc, gasification, anaerobic digestion, chemical digestion, and any other newer technologies that are known at the time of commissioning the study. The analysis will include (but not be limited to): the capital investment needed for a 2,500 ton per day mixed waste facility; the tip fee required to pay the capital, debt service and fund all operating costs; electricity sale revenues; operating costs; statutory considerations; the timeline for all processes including construction, identifying the source of the funds for the project, and a risk assessment to include environmental as well as economic risk. Issue#3, Option C: Pursue Zero Waste
Zero Waste conversations are happening worldwide. At issue is the fact that there is no single
agreed upon definition of Zero Waste, however there are common threads woven through policies and plans to maximize diversion from WTE facilities and from landfills to achieve as close to zero disposed waste as possible. Only after all practical diversion efforts have been implemented should technology to process waste be considered. Key diversion opportunities include:
Organics Durables MRF materials Special, hard to handle wastes
Issue#3, Option D: Explore Feasibility of a Major Expansion of the Existing Johnston Landfill or site a New Landfill in Rhode Island
This fourth option would depend on the answers to two questions: Could there be another major (20+ years) expansion at the Johnston location, or is there another site in RI that could host a new large landfill? The last siting exercise conducted by RIRRC and DEM determined that there were no other suitable locations in RI for a large landfill, however, if zero waste programs and policies are enacted and are successful, perhaps a smaller footprint would suffice, and a new siting exercise would need to be conducted. These questions will need DEM analysis and stakeholder input before proceeding.
State Guide Plan 171 Preliminary Draft: September 2014
4-1
Part 4 Recommended Actions
This Solid Waste Management Plan recommends the continuation, with some expansion, of existing efforts to address the immediate needs of reducing the amount of solid waste land filled in Rhode Island. In addition, this Plan recommends some bold alternatives be undertaken.
One is that RIRRC should implement a centrally managed statewide PAYT system for
household managed refuse in order to address both the need to incent residential waste reduction and to fund the system.
A second is that RIRRC should explore the feasibility of a statewide residential recycling collection system in tandem with PAYT in order to collect the maximum amount of recyclables in a cost effective manner.
In terms of the long-range system of facilities for reducing and managing wastes, this Plan calls for significant research and analysis of alternatives be undertaken in the next four years. The goal of this work is to provide the information needed so that the next update of this Plan can recommend the most appropriate path for managing solid wastes once the existing landfill is exhausted.
The specific recommendations, schedule, and responsible parties follow in the Implementation Matrix. Unless otherwise noted, the “Date” in the third column is the target completion date for the Action. The actions are categorized into four “types” and are listed in the next column. The four action types are:
Program (P) Study (S) Regulation (R), and Legislation (L)
Responsible parties are:
RIRRC – Rhode Island Resource Recovery Corporation DEM – Department of Environmental Management, DOP – Division of Planning, and
MUNI – Municipalities
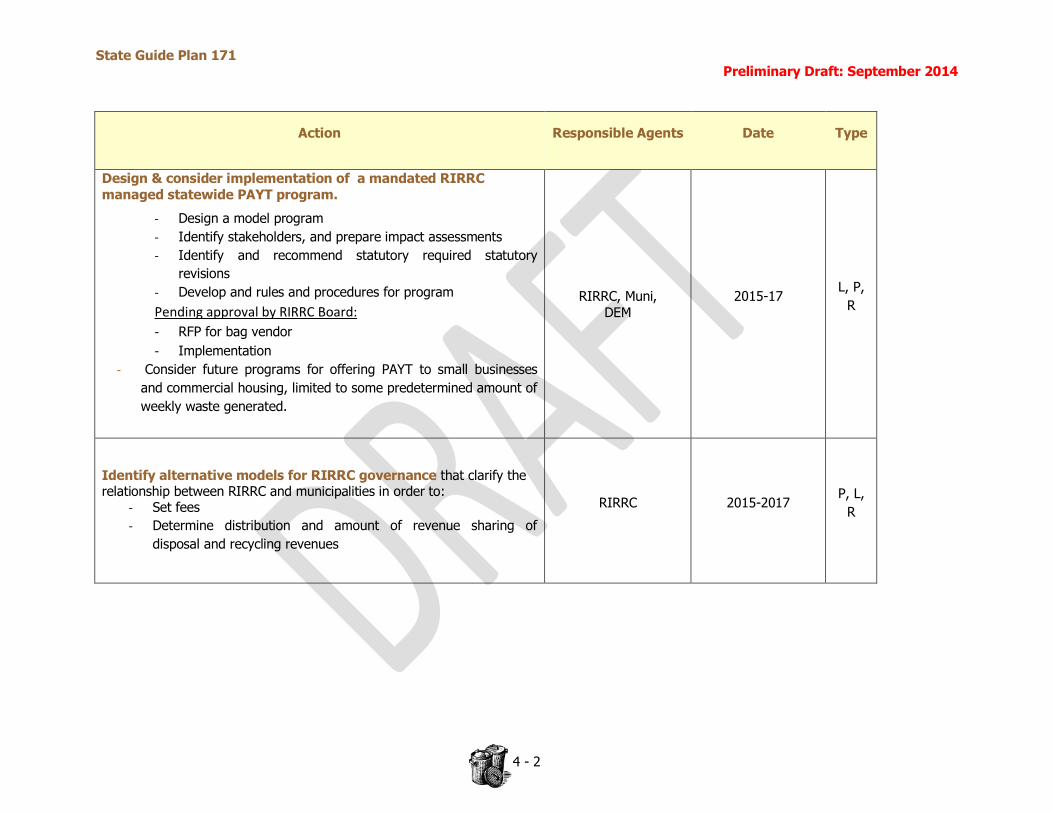
State Guide Plan 171 Preliminary Draft: September 2014
4 - 2
Action Responsible Agents Date Type
Design & consider implementation of a mandated RIRRC managed statewide PAYT program.
- Design a model program
- Identify stakeholders, and prepare impact assessments
- Identify and recommend statutory required statutory
revisions
- Develop and rules and procedures for program
Pending approval by RIRRC Board:
- RFP for bag vendor
- Implementation
- Consider future programs for offering PAYT to small businesses
and commercial housing, limited to some predetermined amount of
weekly waste generated.
RIRRC, Muni, DEM
2015-17 L, P,
R
Identify alternative models for RIRRC governance that clarify the relationship between RIRRC and municipalities in order to:
- Set fees
- Determine distribution and amount of revenue sharing of
disposal and recycling revenues
RIRRC 2015-2017 P, L,
R
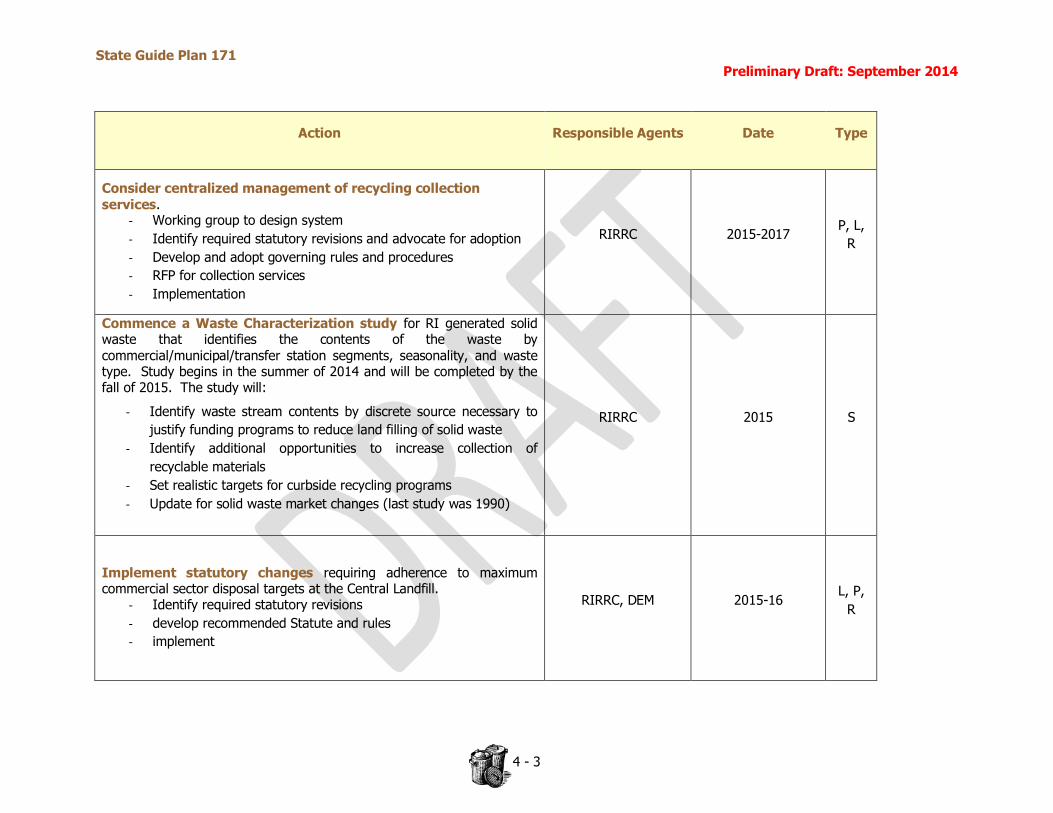
State Guide Plan 171 Preliminary Draft: September 2014
4 - 3
Action Responsible Agents Date Type
Consider centralized management of recycling collection
services. - Working group to design system
- Identify required statutory revisions and advocate for adoption
- Develop and adopt governing rules and procedures
- RFP for collection services
- Implementation
RIRRC 2015-2017 P, L,
R
Commence a Waste Characterization study for RI generated solid waste that identifies the contents of the waste by commercial/municipal/transfer station segments, seasonality, and waste type. Study begins in the summer of 2014 and will be completed by the fall of 2015. The study will:
- Identify waste stream contents by discrete source necessary to
justify funding programs to reduce land filling of solid waste
- Identify additional opportunities to increase collection of
recyclable materials
- Set realistic targets for curbside recycling programs
- Update for solid waste market changes (last study was 1990)
RIRRC 2015 S
Implement statutory changes requiring adherence to maximum commercial sector disposal targets at the Central Landfill.
- Identify required statutory revisions
- develop recommended Statute and rules
- implement
RIRRC, DEM 2015-16 L, P,
R
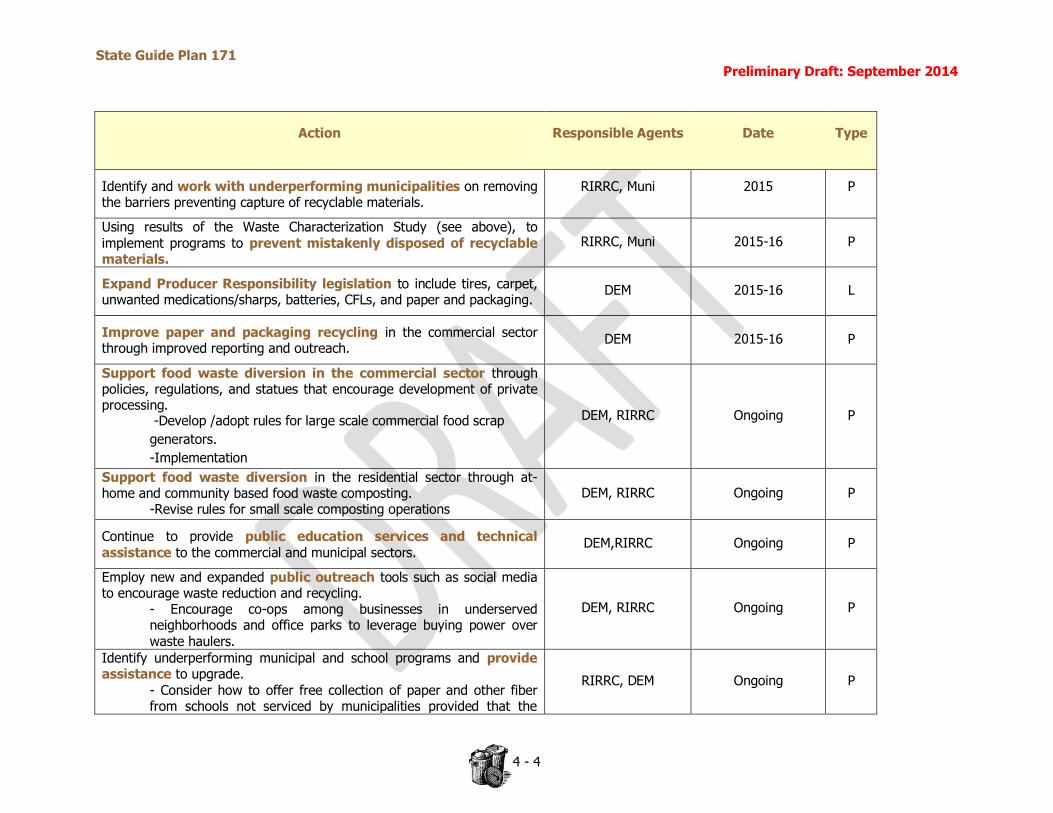
State Guide Plan 171 Preliminary Draft: September 2014
4 - 4
Action Responsible Agents Date Type
Identify and work with underperforming municipalities on removing the barriers preventing capture of recyclable materials.
RIRRC, Muni 2015 P
Using results of the Waste Characterization Study (see above), to implement programs to prevent mistakenly disposed of recyclable materials.
RIRRC, Muni 2015-16 P
Expand Producer Responsibility legislation to include tires, carpet, unwanted medications/sharps, batteries, CFLs, and paper and packaging.
DEM 2015-16 L
Improve paper and packaging recycling in the commercial sector through improved reporting and outreach.
DEM 2015-16 P
Support food waste diversion in the commercial sector through policies, regulations, and statues that encourage development of private processing.
-Develop /adopt rules for large scale commercial food scrap
generators.
-Implementation
DEM, RIRRC Ongoing P
Support food waste diversion in the residential sector through at-home and community based food waste composting.
-Revise rules for small scale composting operations DEM, RIRRC Ongoing P
Continue to provide public education services and technical assistance to the commercial and municipal sectors.
DEM,RIRRC Ongoing P
Employ new and expanded public outreach tools such as social media to encourage waste reduction and recycling.
- Encourage co-ops among businesses in underserved neighborhoods and office parks to leverage buying power over waste haulers.
DEM, RIRRC Ongoing P
Identify underperforming municipal and school programs and provide assistance to upgrade.
- Consider how to offer free collection of paper and other fiber from schools not serviced by municipalities provided that the
RIRRC, DEM Ongoing P
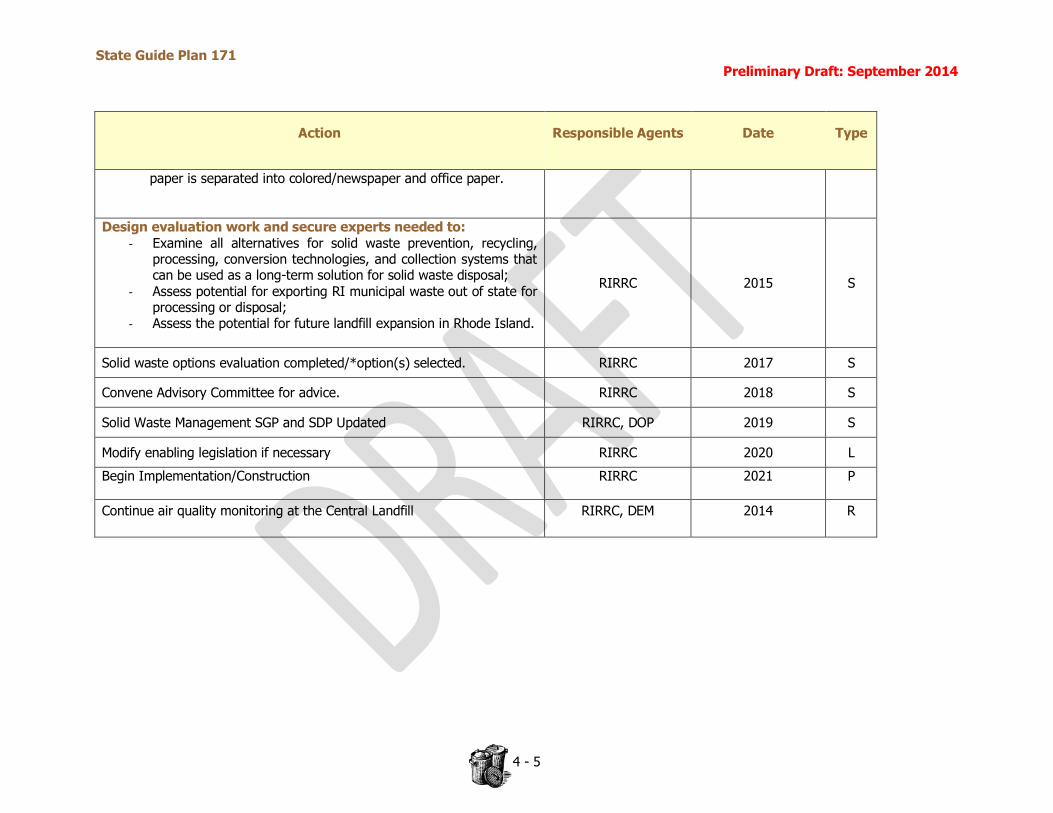
State Guide Plan 171 Preliminary Draft: September 2014
4 - 5
Action Responsible Agents Date Type
paper is separated into colored/newspaper and office paper.
Design evaluation work and secure experts needed to: - Examine all alternatives for solid waste prevention, recycling,
processing, conversion technologies, and collection systems that can be used as a long-term solution for solid waste disposal;
- Assess potential for exporting RI municipal waste out of state for processing or disposal;
- Assess the potential for future landfill expansion in Rhode Island.
RIRRC 2015 S
Solid waste options evaluation completed/*option(s) selected. RIRRC 2017 S
Convene Advisory Committee for advice. RIRRC 2018 S
Solid Waste Management SGP and SDP Updated RIRRC, DOP 2019 S
Modify enabling legislation if necessary RIRRC 2020 L
Begin Implementation/Construction
RIRRC
2021
P
Continue air quality monitoring at the Central Landfill
RIRRC, DEM
2014
R
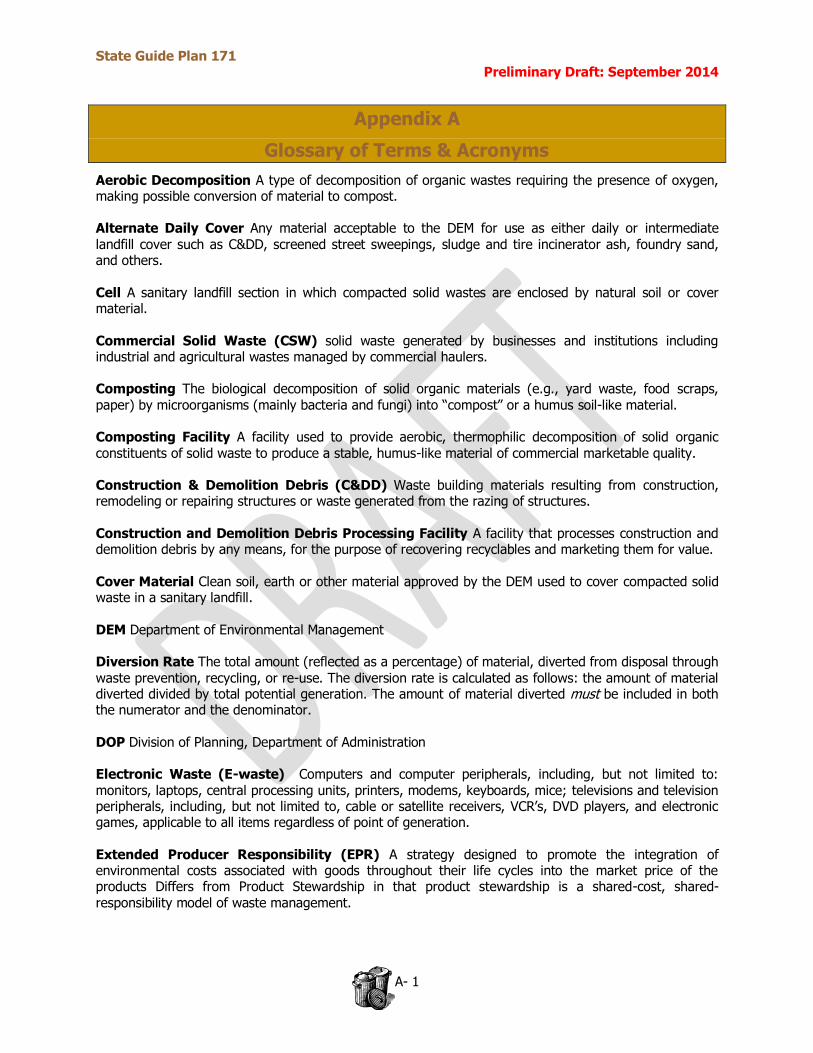
State Guide Plan 171 Preliminary Draft: September 2014
A- 1
Appendix A
Glossary of Terms & Acronyms
Aerobic Decomposition A type of decomposition of organic wastes requiring the presence of oxygen, making possible conversion of material to compost. Alternate Daily Cover Any material acceptable to the DEM for use as either daily or intermediate landfill cover such as C&DD, screened street sweepings, sludge and tire incinerator ash, foundry sand, and others. Cell A sanitary landfill section in which compacted solid wastes are enclosed by natural soil or cover material. Commercial Solid Waste (CSW) solid waste generated by businesses and institutions including industrial and agricultural wastes managed by commercial haulers. Composting The biological decomposition of solid organic materials (e.g., yard waste, food scraps, paper) by microorganisms (mainly bacteria and fungi) into “compost” or a humus soil-like material. Composting Facility A facility used to provide aerobic, thermophilic decomposition of solid organic constituents of solid waste to produce a stable, humus-like material of commercial marketable quality. Construction & Demolition Debris (C&DD) Waste building materials resulting from construction, remodeling or repairing structures or waste generated from the razing of structures. Construction and Demolition Debris Processing Facility A facility that processes construction and demolition debris by any means, for the purpose of recovering recyclables and marketing them for value.
Cover Material Clean soil, earth or other material approved by the DEM used to cover compacted solid waste in a sanitary landfill. DEM Department of Environmental Management Diversion Rate The total amount (reflected as a percentage) of material, diverted from disposal through
waste prevention, recycling, or re-use. The diversion rate is calculated as follows: the amount of material diverted divided by total potential generation. The amount of material diverted must be included in both the numerator and the denominator. DOP Division of Planning, Department of Administration Electronic Waste (E-waste) Computers and computer peripherals, including, but not limited to: monitors, laptops, central processing units, printers, modems, keyboards, mice; televisions and television peripherals, including, but not limited to, cable or satellite receivers, VCR’s, DVD players, and electronic games, applicable to all items regardless of point of generation. Extended Producer Responsibility (EPR) A strategy designed to promote the integration of environmental costs associated with goods throughout their life cycles into the market price of the products Differs from Product Stewardship in that product stewardship is a shared-cost, shared-responsibility model of waste management.
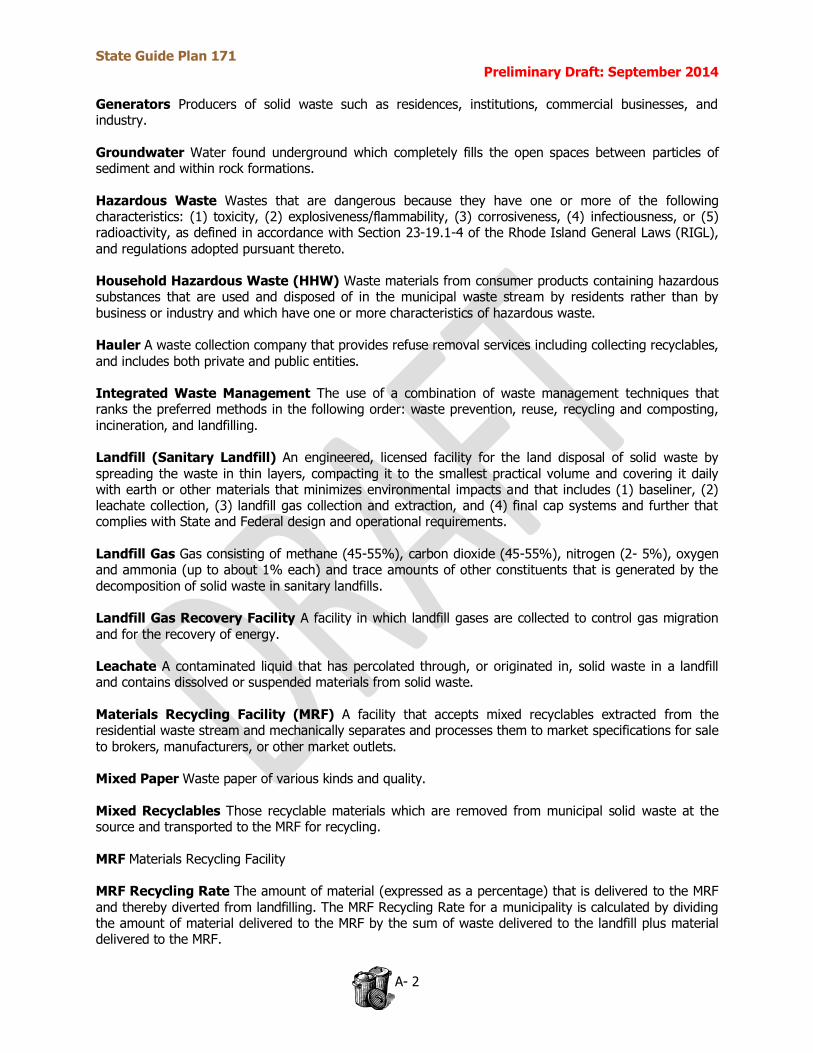
State Guide Plan 171 Preliminary Draft: September 2014
A- 2
Generators Producers of solid waste such as residences, institutions, commercial businesses, and industry.
Groundwater Water found underground which completely fills the open spaces between particles of sediment and within rock formations. Hazardous Waste Wastes that are dangerous because they have one or more of the following characteristics: (1) toxicity, (2) explosiveness/flammability, (3) corrosiveness, (4) infectiousness, or (5) radioactivity, as defined in accordance with Section 23-19.1-4 of the Rhode Island General Laws (RIGL), and regulations adopted pursuant thereto. Household Hazardous Waste (HHW) Waste materials from consumer products containing hazardous substances that are used and disposed of in the municipal waste stream by residents rather than by business or industry and which have one or more characteristics of hazardous waste. Hauler A waste collection company that provides refuse removal services including collecting recyclables,
and includes both private and public entities. Integrated Waste Management The use of a combination of waste management techniques that ranks the preferred methods in the following order: waste prevention, reuse, recycling and composting, incineration, and landfilling. Landfill (Sanitary Landfill) An engineered, licensed facility for the land disposal of solid waste by spreading the waste in thin layers, compacting it to the smallest practical volume and covering it daily with earth or other materials that minimizes environmental impacts and that includes (1) baseliner, (2) leachate collection, (3) landfill gas collection and extraction, and (4) final cap systems and further that complies with State and Federal design and operational requirements. Landfill Gas Gas consisting of methane (45-55%), carbon dioxide (45-55%), nitrogen (2- 5%), oxygen and ammonia (up to about 1% each) and trace amounts of other constituents that is generated by the decomposition of solid waste in sanitary landfills. Landfill Gas Recovery Facility A facility in which landfill gases are collected to control gas migration and for the recovery of energy. Leachate A contaminated liquid that has percolated through, or originated in, solid waste in a landfill and contains dissolved or suspended materials from solid waste. Materials Recycling Facility (MRF) A facility that accepts mixed recyclables extracted from the residential waste stream and mechanically separates and processes them to market specifications for sale to brokers, manufacturers, or other market outlets. Mixed Paper Waste paper of various kinds and quality. Mixed Recyclables Those recyclable materials which are removed from municipal solid waste at the source and transported to the MRF for recycling. MRF Materials Recycling Facility MRF Recycling Rate The amount of material (expressed as a percentage) that is delivered to the MRF and thereby diverted from landfilling. The MRF Recycling Rate for a municipality is calculated by dividing the amount of material delivered to the MRF by the sum of waste delivered to the landfill plus material delivered to the MRF.
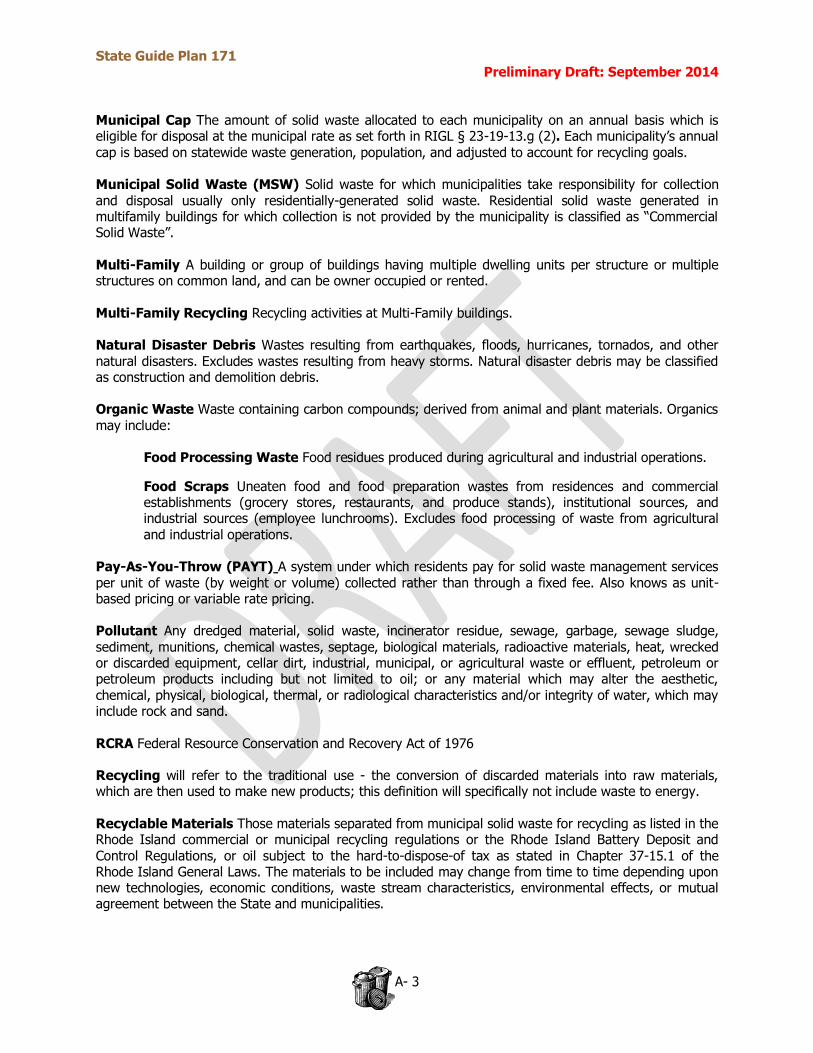
State Guide Plan 171 Preliminary Draft: September 2014
A- 3
Municipal Cap The amount of solid waste allocated to each municipality on an annual basis which is eligible for disposal at the municipal rate as set forth in RIGL § 23-19-13.g (2). Each municipality’s annual
cap is based on statewide waste generation, population, and adjusted to account for recycling goals. Municipal Solid Waste (MSW) Solid waste for which municipalities take responsibility for collection and disposal usually only residentially-generated solid waste. Residential solid waste generated in multifamily buildings for which collection is not provided by the municipality is classified as “Commercial Solid Waste”. Multi-Family A building or group of buildings having multiple dwelling units per structure or multiple structures on common land, and can be owner occupied or rented. Multi-Family Recycling Recycling activities at Multi-Family buildings. Natural Disaster Debris Wastes resulting from earthquakes, floods, hurricanes, tornados, and other
natural disasters. Excludes wastes resulting from heavy storms. Natural disaster debris may be classified as construction and demolition debris. Organic Waste Waste containing carbon compounds; derived from animal and plant materials. Organics may include:
Food Processing Waste Food residues produced during agricultural and industrial operations.
Food Scraps Uneaten food and food preparation wastes from residences and commercial establishments (grocery stores, restaurants, and produce stands), institutional sources, and industrial sources (employee lunchrooms). Excludes food processing of waste from agricultural and industrial operations.
Pay-As-You-Throw (PAYT) A system under which residents pay for solid waste management services per unit of waste (by weight or volume) collected rather than through a fixed fee. Also knows as unit-based pricing or variable rate pricing. Pollutant Any dredged material, solid waste, incinerator residue, sewage, garbage, sewage sludge, sediment, munitions, chemical wastes, septage, biological materials, radioactive materials, heat, wrecked or discarded equipment, cellar dirt, industrial, municipal, or agricultural waste or effluent, petroleum or petroleum products including but not limited to oil; or any material which may alter the aesthetic, chemical, physical, biological, thermal, or radiological characteristics and/or integrity of water, which may include rock and sand. RCRA Federal Resource Conservation and Recovery Act of 1976 Recycling will refer to the traditional use - the conversion of discarded materials into raw materials, which are then used to make new products; this definition will specifically not include waste to energy. Recyclable Materials Those materials separated from municipal solid waste for recycling as listed in the Rhode Island commercial or municipal recycling regulations or the Rhode Island Battery Deposit and Control Regulations, or oil subject to the hard-to-dispose-of tax as stated in Chapter 37-15.1 of the Rhode Island General Laws. The materials to be included may change from time to time depending upon new technologies, economic conditions, waste stream characteristics, environmental effects, or mutual agreement between the State and municipalities.
State Guide Plan 171 Preliminary Draft: September 2014
A- 4
Refuse materials disposed and recycled from both residential and commercial sources but excluding C&DD, sludge, industrial, and agricultural wastes. What is classified by the USEPA as “municipal solid waste”.
Resin The raw material from which plastic products are made. RIRRC Rhode Island Resource Recovery Corporation. SDP Statewide Resource Recovery System Development Plan Septic Waste Any solid, liquid, or semi-solid waste removed from septic tanks or cesspools, lagoons, trucks, or other sources. Sewage Sludge A semi-liquid substance consisting of settled sewage solids combined with water and dissolved materials in varying amounts.
Single Stream Recycling The method of collecting the entire residential recycling stream together in one non-compartmentalized vehicle; Mixed paper and other recyclables are collected together and delivered to the materials recovery facility (MRF) in one “stream.” Special waste Wastes that generated by other than domestic and typical commercial establishments that exist in such an unusual quantity or in such a chemical or physical state that require special handling, transportation and disposal procedures. Solid Waste the entirety of non-hazardous waste materials disposed and recycled by all sources. but does not include solids or dissolved material in domestic sewage or sewage sludge, nor does it include hazardous waste as defined in the Rhode Island Hazardous Waste Management Act, RIGL Chapter 23-19.1. Solid waste shall also include non-hazardous liquid, semi-solid, and containerized gaseous wastes, subject to any special conditions. Solid Waste Management Facility Any plant, structure, equipment, real and personal property, except mobile equipment or incinerators with a capacity of less than one thousand (1,000) pounds per hour, owned or operated for the purpose of processing, treating, or disposing of solid waste. Solid Waste Management Hierarchy Priorities as specified in Section 23- 19-3 of the RI Gen. Laws; “An integrated approach shall be adopted with respect to solid waste management planning and implementation activities that shall be based on the following priorities to the extent economically feasible: (1) Reduction of the amount of source waste generated; (2) Source separation and recycling; (3) Waste processing, such as recycling based technology, to reduce the volume of waste necessary for land disposal; (4) Land disposal.” Also required by federal law. Source Separation Removal by the household of recyclable materials from its waste, placement of such recyclables in and on the set-out container, and conveyance of the container to the designated location for collection. Source Reduction See “Waste Prevention” SPC State Planning Council Tipping Fee Price charged for delivering solid waste or recyclables to the Landfill or MRF, respectively, usually in dollars per ton. TPD Tons Per Day
State Guide Plan 171 Preliminary Draft: September 2014
A- 5
Transfer Station A licensed facility at which solid waste is transferred from collection vehicles to larger trucks or rail cars for longer distance transport.
Waste Diversion The prevention and reduction of generated waste by employing waste reduction, reuse, recycling, and composting techniques and practices. Waste Generation The amount (weight or volume) of materials and products that enter the waste stream before recycling, composting, landfilling, or combustion takes place. Waste Management Actions taken to effectuate the receipt, storage, transportation, processing for resource recovery, recycling, and/or the ultimate disposal of solid waste. Waste Prevention The design, manufacture, purchase, or use of materials or products (including packages) to reduce their amount or toxicity before they enter the solid waste stream. The term “waste prevention” is used here in lieu of “source reduction”. (“Waste prevention” is defined as “source
reduction” in the RI General Laws.) Waste Processing Means by which waste to be landfilled is physically altered to reduce its volume and typically includes compaction, which compresses waste into a smaller volume, and incineration, which reduces waste to ash. Although waste prevention and recycling also reduce the final amount of waste to be landfilled, they are usually considered separate categories from waste processing. Waste Stream The total flow of solid waste from homes, businesses, institutions, and manufacturing plants that must be recycled, incinerated, or disposed of in landfills; or any segment thereof, such as the “residential waste stream” or the “recyclable waste stream.” Waste to Energy Facility (WTE) A facility where recovered solid waste is converted into a usable form of energy, usually through combustion. Wood Waste Lumber, pallets, crates, plywood, particle board, and saw dust, substantially free of contaminants. Contaminants include: lead paint, banding, bolts over 1¼ inch diameter, shingles, pipe, Formica, plastics, and preservatives. Yard Waste Grass, leaves, tree branches and brush, and tree stumps from residential, institutional, and commercial sources such as but not limited to yard trimmings and can be used for compost, mulch, or other similar uses. Zero Waste There is no single agreed upon definition; however there are common threads woven through policies and plans to maximize diversion from waste to energy facilities and from landfills to achieve as close to zero disposed waste in landfills as possible.
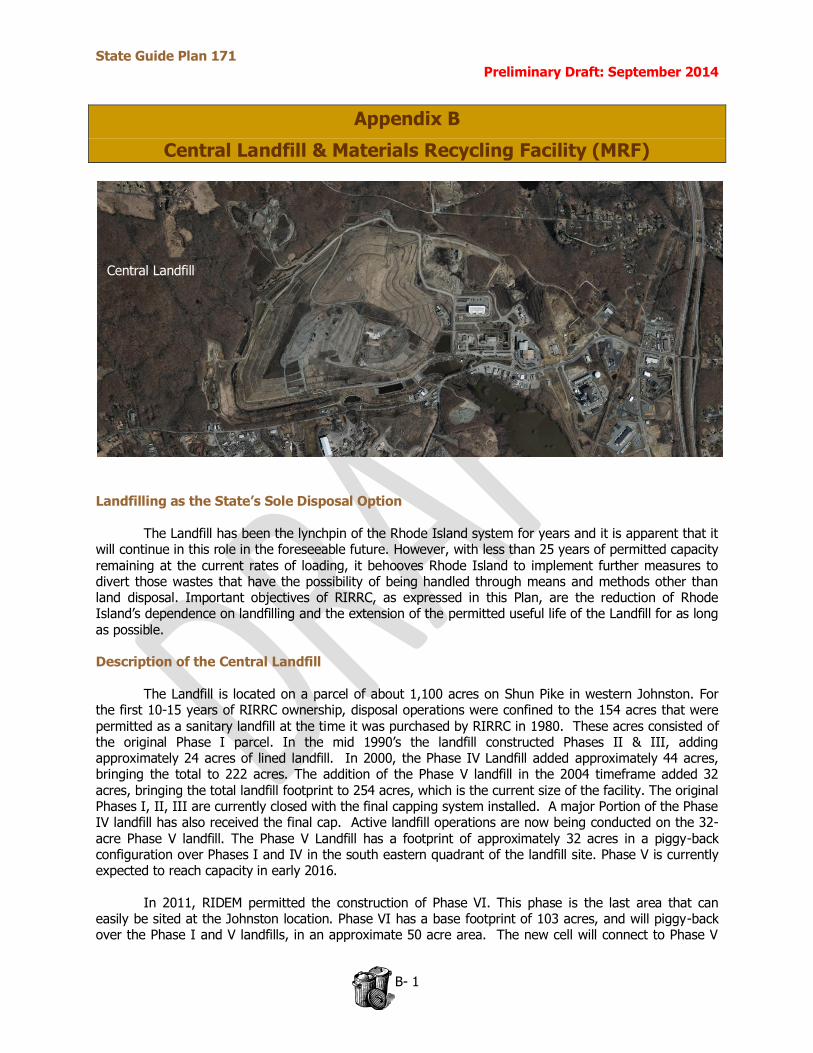
State Guide Plan 171 Preliminary Draft: September 2014
B- 1
Central Landfill
Appendix B
Central Landfill & Materials Recycling Facility (MRF)
Landfilling as the State’s Sole Disposal Option
The Landfill has been the lynchpin of the Rhode Island system for years and it is apparent that it will continue in this role in the foreseeable future. However, with less than 25 years of permitted capacity
remaining at the current rates of loading, it behooves Rhode Island to implement further measures to divert those wastes that have the possibility of being handled through means and methods other than land disposal. Important objectives of RIRRC, as expressed in this Plan, are the reduction of Rhode Island’s dependence on landfilling and the extension of the permitted useful life of the Landfill for as long as possible. Description of the Central Landfill
The Landfill is located on a parcel of about 1,100 acres on Shun Pike in western Johnston. For
the first 10-15 years of RIRRC ownership, disposal operations were confined to the 154 acres that were permitted as a sanitary landfill at the time it was purchased by RIRRC in 1980. These acres consisted of the original Phase I parcel. In the mid 1990’s the landfill constructed Phases II & III, adding approximately 24 acres of lined landfill. In 2000, the Phase IV Landfill added approximately 44 acres, bringing the total to 222 acres. The addition of the Phase V landfill in the 2004 timeframe added 32 acres, bringing the total landfill footprint to 254 acres, which is the current size of the facility. The original Phases I, II, III are currently closed with the final capping system installed. A major Portion of the Phase IV landfill has also received the final cap. Active landfill operations are now being conducted on the 32-acre Phase V landfill. The Phase V Landfill has a footprint of approximately 32 acres in a piggy-back configuration over Phases I and IV in the south eastern quadrant of the landfill site. Phase V is currently expected to reach capacity in early 2016. In 2011, RIDEM permitted the construction of Phase VI. This phase is the last area that can easily be sited at the Johnston location. Phase VI has a base footprint of 103 acres, and will piggy-back over the Phase I and V landfills, in an approximate 50 acre area. The new cell will connect to Phase V
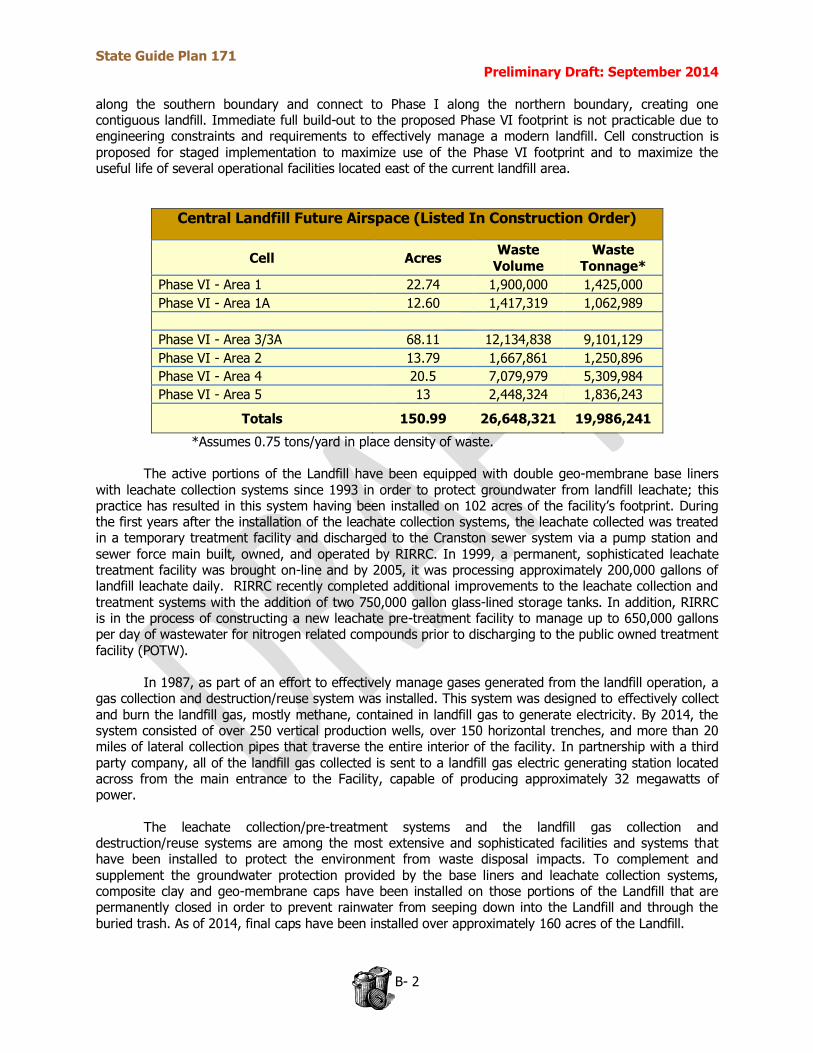
State Guide Plan 171 Preliminary Draft: September 2014
B- 2
along the southern boundary and connect to Phase I along the northern boundary, creating one contiguous landfill. Immediate full build-out to the proposed Phase VI footprint is not practicable due to engineering constraints and requirements to effectively manage a modern landfill. Cell construction is
proposed for staged implementation to maximize use of the Phase VI footprint and to maximize the useful life of several operational facilities located east of the current landfill area.
Central Landfill Future Airspace (Listed In Construction Order)
Cell Acres Waste
Volume
Waste
Tonnage*
Phase VI - Area 1 22.74 1,900,000 1,425,000
Phase VI - Area 1A 12.60 1,417,319 1,062,989
Phase VI - Area 3/3A 68.11 12,134,838 9,101,129
Phase VI - Area 2 13.79 1,667,861 1,250,896
Phase VI - Area 4 20.5 7,079,979 5,309,984
Phase VI - Area 5 13 2,448,324 1,836,243
Totals 150.99 26,648,321 19,986,241
*Assumes 0.75 tons/yard in place density of waste.
The active portions of the Landfill have been equipped with double geo-membrane base liners with leachate collection systems since 1993 in order to protect groundwater from landfill leachate; this practice has resulted in this system having been installed on 102 acres of the facility’s footprint. During the first years after the installation of the leachate collection systems, the leachate collected was treated in a temporary treatment facility and discharged to the Cranston sewer system via a pump station and sewer force main built, owned, and operated by RIRRC. In 1999, a permanent, sophisticated leachate treatment facility was brought on-line and by 2005, it was processing approximately 200,000 gallons of landfill leachate daily. RIRRC recently completed additional improvements to the leachate collection and treatment systems with the addition of two 750,000 gallon glass-lined storage tanks. In addition, RIRRC is in the process of constructing a new leachate pre-treatment facility to manage up to 650,000 gallons per day of wastewater for nitrogen related compounds prior to discharging to the public owned treatment facility (POTW).
In 1987, as part of an effort to effectively manage gases generated from the landfill operation, a gas collection and destruction/reuse system was installed. This system was designed to effectively collect and burn the landfill gas, mostly methane, contained in landfill gas to generate electricity. By 2014, the system consisted of over 250 vertical production wells, over 150 horizontal trenches, and more than 20 miles of lateral collection pipes that traverse the entire interior of the facility. In partnership with a third party company, all of the landfill gas collected is sent to a landfill gas electric generating station located across from the main entrance to the Facility, capable of producing approximately 32 megawatts of power.
The leachate collection/pre-treatment systems and the landfill gas collection and
destruction/reuse systems are among the most extensive and sophisticated facilities and systems that have been installed to protect the environment from waste disposal impacts. To complement and
supplement the groundwater protection provided by the base liners and leachate collection systems, composite clay and geo-membrane caps have been installed on those portions of the Landfill that are permanently closed in order to prevent rainwater from seeping down into the Landfill and through the buried trash. As of 2014, final caps have been installed over approximately 160 acres of the Landfill.
State Guide Plan 171 Preliminary Draft: September 2014
B- 3
A total of more than $150 million has been spent on the various
environmental protection and remediation activities and
programs necessitated by the operation of the Landfill over the
past 35 years.
In order to protect Cedar Swamp Brook and Simmons Upper Reservoir from sediments carried by surface runoff water, eleven sedimentation settlement ponds have been built at an estimated cost of more than $10 million to serve the entire Central Landfill Operations area. Phases IV and V of the Landfill
required the relocation of Cedar Swamp Brook with complete retention of the stream’s riparian integrity at a cost of more than $10 million. The geologic, geophysical, hydraulic, and other geotechnical subsurface investigations completed under the auspices of the EPA and the DEM in connection with the Landfill’s designation as a Superfund site and the remedial activities ordered as a result cost approximately $20 million.
Landfill Loading In the seven years prior to the publication of the initial Plan in 1996, the Landfill disposed an
average of approximately 700,000 tons of solid waste annually with disposal tonnages, slightly higher towards the end of this period (787,000 tons in 1995 and 776,000 tons in 1996). The 1996 Plan projected that, with recycling expected to increase steadily on an annual basis, with the sources of commercial solid waste known and stable, and with the level of municipal and commercial solid waste (CSW) disposal in Rhode Island expected to remain approximately constant, the Landfill would load approximately 750,000 tons annually and the 1996 landfill life projections were calculated on the basis of disposing of 750,000 tons annually.
However, the solid waste disposal situation underwent a number of remarkable changes between 1996 and 1998, changes that very quickly invalidated the landfill life projections made in the 1996 Plan. Most importantly, the commercial waste generated in Rhode Island that had been disposed of in Massachusetts for the previous eight years, began flowing into the Landfill. How significant was this sudden influx of CSW beginning in 1996? Analysis of historical CSW disposal figures at the Landfill and of the commercial solid waste collection industry indicate that between 1988 and 1997, 40 to 60 percent of CSW generated in Rhode Island had been disposed of at Massachusetts facilities depending on the year. In the seven years immediately prior to 1996, 2,322,000 tons of CSW were disposed of at the Landfill, approximately 330,000 tons annually, while in the seven years from 1996 to 2002 inclusively, 3,942,000 tons of CSW were tipped at the Landfill, approximately 563,000 tons annually. Historical data indicate that approximately 900,000 tons of CSW are generated annually in Rhode Island with about 600,000 tons delivered for disposal annually. In other words, 45 percent of the state’s CSW was disposed of in Massachusetts from 1988 through 1995. To put this in a different perspective, from 1996 through 2007 the Landfill has disposed of about 240,000 tons of CSW per year more at the Central Landfill than in the seven-year period prior to 1996, and since the market crash in 2008 (see Figure 5).
Secondly, the levels of recycling that had been anticipated in the 1996 Plan were not realized. As a result, in the eight years preceding 2008, the Central Landfill loaded an average of about 1,075,000 tons annually. In 2008, the national economy began to erode. At the same time, RIRRC began to raise commercial pricing in order to decrease the amount of commercial tons buried in the landfill. By the end of 2008, the economy had crashed. Commercial waste streamed back to MA and CT to feed the incinerators there. Overall disposal volume fell from over one million tons per year to a low of 650,000 tons This series of events unintentionally, but highly effectively, added 10 years of life to the Central Landfill.
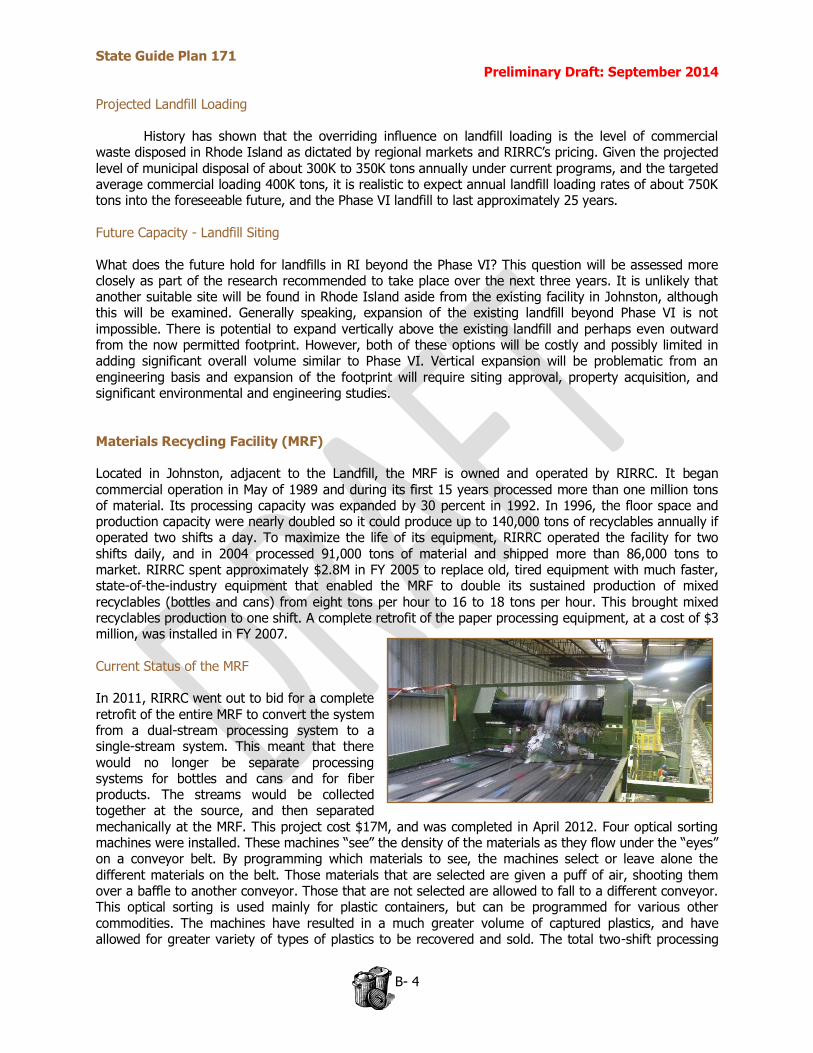
State Guide Plan 171 Preliminary Draft: September 2014
B- 4
Projected Landfill Loading
History has shown that the overriding influence on landfill loading is the level of commercial waste disposed in Rhode Island as dictated by regional markets and RIRRC’s pricing. Given the projected level of municipal disposal of about 300K to 350K tons annually under current programs, and the targeted average commercial loading 400K tons, it is realistic to expect annual landfill loading rates of about 750K tons into the foreseeable future, and the Phase VI landfill to last approximately 25 years.
Future Capacity - Landfill Siting
What does the future hold for landfills in RI beyond the Phase VI? This question will be assessed more closely as part of the research recommended to take place over the next three years. It is unlikely that another suitable site will be found in Rhode Island aside from the existing facility in Johnston, although this will be examined. Generally speaking, expansion of the existing landfill beyond Phase VI is not impossible. There is potential to expand vertically above the existing landfill and perhaps even outward from the now permitted footprint. However, both of these options will be costly and possibly limited in adding significant overall volume similar to Phase VI. Vertical expansion will be problematic from an engineering basis and expansion of the footprint will require siting approval, property acquisition, and significant environmental and engineering studies. Materials Recycling Facility (MRF) Located in Johnston, adjacent to the Landfill, the MRF is owned and operated by RIRRC. It began commercial operation in May of 1989 and during its first 15 years processed more than one million tons of material. Its processing capacity was expanded by 30 percent in 1992. In 1996, the floor space and production capacity were nearly doubled so it could produce up to 140,000 tons of recyclables annually if operated two shifts a day. To maximize the life of its equipment, RIRRC operated the facility for two shifts daily, and in 2004 processed 91,000 tons of material and shipped more than 86,000 tons to market. RIRRC spent approximately $2.8M in FY 2005 to replace old, tired equipment with much faster, state-of-the-industry equipment that enabled the MRF to double its sustained production of mixed recyclables (bottles and cans) from eight tons per hour to 16 to 18 tons per hour. This brought mixed recyclables production to one shift. A complete retrofit of the paper processing equipment, at a cost of $3 million, was installed in FY 2007. Current Status of the MRF In 2011, RIRRC went out to bid for a complete retrofit of the entire MRF to convert the system from a dual-stream processing system to a single-stream system. This meant that there would no longer be separate processing systems for bottles and cans and for fiber products. The streams would be collected together at the source, and then separated mechanically at the MRF. This project cost $17M, and was completed in April 2012. Four optical sorting machines were installed. These machines “see” the density of the materials as they flow under the “eyes” on a conveyor belt. By programming which materials to see, the machines select or leave alone the
different materials on the belt. Those materials that are selected are given a puff of air, shooting them over a baffle to another conveyor. Those that are not selected are allowed to fall to a different conveyor. This optical sorting is used mainly for plastic containers, but can be programmed for various other commodities. The machines have resulted in a much greater volume of captured plastics, and have allowed for greater variety of types of plastics to be recovered and sold. The total two-shift processing
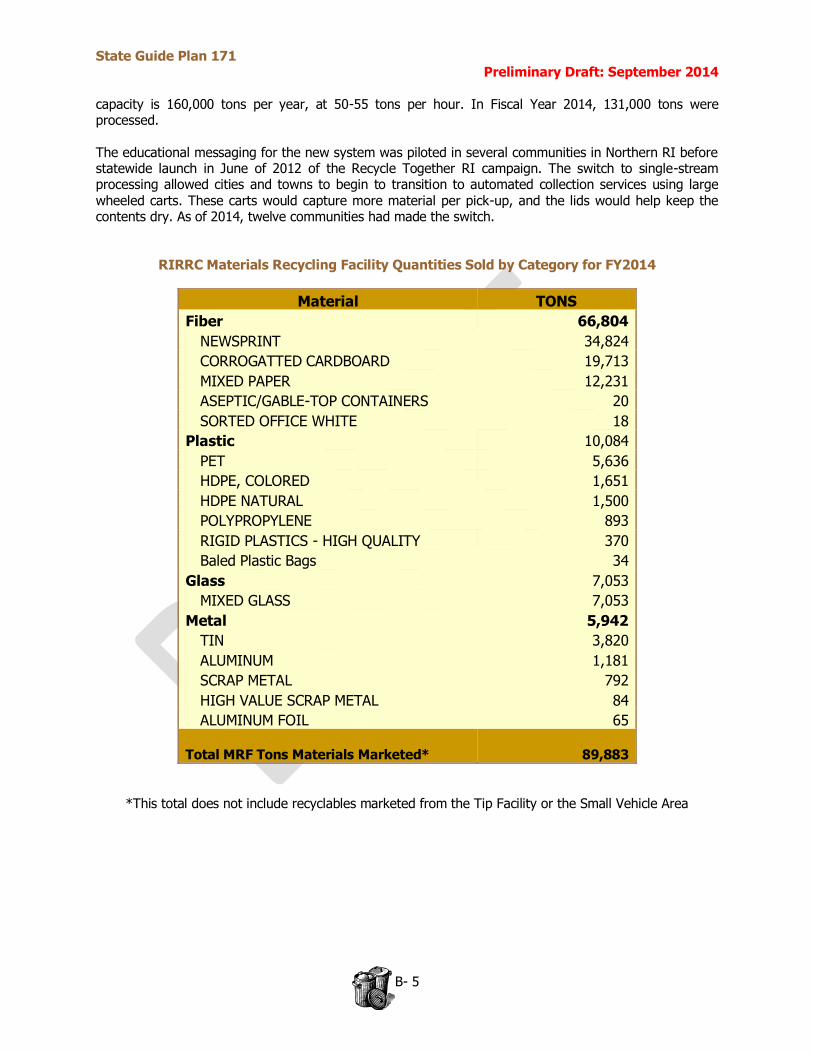
State Guide Plan 171 Preliminary Draft: September 2014
B- 5
capacity is 160,000 tons per year, at 50-55 tons per hour. In Fiscal Year 2014, 131,000 tons were processed.
The educational messaging for the new system was piloted in several communities in Northern RI before statewide launch in June of 2012 of the Recycle Together RI campaign. The switch to single-stream processing allowed cities and towns to begin to transition to automated collection services using large wheeled carts. These carts would capture more material per pick-up, and the lids would help keep the contents dry. As of 2014, twelve communities had made the switch.
RIRRC Materials Recycling Facility Quantities Sold by Category for FY2014
Material TONS
Fiber 66,804
NEWSPRINT 34,824
CORROGATTED CARDBOARD 19,713
MIXED PAPER 12,231
ASEPTIC/GABLE-TOP CONTAINERS 20
SORTED OFFICE WHITE 18
Plastic 10,084
PET 5,636
HDPE, COLORED 1,651
HDPE NATURAL 1,500
POLYPROPYLENE 893
RIGID PLASTICS - HIGH QUALITY 370
Baled Plastic Bags 34
Glass 7,053
MIXED GLASS 7,053
Metal 5,942
TIN 3,820
ALUMINUM 1,181
SCRAP METAL 792
HIGH VALUE SCRAP METAL 84
ALUMINUM FOIL 65
Total MRF Tons Materials Marketed* 89,883
*This total does not include recyclables marketed from the Tip Facility or the Small Vehicle Area
State Guide Plan 171 Preliminary Draft: September 2014
C - 1
Appendix C
Statewide Resource Recovery Development Plan
1. AUTHORITY. The Statewide Resource Recovery System Development Plan (SDP) is required by RIGL §23-19-11(1). 2. PURPOSES. The purposes of the SDP are:
a) to establish, for the purposes of planning by the RIRRC:
1) the annual per capita generation rates for solid waste managed by each municipality;
2) the annual generation of commercial sector solid waste;
3) 20-year projections of the amounts of solid waste within the state that must be managed on
an annual basis out to the 20-year planning horizon based on a range of standard variable
factors, such as, population, and waste generation change rates, taking into account municipal
and commercial recycling and waste prevention rates;
4) indicate the location, type, and size of solid waste management facilities needed for the state’s
integrated solid waste management system, if appropriate and possible;
5) ensure that all aspects of planning, zoning, population estimates, engineering, economics,
need, service area, timing, geography, environmental and health issues are considered in
planning programs or facilities;
6) limit the use of landfills, maximize waste prevention and recycling, include composting of yard
waste and other organics, and pursue the development of new uses for recovered recyclables
to maximize revenue from recycled materials.
3. SUPERSEDES. This Appendix and the data, analyses, methodologies, findings, conclusions, facility and program discussions contained in this State Guide Plan Element supersede the 2007 Statewide Resource Recovery System Development Plan. 4. REFERENCE DATA. All estimates and projections are based on the following sources of data:
RIRRC truck scale transaction weight records;
United States Environmental Protection Agency: Municipal Solid Waste Generation, Recycling, and
Disposal in the United States: Facts and Figures for 2012, February 2014.
Northeast Waste Management Officials’ Association: Municipal Solid Waste (MSW) Interstate Flow
in 2010, January 30, 2013.
Rhode Island Statewide Planning Program Technical Paper 162 Rhode Island Population
Projections 2010 - 2040.
State Guide Plan 171 Preliminary Draft: September 2014
C - 2
5. SYSTEM, PROJECT AND PROGRAM ANALYSES. The system of public and private solid waste facilities is described in Part 2 of this Comprehensive Solid Waste Management Plan, State Guide Plan 171, with further detail on the RIRRC facilities provided in Appendices B and D. Baseline estimates of current generation and the disposition of wastes and recycling are found in the SWMP Table 1. RI Solid Waste Materials Managed; and Table C1 below provide the latest annual waste generation, recycling, composting and disposal for each municipality.
6. FINDINGS/CONCLUSIONS. See Parts 3, Issues, and 4, Recommended Actions, of the Plan.
7. EFFECTIVE DATE. Effective_________2015

State Guide Plan 171 Preliminary Draft: August 2014
C- 3
Table C1. Waste Generation Disposal and Recycling by Rhode Island Municipality in Calendar Year 2013
State Guide Plan 171 Preliminary Draft: September 2014
D- 1
Appendix D
Rhode Island Resource Recovery Corporation
Background Information
About RIRRC: The Rhode Island Resource Recovery Corporation is a quasi-public agency created by the Rhode Island General Assembly in 1974. By “quasi-public” we mean we were created by the state to do the state’s work, but we are not a department in the government and are not dependent on government financing. We have our own budget and bylaws. We are not state employees. RIRRC handles most of the state’s trash and recycling from the cities and towns; except for the town of Tiverton (who
has their own landfill) and some RI businesses. Our mission is to provide safe, environmentally compliant, and affordable solid waste and recycling services for the Rhode Island community. We only accept RI waste here, but even still we won’t be open forever. The landfill is a finite resource. Education: We have a long history of public education and outreach programming: MaxMan (RI’s recycling superhero!) appearances, classroom presentations, tabling at fairs and festivals, high school senior project support and mentoring, and facility tours. We are dedicated to extending the life of the landfill by teaching Rhode Islanders about the 4 Rs: Reducing resource consumption, Reusing resources as much as possible, maximizing what we Recycle, and letting organic waste Rot back into rich compost for our soils.
Municipal programs: Each city and town has unique trash/recycling collection procedures. The Department of Public Works is most often the local contact for trash and recycling. The RI General Assembly has mandated that cities and towns reach a recycling rate of 35% and a diversion rate of 50% by 2012. Different states measure recycling and diversion rates in different ways. The way in which a state defines “recyclables” determines what materials are in or out of the equations. At the present time, RI municipalities use the following when referring to the goals: Mandatory Recycling Rate = weight of recycling bin contents + leaf and yard debris + scrap metal + clothing the above numerator + refuse
Diversion Rate = weight of recycling bin contents + all other materials NOT sent to landfill
the above numerator + refuse
Hours: We’re open to accept trash & recycling M-F from 6am-3:45pm, and Saturdays from 6am-12pm. Our offices stay open until 4:30 Monday-Friday. Daily Traffic: Every day 350-450 trucks bring waste to the landfill and 85-90 bring recycling to the Materials Recycling Facility (we say “MRF” for short and pronounce it “murf”).
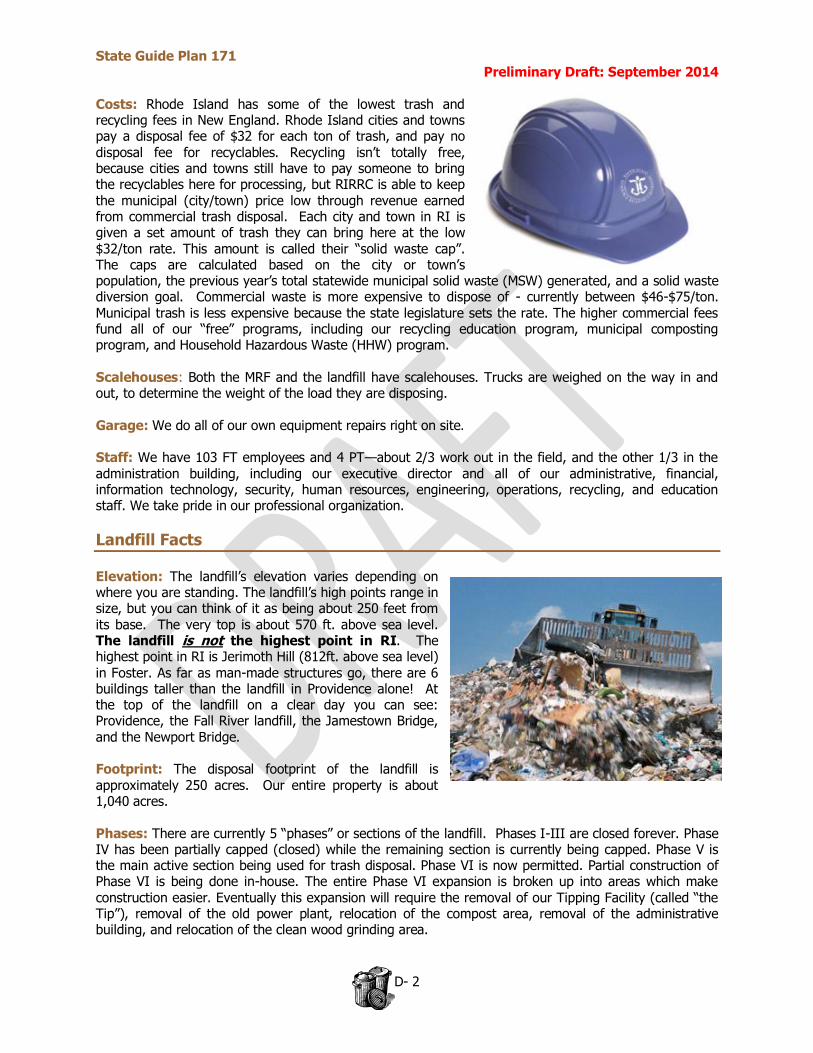
State Guide Plan 171 Preliminary Draft: September 2014
D- 2
Costs: Rhode Island has some of the lowest trash and recycling fees in New England. Rhode Island cities and towns pay a disposal fee of $32 for each ton of trash, and pay no
disposal fee for recyclables. Recycling isn’t totally free, because cities and towns still have to pay someone to bring the recyclables here for processing, but RIRRC is able to keep the municipal (city/town) price low through revenue earned from commercial trash disposal. Each city and town in RI is given a set amount of trash they can bring here at the low $32/ton rate. This amount is called their “solid waste cap”. The caps are calculated based on the city or town’s population, the previous year’s total statewide municipal solid waste (MSW) generated, and a solid waste diversion goal. Commercial waste is more expensive to dispose of - currently between $46-$75/ton. Municipal trash is less expensive because the state legislature sets the rate. The higher commercial fees fund all of our “free” programs, including our recycling education program, municipal composting program, and Household Hazardous Waste (HHW) program.
Scalehouses: Both the MRF and the landfill have scalehouses. Trucks are weighed on the way in and out, to determine the weight of the load they are disposing. Garage: We do all of our own equipment repairs right on site. Staff: We have 103 FT employees and 4 PT—about 2/3 work out in the field, and the other 1/3 in the administration building, including our executive director and all of our administrative, financial, information technology, security, human resources, engineering, operations, recycling, and education staff. We take pride in our professional organization.
Landfill Facts
Elevation: The landfill’s elevation varies depending on where you are standing. The landfill’s high points range in size, but you can think of it as being about 250 feet from its base. The very top is about 570 ft. above sea level. The landfill is not the highest point in RI. The highest point in RI is Jerimoth Hill (812ft. above sea level)
in Foster. As far as man-made structures go, there are 6 buildings taller than the landfill in Providence alone! At the top of the landfill on a clear day you can see: Providence, the Fall River landfill, the Jamestown Bridge, and the Newport Bridge. Footprint: The disposal footprint of the landfill is approximately 250 acres. Our entire property is about 1,040 acres.
Phases: There are currently 5 “phases” or sections of the landfill. Phases I-III are closed forever. Phase IV has been partially capped (closed) while the remaining section is currently being capped. Phase V is the main active section being used for trash disposal. Phase VI is now permitted. Partial construction of Phase VI is being done in-house. The entire Phase VI expansion is broken up into areas which make construction easier. Eventually this expansion will require the removal of our Tipping Facility (called “the Tip”), removal of the old power plant, relocation of the compost area, removal of the administrative building, and relocation of the clean wood grinding area.
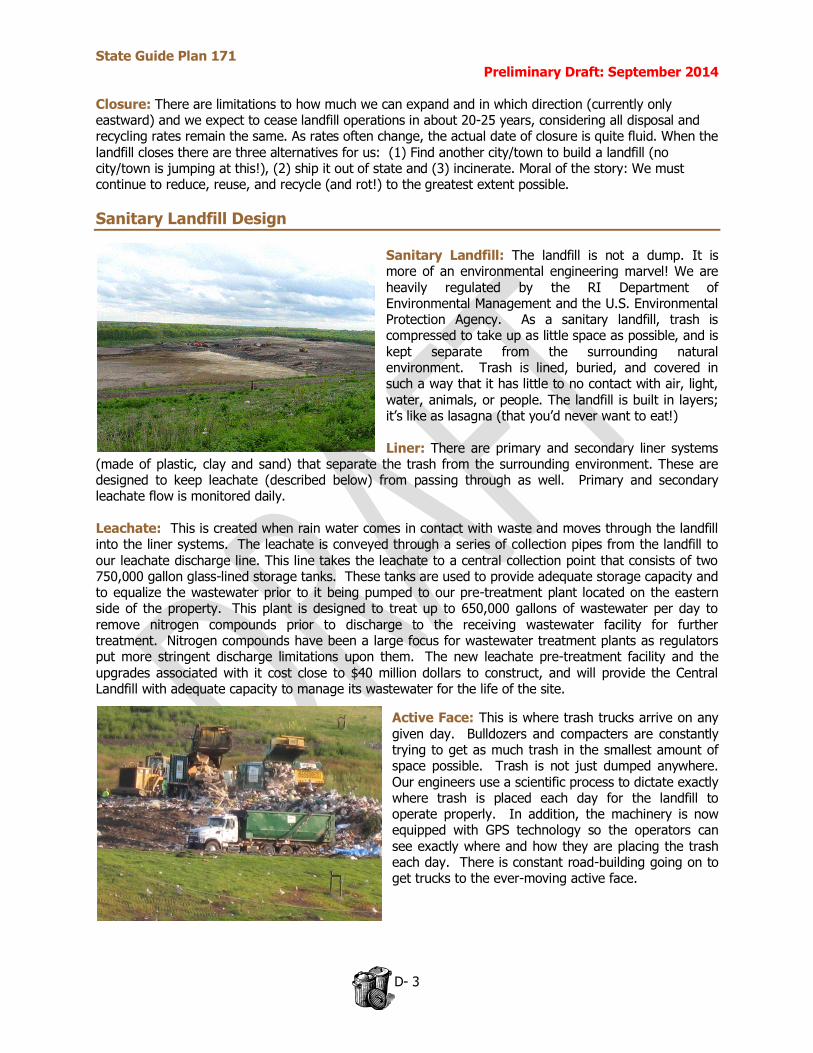
State Guide Plan 171 Preliminary Draft: September 2014
D- 3
Closure: There are limitations to how much we can expand and in which direction (currently only eastward) and we expect to cease landfill operations in about 20-25 years, considering all disposal and recycling rates remain the same. As rates often change, the actual date of closure is quite fluid. When the
landfill closes there are three alternatives for us: (1) Find another city/town to build a landfill (no city/town is jumping at this!), (2) ship it out of state and (3) incinerate. Moral of the story: We must continue to reduce, reuse, and recycle (and rot!) to the greatest extent possible.
Sanitary Landfill Design
Sanitary Landfill: The landfill is not a dump. It is more of an environmental engineering marvel! We are heavily regulated by the RI Department of Environmental Management and the U.S. Environmental Protection Agency. As a sanitary landfill, trash is compressed to take up as little space as possible, and is kept separate from the surrounding natural environment. Trash is lined, buried, and covered in such a way that it has little to no contact with air, light, water, animals, or people. The landfill is built in layers; it’s like as lasagna (that you’d never want to eat!) Liner: There are primary and secondary liner systems
(made of plastic, clay and sand) that separate the trash from the surrounding environment. These are designed to keep leachate (described below) from passing through as well. Primary and secondary leachate flow is monitored daily. Leachate: This is created when rain water comes in contact with waste and moves through the landfill into the liner systems. The leachate is conveyed through a series of collection pipes from the landfill to
our leachate discharge line. This line takes the leachate to a central collection point that consists of two 750,000 gallon glass-lined storage tanks. These tanks are used to provide adequate storage capacity and to equalize the wastewater prior to it being pumped to our pre-treatment plant located on the eastern side of the property. This plant is designed to treat up to 650,000 gallons of wastewater per day to remove nitrogen compounds prior to discharge to the receiving wastewater facility for further treatment. Nitrogen compounds have been a large focus for wastewater treatment plants as regulators put more stringent discharge limitations upon them. The new leachate pre-treatment facility and the
upgrades associated with it cost close to $40 million dollars to construct, and will provide the Central Landfill with adequate capacity to manage its wastewater for the life of the site.
Active Face: This is where trash trucks arrive on any given day. Bulldozers and compacters are constantly trying to get as much trash in the smallest amount of space possible. Trash is not just dumped anywhere. Our engineers use a scientific process to dictate exactly where trash is placed each day for the landfill to operate properly. In addition, the machinery is now equipped with GPS technology so the operators can see exactly where and how they are placing the trash each day. There is constant road-building going on to get trucks to the ever-moving active face.
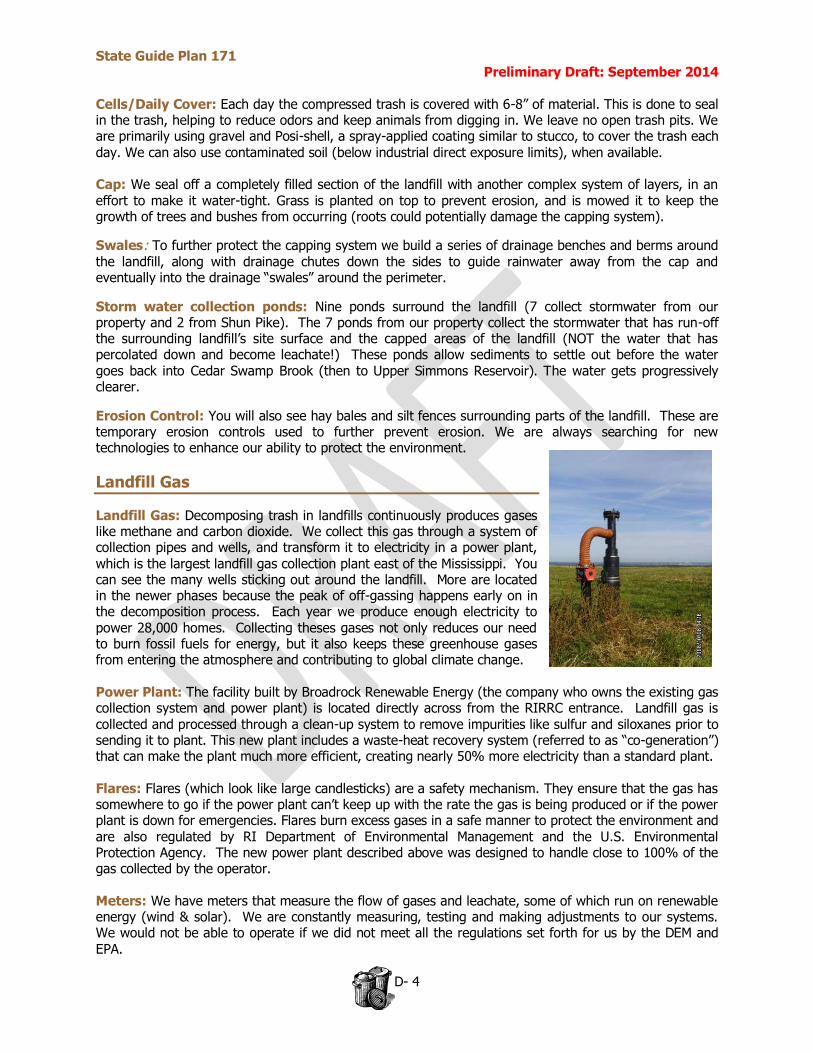
State Guide Plan 171 Preliminary Draft: September 2014
D- 4
Cells/Daily Cover: Each day the compressed trash is covered with 6-8” of material. This is done to seal in the trash, helping to reduce odors and keep animals from digging in. We leave no open trash pits. We are primarily using gravel and Posi-shell, a spray-applied coating similar to stucco, to cover the trash each
day. We can also use contaminated soil (below industrial direct exposure limits), when available. Cap: We seal off a completely filled section of the landfill with another complex system of layers, in an effort to make it water-tight. Grass is planted on top to prevent erosion, and is mowed it to keep the growth of trees and bushes from occurring (roots could potentially damage the capping system).
Swales: To further protect the capping system we build a series of drainage benches and berms around
the landfill, along with drainage chutes down the sides to guide rainwater away from the cap and eventually into the drainage “swales” around the perimeter.
Storm water collection ponds: Nine ponds surround the landfill (7 collect stormwater from our property and 2 from Shun Pike). The 7 ponds from our property collect the stormwater that has run-off the surrounding landfill’s site surface and the capped areas of the landfill (NOT the water that has percolated down and become leachate!) These ponds allow sediments to settle out before the water goes back into Cedar Swamp Brook (then to Upper Simmons Reservoir). The water gets progressively clearer.
Erosion Control: You will also see hay bales and silt fences surrounding parts of the landfill. These are temporary erosion controls used to further prevent erosion. We are always searching for new technologies to enhance our ability to protect the environment.
Landfill Gas
Landfill Gas: Decomposing trash in landfills continuously produces gases like methane and carbon dioxide. We collect this gas through a system of collection pipes and wells, and transform it to electricity in a power plant,
which is the largest landfill gas collection plant east of the Mississippi. You can see the many wells sticking out around the landfill. More are located in the newer phases because the peak of off-gassing happens early on in the decomposition process. Each year we produce enough electricity to power 28,000 homes. Collecting theses gases not only reduces our need to burn fossil fuels for energy, but it also keeps these greenhouse gases from entering the atmosphere and contributing to global climate change.
Power Plant: The facility built by Broadrock Renewable Energy (the company who owns the existing gas collection system and power plant) is located directly across from the RIRRC entrance. Landfill gas is collected and processed through a clean-up system to remove impurities like sulfur and siloxanes prior to sending it to plant. This new plant includes a waste-heat recovery system (referred to as “co-generation”) that can make the plant much more efficient, creating nearly 50% more electricity than a standard plant. Flares: Flares (which look like large candlesticks) are a safety mechanism. They ensure that the gas has somewhere to go if the power plant can’t keep up with the rate the gas is being produced or if the power plant is down for emergencies. Flares burn excess gases in a safe manner to protect the environment and are also regulated by RI Department of Environmental Management and the U.S. Environmental Protection Agency. The new power plant described above was designed to handle close to 100% of the gas collected by the operator. Meters: We have meters that measure the flow of gases and leachate, some of which run on renewable energy (wind & solar). We are constantly measuring, testing and making adjustments to our systems. We would not be able to operate if we did not meet all the regulations set forth for us by the DEM and EPA.
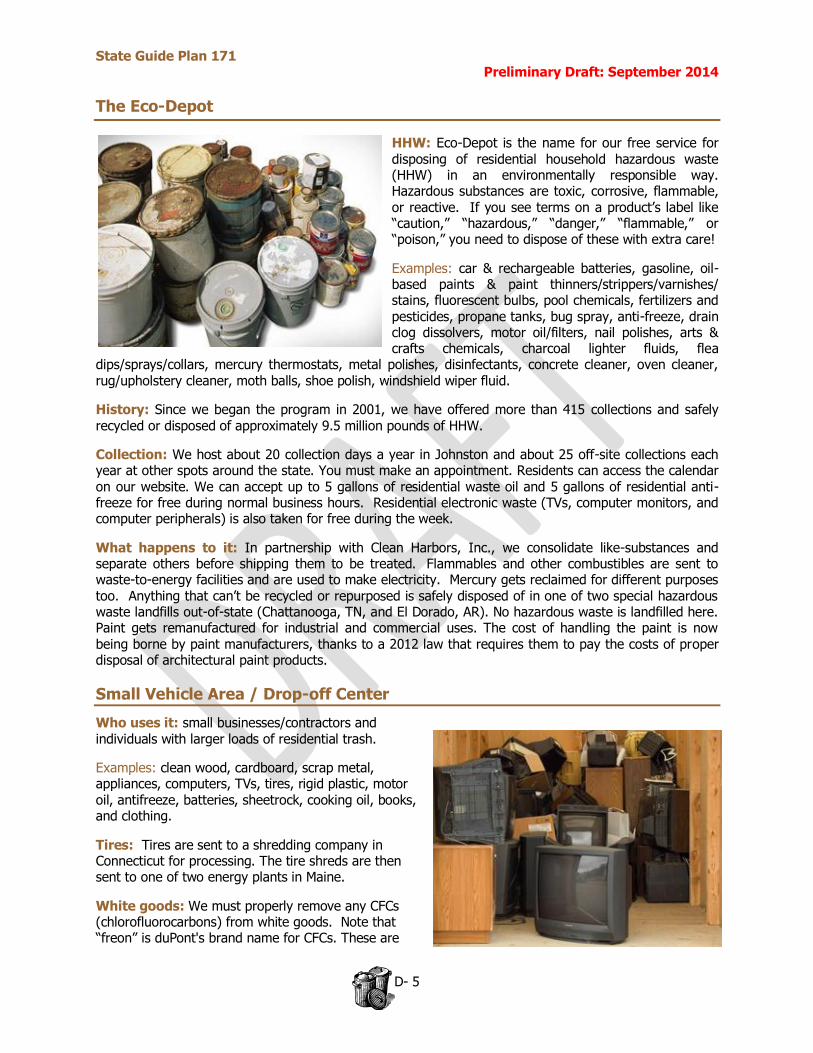
State Guide Plan 171 Preliminary Draft: September 2014
D- 5
The Eco-Depot
HHW: Eco-Depot is the name for our free service for
disposing of residential household hazardous waste (HHW) in an environmentally responsible way. Hazardous substances are toxic, corrosive, flammable, or reactive. If you see terms on a product’s label like “caution,” “hazardous,” “danger,” “flammable,” or “poison,” you need to dispose of these with extra care!
Examples: car & rechargeable batteries, gasoline, oil-based paints & paint thinners/strippers/varnishes/ stains, fluorescent bulbs, pool chemicals, fertilizers and pesticides, propane tanks, bug spray, anti-freeze, drain clog dissolvers, motor oil/filters, nail polishes, arts & crafts chemicals, charcoal lighter fluids, flea
dips/sprays/collars, mercury thermostats, metal polishes, disinfectants, concrete cleaner, oven cleaner, rug/upholstery cleaner, moth balls, shoe polish, windshield wiper fluid.
History: Since we began the program in 2001, we have offered more than 415 collections and safely recycled or disposed of approximately 9.5 million pounds of HHW.
Collection: We host about 20 collection days a year in Johnston and about 25 off-site collections each year at other spots around the state. You must make an appointment. Residents can access the calendar on our website. We can accept up to 5 gallons of residential waste oil and 5 gallons of residential anti-freeze for free during normal business hours. Residential electronic waste (TVs, computer monitors, and computer peripherals) is also taken for free during the week.
What happens to it: In partnership with Clean Harbors, Inc., we consolidate like-substances and separate others before shipping them to be treated. Flammables and other combustibles are sent to waste-to-energy facilities and are used to make electricity. Mercury gets reclaimed for different purposes too. Anything that can’t be recycled or repurposed is safely disposed of in one of two special hazardous waste landfills out-of-state (Chattanooga, TN, and El Dorado, AR). No hazardous waste is landfilled here. Paint gets remanufactured for industrial and commercial uses. The cost of handling the paint is now being borne by paint manufacturers, thanks to a 2012 law that requires them to pay the costs of proper disposal of architectural paint products.
Small Vehicle Area / Drop-off Center
Who uses it: small businesses/contractors and individuals with larger loads of residential trash.
Examples: clean wood, cardboard, scrap metal, appliances, computers, TVs, tires, rigid plastic, motor oil, antifreeze, batteries, sheetrock, cooking oil, books, and clothing.
Tires: Tires are sent to a shredding company in Connecticut for processing. The tire shreds are then sent to one of two energy plants in Maine.
White goods: We must properly remove any CFCs (chlorofluorocarbons) from white goods. Note that “freon” is duPont's brand name for CFCs. These are
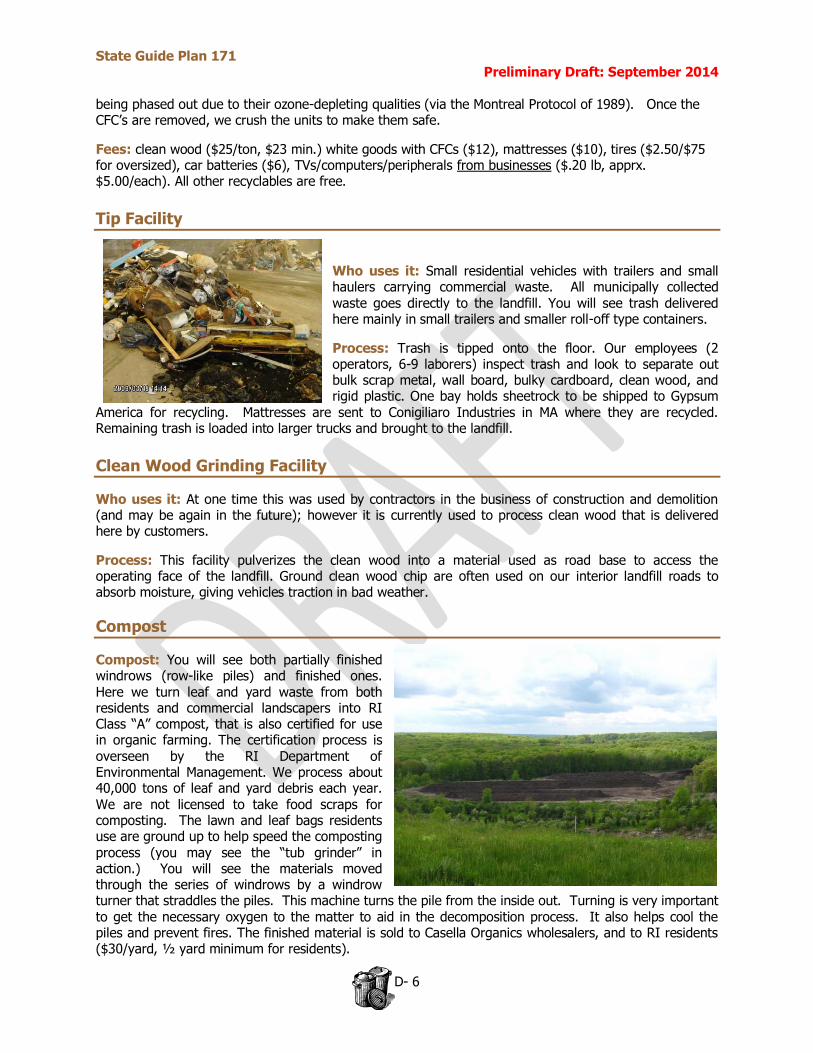
State Guide Plan 171 Preliminary Draft: September 2014
D- 6
being phased out due to their ozone-depleting qualities (via the Montreal Protocol of 1989). Once the CFC’s are removed, we crush the units to make them safe.
Fees: clean wood ($25/ton, $23 min.) white goods with CFCs ($12), mattresses ($10), tires ($2.50/$75 for oversized), car batteries ($6), TVs/computers/peripherals from businesses ($.20 lb, apprx. $5.00/each). All other recyclables are free.
Tip Facility
Who uses it: Small residential vehicles with trailers and small haulers carrying commercial waste. All municipally collected waste goes directly to the landfill. You will see trash delivered here mainly in small trailers and smaller roll-off type containers.
Process: Trash is tipped onto the floor. Our employees (2 operators, 6-9 laborers) inspect trash and look to separate out bulk scrap metal, wall board, bulky cardboard, clean wood, and rigid plastic. One bay holds sheetrock to be shipped to Gypsum
America for recycling. Mattresses are sent to Conigiliaro Industries in MA where they are recycled. Remaining trash is loaded into larger trucks and brought to the landfill.
Clean Wood Grinding Facility
Who uses it: At one time this was used by contractors in the business of construction and demolition (and may be again in the future); however it is currently used to process clean wood that is delivered here by customers.
Process: This facility pulverizes the clean wood into a material used as road base to access the operating face of the landfill. Ground clean wood chip are often used on our interior landfill roads to absorb moisture, giving vehicles traction in bad weather.
Compost
Compost: You will see both partially finished windrows (row-like piles) and finished ones. Here we turn leaf and yard waste from both residents and commercial landscapers into RI Class “A” compost, that is also certified for use in organic farming. The certification process is overseen by the RI Department of Environmental Management. We process about 40,000 tons of leaf and yard debris each year. We are not licensed to take food scraps for composting. The lawn and leaf bags residents use are ground up to help speed the composting process (you may see the “tub grinder” in action.) You will see the materials moved through the series of windrows by a windrow turner that straddles the piles. This machine turns the pile from the inside out. Turning is very important to get the necessary oxygen to the matter to aid in the decomposition process. It also helps cool the piles and prevent fires. The finished material is sold to Casella Organics wholesalers, and to RI residents ($30/yard, ½ yard minimum for residents).
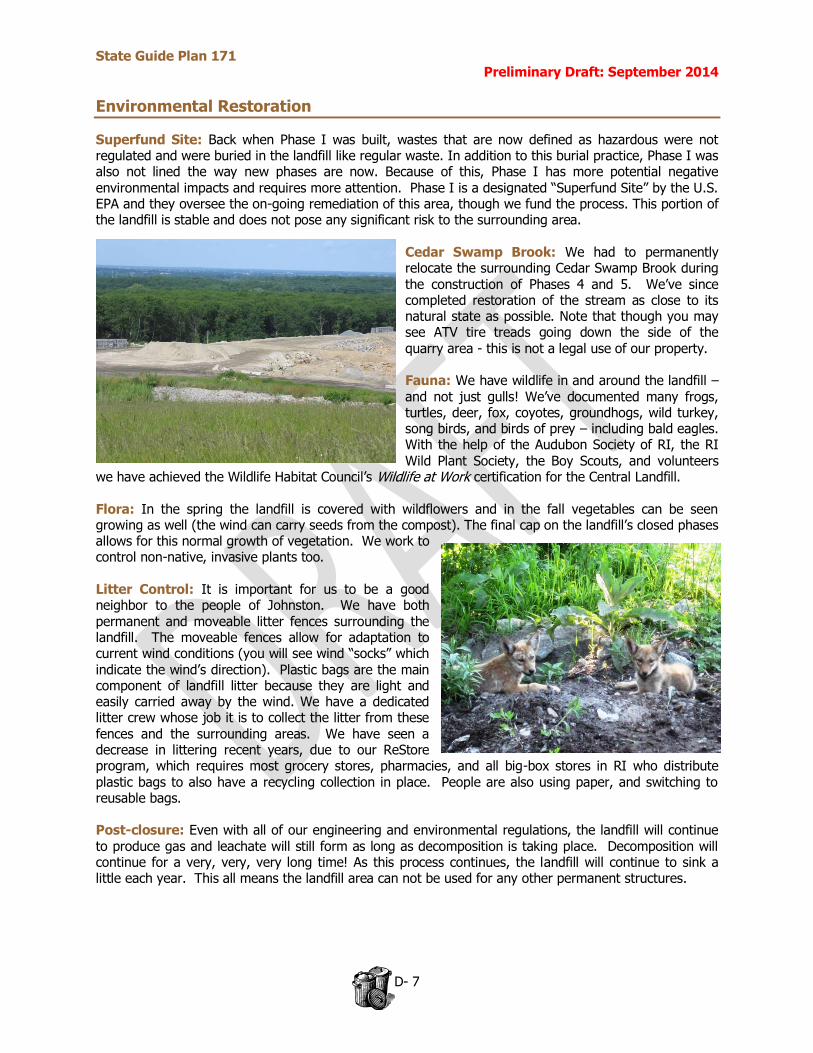
State Guide Plan 171 Preliminary Draft: September 2014
D- 7
Environmental Restoration
Superfund Site: Back when Phase I was built, wastes that are now defined as hazardous were not regulated and were buried in the landfill like regular waste. In addition to this burial practice, Phase I was also not lined the way new phases are now. Because of this, Phase I has more potential negative environmental impacts and requires more attention. Phase I is a designated “Superfund Site” by the U.S. EPA and they oversee the on-going remediation of this area, though we fund the process. This portion of the landfill is stable and does not pose any significant risk to the surrounding area.
Cedar Swamp Brook: We had to permanently relocate the surrounding Cedar Swamp Brook during the construction of Phases 4 and 5. We’ve since completed restoration of the stream as close to its natural state as possible. Note that though you may see ATV tire treads going down the side of the quarry area - this is not a legal use of our property. Fauna: We have wildlife in and around the landfill – and not just gulls! We’ve documented many frogs, turtles, deer, fox, coyotes, groundhogs, wild turkey, song birds, and birds of prey – including bald eagles. With the help of the Audubon Society of RI, the RI
Wild Plant Society, the Boy Scouts, and volunteers we have achieved the Wildlife Habitat Council’s Wildlife at Work certification for the Central Landfill. Flora: In the spring the landfill is covered with wildflowers and in the fall vegetables can be seen growing as well (the wind can carry seeds from the compost). The final cap on the landfill’s closed phases allows for this normal growth of vegetation. We work to control non-native, invasive plants too.
Litter Control: It is important for us to be a good neighbor to the people of Johnston. We have both permanent and moveable litter fences surrounding the landfill. The moveable fences allow for adaptation to current wind conditions (you will see wind “socks” which
indicate the wind’s direction). Plastic bags are the main component of landfill litter because they are light and easily carried away by the wind. We have a dedicated litter crew whose job it is to collect the litter from these fences and the surrounding areas. We have seen a decrease in littering recent years, due to our ReStore program, which requires most grocery stores, pharmacies, and all big-box stores in RI who distribute plastic bags to also have a recycling collection in place. People are also using paper, and switching to reusable bags. Post-closure: Even with all of our engineering and environmental regulations, the landfill will continue to produce gas and leachate will still form as long as decomposition is taking place. Decomposition will continue for a very, very, very long time! As this process continues, the landfill will continue to sink a little each year. This all means the landfill area can not be used for any other permanent structures.
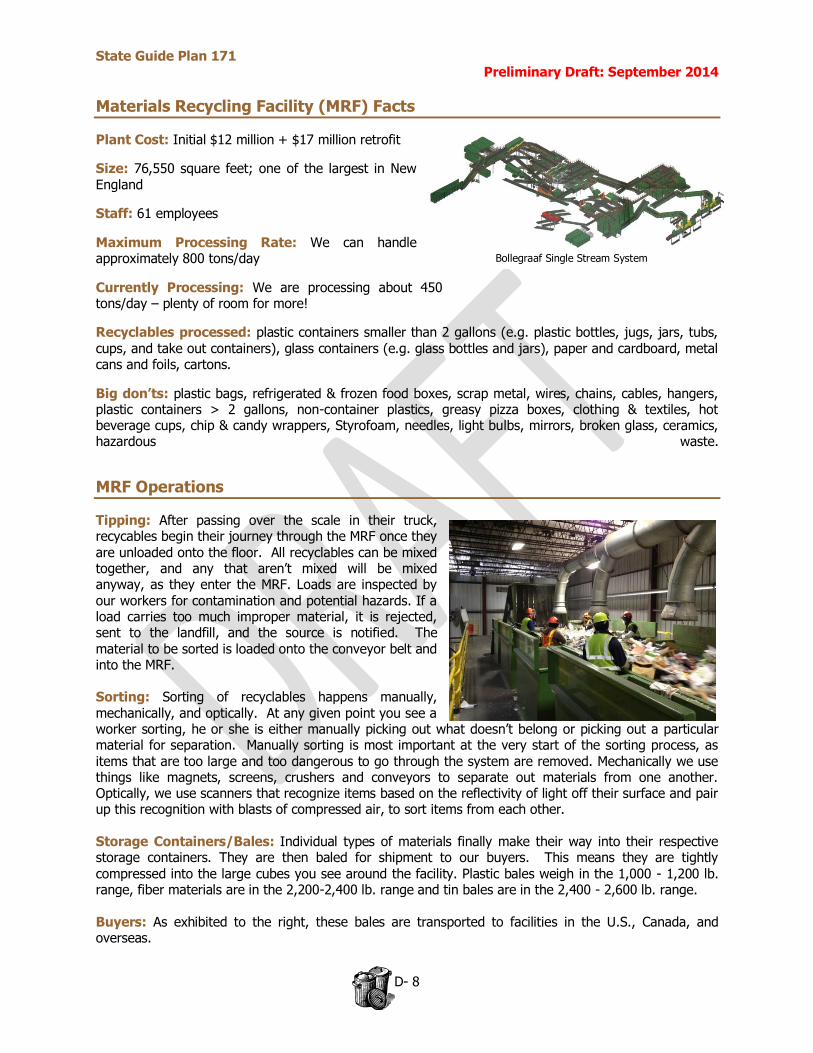
State Guide Plan 171 Preliminary Draft: September 2014
D- 8
Bollegraaf Single Stream System
Materials Recycling Facility (MRF) Facts
Plant Cost: Initial $12 million + $17 million retrofit
Size: 76,550 square feet; one of the largest in New England
Staff: 61 employees
Maximum Processing Rate: We can handle approximately 800 tons/day
Currently Processing: We are processing about 450 tons/day – plenty of room for more!
Recyclables processed: plastic containers smaller than 2 gallons (e.g. plastic bottles, jugs, jars, tubs, cups, and take out containers), glass containers (e.g. glass bottles and jars), paper and cardboard, metal cans and foils, cartons.
Big don’ts: plastic bags, refrigerated & frozen food boxes, scrap metal, wires, chains, cables, hangers, plastic containers > 2 gallons, non-container plastics, greasy pizza boxes, clothing & textiles, hot beverage cups, chip & candy wrappers, Styrofoam, needles, light bulbs, mirrors, broken glass, ceramics, hazardous waste.
MRF Operations
Tipping: After passing over the scale in their truck, recycables begin their journey through the MRF once they are unloaded onto the floor. All recyclables can be mixed together, and any that aren’t mixed will be mixed anyway, as they enter the MRF. Loads are inspected by our workers for contamination and potential hazards. If a load carries too much improper material, it is rejected, sent to the landfill, and the source is notified. The material to be sorted is loaded onto the conveyor belt and into the MRF. Sorting: Sorting of recyclables happens manually, mechanically, and optically. At any given point you see a worker sorting, he or she is either manually picking out what doesn’t belong or picking out a particular material for separation. Manually sorting is most important at the very start of the sorting process, as items that are too large and too dangerous to go through the system are removed. Mechanically we use things like magnets, screens, crushers and conveyors to separate out materials from one another. Optically, we use scanners that recognize items based on the reflectivity of light off their surface and pair up this recognition with blasts of compressed air, to sort items from each other. Storage Containers/Bales: Individual types of materials finally make their way into their respective storage containers. They are then baled for shipment to our buyers. This means they are tightly
compressed into the large cubes you see around the facility. Plastic bales weigh in the 1,000 - 1,200 lb. range, fiber materials are in the 2,200-2,400 lb. range and tin bales are in the 2,400 - 2,600 lb. range.
Buyers: As exhibited to the right, these bales are transported to facilities in the U.S., Canada, and overseas.
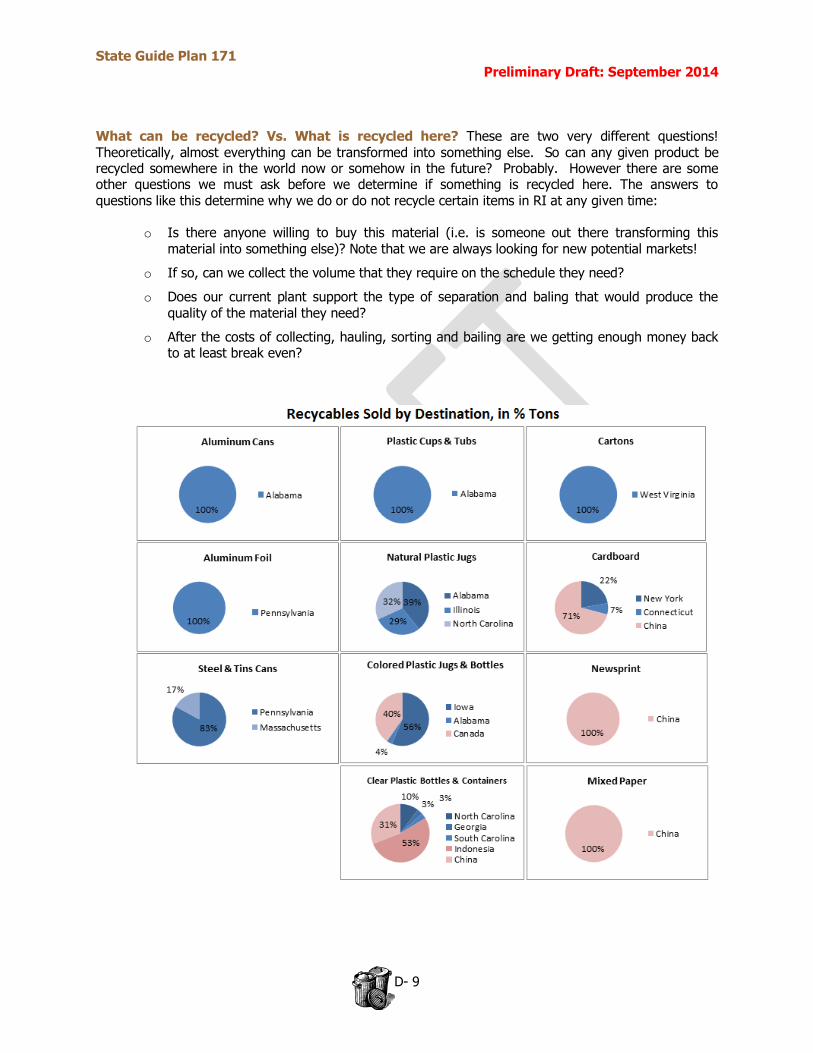
State Guide Plan 171 Preliminary Draft: September 2014
D- 9
What can be recycled? Vs. What is recycled here? These are two very different questions!
Theoretically, almost everything can be transformed into something else. So can any given product be recycled somewhere in the world now or somehow in the future? Probably. However there are some other questions we must ask before we determine if something is recycled here. The answers to questions like this determine why we do or do not recycle certain items in RI at any given time:
o Is there anyone willing to buy this material (i.e. is someone out there transforming this
material into something else)? Note that we are always looking for new potential markets!
o If so, can we collect the volume that they require on the schedule they need?
o Does our current plant support the type of separation and baling that would produce the quality of the material they need?
o After the costs of collecting, hauling, sorting and bailing are we getting enough money back to at least break even?
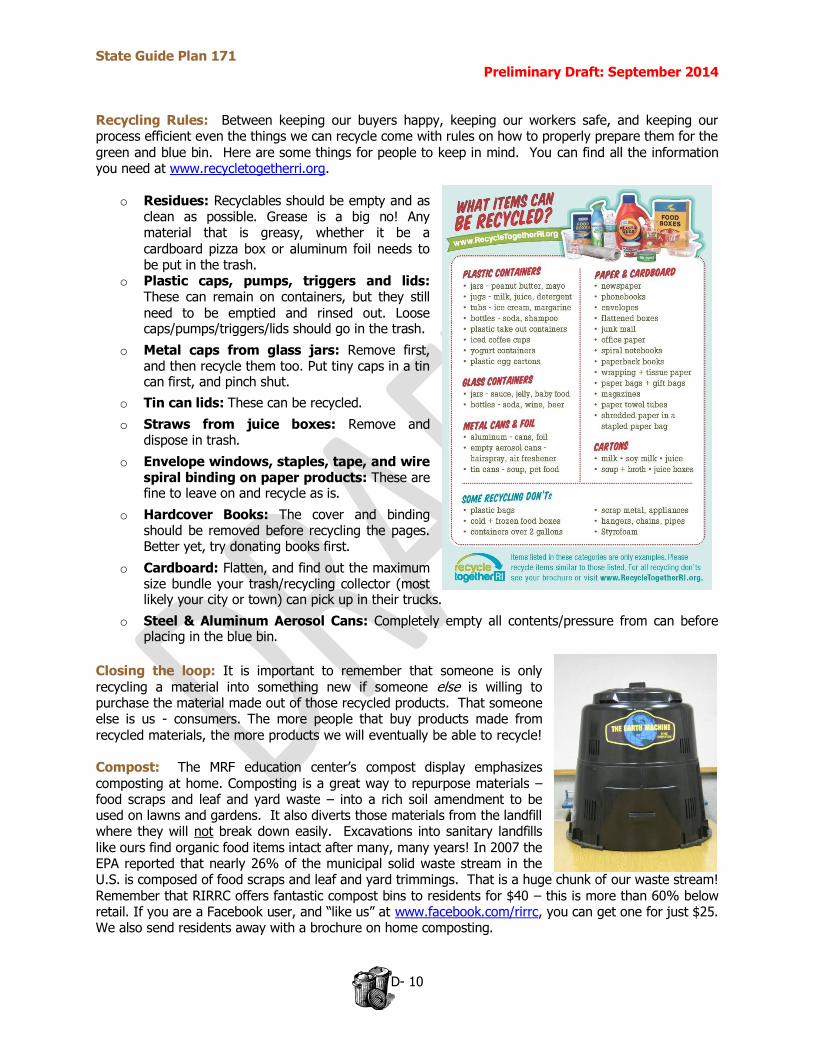
State Guide Plan 171 Preliminary Draft: September 2014
D- 10
Recycling Rules: Between keeping our buyers happy, keeping our workers safe, and keeping our process efficient even the things we can recycle come with rules on how to properly prepare them for the
green and blue bin. Here are some things for people to keep in mind. You can find all the information you need at www.recycletogetherri.org.
o Residues: Recyclables should be empty and as clean as possible. Grease is a big no! Any material that is greasy, whether it be a cardboard pizza box or aluminum foil needs to be put in the trash.
o Plastic caps, pumps, triggers and lids: These can remain on containers, but they still need to be emptied and rinsed out. Loose caps/pumps/triggers/lids should go in the trash.
o Metal caps from glass jars: Remove first, and then recycle them too. Put tiny caps in a tin can first, and pinch shut.
o Tin can lids: These can be recycled.
o Straws from juice boxes: Remove and dispose in trash.
o Envelope windows, staples, tape, and wire spiral binding on paper products: These are fine to leave on and recycle as is.
o Hardcover Books: The cover and binding should be removed before recycling the pages. Better yet, try donating books first.
o Cardboard: Flatten, and find out the maximum size bundle your trash/recycling collector (most likely your city or town) can pick up in their trucks.
o Steel & Aluminum Aerosol Cans: Completely empty all contents/pressure from can before placing in the blue bin.
Closing the loop: It is important to remember that someone is only recycling a material into something new if someone else is willing to purchase the material made out of those recycled products. That someone else is us - consumers. The more people that buy products made from recycled materials, the more products we will eventually be able to recycle! Compost: The MRF education center’s compost display emphasizes composting at home. Composting is a great way to repurpose materials – food scraps and leaf and yard waste – into a rich soil amendment to be used on lawns and gardens. It also diverts those materials from the landfill where they will not break down easily. Excavations into sanitary landfills like ours find organic food items intact after many, many years! In 2007 the EPA reported that nearly 26% of the municipal solid waste stream in the U.S. is composed of food scraps and leaf and yard trimmings. That is a huge chunk of our waste stream! Remember that RIRRC offers fantastic compost bins to residents for $40 – this is more than 60% below retail. If you are a Facebook user, and “like us” at www.facebook.com/rirrc, you can get one for just $25. We also send residents away with a brochure on home composting.

State Guide Plan 171 Preliminary Draft: September 2014
D- 11
U.S. EPA Waste & Recycling Statistics
Footprint: While solid waste generation has increased from 3.66 to 4.38 pounds per person per day between 1980 and 2012, the recycling rate has also increased–from less than 10 % of MSW generated in 1980 to 34.5 % in 2012. Disposal of waste to a landfill has decreased from 89 percent of the amount generated in 1980 to about 54 percent of MSW in 2012.
Recycling Rate: In 2012, Americans generated about 251 million tons of trash and recycled and composted nearly 87 million tons of this material, equivalent to a 34.5 percent recycling rate (note that the EPA rate includes compost).
Energy: Recycling one milk jug saves the amount of energy it takes to run a laptop for over 9 hours. Recycling one aluminum can saves the energy needed to drive a 32mpg car 8 miles.
Economy: Recycling and reuse employs approximately 1.1 million people, generates an annual payroll of nearly $37 billion, and grosses over $236 billion in annual revenues. It is at least 5:1 in job creation compared to trash disposal.
Climate change: The harvesting, extraction, transportation, manufacturing & disposal of products greatly contribute to greenhouse gas emissions.
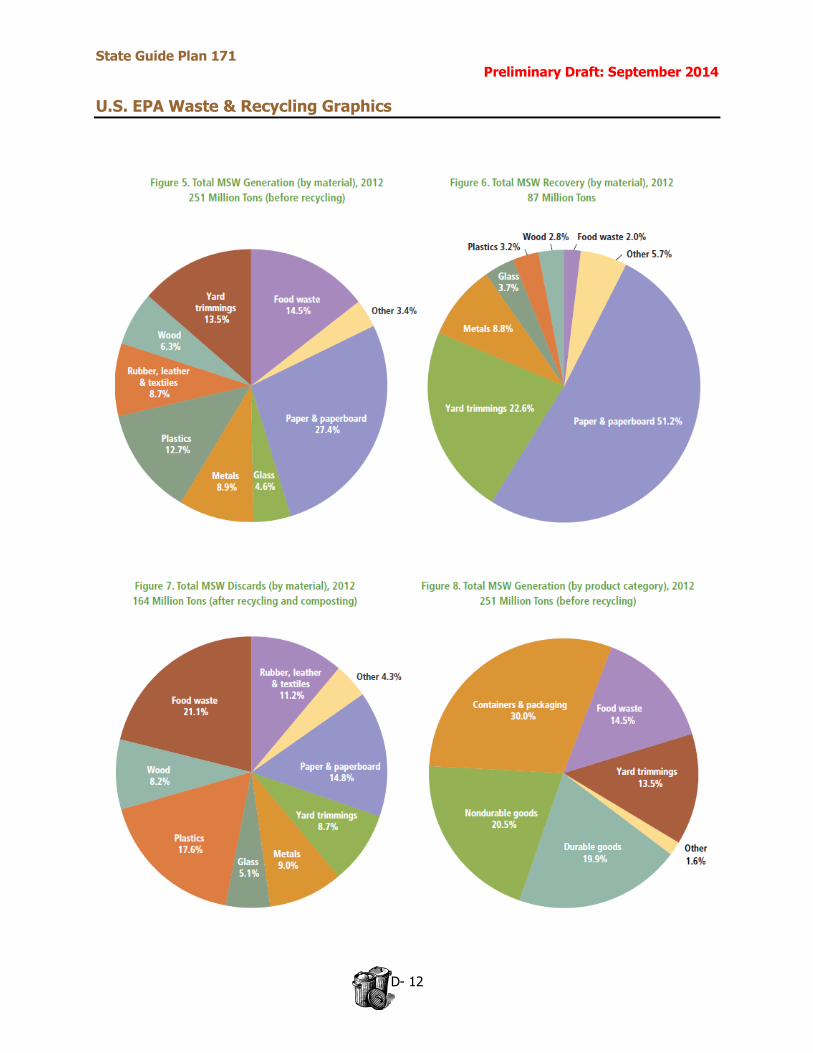
State Guide Plan 171 Preliminary Draft: September 2014
D- 12
U.S. EPA Waste & Recycling Graphics
State Guide Plan 171 Preliminary Draft: September 2014
E- 1
Appendix E
Outreach & Equity
Stakeholder Input and Guidance
The issue of solid waste management is a highly specialized one. The development of this Plan
required a great deal of input from a range of individuals and organizations, from technical experts, to policy professionals, to municipal leaders, to concerned citizens. Each of these groups has a different role in solid waste management. The preparation involved a concerted 2-year effort shared between the Division of Planning (DOP), the Rhode Island Resource recovery Corporation (RIRRC), and the Department of environmental Management (DEM) to contact, to discuss, and incorporate the views and concerns of various stakeholders into the Update. Although extensive input gathered was from individuals and organizations with specialized solid waste knowledge and expertise including but not limited to other state government agencies, municipal officials, solid waste and recycling management professionals, local environmental experts, statewide environmental experts, major employers, etc. Staff made efforts to reach the general public too, after all everyone produces trash. A variety of participation strategies were used to engage experts and non-experts. There is a number of environmental justice issues covered within this Plan. The process and staff considered that the location and potential impacts of the Central Landfill, how transfer stations could impact lower-income and minority communities, and that increased truck traffic, pollution, and street wear-and-tear in these areas needs to be avoided to prevent disparate health outcomes. Different stakeholders were consulted to discuss and weigh a variety of tradeoffs and technologies in order to set goals and policy priorities that would be reflective of these issues among others. This Appendix is a summary of the major efforts undertaken with some of the key educational pieces used included for information. Technical Guidance
1. Solid Waste Management Plan (SWMP) Working Group - A listing of the Working Group is in the
front of the Plan (page vi.). This group was made up of representatives/staff of the Rhode Island Resource Recovery Corporation (RIRRC), the Department of Administration, Division of Planning (DOP) and the Department of Environmental Management Office of Waste Management (DEM). The DOP staff managed the Plan update and adoption processes per a Memorandum of Understanding among the 3 agencies. This Group communicated regularly and met whenever
necessary.
2. Solid Waste Management Plan Advisory Committee – A listing of the Committee is in the front of the Plan (page v.). This multi-disciplinary group was established by RIRRC and DOP to provide direction and guidance during the preparation of the preliminary draft. The Committee was assembled by the RIRRC and designed to ensure full and balanced representation of the interests and groups concerned with solid waste management and recycling issues. It was guided by staff support from the DOP and RIRRC with technical assistance from DEM. The Committee provided information and recommendations to assist in preparing a preliminary draft SWMP.
3. Staff Meetings with Identified Stakeholders – These were additional key stakeholders that the
Working Group staff met with to provide input on the Plan, given their technical knowledge and/or expertise. Some regular existing meetings were used to also discuss the Update. DOP staff helped coordinate and facilitate meetings. Organizations contacted included:
State Guide Plan 171 Preliminary Draft: September 2014
E- 2
Apeiron Institute for Sustainable Living Blackstone Valley Tourism Council Block Island Chamber of Commerce & Tourism Council
Central Rhode Island Chamber of Commerce Charlestown Chamber of Commerce Conservation Law Foundation East Bay Chamber of Commerce East Greenwich Chamber of Commerce East Providence Chamber of Commerce Environmental Justice League of RI Fidelity Real Estate Company Greater Cranston & Providence Chamber of Commerce s Greater Westerly/Pawcatuck Area Chamber of Commerce Green & Healthy Homes Initiative Hispanic American Chamber of Commerce Jamestown Chamber of Commerce
Narragansett Chamber of Commerce Newport & Bristol County Convention & Visitors Bureau, Chamber of Commerce North Central Chamber of Commerce North Kingstown Chamber of Commerce Northern Rhode Island Chamber of Commerce Providence Foundation Providence/Warwick Convention & Visitors Bureau Rhode Island Builders Association
DEM staff - Standing meetings with Environmental Business Council
RIRRC staff - Standing meetings with municipal Public Works Directors & Recycling Coordinators
Other tools used – DOP monthly newsletter, Google List Serve, RhodeMap RI,
Other Outreach:
2013 June – International Green Construction Code training program July – RI American Planning Association Brown Bag program Oct – Trashed screening & Portsmouth, RI solid waste forum Dec – RI Green Building Council Green Eggs program - RISEP Policy Luncheon with DEM
2014 Jan - Clean Water Action conference - Farm Fresh RI monthly newsletter
- Block Island Town Council presentation - URI Master Gardeners program - RI League of Cites & Towns convention - Clean Water Action – Waste in RI series interview March – RI Food Policy Council – Food Matters event April – Central Falls Housing – pilot composting program May – RISEP – Spring Luncheon June – New England Waste Management Official Association – solid waste program

State Guide Plan 171 Preliminary Draft: September 2014
E- 3
General Public Input Regional Public Forums - In order to increase public awareness about the Solid Waste Management Plan
update and get some basic feedback on proposed goals, policies and strategies, 4 four regional public forums were held. These forums were also used as an educational opportunity for the general public.
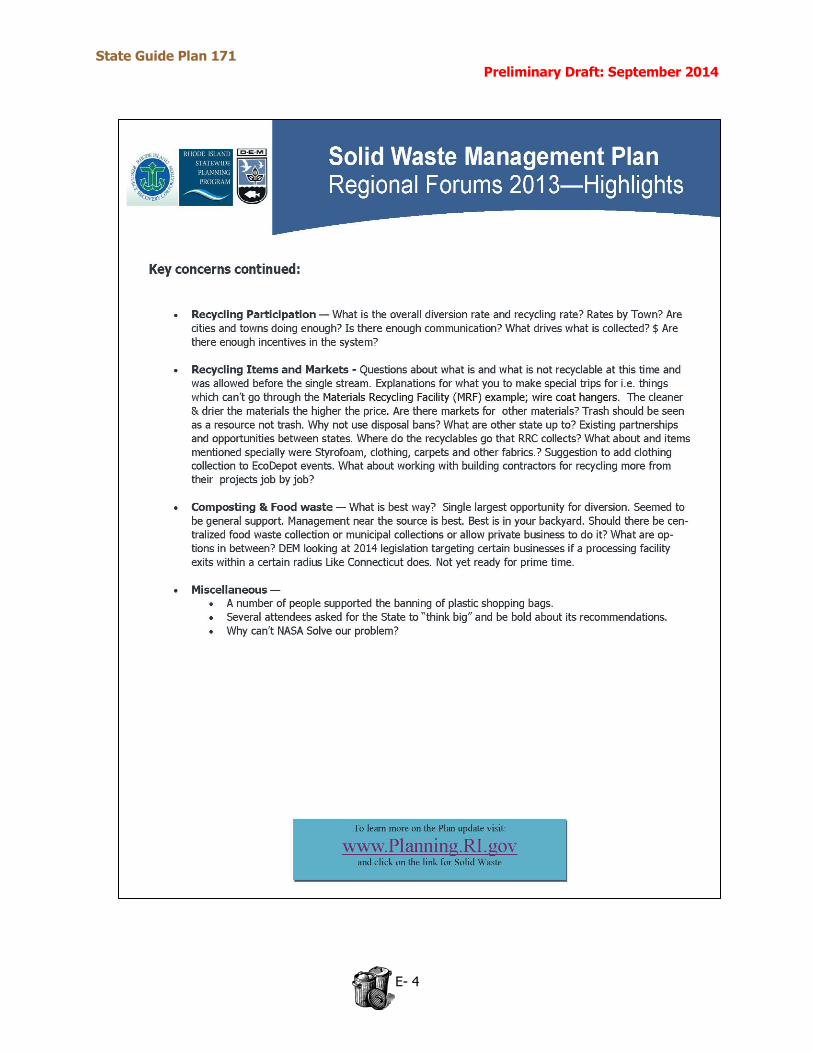
State Guide Plan 171 Preliminary Draft: September 2014
E- 4
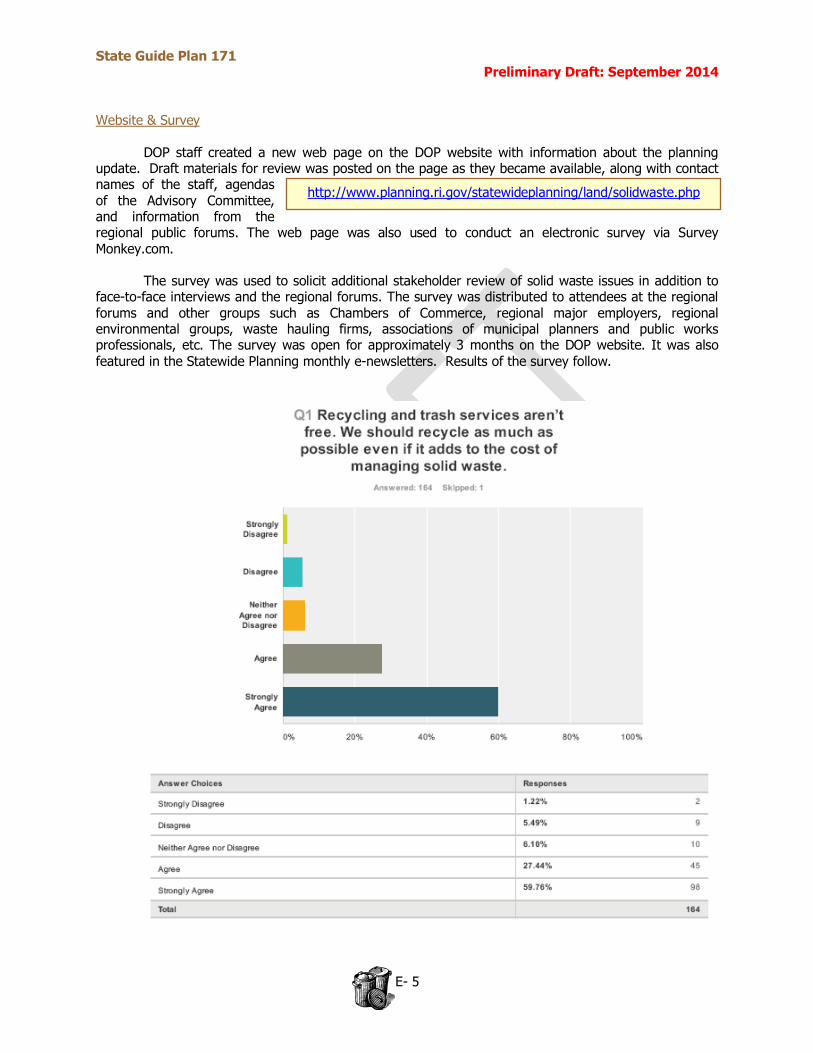
State Guide Plan 171 Preliminary Draft: September 2014
E- 5
http://www.planning.ri.gov/statewideplanning/land/solidwaste.php
Website & Survey
DOP staff created a new web page on the DOP website with information about the planning update. Draft materials for review was posted on the page as they became available, along with contact names of the staff, agendas of the Advisory Committee, and information from the regional public forums. The web page was also used to conduct an electronic survey via Survey Monkey.com.
The survey was used to solicit additional stakeholder review of solid waste issues in addition to
face-to-face interviews and the regional forums. The survey was distributed to attendees at the regional forums and other groups such as Chambers of Commerce, regional major employers, regional environmental groups, waste hauling firms, associations of municipal planners and public works professionals, etc. The survey was open for approximately 3 months on the DOP website. It was also
featured in the Statewide Planning monthly e-newsletters. Results of the survey follow.
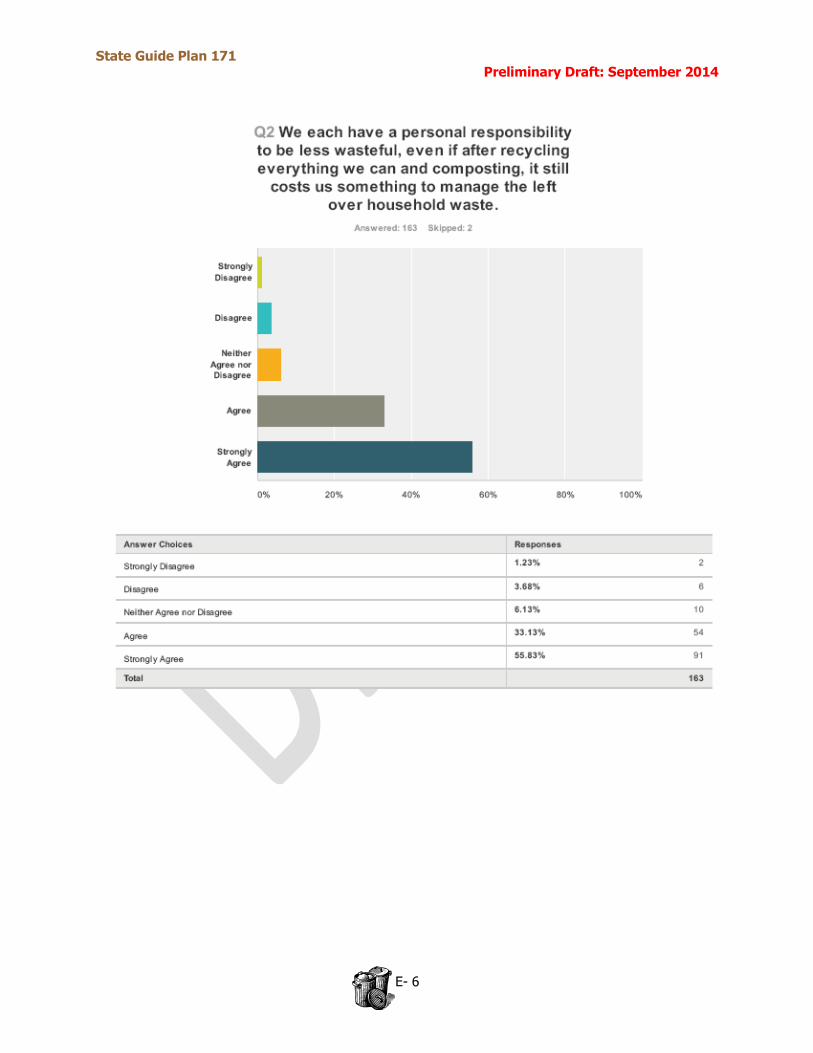
State Guide Plan 171 Preliminary Draft: September 2014
E- 6

State Guide Plan 171 Preliminary Draft: September 2014
E- 7
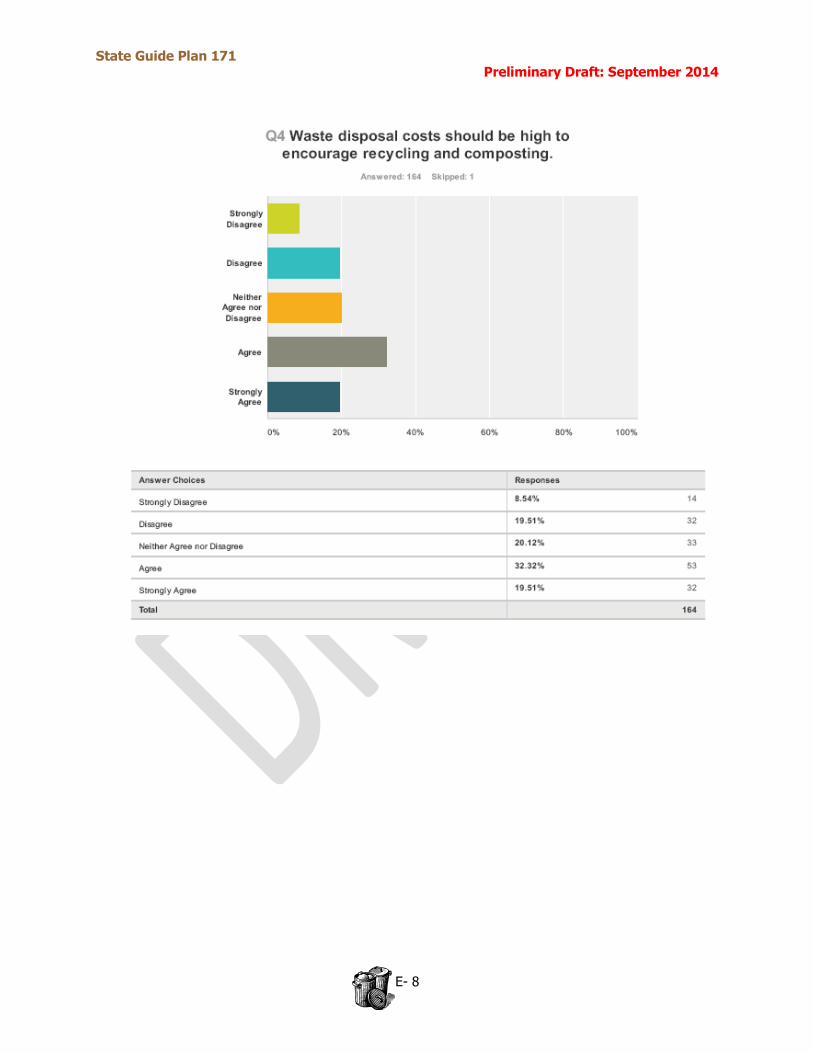
State Guide Plan 171 Preliminary Draft: September 2014
E- 8
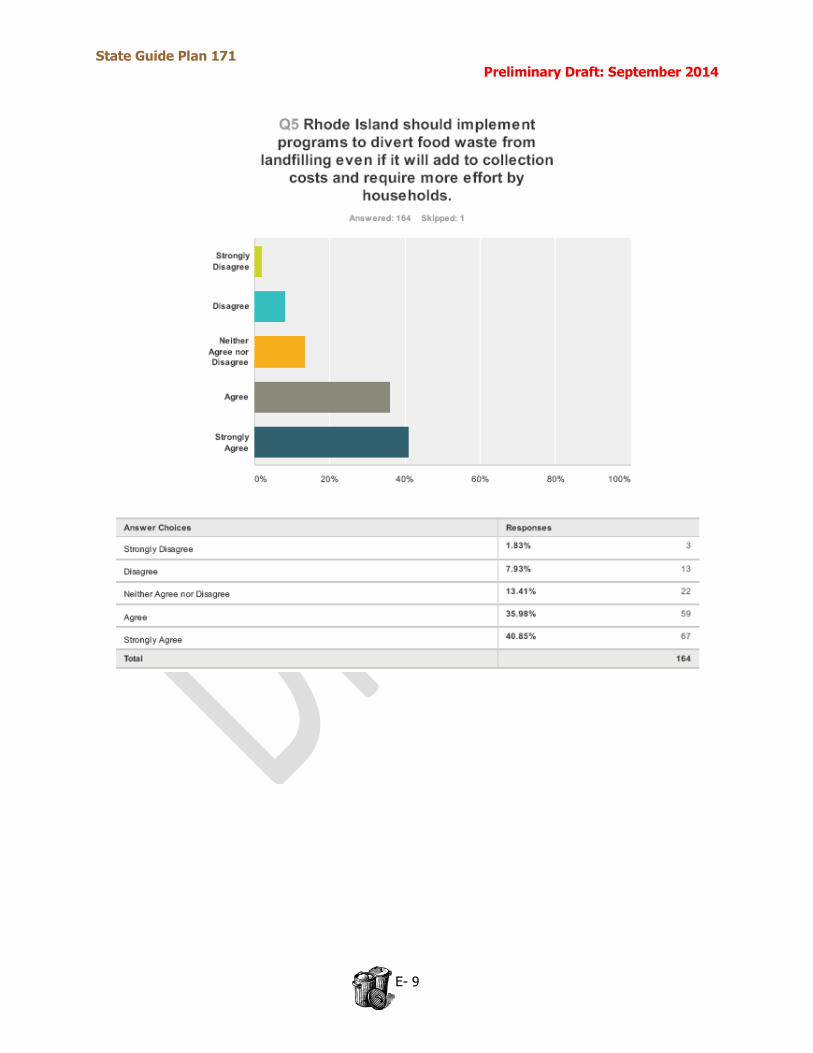
State Guide Plan 171 Preliminary Draft: September 2014
E- 9
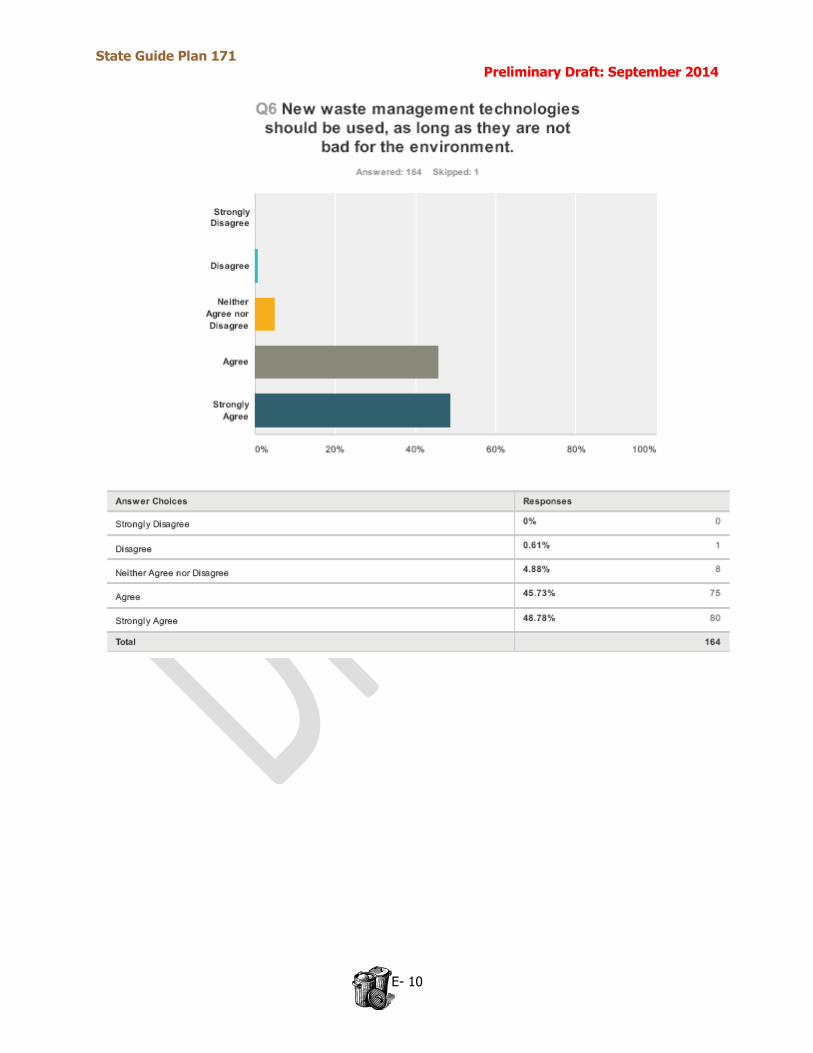
State Guide Plan 171 Preliminary Draft: September 2014
E- 10
State Guide Plan 171 Preliminary Draft: September 2014
E- 11
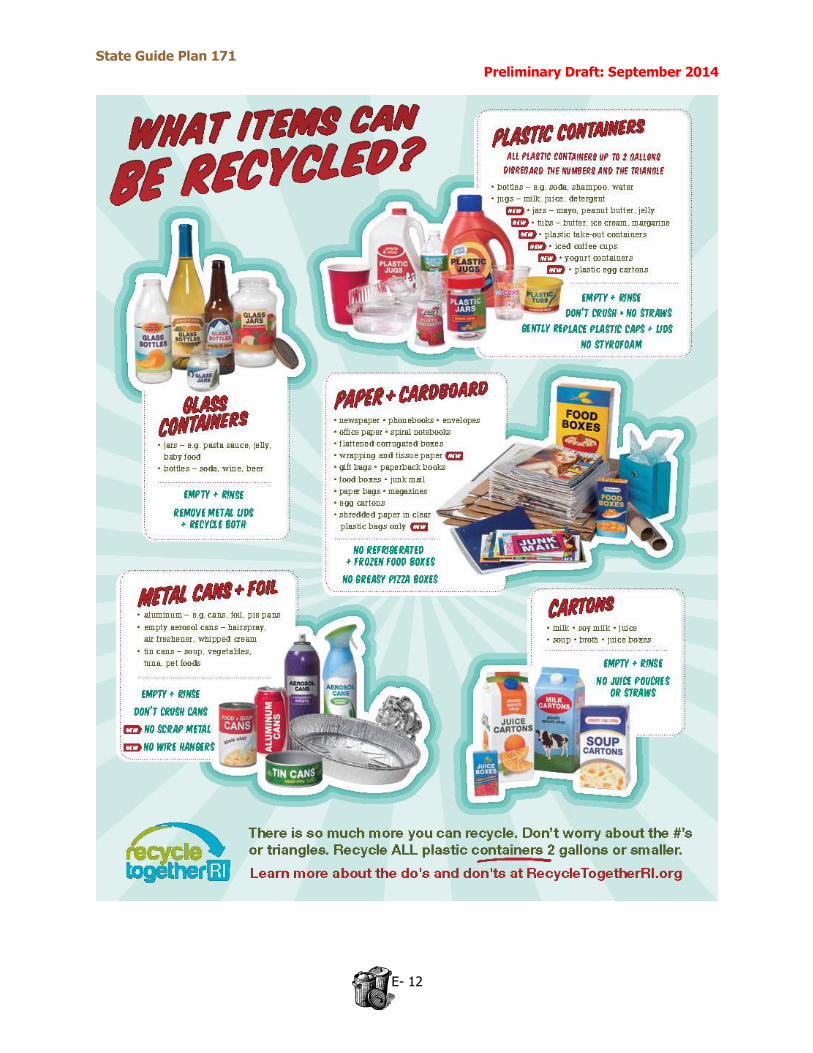
State Guide Plan 171 Preliminary Draft: September 2014
E- 12
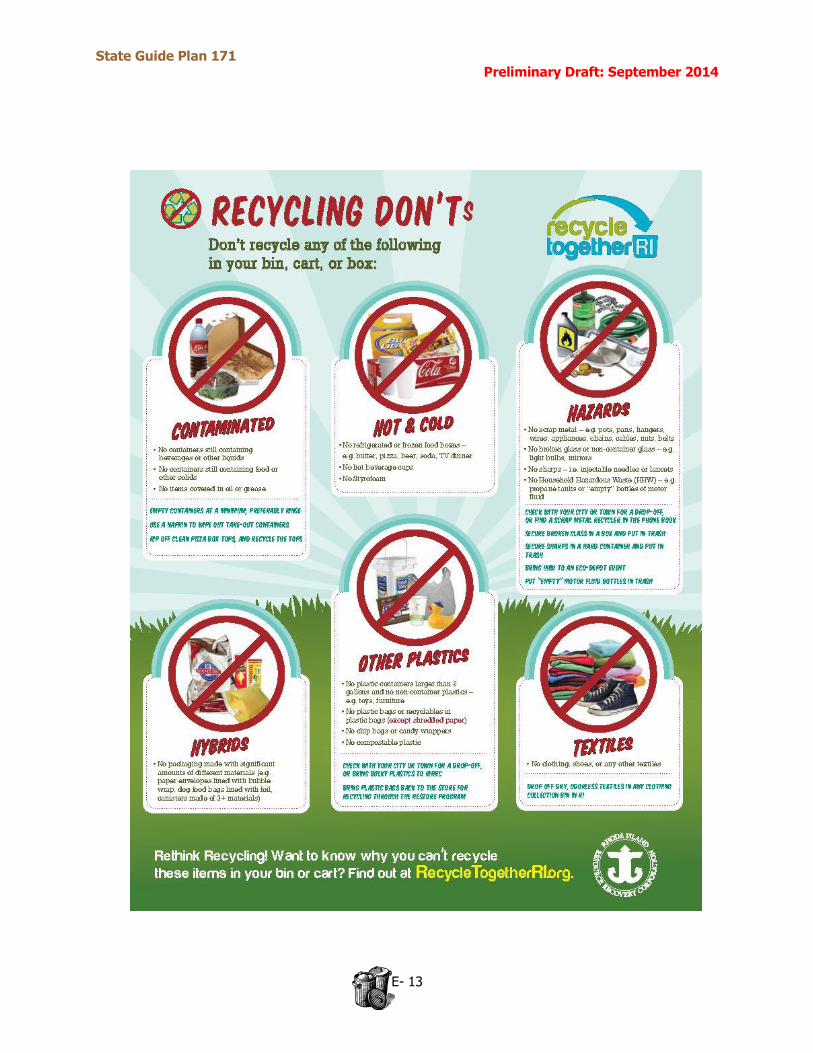
State Guide Plan 171 Preliminary Draft: September 2014
E- 13