Embed Size (px)
Citation preview

JOURNAL OF RESEARCH of the National Bureau of Standards-A. Physics and Chemistry Vol. 77A, No. 1,January-February 1973
Solubility and Surface Properties of Finely Divided Hydroxyapatite
Y. Avnimelech,* E. C. Moreno,** and W. E. Brown***
Institute for Materials Research, National Bureau of Standards, Washington, D.C. 20234
(October 3, 1972)
Synthetic hydroxyapatite (OHAp), Cas(PO.)aOH, was prepared by slow addition of phosphoric acid to a boiling Ca(OH), suspension. The solid, precipitated at a pH of about 12, was stabilized by pro· longed boiling. The Ca/p ratio of the product was 1.69 ± 0.04 and it had a specific surface area of 26 m 2/g.
Samples of OHAp were equilibrated with phosphoric acid solutions. Within the pH range studied, 5 to 7, the solubility product, (Ca)5(PO.)3(OH), was found to be 6.3 ± 2.1 X 10- 59 at 25°C.
Substantial deviations of the overall dissolution reaction from OHAp stoichiometry were observed and are attributed to non stoichiometric reactions occurring at the surface. A linear dependence of excessive phosphorus on the surface with decrease in pH was found. Estimates on the extent of devia· tion from stoichiometry caused by the surface reaction are given.
Key words: Hone mineral ; calcium phosphate; hydroxyapatite; solubility product; surface.
1. Introduction
Hydroxyapatite (OHAp), Ca5(P04hOH, is the prototype of the inorganic constituent found in tooth and bone. In biological materials it is invariably very finely subdivided and with high specific surface area (e.g., over 100 m 2/g in bone). It is anticipated that the physicochemical properties of these materials reflect both the "lattice" and "surface" properties. The relative contributions of these properties to the equilibrium in the ternary system Ca(OHh-H 3P04-H 20 are analyzed in detail in a subsequent paper [1].1 Here we present experimental data confirming that
(1) the equilibrium solution compositions are confined to the solubility isotherm fixed by the equilibrium with the lattice even when the "overall" dissolution reaction is nonstoichiometric,
(2) the surface contributes to deviations from the ideal stoichiometry of the overall dissolutionprecipitation reaction, and
(3) a capacitative factor can be assigned to the surface which measures the contribution of the surf':lCe to the nonstoichiometry of the dissolution reaction.
Lacking the information to define the interface in terms of its 3-dimensional structure, one is limited to
L Figures in brackets indicate the literature references at the end of this paper. *Re8carch Associate of the American Dental AS8ociation at the National Bureau of
Standards. Washington , D.C. 20234. Now at the Soil Science Laboratory, braellnstitute of Technology. Technion City, Haifa, Israel.
··Research Associate of the American Dental Aaaociation at the National Bureau of Standards. Washington. D.C. 20234. Now at the Forsyth Dental Center, 140 Fen~ay, Booton. Ma ... 02215.
compositional descriptions. However, when the interface is between two condensed phases, both of which contain all three components, it is not operationally possible to assign a unique composition to the interfacial region. Therefore, one is limited to measurements involving chemical reactions (dissolution or precipitation) in which only those changes in the surface composition contributing to the nonstoichiometry of the overall reaction can be measured. We believe the approach presented here-involving as it does the use of a system confined to a single degree of freedom and the treatment of the res ults in terms ofthe stoichiometry of the reaction (thus avoiding any attempt to define the composition of the interface per se) is new, and it can be applied to other sparingly soluble salts.
2. Materials and methods
The OHAp was prepared (see sec. 2.1) by titrating a calcium hydroxide slurry at boiling temperature with phosphoric acid. High pH, high temperature and slow addition of reagents minimized formation of metastable calcium phosphates. The preparation was then boiled for several days to minimize recrystallization during the subsequent equilibrations. The pre para-
···Oirector, American Dental Association Research Unit at the National Bureau of Standards, Washington, D.C. 20234.
De~~!i ~~~:~~~~~rr:'::Sth~'N:So~~iIn~~~!lt~YofD:~~~h R~::!r~hE:~~! ~~~hof ~:d~~:~ research program conducted by the National Bureau of Standards in cooperation with the American Dental Association: the United States Army Medical Research and Development Command; the Dental Sciences Division of the School of Aerospace Medicine, USAF; the Nationallnatitule of Dental Research; and the Veterans Adminiatration~
149
tion was made using only the components of the ternary system, Ca(OHh-H 3P0 4-H 20, to minimize contamination and to simplify application of the electroneutrality principle as a check on the experimental results.
The measurements were carried out under conditions of thermodynamic equilibrium in the ternary system. In this way the solution compositions, confined to the solubility isotherm [1 , 2], are definable in terms of a single parameter (e.g. , pH) and have a degree of uniqueness which is unattainable with unsaturated solutions or in solutions containing other components.
2.1. Preparation of OHAp
Analytical grade CaC0 3 (major impurity, Sr, 0.009%), 620 g, was calcined at 1100°C for 24 hours; the resulting CaO was protected from atmospheric CO 2• The CaO was transferred to a 20 liter, heavywall, polypropylene carboy containing 12 liters of distilled water that had been boiled for one hour, and to which was attached a condenser protected by a CO 2 trap containing NaOH solution. Phosphoric acid solution, 2M, prepared from twice recrystallized 2H 3P0 4 • H 20 and degassed distilled water, was introduced through a glass tube, the end of which dipped into a small glass dish in the carboy located right below the condenser; in this way, the acid was diluted about 1: IS by condensing water. The phosphoric acid, 1.8 liter, was intro· duced by a peristaltic pump at a rate of 1 ml per minute. Vigorous boiling was maintained during the precipitation and was continued for two days after completing addition of the acid. The solid was then allowed to settle, supernatant liquid was removed and replaced by an equal volume of boiled , distilled water , and the suspension was boiled for three more days. This washing and boiling was repeated a second time before filtering the suspension. The precipitate was washed with acetone in a Buchner filter and drieo in an oven at lOS 0c.
2.2. Characterization of the Solid
Chemical analysis yielded a CalP ratio of 1.69 ± .04 as compared to the stoichiometric ratio 1.67. Petrographically the solid appeared homogeneous and nonbirefringent with a mean index of 1.634. This index is somewhat lower than that for OHAp obtained by hydrothermal procedures (1.646) [3]; a low value appears to be characteristic for precipitated OHAp, and is probably related to the presence of H 20 incorporated into the crystals. The infrared spectrum was typical for OHAp [4]; the OH-stretching peak at 3S70 cm -1 was sharp and the PO-stretching peaks at 1040 to 1200 cm -1 were split, indicating that the material was reasonably well crystallized. The presence of a trace of an acid phosphate was indicated by a shoulder at 1070 cm - 1 and a trace of carbonate by a peak at 1430 cm - 1. In subsequent experiments, it was found that the dry OHAp absorbed CO 2 from the air. The small amount of contaminating carbonate was probably incorporated when the OHAp was exposed to the air
after being dried. The surface area, determined by N 2
adsorption, was 26 m 2/g.
2.3. Analytical Methods
Calcium was determined using an atomic absorption spectrophotometer. Strontium chloride solution was added to samples and standards to depress phosphorus interference (final strontium concentration was 2 ppm). Phos phorus was determined by the colorimetric method of Brabson et al. [5]. The estimated errors were ± 1.5 percent of the amounts of Ca or P analyzed.
The pH measurements were made with a null-point instrument, claimed accuracy ± O.OOS pH units. The pH meter was standardized with certified NBS buffers [6]. The uncertainty in the pH measurements was estimated to be ± 0.008 pH units. The conductivity of the solution was determined at 1000 Hz. The platinum electrodes were calibrated against solutions of doubly crystallized KCl. With the bridge used, the error in the conductivity measurements was estimated to be about ± 0.1 percent.
2.4. Solubility Measurements and Calculations
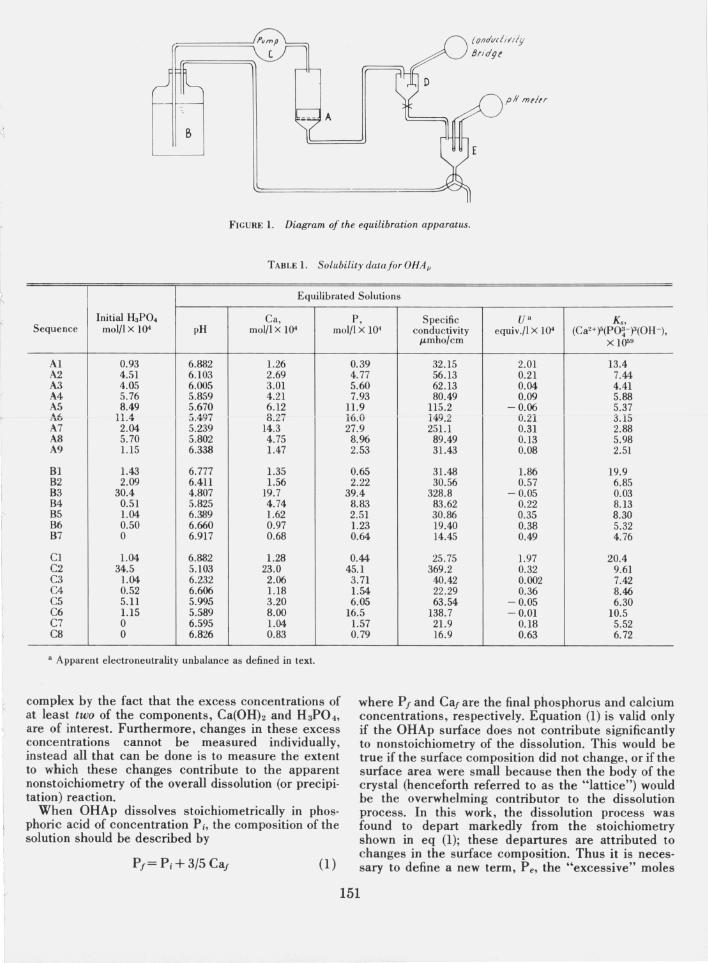
Saturation was achieved by circulating the equilibration solution through a column of the OHAp in a thermostated water bath at 2S±0.03°C, as shown schematically in figure 1. A millipore membrane (0.22 p,m pore diameter) or filter paper was placed on the perforated plate A on top of which was a IS mm column (7 g) of OHAp. Reservoir B was filled with 9S0 ml of dilute phosphoric acid solution of selected concentration (see table 1) which was then circulated through the OHAp column by means of the peristaltic pump C. Conductivity and pH of the clear solution were measured in samples collected in cells D and E, respectively. The solutions were assumed to be saturated with respect to OHAp when no significant changes could be detected in either the conductivity or the pH during a period of six hours, which usually took 2 to 4 days. Samples were then taken for calcium and phosphorus analyses, and the apparatus was drained and refilled with phosphoric acid of the next concentration.
The ionic activity coefficients used in the calculation of activity products were computed using the DebyeHiickel extended equation with Kielland's values [7] for the "distances of closest approach" and an iterative procedure described by Moreno et al. (2).
2.5. Calculation of Excessive Phosphorus, Pe
In the absence of a unique entity that can be defined as a "surface" it has been customary to use the term "surface" to denote a zone in which compo· nents appear in "excess" quantities relative to the composition of the condensed phase. This procedure necessitates the definition of boundaries that are both sharp and arbitrary; these boundaries are not susceptible of experimental verification and, in the aqueous phase at least, are structurally inconceivable. In the ternary system the situation is made more
150
J '"
! /
i
j
pllmtltr
A
FIGURE 1. Diagram of the equilibration apparatus .
TABLE 1. Solubility datafor OHA"
Equilibrated Solutions
Initial H3PO, Ca, P, Specific Ua Ks, Sequence mol/I X 1()4 pH mol/l X 1()4 molll X 10' conductivity equiv./I X 10' (Ca2+)'(PO~-)3(OH-),
Al 0.93 6.882 1.26 A2 4.51 6.103 2.69 A3 4.05 6.005 3.01 A4 5.76 5.859 4.21 A5 8.49 5.670 6.12 A6 " . 5.497 8.27 .1.1.~
A7 2.04 5.239 14.3 A8 5.70 5.802 4.75 A9 l.l5 6.338 1.47
81 1.43 6.777 1.35 82 2.09 6.411 1.56 83 30.4 4.807 19.7 84 0.51 5.825 4.74 85 1.04 6.389 1.62 86 0.50 6.660 0.97 87 0 6.917 0.68
C1 1.04 6.882 1.28 C2 34.5 5.103 23.0 C3 1.04 6.232 2.06 C4 0.52 6.606 1.18 C5 5.11 5.995 3.20 C6 l.l5 5.589 8.00 C7 0 6.595 1.04 C8 0 6.826 0.83
a Apparent electro neutrality unbalance as defined in text.
complex by the fact that the excess concentrations of at least two of the components, Ca(OHh and H 3P0 4,
are of interest. Furthermore, changes in these excess concentrations cannot be measured individually, instead all that can be done is to measure the extent to which these changes contribute to the apparent nonstoichiometry of the overall dissolution (or precipi· tation) reaction.
When OHAp dissolves stoichiometrically in phos· phoric acid of concentration Pi, the composition of the solution should be described by
(1)
p.mho/cm X lOS"
0.39 32.15 2.01 13.4 4.77 56.13 0.21 7.44 5.60 62.13 0.04 4.41 7.93 80.49 0.09 5.88
11.9 115.2 -0.06 5.37 16.0 l49.2 0.21 3.15 27.9 25l.l 0.31 2.88 8.% 89.49 0.13 5.98 2.53 31.43 0.08 2.51
0.65 31.48 1.86 19.9 2.22 30.56 0.57 6.85
39.4 328.8 -0.05 0.03 8.83 83.62 0.22 8.13 2.51 30.86 0.35 8.30 1.23 19.40 0.38 5.32 0.64 14.45 0.49 4.76
0.44 25.75 1.97 20.4 45.1 369.2 0.32 9.61
3.71 40.42 0.002 7.42 1.54 22.29 0.36 8.46 6.05 63.54 - 0.05 6.30
16.5 138.7 - 0.01 10.5 1.57 21.9 0.18 5.52 0.79 16.9 0.63 6. 72
where PI and Cal are the final phosphorus and calcium concentrations, respectively. Equation (1) is valid only if the OHAp surface does not contribute significantly to nonstoichiometry of the dissolution. This would be true if the surface composition did not change, or if the surface area were small because then the body of the crystal (henceforth referred to as the "lattice") would be the overwhelming contributor to the dissolution process. In this work, the dissolution process was found to depart markedly from the stoichiometry shown in eq (1); these departures are attributed to changes in the surface composition. Thus it is neces· sary to define a new term, P e, the "excessive" moles
151

of phosphorus contributed by the surface of one gram of solid to the dissolution process,
where V is the volume of solution and W is the weight of OHAp. We could also define the quantity excessive calcium, Cae, similarly to P e, but, since it is impossible, to make a distinction between surface and lattice dissolution,
(3 )
In other words, a given deviation from stoichiometry in the dissolution reaction can be explained equally well by a surface impoverishment in phosphorus, P e, or by a surface enrichment in calcium. We have chosen to make the calculations in terms of P e.
3. Results
The results from three sequences of equilibrations, A, B, and C, are given in table 1. In the table are given the initial phosphoric acid concentrations, and measured quantities (pH, P and Ca concentrations, and , specific conductances) of the saturated solutions. Given, also, are two derived quantities, the apparent electroneutrality unbalance [8], U, and the activity product, Ks, defined by
(4)
and (5 )
where the parentheses denote ionic activities, and Cj
and Zj represent the concentration and valence (with sign) of the ith ionic species present in the solution. The summation over i includes only ions formed by the three components Ca(OHh, H3P04 and H 20. Thus it is a measure of the charge unbalance contributed by impurity ions, but it also reflects analytical errors and incorrect estimates of the concentrations of the various phosphate ions and ion pairs due to errors in dissociation constants and inadequacies in the expressions for activity coefficients.
The value of U is relatively large for the first solution in each series. Most of the other values of U are less than 5 percent of the number of calcium equivalents in the corresponding solution, and considering that all the analytical errors are reflected in U, they are within the anticipated experimental error. The large value of U in the first member of each series indicates that the solid contained a contaminant, most probably carbonate (see sec. 2.2), which to a large degree was extracted in the initial equilibration.
The values for calcium concentration, used in the derivation of Pe were taken as [Cal - 0.5 U, where [Cal is the measured concentration of calcium in the equilib~~ed solution (mol/I) and U is the electro-
neutrality unbalance (equivalents/I). This implies that the unbalance was due to an anionic contaminant associated with calcium. This correction is significant only in those cases where U is large relative to the deviation from stoichiometry. The Ks values for the first solution in each of the three sequences are consistently too large, and the one for B-3 is abnormally low; these values were omitted from the average for the Ks given in table 1,6.3 ± 2.1 X 10-59• The listed standard error in Ks is reasonable in view of the fact that errors of 1 percent in the Ca and P analyses would result in about 10 percent error in Ks and a 0.01 error in the pH would cause about 30 percent error in Ks. Conductivity data are given in table 1 because they are useful in verifying the condition of saturation in future studies employing OHAp in the three-component system. Conductivity measurements have the advantage over calcium and phosphorus analyses of being more sensitive and accurate, and are quicker and nondestructive. Furthermore, there is no contamination of the solution by a salt bridge as is the case with pH measurements.
400
E u '-0 .c 300 9. ,; u
" 2 u 200 " '0
" 0 u
,~ ... '0 100 u • 0-m
~ ~~(PJ
~(Cal .~._
~ - ~ conductivity
;;l o · 'g. o
10- 4 g o ~
o e o
§ o o , o • , .. ~ • ..
10- 6 b· ? 3 g.
~
FIGURE 2. Experimental concentrations of phosphorus, calcium and electrical conductivity of the equilibrated solutions plotted against pH.
In figure 2 are given plots of the calcium and phosphorus concentrations and the specific conduct: ance against pH. With the exception of the four points that were omitted from the average of K s , the points fall on smooth curves, indicating self-consistency in the experimental data.
A further verification of equilibrium is given in figure 3, where the data in table 1 are plotted on a
152
32 ,------------------------------------,
31
30 , " 0 ~
" -b:
'" 0 .., , 29
1 8
2 7 L........--I --'-----1-\-----",,----"0 I
18 19 20 21
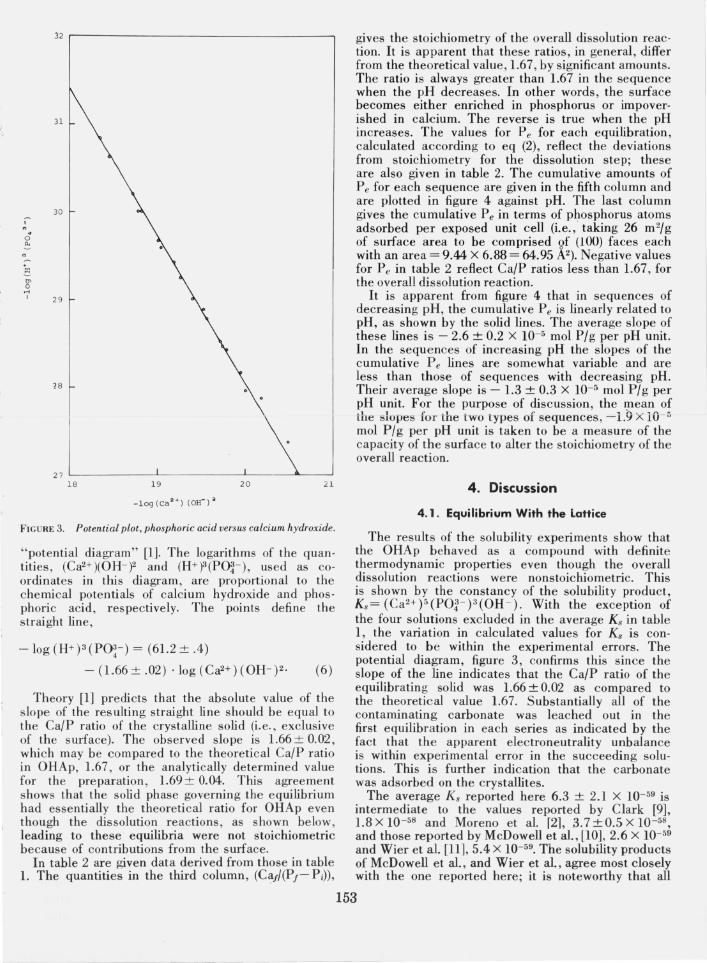
FIGURE 3. Potential plot, phosphoric acid versus calcium hydroxide.
"potential diagram" [1]. The logarithms of the quantities , (Ca2+)(OH- f and (H+)3(PO~- ), used as coordinates in this diagram, are proportional to the chemical potentials of calcium hydroxide and phosphoric acid, respectively. The points define the straight line,
-log (H+)3 (PO!- ) = (61.2 ± .4)
-(L66±.02) . log (Ca2+)(OH- )2. (6)
Theory [1] predicts that the absolute value of the slope of the res ulting straight line should be equal to the Ca/P ratio of the crystalline solid (i. e., exclusive of the surface)_ The observed slope is 1.66 ± 0.02, which may be compared to the theoretical CaIP ratio in OHAp, 1.67, or the analytically determined value for the preparation, 1.69 ± 0.04. This agreement shows that the solid phase governing the equilibrium had essentially the theoretical ratio for OHAp even though the dissolution reactions , as shown below, leading to these equilibria were not stoichiometric because of contributions from the surface.
In table 2 are given data derived from those in table 1. The quantities in the third column, (CaA(Pr- Pi)),
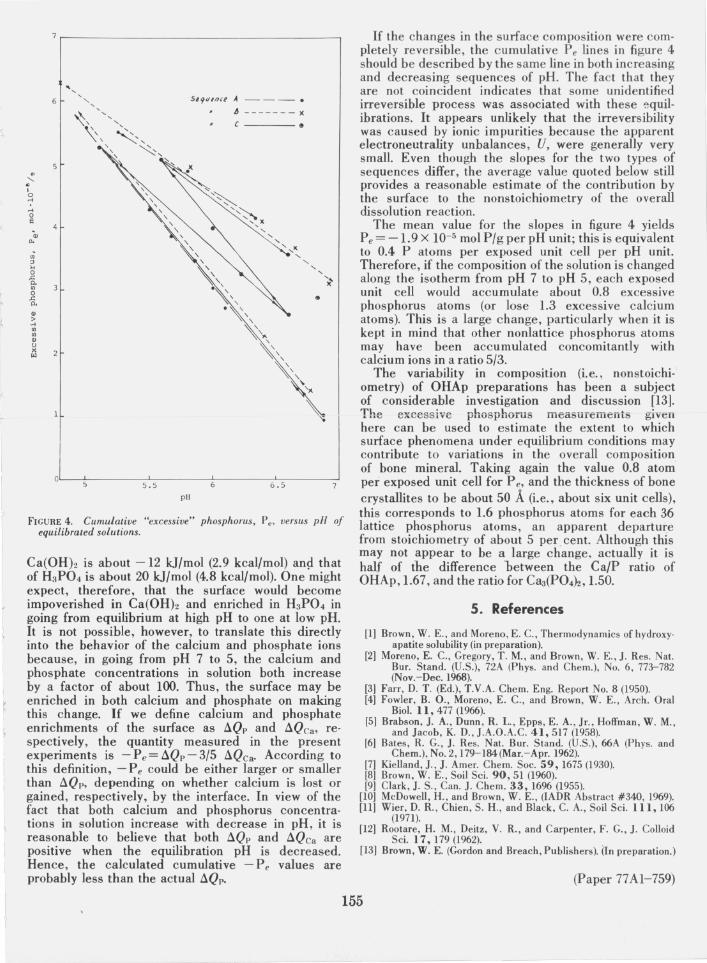
gives the stoichiometry of the overall dissolution reaction. It is apparent that these ratios, in general, differ fro m the theoretical value, 1.67, by significant amounts. The ratio is always greater than 1.67 in the sequence when the pH decreases. In other words, the surface becomes either enriched in phosphorus or impoverished in calcium. The reverse is true when the pH increases. The values for P e for each equilibration, calculated according to eq (2), reflect the deviations from stoichiometry for the dissolution step; these are also give n in table 2. The cumulative amounts of P e for each sequence are given in the fifth column and are plotted in figure 4 against pH. The last column gives the cumulative P e in terms of phosphorus atoms adsorbed per exposed unit cell (i.e., taking 26 m 2/g of surface area to be comprised \,If (100) faces each with an area = 9.44 X 6.88 = 64.95 N). Negative values for P e in table 2 reflect Ca/P ratios less than 1.67, for the overall dissolution reaction.
It is apparent from figure 4 that in sequences of decreasing pH, the cumulative Pe is linearly related to pH, as shown by the solid lines. The average slope of these lines is - 2.6 ± 0.2 X 10- 5 mol PIg per pH unit. In the sequences of increasing pH the slopes of the cumulative Pe lines are somewhat variable and are less than those of sequences with decreasing pH. Their average slope is - 1.3 ± 0.3 X 10⁻⁵ mol PIg per pH unit. For the purpose of discussion , the IJlean of tht: slupes fur the two types of sequences, - l.9 X 1O- ~ mol PIg per pH unit is taken to be a measure of the capacity of the surface to alter the stoichiometry of the overall reaction.
4. Discussion
4.1. Equilibrium With the Lattice
The results of the solubility experiments show that the OHAp behaved as a compound with definite thermodynamic properties even though the overall dissolution reactions were nonstoichiometric. This is shown by the constancy of the solubility product, Ks= (Ca2+)5(P01- )3(OH - ). With the exception of the four solutions excluded in the average Ks in table 1, the variation in calculated values for Ks is considered to b e within the experimental errors. The potential diagram, figure 3, confirms this since the slope of the line indicates that the CaIP ratio of the equilibrating solid was 1.66 ± 0.02 as compared to the theoretical value 1.67. Substantially all of the contaminating carbonate was leached out in the first equilibration in each series as indicated by the fact that the apparent electroneutrality unbalance is within experimental error in the succeeding solutions. This is further indication that the carbonate was adsorbed on the crystallites.
The average [(8 reported here 6.3 ± 2.1 X 10- 59 is intermediate to the values reported by Clark [9], 1.8 X 10- 58 and Moreno et al. r21, 3 .7 ± 0.5 X 10- 58 , and those reported by McDowell et aI., [10], 2.6 X 10- 59 and Wier et al. [11], 5.4 X 10- 59. The solubility products of McDowell et aI., and Wier et aI., agree most closely with the one reported here; it is noteworthy that all
153
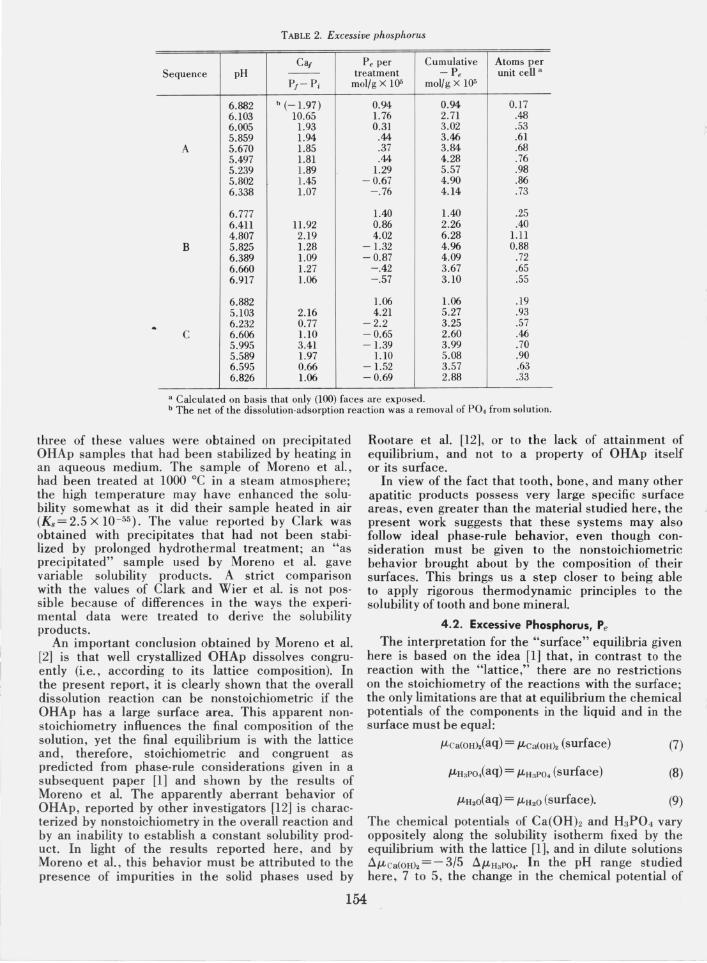
TABLE 2. Excessive phosphorus
Cal Pe per Cumulative Atoms per pH -- treatment - Pe unit cell a Sequence
PI-Pi mol/g X lOS mol/g X lOS
6.882 b (-1.97) 0.94 0.94 0.17 6.103 10.65 1.76 2.71 .48 6.005 1.93 0.31 3.02 .53 5.859 1.94 .44 3.46 .61
A 5.670 1.85 .37 3.84 .68 5.497 1.81 .44 4.28 .76 5.239 1.89 1.29 5.57 .98 5.802 1.45 -0.67 4.90 .86 6.338 1.07 -.76 4.14 .73
6.777 1.40 1.40 .25 6.411 11.92 0.86 2.26 .40 4.807 2.19 4.02 6.28 1.11
B 5.825 1.28 -1.32 4.96 0.88 6.389 1.09 -0.87 4.09 .72 6.660 1.27 -.42 3.67 .65 6.917 1.06 - .57 3.10 .55
6.882 1.06 1.06 .19 5.103 2.16 4.21 5.27 .93 6.232 0.77 -2.2 3.25 .57
C 6.606 1.10 -0.65 2.60 .46 5.995 3.41 -1.39 3.99 .70 5.589 1.97 1.10 5.08 .90 6.595 0.66 -1.52 3.57 .63 6.826 1.06 -0.69 2.88 .33
a Calculated on basis that only (100) faces are exposed. b The net of the dissolution·adsorption reaction was a removal of PO. from solution.
three of these values were obtained on precipitated OHAp samples that had been stabilized by heating in an aqueous medium. The sample of Moreno et al., had been treated at 1000 °C in a steam atmosphere; the high temperature may have enhanced the solubility somewhat as it did their sample heated in air (Ks =2.5 X 10-55 ). The value reported by Clark was obtained with precipitates that had not been stabilized by prolonged hydrothermal treatment; an "as precipitated" sample used by Moreno et al. gave variable solubility products. A strict comparison with the values of Clark and Wier et al. is not pos· sible because of differences in the ways the experi· mental data were treated to derive the solubility products.
An important conclusion obtained by Moreno et al. [2] is that well crystallized OHAp dissolves congruently (i.e., according to its lattice composition). In the present report, it is clearly shown that the overall dissolution reaction can be nonstoichiometric if the OHAp has a large surface area. This apparent nonstoichiometry influences the final composition of the solution, yet the final equilibrium is with the lattice and, therefore, stoichiometric and congruent as predicted from phase-rule considerations given in a subsequent paper [1] and shown by the results of Moreno et al. The apparently aberrant behavior of OHAp, reported by other investigators [12] is characterized by nonstoichiometry in the overall reaction and by an inability to establish a constant solubility product. In light of the results reported here, and by Moreno et al., this behavior must be attributed to the presence of impurities in the solid phases used by
154
Rootare et al. [12] , or to the lack of attainment of equilibrium, and not to a property of OHAp itself or its surface.
In view of the fact that tooth, bone, and many other apatitic products possess very large specific surface areas, even greater than the material studied here, the present work suggests that these systems may also follow ideal phase-rule behavior, even though consideration must be given to the nonstoichiometric behavior brought about by the composition of their surfaces. This brings us a step closer to being able to apply rigorous thermodynamic principles to the solubility of tooth and bone mineral.
4.2. Excessive Phosphorus, Pe
The interpretation for the "surface" equilibria given here is based on the idea [1] that, in contrast to the reaction with the "lattice," there are no restrictions on the stoichiometry of the reactions with the surface; the only limitations are that at equilibrium the chemical potentials of the components in the liquid and in the surface must be equal:
1Lca(OHh(aq) = 1LCa(OHh (surface) (7)
(8)
1LH20(aq) = 1LH20 (surface). (9)
The chemical potentials of Ca(OHh and H3P04 vary oppositely along the solubility isotherm fixed by the equilibrium with the lattice [1], and in dilute solutions A1L Ca(OHh = - 3/5 A1LH3PO.' In the pH range studied here, 7 to 5, the change in the chemical potential of
-..::: . , o "'
Ul
" " o
'" 0.. Ul o -a. " > ." Ul Ul
" u tl
1
I
5t9vln(e A - - - •
~ -------x ----.
•
0 ,--1 ----!---_----'---' _~' _-----,'--::-, _-----' 5., 6 6 .5
pH
FIGURE 4. Cumulative "excessive" phosphorus. Pe• versus pH of equilibrated solutions.
Ca(OHh is about -12 kJ/mol (2.9 kcal/mol) an9 that of H3P04 is about 20 kJ/mol (4.8 kcal/mol). One might expect, therefore, that the surface would become impoverished in Ca(OHh and enriched in H3P04 in going from equilibrium at high pH to one at low pH. It is not possible, however, to translate this directly into the behavior of the calcium and phosphate ions because, in going from pH 7 to 5, the calcium and phosphate concentrations in solution both increase by a factor of about 100. Thus, the surface may be enriched in both calcium and phosphate on making this change. If we define calcium and phosphate enrichments of the surface as !:lQp and !:lQca, respectively, the quantity measured in the present experiments is - P e = !:lQp - 3/5 !:lQca. According to this definition, - P e could be either larger or smaller than !:lQp, depending on whether calcium is lost or gained, respectively, by the interface. In view of the fact that both calcium and phosphorus concentrations in solution increase with decrease in pH, it is reasonable to believe that both !:lQp and !:lQca are positive when the equilibration pH is decreased. Hence, the calculated cumulative - P e values are probably less than the actual !:lQp.
If the changes in the surface composition were completely reversible, the c umulative P e lines in figure 4 should be described by the same line in both increasing and decreasing sequences of pH. The fact that they are not coincident indicates that some unidentified irreversible process was associated with these ~quilibrations. It appears unlikely that the irreversibility was caused by ionic impurities because the apparent electroneutrality unbalances, U, were generally very small. Even though the slopes for the two types of sequences differ, the average value quoted below still provides a reasonable estimate of the contribution by the surface to the nonstoichiometry of the overall dissolution reaction.
The mean value for the slopes in figure 4 yields Pe = -1.9 X 10⁻⁵ mol PIg per pH unit; this is equivalent to 0.4 P atoms per exposed unit cell per pH unit. Therefore, if the composition of the solution is changed along the isotherm from pH 7 to pH 5, each exposed unit cell would accumulate about 0.8 excessive phosphorus atoms (or lose 1.3 excessive calcium atoms). This is a large change, particularly when it is kept in mind that other nonlattice phosphorus atoms may have been accumulated concomitantly with calcium ions in a ratio 5/3.
The variability in composition (i.e., nonstoichiometry) of OHAp preparations has been a subject of considerable investigation and discussion [13]. The excessi\'e phosphorus measurements given here can be used to estimate the extent to which surface phenomena under equilibrium conditions may contribute to variations in the overall composition of bone mineral. Taking again the value 0.8 atom per exposed unit cell for P e, and the thickness of bone crystallites to be about 50 A (i.e., about six unit cells), this corresponds to 1.6 phosphorus atoms for each 36 lattice phosphorus atoms, an apparent departure from stoichiometry of about 5 per cent. Although this may not appear to be a large change. actually it is half of tbe difference between the CaIP ratio of OHAp, 1.67, and the ratio for Ca3(P04)2, 1.50.
5. References
[1] Brown, W. E., and Moreno, E. c., Thermodynamics of hydroxyapatite solubility (in preparation).
[2] Moreno, E. c., Gregory, T. M., and Brown, W. E.,1. Res. Nat. Bur. Stand. (U.S.), 72A (phys. and Chern.), No.6, 773-782 (Nov.-Dec. 1968).
[3] Farr, D. T. (Ed.), T.V.A. Chern. Eng. Report No.8 (1950). [4] Fowler, B. 0., Moreno, E. C., and Brown, W. E., Arch. Oral
BioI. 11,477 (1966). [5] Brabson, ]. A., Dunn, R. L., Epps, E. A., Jr., Hoffman, W. M.,
and Jacob, K. D., J .A.O.A.C. 41,517 (1958). [6] Bates, R. G., ]. Res. Nat. Bur. Stand. (U.S.), 66A (phys. and
Chern.) , No.2, 179-184 (Mar. -Apr. 1962). [7] Kielland,]., J. Amer. Chern. Soc. 59,1675 (1930). [8] Brown, W. E., Soil Sci. 90,51 (1960). [9] Clark, J. S. , Can. J. Chern. 33, 1696 (1955).
[10] McDowell, H., and Brown, W. E., (IADR Abstract #340, 1969). [11] Wier, D. R. , Chien, S. H., and Black, C. A., Soil Sci. 111,106
(1971). [12] Rootare, H. M., Deitz, V. R., and Carpenter, F. G., 1. Colloid
Sci. 17, 179 (1962). [13] Brown, W. E. (Gordon and Breach, Publishers). (In preparation.)
(Paper 77AI-759)
155

![N0 CI-, F-, sol-, and C0 on Pb Hydroxyapatitesoils.ifas.ufl.edu/lqma/PUBLICATION/Ma-94b.pdf · reaction with Pb, and both aqueous P and hydroxyapatite (HA) [Ca5(P04>sOH] ... 0.08](https://img.pdfslide.net/doc/110x75/5a960a8f7f8b9a8b5d8d43d5/n0-ci-f-sol-and-c0-on-pb-with-pb-and-both-aqueous-p-and-hydroxyapatite-ha.jpg)