Embed Size (px)
Citation preview

Department of Civil and Environmental Engineering
Division of Water Environment Technology
CHALMERS UNIVERSITY OF TECHNOLOGY
Master’s Thesis BOMX02-16-87
Gothenburg, Sweden 2016
Soluble microbial products
(SMP) and bacteriophages in
activated sludge
Master’s Thesis in the Master’s Programme Infrastructure and
Environmental Engineering, Nordic Master in Environmental Engineering
CECILIA BURZIO

MASTER’S THESIS BOMX02-16-87
Soluble microbial products (SMP) and
bacteriophages in activated sludge
Master’s Thesis in the Master’s Programme Infrastructure and Environmental
Engineering, Nordic Master in Environmental Engineering
CECILIA BURZIO
Department of Civil and Environmental Engineering
Division of Water Environment Technology
CHALMERS UNIVERSITY OF TECHNOLOGY

Göteborg, Sweden 2016
Soluble microbial products (SMP) and bacteriophages in activated sludge
Master’s Thesis in the Master’s Programme Infrastructure and Environmental
Engineering, Nordic Master in Environmental Engineering
CECILIA BURZIO
© CECILIA BURZIO, 2016
Examensarbete BOMX02-16-87/ Institutionen för bygg- och miljöteknik,
Chalmers tekniska högskola 2016
Department of Civil and Environmental Engineering
Division of Water Environment Technology
Chalmers University of Technology
SE-412 96 Göteborg
Sweden
Telephone: + 46 (0)31-772 1000
Department of Civil and Environmental Engineering
Göteborg, Sweden, 2016


I
Soluble microbial products (SMP) and bacteriophages in activated sludge
Master’s Thesis in the Master’s Programme Infrastructure and Environmental
Engineering, Nordic Master in Environmental Engineering
CECILIA BURZIO
Department of Civil and Environmental Engineering
Division of Water Environment Technology
Chalmers University of Technology
ABSTRACT
Soluble microbial products (SMPs) are the pool of organic compounds originated from
bacterial metabolism and decay and they constitute the major fraction of the soluble
organic carbon in the effluent from biological treatment processes. SMP occurrence and
characteristics are of a great significance with respect to discharge quality and
performance of wastewater treatment processes.
In this study, two sets of aerobic batch reactors were used to investigate the growth, the
organic carbon uptake and the release of SMPs by communities of bacteria fed with
different volatile fatty acids (VFAs) as carbon sources (formate, acetate, propionate,
butyrate). For each reactor, biomass growth, VFA biodegradation and SMP production
as dissolved organic carbon (DOC) were examined. The examination of molecular
weight (MW) distribution, analyzed with high performance size exclusion
chromatography (HPSEC), and spectroscopic parameters (absorbance spectrum,
specific ultraviolet absorbance (SUVA) and slope ratio (SR) allowed understanding the
pattern in the production of different types of SMP. The results revealed that the
investigated reactors produced SMPs in different concentrations and types, and they
were characterized by SUVA values <2 mg/L, reflecting hydrophilic characteristics.
The molecular weight (MW) distribution of the DOC varied from very low (<100 Da)
to high (>20 kDa). The calculated SR values revealed to be a good proxy for SMP MW
indicating a shift from low MW compounds to high MW along the course of the
experiments, in accordance with HPSEC results.
Parallel to this investigation, an attempt to isolate bacteriophages was carried out in
order to evaluate their impact on SMP production and to quantify their number in
different stages of a wastewater treatment plant. Bacteriophages, or phages, are viruses
that infect bacteria causing their lysis. They appear to be active components of activated
sludge communities and the most numerous entities. The double layer plaque protocol
was followed to isolated phages from activated sludge process treating urban sewage.
Bacterial isolates from the batch reactors were used as hosts. None of the bacterial
isolates supported plaque formation, suggesting that none of the strains were host for
the phages present in the activated sludge reactor. The lack of plaques prevented culture
counts. Enumeration of virus-like particle in a wastewater treatment plant was also
carried out using a tunable resistive pulse sensing technique. The results showed counts
of 109 to 1010 virus like particles, with higher abundance in the influent and activated
II
sludge reactor compared to the effluent. It was estimated that the virus like particles
could make up as much as 6-20% of the DOC in the effluent from the sampled
wastewater treatment plant.
KEY WORDS: soluble microbial products, aerobic batch reactors, volatile fatty acids,
molecular size distribution, bacteriophages.

III
ACKNOWLEDGEMENTS
I would like to thank my supervisor, Oskar Modin, for this stimulating task and his
support and knowledge that helped me accomplish the project. I extend my gratitude to
Raquel Liebana for her guidance and help.
I wish to thank my family and friends, who always encourage and support me.

CHALMERS Civil and Environmental Engineering, Master’s Thesis BOMX02-16-87
IV
CONTENTS
ABSTRACT ...................................................................................................................... I
CONTENTS ................................................................................................................... IV
1 Introduction ............................................................................................................... 1
1.1 Aim .................................................................................................................... 2
2 Literature review ....................................................................................................... 3
2.1 Activated sludge ................................................................................................ 3
2.1.1 Characteristic and properties of the biological flocs .................................. 3
2.1.2 Principle of biological oxidation ................................................................ 4
2.2 Soluble Microbial Products ............................................................................... 4
2.2.1 Analytical methods for SMPs ..................................................................... 6
2.2.2 SMP treatments .......................................................................................... 7
2.3 Bacteriophages ................................................................................................... 7
2.3.1 Relevance in wastewater treatment systems ............................................... 7
2.3.2 Detecting and counting bacteriophages: the plaque assay.......................... 8
2.4 Rya WWTP ........................................................................................................ 8
3 Methodology ........................................................................................................... 11
3.1 Experimental setup .......................................................................................... 11
3.1.1 Investigation of the activated sludge in batch culture systems ................. 11
3.1.2 Culture media ........................................................................................... 12
3.2 Modelling of the Batch Fermenter ................................................................... 14
3.3 Analysis ........................................................................................................... 14
3.4 Isolation of Bacteria ......................................................................................... 16
3.5 Isolation of Bacteriophages.............................................................................. 17
3.6 Enumeration of Bacteriophages ....................................................................... 17
3.7 Microscopy Analysis ....................................................................................... 18
4 Results and discussion ............................................................................................. 19
4.1 Investigation over the batch reactors ............................................................... 19
4.1.1 Biomass growth ........................................................................................ 19
4.1.2 Cell mass concentration ............................................................................ 19
4.1.3 Stoichiometric and kinetic coefficients .................................................... 23
4.1.4 Pigment production .................................................................................. 24
4.1.5 Substrate consumption and SMP production............................................ 24
CHALMERS Civil and Environmental Engineering, Master’s Thesis BOMX02-16-87
V
4.1.6 Spectroscopic methods ............................................................................. 27
Spectrum Curves ................................................................................................. 27
Slope ratio ............................................................................................................ 30
SUVA .................................................................................................................. 31
4.1.7 MW distribution of organic matter ........................................................... 31
Comparison with spectroscopic methods ............................................................ 36
4.2 Isolation of Bacteriophages.............................................................................. 36
4.3 Enumeration of Bacteriophages ....................................................................... 38
5 Conclusion ............................................................................................................... 41
5.1 Recommendations ............................................................................................ 42
Appendix ........................................................................................................................ 43

CHALMERS Civil and Environmental Engineering, Master’s Thesis BOMX02-16-87
VI
List of abbreviations
AS Activated Sludge
BAP Biomass Associated Product
DOC Dissolved Organic Carbon
EPS Extracellular Polymeric Substances
HPLC High Performance Liquid Chromatography
HPSEC High Performance Size Exclusion Chromatography
MBBR Moving Bed Biofilm Reactor
MLSS Mixed Liquor Suspended Solids
MLVSS Mixed Liquor Volatile Suspended Solids
MW Molecular Weight
OD Optical Density
SR Slope Ratio
SMP Soluble Microbial Products
SUVA Specific Ultraviolet Absorbance
TOC Total Organic Carbon
UAP Utilization Associated Products
VFA Volatile Fatty Acid
VLP Virus-like Particles
WWTP Waste Water Treatment Plant
ΔG° Gibbs free energy

CHALMERS Civil and Environmental Engineering, Master’s Thesis BOMX02-16-87
VII
List of tables
Table 2.1: analytical procedures and investigated parameters ......................................... 6
Table 2.2: Rya WWTP treatment chain............................................................................ 9
Table 3.1: composition of the four different media ........................................................ 13
Table 3.2: Composition of trace elements and Se/W solutions ...................................... 13
Table 3.3: analytical procedures and investigated parameters ....................................... 14
Table 3.4: HPSEC standards using polyethylene glycol. ............................................... 16
Table 3.5: general media composition ............................................................................ 17
Table 3.1: Gibbs free energy values for the organic carbon compounds ....................... 19
Table 3.2: yield coefficient, specific growth and death rate of the reactors ................... 23
Table 3.3: SMP production peaks in the first set of batch reactors ................................ 25
Table 3.4: Virus-like particle enumeration (Izon Science)............................................. 38
Table 3.5: Molecular weight calculation from Erickson's correlation ........................... 40
Table 3.6: contribution of the VLP to the wastewater DOC .......................................... 40
List of figures
Figure 2.1: Fractions of SMPs .......................................................................................... 5
Figure 3.1: schematic of the experimental setup ............................................................ 12
Figure 3.2: scheme of the WWTP and points of sampling ............................................. 18
Figure 3.1: optical density curves for the first set of batch reactors ............................... 20
Figure 3.2: optical density curves for the second set of batch reactors .......................... 21
Figure 3.3: OD and MLVSS correlation in the first batch reactors ................................ 22
Figure 3.4: OD and MLVSS correlation in the second batch reactors ........................... 22
Figure 3.5: picture of the yellow activated sludge fed with butyrate ............................. 24
Figure 3.6: substrate consumption and SMP production in the first set of batch reactors
........................................................................................................................................ 25
Figure 3.7: substrate consumption and SMP production in the second set of batch
reactors............................................................................................................................ 26
Figure 3.8: normalized SMP accumulation in relation to the total amount of biomass . 27
Figure 3.9: absorbance spectra of acetate and butyrate reactors of the first set ............. 28
Figure 3.10: absorbance spectra of acetate and butyrate reactors of the second set....... 29
Figure 3.11: Slope ratio values for the first set of reactors (left) and second set (right) 30
Figure 3.12: SUVA values distribution. On the left: first set. On the right: second set . 31
Figure 3.13: HPSEC results of the first set of acetate reactor ........................................ 32
Figure 3.14: HPSEC results of the first set of butyrate reactor ...................................... 33
Figure 3.15: HPSEC results of the second set of acetate reactor ................................... 34
Figure 3.16: HPSEC results of the second set of butyrate reactor ................................. 35
Figure 3.17: isolated bacterial population from the general media. Scale 10 μm .......... 36
Figure 3.18: images of the plate for Bacteriophages isolation dyed with methylene blue
........................................................................................................................................ 37
Figure 3.19: size histogram provided by Izon Science ................................................... 38

CHALMERS Civil and Environmental Engineering, Master’s Thesis BOMX02-16-87
1
1 INTRODUCTION
The activated sludge process is a widespread technique to treat municipal and industrial
wastewater biologically. It exploits the natural capacity of complex microbial
communities to remove pollutants from wastewater through oxidation of the organic
load. There is still a lack of understanding about the interrelationships of different
members in the activated sludge communities, and more work is needed to unravel the
activities taking place in the microbial black box.
Soluble microbial products (SMP) is one factor that affects the quality of wastewater
effluents and microbial activities in an unclear way. The organic carbon left in the
effluents from a biological treatment process consists of a wide variety of soluble
organic matter containing a small fraction of residual influent organic compounds and a
larger fraction SMP, which are produced during bacterial metabolism and decay (Barker
and Stuckey 1999; Laspidou and Rittmann 2002; Shin and Kang 2003). SMPs can
affect the treatment performance, not just in terms of effluent quality, but they can also
adversely affect the microbial community in terms of kinetic activity and settling
characteristics because of their flocculating, chelating and toxic properties (Yan,
Subramanian et al. 2007). SMPs may in some cases be even more toxic than the original
organic matter present in wastewater (Aquino and Stuckey 2002). Therefore, the
majority of the studies about these compounds have been directed to identify the SMP
species, to quantify their production, to evaluate the most efficient posttreatment
processes for their removal, and to assess the ways of reducing their production through
control of process parameters. Most of the work has been done on aerobic and anaerobic
systems with pure culture and/or defined feed and making use of this knowledge in a
real system still an uncompleted task. A better understanding of the dynamics can lead
to an optimization of the activated sludge process by minimizing SMPs and
consequently the residual chemical oxygen demand in the effluent. The knowledge
about SMPs is far from complete and more research needs to be directed to entirely
understand their influence on the treatment performance.
Another factor that may affect the performance of the activated sludge process is
predation by bacteriophages (phages). Phages, viruses infecting bacteria, are considered
the most numerous and diverse entities on our planet, with a ratio of phages to bacterial
cells of 10:1 in most of the studied ecosystem, including wastewater treatment plant
(WWTP) (Shapiro and Kushmaro 2011). Since they are the most abundant biological
entities in WWTP, it is believed that they play a central role in the ecology of activated
sludge. Most of the work in this field has been focused on the detection of virus-like
particles (VLP) as indicators of pathogenic viruses in the wastewater effluent (Baker
and Herson 1999). Little is known about bacteriophage activity on the microbial
ecology of activated sludge, but it has the potential to improve the performance and
effluent quality, and to control some of the process problems by regulating key bacterial
functional groups (Withey, Cartmell et al. 2005). However, before using phages to
manipulate and control environmental biotechnology processes, a better understanding
of phage interactions with their hosts is needed. It is also possible that phage activity
CHALMERS Civil and Environmental Engineering, Master’s Thesis BOMX02-16-87
2
has an effect on the characteristics of SMPs, since it is expected that a bacterial cell
lysed due to phage infection will release a range of SMP into the surrounding water.
Phage particles may themselves also contribute to the SMP concentration in the water.
1.1 AIM The main goal of this study is to investigate release of organic compounds by
microorganisms in activated sludge. The specific objectives of this work are:
i. To investigate the growth, the organic carbon uptake and the release of soluble
microbial products (SMPs) by communities of bacteria fed with different carbon
sources.
ii. To investigate spectrophotometric methods for the characterization of SMPs.
iii. To quantify the number of bacteriophages in different stages of a wastewater
treatment plant
iv. To isolate bacteria and bacteriophages and investigate the effect of their
interactions on SMP production.

CHALMERS Civil and Environmental Engineering, Master’s Thesis BOMX02-16-87
3
2 LITERATURE REVIEW
In this chapter, general background information are presented in order to provide the
reader a foundation for the data analysis.
2.1 ACTIVATED SLUDGE Activated sludge processes have been exploited for domestic and industrial wastewater
treatment since the last century (Ramalho 2012). The process consists of the oxidation
of soluble and particulate organic material, which serve as substrate for bacterial
growth, with oxygen or nitrite and nitrate driven by a flocculent slurry of
microorganisms, resulting in production of gaseous products and additional biomass.
The reactor in which the process occurs is aerated in order to provide mixing and
oxygen transfer. The solid fraction, which includes the biomass, is separated from the
effluent and recirculated in the system. The excess sludge is removed from the system
in order to maintain a desired solids retention time (Jenkins and Wanner 2014). The
domestic wastewater provides the inoculum, the biological nourishment and the
nutrients necessary for the microbial growth (Viessman, Hammer et al. 2009).
The aims of the activated sludge process are to reach high removal of nutrients and
organic compounds within a short time and to produce flocs that are easy to settle and
separate from the effluent (Wang, Pereira et al. 2009).
2.1.1 Characteristic and properties of the biological flocs
Activated sludge consists of several constituents such as growing microorganisms,
extracellular polymeric substances (EPS), organic and inorganic matter, suspended and
precipitated. The floc structure and properties are dependent on these constituents
together with other factors, i.e. the physicochemical characteristic of the inflow
(Nielsen, Thomsen et al. 2004).
The microbial community in activated sludge is very diverse. The bacterial fraction
dominates and is constituted mainly by aerobic heterotrophic bacteria. Heterotrophic
organisms use organic compounds as energy source and carbon source for synthesis of
new biomass (Viessman, Hammer et al. 2009). The presence of lithoautotropic bacteria,
which use CO2 as carbon source and oxidize an inorganic compound as energy source,
is also to be expected, such as nitrifying bacteria. Fungi may be present at low pH,
which is an uncommon characteristic for domestic wastewater treatment reactors
(Seviour, Blackall et al. 1999). Algae are microscopic photosynthetic plants, therefore
they thrive in presence of light, which may be relevant in open systems (Seviour,
Blackall et al. 1999). Protozoans are single-celled animals ingesting solid organic
matter, including bacteria and algae, for energy and carbon source. Metazoans are
multicelled animals that cope if the sludge age is high enough and feed on protozoans,
bacteria and solid organic matter. The flocs of activated sludge include most of the
important groups of microorganisms. Metazoans and protozoans, which continuously
CHALMERS Civil and Environmental Engineering, Master’s Thesis BOMX02-16-87
4
graze on the activated sludge flocs, are not part of them since they can break away from
them (Wang, Pereira et al. 2009).
Bacteria are the key player with the regards to floc characteristics and properties
(Nielsen, Thomsen et al. 2004). Therefore, the operating condition of the WWTP are
strongly dependent on the microbial community of the activated sludge. The
understanding of the role of the organisms in the activated sludge ecosystem leads to a
better control of the operation and to an improved performance (Nielsen, Thomsen et al.
2004). Single celled, floc forming or filamentous bacteria compose the bacterial
biocoenosis of activated sludge. All three types degrade organics.
2.1.2 Principle of biological oxidation
Bacteria take in nutrients and substrates and convert them into energy for their
metabolism, cell component and waste. The formula, which describes the complete
oxidation of organics by activated sludge bacteria in an aerated tank assuming a period
of infinite aeration, can be expressed as:
Organics (C, H, O) + biomass + O2 → CO2 + H2O + biomass + energy + microbial
products
It has been observed that when the wastewater is mixed with activated sludge in an
aeration tank a significant removal of organic matter occurs in the first few minutes
depending on the characteristics of the incoming liquid and activated sludge. This
process is interpreted as an adsorption phenomenon removing discrete and colloidal
particles. The adsorbed organic matter is subsequently oxidized or used in the synthesis
of cellular components (Wang, Pereira et al. 2009).
2.2 SOLUBLE MICROBIAL PRODUCTS Most bacteria produce three dissimilar microbial products: extracellular polymeric
substances (EPS), soluble microbial products (SMP) and inert biomass (Laspidou and
Rittmann 2002). EPS is a matrix of large polymeric molecules, the most abundant
components being polysaccharides, proteins and nucleic acids, and it constitutes the
microbial biofilm or the floc in a suspended culture (Laspidou and Rittmann 2002). EPS
carries out several important functions, i.e. aggregation of bacterial cells, adhesion of
microorganisms to a surface, protection against harmful external factors, retention of
water, concentration of organic matter and nutrients, accumulation of extracellular
enzymes (Laspidou and Rittmann 2002). Inert biomass is the part of the decayed active
biomass that has not been oxidized to generate energy for maintenance needs (Laspidou
and Rittmann 2002).
SMPs are defined as the group of soluble organic compounds released during bacterial
metabolism. SMPs can be classified in two typologies: biomass associated products
(BAPs), which are related to endogenous respiration, i.e. cell lysis and decay, and
utilization associated products (UAPs) associated with biomass growth and substrate
consumption (Namkung and Rittmann 1986). The UAPs are produced at a rate

CHALMERS Civil and Environmental Engineering, Master’s Thesis BOMX02-16-87
5
proportional to the rate of substrate uptake, while BAPs are produced at a rate
proportional to the concentration of biomass (Barker and Stuckey 2001). Therefore,
UAPs are expected to prevail in substrate-rich conditions, while BAPs are likely to be
found under substrate deficiency (Jarusutthirak and Amy 2007). SMPs are formed by a
complex pool of organic compounds, such as proteins, polysaccharides, humic
substances, nucleic acids, organic acids, amino acids, DNA, lipids, other carbohydrates,
etc. (Barker and Stuckey 1999). Small carbonaceous molecules derived from the
original substrate mostly compose UAPs, while BAPs are macromolecules composed
by both carbon and nitrogen (Urbain, Mobarry et al. 1998).
SMPs are produced during normal bacterial growth and metabolism. They are expelled
also to create a concentration equilibrium across the cell membrane. Other factors can
intensify their formation, such as starvation or unavailability of a required nutrient,
sudden increase in concentration of a carbon or energy source, environmental stress e.g.
osmotic shock and temperature changes (Barker and Stuckey 1999; Lebrun, Thieblin et
al. 1999). The characteristics of SMPs are dependent on the microbial populations, the
substrate and its utilization rate, and other physicochemical condition, such as pH,
temperature, redox potential, retention time etc. (Barker and Stuckey 1999; Shin and
Kang 2003).
An important parameter in their investigation is the molecular weight (MW)
distribution. It has been showed that the distribution is very wide (from <0.5 kDa to
>100 kDa), but is bimodal with a peak of distribution in the low molecular weight
(LMW) region (<1 kDa) and a spike in the high molecular weight (HMW) region (>10
kDa). UAPs are mostly distributed in the LMW region, while BAPs are mostly
composed of large molecules (Boero, Bowers et al. 1996).
Figure 2.1: Fractions of SMPs
SMPs
UAPs
prevail under substrate-rich conditions
production rate proportional to the rate of substrate uptake
LMW region (<1 kDa)
BAPs
prevail under substrate deficiency
production rate proportional to the concentration of
biomass
HMW region (>10 kDa)

CHALMERS Civil and Environmental Engineering, Master’s Thesis BOMX02-16-87
6
Most of the SMPs are biodegradable in both aerobic and anaerobic systems over a time
that is usually longer than the conventional hydraulic retention time of the processes
(Schiener, Nachaiyasit et al. 1998).
Most of the soluble organic matter in the effluent from a biological treatment process
has been proven to be SMP (Barker and Stuckey 1999; Jarusutthirak and Amy 2007).
The dissolved organic carbon (DOC) effluent from a biological process is composed by
the fraction of untreated DOC coming from the influent and the SMP formed during the
treatment (Lebrun, Thieblin et al. 1999). SMPs that remain in the effluent from the
wastewater process represent the upper limit of treatment performances, reducing the
efficiency of the system (Yan, Subramanian et al. 2007). Besides this issue, it has been
shown that membrane internal fouling is mainly due to these soluble microbial products
(Fonseca, Summers et al. 2007)
2.2.1 Analytical methods for SMPs
The identification of SMPs is challenging, since multiple unknown compounds
compose them and they do not belong to a specific group. As there is no standard
analysis for SMP characterization and identification, the comparison of results from
different studies is also difficult. Most of the studies focus on the general
characterization, even though greater knowledge of their composition is necessary to
understand their production mechanisms. Kunacheva and Stuckey (2014) summarized
methods for analyzing SMPs as shown in Table 2.1
Table 2.1: analytical procedures and investigated parameters
Parameter Methods of analysis
MW distribution Size Exclusion Chromatography (SEC); Gel-filtration
chromatography (GFC); Gel-permeation Chromatography;
Ultrafiltration (UF).
Identification of LMW
compounds
Gas Chromatography – Mass Spectrometry (GC-MS) with
matching libraries.
Hydrolysis of HMW
compounds
Acidic hydrolysis; Microwave radiation induced
hydrolysis; Alkaline hydrolysis; Enzymatic hydrolysis.
Protein content Lowry method; Excitation-emission matrix spectroscopy
(EEM); Resonance light scattering; Ion-exchange
Chromatography.
Total carbohydrates Titration; Gravimetric methods; Colorimetric methods; Gas
Chromatography (GC); High Performance Liquid
Chromatography (HPLC).
Aromaticity UV-Vis Spectrometry.
Functional Groups Nuclear Magnetic Resonance (NMR); Raman
spectrophotometry; Fourier Transformed Infrared
Spectrometry.
Biodegradability BOD test (aerobic system); Biochemical methane potential
(anaerobic system).
CHALMERS Civil and Environmental Engineering, Master’s Thesis BOMX02-16-87
7
2.2.2 SMP treatments
SMP production can be lowered by the optimization of the biological process.
Nevertheless, it is inevitable that some SMPs remain in the effluent from a biological
treatment process. MW distribution, biodegradability and SUVA characterization are
particularly useful for determining the efficiency and suitability of the posttreatment
removal techniques.
Many researchers have investigated advanced techniques for SMP removal, such as
activated carbon, membrane filtration techniques, synthetic resin absorption, ozonation,
chemical precipitation and breakpoint chlorination. SMP can be precursor for
trihalomethanes (THM), therefore chlorination may induce the formation of
carcinogenic by-products (Namkung and Rittmann 1988). Granular activated carbon
(GAC) appears to be the most effective method, with differences in performance
depending on the MW (Barker and Stuckey 1999).
2.3 BACTERIOPHAGES Bacteriophages, also named phages, are viruses that infect bacteria causing their lysis.
Viruses are obligate intracellular parasites and can replicate only inside a living host
cell, on which they rely for protein synthesis, energy and metabolic intermediates
production. They have a nucleic acid genome and an extracellular form, named virion,
which allows the movement from one host cell to another. The virion has a protection
function of the viral genome when outside the host cell and it presents on its surface
important protein for the attachment to the host cell. The infection process occurs when
the genome of the virus has entered the host cell. Inside the host, the virus can express
two different types of infection. In a lytic infection, the host metabolism is directed to
support virus replication and virion formation. The infection continues until the host cell
is destroyed and new virions are released. Alternatively, some viruses can undergo a
lysogenic infection in which the host cell is not destroyed but is genetically altered
because the viral genome becomes part of the host genome (Madigan, Martinko et al.
2014).
2.3.1 Relevance in wastewater treatment systems
The bacteriophage predation has raised interest in their potential application in
wastewater treatment, since bacteriophages appear to be active components of activated
sludge community (Hantula, Kurki et al. 1991). Epifluorescence microscopy has been
applied to estimate the total viral counts in activated sludge reactors and many
investigations reported a viral concentration of 108 to 109 virus like particles (VLP)/ml,
resulting to be the most numerous entities (Shapiro and Kushmaro 2011). Even though
there is little evidence of their activity directly altering activated sludge performance,
the application phages in wastewater treatment may provide long term and cost effective
techniques for improving effluent and sludge emissions into the environment (Withey,
Cartmell et al. 2005). The bactericidal action of phages is generally accepted to enhance
microbial diversification, which promotes resilience to perturbations of the community
of activated sludge and therefore stability of performance (Shapiro and Kushmaro
CHALMERS Civil and Environmental Engineering, Master’s Thesis BOMX02-16-87
8
2011). The microbial diversity control may be not the only the only potential of phage
mediated bacterial mortality. Phages could potentially be used in biological sludge
stabilization to regulate the abundance of specific pathogenic bacteria; improving
dewaterability and digestibility of waste activated sludge; the control of filamentous
bacteria; and reducing the competition between nuisance bacteria and functionally
relevant bacterial strains (Withey, Cartmell et al. 2005). The current understanding of
bacteriophages ecology is limited and it needs to be better investigated before starting
phage manipulation in activated sludge systems (Shapiro and Kushmaro 2011). It is also
possible that phage activity has an effect on the SMP concentration and composition in
activated cell. A microbial cell lysed because of a phage infection will release a range of
SMP into the surrounding water.
2.3.2 Detecting and counting bacteriophages: the plaque assay
In order for bacteriophages to replicate, host cells need to be cultivated either in liquid
form or as lawns over agar plates (Madigan, Martinko et al. 2014). Plaque assays are the
most spread technique for phage detection. With this technique, dilutions of the phage
preparations are mixed with a permissive host bacterium and they are disseminated onto
a semisolid medium, typically soft agar. During the incubation, the bacterial isolate
forms a turbid layer over the medium, and when the infection takes place clear spots
result in a localized zone, called plaques. This translucent area is determined by the cell
lysis and it expands until it is visible to the naked eye. In order to expand, a sufficient
yield of phage progeny needs to form from each bacterial cell (Kropinski, Mazzocco et
al. 2009). By counting the number of plaques, it is possible to calculate the titer of the
virus sample, expressed as plaque-forming units (PFU) per milliliter (Madigan,
Martinko et al. 2014). This method permits the isolation of bacteriophages, the
enumeration and also their characterization by plaque morphology. Plaques can be
different in size, present an halo and show either a clear or a turbid lysis (Kropinski,
Mazzocco et al. 2009).
2.4 RYA WWTP Rya wastewater treatment plant (WWTP) was built in 1972 and purifies wastewater for
an equivalent population of 730000 inhabitants and an average of 4000 liters of
wastewater per second pumped to the plant. It serves the municipalities of Ale,
Göteborg, Härryda, Kungälv, Lerum, Mölndal and Partille (Avfall Sverige 2013). The
WWTP is part of the regional sewage works of Göteborg region, run by Gryaab AB,
which is jointly owned by those municipalities. At the plant, the residual sludge product
from the wastewater is treated, biogas is produced and converted to green vehicle fuel.
The treated water is discharged into the river Göta älv in the proximity of the sea and
the dewatered sludge is used for landscaping (Gryaab AB 2011).
Pollutants in wastewaters consists of a complex mixture of organic and inorganic
contaminants (Ramalho 2012). The purpose of a WWTP is to reduce the discharge of
those contaminants to the receiving environment by the mean of particle separation and
biological processes. The treatment chain can be divided in three broad areas:
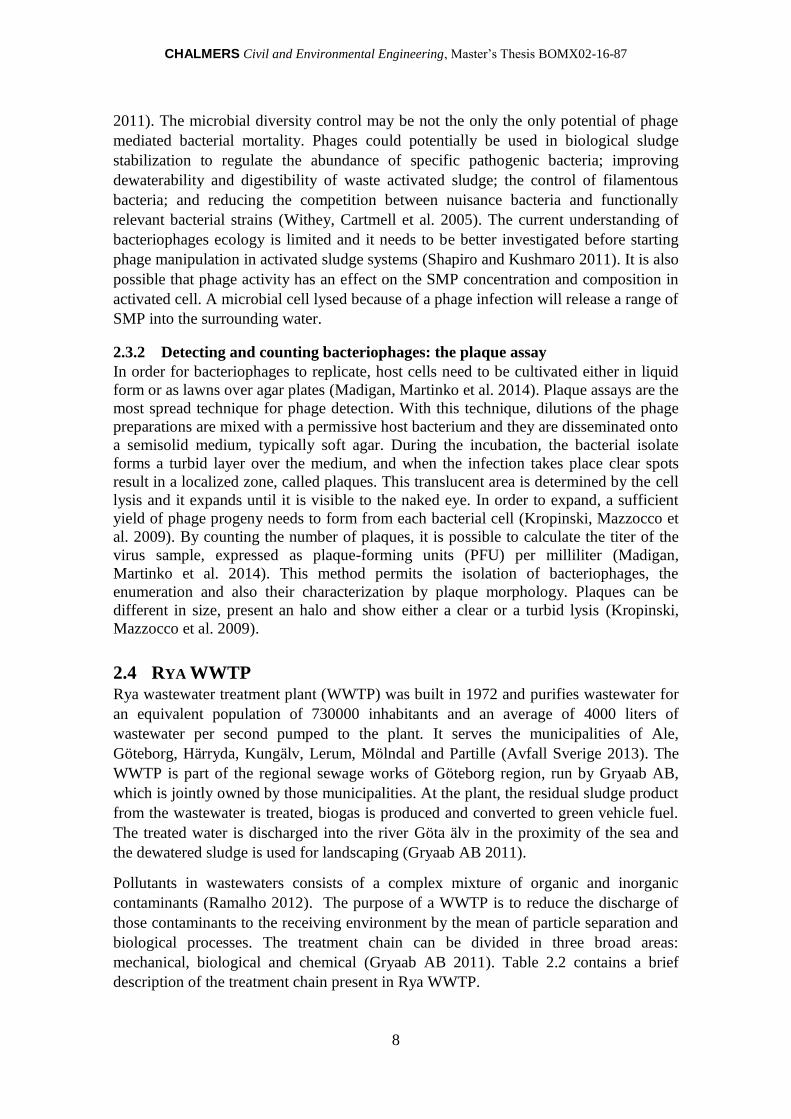
mechanical, biological and chemical (Gryaab AB 2011). Table 2.2 contains a brief
description of the treatment chain present in Rya WWTP.
CHALMERS Civil and Environmental Engineering, Master’s Thesis BOMX02-16-87
9
Table 2.2: Rya WWTP treatment chain
Operation Process description
Mechanical process
Coarse bar screen,
Sand trap,
Fine bar screen,
Primary sedimentation
Those steps constitute the primary treatment
in the treatment plant and are designed to
remove coarse material, gravel, sand and
suspended solids from the raw sewage.
Secondary sedimentation The secondary sedimentation tank is located
after the activated sludge tanks and it is
designed to separate the sludge from the
water. The biological sludge is formed by
bacteria and precipitated phosphate and it is
partly recirculated to the activated sludge
tanks, partly removed and treated
Disc filters The secondary effluent is filtered through
disc filters before being discharged to the
river. The filter consists of multiple cloths
vertically installed on rotating drums.
Gryaab’s disc filters have screen cloths with
15 micrometres holes.
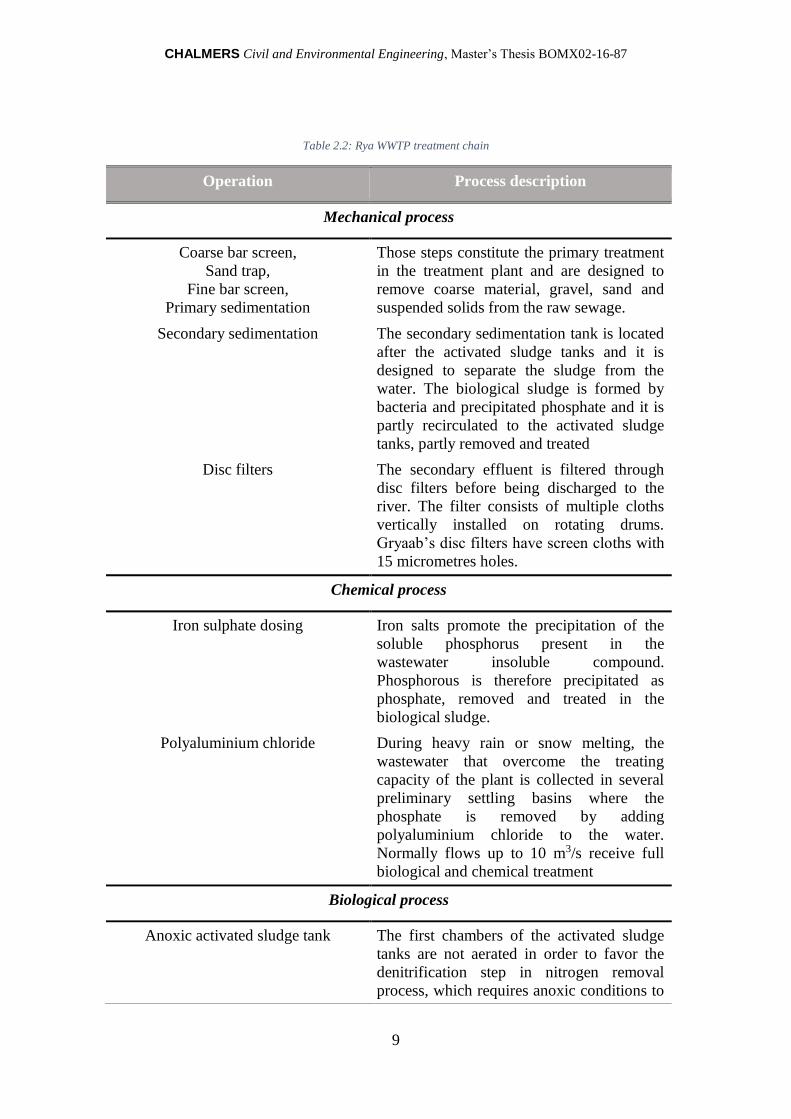
Chemical process
Iron sulphate dosing Iron salts promote the precipitation of the
soluble phosphorus present in the
wastewater insoluble compound.
Phosphorous is therefore precipitated as
phosphate, removed and treated in the
biological sludge.
Polyaluminium chloride During heavy rain or snow melting, the
wastewater that overcome the treating
capacity of the plant is collected in several
preliminary settling basins where the
phosphate is removed by adding
polyaluminium chloride to the water.
Normally flows up to 10 m3/s receive full
biological and chemical treatment
Biological process
Anoxic activated sludge tank The first chambers of the activated sludge
tanks are not aerated in order to favor the
denitrification step in nitrogen removal
process, which requires anoxic conditions to
CHALMERS Civil and Environmental Engineering, Master’s Thesis BOMX02-16-87
10
occur, since bacteria are forced to use nitrate
instead of oxygen for respiration.
Aerobic activated sludge tank In the aerobic tanks, the air is pumped in
order to promote organic carbon removal.
Trickling filters Blocks of corrugated plastic sheets support
the growth of a bacteria in a biofilm. In this
step, ammonia is converted to nitrite and
nitrate in a process called nitrification.
Moving Bed Biofilm Reactor (MBBR) The plant needed to be supplemented with
additional denitrification, therefore in 1997
an additional step was built to enhance
denitrification. The bacteria grow on a
moving plastic media, which allow the
microorganisms responsible for nitrogen
removal to be active over a longer period of
time compared to activated sludge condition.
An external carbon source is required and it
is dosed as methanol.
CHALMERS Civil and Environmental Engineering, Master’s Thesis BOMX02-16-87
11
3 METHODOLOGY
The experiments were carried in the Environmental Chemistry laboratory at the
department of Civil and Environmental Engineering, Chalmers University of
Technology. The activated sludge was collected in January 2016 from the Rya
wastewater treatment plant located in the city of Gothenburg. The AS was stored in a
refrigerator at a temperature of 4°C.
3.1 EXPERIMENTAL SETUP
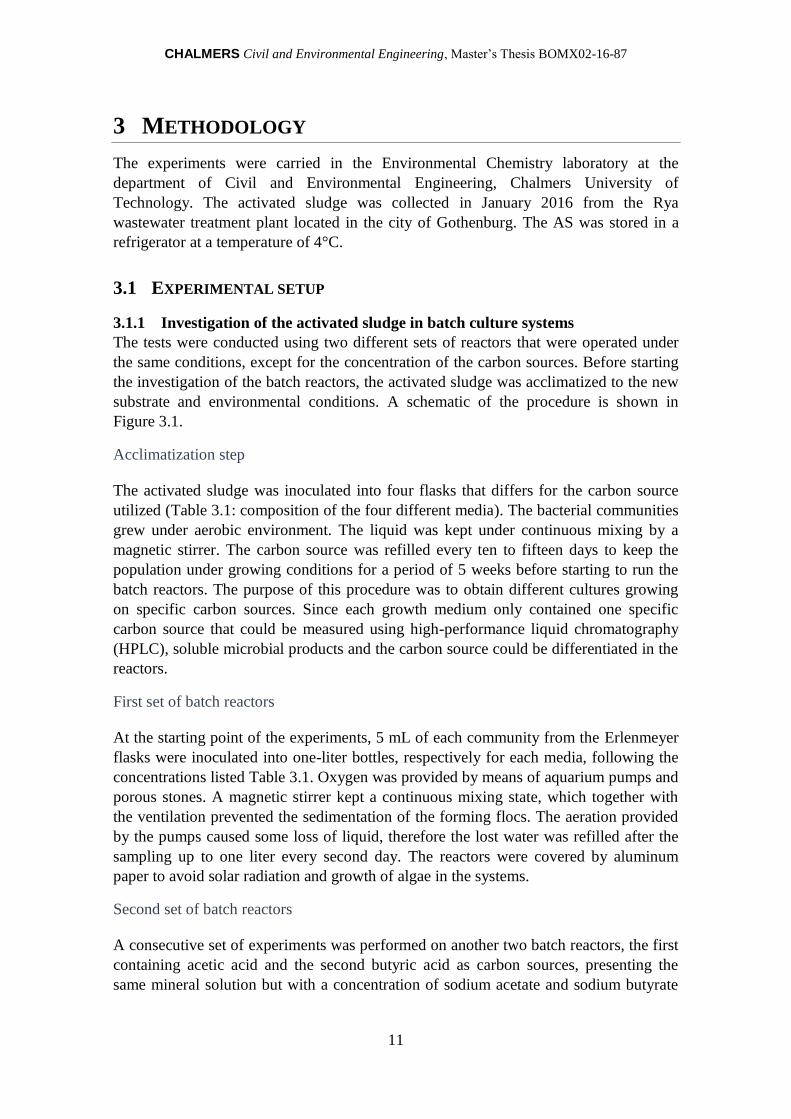
3.1.1 Investigation of the activated sludge in batch culture systems
The tests were conducted using two different sets of reactors that were operated under
the same conditions, except for the concentration of the carbon sources. Before starting
the investigation of the batch reactors, the activated sludge was acclimatized to the new
substrate and environmental conditions. A schematic of the procedure is shown in
Figure 3.1.
Acclimatization step
The activated sludge was inoculated into four flasks that differs for the carbon source
utilized (Table 3.1: composition of the four different media). The bacterial communities
grew under aerobic environment. The liquid was kept under continuous mixing by a
magnetic stirrer. The carbon source was refilled every ten to fifteen days to keep the
population under growing conditions for a period of 5 weeks before starting to run the
batch reactors. The purpose of this procedure was to obtain different cultures growing
on specific carbon sources. Since each growth medium only contained one specific
carbon source that could be measured using high-performance liquid chromatography
(HPLC), soluble microbial products and the carbon source could be differentiated in the
reactors.
First set of batch reactors
At the starting point of the experiments, 5 mL of each community from the Erlenmeyer
flasks were inoculated into one-liter bottles, respectively for each media, following the
concentrations listed Table 3.1. Oxygen was provided by means of aquarium pumps and
porous stones. A magnetic stirrer kept a continuous mixing state, which together with
the ventilation prevented the sedimentation of the forming flocs. The aeration provided
by the pumps caused some loss of liquid, therefore the lost water was refilled after the
sampling up to one liter every second day. The reactors were covered by aluminum
paper to avoid solar radiation and growth of algae in the systems.
Second set of batch reactors
A consecutive set of experiments was performed on another two batch reactors, the first
containing acetic acid and the second butyric acid as carbon sources, presenting the
same mineral solution but with a concentration of sodium acetate and sodium butyrate
CHALMERS Civil and Environmental Engineering, Master’s Thesis BOMX02-16-87
12
three times higher than the previous reactors. The inocula used in the second reactors
were extracted from the respective first set of batch reactors.
Figure 3.1: schematic of the experimental setup
3.1.2 Culture media
In order to grow, bacterial cells need a set of essential nutrients, which include: a carbon
source for cell material production; an energy source for carrying out the biochemical
reactions; a nitrogen source, for protein and nucleic acid synthesis; sulphur for amino
acid formation; macronutrients such as phosphorus, potassium, magnesium and calcium
for building cell components and enzymatic functions (Seviour, Blackall et al. 1999).
Those nutritional requirements were satisfied in the culture media used for the bacterial
growth. The compounds were diluted in deionized water in concentrations indicated in
Table 3.1 and Table 3.2. As previously mentioned, the four batch reactors differed just
for the carbon source utilized. The compounds added for organic carbon sources are
salts of short-chain fatty acids, also referred to as volatile fatty acids (VFAs).

CHALMERS Civil and Environmental Engineering, Master’s Thesis BOMX02-16-87
13
Table 3.1: composition of the four different media
Compounds Medium
1
Medium
2
Medium
3
Medium
4
Organic carbon source
Sodium formate CHNaO2 1133 mg/L - - -
Sodium acetate C2H3NaO2 - 683 mg/L - -
Sodium propionate C3H5NaO2 - - 534 mg/L -
Sodium butyrate C4H7NaO2 - - - 458 mg/L
Mineral solution
NaHCO3 1000 mg/L
NaNO3 700 mg/L
NaH2PO4 50 mg/L
MgSO4∙7H2O 200 mg/L
CaCl2∙2H2O 200 mg/L
KCl 200 mg/L
Trace elements 1 mL/L
Se/W 1 mL/L
Table 3.2: Composition of trace elements and Se/W solutions
Trace elements
FeCl2∙4H2O 2 g/L
H3BO3 0.05 g/L
ZnCl2 0.05 g/L
CuCl2 0.03 g/L
MnCl2∙4H2O 0.5 g/L
(NH4)Mo7O2∙4H2O 0.05 g/L
AlCl3 0.05 g/L
CoCl2∙6H2O 0.05 g/L
NiCl2 0.05 g/L
EDTA 0.5 g/L
HCl conc. 1 g/L
Se/W
Na2SeO3 0.1 mmol/L
Na2WO4∙2H2O 0.1 mmol/L
CHALMERS Civil and Environmental Engineering, Master’s Thesis BOMX02-16-87
14
3.2 MODELLING OF THE BATCH FERMENTER Equation 1 was used to describe the change in biomass concentration in the batch
reactors
𝑑𝑋
𝑑𝑡= 𝜇 𝑋 = −𝑌
𝑑𝑆
𝑑𝑡− 𝑘𝑑 𝑋 (1)
where X is the biomass concentration (mg MLVSS/L), S is the limiting substrate
concentration (mg VFA/L), t is time (d), μ is the growth rate (d-1), Y is the yield
coefficient (mg MLVSS/mg VFA), and kd is the decay coefficient (d-1). It was assumed
that the substrate was converted only into biomass and the maintenance rate was
neglected. The decay coefficient was determined from the endogenous respiration phase
of the batch experiments. The yield coefficient was determined from initial growth
phase.
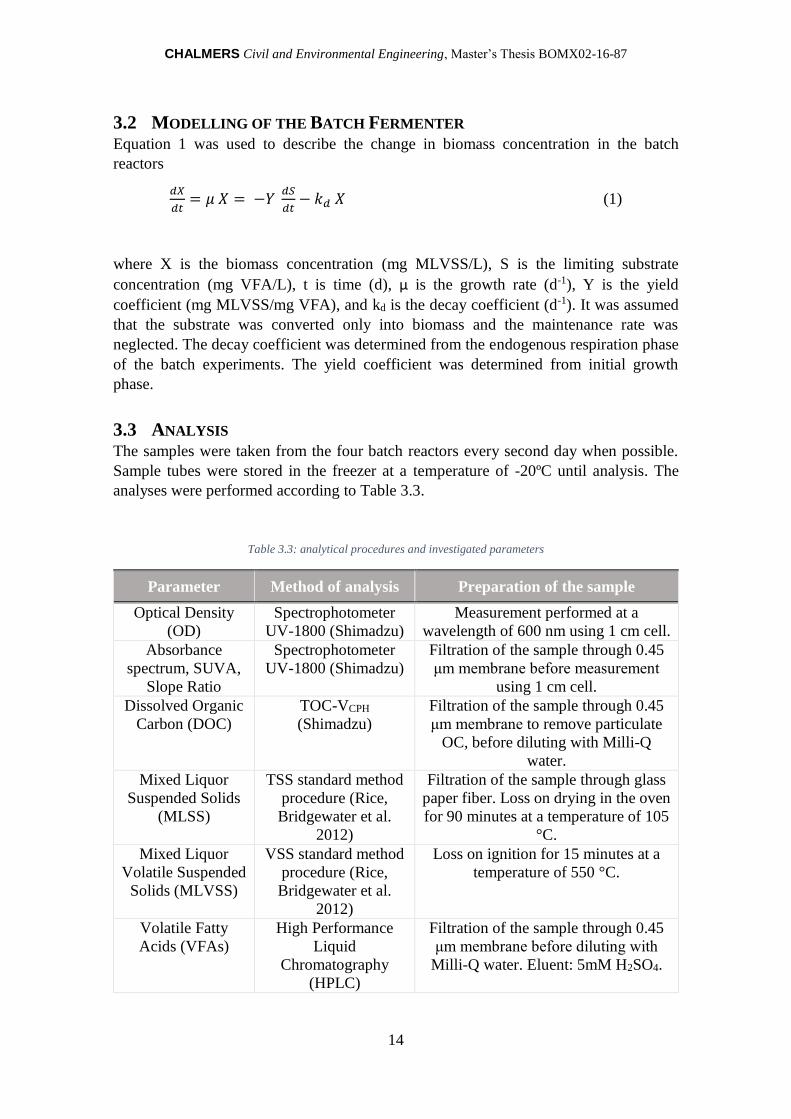
3.3 ANALYSIS The samples were taken from the four batch reactors every second day when possible.
Sample tubes were stored in the freezer at a temperature of -20ºC until analysis. The
analyses were performed according to Table 3.3.
Table 3.3: analytical procedures and investigated parameters
Parameter Method of analysis Preparation of the sample
Optical Density
(OD)
Spectrophotometer
UV-1800 (Shimadzu)
Measurement performed at a
wavelength of 600 nm using 1 cm cell.
Absorbance
spectrum, SUVA,
Slope Ratio
Spectrophotometer
UV-1800 (Shimadzu)
Filtration of the sample through 0.45
μm membrane before measurement
using 1 cm cell.
Dissolved Organic
Carbon (DOC)
TOC-VCPH
(Shimadzu)
Filtration of the sample through 0.45
μm membrane to remove particulate
OC, before diluting with Milli-Q
water.
Mixed Liquor
Suspended Solids
(MLSS)
TSS standard method
procedure (Rice,
Bridgewater et al.
2012)
Filtration of the sample through glass
paper fiber. Loss on drying in the oven
for 90 minutes at a temperature of 105
°C.
Mixed Liquor
Volatile Suspended
Solids (MLVSS)
VSS standard method
procedure (Rice,
Bridgewater et al.
2012)
Loss on ignition for 15 minutes at a
temperature of 550 °C.
Volatile Fatty
Acids (VFAs)
High Performance
Liquid
Chromatography
(HPLC)
Filtration of the sample through 0.45
μm membrane before diluting with
Milli-Q water. Eluent: 5mM H2SO4.
CHALMERS Civil and Environmental Engineering, Master’s Thesis BOMX02-16-87
15
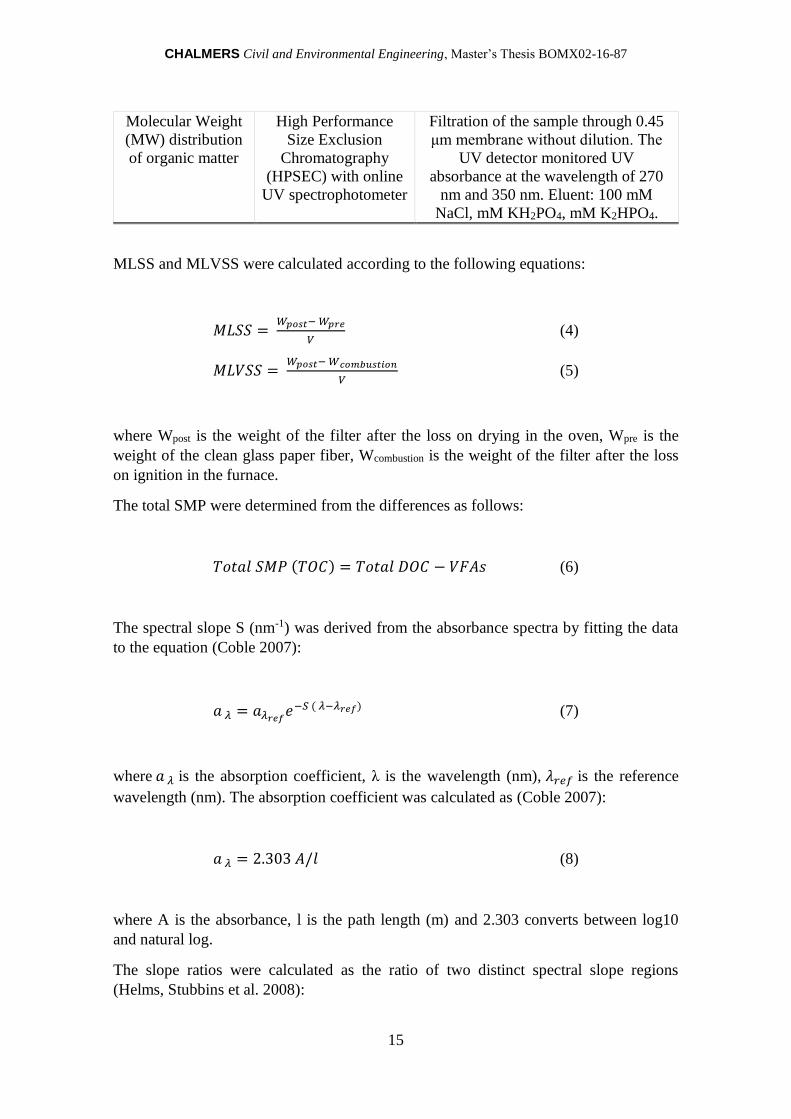
Molecular Weight
(MW) distribution
of organic matter
High Performance
Size Exclusion
Chromatography
(HPSEC) with online
UV spectrophotometer
Filtration of the sample through 0.45
μm membrane without dilution. The
UV detector monitored UV
absorbance at the wavelength of 270
nm and 350 nm. Eluent: 100 mM
NaCl, mM KH2PO4, mM K2HPO4.
MLSS and MLVSS were calculated according to the following equations:
𝑀𝐿𝑆𝑆 = 𝑊𝑝𝑜𝑠𝑡− 𝑊𝑝𝑟𝑒
𝑉 (4)
𝑀𝐿𝑉𝑆𝑆 = 𝑊𝑝𝑜𝑠𝑡− 𝑊𝑐𝑜𝑚𝑏𝑢𝑠𝑡𝑖𝑜𝑛
𝑉 (5)
where Wpost is the weight of the filter after the loss on drying in the oven, Wpre is the
weight of the clean glass paper fiber, Wcombustion is the weight of the filter after the loss
on ignition in the furnace.
The total SMP were determined from the differences as follows:
𝑇𝑜𝑡𝑎𝑙 𝑆𝑀𝑃 (𝑇𝑂𝐶) = 𝑇𝑜𝑡𝑎𝑙 𝐷𝑂𝐶 − 𝑉𝐹𝐴𝑠 (6)
The spectral slope S (nm-1) was derived from the absorbance spectra by fitting the data
to the equation (Coble 2007):
𝑎 𝜆 = 𝑎𝜆𝑟𝑒𝑓𝑒−𝑆 ( 𝜆−𝜆𝑟𝑒𝑓) (7)
where 𝑎 𝜆 is the absorption coefficient, λ is the wavelength (nm), 𝜆𝑟𝑒𝑓 is the reference
wavelength (nm). The absorption coefficient was calculated as (Coble 2007):
𝑎 𝜆 = 2.303 𝐴/𝑙 (8)
where A is the absorbance, l is the path length (m) and 2.303 converts between log10
and natural log.
The slope ratios were calculated as the ratio of two distinct spectral slope regions
(Helms, Stubbins et al. 2008):
CHALMERS Civil and Environmental Engineering, Master’s Thesis BOMX02-16-87
16
𝑆𝑅 =𝑠𝑙𝑜𝑝𝑒 𝑜𝑓 275−295 𝑛𝑚 𝑟𝑒𝑔𝑖𝑜𝑛
𝑠𝑙𝑜𝑝𝑒 𝑜𝑓 350−400 𝑛𝑚 𝑟𝑒𝑔𝑖𝑜𝑛 (9)
The Specific UV Absorbance (SUVA) was calculated from the ratio of 𝑎 254 (m-1) to
DOC concentration (mg/L) (Weishaar, Aiken et al. 2003).
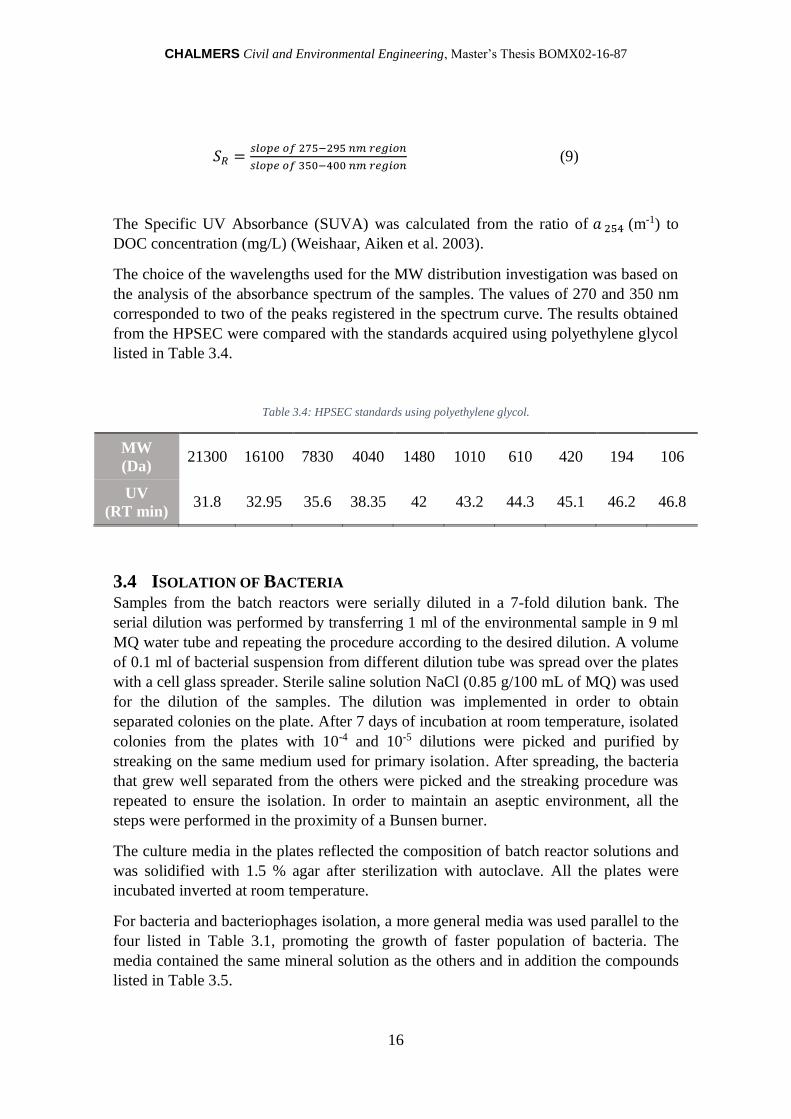
The choice of the wavelengths used for the MW distribution investigation was based on
the analysis of the absorbance spectrum of the samples. The values of 270 and 350 nm
corresponded to two of the peaks registered in the spectrum curve. The results obtained
from the HPSEC were compared with the standards acquired using polyethylene glycol
listed in Table 3.4.
Table 3.4: HPSEC standards using polyethylene glycol.
MW
(Da) 21300 16100 7830 4040 1480 1010 610 420 194 106
UV
(RT min) 31.8 32.95 35.6 38.35 42 43.2 44.3 45.1 46.2 46.8
3.4 ISOLATION OF BACTERIA Samples from the batch reactors were serially diluted in a 7-fold dilution bank. The
serial dilution was performed by transferring 1 ml of the environmental sample in 9 ml
MQ water tube and repeating the procedure according to the desired dilution. A volume
of 0.1 ml of bacterial suspension from different dilution tube was spread over the plates
with a cell glass spreader. Sterile saline solution NaCl (0.85 g/100 mL of MQ) was used
for the dilution of the samples. The dilution was implemented in order to obtain
separated colonies on the plate. After 7 days of incubation at room temperature, isolated
colonies from the plates with 10-4 and 10-5 dilutions were picked and purified by
streaking on the same medium used for primary isolation. After spreading, the bacteria
that grew well separated from the others were picked and the streaking procedure was
repeated to ensure the isolation. In order to maintain an aseptic environment, all the
steps were performed in the proximity of a Bunsen burner.
The culture media in the plates reflected the composition of batch reactor solutions and
was solidified with 1.5 % agar after sterilization with autoclave. All the plates were
incubated inverted at room temperature.
For bacteria and bacteriophages isolation, a more general media was used parallel to the
four listed in Table 3.1, promoting the growth of faster population of bacteria. The
media contained the same mineral solution as the others and in addition the compounds
listed in Table 3.5.

CHALMERS Civil and Environmental Engineering, Master’s Thesis BOMX02-16-87
17
Table 3.5: general media composition
Compound Concentration
Sodium Acetate 683 mg/L
Glucose 600 mg/L
Yeast extract 200 mg/L
NH4Cl 382 mg/L
3.5 ISOLATION OF BACTERIOPHAGES The double layer plaque assay was the protocol used to isolated bacteriophages. Phages
were inoculated from the supernatant of the activated sludge collected from Rya
WWTP. The supernatant was filtrated with 0.22 μm membrane to exclude bacteria from
the activated sludge sample and diluted in 10-fold dilutions with the same media used
for bacterial isolation. For each dilutions, 100 μL of the phage preparation was mixed
with 100 μL ml of overnight growing cultures of host bacteria and dispersed into 3 ml
soft agar media (0.4% agar). The tubes with soft agar media were kept in a water bath at
45°C in order to avoid the solidification of the media and maintain a harmless
temperature for the bacteria. The tubes were then mixed and poured on the top of a hard
agar Petri dish. Control plates with soft agar and bacterial isolates were prepared
without phage preparation. The soft agar layer prevented the virus from spreading from
the host cell to other surrounding uninfected cells. After the hardening of the soft agar,
the plates were inverted and incubated at room temperature. Plates were checked daily
for plaque formation.
Once observed, the plaques containing viruses were supposed to be picked and stored in
sterile media. The viruses thus isolated were intended to be tested on a different host, in
order to study the infectivity range over different bacterial isolates.
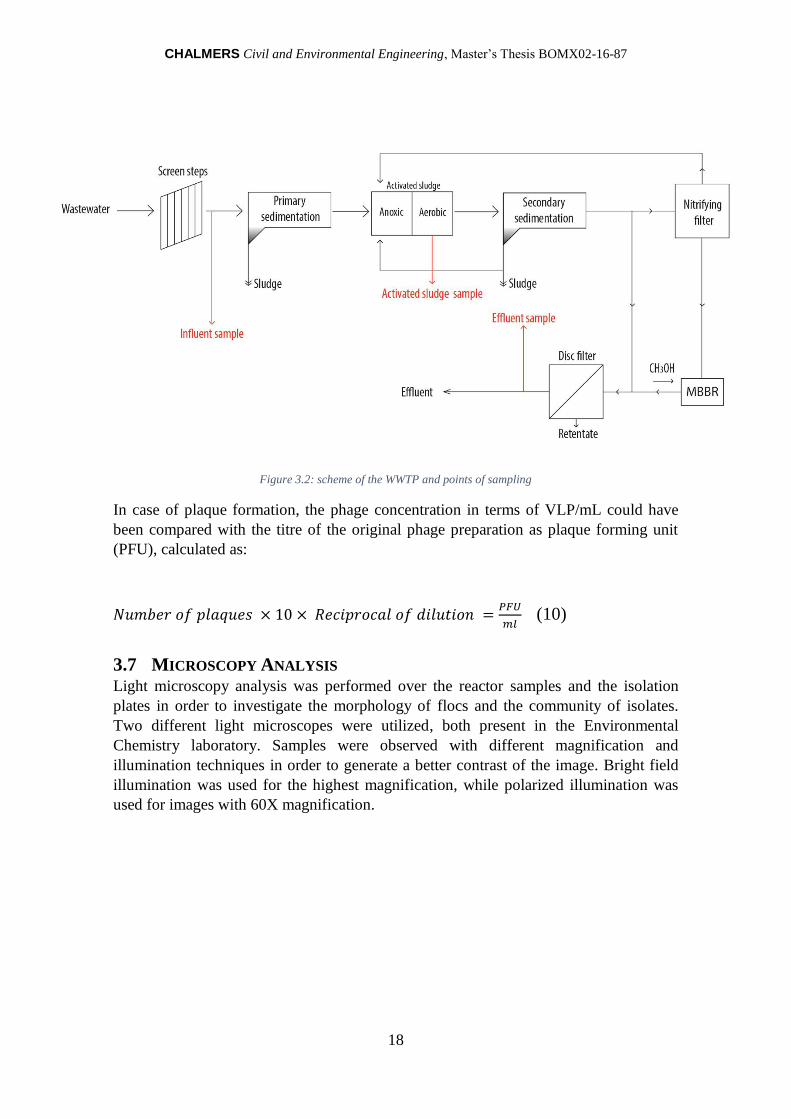
3.6 ENUMERATION OF BACTERIOPHAGES Wastewater samples from Rya WWTP were taken in three different positions of the
chain process (influent, aerated tank with activated sludge, effluent, as shown in Figure
3.2), then filtered through 0.22 μm membrane and sent to Izon Science for enumeration
of viruses in terms of virus like particles (VLP) per liter. The measurement
methodology, known as Tunable Resistive Pulse Sensing (TRPS), exploits dynamically
resizable nanopores for real-time particle detection, quantitation and characterization
(IZONscience 2015). The pore size NP150, which is suitable for VLP between 80 and
200 nm, was used.
CHALMERS Civil and Environmental Engineering, Master’s Thesis BOMX02-16-87
18
Figure 3.2: scheme of the WWTP and points of sampling
In case of plaque formation, the phage concentration in terms of VLP/mL could have
been compared with the titre of the original phage preparation as plaque forming unit
(PFU), calculated as:
𝑁𝑢𝑚𝑏𝑒𝑟 𝑜𝑓 𝑝𝑙𝑎𝑞𝑢𝑒𝑠 × 10 × 𝑅𝑒𝑐𝑖𝑝𝑟𝑜𝑐𝑎𝑙 𝑜𝑓 𝑑𝑖𝑙𝑢𝑡𝑖𝑜𝑛 =𝑃𝐹𝑈
𝑚𝑙 (10)
3.7 MICROSCOPY ANALYSIS Light microscopy analysis was performed over the reactor samples and the isolation
plates in order to investigate the morphology of flocs and the community of isolates.
Two different light microscopes were utilized, both present in the Environmental
Chemistry laboratory. Samples were observed with different magnification and
illumination techniques in order to generate a better contrast of the image. Bright field
illumination was used for the highest magnification, while polarized illumination was
used for images with 60X magnification.

CHALMERS Civil and Environmental Engineering, Master’s Thesis BOMX02-16-87
19
4 RESULTS AND DISCUSSION
4.1 INVESTIGATION OVER THE BATCH REACTORS
4.1.1 Biomass growth
Based on the growth media, different population of bacteria arose and established in the
reactors. Considering the carbon source and the supply of oxygen to satisfy the
biochemical oxygen demand in the process, it is likely that the dominant populations
were organoheterotrophic bacteria, oxidizing the organic carbon to CO2. Based on the
assumption that the organic carbon was degraded through an aerobic respiration
process, different free energy values (ΔG°) are obtained depending on the nature of the
substrate. Table 4.1 shows the calculated free energy values for one mole of each salt of
VFAs. The higher ΔG°, the higher is the bacterial yield and thus biomass level (Kuo,
Sneve et al. 1996).
Table 4.1: Gibbs free energy values for the organic carbon compounds
Compound Structural
formula
Biological decomposition of one
mole of substrate under aerobic
conditions
Gibbs free
energy ΔG°298
(kJ/ C)
Formate HCOO- HCOO- + 0.5O2 → HCO3- -236.06
Acetate CH3COO- CH3COO-+ 2O2 → HCO3
- + CO2
+ H2O -423.2
Propionate CH3CH2COO- CH3CH2COO- + 3.5O2 → HCO3
-
+ 2CO2 + 2H2O -494.77
Butyrate CH3(CH2)2COO- CH3(CH2)2COO- + 5O2 → HCO3
-
+ 3CO2 + 3H2O -532.32
As can be seen from the calculations, the higher is the number of carbon atoms in the
compound, the higher is the ΔG° obtained. Butyrate, which has four carbon atoms, leads
to the highest result, followed by propionate, acetate and formate, respectively.
Therefore, it was expected that butyrate fed reactor led to a greater biomass level
compared to the other three VFAs.
4.1.2 Cell mass concentration
The bacterial growth in a culture can be determined by measuring the cell number. The
cell density was measured optically by a spectrophotometer, which determines the
turbidity of a solution by measuring the amount of light that passed through a
suspension of cells. The cells scatter the light beam passing through the cuvette and the
scattering intensity or turbidity, also called optical density OD, is proportional to the
bacterial density (Widdel 2007). The OD of a culture depends on the wavelength used;

CHALMERS Civil and Environmental Engineering, Master’s Thesis BOMX02-16-87
20
as previously mentioned, a wavelength of 600 nm was chosen. Based on the results
presented in the graphs below (Figure 4.1 and Figure 4.2), it was possible to estimate
the different growth phases for the bacterial population in the batch culture.
Figure 4.1: optical density curves for the first set of batch reactors
The shape of the graph in Figure 4.1 shows similar biomass growth curves for the
reactors fed with butyrate, propionate and acetate, while in case of formate the pattern is
different. In this reactor, as expected from the free energy results, the growth appeared
to be slower and it led to a lower biomass level, reaching a maximum of OD=0.033 at
the end of the experiments. By the end of the test, the biomass grown on formate still
presented a growing trend as opposed to propionate and butyrate reactors, which
showed a decline. The reactor fed with acetate exhibited a higher development of
biomass than formate, reaching a peak of OD=0.074. After this day, the cell density
showed a decline, followed by a stationary phase, even though the organic carbon
source provided was totally consumed by the 11th day as shown by the results of the
HPLC (Figure 4.6). A possible explanation to those results may lie in the fact that
another population of bacteria with different metabolic needs overcame the previous
dominant one responsible for acetate depletion. The propionate reactor presented the
greatest cell density values equal to an OD of 0.088, slightly higher than the peak
reached by butyrate (OD=0.083). On the other hand, butyrate presented a longer
stationary phase from day 11th to day 15th compared to propionate, and it showed a
significantly faster and higher development of biomass level in the first 10 days of
incubation, leading to a quicker depletion of the carbon source.
CHALMERS Civil and Environmental Engineering, Master’s Thesis BOMX02-16-87
21
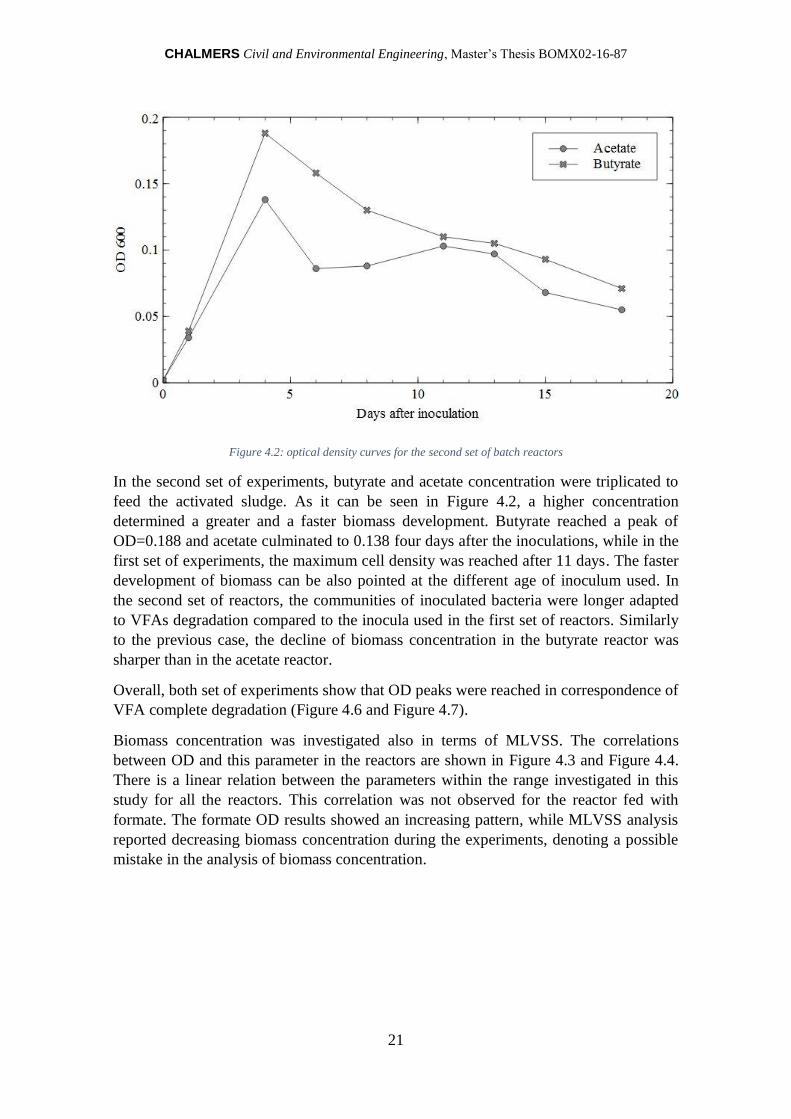
Figure 4.2: optical density curves for the second set of batch reactors
In the second set of experiments, butyrate and acetate concentration were triplicated to
feed the activated sludge. As it can be seen in Figure 4.2, a higher concentration
determined a greater and a faster biomass development. Butyrate reached a peak of
OD=0.188 and acetate culminated to 0.138 four days after the inoculations, while in the
first set of experiments, the maximum cell density was reached after 11 days. The faster
development of biomass can be also pointed at the different age of inoculum used. In
the second set of reactors, the communities of inoculated bacteria were longer adapted
to VFAs degradation compared to the inocula used in the first set of reactors. Similarly
to the previous case, the decline of biomass concentration in the butyrate reactor was
sharper than in the acetate reactor.
Overall, both set of experiments show that OD peaks were reached in correspondence of
VFA complete degradation (Figure 4.6 and Figure 4.7).
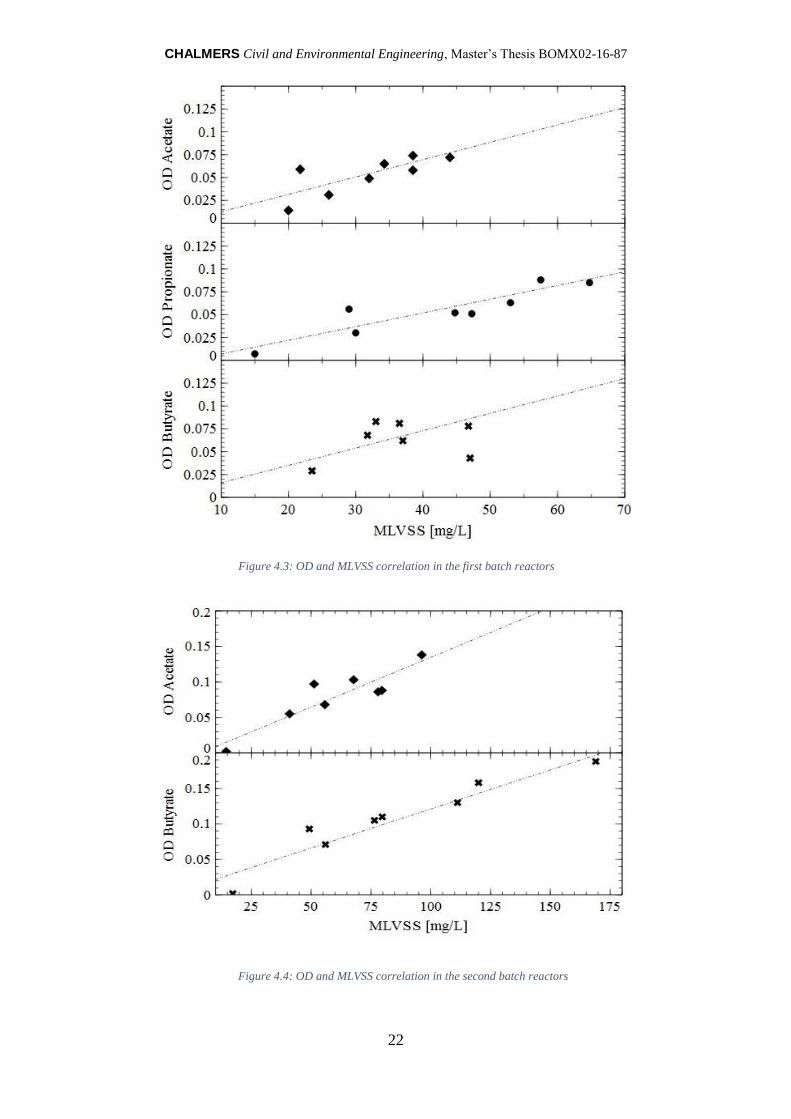
Biomass concentration was investigated also in terms of MLVSS. The correlations
between OD and this parameter in the reactors are shown in Figure 4.3 and Figure 4.4.
There is a linear relation between the parameters within the range investigated in this
study for all the reactors. This correlation was not observed for the reactor fed with
formate. The formate OD results showed an increasing pattern, while MLVSS analysis
reported decreasing biomass concentration during the experiments, denoting a possible
mistake in the analysis of biomass concentration.
CHALMERS Civil and Environmental Engineering, Master’s Thesis BOMX02-16-87
22
Figure 4.3: OD and MLVSS correlation in the first batch reactors
Figure 4.4: OD and MLVSS correlation in the second batch reactors
CHALMERS Civil and Environmental Engineering, Master’s Thesis BOMX02-16-87
23
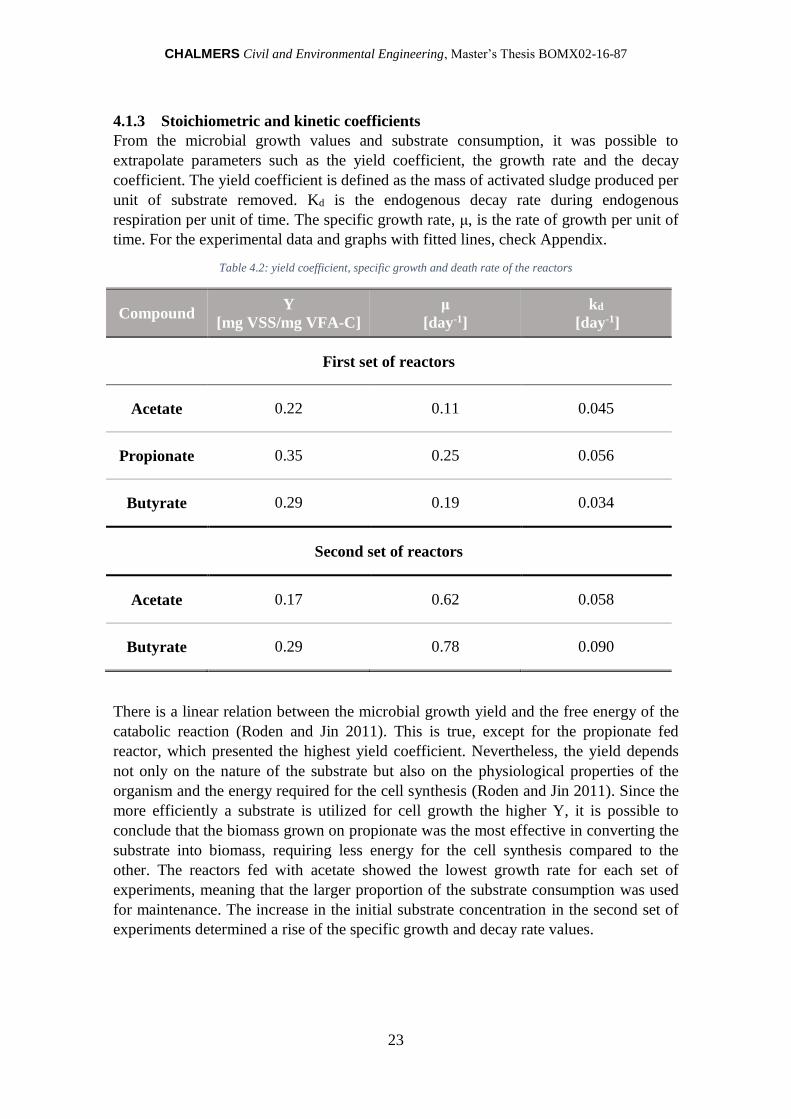
4.1.3 Stoichiometric and kinetic coefficients
From the microbial growth values and substrate consumption, it was possible to
extrapolate parameters such as the yield coefficient, the growth rate and the decay
coefficient. The yield coefficient is defined as the mass of activated sludge produced per
unit of substrate removed. Kd is the endogenous decay rate during endogenous
respiration per unit of time. The specific growth rate, μ, is the rate of growth per unit of
time. For the experimental data and graphs with fitted lines, check Appendix.
Table 4.2: yield coefficient, specific growth and death rate of the reactors
Compound Y
[mg VSS/mg VFA-C]
μ
[day-1]
kd
[day-1]
First set of reactors
Acetate 0.22 0.11 0.045
Propionate 0.35 0.25 0.056
Butyrate 0.29 0.19 0.034
Second set of reactors
Acetate 0.17 0.62 0.058
Butyrate 0.29 0.78 0.090
There is a linear relation between the microbial growth yield and the free energy of the
catabolic reaction (Roden and Jin 2011). This is true, except for the propionate fed
reactor, which presented the highest yield coefficient. Nevertheless, the yield depends
not only on the nature of the substrate but also on the physiological properties of the
organism and the energy required for the cell synthesis (Roden and Jin 2011). Since the
more efficiently a substrate is utilized for cell growth the higher Y, it is possible to
conclude that the biomass grown on propionate was the most effective in converting the
substrate into biomass, requiring less energy for the cell synthesis compared to the
other. The reactors fed with acetate showed the lowest growth rate for each set of
experiments, meaning that the larger proportion of the substrate consumption was used
for maintenance. The increase in the initial substrate concentration in the second set of
experiments determined a rise of the specific growth and decay rate values.

CHALMERS Civil and Environmental Engineering, Master’s Thesis BOMX02-16-87
24
4.1.4 Pigment production
The reactor fed with butyrate showed after one week of incubation a yellow color
(Figure 4.5). Under specific growth condition, bacterial cells accumulate pigments
(Kirti, Amita et al. 2014). The bright yellow color disappeared towards the end of the
experiments, when the butyrate was completely consumed by the bacteria.
In the second batch, no yellow-pigmented bacteria were observed. This may be due to
the fact that several factors affect microbial pigment production such as temperature of
incubation, pH of the medium, the type of carbon and nitrogen source (Joshi, Attri et al.
2003). None of these features was modified except for the concentration of the carbon
source, which was triplicated. An explanation to this result may lie in the different
initial microbial population inoculated in the reactors. In the second reactor, the initial
population was taken from the microorganisms of the first reactor. Another possible
explanation may be a spontaneous mutation, which occurs due to occasional errors in
the pairing of bases by DNA polymerase during DNA replication leading to the loss of
enzyme in biosynthetic pathway responsible for pigment productions (Madigan,
Martinko et al. 2014).
4.1.5 Substrate consumption and SMP production
The depletion of the different substrate and the production of SMP are shown in Figure
4.6 and Figure 4.7.
Regarding the first set, it was observed that VFA concentrations decreased rapidly from
the fourth to the 11th day after the inoculation in all the reactors except for the formate.
Hence, the slower depletion of the first four days can be pointed to an acclimatization
period. The slow depletion of carbon source in formate fed reactor justified the slow
growth of the activated sludge observed in the OD results (Figure 4.1). The peaks in
SMP concentration were registered in the growing phases of the activated sludge. The
results, showed in Table 4.3, seem to reflect the free energy results. The higher the ΔG°
obtained from the compound the higher is the SMP maximum concentration.
Figure 4.5: picture of the yellow activated sludge fed with butyrate

CHALMERS Civil and Environmental Engineering, Master’s Thesis BOMX02-16-87
25
Table 4.3: SMP production peaks in the first set of batch reactors
Carbon Source Formate Acetate Propionate Butyrate
Maximum SMP
concentration [mg C/L] 39.25 48.72 60.50 82.55
Days after inoculation 0 0 6 4
The samples of the first day of experiments were taken from two to three hours after the
inoculation. The high SMP concentration measured for those samples may suggest that
SMP production was a relatively fast process.
Figure 4.6: substrate consumption and SMP production in the first set of batch reactors
CHALMERS Civil and Environmental Engineering, Master’s Thesis BOMX02-16-87
26
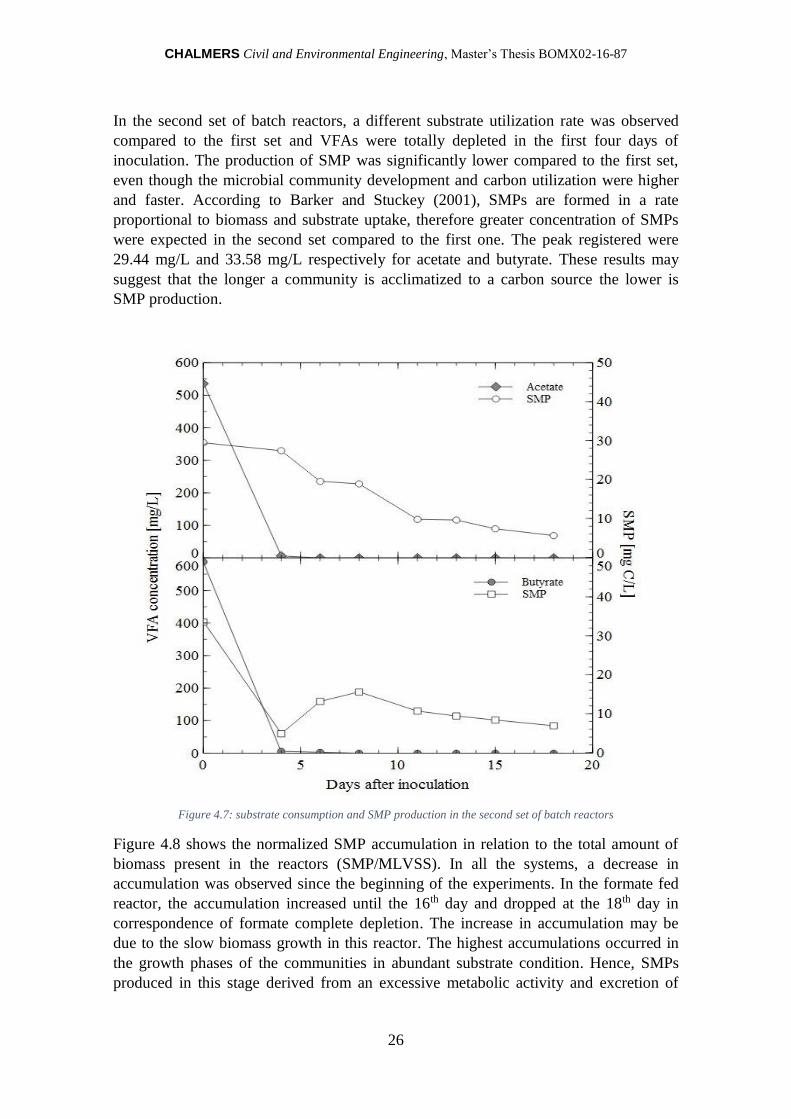
In the second set of batch reactors, a different substrate utilization rate was observed
compared to the first set and VFAs were totally depleted in the first four days of
inoculation. The production of SMP was significantly lower compared to the first set,
even though the microbial community development and carbon utilization were higher
and faster. According to Barker and Stuckey (2001), SMPs are formed in a rate
proportional to biomass and substrate uptake, therefore greater concentration of SMPs
were expected in the second set compared to the first one. The peak registered were
29.44 mg/L and 33.58 mg/L respectively for acetate and butyrate. These results may
suggest that the longer a community is acclimatized to a carbon source the lower is
SMP production.
Figure 4.7: substrate consumption and SMP production in the second set of batch reactors
Figure 4.8 shows the normalized SMP accumulation in relation to the total amount of
biomass present in the reactors (SMP/MLVSS). In all the systems, a decrease in
accumulation was observed since the beginning of the experiments. In the formate fed
reactor, the accumulation increased until the 16th day and dropped at the 18th day in
correspondence of formate complete depletion. The increase in accumulation may be
due to the slow biomass growth in this reactor. The highest accumulations occurred in
the growth phases of the communities in abundant substrate condition. Hence, SMPs
produced in this stage derived from an excessive metabolic activity and excretion of
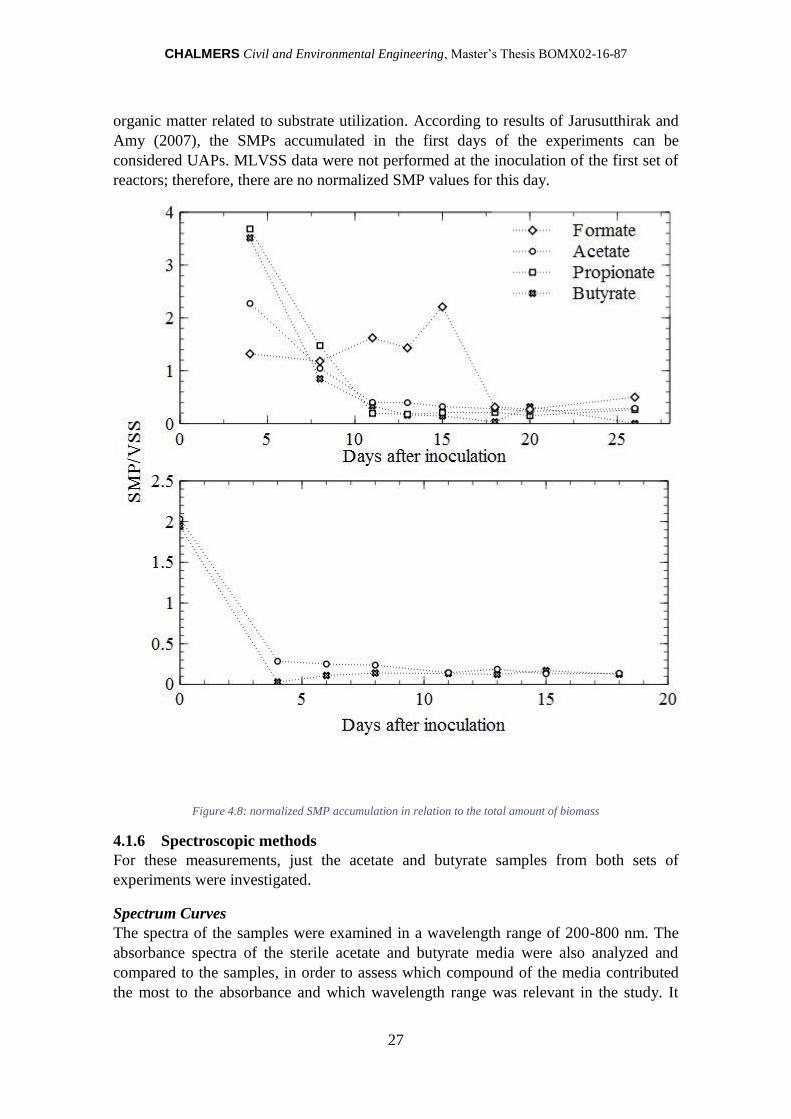
CHALMERS Civil and Environmental Engineering, Master’s Thesis BOMX02-16-87
27
organic matter related to substrate utilization. According to results of Jarusutthirak and
Amy (2007), the SMPs accumulated in the first days of the experiments can be
considered UAPs. MLVSS data were not performed at the inoculation of the first set of
reactors; therefore, there are no normalized SMP values for this day.
Figure 4.8: normalized SMP accumulation in relation to the total amount of biomass
4.1.6 Spectroscopic methods
For these measurements, just the acetate and butyrate samples from both sets of
experiments were investigated.
Spectrum Curves
The spectra of the samples were examined in a wavelength range of 200-800 nm. The
absorbance spectra of the sterile acetate and butyrate media were also analyzed and
compared to the samples, in order to assess which compound of the media contributed
the most to the absorbance and which wavelength range was relevant in the study. It
CHALMERS Civil and Environmental Engineering, Master’s Thesis BOMX02-16-87
28
was established that sodium nitrate NaNO3 was the responsible chemical for the high
absorbance (Abs>3) in the range from 200 to 230 nm and for the smaller peaks
registered around 300 nm (see Appendix).
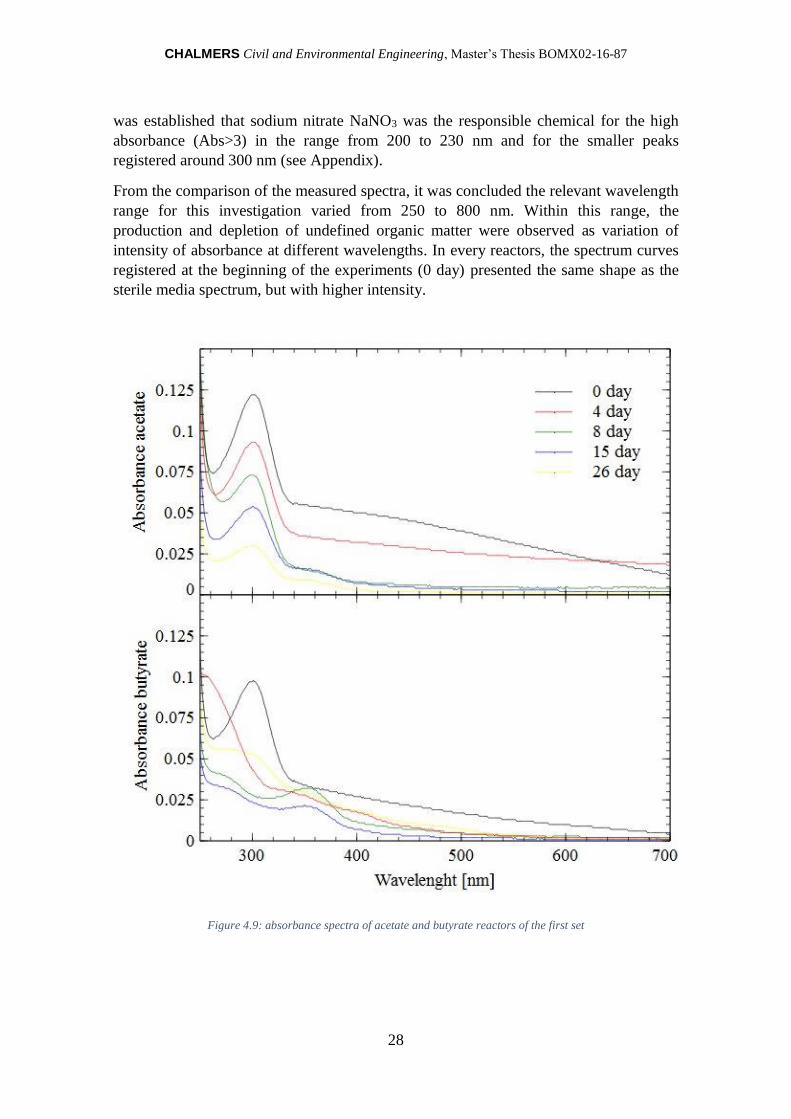
From the comparison of the measured spectra, it was concluded the relevant wavelength
range for this investigation varied from 250 to 800 nm. Within this range, the
production and depletion of undefined organic matter were observed as variation of
intensity of absorbance at different wavelengths. In every reactors, the spectrum curves
registered at the beginning of the experiments (0 day) presented the same shape as the
sterile media spectrum, but with higher intensity.
Figure 4.9: absorbance spectra of acetate and butyrate reactors of the first set

CHALMERS Civil and Environmental Engineering, Master’s Thesis BOMX02-16-87
29
Regarding acetate fed reactor in the first set of experiments (Figure 4.9), it is possible to
observe the decrease of the peak registered at 300 nm along the duration of the
experiments. Hence, the decrement of the absorbance can be interpreted as the result of
the biodegradation of DOC. The results obtained from butyrate fed reactor show a
different pattern. Eight days after inoculation, another two peaks appeared on the curve
around 260 and 400 nm, suggesting the possible formation of other kinds of SMPs with
different molecular structure. Those peaks disappeared by the end of the experiment,
reflecting biomass degradation.
Figure 4.10: absorbance spectra of acetate and butyrate reactors of the second set
In acetate second reactor (Figure 4.10) two peaks appeared in correspondence of 250
and 350 nm denoting possible production of SMP species different from the respective

CHALMERS Civil and Environmental Engineering, Master’s Thesis BOMX02-16-87
30
reactor in the first set. In butyrate reactor, the same peaks were registered as in the
previous one but with a smaller intensity.
From the spectrum curves, it is possible to understand that compounds with different
wavelength absorbance were produced in the reactors, even among those fed by the
same carbon source, suggesting production of different SMP species. As previously
mentioned, the only different parameters differentiating the first set from the second of
experiments were the higher concentration of VFAs and the “age” of the microbial
community. Therefore, the two mentioned parameters seem to influence the SMP
species production.
Different intensity peaks were also registered, but there was no correlation with SMP
concentration. The highest intensity was detected in the second acetate reactor, which
showed the lowest SMP concentration, as shown in Figure 4.7. Therefore, this results
suggested that the measured intensity cannot be correlated to the absolute SMP
concentration and there are some SMPs that may not be detected by the
spectrophotometer.
Slope ratio
The slope ratio SR was demonstrated to be a good proxy for dissolved organic matter
MW in different kinds of water. SR are generally lower for the HMW fraction compared
to the LMW region (Helms, Stubbins et al. 2008). In all the reactors, SR values
decreased with time. Therefore, the calculated values indicate a shift from LMW
compounds to HMW along the course of the experiments. This result seems to be in
accordance to the MW of SMP types. LMW compounds characterize UAPs, which are
expected to be formed in substrate rich condition at the start of the experiment, while
BAPs, which consist in HMW organic matter, are related to endogenous respiration at
the end of the test when the substrate is consumed.
Figure 4.11: Slope ratio values for the first set of reactors (left) and second set (right)

CHALMERS Civil and Environmental Engineering, Master’s Thesis BOMX02-16-87
31
SUVA
The Specific UV Absorbance (SUVA), determined at 254 nm, represents an index of
aromaticity of the organic matter of the samples. In this wavelength range, the UV
absorbance of DOC reflects the existence of unsaturated double bonds and π→π
interaction like in aromatic compounds (Ates, Kitis et al. 2007).
Figure 4.12: SUVA values distribution. On the left: first set. On the right: second set
In all the reactors, SUVA pattern exhibited two peaks followed by a declining curve as
can be seen in Figure 4.12. This trend suggests a decomposition of biodegradable
compounds and a remaining of refractory species (Jarusutthirak and Amy 2007). The
increase of SUVA reflects that the fraction of larger, more aromatic and double bond
rich compounds increased; therefore, the species produced at the peak of the curve are
more hydrophobic and present low hydrogen to carbon ratio (Shin and Kang 2003). In
general, the SUVA values measured at the end of the experiments are quite low <1.5 L/
mgCm. Natural waters with SUVA values <2-3 L/mgCm comprise mostly hydrophilic,
non-humic and LMW compounds (Ates, Kitis et al. 2007).
4.1.7 MW distribution of organic matter
Figure 4.13, Figure 4.14, Figure 4.15, Figure 4.16 show the results of the HPSEC
resulting from the transformation of VFAs in the activated sludge reactors. The
molecular distribution of organic matter was determined using an online UV detection.
This method has a limitation in the detection of low UV-absorptivity components, e.g.
polysaccharides (Jarusutthirak and Amy 2007). All organic compounds could be
recognized with an online TOC detector (Her, Amy et al. 2002), which is not present in

CHALMERS Civil and Environmental Engineering, Master’s Thesis BOMX02-16-87
32
the Environmental Chemistry laboratory. Therefore, the results indicated just the UV
sensitive fraction of SMP.
The MW distribution varied widely from very low (<100 Da) to high (>20 kDa).
Several peaks were identified corresponding to MW of 194 Da, 1010 Da and 4040 Da.
Organic matter with MW >200 kDa was detected towards the end of the experiments. In
every reactors, very high intensity was registered at the beginning of the tests for
compounds with MW <100 Da, probably justified by the fact that acetate and butyrate
molar mass are in this range, respectively 59 Da and 87 Da. As previously mentioned,
UAPs are mostly distributed in the LMW region (<100 Da), while BAPs are mostly
composed of large molecules (>10 kDa).
Figure 4.13: HPSEC results of the first set of acetate reactor

CHALMERS Civil and Environmental Engineering, Master’s Thesis BOMX02-16-87
33
Figure 4.14: HPSEC results of the first set of butyrate reactor
Regarding the first set of experiments (Figure 4.13 and Figure 4.14), the chromatograms
of acetate and butyrate reactors display the presence of LMW compounds, which
intensity slightly decreased along the course of the test, probably reflecting the
degradation of the volatile fatty acids. Even after acetate and butyrate complete
depletion (day 11th), compounds with similar molecular weight were detected. This
result suggest: (i) the presence of refractory UAPs and/or (ii) the formation of LMW
compounds form by the degradation of bigger molecules, i.e. BAPs. In the butyrate
reactor, eight days after the inoculation intermediates with higher MW (1010 Da) were
formed and slightly degraded by the 15th day. The same MW compounds were detected
in acetate reactor, but in a later stage of the inoculation and with lower intensity. HMW
organic matter (>20 kDa) was detected in the samples collected 15 days after the
inoculation, when the endogenous phase in those reactors had already started, as can be
seen in the OD curves (Figure 4.1), suggesting that those compounds were BAPs. The
intensities of the compounds measured at 350 nm were generally lower than the ones
analyzed at 270 nm. On the other hand, the wavelength at 350 nm allowed detecting the
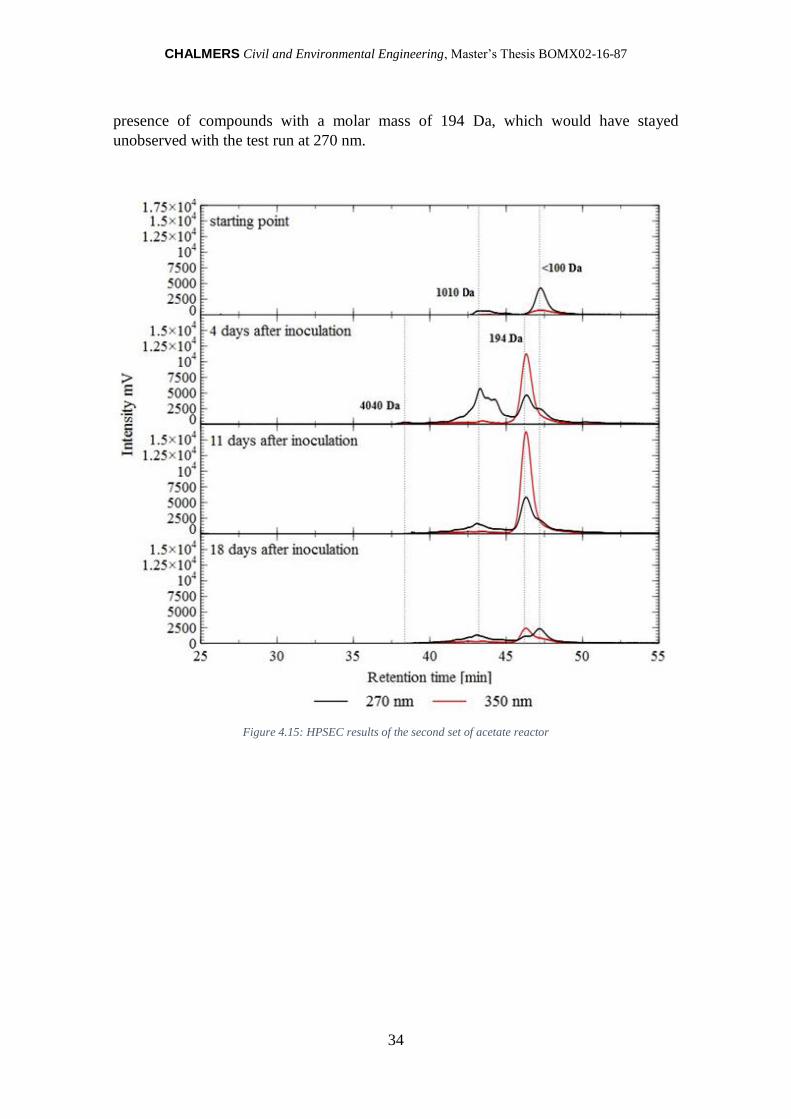
CHALMERS Civil and Environmental Engineering, Master’s Thesis BOMX02-16-87
34
presence of compounds with a molar mass of 194 Da, which would have stayed
unobserved with the test run at 270 nm.
Figure 4.15: HPSEC results of the second set of acetate reactor
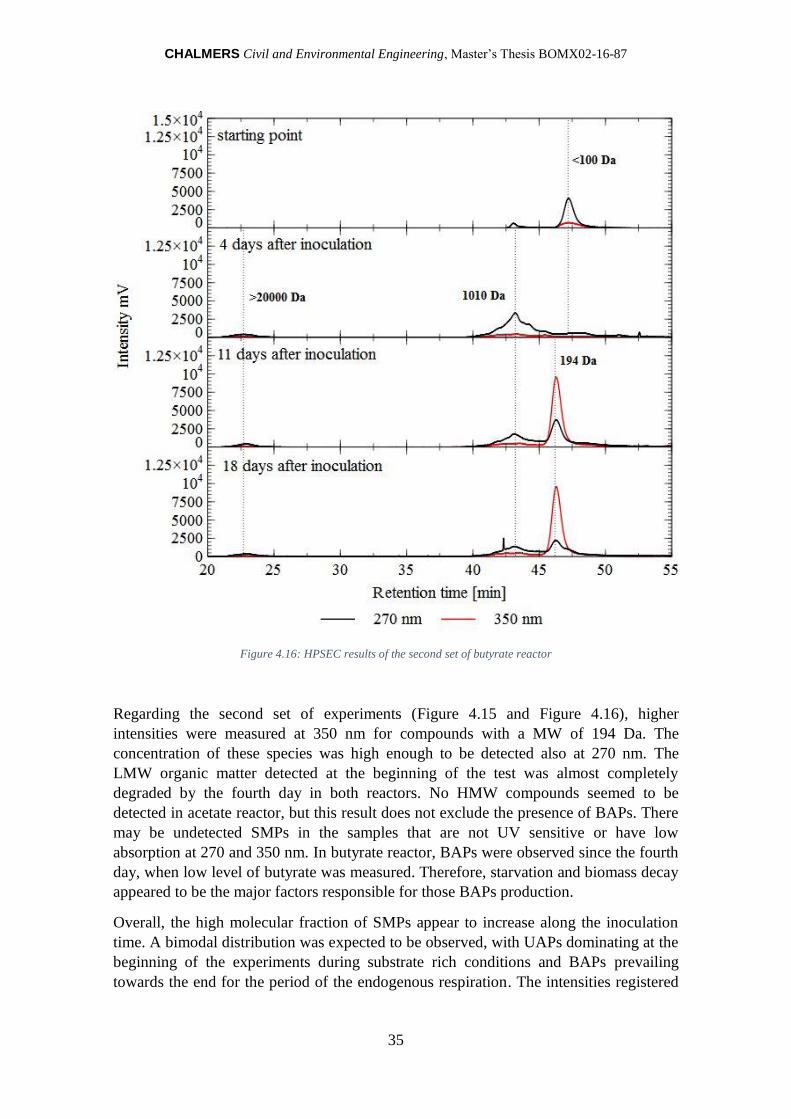
CHALMERS Civil and Environmental Engineering, Master’s Thesis BOMX02-16-87
35
Figure 4.16: HPSEC results of the second set of butyrate reactor
Regarding the second set of experiments (Figure 4.15 and Figure 4.16), higher
intensities were measured at 350 nm for compounds with a MW of 194 Da. The
concentration of these species was high enough to be detected also at 270 nm. The
LMW organic matter detected at the beginning of the test was almost completely
degraded by the fourth day in both reactors. No HMW compounds seemed to be
detected in acetate reactor, but this result does not exclude the presence of BAPs. There
may be undetected SMPs in the samples that are not UV sensitive or have low
absorption at 270 and 350 nm. In butyrate reactor, BAPs were observed since the fourth
day, when low level of butyrate was measured. Therefore, starvation and biomass decay
appeared to be the major factors responsible for those BAPs production.
Overall, the high molecular fraction of SMPs appear to increase along the inoculation
time. A bimodal distribution was expected to be observed, with UAPs dominating at the
beginning of the experiments during substrate rich conditions and BAPs prevailing
towards the end for the period of the endogenous respiration. The intensities registered

CHALMERS Civil and Environmental Engineering, Master’s Thesis BOMX02-16-87
36
in HMW region were low relatively compared to the LMW species, suggesting that
most of BAP compounds remained undetected. Another explanation for the
predominance of LMW compounds could be that HMW species were degraded or
hydrolyzed to LMW, as suggested by (Shin and Kang 2003)
Comparison with spectroscopic methods
From the comparison of the results obtained with the spectroscopic method together
with the HPSEC values, it was possible to conclude that the slope ratio SR values were
in accordance with the MW distribution, indicating a shift from LMW to HMW
compounds.
Regarding the spectrum curves, from the observation of the intensity peaks registered
for the same sampling days, it is possible to conclude that compounds with a MW of
194 Da had high absorbance at 350 nm, while compounds with a MW of 1010 Da
showed a peak of absorbance at 260 nm. The peaks occurring at different retention
times indicated the production of diverse species, supporting the absorbance spectrum
results.
4.2 ISOLATION OF BACTERIOPHAGES Isolation of Bacteriophages was attempted with bacterial isolates from the batch
reactors. The isolation of bacteria was ensured by streaking the plate two times. A total
amount of eight isolates was tested, four growing on acetate, two on butyrate, one on
propionate and one on the general media. Figure 4.17 shows the microscopy image from
isolated colonies grown on general media. The microscopy observation was not
exhaustive with regard to establish the purity of isolates, since it could be one type of
bacteria or different bacteria (bacilli) with the same shape.
Figure 4.17: isolated bacterial population from the general media. Scale 10 μm

CHALMERS Civil and Environmental Engineering, Master’s Thesis BOMX02-16-87
37
None of the plates showed plaque formation. This result may be justified by different
explanation that are listed below.
i. The result may suggest that none of the isolates were host for the phages present
in the activated sludge reactor. Since phage abundance is dependent on the
concentration of its specific host, the isolated colonies need to be dominant in
the investigated reactor in order to observe plaque formation (Shapiro and
Kushmaro 2011). It is unlikely that the isolates from the batch reactors were
representative of the dominants in the activated sludge basin, even though the
inocula was taken from the same environment.
ii. Since the formation of the plaques depend on the conditions used, the failure in
plaques observation may be due not to the lack of infection, but the impossibility
to observe the lysis due to the experimental conditions (Hantula, Kurki et al.
1991), such as the culture media (Khan, Satoh et al. 2002). It is likely that some
plates formed plaques so tiny to be impossible to detect with the naked eye.
iii. The isolation of the bacteria by the streaking method was assumed to be
effective. Since no method was used to check the purity of isolates, such as gram
staining, the bacterial culture may contain more than one strain. Hence, even if
infection occurred on one isolate, plaque formation may have been impossible to
observe because the area of cell lysis represent a nutrient rich zones for other
bacteria to grow.
iv. Even though plaque formation was not detected, infection may have occurred in
a form of lysogenic type, forming a dormant prophage (Khan, Satoh et al. 2002).
In some of the plates, the soft agar was dyed with methylene blue with the purpose of
enhancing plaque observation. Even though the plaques were not observed, the dye
enhanced the visualization of morphologies that could be interpreted as bacterial
colonies. Figure 4.18 shows the possible colonies of bacterial isolates growing on
acetate, propionate and butyrate respectively from left.
Figure 4.18: images of the plate for Bacteriophages isolation dyed with methylene blue
Due to the failure in observing plaque formation, it was not possible to performe any
culture count over the plates. On the other hand, plaque assay cannot be considered a
reliable method for giving an approximate number of phages in a diverse community
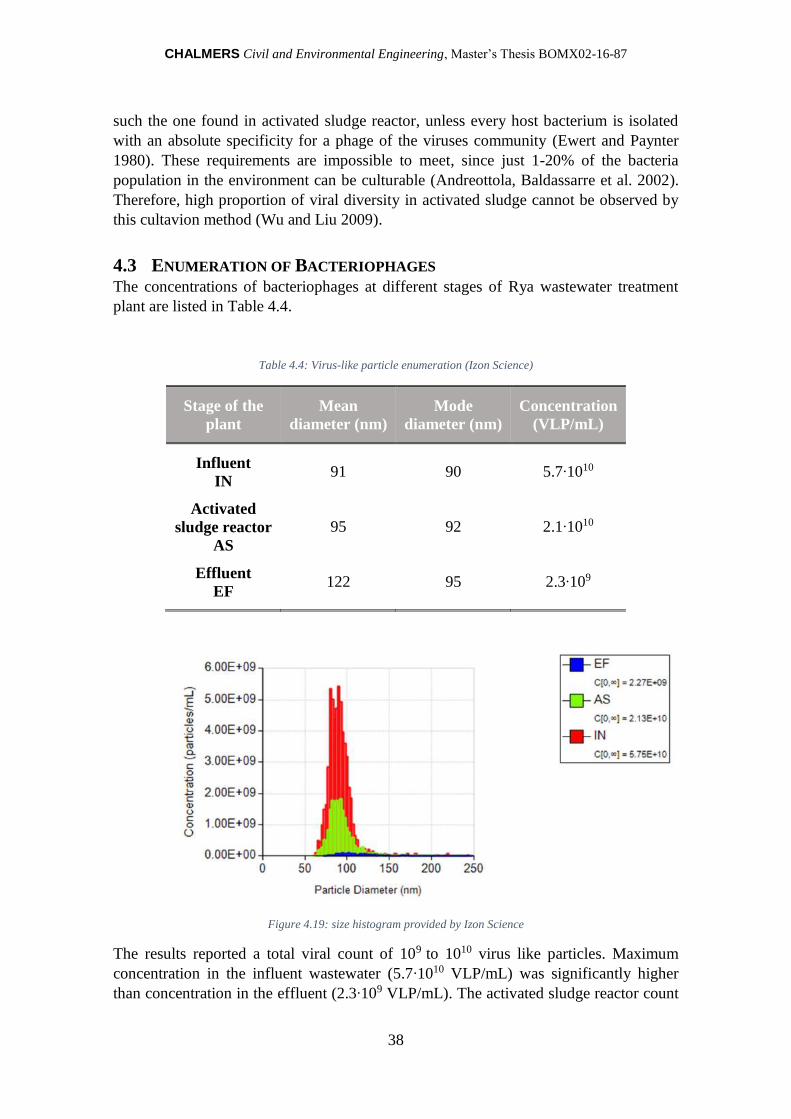
CHALMERS Civil and Environmental Engineering, Master’s Thesis BOMX02-16-87
38
such the one found in activated sludge reactor, unless every host bacterium is isolated
with an absolute specificity for a phage of the viruses community (Ewert and Paynter
1980). These requirements are impossible to meet, since just 1-20% of the bacteria
population in the environment can be culturable (Andreottola, Baldassarre et al. 2002).
Therefore, high proportion of viral diversity in activated sludge cannot be observed by
this cultavion method (Wu and Liu 2009).
4.3 ENUMERATION OF BACTERIOPHAGES The concentrations of bacteriophages at different stages of Rya wastewater treatment
plant are listed in Table 4.4.
Table 4.4: Virus-like particle enumeration (Izon Science)
Stage of the
plant
Mean
diameter (nm)
Mode
diameter (nm)
Concentration
(VLP/mL)
Influent
IN 91 90 5.7∙1010
Activated
sludge reactor
AS
95 92 2.1∙1010
Effluent
EF 122 95 2.3∙109
Figure 4.19: size histogram provided by Izon Science
The results reported a total viral count of 109 to 1010 virus like particles. Maximum
concentration in the influent wastewater (5.7∙1010 VLP/mL) was significantly higher
than concentration in the effluent (2.3∙109 VLP/mL). The activated sludge reactor count

CHALMERS Civil and Environmental Engineering, Master’s Thesis BOMX02-16-87
39
(2.1∙1010 VLP/mL) was slightly lower than the influent sewage. Hence, the measured
values demonstrated a decreasing concentration of bacteriophages along the plant. The
removal of viruses in the activated sludge processes occurs by adsorption to the flocs
(Yasunori, Katsunori et al. 2002), therefore, high phage penetration to the sludge flocs
may justify the relevant gap among the influent and the effluent. Bacteria, protozoa and
metazoan may contribute also to the loss by ingesting the viral particles (Kim and Unno
1996). An opposite trend was obtained in the study of Ewert and Paynter (1980), in
which the total concentration of phages in an activated sludge treatment plant was
performed with direct electron microscopic counts. Their investigation showed an
increase in number from the influent to the effluent, from 2.2∙107 to 8.4∙107 mL-1,
suggesting a net production of phages within the reactor (Ewert and Paynter 1980). The
number measured is significantly lower than the results obtained; on the other hand it
was argued that the method used in their investigation, transmission electron
microscopy (TEM), may underestimate the count (Wu and Liu 2009). Wu and Liu
applied epifluorescence microscopy and estimated the viral counts from 0.28∙109 to
27.04∙109 mL-1. In their study, TEM was also applied to estimate the morphology of the
viruses and they found that most of the viruses diameters ranges from 40 to 250 nm,
similarly to the results obtained for Rya WWTP. Epifluorescence microscopy was used
in another recent viral abundance study in Japan and the concentration was found to be
between 10-7 to 10-9 (Otawa, Lee et al. 2007). The viral abundance in Rya WWTP along
the water stream was higher than the study reported above. The explanation may be due
to the different methods used. A comparison of the techniques would be useful to
determine if Tunable Resistive Pulse Sensing (TRPS) overestimates the numbers of
VLP. TEM has also the advantage to allow the characterization of virus morphology
and diversity, which would help to differentiate the viruses in the activated sludge
reactor from the influent and understand whether the viruses in the activated sludge are
indigenous or are coming from the sewage inflow.
From phage enumeration, it was possible to estimate the contribution of VLP to the total
dissolved organic carbon in the wastewater, assuming that 50% of the mass of the
particle was carbon. Different DOC results were obtained considering diverse MWs. In
the first case, the MWs were calculated through a correlation between size and mass of
a protein molecule, assuming the following relationship (Erickson 2009):
MW(Da) = (diameter(nm)
2 × 0.066)
10.333⁄
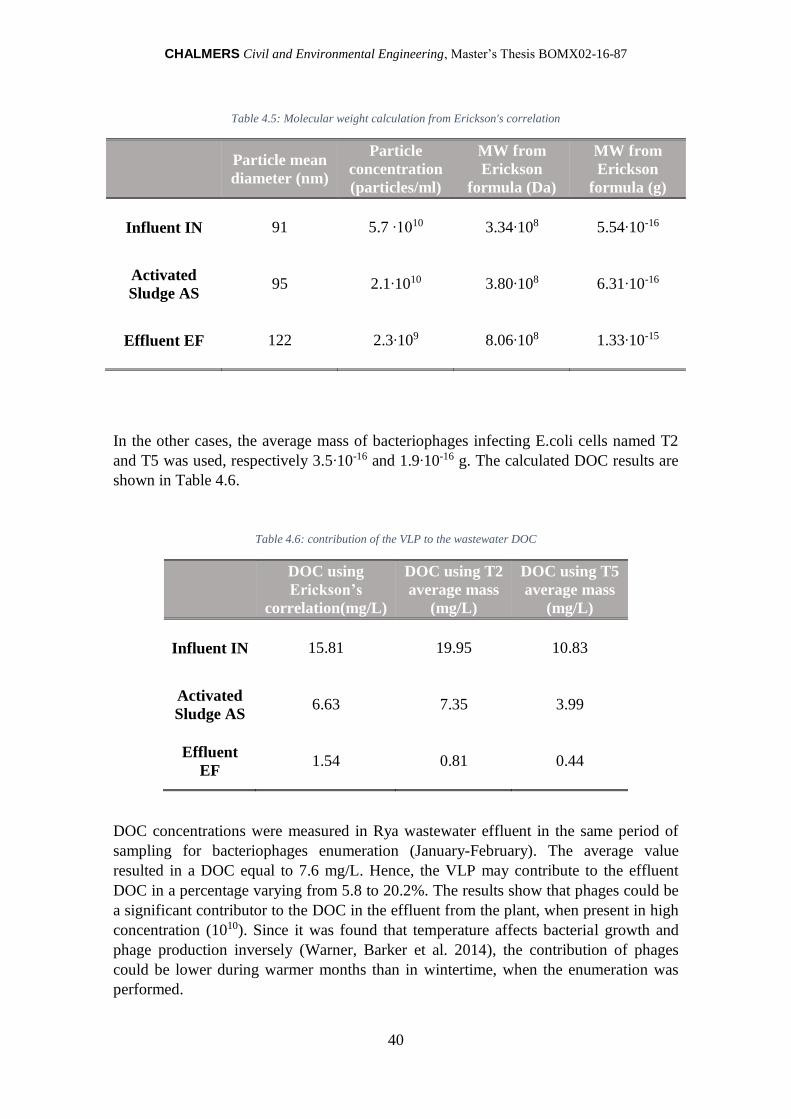
CHALMERS Civil and Environmental Engineering, Master’s Thesis BOMX02-16-87
40
Table 4.5: Molecular weight calculation from Erickson's correlation
Particle mean
diameter (nm)
Particle
concentration
(particles/ml)
MW from
Erickson
formula (Da)
MW from
Erickson
formula (g)
Influent IN 91 5.7 ∙1010 3.34∙108 5.54∙10-16
Activated
Sludge AS 95 2.1∙1010 3.80∙108 6.31∙10-16
Effluent EF 122 2.3∙109 8.06∙108 1.33∙10-15
In the other cases, the average mass of bacteriophages infecting E.coli cells named T2
and T5 was used, respectively 3.5∙10-16 and 1.9∙10-16 g. The calculated DOC results are
shown in Table 4.6.
Table 4.6: contribution of the VLP to the wastewater DOC
DOC using
Erickson’s
correlation(mg/L)
DOC using T2
average mass
(mg/L)
DOC using T5
average mass
(mg/L)
Influent IN 15.81 19.95 10.83
Activated
Sludge AS 6.63 7.35 3.99
Effluent
EF 1.54 0.81 0.44
DOC concentrations were measured in Rya wastewater effluent in the same period of
sampling for bacteriophages enumeration (January-February). The average value
resulted in a DOC equal to 7.6 mg/L. Hence, the VLP may contribute to the effluent
DOC in a percentage varying from 5.8 to 20.2%. The results show that phages could be
a significant contributor to the DOC in the effluent from the plant, when present in high
concentration (1010). Since it was found that temperature affects bacterial growth and
phage production inversely (Warner, Barker et al. 2014), the contribution of phages
could be lower during warmer months than in wintertime, when the enumeration was
performed.

CHALMERS Civil and Environmental Engineering, Master’s Thesis BOMX02-16-87
41
5 CONCLUSION
Based on the growth media, different population of aerobic heterotrophic bacteria were
enriched in the reactors, characterized by different growth curves and kinetic
coefficients. The peaks in cell density reflected the free energy values obtained from the
carbon source, except for propionate fed reactor, which showed the highest biomass
yield and cell density. The free energy values seem also to be correlated to SMP
production. The higher was ΔG° obtained from the compound the higher was the SMP
maximum concentration observed.
SMPs were produced since the start of the experiment in high concentration, with the
highest accumulations occurred in the growth phases of the communities in abundant
substrate condition, suggesting that their formation is a relatively fast process. Even
though in the second set of reactors the VFA concentration was three times higher, the
detected SMP concentration was lower, proposing that the longer a community is
acclimatized to a carbon source the lower is SMP production.
The calculated spectrophotometric parameters gave information about the aromatic
nature of the DOC and the change in MW along the time. SUVA results indicated that
the produced SMP comprised mostly hydrophilic, non-humic and LMW compounds.
The SR values decreased with time, indicating a shift from LMW compounds to HMW
along the course of the experiments. The diverse shape and intensity of the spectrum
curves indicated that compounds with different wavelength absorbance were produced
in the reactors, even among those fed by the same carbon source, suggesting production
of different SMP species. HPSEC results confirmed the findings from SR values and
absorbance spectra. The MW distribution varied widely from very low (<100 Da) to
high (>20 kDa) with a transition from LMW to HMW. Several peaks were identified
corresponding to MW of 194 Da, 1010 Da and 4040 Da, indicating the formation of
different compounds. It is possible to conclude that the spectrophotometric method is a
practical and reproducible technique giving a first and fast characterization of SMP,
using a small volume of sample that does not required sophisticated sample
pretreatment and analytical equipment. No information about SMP concentration or
identification of the compounds are provided since the method is limited to detection of
light-absorbing compounds.
Comparing the results obtained in each reactor, it is possible to conclude that the carbon
source, its concentration and the acclimatization of the microbial community may
influence SMP productivity in terms of concentration and composition.
The bacteriophages isolation failed due to lack of plaque formation, which can be
justified by the following explanations: absence of host for phages, not suitable
experimental conditions, contamination in the bacterial isolates, and occurrence of
lysogenic infection.
High dynamic of virus abundance characterizes the water stream of Rya WWTP, with
higher abundance in the influent and activated sludge reactor compared to the effluent.
When present in high concentration (1010 mL-1), VLP may constitute a significant

CHALMERS Civil and Environmental Engineering, Master’s Thesis BOMX02-16-87
42
fraction of the total DOC in the wastewater effluent. The viral count was significantly
higher than the investigation performed in other WWTPs. Therefore, it remains to
determine whether Tunable Resistive Pulse Sensing (TRPS) overestimates the numbers
of VLP and whether the temperature of wastewater influences the count of
bacteriophages.
5.1 RECOMMENDATIONS The following is a list of recommendations if future experiments are carried out with
SMP investigation in batch reactors or bacteriophages isolation and enumeration from
activated sludge processes.
i. Since the production of SMPs seems to be a fast process, multiple samples
should be taken in the first hours just after the biomass gets in contact with the
substrate.
ii. In order to detect all the organic compounds and not just the UV sensitive
fraction, size distribution analysis should be carry out using ultrafiltration or
SEC with online TOC detector.
iii. If performing UV analysis over the spectrum, it is recommendable to use a
liquid nutrient media without NO3-, since its absorption is elevated and disturb
the absorption of the other compounds.
iv. It would be useful to assess the biodegradability of the SMP parallel to the
quantity produced by different reactors, since lower production may also involve
the production of more refractory compounds.
v. In order to be successful, bacteriophages isolation with the method of the plaque
assay should be attempted just on dominant bacteria of the same phage
environment.
vi. Different media culture should be tested for bacteria and bacteriophages
isolation, since this condition may inhibit the plaque formation. A recommended
culture media from the literature contains sodium acetate 5g/L, tryptone 10 g/L,
yeast extract 5 g/L, NaCl 10 g/L, MgSO4∙7H2O 0.2g/L, MnSO4∙7H2O 0.05 g/L,
and agar 15 g/L (hard agar) or 4 g/L (soft agar) (Khan, Satoh et al. 2002). In this
study, 15 bacterial isolates were obtained from activated sludge process and nine
of them supported plaque formation.
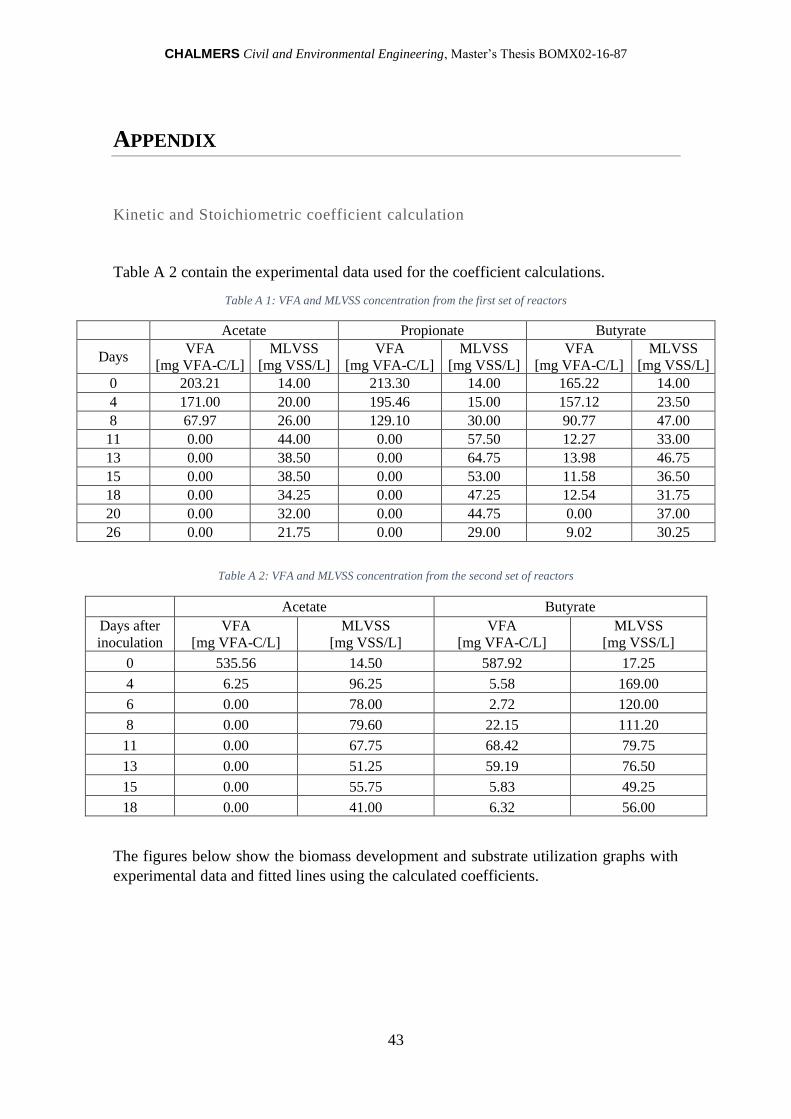
CHALMERS Civil and Environmental Engineering, Master’s Thesis BOMX02-16-87
43
APPENDIX
Kinetic and Stoichiometric coefficient calculation
Table A 2 contain the experimental data used for the coefficient calculations.
Table A 1: VFA and MLVSS concentration from the first set of reactors
Acetate Propionate Butyrate
Days VFA
[mg VFA-C/L]
MLVSS
[mg VSS/L]
VFA
[mg VFA-C/L]
MLVSS
[mg VSS/L]
VFA
[mg VFA-C/L]
MLVSS
[mg VSS/L]
0 203.21 14.00 213.30 14.00 165.22 14.00
4 171.00 20.00 195.46 15.00 157.12 23.50
8 67.97 26.00 129.10 30.00 90.77 47.00
11 0.00 44.00 0.00 57.50 12.27 33.00
13 0.00 38.50 0.00 64.75 13.98 46.75
15 0.00 38.50 0.00 53.00 11.58 36.50
18 0.00 34.25 0.00 47.25 12.54 31.75
20 0.00 32.00 0.00 44.75 0.00 37.00
26 0.00 21.75 0.00 29.00 9.02 30.25
Table A 2: VFA and MLVSS concentration from the second set of reactors
Acetate Butyrate
Days after
inoculation
VFA
[mg VFA-C/L]
MLVSS
[mg VSS/L]
VFA
[mg VFA-C/L]
MLVSS
[mg VSS/L]
0 535.56 14.50 587.92 17.25
4 6.25 96.25 5.58 169.00
6 0.00 78.00 2.72 120.00
8 0.00 79.60 22.15 111.20
11 0.00 67.75 68.42 79.75
13 0.00 51.25 59.19 76.50
15 0.00 55.75 5.83 49.25
18 0.00 41.00 6.32 56.00
The figures below show the biomass development and substrate utilization graphs with
experimental data and fitted lines using the calculated coefficients.

CHALMERS Civil and Environmental Engineering, Master’s Thesis BOMX02-16-87
44
Figure A 1: measured and modelled values for acetate consumption in the first set of experiments
Figure A 2: measured and modelled values for biomass development for acetate reactor in the first set of experiments
Figure A 3: measured and modelled values for propionate consumption in the first set of experiments
Figure A 4: measured and modelled values for biomass development for propionate reactor in the first set of
experiments
0.00
50.00
100.00
150.00
200.00
250.00
0 10 20
Ace
tate
[m
g C
/L]
Days after inoculation
0.00
10.00
20.00
30.00
40.00
50.00
0 5 10 15 20 25
ML
VS
S [
mg/L
]
Days after inoculation
0.00
50.00
100.00
150.00
200.00
250.00
0 5 10 15 20 25
Pro
pio
nat
e [m
g C
/L]
Days after inoculation
0.00
10.00
20.00
30.00
40.00
50.00
60.00
70.00
80.00
0 5 10 15 20 25
ML
VS
S [
mg/L
]
Days after inoculation
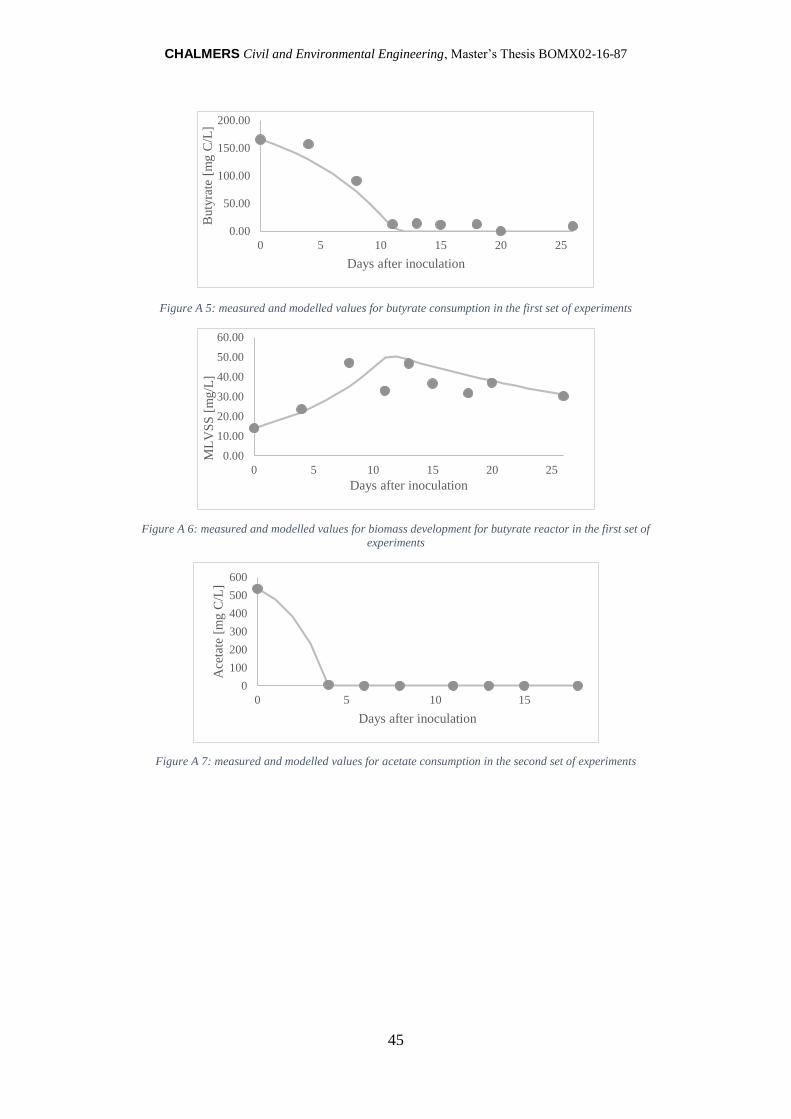
CHALMERS Civil and Environmental Engineering, Master’s Thesis BOMX02-16-87
45
Figure A 5: measured and modelled values for butyrate consumption in the first set of experiments
Figure A 6: measured and modelled values for biomass development for butyrate reactor in the first set of
experiments
Figure A 7: measured and modelled values for acetate consumption in the second set of experiments
0.00
50.00
100.00
150.00
200.00
0 5 10 15 20 25
Buty
rate
[m
g C
/L]
Days after inoculation
0.00
10.00
20.00
30.00
40.00
50.00
60.00
0 5 10 15 20 25
ML
VS
S [
mg/L
]
Days after inoculation
0
100
200
300
400
500
600
0 5 10 15
Ace
tate
[m
g C
/L]
Days after inoculation
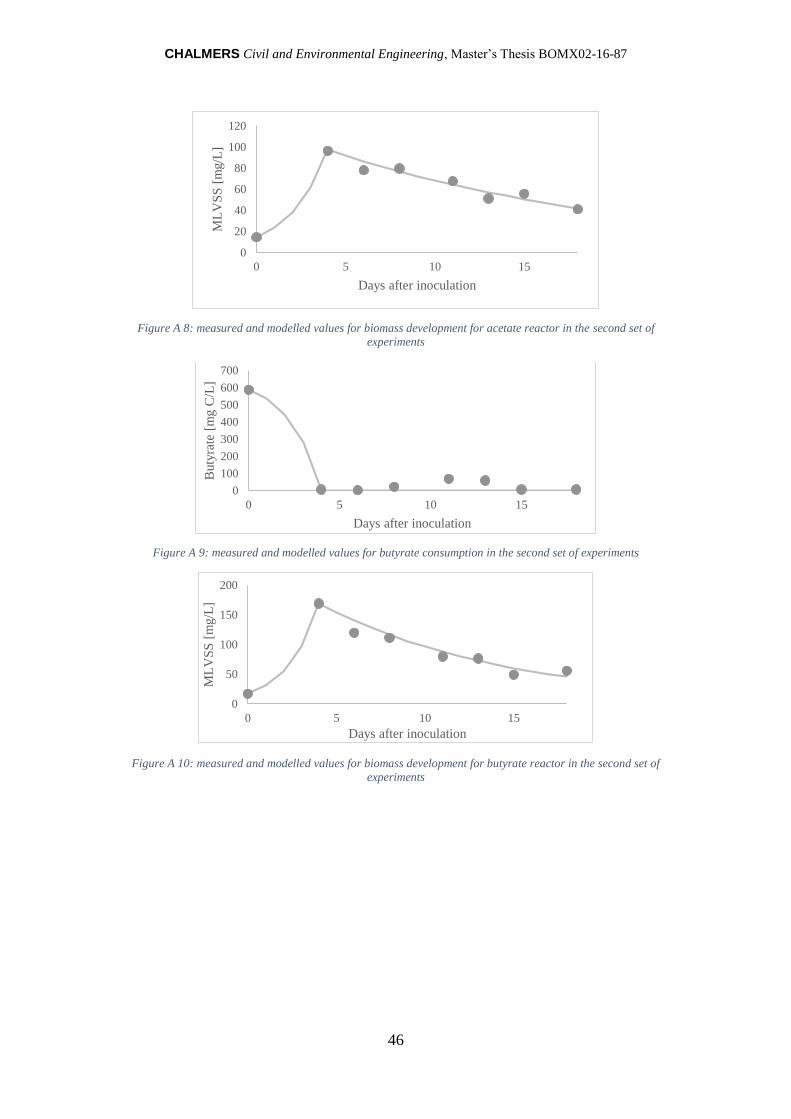
CHALMERS Civil and Environmental Engineering, Master’s Thesis BOMX02-16-87
46
Figure A 8: measured and modelled values for biomass development for acetate reactor in the second set of
experiments
Figure A 9: measured and modelled values for butyrate consumption in the second set of experiments
Figure A 10: measured and modelled values for biomass development for butyrate reactor in the second set of
experiments
0
20
40
60
80
100
120
0 5 10 15
ML
VS
S [
mg/L
]
Days after inoculation
0
100
200
300
400
500
600
700
0 5 10 15
Buty
rate
[m
g C
/L]
Days after inoculation
0
50
100
150
200
0 5 10 15
ML
VS
S [
mg/L
]
Days after inoculation
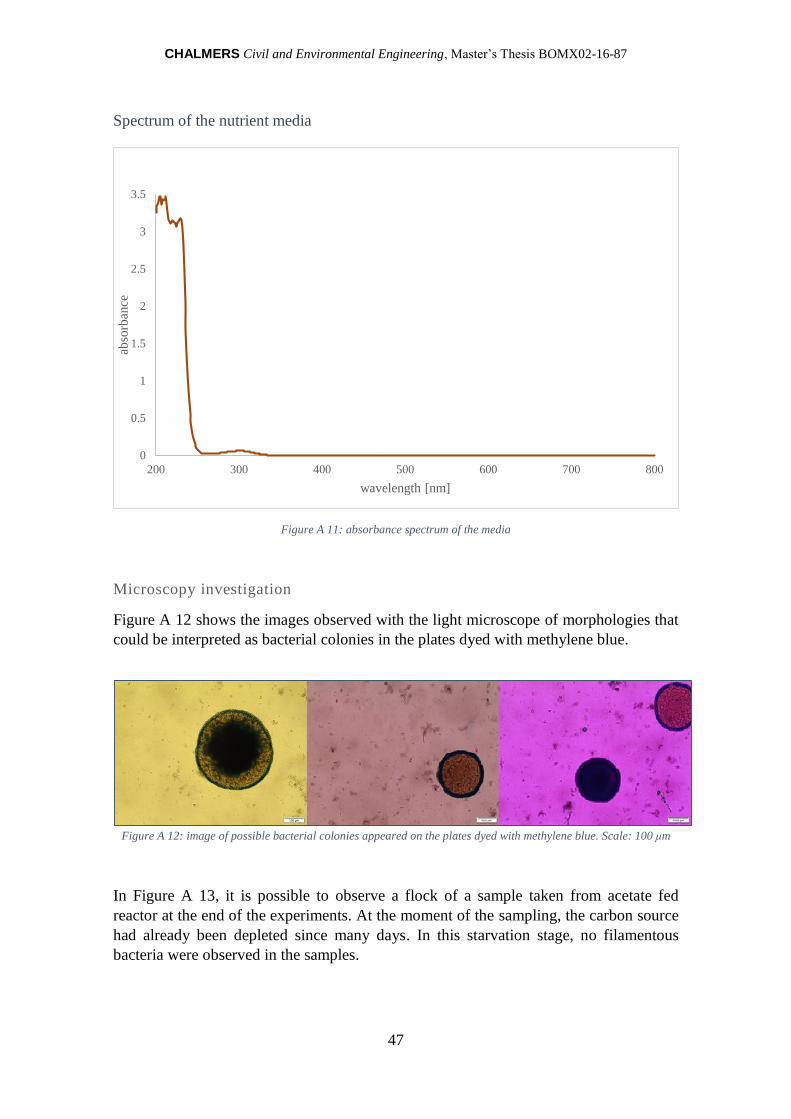
CHALMERS Civil and Environmental Engineering, Master’s Thesis BOMX02-16-87
47
Spectrum of the nutrient media
Figure A 11: absorbance spectrum of the media
Microscopy investigation
Figure A 12 shows the images observed with the light microscope of morphologies that
could be interpreted as bacterial colonies in the plates dyed with methylene blue.
Figure A 12: image of possible bacterial colonies appeared on the plates dyed with methylene blue. Scale: 100 μm
In Figure A 13, it is possible to observe a flock of a sample taken from acetate fed
reactor at the end of the experiments. At the moment of the sampling, the carbon source
had already been depleted since many days. In this starvation stage, no filamentous
bacteria were observed in the samples.
0
0.5
1
1.5
2
2.5
3
3.5
200 300 400 500 600 700 800
abso
rban
ce
wavelength [nm]

CHALMERS Civil and Environmental Engineering, Master’s Thesis BOMX02-16-87
48
Figure A 13: image of a flock in acetate fed reactor. Scale: 20 μm
Figure A 14 shows a rotifer feeding on the flock of butyrate fed reactor. Rotifers thrive
in aerobic condition and are indicator species for stable activated sludge systems.
Figure A 14: image of a rotifer feeding on the flock of butyrate fed reactor. Scale: 20 μm

CHALMERS Civil and Environmental Engineering, Master’s Thesis BOMX02-16-87
49
References
Andreottola, G., L. Baldassarre, et al. (2002). "A comparison among different
methods for evaluating the biomass activity in activated sludge systems: preliminary
results." Water science and technology : a journal of the International Association on
Water Pollution Research 46(1-2): 413.
Aquino, S. and D. Stuckey (2002). "Characterization of soluble microbial
products(SMP) in effluents from anaerobic reactors." Water Science and Technology
45(10): 127-132.
Ates, N., M. Kitis, et al. (2007). "Formation of chlorination by-products in waters
with low SUVA—correlations with SUVA and differential UV spectroscopy." Water
Research 41(18): 4139-4148.
Avfall Sverige (2013). "Waste to energy in Sweden - suppliers of sustainable
solutions." 2016, from
http://www.avfallsverige.se/fileadmin/uploads/Exportsatsningen/India_booklet.pdf.
Baker, K. H. and D. S. Herson (1999). "Detection and occurence of indicator
organisms and pathogens." Water environment research 71(5): 530.
Barker, D. J. and D. C. Stuckey (1999). "A review of soluble microbial products
(SMP) in wastewater treatment systems." Water Research 33(14): 3063-3082.
Barker, D. J. and D. C. Stuckey (2001). "Modeling of soluble microbial products
in anaerobic digestion: The effect of feed strength and composition." Water
environment research 73(2): 173-184.
Boero, V. J., A. R. Bowers, et al. (1996). "Molecular weight distribution of
soluble microbial products in biological systems." Water Science and Technology 34(5-
6): 241-248.
Coble, P. G. (2007). "Marine optical biogeochemistry: the chemistry of ocean
color." Chemical reviews 107(2): 402-418.
Erickson, H. P. (2009). "Size and Shape of Protein Molecules at the Nanometer
Level Determined by Sedimentation, Gel Filtration, and Electron Microscopy."
Biological Procedures Online 11(1): 32-51.
Ewert, D. L. and M. Paynter (1980). "Enumeration of bacteriophages and host
bacteria in sewage and the activated-sludge treatment process." Applied and
Environmental Microbiology 39(3): 576-583.
Fonseca, A. C., R. S. Summers, et al. (2007). "Extra-cellular polysaccharides,
soluble microbial products, and natural organic matter impact on nanofiltration
membranes flux decline." Environmental science & technology 41(7): 2491-2497.

CHALMERS Civil and Environmental Engineering, Master’s Thesis BOMX02-16-87
50
Gryaab AB (2011). "Clean facts about Gryaab and your wastewater." 2016, from
http://www.gryaab.se/admin/bildbank/uploads/Dokument/Broschyrer/Allmanbroschyr_
eng_klar.pdf.
Hantula, J., A. Kurki, et al. (1991). "Ecology of bacteriophages infecting activated
sludge bacteria." Applied and Environmental Microbiology 57(8): 2147-2151.
Helms, J. R., A. Stubbins, et al. (2008). "Absorption Spectral Slopes and Slope
Ratios as Indicators of Molecular Weight, Source, and Photobleaching of Chromophoric
Dissolved Organic Matter." Limnology and Oceanography 53(3): 955-969.
Her, N., G. Amy, et al. (2002). "Optimization of method for detecting and
characterizing NOM by HPLC-size exclusion chromatography with UV and on-line
DOC detection." Environmental science & technology 36(5): 1069-1076.
IZONscience (2015). "TRPS Tunable Resistive Pulse Sensing." 2016.
Jarusutthirak, C. and G. Amy (2007). "Understanding soluble microbial products
(SMP) as a component of effluent organic matter (EfOM)." Water Research 41(12):
2787-2793.
Jenkins, D. and J. Wanner (2014). Activated Sludge : 100 Years and Counting.
London, GBR, IWA Publishing.
Joshi, V., D. Attri, et al. (2003). "Microbial pigments." Indian Journal of
Biotechnology 2(3): 362-369.
Khan, M. A., H. Satoh, et al. (2002). "Bacteriophages isolated from activated
sludge processes and their polyvalency." Water Research 36(13): 3364-3370.
Kim, T.-D. and H. Unno (1996). "The roles of microbes in the removal and
inactivation of viruses in a biological wastewater treatment system." Water Science and
Technology 33(10): 243-250.
Kirti, K., S. Amita, et al. (2014). "Colorful World of Microbes: Carotenoids and
Their Applications." Advances in Biology 2014: 13.
Kropinski, A. M., A. Mazzocco, et al. (2009). "Enumeration of bacteriophages by
double agar overlay plaque assay." Bacteriophages: Methods and Protocols, Volume 1:
Isolation, Characterization, and Interactions: 69-76.
Kunacheva, C. and D. C. Stuckey (2014). "Analytical methods for soluble
microbial products in wastewater treatment systems: A review." Water Research
61(Journal Article): 1.
Kuo, W.-C., M. A. Sneve, et al. (1996). "Formation of soluble microbial products
during anaerobic treatment." Water environment research 68(3): 279-285.

CHALMERS Civil and Environmental Engineering, Master’s Thesis BOMX02-16-87
51
Laspidou, C. S. and B. E. Rittmann (2002). "A unified theory for extracellular
polymeric substances, soluble microbial products, and active and inert biomass." Water
Research 36(11): 2711-2720.
Lebrun, T., E. Thieblin, et al. (1999). "Origin and Nature of Refractory Organic
Compounds Produced During Anaerobic Treatment of Easily Biodegradable Substrate."
Environmental Technology 20(9): 987-993.
Madigan, M. T., J. M. Martinko, et al. (2014). Brock biology of microorganisms.
Namkung, E. and B. E. Rittmann (1986). "Soluble microbial products (SMP)
formation kinetics by biofilms." Water Research 20(6): 795-806.
Namkung, E. and B. E. Rittmann (1988). "Effects of SMP on Biofilm-Reactor
Performance." Journal of Environmental Engineering 114(1): 199-210.
Nielsen, P., T. R. Thomsen, et al. (2004). "Bacterial composition of activated
sludge-importance for floc and sludge properties." Water Science and Technology
49(10): 51-58.
Otawa, K., S. H. Lee, et al. (2007). "Abundance, Diversity, and Dynamics of
Viruses on Microorganisms in Activated Sludge Processes." Microbial Ecology 53(1):
143-152.
Ramalho, R. (2012). Introduction to wastewater treatment processes, Elsevier.
Rice, E. W., L. Bridgewater, et al. (2012). Standard methods for the examination
of water and wastewater: 22 ed. / prepared and published jointly by American Public
Health Association, American Water Works Association, Water Environment
Federation ; joint editorial board, Eugene W. Rice .. [et al.] ; managing editor, Laura
Bridgewater. Washington, D.C, American Public Health Association.
Roden, E. E. and Q. Jin (2011). "Thermodynamics of Microbial Growth Coupled
to Metabolism of Glucose, Ethanol, Short-Chain Organic Acids, and Hydrogen."
Applied and Environmental Microbiology 77(5): 1907-1909.
Schiener, P., S. Nachaiyasit, et al. (1998). "Production of Soluble Microbial
Products (SMP) in an Anaerobic Baffled Reactor: Composition, Biodegradability, and
the Effect of Process Parameters." Environmental Technology 19(4): 391-399.
Seviour, R. J., L. L. Blackall, et al. (1999). The Microbiology of Activated
Sludge. Dordrecht, Springer Netherlands.
Shapiro, O. H. and A. Kushmaro (2011). "Bacteriophage ecology in
environmental biotechnology processes." Current Opinion in Biotechnology 22(3): 449-
455.
CHALMERS Civil and Environmental Engineering, Master’s Thesis BOMX02-16-87
52
Shin, H.-S. and S.-T. Kang (2003). "Characteristics and fates of soluble microbial
products in ceramic membrane bioreactor at various sludge retention times." Water
Research 37(1): 121-127.
Urbain, V., B. Mobarry, et al. (1998). "Integration of performance, molecular
biology and modeling to describe the activated sludge process." Water Science and
Technology 37(4): 223-229.
Viessman, W., M. J. Hammer, et al. (2009). Water supply and pollution control,
Pearson Prentice Hall New Jersey (NJ).
Wang, L. K., N. C. Pereira, et al. (2009). Biological treatment processes. New
York, Humana Press.
Warner, C. M., N. Barker, et al. (2014). "M13 bacteriophage production for large-
scale applications." Bioprocess and Biosystems Engineering 37(10): 2067-2072.
Weishaar, J. L., G. R. Aiken, et al. (2003). "Evaluation of specific ultraviolet
absorbance as an indicator of the chemical composition and reactivity of dissolved
organic carbon." Environmental science & technology 37(20): 4702-4708.
Widdel, F. (2007). "Theory and measurement of bacterial growth." Di dalam
Grundpraktikum Mikrobiologie 4(11).
Withey, S., E. Cartmell, et al. (2005). "Bacteriophages—potential for application
in wastewater treatment processes." Science of the total environment 339(1): 1-18.
Wu, Q. and W.-T. Liu (2009). "Determination of virus abundance, diversity and
distribution in a municipal wastewater treatment plant." Water Research 43(4): 1101-
1109.
Yan, S., B. Subramanian, et al. (2007). "Isolation, Characterization, and
Identification of Bacteria from Activated Sludge and Soluble Microbial Products in
Wastewater Treatment Systems." Practice Periodical of Hazardous, Toxic, and
Radioactive Waste Management 11(4): 240-258.
Yasunori, T., M. Katsunori, et al. (2002). "Fate of coliphage in a wastewater
treatment process." Journal of Bioscience and Bioengineering 94(2): 172-174.
![Analytical Standardization of Ayurvedic Formulation- …...soluble extractive and water soluble extract values were determined.[ 3,4] Microbial screening Microbial screening carried](https://img.pdfslide.net/doc/110x75/5eaef11d6cb79344be2bc8d0/analytical-standardization-of-ayurvedic-formulation-soluble-extractive-and.jpg)