Embed Size (px)
Citation preview
Research Article
Soluble PD-L1 as a Biomarker in MalignantMelanoma Treated with Checkpoint BlockadeJun Zhou1,2,3, Kathleen M. Mahoney1,4, Anita Giobbie-Hurder3,5, Fengmin Zhao5,Sandra Lee5, Xiaoyun Liao3,6, Scott Rodig3,6, Jingjing Li1,2,3, Xinqi Wu1,2,Lisa H. Butterfield7,8, Matthias Piesche1,9, Michael P. Manos2,3, Lauren M. Eastman2,3,Glenn Dranoff10, Gordon J. Freeman1,3, and F. Stephen Hodi1,2,3
Abstract
Blockade of the pathway including programmed death-ligand1 (PD-L1) and its receptor programmed cell death protein 1(PD-1) has produced clinical benefits in patients with a varietyof cancers. Elevated levels of soluble PD-L1 (sPD-L1) have beenassociated with worse prognosis in renal cell carcinoma andmultiple myeloma. However, the regulatory roles and functionof sPD-L1 particularly in connection with immune checkpointblockade treatment are not fully understood. We identified foursplice variants of PD-L1 in melanoma cells, and all of them aresecreted. Secretion of sPD-L1 resulted from alternate splicingactivities, cytokine induction, cell stress, cell injury, and celldeath in melanoma cells. Pretreatment levels of sPD-L1 wereelevated in stage IV melanoma patient sera compared with
healthy donors. High pretreatment levels of sPD-L1 were asso-ciated with increased likelihood of progressive disease inpatients treated by CTLA-4 or PD-1 blockade. Although changesin circulating sPD-L1 early after treatment could not distinguishresponders from those with progressive disease, after fivemonths of treatment by CTLA-4 or PD-1 blockade patients whohad increased circulating sPD-L1 had greater likelihood ofdeveloping a partial response. Induction of sPD-L1 was associ-ated with increased circulating cytokines after CTLA-4 blockadebut not following PD-1 blockade. Circulating sPD-L1 is a prog-nostic biomarker that may predict outcomes for subgroups ofpatients receiving checkpoint inhibitors. Cancer Immunol Res; 5(6);480–92. �2017 AACR.
IntroductionProgrammed death-ligand 1 (PD-L1) is a membrane-bound
protein primarily expressed on dendritic cells (DC) and mono-cytes (1). Its receptor, programmed cell death protein 1 (PD-1), isexpressed on activated T cells and B cells, DC, andmonocytes (1).As T cells engage with the antigen/MHC complex, binding of PD-L1 to PD-1 inhibits T-cell activation, leading to immune suppres-sion (1, 2). Awide range of tumors express PD-L1 (3–6). Although
conflicting reports exist for melanoma (7), PD-L1 expression isassociated with worse clinical outcomes in some tumor types (8,9). Blocking the PD-1/PD-L1 interaction increases antigen-spe-cific T-cell activity whereas decreasing Treg suppressive function(10, 11). Antibodies that block either PD-1 or PD-L1 improveclinical responses as well as patients' overall survival in manytumor types (12–16).
Soluble PD-L1 (sPD-L1) in sera is associated with aggressiverenal cell carcinoma and shorter survival in multiple myelomaand diffuse large B-cell lymphoma (17–19). sPD-L1 can beproduced by cytokine-activated mature DCs in vitro (20). How-ever, the mechanisms by which sPD-L1 in patients are generatedremain poorly understood. The clinical significance of circulatingsPD-L1 in melanoma is unknown. A splice variant of PD-L1,which lacks the IgV domain by splicing out exon 2 (21), is likelyneither secreted nor functional, because it retains the transmem-brane domain but lacks the PD-1 binding site within the IgVdomain. An additional variant with splicing regions in exons 3and 4 is documented in Genbank (Accession: AY714881).
Here, we identify four splice variants of PD-L1 in melanomaand investigated production of sPD-L1 in patients receivingimmune checkpoint blockade.
Materials and MethodsCell lines
A375, K008, K028, K029, K033, M34, and UACC257 melano-ma cell lines were cultured in DMEM medium with 10% fetalbovine serum. 293T cells were cultured in complete DMEM.Human melanoma cells were isolated from tumor biopsies ofmelanoma patients, and the human melanoma cell lines were
1Department of Medical Oncology, Dana-Farber Cancer Institute and HarvardMedical School, Boston, Massachusetts. 2Melanoma Disease Center, Dana-Far-ber Cancer Institute and Harvard Medical School, Boston, Massachusetts. 3Cen-ter for Immuno-oncology, Dana-Farber Cancer Institute and Harvard MedicalSchool, Boston, Massachusetts. 4Division of Hematology/Oncology, Beth IsraelDeaconessMedical Center, Boston, Massachusetts.5Department of Biostatisticsand Computational Biology, Dana-Farber Cancer Institute, Boston, Massachu-setts. 6Department of Pathology, Brigham and Women's Hospital, Boston,Massachusetts. 7Department of Medicine, University of Pittsburgh, Pittsburgh,Pennsylvania. 8Immunologic Monitoring and Cellular Products Laboratory,Hillman Cancer Center Research Pavilion, University of Pittsburgh CancerInstitute, Pittsburgh, Pennsylvania. 9Biomedical Research Laboratories, Med-icine Faculty, Catholic University of Maule, Talca, Chile. 10Novartis Institutesfor BioMedical Research, Cambridge, Massachusetts.
Note: Supplementary data for this article are available at Cancer ImmunologyResearch Online (http://cancerimmunolres.aacrjournals.org/).
Corresponding Author: F. Stephen Hodi, Dana-Farber Cancer Institute, 450Brookline Avenue, Boston, MA 02215. Phone: 617-632-5053; Fax: 617-582-7992;E-mail: [email protected]
doi: 10.1158/2326-6066.CIR-16-0329
�2017 American Association for Cancer Research.
CancerImmunologyResearch
Cancer Immunol Res; 5(6) June 2017480
on February 1, 2019. © 2017 American Association for Cancer Research. cancerimmunolres.aacrjournals.org Downloaded from
Published OnlineFirst May 18, 2017; DOI: 10.1158/2326-6066.CIR-16-0329
developed approximately 25 years ago in accordance with Dana-Farber/Harvard Cancer Center Institutional Review Boardapproved protocols. UACC257 cells were kindly provided by Dr.David E. Fisher fromMassachusetts General Hospital, Boston, 11years ago. A375 cells were obtained from ATCC 10 years ago. Thecell lines have been used in current project for 5 years. All cell lineswere confirmed to express MITF and melanocytic markers. Cellline authentication was performed using short tandem repeatprofiling and profiling data were compared with known cell lineDNA profiles in the end of current project in 2016.
Plasma and sera of healthy donors and melanoma patientsPeripheral blood samples were obtained from melanoma
patients and healthy donors on Dana-Farber Cancer Center Insti-tutional Review Board approved protocols. Peripheral blood wascollected inheparinized and anticoagulant-free tubes. Plasma andserum supernatants were collected by centrifugation. Specimenswere further analyzed from 42 patients receiving combinationipilimumab plus bevacizumab in a clinical trial (NCT00790010;ref. 22), from 23 patients receiving ipilimumab, and from 35patients receiving pembrolizumab (anti–PD-1) at DFCI. Periph-eral blood samples were obtained frommelanoma patients in theNCI-sponsored Eastern Cooperative Group Trial E1608 com-paring ipilimumab plus sargramostim with ipilimumab(NCT01134614; ref. 23). Peripheral blood was collected in redtop, anticoagulant-free tubes, shipped overnight from clinicalsites to the ECOG-ACRIN immunology reference Lab at theUniversity of Pittsburgh Cancer Institute, where it was processedupon receipt for serum. Serum supernatant was collected bycentrifugation and stored at a�80�C inmonitored freezer. Speci-mens were further analyzed from 151 patients. Among them, 78patients were treated with ipilimumab plus sargramostim(arm A), and 73 patients received ipilimumab (control arm B).
RT-PCR and human PD-L1 variant cloningTotal RNA of melanoma cell lines was generated with the
RNeasy Mini Kit (Qiagen). RNA (1 mg) of each melanoma cellline was reverse-transcripted to cDNA with SuperScript reversetranscriptase (Life Technologies). PD-L1 transcripts from A375and M34 melanoma cell lines were cloned by PCR with a XbaIrestriction site tagged forward primer: GCGTCGTCTAGAGCCAC-CATGAGGATATTTGCTGTCT encompassing the translationalstart site and a SalI tagged reverse primer: Sal1 GCGCCAGTC-GACTTACGTCTCCTCCAAATGTGT encompassing the transla-tional stop site of full-length PD-L1. The PCR products werecloned into a TA TOPO vector (Life Technologies) for sequencinganalysis. The variants of PD-L1 were further inserted into alentiviral transfer vector pELNS, which was kindly provided byDr. Michael P. Riley from University of Pennsylvania (Philadel-phia, PA).
To detect mRNA splicing variants of PD-L1 in melanoma celllines, primers were designed to contain both ends of splice donorand acceptor, and were specific for PD-L1-1, 3/12, and 9 variants(Supplementary Fig. S1). The specific primers of PD-L1-1, PD-L1-3/12, and PD-L1-9 were CCAAATGAAAGGACTCACTTG/CGTC-TCCTCCAAATGTGTATCTT, AAGTCCTGAGTGGAGATTAGATC/CATTCTCCCAAGTGAGTCC, and ACCAGCACACTGAGAAT-CAAC/CACATCCATCATTCTCCCAAG, respectively. The sizes ofPCR products were 103, 104, and 161 bps, respectively. Theidentities of the PCR products were confirmed by sequencing(Eton Bioscience Inc.).
Transfection, lentiviral production, and lentiviral transductionThe pELNS expressing PD-L1 variants were cotransfected into
293T cells with three packaging plasmids expressing gag/pol, VSV-g, and REV using TransfectIT-293 (Mirus). Lentiviral supernatantswere collected and filtered. PD-L1-1, PD-L1-3, and PD-L1-9 weretransduced into 1 � 105 A375 cells with the supernatant in thepresence of 8 mg/mL Polybrene (EMD Millipore).
Immunoprecipitation, SDS-PAGE, and immunoblottingFor BRAF resistant cell line studies, approximately 8 � 107
PLX4032 resistant A375 and 1 � 107 PLX4032 resistant M34melanoma cell lineswere cultured in completeDMEMmedium inthe presence of 1 mg/mL PLX4032 for 2 days. After washing withPBS three times, the cells were further cultured in Opti-MEMreduced serum medium (Life Technologies) in the presence of1 mg/mL PLX4032 for 2 days. For cytokine induction studies,approximately 5–30 � 106 cells (A375, K008, K028, andUACC257)were cultured in complete DMEMmedium for 2 days.After washing with PBS three times, the melanoma cell lines werecultured in Opti-MEM reduced serummedium in the presence ofeither 200 U/mL IFNg (Biolegend), or 2000 U/mL IFNa (EMDMillipore), or 10 ng/mL TNFa (R&D systems) for an additional 2days. The culture media were collected, and concentrated with a3K cutoffCentriprep spin column(EMDMillipore). Sampleswerenormalized by cell numbers. Concentrated supernatant was incu-bated with 0.5 mg anti-human PD-L1 mAb (clone 29E.2A3,Biolegend) and 10 mL protein G plus agarose (Santa Cruz Bio-technology) at 4 �Covernight. Afterwashingwith PBS, the agarosebeads were resuspended in Laemmli's reducing buffer (BostonBioproducts), and further heated. Immunoprecipitated proteinswere subjected to 12% SDS-polyacrylamide gel electrophoresis(PAGE), and transferred onto PVDFmembranes. Themembraneswere immunoblotted overnight at 4�C with a biotinylated goatanti-human PD-L1 at 0.1 mg/mL (R&D systems), and furtherincubated with HRP-conjugated streptavidin at 2.5 mg/mL(Jackson ImmunoResearch) at room temperature for 2 hours.The protein bands were detected by chemiluminescence(PerkinElmer).
PD-L1/Fc fusion proteinCH2 and CH3 domains of human IgG1 were fused to PD-L1-3,
PD-L1-9, and PD-L1-1 in pELNS vector. PD-L1-3/Fc, PD-L1-9/Fc,and PD-L1-1/Fc were transduced into CHO-S cells by lentiviralsupernatant in the presence of 8 mg/mL Polybrene (EMD Milli-pore), respectively. PD-L1-3/Fc, PD-L1-9/Fc, and PD-L1-1/Fcwerepurified with protein A agarose (Life Technologies). It was furtherconfirmed by SDS-PAGE and Coomassie staining, and by immu-noblottingwith anti-humanPD-L1mAb (29E.1D5) (Supplemen-tary Fig. S2A and S2B).
Proliferation assayTo generate activated T cells, human na€�ve CD4þ or CD8þ T
cells were treatedwith 10 mg/mL PHA for 3 days and further restedovernight. A total of 1� 105 cells/well of PHA-activated CD4þ orCD8þ T cells were stimulated with 5 mg/mL coated anti-CD3 (BDBiosciences) in the absence or presence of 10 mg/mL coated eitherrecombinant fusion proteins of PD-L1 variants or human IgG for3 days, and further pulsedwith [3H]thymidine (0.25mCiH3/well)for 6 hours. The incorporated radioactivity was measured in aliquid scintillation counter (Wallac 1450Microbeta Trilux, PerkinElmer).
Soluble PD-L1 in Melanoma
www.aacrjournals.org Cancer Immunol Res; 5(6) June 2017 481
on February 1, 2019. © 2017 American Association for Cancer Research. cancerimmunolres.aacrjournals.org Downloaded from
Published OnlineFirst May 18, 2017; DOI: 10.1158/2326-6066.CIR-16-0329
sPD-L1 ELISATo assay sPD-L1 variants, 0.1mg/well ofmouse anti-humanPD-
L1mab (130021, R&D systems) or 0.2mg/well anti-human PD-L1mAb (29E.12B1) was coated on Costar ELISA plates overnight at4�C. Plates were then washed with PBS and blocked with protein-free blocking buffer (Pierce) for 4 hours. Patient sera or plasmawere diluted with PBS in 1:1 volume ratio. One-hundred micro-liters per well of diluted patient sera or plasma was added andincubated overnight at 4�C. Plates were washedwith PBS contain-ing Tween-20, and incubated with 100 mL per well of 0.1 mg/wellbiotinylated anti–PD-L1 mAb (29E.2A3, Biolegend) in protein-free blocking buffer at room temperature for 2 hours. Plates werethen washed and incubated with 1 mg/mL streptavidin-HRP(Jackson ImmunoResearch) diluted 1:40,000 in protein-freeblocking buffer for 2 hours. Plates were washed and treated withbiotinyl tyramide (Perkin Elmer) for 30 minutes, and thenwashed and incubated with 1 mg/mL streptavidin-HRP (JacksonImmunoResearch) diluted 1:400,000 in protein-free blockingbuffer for 2 hours with further development with TMB (Pierce).Plates were read at an optical density (O.D.) of 450 nm. Allsamples were assayed in duplicate. A standard curve using recom-binant human PD-L1-HIS (Novoprotein) was also performedwith each assay.
Cytokine Luminex assayIFNa, IFNg , and TNFa in plasma of melanoma patients were
quantified by a Luminex beads kit (EMD Millipore). Twenty-fivemicroliters/well of antibody coupled beads and 50 mL/well ofdiluted patient plasma were added into a 96-well plate andincubated overnight at 4�C. Plates were processed followingmanufacturer's instruction and read by Luminex 200 (LuminexCorporation). All samples were performed in duplicate. Thestandard curves were also performed with each assay.
Statistical analysesELISAs were conducted in duplicate to examine sPD-L1 in
patient serum samples. A value of 0.1 ng/mL was determined tobe the lower limit of detection on the basis of sensitivity of theELISA assay. If assay values were < 0.1 ng/mL, 0.01 ng/mL wassubstituted. Clinical comparisons addressed two hypotheses: (i)high levels of sPD-L1 were associated with progressive disease;and (ii) long-term or delayed increases in sPD-L1 were associatedwith favorable clinical response. Data from the ipilimumab plusbevacizumab trial were used as a test set; data from E1608 andfrom patients treated with ipilimumab and PD-1 were validationsets. Division points in pretreatment sPD-L1 in sPD-L1 used in theanalysiswere basedon the test set andwere selected todeterminedusing the algorithmofContal-O'Quigley (24).Division points forpretreatment sPD-L1L and sPD-L1all were 0.5 ng/mL and 1.4 ng/mL, respectively. An increase of at least 1.5-fold relative to pre-treatment was considered meaningful.
Pretreatment comparisons were based on data from allpatients. Five-month landmark samples were used to assess theeffects of change in sPD-L1 upon response or survival. Patientswhowere alive and had posttreatment samples collected between5 and 7months (ipilimumab plus bevacizumab trial) or 5 and 11months (E1608Control ArmBor PD-1)were followed forward intime. If multiple samples were collected for a patient during thelandmark window, data from the first sample were used in theanalysis. Two sample Student t tests with unequal variances wereconducted to assess sPD-L1 pretreatment level differences in sera
between healthy donors and melanoma patients. The compar-isons of clinical response according to categories of pretreatmentlevels or on-treatment increases in sPD-L1 were carried out withFisher exact tests. Comparisons of sPD-L1 levels according toresponse were based on Kruskal–Wallis tests. The distribution ofoverall survival was summarized using the method of Kaplan–Meier; comparisons of survival according to pretreatment or on-treatment sPD-L1 classes were based on log-rank tests. All testswere two-sided, and P < 0.05 was considered statisticallysignificant.
ResultsSplice variants of PD-L1 in melanoma
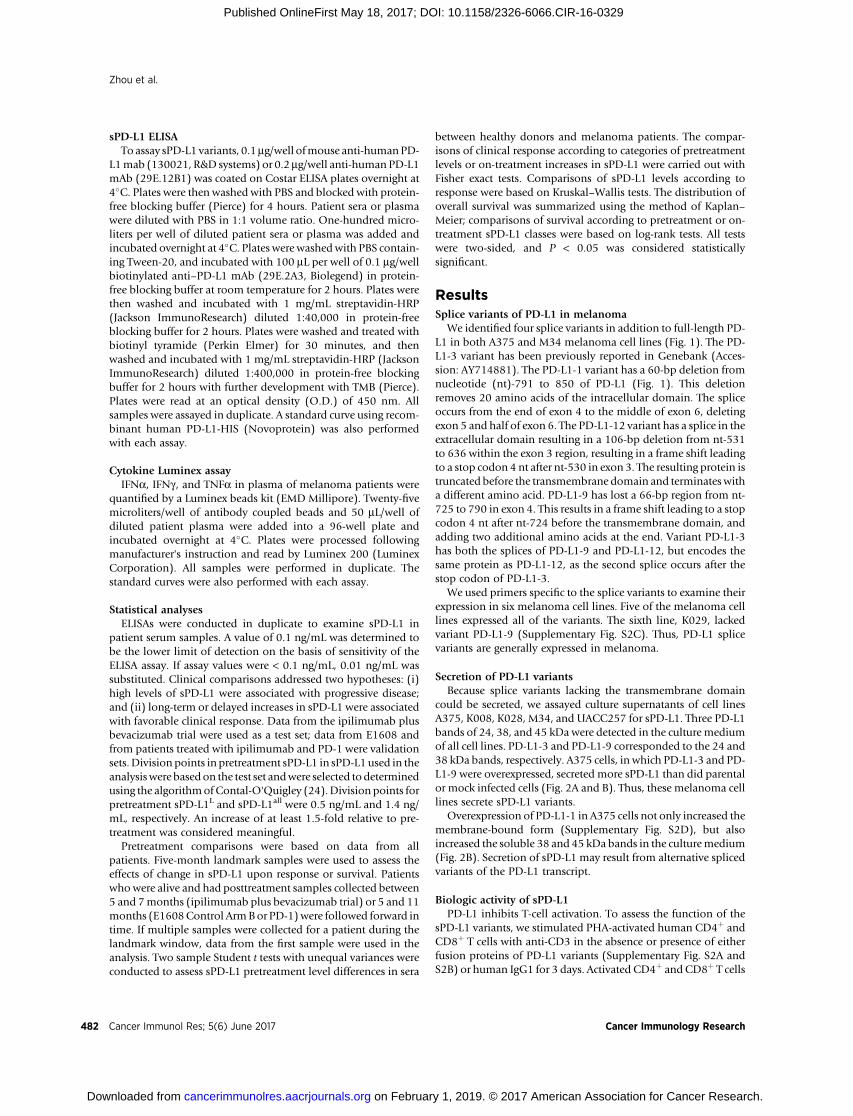
We identified four splice variants in addition to full-length PD-L1 in both A375 and M34 melanoma cell lines (Fig. 1). The PD-L1-3 variant has been previously reported in Genebank (Acces-sion: AY714881). The PD-L1-1 variant has a 60-bp deletion fromnucleotide (nt)-791 to 850 of PD-L1 (Fig. 1). This deletionremoves 20 amino acids of the intracellular domain. The spliceoccurs from the end of exon 4 to the middle of exon 6, deletingexon 5 and half of exon 6. The PD-L1-12 variant has a splice in theextracellular domain resulting in a 106-bp deletion from nt-531to 636 within the exon 3 region, resulting in a frame shift leadingto a stop codon 4 nt after nt-530 in exon 3. The resulting protein istruncated before the transmembrane domain and terminates witha different amino acid. PD-L1-9 has lost a 66-bp region from nt-725 to 790 in exon 4. This results in a frame shift leading to a stopcodon 4 nt after nt-724 before the transmembrane domain, andadding two additional amino acids at the end. Variant PD-L1-3has both the splices of PD-L1-9 and PD-L1-12, but encodes thesame protein as PD-L1-12, as the second splice occurs after thestop codon of PD-L1-3.
We used primers specific to the splice variants to examine theirexpression in six melanoma cell lines. Five of the melanoma celllines expressed all of the variants. The sixth line, K029, lackedvariant PD-L1-9 (Supplementary Fig. S2C). Thus, PD-L1 splicevariants are generally expressed in melanoma.
Secretion of PD-L1 variantsBecause splice variants lacking the transmembrane domain
could be secreted, we assayed culture supernatants of cell linesA375, K008, K028, M34, and UACC257 for sPD-L1. Three PD-L1bands of 24, 38, and 45 kDa were detected in the culture mediumof all cell lines. PD-L1-3 and PD-L1-9 corresponded to the 24 and38 kDa bands, respectively. A375 cells, in which PD-L1-3 and PD-L1-9 were overexpressed, secreted more sPD-L1 than did parentalor mock infected cells (Fig. 2A and B). Thus, these melanoma celllines secrete sPD-L1 variants.
Overexpression of PD-L1-1 in A375 cells not only increased themembrane-bound form (Supplementary Fig. S2D), but alsoincreased the soluble 38 and 45 kDa bands in the culturemedium(Fig. 2B). Secretion of sPD-L1 may result from alternative splicedvariants of the PD-L1 transcript.
Biologic activity of sPD-L1PD-L1 inhibits T-cell activation. To assess the function of the
sPD-L1 variants, we stimulated PHA-activated human CD4þ andCD8þ T cells with anti-CD3 in the absence or presence of eitherfusion proteins of PD-L1 variants (Supplementary Fig. S2A andS2B) or human IgG1 for 3 days. Activated CD4þ and CD8þ T cells
Zhou et al.
Cancer Immunol Res; 5(6) June 2017 Cancer Immunology Research482
on February 1, 2019. © 2017 American Association for Cancer Research. cancerimmunolres.aacrjournals.org Downloaded from
Published OnlineFirst May 18, 2017; DOI: 10.1158/2326-6066.CIR-16-0329
Figure 1.
A, Schematic diagram of identified splice variants of PD-L1. The full-length of PD-L1 consists of six exons. The transmembrane domain (TM) is located in exon 4 andmarked in pink. Spliced-out regions of PD-L1-1, 3, 9, and 12 are indicated with bracket symbols. Stop represents a stop codon. B, Identification of splicevariants of human PD-L1. PD-L1 transcripts fromA375 andM34melanoma cell lines were generated by RT-PCR and cloned into a TA TOPO vector. Four unique PD-L1splice variants were identified by sequencing. Three splice variants PD-L1-1, PD-L1-9, and PD-L1-12 have not been previously reported. The full-length nucleotideand amino acid sequence for membrane-bound PD-L1 are represented (top). The transmembrane domain is shown in pink. Spliced-out regions are indicatedwith bracket symbols and shown in red. In each of the identified splice variants, the amino acid sequences are shown in blue. Underlines indicate additional differentamino acids.
Soluble PD-L1 in Melanoma
www.aacrjournals.org Cancer Immunol Res; 5(6) June 2017 483
on February 1, 2019. © 2017 American Association for Cancer Research. cancerimmunolres.aacrjournals.org Downloaded from
Published OnlineFirst May 18, 2017; DOI: 10.1158/2326-6066.CIR-16-0329
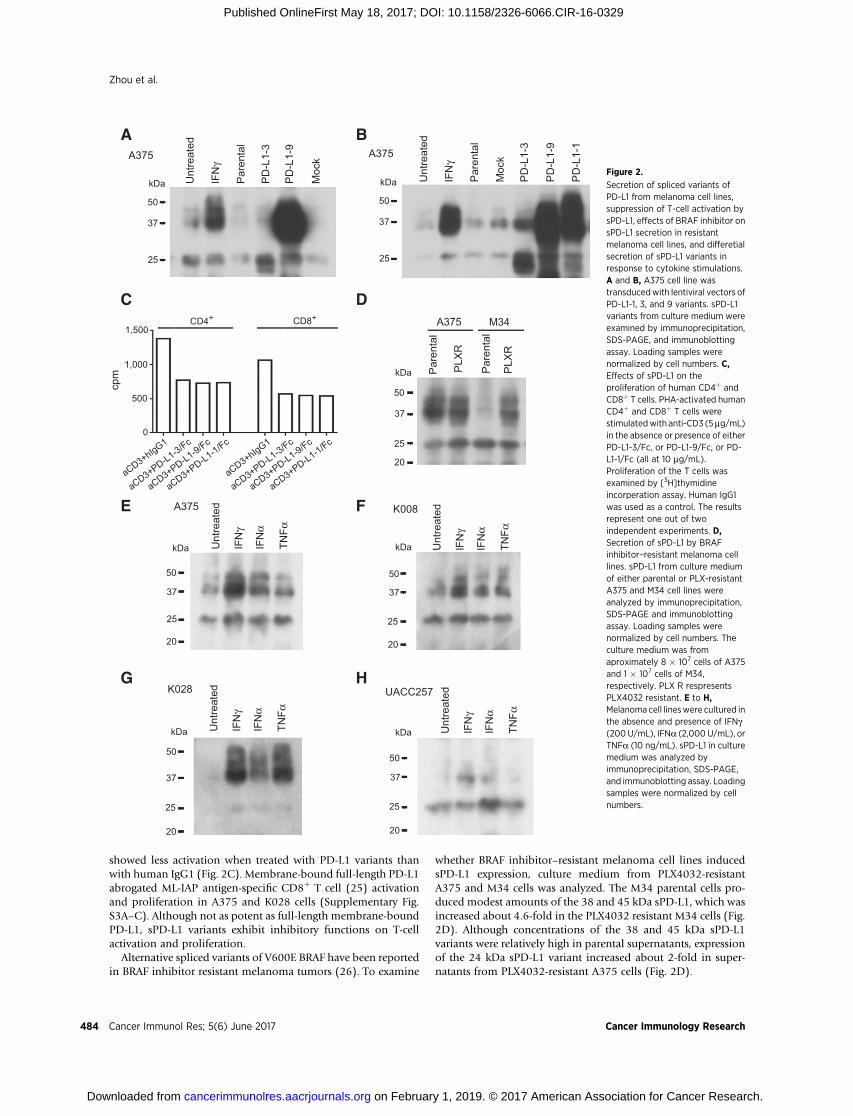
showed less activation when treated with PD-L1 variants thanwith human IgG1 (Fig. 2C). Membrane-bound full-length PD-L1abrogated ML-IAP antigen-specific CD8þ T cell (25) activationand proliferation in A375 and K028 cells (Supplementary Fig.S3A–C). Although not as potent as full-length membrane-boundPD-L1, sPD-L1 variants exhibit inhibitory functions on T-cellactivation and proliferation.
Alternative spliced variants of V600E BRAF have been reportedin BRAF inhibitor resistant melanoma tumors (26). To examine
whether BRAF inhibitor–resistant melanoma cell lines inducedsPD-L1 expression, culture medium from PLX4032-resistantA375 and M34 cells was analyzed. The M34 parental cells pro-duced modest amounts of the 38 and 45 kDa sPD-L1, which wasincreased about 4.6-fold in the PLX4032 resistant M34 cells (Fig.2D). Although concentrations of the 38 and 45 kDa sPD-L1variants were relatively high in parental supernatants, expressionof the 24 kDa sPD-L1 variant increased about 2-fold in super-natants from PLX4032-resistant A375 cells (Fig. 2D).
50
kDa
37
25
A375
A B
Untreated
Parental
Mock
PD-L1-9
PD-L1-3
IFN
γ50
kDa
37
25
A375
50
kDa
37
25
20
Untreated
Parental
Parental
Parental
PLXR
M34A375
PLXR
Mock
PD-L1-1
PD-L1-9
PD-L1-3
IFN
γ
50
kDa
37
25
20
K008
Untreated
IFN
γ
IFN
α
TNFα
50
kDa
37
25
20
UACC257
Untreated
IFN
γ
IFN
α
TNFα
50
kDa
37
25
20
K028
Untreated
IFN
γ
IFN
α
TNFα
50
kDa
37
25
20
A375
500
0
cpm
1,000
1,500CD4+ CD8+
aCD3+hIgG1
aCD3+hIgG1
aCD3+PD-L1-3/Fc
aCD3+PD-L1-3/Fc
aCD3+PD-L1-9/Fc
aCD3+PD-L1-9/Fc
aCD3+PD-L1-1/Fc
aCD3+PD-L1-1/Fc
Untreated
IFN
γ
IFN
α
TNFα
C D
E F
G H
Figure 2.
Secretion of spliced variants ofPD-L1 from melanoma cell lines,suppression of T-cell activation bysPD-L1, effects of BRAF inhibitor onsPD-L1 secretion in resistantmelanoma cell lines, and differetialsecretion of sPD-L1 variants inresponse to cytokine stimulations.A and B, A375 cell line wastransducedwith lentiviral vectors ofPD-L1-1, 3, and 9 variants. sPD-L1variants from culture medium wereexamined by immunoprecipitation,SDS-PAGE, and immunoblottingassay. Loading samples werenormalized by cell numbers. C,Effects of sPD-L1 on theproliferation of human CD4þ andCD8þ T cells. PHA-activated humanCD4þ and CD8þ T cells werestimulatedwith anti-CD3 (5mg/mL)in the absence or presence of eitherPD-L1-3/Fc, or PD-L1-9/Fc, or PD-L1-1/Fc (all at 10 mg/mL).Proliferation of the T cells wasexamined by [3H]thymidineincorperation assay. Human IgG1was used as a control. The resultsrepresent one out of twoindependent experiments. D,Secretion of sPD-L1 by BRAFinhibitor–resistant melanoma celllines. sPD-L1 from culture mediumof either parental or PLX-resistantA375 and M34 cell lines wereanalyzed by immunoprecipitation,SDS-PAGE and immunoblottingassay. Loading samples werenormalized by cell numbers. Theculture medium was fromaproximately 8 � 107 cells of A375and 1 � 107 cells of M34,respectively. PLX R respresentsPLX4032 resistant. E to H,Melanoma cell lineswere cultured inthe absence and presence of IFNg(200U/mL), IFNa (2,000 U/mL), orTNFa (10 ng/mL). sPD-L1 in culturemedium was analyzed byimmunoprecipitation, SDS-PAGE,and immunoblotting assay. Loadingsamples were normalized by cellnumbers.
Zhou et al.
Cancer Immunol Res; 5(6) June 2017 Cancer Immunology Research484
on February 1, 2019. © 2017 American Association for Cancer Research. cancerimmunolres.aacrjournals.org Downloaded from
Published OnlineFirst May 18, 2017; DOI: 10.1158/2326-6066.CIR-16-0329
To assess the effects of cytokines, such as IFNg (which inducesPD-L1) on the secretion of sPD-L1 variants, cell lines A375, K008,K028, and UACC257 were cultured in the absence or presence ofIFNg (200 U/mL), IFNa (2,000U/mL), or TNFa (10 ng/mL) for 2days. The 38 and 45 kDa bands of sPD-L1 were increased 4 or 2.3-fold by IFNg treatment, 2.7 or 1.3-fold by IFNa, and 1.6 or 1.2-fold by TNFa, in supernatants from cell lines A375 and K008,respectively (Fig. 2E and F). The38- and45-kDabands of PD-L1 insupernatant from K028 were increased by about 14-fold withIFNg or TNFa treatments and by 6.6-fold with IFNa treatment(Fig. 2G). The 38- and 45-kDa bands increased in cell lineUACC257 supernatants 6.3- or 4.7-fold with IFNg or IFNa treat-ments, respectively, and the 24-kDa band increased 2.2-fold withIFNa treatment (Fig. 2H).Differentmelanoma cell lines appearedto produce different sPD-L1 variants in response to differentcytokine treatment.
Cytokine treatment of A375, K028, and UACC257 melanomacell lines resulted in increased secretion of sPD-L1, as well asincreased expression of cell surface PD-L1 and decreased cellproliferation (Fig. 2E, G, and H; Supplementary Fig. S4A–S4C).K008 cells constitutively express PD-L1, but express sPD-L1 inresponse to cytokine treatment (Fig. 2F; Supplementary Fig. S4D).Thus, cytokines induced expression of both sPD-L1 and PD-L1 ina dose-dependent manner in melanoma cell lines (Supplemen-tary Fig. S5A–S5F).
The expression of cell surface PD-L1 parallels expression ofsPD-L1 in melanoma cell lines without cytokine treatment (Sup-plementary Figs. S4 and S5G), and is inducible by sodium azide(Supplementary Fig. S6). We suggest that secretion or release ofsPD-L1 can result from BRAF-resistance mechanisms, cytokineinduction, cell stress or cell injury, or cell death.
Development of sPD-L1 ELISAWe developed ELISA assays with two capture antibodies that
detect PD-L1 variants. Specificity was assayedwith concentrationsof recombinant PD-L1 (Novoprotein), PDL2 (Novoprotein), ML-IAP (R&D systems), and human IgG1 (SouthernBiotech) rangingfrom 0.001 ng/mL to 100 ng/mL (Supplementary Fig. S7A andS7B).Mouse anti PD-L1mAbs, clone 29E.12B1, and 130021wereboth specific and sensitive capture mAbs for PD-L1. Thelower limit of detection sensitivity was 0.1 ng/mL of recombinantPD-L1.
The specificity of the two capture ELISA assays for the sPD-L1variants was also investigated. The pretreatment secretion of sPD-L1 in A375was below the level of detection. Thus, A375 cells weretransduced with either PD-L1-3, or PD-L1-9, or PD-L1-1 and thesupernatants were assayed by ELISA (Supplementary Fig. S7C andS7D). Amino acid regions of sPD-L1 variants, amino acid regionsof recombinant PD-L1-3/Fc and PD-L1-HIS, and antibody recog-
nition regions are shown inSupplementaryTable S1AandS1B, andSupplementary Fig. S8A, respectively. Clone130021mAbwas ableto detect sPD-L1-9 and sPD-L1-1 variants, which are the two longerforms (PD-L1L) with an intact IgC domain, whereas clone29E.12B1 mAb recognized all three sPD-L1 variants (PD-L1all).To confirm the different recognitions of these two antibodies,recombinant PD-L1-3/Fc and PD-L1-HIS were detected with theantibodies by SDS-PAGE and immunoblotting. Clone 130021only recognized PD-L1-HIS, which contains the complete extra-cellular domain found in the long soluble forms (PD-L1L; Sup-plementary Fig. S8A–S8D). On the other hand, clone 29E.12B1detected PD-L1-3/Fc, the shortest form, recognizing an epitope inthe IgV domain. Thus, clone 29E.12B1 and clone 130021 candistinguish sPD-L1 variants. The detection mAb 29E.2A3 recog-nizes an epitope in the IgV domain that is non-overlapping withthe 29E.12B1 epitope (Supplementary Fig. S8E and S8F).
Quantitative detection of sPD-L1 concentrations between seraand plasma from the same patient showed no differences in theseassays (Supplementary Fig. S9A and S9B).
sPD-L1 levels in melanoma patientssPD-L1 in samples from 25 healthy donors and 65 untreated
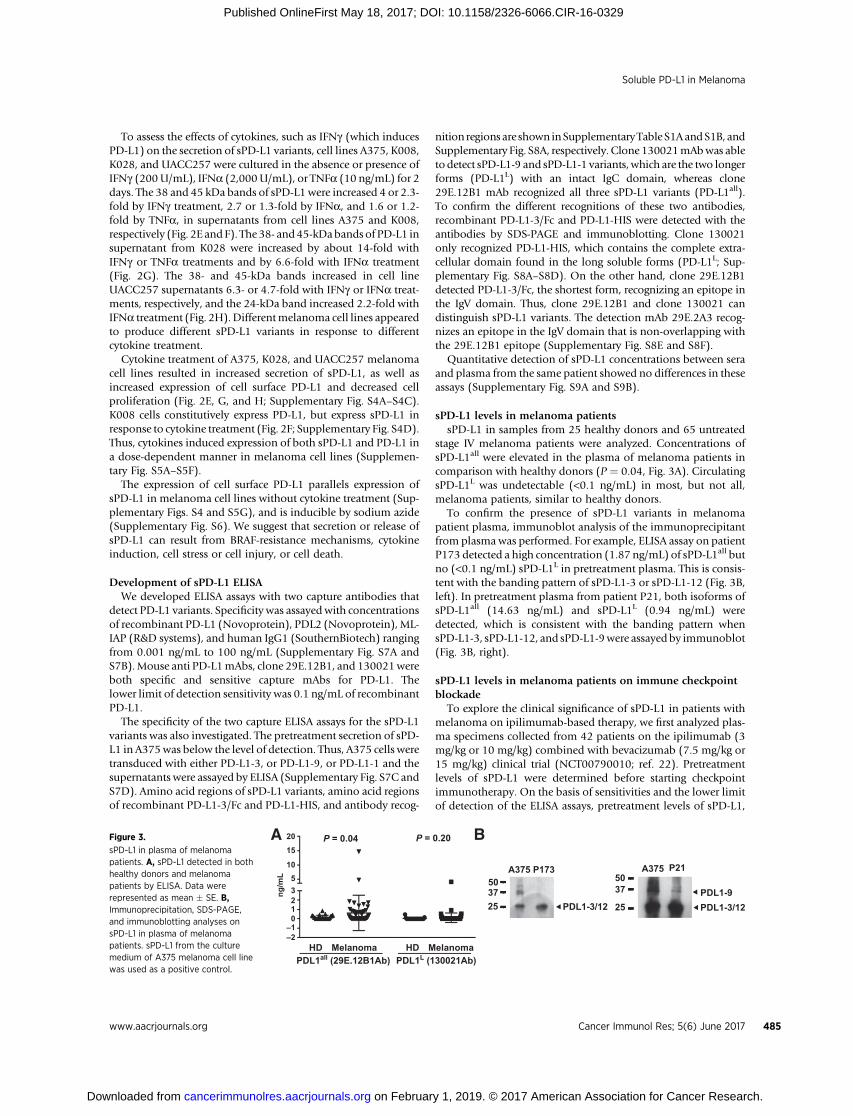
stage IV melanoma patients were analyzed. Concentrations ofsPD-L1all were elevated in the plasma of melanoma patients incomparison with healthy donors (P ¼ 0.04, Fig. 3A). CirculatingsPD-L1L was undetectable (<0.1 ng/mL) in most, but not all,melanoma patients, similar to healthy donors.
To confirm the presence of sPD-L1 variants in melanomapatient plasma, immunoblot analysis of the immunoprecipitantfrom plasma was performed. For example, ELISA assay on patientP173 detected a high concentration (1.87 ng/mL) of sPD-L1all butno (<0.1 ng/mL) sPD-L1L in pretreatment plasma. This is consis-tent with the banding pattern of sPD-L1-3 or sPD-L1-12 (Fig. 3B,left). In pretreatment plasma from patient P21, both isoforms ofsPD-L1all (14.63 ng/mL) and sPD-L1L (0.94 ng/mL) weredetected, which is consistent with the banding pattern whensPD-L1-3, sPD-L1-12, and sPD-L1-9were assayedby immunoblot(Fig. 3B, right).
sPD-L1 levels in melanoma patients on immune checkpointblockade
To explore the clinical significance of sPD-L1 in patients withmelanoma on ipilimumab-based therapy, we first analyzed plas-ma specimens collected from 42 patients on the ipilimumab (3mg/kg or 10 mg/kg) combined with bevacizumab (7.5 mg/kg or15 mg/kg) clinical trial (NCT00790010; ref. 22). Pretreatmentlevels of sPD-L1 were determined before starting checkpointimmunotherapy. On the basis of sensitivities and the lower limitof detection of the ELISA assays, pretreatment levels of sPD-L1,
P = 0.04 P = 0.20
HD–2–1
1235
15
10
20A B
ng/m
L
0
MelanomaPDL1all (29E.12B1Ab) PDL1L (130021Ab)
HD Melanoma
503725
A375 P173
PDL1-3/12PDL1-9PDL1-3/12
A375 P215037
25
Figure 3.
sPD-L1 in plasma of melanomapatients. A, sPD-L1 detected in bothhealthy donors and melanomapatients by ELISA. Data wererepresented as mean � SE. B,Immunoprecipitation, SDS-PAGE,and immunoblotting analyses onsPD-L1 in plasma of melanomapatients. sPD-L1 from the culturemedium of A375 melanoma cell linewas used as a positive control.
Soluble PD-L1 in Melanoma
www.aacrjournals.org Cancer Immunol Res; 5(6) June 2017 485
on February 1, 2019. © 2017 American Association for Cancer Research. cancerimmunolres.aacrjournals.org Downloaded from
Published OnlineFirst May 18, 2017; DOI: 10.1158/2326-6066.CIR-16-0329
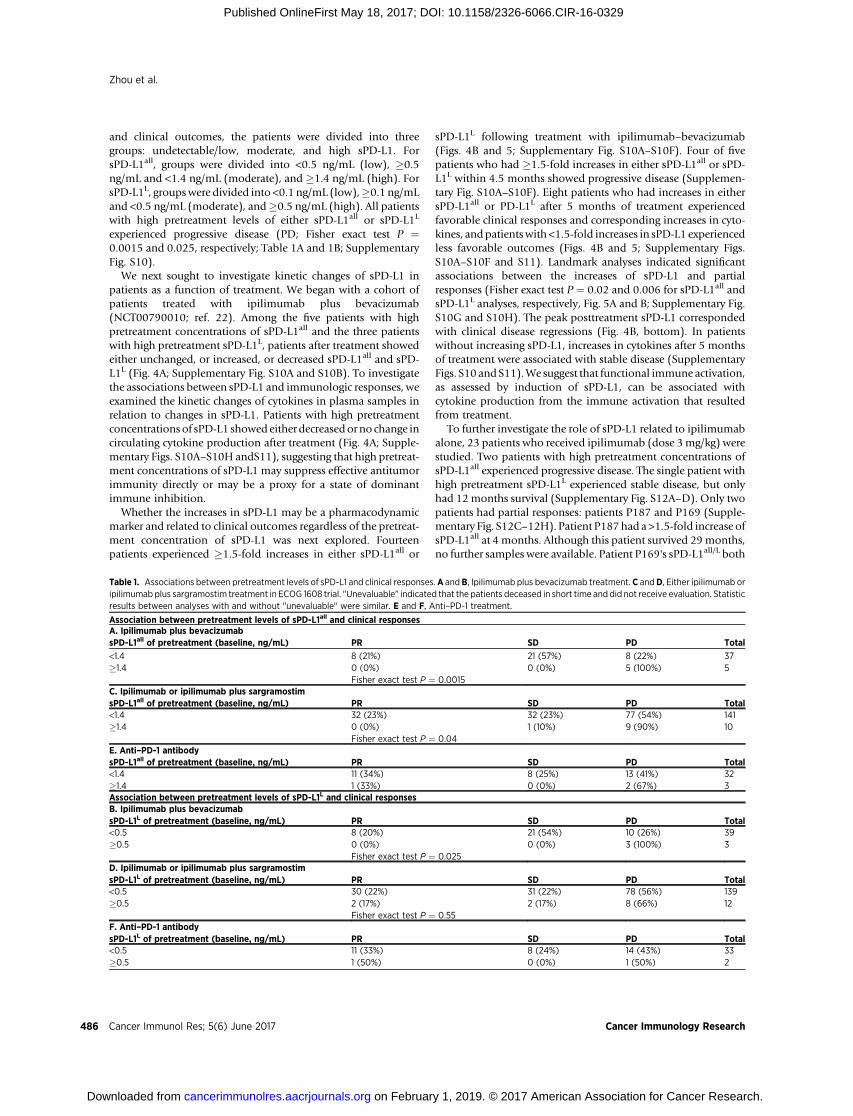
and clinical outcomes, the patients were divided into threegroups: undetectable/low, moderate, and high sPD-L1. ForsPD-L1all, groups were divided into <0.5 ng/mL (low), �0.5ng/mL and <1.4 ng/mL (moderate), and �1.4 ng/mL (high). ForsPD-L1L, groupswere divided into <0.1 ng/mL (low),�0.1 ng/mLand <0.5 ng/mL (moderate), and�0.5 ng/mL (high). All patientswith high pretreatment levels of either sPD-L1all or sPD-L1L
experienced progressive disease (PD; Fisher exact test P ¼0.0015 and 0.025, respectively; Table 1A and 1B; SupplementaryFig. S10).
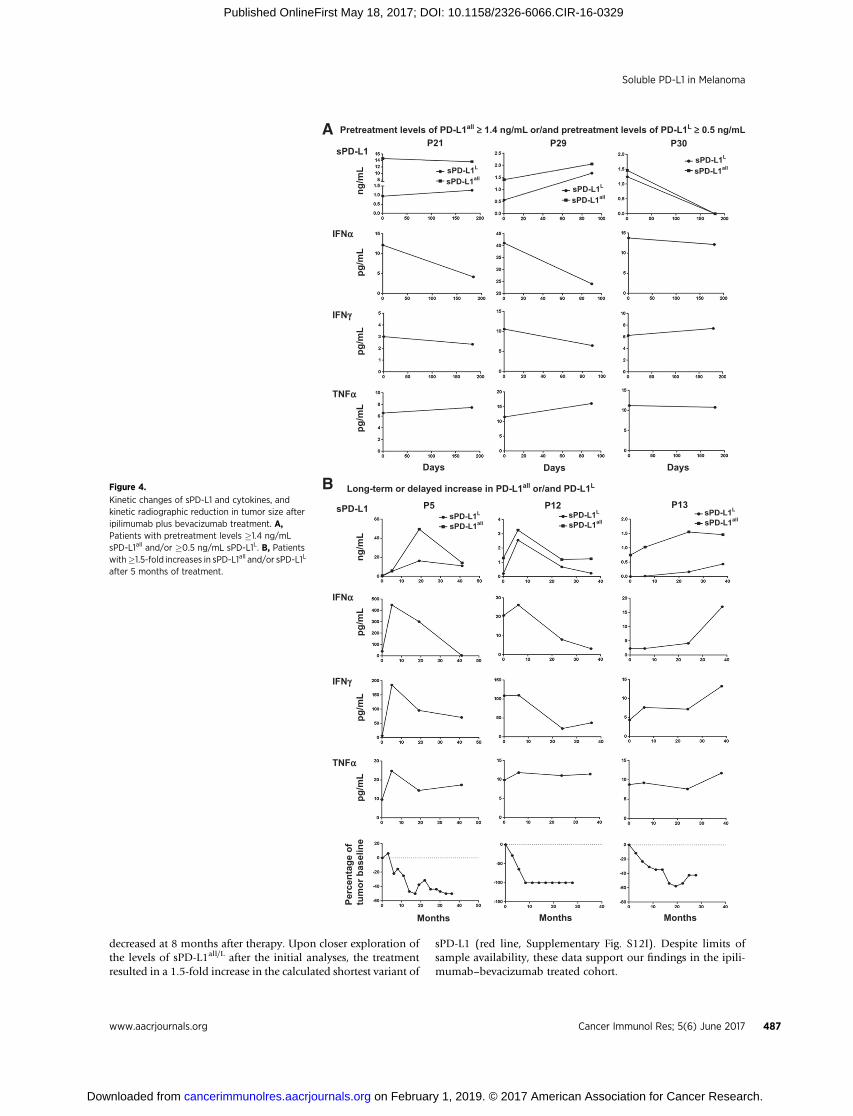
We next sought to investigate kinetic changes of sPD-L1 inpatients as a function of treatment. We began with a cohort ofpatients treated with ipilimumab plus bevacizumab(NCT00790010; ref. 22). Among the five patients with highpretreatment concentrations of sPD-L1all and the three patientswith high pretreatment sPD-L1L, patients after treatment showedeither unchanged, or increased, or decreased sPD-L1all and sPD-L1L (Fig. 4A; Supplementary Fig. S10A and S10B). To investigatethe associations between sPD-L1 and immunologic responses, weexamined the kinetic changes of cytokines in plasma samples inrelation to changes in sPD-L1. Patients with high pretreatmentconcentrations of sPD-L1 showed either decreasedor no change incirculating cytokine production after treatment (Fig. 4A; Supple-mentary Figs. S10A–S10H andS11), suggesting that high pretreat-ment concentrations of sPD-L1 may suppress effective antitumorimmunity directly or may be a proxy for a state of dominantimmune inhibition.
Whether the increases in sPD-L1 may be a pharmacodynamicmarker and related to clinical outcomes regardless of the pretreat-ment concentration of sPD-L1 was next explored. Fourteenpatients experienced �1.5-fold increases in either sPD-L1all or
sPD-L1L following treatment with ipilimumab–bevacizumab(Figs. 4B and 5; Supplementary Fig. S10A–S10F). Four of fivepatients who had �1.5-fold increases in either sPD-L1all or sPD-L1L within 4.5 months showed progressive disease (Supplemen-tary Fig. S10A–S10F). Eight patients who had increases in eithersPD-L1all or PD-L1L after 5 months of treatment experiencedfavorable clinical responses and corresponding increases in cyto-kines, andpatientswith<1.5-fold increases in sPD-L1 experiencedless favorable outcomes (Figs. 4B and 5; Supplementary Figs.S10A–S10F and S11). Landmark analyses indicated significantassociations between the increases of sPD-L1 and partialresponses (Fisher exact test P ¼ 0.02 and 0.006 for sPD-L1all andsPD-L1L analyses, respectively, Fig. 5A and B; Supplementary Fig.S10G and S10H). The peak posttreatment sPD-L1 correspondedwith clinical disease regressions (Fig. 4B, bottom). In patientswithout increasing sPD-L1, increases in cytokines after 5 monthsof treatment were associated with stable disease (SupplementaryFigs. S10 andS11).We suggest that functional immune activation,as assessed by induction of sPD-L1, can be associated withcytokine production from the immune activation that resultedfrom treatment.
To further investigate the role of sPD-L1 related to ipilimumabalone, 23 patients who received ipilimumab (dose 3mg/kg) werestudied. Two patients with high pretreatment concentrations ofsPD-L1all experienced progressive disease. The single patient withhigh pretreatment sPD-L1L experienced stable disease, but onlyhad 12months survival (Supplementary Fig. S12A–D). Only twopatients had partial responses: patients P187 and P169 (Supple-mentary Fig. S12C–12H). Patient P187had a>1.5-fold increase ofsPD-L1all at 4 months. Although this patient survived 29months,no further samples were available. Patient P169's sPD-L1all/L both
Table 1. Associations between pretreatment levels of sPD-L1 and clinical responses.A andB, Ipilimumab plus bevacizumab treatment.C andD, Either ipilimumab oripilimumab plus sargramostim treatment in ECOG 1608 trial. "Unevaluable" indicated that the patients deceased in short time and did not receive evaluation. Statisticresults between analyses with and without "unevaluable" were similar. E and F, Anti–PD-1 treatment.
Association between pretreatment levels of sPD-L1all and clinical responsesA. Ipilimumab plus bevacizumabsPD-L1all of pretreatment (baseline, ng/mL) PR SD PD Total
<1.4 8 (21%) 21 (57%) 8 (22%) 37�1.4 0 (0%) 0 (0%) 5 (100%) 5
Fisher exact test P ¼ 0.0015C. Ipilimumab or ipilimumab plus sargramostimsPD-L1all of pretreatment (baseline, ng/mL) PR SD PD Total<1.4 32 (23%) 32 (23%) 77 (54%) 141�1.4 0 (0%) 1 (10%) 9 (90%) 10
Fisher exact test P ¼ 0.04E. Anti–PD-1 antibodysPD-L1all of pretreatment (baseline, ng/mL) PR SD PD Total<1.4 11 (34%) 8 (25%) 13 (41%) 32�1.4 1 (33%) 0 (0%) 2 (67%) 3Association between pretreatment levels of sPD-L1L and clinical responsesB. Ipilimumab plus bevacizumabsPD-L1L of pretreatment (baseline, ng/mL) PR SD PD Total<0.5 8 (20%) 21 (54%) 10 (26%) 39�0.5 0 (0%) 0 (0%) 3 (100%) 3
Fisher exact test P ¼ 0.025D. Ipilimumab or ipilimumab plus sargramostimsPD-L1L of pretreatment (baseline, ng/mL) PR SD PD Total<0.5 30 (22%) 31 (22%) 78 (56%) 139�0.5 2 (17%) 2 (17%) 8 (66%) 12
Fisher exact test P ¼ 0.55F. Anti–PD-1 antibodysPD-L1L of pretreatment (baseline, ng/mL) PR SD PD Total<0.5 11 (33%) 8 (24%) 14 (43%) 33�0.5 1 (50%) 0 (0%) 1 (50%) 2
Zhou et al.
Cancer Immunol Res; 5(6) June 2017 Cancer Immunology Research486
on February 1, 2019. © 2017 American Association for Cancer Research. cancerimmunolres.aacrjournals.org Downloaded from
Published OnlineFirst May 18, 2017; DOI: 10.1158/2326-6066.CIR-16-0329
decreased at 8 months after therapy. Upon closer exploration ofthe levels of sPD-L1all/L after the initial analyses, the treatmentresulted in a 1.5-fold increase in the calculated shortest variant of
sPD-L1 (red line, Supplementary Fig. S12I). Despite limits ofsample availability, these data support our findings in the ipili-mumab–bevacizumab treated cohort.
P21A
B
P29 P30sPD-L1
Pretreatment levels of PD-L1all ≥ 1.4 ng/mL or/and pretreatment levels of PD-L1L ≥ 0.5 ng/mL
IFNa
TNFa
IFNg
sPD-L1 P5
Days
Long-term or delayed increase in PD-L1all or/and PD-L1L
Days Days
P12 P13
IFNa
TNFa
Months
Perc
enta
ge o
f tu
mor
bas
elin
e
Months Months
IFNg
sPD-L1L
sPD-L1all
sPD-L1L
sPD-L1allsPD-L1L
sPD-L1allsPD-L1L
sPD-L1all
sPD-L1L
sPD-L1all
sPD-L1L
sPD-L1all
ng/m
Lpg
/mL
pg/m
Lpg
/mL
ng/m
Lpg
/mL
pg/m
Lpg
/mL
Figure 4.
Kinetic changes of sPD-L1 and cytokines, andkinetic radiographic reduction in tumor size afteripilimumab plus bevacizumab treatment. A,Patients with pretreatment levels �1.4 ng/mLsPD-L1all and/or �0.5 ng/mL sPD-L1L. B, Patientswith�1.5-fold increases in sPD-L1all and/or sPD-L1L
after 5 months of treatment.
Soluble PD-L1 in Melanoma
www.aacrjournals.org Cancer Immunol Res; 5(6) June 2017 487
on February 1, 2019. © 2017 American Association for Cancer Research. cancerimmunolres.aacrjournals.org Downloaded from
Published OnlineFirst May 18, 2017; DOI: 10.1158/2326-6066.CIR-16-0329
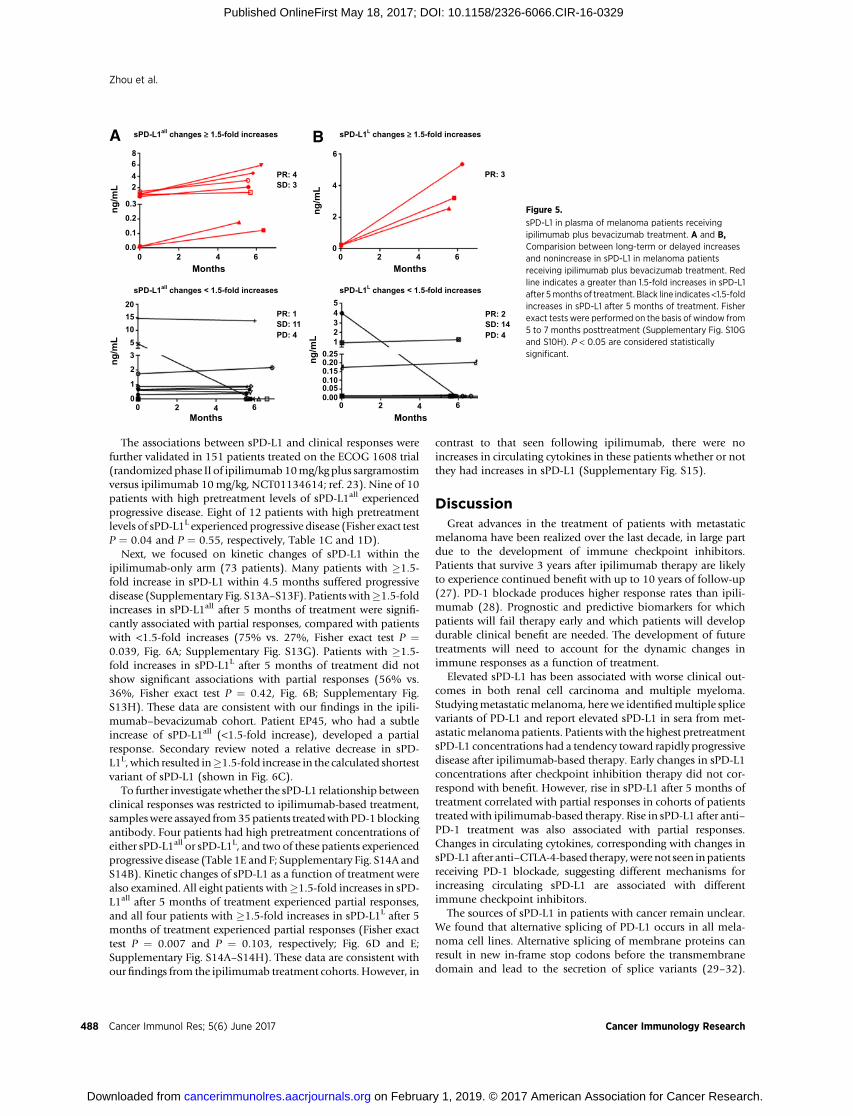
The associations between sPD-L1 and clinical responses werefurther validated in 151 patients treated on the ECOG 1608 trial(randomized phase II of ipilimumab10mg/kg plus sargramostimversus ipilimumab 10mg/kg, NCT01134614; ref. 23). Nine of 10patients with high pretreatment levels of sPD-L1all experiencedprogressive disease. Eight of 12 patients with high pretreatmentlevels of sPD-L1L experienced progressive disease (Fisher exact testP ¼ 0.04 and P ¼ 0.55, respectively, Table 1C and 1D).
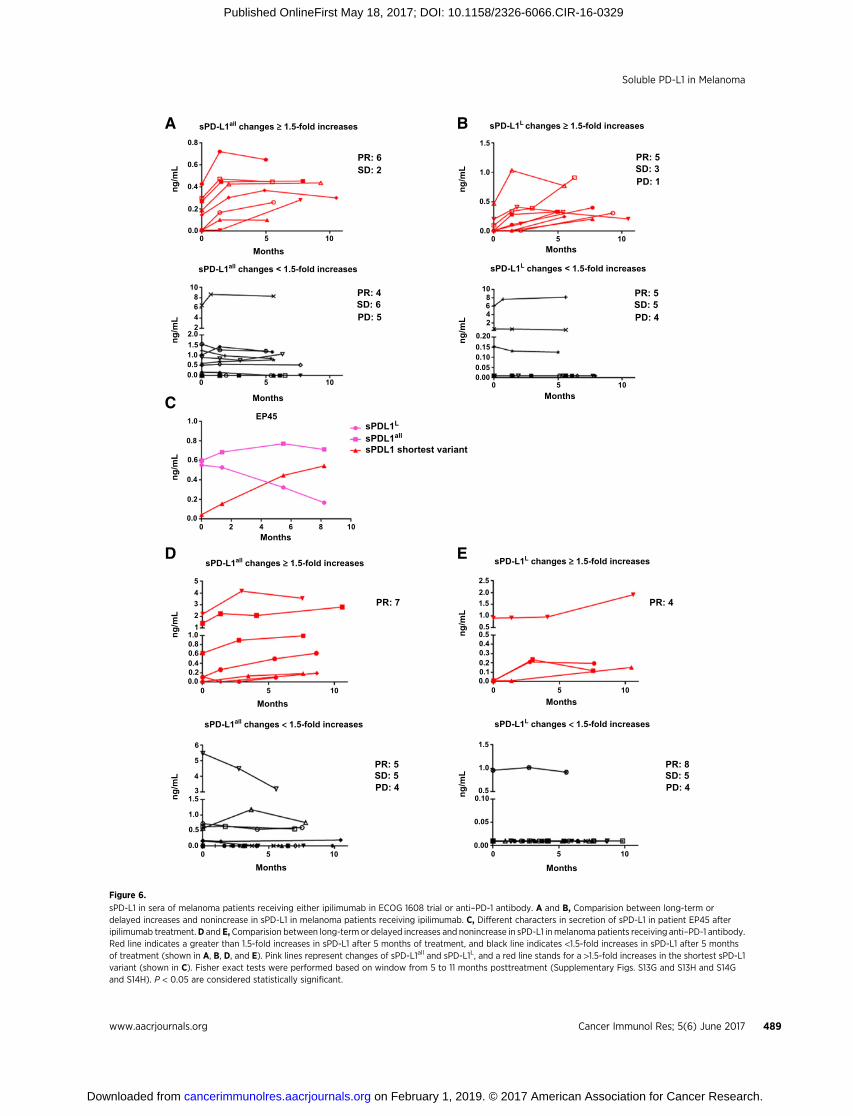
Next, we focused on kinetic changes of sPD-L1 within theipilimumab-only arm (73 patients). Many patients with �1.5-fold increase in sPD-L1 within 4.5 months suffered progressivedisease (Supplementary Fig. S13A–S13F). Patients with�1.5-foldincreases in sPD-L1all after 5 months of treatment were signifi-cantly associated with partial responses, compared with patientswith <1.5-fold increases (75% vs. 27%, Fisher exact test P ¼0.039, Fig. 6A; Supplementary Fig. S13G). Patients with �1.5-fold increases in sPD-L1L after 5 months of treatment did notshow significant associations with partial responses (56% vs.36%, Fisher exact test P ¼ 0.42, Fig. 6B; Supplementary Fig.S13H). These data are consistent with our findings in the ipili-mumab–bevacizumab cohort. Patient EP45, who had a subtleincrease of sPD-L1all (<1.5-fold increase), developed a partialresponse. Secondary review noted a relative decrease in sPD-L1L, which resulted in�1.5-fold increase in the calculated shortestvariant of sPD-L1 (shown in Fig. 6C).
To further investigate whether the sPD-L1 relationship betweenclinical responses was restricted to ipilimumab-based treatment,sampleswere assayed from35patients treatedwithPD-1blockingantibody. Four patients had high pretreatment concentrations ofeither sPD-L1all or sPD-L1L, and two of these patients experiencedprogressive disease (Table 1E and F; Supplementary Fig. S14A andS14B). Kinetic changes of sPD-L1 as a function of treatment werealso examined. All eight patients with�1.5-fold increases in sPD-L1all after 5 months of treatment experienced partial responses,and all four patients with �1.5-fold increases in sPD-L1L after 5months of treatment experienced partial responses (Fisher exacttest P ¼ 0.007 and P ¼ 0.103, respectively; Fig. 6D and E;Supplementary Fig. S14A–S14H). These data are consistent withour findings from the ipilimumab treatment cohorts. However, in
contrast to that seen following ipilimumab, there were noincreases in circulating cytokines in these patients whether or notthey had increases in sPD-L1 (Supplementary Fig. S15).
DiscussionGreat advances in the treatment of patients with metastatic
melanoma have been realized over the last decade, in large partdue to the development of immune checkpoint inhibitors.Patients that survive 3 years after ipilimumab therapy are likelyto experience continued benefit with up to 10 years of follow-up(27). PD-1 blockade produces higher response rates than ipili-mumab (28). Prognostic and predictive biomarkers for whichpatients will fail therapy early and which patients will developdurable clinical benefit are needed. The development of futuretreatments will need to account for the dynamic changes inimmune responses as a function of treatment.
Elevated sPD-L1 has been associated with worse clinical out-comes in both renal cell carcinoma and multiple myeloma.Studyingmetastatic melanoma, here we identifiedmultiple splicevariants of PD-L1 and report elevated sPD-L1 in sera from met-astaticmelanoma patients. Patients with the highest pretreatmentsPD-L1 concentrations had a tendency toward rapidly progressivedisease after ipilimumab-based therapy. Early changes in sPD-L1concentrations after checkpoint inhibition therapy did not cor-respond with benefit. However, rise in sPD-L1 after 5 months oftreatment correlated with partial responses in cohorts of patientstreatedwith ipilimumab-based therapy. Rise in sPD-L1 after anti–PD-1 treatment was also associated with partial responses.Changes in circulating cytokines, corresponding with changes insPD-L1 after anti–CTLA-4-based therapy,were not seen inpatientsreceiving PD-1 blockade, suggesting different mechanisms forincreasing circulating sPD-L1 are associated with differentimmune checkpoint inhibitors.
The sources of sPD-L1 in patients with cancer remain unclear.We found that alternative splicing of PD-L1 occurs in all mela-noma cell lines. Alternative splicing of membrane proteins canresult in new in-frame stop codons before the transmembranedomain and lead to the secretion of splice variants (29–32).
8 6
4
2
00 2 4
Months
PR: 2
PR: 3
SD: 14PD: 4
PR: 1SD: 11
PR: 4SD: 3
PD: 4
sPD-L1L changes < 1.5-fold increasessPD-L1all changes < 1.5-fold increases
sPD-L1all changes ≥ 1.5-fold increasesA B sPD-L1L changes ≥ 1.5-fold increases
6
642
0.3
0.2
0.1
0.0
5201510
53
2
1
0
1
4
23
0.250.200.150.10
0.000 2 4
MonthsMonths60 2 4 6
0.05
0 2 4 6Months
ng/m
L
ng/m
Lng
/mL
ng/m
L
Figure 5.
sPD-L1 in plasma of melanoma patients receivingipilimumab plus bevacizumab treatment. A and B,Comparision between long-term or delayed increasesand nonincrease in sPD-L1 in melanoma patientsreceiving ipilimumab plus bevacizumab treatment. Redline indicates a greater than 1.5-fold increases in sPD-L1after 5months of treatment. Black line indicates<1.5-foldincreases in sPD-L1 after 5 months of treatment. Fisherexact tests were performed on the basis of window from5 to 7 months posttreatment (Supplementary Fig. S10Gand S10H). P < 0.05 are considered statisticallysignificant.
Zhou et al.
Cancer Immunol Res; 5(6) June 2017 Cancer Immunology Research488
on February 1, 2019. © 2017 American Association for Cancer Research. cancerimmunolres.aacrjournals.org Downloaded from
Published OnlineFirst May 18, 2017; DOI: 10.1158/2326-6066.CIR-16-0329
0.8
0.6
0.4
0.2
0.0
108642
2.01.51.00.50.0
1.0
0.8
0.6
0.4
0.2
0.0
54321
1.00.80.60.40.20.0
1.5
1.0
0.5
0.00 5 10
4
3
5
6
0 5 10
0 2 4 6Months
Months
Months
108
0 5
Months
EP45
10
5 100
Months Months
Months
ng/m
Lng
/mL
108642
0.200.150.100.050.00
0 5 10
00.0
0.5
1.0
1.5
5 10
ng/m
Lng
/mL
ng/m
Lng
/mL
2.52.01.51.00.50.50.40.30.20.10.0
0 5 10Months
00.00
0.05
0.100.5
1.0
1.5
5 10
Months
ng/m
Lng
/mL
ng/m
L
sPD-L1all changes < 1.5-fold increases sPD-L1L changes < 1.5-fold increases
sPD-L1all changes ≥ 1.5-fold increases sPD-L1L changes ≥ 1.5-fold increases
sPD-L1all changes < 1.5-fold increases sPD-L1L changes < 1.5-fold increases
sPD-L1all changes ≥ 1.5-fold increasesA B
C
D E
sPD-L1L changes ≥ 1.5-fold increases
sPDL1L
PR: 4
PR: 6SD: 2
SD: 6PD: 5
PR: 5SD: 3PD: 1
PR: 5SD: 5PD: 4
sPDL1all
sPDL1 shortest variant
PR: 7 PR: 4
PR: 5
PD: 4SD: 5
PR: 8
PD: 4SD: 5
Figure 6.
sPD-L1 in sera of melanoma patients receiving either ipilimumab in ECOG 1608 trial or anti–PD-1 antibody. A and B, Comparision between long-term ordelayed increases and nonincrease in sPD-L1 in melanoma patients receiving ipilimumab. C, Different characters in secretion of sPD-L1 in patient EP45 afteripilimumab treatment.D and E, Comparision between long-term or delayed increases and nonincrease in sPD-L1 inmelanoma patients receiving anti–PD-1 antibody.Red line indicates a greater than 1.5-fold increases in sPD-L1 after 5 months of treatment, and black line indicates <1.5-fold increases in sPD-L1 after 5 monthsof treatment (shown in A, B, D, and E). Pink lines represent changes of sPD-L1all and sPD-L1L, and a red line stands for a >1.5-fold increases in the shortest sPD-L1variant (shown in C). Fisher exact tests were performed based on window from 5 to 11 months posttreatment (Supplementary Figs. S13G and S13H and S14Gand S14H). P < 0.05 are considered statistically significant.
Soluble PD-L1 in Melanoma
www.aacrjournals.org Cancer Immunol Res; 5(6) June 2017 489
on February 1, 2019. © 2017 American Association for Cancer Research. cancerimmunolres.aacrjournals.org Downloaded from
Published OnlineFirst May 18, 2017; DOI: 10.1158/2326-6066.CIR-16-0329
Indeed, three splice variants lack the transmembrane domain andresult in the secretion of sPD-L1. In one variant, loss of theintracellular domain due to splicing also led to secretion, suggest-ing that the intracellular domain may stabilizePD-L1 on the cellsurface.
Aberrant alternative splicing activities occur in a variety ofcancers, and these events affect the expression of transcriptionfactors, cell signaling factors, and membrane proteins (29).Functional changes of these spliced proteins are involved in thedevelopment, proliferation, and metastasis of cancers (29, 33,34). We show here that such splicing activities for PD-L1 affectmetastatic melanoma. High pretreatment concentrations ofsPD-L1 that were associated with worse outcomes to checkpointblockade may reflect the extent of increased splicing activities inmelanoma cells as well as tumor burden. This idea is supportedby the increased splice variants of sPD-L1 observed in BRAFinhibitor resistant melanoma cell lines. Selective pressures fromBRAF inhibitors are also associated with induced splicing var-iants of BRAF V600E (26).
The balance between a protumor inflammation and antitumorimmune response is complex. Inflammation is a hallmark ofcancer (35) and can cause tumor progression (36, 37). Cytokinesalso canproduce an antitumor immune response and are essentialfor antitumor immune effector function (36, 38). As part of theregulatory homeostatic response, cytokines such as IFNg andTNFa induce expression of PD-L1 in a variety of cancer cells(39–42). CD8þ T cells at tumor sites correlate with PD-L1 expres-sion and clinical responses (43, 44). Our data demonstrated thatcytokines, such as IFNa, IFNg , and TNFa, increase splicing activ-ities of PD-L1 leading to secretion of sPD-L1 directly by tumorcells. PD-L1 cell surface expression was parallel to sPD-L1 secre-tion in response to cytokines in melanoma cancer cells, andpatientswithmoderate pretreatment levels of sPD-L1 experiencedfavorable clinical outcomes. In addition, most patients withfavorable clinical responses showed detectable levels of cytokinesin their pretreatment sera.Moderate pretreatment levels of sPD-L1may indicate existing antitumor immune responses in somepatients. Pretreatment sPD-L1 concentrations may be related topreexisting protumor inflammatory responses.
Circulating sPD-L1 in the sera of patients may have multiplesources produced by distinct mechanisms. These include intrinsicsplicing activities in tumor cells, protumor inflammatoryresponses, and antitumor immune responses. Patients with highpretreatment sPD-L1 had poor outcomes, perhaps due to largetumorburden, increased aberrant splicing activities in tumor cells,or an exhausted antitumor immune response, which may bedifficult to overcomewith single checkpoint blockade. As a result,qualitative differences in pretreatment sPD-L1 concentrationscould represent either favorable or unfavorable factors for clinicaloutcomes depending on the source of sPD-L1. Favorable clinicaloutcomes with immune checkpoint blockade occurred predom-inately in patients with moderate to low pretreatment sPD-L1.Moderate sPD-L1 may reflect pre-existing antitumor immuneresponses. Although clinical responses in patients with moderatepretreatment sPD-L1 concentrations were most impressive in theipilimumab plus bevacizumab trial, this was not seen in theipilimumab arm of the ECOG 1608 trial. However, cross trialcomparisons in the cohorts may not be appropriate, given that itwould be comparing different combinations and different treat-ment doses in nonrandomized cohorts. Multiplex analysis ofpretreatment sPD-L1 and cytokine concentrations in patientsmay
help to distinguish PD-L1 splicing activities from tumor cellsversus inflammatory responses.
We show that circulating sPD-L1 levels frequently increase asthe result of treatment with checkpoint blockade. Patients withlong-term or delayed increase in sPD-L1 correspond with clini-cally beneficial outcomes. This scenario occurred in around 70%of total patients with partial responses. Furthermore, sPD-L1concentrations are associated with concentrations of circulatingcytokines after ipilimumab-based therapy. As secretion of sPD-L1can result from cytokine induction, cell stress, cell injury, and celldeath, increases in sPD-L1 by checkpoint blockademay indirectlyreflect antitumor immune responses. Long-term or delayedincreases in sPD-L1 following treatment suggest that the antitu-mor immune responses can overcome the negative barriers of PD-L1 and other potential immune suppressive factors in the tumormicroenvironment. Short-term increases in sPD-L1 from treat-mentwere associatedwith progressive disease and shorter survivalin subsets of patients. This suggests a challenge in the earlyevaluation of sPD-L1 rise and discerning whether rising sPD-L1is because of tumor progression or activated antitumor immuneresponses, and determining whether antitumor immuneresponses could overcome immune suppressive barriers in longterm. On the basis of our initial analyses of four cohorts ofpatients, the minimum time needed to distinguish whether anincrease in sPD-L1 increases the likelihood of clinical benefit isapproximately 5months. Further detailed collection of long-termsamples from both responding and nonresponding patients isneeded to investigate association of sPD-L1 changes and clinicaloutcomes. Preliminary studies on this were investigated (Supple-mentary Fig. S16 and S17). Increases in sPD-L1 concentrationoccurred with both CTLA-4 and PD-1 blockade, indicating thatsPD-L1 concentration may be an indicator of beneficial clinicaloutcomes. Patients receiving CTLA-4 blockade showed associa-tions between increases of sPD-L1 and cytokine production,whereas this association was not observed in patients receivingPD-1 blockade alone. This may be related to the mechanism ofaction for these drugs, with anti–CTLA-4 acting globally onimmune function and anti–PD-1 affecting primarily the tumormicroenvironment.
Although tumors that express PD-L1 may produce secretedsplice variants detectable in the circulation, the tumormay not bethe only source of sPD-L1. Our and others' (20) data (Supple-mentary Fig. S18) also indicated that sPD-L1 can be secreted fromhuman myeloid DC in the presence of cytokines and LPS duringDC maturation. sPD-L1 from myeloid DC in patients withouttreatment can't be ruled out. However, secretion of sPD-L1 resultsfrom cytokine presence, cell stress, cell injury and cell death, andlong-term or delayed increases in sPD-L1 were associated withfavorable clinical outcomes during treatment with checkpointinhibitors, and the peak posttreatment sPD-L1 correspondedwithclinical tumor regression. In contrast, human myeloid DCexpressed high levels of PD-L1 and suppressed T-cell activation,and T cells conditioned with PD-L1 blocked myeloid DC inhib-ited human ovarian carcinoma growth (45).We suggest that sPD-L1 mainly originated from the tumor in patients who had favor-able clinical responses after checkpoint blockade.
sPD-L1 secretion in melanoma is associated with three majorsplice variants that may be differentially secreted. In addition,secretion of sPD-L1 may more precisely reflect cytokine stimula-tions, because there are dissociations between constitutive expres-sion of membrane-bound PD-L1 and increases in sPD-L1. PD-L1
Zhou et al.
Cancer Immunol Res; 5(6) June 2017 Cancer Immunology Research490
on February 1, 2019. © 2017 American Association for Cancer Research. cancerimmunolres.aacrjournals.org Downloaded from
Published OnlineFirst May 18, 2017; DOI: 10.1158/2326-6066.CIR-16-0329
variants should be taken into consideration in assay developmentas there may be difference in biological significance across var-iants, although sPD-L1all is more significantly associated withclinical outcomes. We found no associations of sPD-L1 with age,gender,M-stage, and LDH in the current evaluated patient cohorts(Supplementary Table S2). These data suggest that high sPDL1andLDHconcentrationsmaybenot related in termsof prognosticor predictive values. It remains unclear whether sPD-L1 is aclinically significant systemic immunosuppressant.
Immune therapy is not as effective in patients with symptom-atic, rapidly progressive disease. Although the number of patientswith high sPD-L1 prior to anti–PD-1 therapy is small, we found itinteresting that some of these benefited from PD-1 blockade. Inpatients for whom we had plasma samples after 5 months ontherapy, we found that those who had 1.5-fold increases in sPD-L1all plasma concentrations were more likely to achieve partialresponses not only to ipilimumab or ipilimumab–bevacizumabtreatment, but also anti–PD-1 therapy. Prospective validation ofthe prognostic and kinetics of sPD-L1 alone or in the context of amultiple assay incorporating cytokines, such as IFNs and TNF,may help establish whether kinetic changes in sPD-L1 afterimmune checkpoint are effective in predicting not only RECISTcriteria responses, but also durable clinical benefit.
In summary, sPD-L1 exists as several variants that can originatefrom both tumor and immune cells. sPD-L1 may serve as ameaningful and practical dynamic biomarker for the predictionof durable efficacy to immunotherapy agents alone or in thecontext of additional factors. Soluble circulating factors offer apractical means for monitoring patient outcomes while improv-ing our mechanistic understanding.
Disclosure of Potential Conflicts of InterestJ. Zhou has ownership interest in a pending patent application for soluble
PD-L1 as a biomarker. X. Wu has ownership interest in compositions andmethods for identification, assessment, prevention, and treatment ofmelanomausing pd-l1 isoforms, per institution policy (patent application is pending).G. Dranoff is Global Head, Exploratory Immune-oncology at Novartis, reportsreceiving a commercial research grant from Novartis and Bristol-Myers Squibb,has ownership interest (including patents) in Novartis, and is a consultant/advisory board member for Novartis. G. Freeman has ownership interest(including patents) in Roche, Merck, Bristol-Myers Squibb, Novartis, EMDSerono, AstraZeneca, Boehringer Ingelheim, andRoche, is a consultant/advisoryboard member for Roche, Novartis, Eli Lilly, Bristol Myers Squibb, SeattleGenetics, Bethyl Laboratories, and Surface Oncology, and has an immediatefamily member with ownership interest in Roche and Novartis and who isa consultant/advisory board member of Surface Oncology and Novartis.F.S. Hodi reports receiving a commercial research grant from Bristol-Myers
Squibb to institution, has ownership interest (including patents) in royalty toinstitution per institutional policy on patent pending: MICA related disorders,institutional patent pending soluble PD-L1 as a biomarker for immune therapy;no financial interest to date, is a consultant/advisory board member for Merck,EMD Serono, Genentech, Novartis, and Amgen. No potential conflicts ofinterest were disclosed by the other authors.
DisclaimerThe content of this study is solely the responsibility of the authors and does
not necessarily represent the official views of the National Cancer Institute.
Authors' ContributionsConception and design: J. Zhou, G. Dranoff, F.S. HodiDevelopment of methodology: J. Zhou, X. Liao, M. Piesche, G.J. Freeman,F.S. HodiAcquisition of data (provided animals, acquired and managed patients,provided facilities, etc.): J. Zhou, X. Liao, J. Li, X. Wu, L.H. Butterfield,M.P. Manos, L.M. Eastman, F.S. HodiAnalysis and interpretation of data (e.g., statistical analysis, biostatistics,computational analysis): J. Zhou, K.M. Mahoney, A. Giobbie-Hurder, F. Zhao,S. Lee, S. Rodig, L.H. Butterfield, G.J. Freeman, F.S. HodiWriting, review, and/or revision of the manuscript: J. Zhou, K.M. Mahoney,A. Giobbie-Hurder, F. Zhao, X. Liao, J. Li, X. Wu, M. Piesche, G. Dranoff,G.J. Freeman, F.S. HodiAdministrative, technical, or material support (i.e., reporting or organizingdata, constructing databases): J. Zhou, M. Piesche, M.P. Manos, L.M. Eastman,F.S. HodiStudy supervision: J. Zhou, F.S. Hodi
Grant SupportA portion of this study was coordinated by the ECOG-ACRIN Cancer
Research Group (Robert L. Comis, MD and Mitchell D. Schnall, MD, PhD,group co-chairs) and supported in part by Public Health Service GrantsCA180794, CA180820, CA21115, CA66636, CA23318, CA180867, CA39229,CA180844, and P50CA101942 (G.J. Freeman) from the National CancerInstitute, NIH, and the Department of Health and Human Services. K.M.Mahoney was supported by Claudia Adams Barr Program in Innovative CancerResearch, the 2014 AACR Basic Cancer Research Fellowship, grant number14-40-01-MAHO, and the ASCO Young Investigator Award supported byKidney Cancer Association. F.S. Hodi was supported by NIH CA143832, theMelanoma Research Alliance, the Sharon Crowley Martin Memorial Fundfor Melanoma Research and the Malcolm and Emily MacNaught Fund forMelanoma Research at Dana-Farber Cancer Institute, Genentech/Roche, andBristol-Myers Squibb.
The costs of publication of this articlewere defrayed inpart by the payment ofpage charges. This article must therefore be hereby marked advertisement inaccordance with 18 U.S.C. Section 1734 solely to indicate this fact.
ReceivedNovember 16, 2016; revisedMarch 13, 2017; acceptedMay 2, 2017;published OnlineFirst May 18, 2017.
References1. Keir ME, Butte MJ, Freeman GJ, Sharpe AH. PD-1 and its ligands in
tolerance and immunity. Ann Rev Immunol 2008;26:677–704.2. Sharpe AH, Freeman GJ. The B7-CD28 superfamily. Nat Rev Immunol
2002;2:116–26.3. Thompson RH, Gillett MD, Cheville JC, Lohse CM, Dong H, Webster WS,
et al. Costimulatory B7-H1 in renal cell carcinoma patients: indicator oftumor aggressiveness and potential therapeutic target. Proc Natl Acad Sci US A 2004;101:17174–9.
4. Inman BA, Sebo TJ, Frigola X, Dong H, Bergstralh EJ, Frank I, et al. PD-L1(B7-H1) expression by urothelial carcinoma of the bladder and BCG-induced granulomata: associations with localized stage progression. Can-cer 2007;109:1499–505.
5. Hamanishi J, Mandai M, Iwasaki M, Okazaki T, Tanaka Y, Yamaguchi K,et al. Programmed cell death 1 ligand 1 and tumor-infiltrating CD8þ T
lymphocytes are prognostic factors of human ovarian cancer. Proc NatlAcad Sci U S A 2007;104:3360–65.
6. GhebehH, TulbahA,Mohammed S, ElkumN, Bin Amer SM, Al-Tweigeri T,et al. Expression of B7-H1 in breast cancer patients is strongly associatedwith high proliferative Ki-67-expressing tumor cells. Int J Cancer2007;121:751–8.
7. Gadiot J, Hooijkaas AI, Kaiser AD, van Tinteren H, van Boven H, Blank C.Overall survival and PD-L1 expression in metastasized malignant mela-noma. Cancer 2011;117:2192–201.
8. Hino R, Kabashima K, Kato Y, Yagi H, Nakamura M, Honjo T, et al. Tumorcell expression of programmed cell death-1 ligand 1 is a prognostic factorfor malignant melanoma. Cancer 2010;116:1757–66.
9. Chen BJ, Chapuy B, Ouyang J, Sun HH, Roemer MG, Xu ML, et al. PD-L1expression is characteristic of a subset of aggressive B-cell lymphomas
www.aacrjournals.org Cancer Immunol Res; 5(6) June 2017 491
Soluble PD-L1 in Melanoma
on February 1, 2019. © 2017 American Association for Cancer Research. cancerimmunolres.aacrjournals.org Downloaded from
Published OnlineFirst May 18, 2017; DOI: 10.1158/2326-6066.CIR-16-0329
and virus-associated malignancies. Clin Cancer Res 2013;19:3462–73.
10. Wong RM, Scotland RR, Lau RL, Wang C, Korman AJ, Kast WM, et al.Programmed death-1 blockade enhances expansion and functional capac-ity of human melanoma antigen-specific CTLs. Int Immunol 2007;19:1223–34.
11. Wang W, Lau R, Yu D, Zhu W, Korman A, Weber J. PD1 blockade reversesthe suppression of melanoma antigen-specific CTL by CD4þ CD25(Hi)regulatory T cells. Int Immunol 2009;21:1065–77.
12. Brahmer JR,DrakeCG,Wollner I, Powderly JD, Picus J, SharfmanWH, et al.Phase I study of single-agent anti-programmed death-1 (MDX-1106) inrefractory solid tumors: safety, clinical activity, pharmacodynamics, andimmunologic correlates. J Clin Oncol 2010;28:3167–75.
13. TopalianSL,Hodi FS, Brahmer JR,Gettinger SN, SmithDC,McDermottDF,et al. Safety, activity, and immune correlates of anti–PD-1 antibody incancer. N Engl J Med 2012;366:2443–54.
14. Ansell SM, Lesokhin AM, Borrello I, Halwani A, Scott EC, GutierrezM, et al.PD-1 blockade with nivolumab in relapsed or refractory Hodgkin's lym-phoma. N Engl J Med 2015;372:311–9.
15. Powles T, Eder JP, Fine GD, Braiteh FS, Loriot Y, Cruz C, et al. MPDL3280A(anti–PD-L1) treatment leads to clinical activity in metastatic bladdercancer. Nature 2014;515:558–62.
16. Herbst RS, Soria JC, Kowanetz M, Fine GD, Hamid O, Gordon MS, et al.Predictive correlates of response to the anti–PD-L1 antibody MPDL3280Ain cancer patients. Nature 2014;515:563–7.
17. Wang L, Wang H, Chen H, Wang WD, Chen XQ, Geng QR, et al. Serumlevels of soluble programmed death ligand 1 predict treatment responseand progression free survival in multiple myeloma. Oncotarget 2015;6:41228–36.
18. Frigola X, Inman BA, Lohse CM, Krco CJ, Cheville JC, Thompson RH, et al.Identification of a soluble form of B7-H1 that retains immunosuppressiveactivity and is associated with aggressive renal cell carcinoma. Clin CancerRes 2011;17:1915–23.
19. Rossille D,GressierM,DamotteD,Maucort-BoulchD, Pangault C, SemanaG, et al. High level of soluble programmed cell death ligand 1 in bloodimpacts overall survival in aggressive diffuse large B-Cell lymphoma:results from a French multicenter clinical trial. Leukemia 2014;28:2367–75.
20. Frigola X, Inman BA, Krco CJ, Liu X, Harrington SM, Bulur PA, et al. SolubleB7-H1: differences in production between dendritic cells and T cells.Immunol Lett 2012;142:78–82.
21. He XH, Xu LH, Liu Y. Identification of a novel splice variant of human PD-L1 mRNA encoding an isoform-lacking Igv-like domain. Acta pharmaco-logica Sinica 2005;26:462–8.
22. Hodi FS, Lawrence D, Lezcano C, Wu X, Zhou J, Sasada T, et al. Bevaci-zumab plus ipilimumab in patients with metastatic melanoma. CancerImmunol Res 2014;2:632–42.
23. Hodi FS, Lee S, McDermott DF, Rao UN, Butterfield LH, Tarhini AA, et al.Ipilimumab plus sargramostim vs ipilimumab alone for treatment ofmetastatic melanoma: a randomized clinical trial. JAMA 2014;312:1744–53.
24. Contal C, O'Quigley J. An application of changepointmethods in studyingthe effect of age on survival in breast cancer. Comput Stat Data Analys1999;30:253–70.
25. Schmollinger JC, Vonderheide RH, Hoar KM,Maecker B, Schultze JL, HodiFS, et al. Melanoma inhibitor of apoptosis protein (ML-IAP) is a target forimmune-mediated tumor destruction. Proc Natl Acad Sci U S A2003;100:3398–403.
26. Poulikakos PI, Persaud Y, JanakiramanM, Kong X, Ng C,Moriceau G, et al.RAF inhibitor resistance is mediated by dimerization of aberrantly splicedBRAF(V600E). Nature 2011;480:387–90.
27. Schadendorf D, Hodi FS, Robert C, Weber JS, Margolin K, Hamid O, et al.Pooled analysis of long-term survival data from phase II and phase iii trialsof ipilimumab in unresectable or metastatic melanoma. J Clin Oncol2015;33:1889–94.
28. Larkin J, Hodi FS, Wolchok JD. Combined nivolumab and ipilimumabormonotherapy inuntreatedmelanoma.NEngl JMed2015;373:1270–71.
29. Venables JP.Aberrant and alternative splicing in cancer. Cancer Res2004;64:7647–54.
30. TangW,GunnTM,McLaughlinDF, BarshGS, Schlossman SF,Duke-CohanJS. Secreted and membrane attractin result from alternative splicing of thehuman ATRN gene. Proc Natl Acad Sci U S A 2000;97:6025–30.
31. Gower HJ, Barton CH, Elsom VL, Thompson J, Moore SE, Dickson G, et al.Alternative splicing generates a secreted form of N-CAM in muscle andbrain. Cell 1988;55:955–64.
32. van der Voort R, Verweij V, deWitte TM, Lasonder E, Adema GJ, Dolstra H.An alternatively spliced CXCL16 isoform expressed by dendritic cells is asecreted chemoattractant for CXCR6þ cells. J Leukoc Biol 2010;87:1029–39.
33. Frasca F, Pandini G, Scalia P, Sciacca L,MineoR, Costantino A, et al. Insulinreceptor isoform A, a newly recognized, high-affinity insulin-like growthfactor II receptor in fetal and cancer cells. Mol Cell Biol 1999;19:3278–88.
34. Vella V, Pandini G, Sciacca L, Mineo R, Vigneri R, Pezzino V, et al. A novelautocrine loop involving IGF-II and the insulin receptor isoform-A stimu-lates growth of thyroid cancer. J Clin Endocrinol Metab 2002;87:245–54.
35. Hanahan D, Weinberg RA. Hallmarks of cancer: the next generation. Cell2011;144:646–74.
36. Dranoff G.Cytokines in cancer pathogenesis and cancer therapy. Nat RevCancer 2004;4:11–22.
37. Coussens LM,Werb Z. Inflammation and cancer. Nature 2002;420:860–67.38. Chada S, Ramesh R,Mhashilkar AM. Cytokine- and chemokine-based gene
therapy for cancer. Curr Opin Mol Thera 2003;5:463–74.39. Dong H, Strome SE, Salomao DR, Tamura H, Hirano F, Flies DB, et al.
Tumor-associated B7-H1 promotes T-cell apoptosis: a potential mecha-nism of immune evasion. Nat Med 2002;8:793–800.
40. Abiko K, Mandai M, Hamanishi J, Yoshioka Y, Matsumura N, Baba T, et al.PD-L1 on tumor cells is induced in ascites and promotes peritonealdissemination of ovarian cancer through CTL dysfunction. Clin CancerRes 2013;19:1363–74.
41. Lee SJ, Jang BC, Lee SW,Yang YI, Suh SI, Park YM, et al. Interferon regulatoryfactor-1 is prerequisite to the constitutive expression and IFN-gamma-induced upregulation of B7-H1 (CD274). FEBS Lett 2006;580:755–62.
42. Liu J,Hamrouni A,WolowiecD, Coiteux V, Kuliczkowski K,HetuinD, et al.Plasma cells from multiple myeloma patients express B7-H1 (PD-L1) andincrease expression after stimulation with IFN-{gamma} and TLR ligandsvia a MyD88-, TRAF6-, and MEK-dependent pathway. Blood 2007;110:296–304.
43. Spranger S, Spaapen RM, Zha Y, Williams J, Meng Y, Ha TT, et al. Up-regulation of PD-L1, IDO, and T(regs) in the melanoma tumor microen-vironment is driven by CD8(þ) T cells. Sci Translat Med 2013;5:200ra116.
44. Tumeh PC, Harview CL, Yearley JH, Shintaku IP, Taylor EJ, Robert L, et al.PD-1 blockade induces responses by inhibiting adaptive immune resis-tance. Nature 2014;515:568–71.
45. Curiel TJ, Wei S, DongH, Alvarez X, Cheng P, Mottram P, et al. Blockade ofB7-H1 improves myeloid dendritic cell-mediated antitumor immunity.Nat Med 2003;9:562–7.
Cancer Immunol Res; 5(6) June 2017 Cancer Immunology Research492
Zhou et al.
on February 1, 2019. © 2017 American Association for Cancer Research. cancerimmunolres.aacrjournals.org Downloaded from
Published OnlineFirst May 18, 2017; DOI: 10.1158/2326-6066.CIR-16-0329
2017;5:480-492. Published OnlineFirst May 18, 2017.Cancer Immunol Res Jun Zhou, Kathleen M. Mahoney, Anita Giobbie-Hurder, et al. Checkpoint BlockadeSoluble PD-L1 as a Biomarker in Malignant Melanoma Treated with
Updated version
10.1158/2326-6066.CIR-16-0329doi:
Access the most recent version of this article at:
Material
Supplementary
http://cancerimmunolres.aacrjournals.org/content/suppl/2017/05/18/2326-6066.CIR-16-0329.DC1
Access the most recent supplemental material at:
Cited articles
http://cancerimmunolres.aacrjournals.org/content/5/6/480.full#ref-list-1
This article cites 45 articles, 13 of which you can access for free at:
Citing articles
http://cancerimmunolres.aacrjournals.org/content/5/6/480.full#related-urls
This article has been cited by 8 HighWire-hosted articles. Access the articles at:
E-mail alerts related to this article or journal.Sign up to receive free email-alerts
Subscriptions
Reprints and
To order reprints of this article or to subscribe to the journal, contact the AACR Publications Department
Permissions
Rightslink site. Click on "Request Permissions" which will take you to the Copyright Clearance Center's (CCC)
.http://cancerimmunolres.aacrjournals.org/content/5/6/480To request permission to re-use all or part of this article, use this link
on February 1, 2019. © 2017 American Association for Cancer Research. cancerimmunolres.aacrjournals.org Downloaded from
Published OnlineFirst May 18, 2017; DOI: 10.1158/2326-6066.CIR-16-0329


![PD-L1 assessment in pediatric rhabdomyosarcoma: a pilot study · PD-L1 expression in tumor or inflammatory cells is a candidate biomarker [12]. However, the only limitation is that](https://img.pdfslide.net/doc/110x75/5f49f8ef7bf1f361ca036a6f/pd-l1-assessment-in-pediatric-rhabdomyosarcoma-a-pilot-study-pd-l1-expression-in.jpg)