Embed Size (px)
Citation preview

SOLUCIONES DE
AGILENT PARA
METABOLOMICA
Y
PROTEOMICA
Herramientas de software
Integradas
15 Febrero 2011Page 1
Jaume C. Morales
LC/MS Product Specialist
Agilent Technologies

PROGRAMA10.00 Introducción.
10.15 Mass Hunter and METLIN Database
Busqueda de compuestos e identificación en Base de Datos/Libreria
10.45 Mass Profiler Professional / Pathway Analysis
Análisis estadístico/diferencial, identificación y localización en vías metabólias
11.15 Descanso / Café
11.30 Agilent Spectrum Mill Proteomics Software
Procesado de datos y Busqueda en librerias de peptidos/proteínas
Cuantificación diferecial con SILAC/ITRAQ labelling
12.00 Peptide Optimizer & MH QQQ Acq
Proteómica cuantitativa por DMRM
12.30 MasHunter BioConfirm
Caracterización más exacta y rápida de peptidos y proteinas.
13.00 Sesión de preguntas y cierre

ASMS Metabolomics Bottleneck Summary
2009 ASMS Metabolomics Survey Results
http://metabolomics.us/2009/ASMSMetabolomicsWorkshop/SurveyResults/
81% de los encuestados
confirman que los retos
son software NO hardware
1. Compound Identification – 35%
2. Biological Significance – 27%
3. Data Processing – 14%
4. Statistical Analysis – 5%

MassHunter: el software de MS más popular• Control, proceso y optimización adquisición datos de LC/MS, GC/MS and ICP-MS
• Cuantitativo: High-Throughput Quant con LC/GC-Q, QQQ, TOF, Q-TOF + UV
• Cualitativo: ID desconocidos, impurezas, confirmación formula molecular, cribados masivos,….
Mass Profiler Professional (MPP)• Análisis diferencial con PCA y ANOVA para descubrimiento y validación de biomarcadores.
• Comparación y Clasificación de muestras
• Análisis de Rutas Metabólicas (“Pathway Analysis” opcional
• METLIN accurate mass MS/MS library (PCDL)
Bases de Datos y Bibliotecas de Espectros de Compuestos
• Cribados masivos e ID de compuestos: Forénsicos, Tóxicos y Pesticidas con Bases de Datos
personalizables de masa exacta (PCD) + RT (AMRT) y bibliotecas de espectros (PCDLs)
Farma Workflows para ADME, Bioanálisis & Confirmación Compuestos
• MetID: Identificación de metabolitos exógenos conocidos Y desconocidos.
• BioConfirm: Caracterización de proteínas intactas, anticuerpos y péptidos sintéticos.
• Analytical Studio Reviewer (ASR): navegador resultados de pureza y confirmación. .
Nuevo PearlHunter Proteomics Workflow
• Spectrum Mill: ID de proteínas mediante BD, cuantificación con o sin marcado (“label-free”)
• MPP: para descubrimiento y validación de biomarcadores.
MassHunter Workstation: “From Ions to Answers”

Overview of Agilent
Metabolomics Workflow
Page 5

Agilent Metabolomics WorkflowG
CM
SLC
MS
Separate &
Detect
GC/MSD
GC-QQQ
LC-TOF/QTOF
LC-QQQ
Feature
Finding
Quantitate
MassHunter QualAMDIS or Find by
chromatographic
deconvolution
MassHunter QualMFE,
Find by Formula,
Find by Ion
Alignment &
Statistics
Mass Profiler
Professional
(MPP)
Identify
ID Browser
Pathways
Pathway module
Cytoscape
Mass Profiler
(MP)
Recursive
2nd pass extraction
with Find-by-Ion

MassHunter Qual
Aumento de productividad.El interés del usuario está en obtener rápidamente
toda la información disponible sobre los
compuestos de una muestra
• Revolucionario procesado de datos:
“compound-centric “
• Extrae automáticamente toda la
información disponible del compuesto, no
sólo masas y picos cromatográficos.
• Encuentra con fiabilidad:– Todos los compuestos ionizados en sus muestras,
– Las diferencias entre muestras o grupos de muestras.
• Fácilmente confirmar e identificar
desconocidos a través de:– Confirmar o Generar la fórmula molecular
– Búsqueda Bases de datos AMRT (m/z exacta+ Tiempo
retención
– Búsqueda en Bibliotecas de espectros de MS / MS.

MassHunter Qual

Mass Hunter QualBusqueda de compuestos e identificación
Permite ajustar el amplio elenco de
posibles tareas a las específicas
del usuario / instrumento
Plataforma cualitativa para
diferentes tipos de instrumentación
MS, MS/MS (UV y ADC)
CONFIGURABLE

Mass Hunter QualEntorno gráfico
Data
Navigator
Method
Explorer
Chromatogram
Results
Method
Editor Spectrum Results

Mass Hunter QualOrientado a compuestos
MS Targe MS/MS Auto MS/MS
LC MFE & FBFMFE, FBF & Find by
Target
MFE, FBF & Find By
Auto
GC Deconvolution Deconvolution Deconvolution
Diferentes algoritmos de búsqueda de compuestos según origen :

Mass Hunter QualFind Compounds by Chromatogram Deconvolution (GC/MS)
Algoritmo diseñado para datos adquiridos en un GC/MS tanto para MS como MSMS.
Similar a AMDIS, con discriminación de ruido, eliminación de artefactos y métricas de
picos.
Ejecuta secuencialmente :
1. Análisi del ruido
2. Percepción de compuestos.
3. Deconvolución espectral agrupando juntos aquellos iones con idéntico perfil de
pico.
Después de encontrar los compuestos, éstos pueden
identificarse a través de algoritmos de MH en librerias
espectrales (MH, NIST, Wiley, Fiehn….) y/o exportarlos a otros
programas (MPP, NIST, mzData, Xml…)

Mass Hunter QualFind Compounds by Target MS/MS (LC/MS)
Algoritmo diseñado para uso con datos LC-MS/MS adquiridos especificando un ion
precursor a un tiempo determinado, en un QTOF.

Mass Hunter QualFind Compounds by Target MS/MS (LC/MS)
Busca todos los espectros MS/MS para un único precursor m/z.
Identifica:
•El ion m/z precursor del que se ha hecho MS/MS,
•Los m/z de fragmentos del precursor, o las diferencias neutras respecto a éste
para espectros de pérdida o ganancia neutra.
Generando :
•Un cromatograma MSMS TIC de los fragmentos del precursor
•UN espectro MS/MS promedio
Los espectros MS/MS pueden buscarse en una Librería de Espectros
Los datos generados por Target MS/MS suelen tener un objetivo de
cuantificación (MH Quant) o bien Post-Identificación

Mass Hunter QualFind Compounds by Auto MS/MS (LC/MS)
Algoritmo diseñado para uso con datos LC-MS/MS provinientes de una adquisición de
datos “Data Dependant” en un QTOF.
MS
MSMS

Mass Hunter QualFind Compounds by Auto MS/MS (LC/MS)
Este modo de adquisición trabaja en base a los espectros de MS. El “Motor de
decisión” examina los espectros MS y en base a unos criterios, establecidos por el
usuario , selecciona candidatos a los que aplicar MSMS.
Identifica :
•La m/z del ion precursor para hacer MSMS.
•Los m/z de fragmentos del precursor, o las diferencias neutras respecto a éste
para espectros de pérdida o ganancia neutra.
Genera :
•un cromatograma MS y un espectro MS,
•un cromatograma MS/MS y un espectro MS/MS
Los datos adquiridos en Auto MSMS,por su alto contenido en
información suelen ser objeto de busqueda en librerias.

Mass Hunter QualFind Compounds by Formula (LC/MS)
Espectro real
Espectro Limpio

Mass Hunter QualFind Compounds by Formula (LC/MS)
Algoritmo diseñado para uso con datos LC-MS proveniences de una adquisición datos
“Full Scan” MS en un TOF ó QTOF.
Mass Hunter QualFind Compounds by Formula (LC/MS)
Este modo de adquisición trabaja en base a las Fórmulas elementales proporcionadas
por el usuario.
Se suministra el total de compuestos de los que se quiere confirmar su presencia.
MH extrae los EIC sumando todas las especies iónicas que pueden pertenecer a cada
compuesto (C12, C13, C14, Aductos e isótopos, multicargas, dimeros, etc….).
Esos EIC son integrados, extrayendo luego los espectros MS de sus picos y
confrontando los m/z y distribución isotópica medidos con los teóricos de la Fórmula
suministrada.
Algoritmo de ALTA sensibilidad, utilizado para screening o
confirmación de falsos negativos.

Mass Hunter QualFind Compounds by MFE (LC/MS)
Avanzado Algoritmo de Deconvolución. Búsqueda de compuestos desconocidos.
ESENCIAL en Metabolómica Masa exacta de ”todos” los Compuestos Ionizados.
Forma parte del soft. de TOF y Q-TOF

Mass Hunter QualFind Compounds by MFE (LC/MS)
MFE, antes que nada, elimina el background persistente a lo largo del tiempo.

Mass Hunter QualFind Compounds by MFE (LC/MS)
Luego, espectro X espectro busca relaciones entre formas iónicas gracias a la
masa exacta y confirma distribucón isotópica.
C12(M+H)+
C13(M+H)+
C14(M+H)+
C14(M+Na)+
C13(M+Na)+
C12(M+Na)+
Cl37(M+Na)+
Cl35(M+Na)+

Mass Hunter QualFind Compounds by MFE (LC/MS)
A continuación confirma la presencia del compuesto por su perfil cromatográfico

Mass Hunter QualFind Compounds by MFE (LC/MS)
Generando al final un listado de posibles compuestos “Features” listos para identifcar
o en bases de datos (METLIN, PCDB, CSV,…) o por generación de Fórmula (MFG), o bein
exportar a tratamiento estadístico (MPP)
15 Febrero 2011
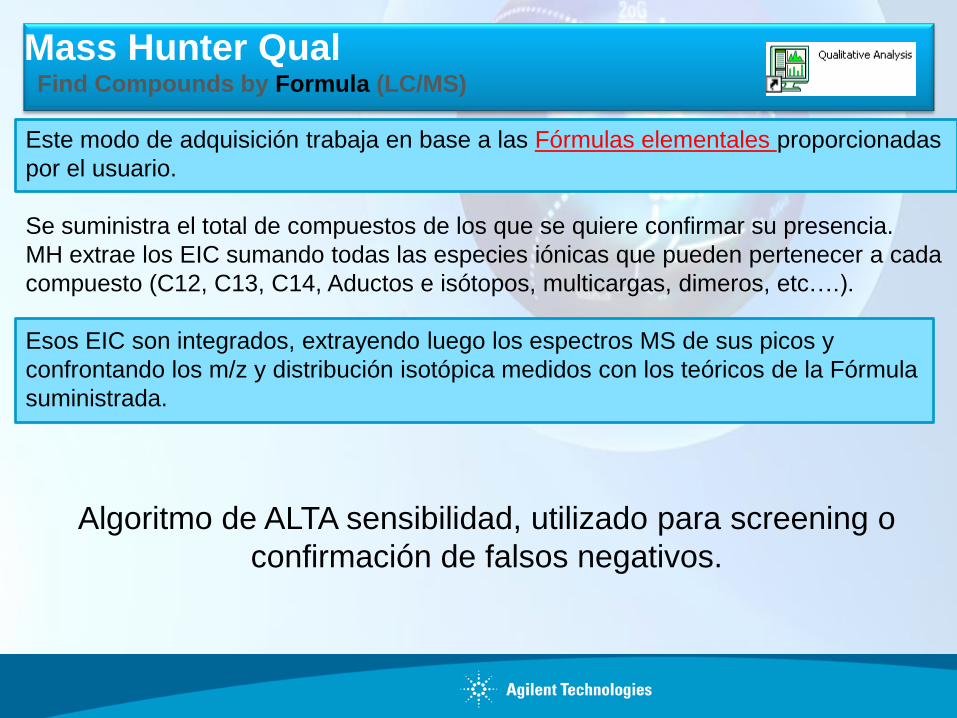
MFE seguido de MFG – Excelente combinación para la identificación de un
desconocido.
Average error:
Standard deviation:
0.47 ppm
0.37 ppm
Mass Hunter QualIdentificación por MFG (LC/MS)

15 Febrero 2011
Monoisotopic mass
(varies in ppm)
Isotope spacing
(varies in ppm)
Isotope distribution
(varies in %)
Scoring based onMass Match +
Abund. Match +
Spacing
Match =
Overall Score
Sin el uso de la información isotópica, la identificación hubiera sido incorrecta!
Mass Hunter QualIdentificación por MFG (LC/MS)

METLIN Database
Aumento de productividad.
METLIN DataBase es la versión EDITABLE y
mejorada de Agilent de la biblioteca pública
Metlin.
Rápida Identificación de metabolitos así como
incorporación de nuevos, “personalizando” la
base de datos
Analisis de Metabolitos usando METLIN con
Tiempo de retención, Exactitud de masa y
Distribución Isotópica
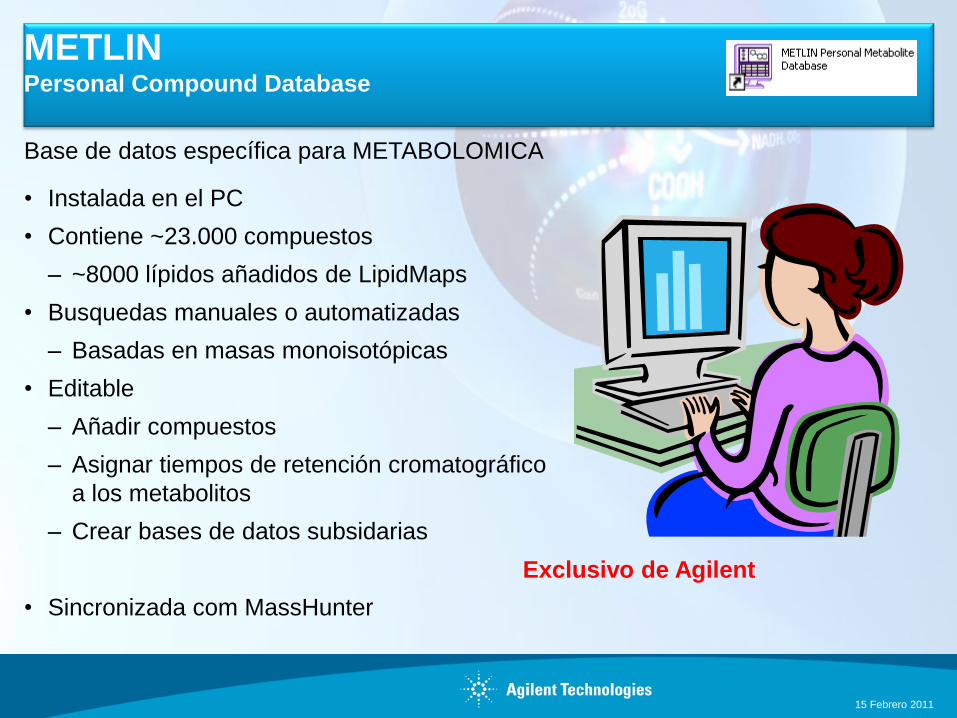
METLINPersonal Compound Database
Base de datos específica para METABOLOMICA
• Instalada en el PC
• Contiene ~23.000 compuestos
– ~8000 lípidos añadidos de LipidMaps
• Busquedas manuales o automatizadas
– Basadas en masas monoisotópicas
• Editable
– Añadir compuestos
– Asignar tiempos de retención cromatográfico
a los metabolitos
– Crear bases de datos subsidarias
• Sincronizada com MassHunter
Exclusivo de Agilent
15 Febrero 2011

15 Febrero 2011
Mayor especificidad en la identificación
•Búsqueda de la masa exacta mono-isotópica
•Requiere tiempo de retención
•Cálculo de la fórmula empírica usando la distribución isotópica
•Generación de la fórmula empírica paradatos no identificados
•Adición del compuestos no identificados paraseguimiento futuro.
- tiempo de retención y fórmula propuesta
Molecular Formula and METLIN Personal Metabolite Database Matching Applied to the Identification of Compounds Generated by LC/TOF-MS, T. Sana et al, Journal of BiomolecularTechniques 1 9:258–266 2008
METLINPersonal Compound Database AMRT

AMRT Database Generation For METLIN PCDL
• Over 700 Standards for most common metabolite classes analyzed
•Simple linear gradient: 2% methanol to 98% methanol in 13 minutes, 6 minute hold at 98% methanol; Flow rate 0.6 mL/min
•Compatible with ESI/APCI and positive/negative ionization modes
•EIC of each standard is evaluated: Retention Time and Accurate Mass are added to the METLIN Personal Metabolite Database
20
40
60
80
100
Me
tha
nol %
2.1 x 30 mm, 3.5 µm SB-C8 Guard
2.1 x 50 mm, 1.8 µm SB-aq C18
METLINPersonal Compound Database AMRT
15 Febrero 2011

Librería de metabolitos específica para
LC-MS/MS Q-TOF • Librería y base de datos de masa exacta
LC-MS/MS
– Comparte contenido con la base de datos
METLIN AMRT
• Incluye espectros MS/MS con ESI en modo
positivo y negativo
• Los espectros MS/MS se generan partiendo
del ion monoisotópico
• Se recogen espectros a tres energías de
colisión distintas : 10, 20 and 40
• Espectros MS/MS de standards procesados
– Fragmentos corregidos en masa y
filtrados de ruido antes de ser añadidos.
• Identificación por doble busqueda en un
sentido y reverso
• Resultado de la identificación cuantificado
mediante un “Match Quality”
15 Febrero 2011
10, 20, 40 eV
La librería está siendo
desarrollada en colaboración
con Gary Siuzdak Exclusivo de Agilent
METLINAMRT & Spectra Library

Urine Analysis: Compound
Identification Using Accurate Mass
Retention Time (AMRT)
A m/z 206.08270 hay 6 distintos picos
cromatográficos
• METLIN utilizando un margen de error
de (+/- 5 ppm) proporciona 5
posibilidades
• Una mayor precisión o la distribución
isotópica no ayudaría pues las formulas
empíricas son idénticas C11H11NO3.
• La búsqueda en METLIN usando la
masa exacta Y el tiempo de retención
proporcionan una sóida posibilidad :
5-Methoxyindoleacetate5-Methoxyindoleacetate
EIC of 206.0827
15 Febrero 2011
METLINAMRT & Spectra Library

Compound Identification In Urine:
Targeted MS/MS Fragment m/z
192.0655
5-Hydroxyindoleacetic acid
Reverse match score:
@ 10 eV = 99.4
@ 20 eV = 97.5
@ 40 eV = 91.1
METLINAMRT & Spectra Library
15 Febrero 2011

Agilent Metabolomics WorkflowG
CM
SLC
MS
Separate &
Detect
GC/MSD
GC-QQQ
LC-TOF/QTOF
LC-QQQ
Feature
Finding
Quantitate
MassHunter QualAMDIS or Find by
chromatographic
deconvolution
MassHunter QualMFE,
Find by Formula,
Find by Ion
Alignment &
Statistics
Mass Profiler
Professional
(MPP)
Identify
ID Browser
Pathways
Pathway module
Cytoscape
Mass Profiler
(MP)
Recursive
2nd pass extraction
with Find-by-Ion

Mass Profiler Professional
Differential Analysis Software Solution
for Mass Spectral Data
15 Febrero 2011

Analisis Multivariante Metabólico
Objetivo: Detectar diferencias observadas de
fenotipo a nivel químico
El análisis multivariante es una herramienta
adecuada para detectar esas diferencias y
puede “puntuar” la importancia del metabolito
para el fenotipo.
Pero no explica la biología subyacente
Phosphoguanidinoacetate
Mass Profiler Professional

A new Compound Exchange File (.cef) enables recursive feature extraction
• Allows recursive workflow to improve differential analysis statistics
• Allows annotation with compound IDs and MS/MS spectra
• Enables mapping to biological pathways
• More automation and convenience for differential analysis workflow
MFE
GC/MS
LC/MS
MassHunter
Qual.d
Mass Profiler
Professional
Pathway
AnalysisCASID
Raw feature lists.cef .cef
.cef
.cef
Combined binned List
.CEF.CEF.cefRefined
feature lists
1
2
3
MassHunter
ID Browser
.cefDifferential features
4
.cef 5Annotated
compounds
1
3 FBI
Mass Profiler ProfessionalMPP Workflow

Project – Espacio de trabajo, contenedor de Experiments
Experiment – Colección de muestras analizadas en un conjunto
Parameter – Variable en un experimento (p.e. Tiempo o Temp)
Condition – Una o más muestras que representan un estado biológico
común (p.e. Tiempo 14h)
Interpretation – Muestras agrupadas basadas en Conditions. (p.e.
Tiempo vs Temp)
Entity – Entidad molecular para la cual se conoce tiempo de retención,
masa y abundancia . Puede ser “Identificada” o “NO Identificada”.
Technology – Registro contenedor de la información de todas las
Entities e información biológica sobre ellas (annotation)
Mass Profiler ProfessionalMPP Terminology

15 Febrero 2011
Interpretation 1: Define samples by
parameter GrapeCondition1: Cabernet Sauvignon (samples 1-4)
Condition2: Merlot (samples 5-8)
Condition3: Pinot Noir (samples 9-12)
Interpretation 2: Define samples by
parameter CountryCondition1: USA (samples 1,2,5,6,9,10)
Condition2: France (samples 3,4,7,8,11,12)
Interpretation 3: Define samples by
parameter Grape and CountryCondition1: Cabernet Sauvignon-USA (samples 1,2)
Condition2: Cabernet Sauvignon-France (samples 3,4)
Condition3: Merlot-USA (samples 5,6)
Condition4: Merlot-France (samples 7,8)
Condition5: Pinot Noir-USA (samples 9,10)
Condition6: Pinot Noir-France (samples 11,12)
Mass Profiler ProfessionalMPP Terminology

15 Febrero 2011
Experiment
Navigator
Legend
Window
Project
Navigator
Workflow
Browser
Status bar
Tool & Menu
bar
Mass Profiler ProfessionalMPP Interface
Desktop area with
views

Agilent LC/MS
Agilent GC/MS
Agilent QQQ
Generic (cvs, tsv, xls)
mzXML from non-Agilent
Experiment Creation
Data Load Filtering Experiment createdBaseliningNormalizationMass vs RT plot
Mass Profiler ProfessionalMPP Workflow
Guided Workflow
Advanced Workflow
Nivel básico, inicial
Nivel avanzado, experto

Mass Profiler ProfessionalAlignment Summary – Experiment READY
15 Febrero 2011
Number of compounds found in
each sample is displayed.
A „flag‟ is automatically
assigned to each entity in each
sample:
Present – entity is detected and
abundance measured
Absent – entity is not found in
sample. Nominal abundance
value of 1.0 is given to these.
MassHunterQuant data – the
user can determine how flags
are assigned based on input
files (Present, Marginal, Absent)
Export for recursion possible
Total number of aligned
compounds found

Mass Profiler ProfessionalGuided Workflow Analysis – Step 1 : Summary Report
1. Summary Report
2. Experiment Grouping
3. Filter on Flags
4. Filter by Frequency
5. QC on Samples
6. Significance Analysis
7. Fold Change
8. ID Browser identification

Mass Profiler ProfessionalGuided Workflow Analysis – Step 2: Grouping

Filter on “Present” and “Marginal” (saturated entity)
- Can be used to filter out entities which are
rarely detected, therefore not very reliable
- Similar to filter by frequency
14502 entities retained out of 14502
Mass Profiler ProfessionalGuided Workflow Analysis – Step 3: Filter on Flags

1547 entities retained
out of 14502
Mass Profiler ProfessionalGuided Workflow Analysis – Step 4: Filter by Frequency

By default, each sample is plotted
according to its values for the first three
Principal Components
Principal Components are vectors that
capture the most variance in the data.
Assumption: samples within an
experimental condition should be more
similar to each other than to those from
different conditions.
Expect to see samples from the same
experimental condition to group closer to
each other than to samples of a different
condition
Mass Profiler ProfessionalGuided Workflow Analysis – Step 5: QC on Samples
PCA to verify quality of Samples and separation of groups

PCA Is a Variable Reduction Method
An eigenvalue-eigenvector decomposition is performed on the covariance matrix of the entity expression values around zero
The eigenvector corresponding to the largest eigenvalue is called the first principal component
Successive principal components are eigenvectors corresponding to each smaller eigenvalue
PC 2
PC 1
PCA to verify quality of Samples and separation of groups
Mass Profiler ProfessionalPCA is a variable reduction Method

Entity by Chance False Discovery Rate
Depending upon the
experimental grouping,
Mass Profiler
Professional performs
either T-test or Analysis of
Variance (ANOVA) based
on the samples.
Mass Profiler ProfessionalGuided Workflow Analysis – Step 6: Significance Analysis

2-way ANOVA 3-way ANOVA
T-test ANOVA
Statistical Tests
One-way Tests: Compare conditions defined by a single parameter (i.e
Grape)
Pinot NoirMerlot Merlot Pinot Noir Caber
Vintage
2004
2006X
Grape
Merlot
Pinot Noir
Country
USA
FranceX
N-way Tests: Compare conditions defined by 2 or more parameters
Grape
Merlot
Pinot Noir
Country
USA
FranceX
Mass Profiler ProfessionalGuided Workflow Analysis – Statistical Tests

Filter Sets Fold Change P> 2.0.. To more
Mass Profiler ProfessionalGuided Workflow Analysis – Step 7: Fold Change

Entities will be annotated upon return to MPP Program
Mass Profiler ProfessionalGuided Workflow Analysis – Step 8: ID Browser

Mass Profiler ProfessionalGuided Workflow Analysis – Step 8: ID Browser - Return

After Guided Wizard
1-Choose Interpretation
2-Choose Analysis
3-Choose Plot
Mass Profiler ProfessionalAfter Guided Worklfow

Listing EntitiesMass Profiler ProfessionalListing Entities

Exporting Entities as Inclusion List
Inclusion list for Target MS/MS on QTOF
Mass Profiler ProfessionalExporting Entities

Agilent LC/MS
Agilent GC/MS
Agilent QQQ
Generic (cvs, tsv, xls)
mzXML from non-Agilent
Experiment Creation
Data Load Filtering Experiment createdBaseliningNormalizationMass vs RT plot
Mass Profiler ProfessionalMPP Workflow
Guided Workflow
Advanced Workflow
Nivel básico, inicial
Nivel avanzado, experto

Advanced Analysis
• Use of Experiment Browser
•User defined Interpretations
•User defined Analysis
•Free use of Advanced
tools & Utilities
15 Febrero 2011
Experiment Browser is designed
following usual workflow
Mass Profiler ProfessionalMPP Advanced Workflow

Advanced Analysis
15 Febrero 2011
Mass Profiler ProfessionalExperiment Setup
Quick Start Guide / Experiment Grouping / Create Interpretation
Create conditions and
Populate values
Define Interpretations,
group samples

Quality
Control on
Entities
Quality
Control on
Samples
Mass Profiler ProfessionalQualty control
Goal: To remove poor quality or outlying samples before analysis
Assumption: Samples within the same experimental condition should be more similar in their global abundance profiles than samples from other experimental conditions
Goal: To remove entities which do not
have reproducible measurements
within a condition (%CV or SD) or
entities which are rarely detected –
therefore not very reliable

15 Febrero 2011
Advanced Analysis Workflow : Analysis
Tools for finding:
Which entities are differentially expressed?
What patterns of expression are there in the experiment?
Mass Profiler ProfessionalAnalysis

Parametric Test
Bell shaped distribution symmetrical about the
mean
MPP assume that you have sampled from populations where expression of Entity
X follows a normal distribution
Expression of Entity X
Fre
qu
en
cy
Mass Profiler ProfessionalAnalysis- Parametric Test
Parametric test Non- Parametric test
Does not assume normal distribution
Does not assume equal variances
Ranks the order of normalized data across
conditions for analyses
With small number of replicates, non-
parametric tests have less statistical power
than the corresponding parametric tests
P-value Calculation Methods
Asymptotic Method Permutation Method

5HT1c 0.002364
NFL 0.002649
NMDA2C 0.017181
aFGF 0.027544
GRa3 0.041179
actin 0.045342
nAChRd 0.046372
EGFR 0.0468
bFGF 0.087842
5HT2 0.106591
Brm 0.137903
SOD 0.147089
mGluR2 0.174708
IGF.I 0.223558
SC2 0.274809
trkC 0.288776
mGluR1 0.313801
SC6 0.343059
CNTFR 0.354717
pre-GAD67 0.366955
BDNF.rat 0.417615
GDNF 0.421125
IP3R2 0.421308
L1 0.443525
GAD67 0.462416
H2AZ 0.561907
IP3R1 0.573717
MK2 0.630177
CCO2 0.640797
mGluR3 0.654866
PDGFa 0.659352
IGF.II 0.683554
CNTF 0.690512
nAChRe 0.701041
IGFR2 0.728141
GAP43 0.732078
ODC 0.745628
SC1 0.74575
NT3 0.78811
PTN 0.795557
trk 0.82403
mGluR5 0.8305
cjun 0.839991
Ins2 0.841945
MAP2 0.851833
neno 0.879299
GRb1 0.888485
TCP 0.892361
GRb2 0.900601
S100beta 0.930265
Truly
differentially
expressed
Unchanged
between
populations
15 Febrero 2011
Mass Profiler ProfessionalP-value Cut-off
What type of error you are more comfortable with
Type I Error (false positive): Calling entities differentially
expressed when they really are not
Type II Error (false negative):
Not calling entities differentially expressed when they really are
Choice of cut-off trades off between type I and type II errors
p-value=0.05

Which MTC to Use?
> Family-wise Error Rate (FWER) - Very conservative and does not tolerate any false positives
> False Discovery Rate (FDR) - False positives a percentage of called entities
> None - False positives a percentage of entities being tested
More false
negatives
More false
positives
Bonferonni FWER
Bonferonni Holm FWER
Benjamini Hochberg FDR
No Correction
Mass Profiler ProfessionalMultiple Testing Correction
1 entity = 1 individual test
• 10000 entities = 10000 tests
• With p-value = 0.05 and analyzing 10000 entities: 500 entities (0.05 x 10000) likely to appear significant by chance
– Number of false positives increases proportionally to number of tests being performed
Performing multiple testing correction further decreases the number of false positives

Which MTC to Use?Mass Profiler ProfessionalPost Hoc Tests
Decreases rate of false positives, only available in MPP for one-way ANOVA tests
MPP test options:
Tukey‟s Honestly Significant Difference (HSD) testStudent-Newman-Keuls (SNK) test
Blue boxes contain
entities whose
expression differs
significantly between
the two conditions
Pink boxes contain
entities whose
expression does not
differ significantly
between the two
conditions

15 Febrero 2011
Clustering Background
Clustering is an unsupervised method for identifying patterns
within datasets.
Mass Profiler ProfessionalCLUSTERING
1) What do you want to cluster together?
2) What similarity metric to select?
3) What clustering algorithm will be applied?

15 Febrero 2011
Hierarchical Clustering
Overview:
• Hierarchical clustering algorithm can be used to group entities and conditions based on the similarity of their expression profiles
• Performing Hierarchical clustering on both entities and conditions result in a 2-dimensional dendrogram
• Most similar profiles are joined together into a group and groups are further joined in a tree structure until all data forms a single group
Mass Profiler ProfessionalHierarchical CLUSTERING

15 Febrero 2011
K-means Clustering
Overview:
• User chooses K, the
number of clusters to
partition selected entities
or conditions into
• Algorithm attempts to
minimize intra-cluster
variability and maximize
inter-cluster variability
Groups of Compounds that behave similarly
Mass Profiler ProfessionalK-means CLUSTERING

15 Febrero 2011
Mass Profiler ProfessionalPathway Analysis
Two types of pathway analysis in MPP:
1. Find Significant Pathways:
Is there a significant enrichment of my entities of
interest in a particular pathway?
2. Pathway Analysis:
How do my entities of interest interact in a biochemical network?
Pathway Anaylsis allows for Finding Biological Relevance of
differencial entities

15 Febrero 2011
Importing and Visualizing BioPAX Pathways
BioPAX (Biological Pathway Exchange) is a standard pathway data exchange format.
Pathways in the biopax format will have the extension .owl
MPP users can import pathway data standard pathway sites in BioPAX level 1 or 2
format
• www.pathguide.org is a useful website which list repositories of pathways
Databases for any organism of interest can be created using the Biopax files- Rice,
zebra fish, chimpanzee, dog
Mass Profiler ProfessionalPathway Analysis

15 Febrero 2011
Find Significant Pathways Tool
Is there a significant enrichment of my entities of interest in a particular pathway?
Analysis will be performed on every pathway that has been imported into MPP for the
matching organism and every pathway created in MPP
Mass Profiler ProfessionalPathway Analysis – Find Significant Pathway
15 Febrero 2011
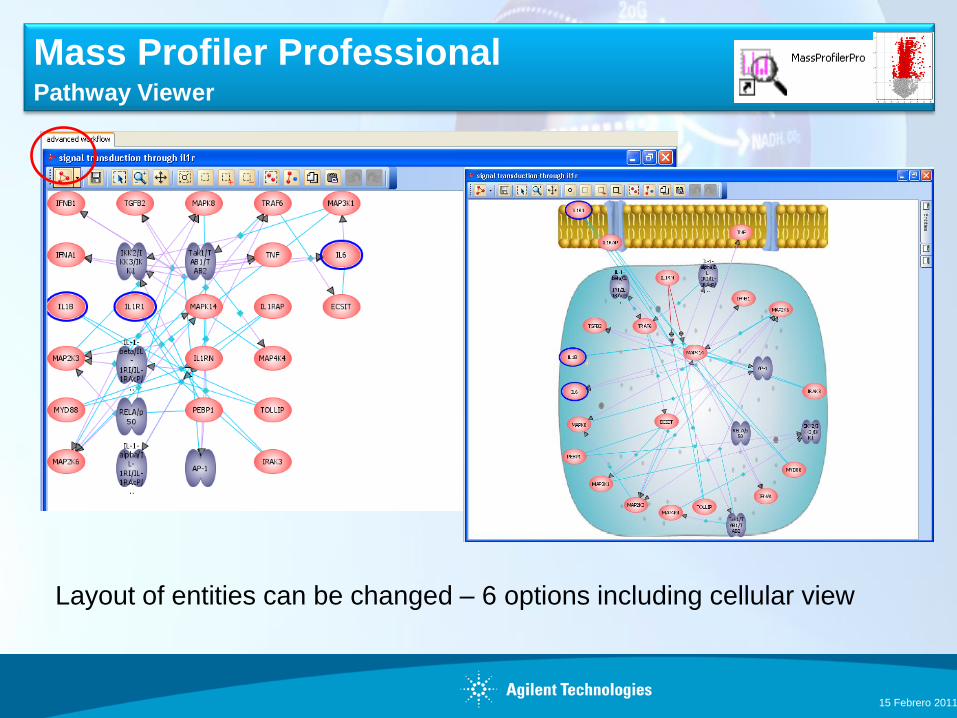
Pathway Viewer
Layout of entities can be changed – 6 options including cellular view
Mass Profiler ProfessionalPathway Viewer

0
500
1000
1500
2000
2500
L-ornithine
[IRBC_pH9] avg :Raw
[NRBC_pH9] avg :Raw
0
2000
4000
6000
8000
10000
12000
L-arginine
[IRBC_pH9] avg :Raw
[NRBC_pH9] avg :Raw
0
2
4
6
8
10
12
14
16
18
20
citrulline
[IRBC_pH9] avg :Raw
[NRBC_pH9] avg :Raw0
500
1000
1500
2000
2500
L-ornithine
[IRBC_pH9] avg :Raw
[NRBC_pH9] avg :Raw
L-Arg (Arginine)OrnithineCitrulline
Pathway analysis in MPP showing differential abundances for three compounds in the urea cycle
Infected
Blood cells
Non infected
Mass Profiler ProfessionalPathway Viewer
15 Febrero 2011
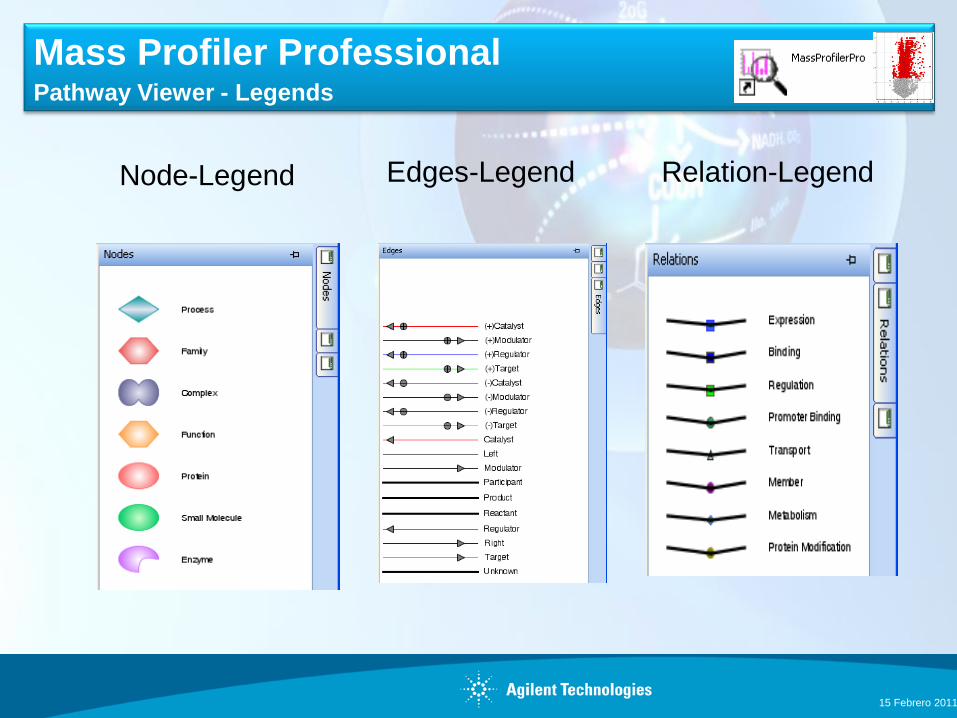
Node-Legend Edges-Legend Relation-Legend
Mass Profiler ProfessionalPathway Viewer - Legends

15 Febrero 2011
Pathway Analysis using Interaction Database
Pathway Analysis in MPP can be used to find relationships between entities of interest. These
may be direct interactions or other relationships such as common regulators or common targets.
Pathway Analysis utilizes preloaded interaction databases. The information is extracted from
literature using Natural Language Processing (NLP) algorithms to search PubMed abstracts.
These databases contain details of biological and chemical entities, relationships between
entities, and properties of these entities
These must be downloaded from the Agilent server and are currently available for the following
organisms:
• Human, Mouse, Rat, Arabidopsis, Drosophila, Yeast, E.coli, Rice, C.elegans, Plasmodium
falciparum, Mycobacterium tuberculosis, B. Subtilis, C.reinhardtii, Zea mays, N.crassa
The protein sections of these databases are organism specific. All other data is contained in the
generic section of the database.
Mass Profiler ProfessionalPathway Analysis – Using Interaction Data Base

15 Febrero 2011
Relation from NLP inference
UBE2L3 up-regulates the
expression of MT1G. VEGFA
modulates this up-regulation of
expression
UBE2L3 up-regulates the
expression of MT1G. VEGFA
modulates this up-regulation of
expression
Mass Profiler ProfessionalPathway Analysis – Using Interaction Data Base