Embed Size (px)
Citation preview
1
Leakage Detection in a Casing String
of a Brine Production Well by Means of
Simultaneous Fiber Optic DTS / DAS Measurements
Marinus den Hartogh Nouryon, Hengelo, The Netherlands
Stephan Grosswig, Thomas Pfeiffer
GESO, Jena, Germany
Michael Rembe
Rembe Consulting, Nordhausen, Germany
Markus PerkDEEP.KBB, Bad Zwischenahn, Germany
Lukas DomurathAP Sensing, Boeblingen, Germany
SMRI Fall 2019 Conference 23-24 September 2019
Berlin, Germany
Solution Mining Research Institute Fall 2019 Conference
SOLUTION MINING RESEARCH INSTITUTE www.solutionmining.org
105 Apple Valley Circle Clarks Summit, PA 18411, USA
Telephone: +1 570-585-8092
Technical Conference
Paper
2
Berlin, Germany, 23-24 September 2019
Leakage Detection in a Casing String of a Brine Production Well by Means of Simultaneous Fiber Optic DTS / DAS Measurements
Marinus den Hartogh*, Stephan Grosswig**, Thomas Pfeiffer**, Michael Rembe***, Markus Perk****, Lukas Domurath*****
* Nouryon B.V., Boortorenweg 27, 7554 RS Hengelo (Ov.), The Netherlands
** GESO Gesellschaft für Sensorik, geotechnischen Umweltschutz und mathematische Modellierung mbH & Co. Projekt KG, Loebstedter Strasse 50, 07749 Jena, Germany
*** Rembe Consulting - Partnerschaftsgesellschaft für Geologie, Geostroemungstechnik, Umweltplanung und numerische Simulation mbB, Alte Leipziger Strasse 50, 99734 Nordhausen, Germany
**** DEEP.KBB GmbH, Eyhauser Allee 2A, 26160 Bad Zwischenahn, Germany
***** AP Sensing GmbH, Herrenberger Strasse 130, 71034 Boeblingen, Germany
Abstract
As part of a well integrity assessment, distributed fiber optic temperature measurements (DTS) and distributed fiber optic acoustic measurements (DAS) were performed simultaneously to detect possible leakages, especially very small ones in the cemented 13 ⅜“ casing of a brine production well. For this purpose, the borehole was temporarily pressurized with nitrogen and then relieved again. By injecting nitrogen into the borehole, the nitrogen-brine level was positioned below the 13 ⅜“ casing shoe. As a result, nitrogen passed through a leakage path into the cementation and a nitrogen reservoir formed in the cementation over a period of approximately 16 hours. During the subsequent nitrogen relief, the rise of the nitrogen-brine-level was much faster than the emptying of the nitrogen reservoir formed in the cementation. As a result, in the nitrogen relief phase, the pressure of the nitrogen in the cementation was significantly higher than the sum of the hydrostatic brine pressure and the gas pressure of the remaining nitrogen blanket. Due to the resulting pressure gradient, nitrogen escaped into the rising brine from the cementation at the leakage in form of bubbles. This leakage of the nitrogen bubbles is associated with both the generation of noise and a temperature change which can be detected by applying DAS and DTS techniques. The use of a fiber optic sensor cable containing multiple fibers allows a simultaneous measurement of the temperature and noise depth distribution in the borehole. By coupling the two independent methods, the validity of the measurement results is significantly increased, e.g. non-leakage temperature anomalies can be excluded as the cause of a leakage. In order to understand the measurements and perform a comprehensible interpretation, an FEM-simulation model of a coupled solid and pressure acoustic measurement was set up to simulate the noise propagation in the borehole. The simulation result shows the fundamental pattern of sound propagation in the borehole in high similarity to the result of the distributed fiber optic acoustic measurement. Thus, the application of the FEM simulation model contributes to the interpretation of the measurement results and to the detection/verification of the leakage position. The method of simultaneously distributed fiber optic measurement of temperature and acoustics was used for the first time and proved successful in the investigation of the borehole integrity. A casing connector was identified as the cause of the leakage.
Key words: brine production, geophysics, instrumentation and monitoring, leak, monitoring,modeling, solution mining, well casing.
3
1. Introduction Salt caverns, either for gas, oil storage or brine production, have been utilized for several decades. Ensuring long term well integrity throughout the cavern lifecycle is a vital part of the cavern design and construction, and is of great interest to the operator and the public, as well as the environment. In the past, conscientious operators have already utilized measures to maintain the integrity and functionality of the caverns, especially to control the casing/production string integrity which can be diminished by corrosion, damage during well intervention, unfavorable operating conditions in terms of pressure and temperature, rock mass deformation and other factors. However, monitoring and maintenance measures regarding cavern integrity can definitely be improved upon. Large leakages in casings can nowadays be detected quite easily through ultrasonic imaging, tightness tests, camera runs, separate temperature and acoustic measurements, etc. But at the moment there is no practical technical method for in-situ detection of micro leakages in casings/strings. This paper presents a method of simultaneously measuring the temperature and acoustic noise distribution within the borehole by using a fiber optic sensor cable containing multiple fibers. By coupling the two independent methods, a higher resolution and efficiency can be achieved, thereby allowing direct detection of even the smallest leakages.
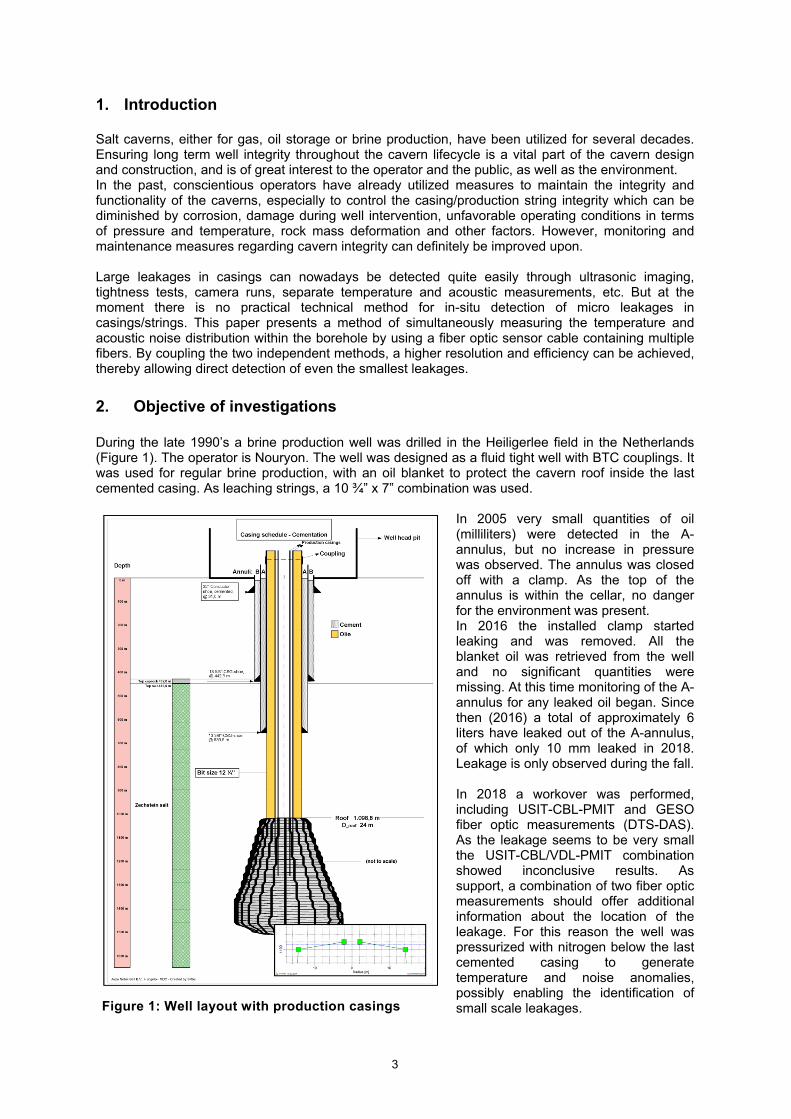
2. Objective of investigations During the late 1990’s a brine production well was drilled in the Heiligerlee field in the Netherlands (Figure 1). The operator is Nouryon. The well was designed as a fluid tight well with BTC couplings. It was used for regular brine production, with an oil blanket to protect the cavern roof inside the last cemented casing. As leaching strings, a 10 ¾” x 7” combination was used.
In 2005 very small quantities of oil (milliliters) were detected in the A-annulus, but no increase in pressure was observed. The annulus was closed off with a clamp. As the top of the annulus is within the cellar, no danger for the environment was present. In 2016 the installed clamp started leaking and was removed. All the blanket oil was retrieved from the well and no significant quantities were missing. At this time monitoring of the A-annulus for any leaked oil began. Since then (2016) a total of approximately 6 liters have leaked out of the A-annulus, of which only 10 mm leaked in 2018. Leakage is only observed during the fall. In 2018 a workover was performed, including USIT-CBL-PMIT and GESO fiber optic measurements (DTS-DAS). As the leakage seems to be very small the USIT-CBL/VDL-PMIT combination showed inconclusive results. As support, a combination of two fiber optic measurements should offer additional information about the location of the leakage. For this reason the well was pressurized with nitrogen below the last cemented casing to generate temperature and noise anomalies, possibly enabling the identification of small scale leakages.
Figure 1: Well layout with production casings
4
3. Measuring technology and measuring arrangement
3.1 Measurement methodology and sensor cable The so called distributed measurement methods using a fiber optic cable as the sensor offer a lot of great advantages compared to conventional measurements. Once implemented into the borehole measurements can be conducted repeatedly along the whole length of the fiber optic cable with a high spatial-, time-, and measuring value resolution. Thus, a temporal development of the measured value field can be obtained and dynamic processes in the borehole and in the immediate vicinity can be monitored. The measuring process itself has no influence on the measured field. The fiber optic system works without the use of electronic components along the cable. Therefore, it is immune to electromagnetic radiation and can be used even in hazardous areas. The distributed sensing methods are part of the intrinsic fiber optic sensor technology in which the optical fiber itself is the sensitive element. It serves not only the transmission of the optical signal but also, with intrinsic fiber optic sensors, the physical quantities like temperature, strain or noise affect the optical fibers whose optical material properties are changed in reversible form within the material specific limitations at the point of influence (s.a. Nishigaki et al. 1997). A very short pulse of laser light is coupled into the optical fiber which is the sensing element. Owing to changes in density and composition as well as molecular and bulk vibrations, a small part of light is backscattered as the pulse propagates through the fiber. The backscattered light is made up of different spectral components that contain information about temperature, strain and noise. As the velocity of light within the fiber is known, the location of the backscattering centers along the optical fiber can be calculated from the travel time of the backscattered light. This makes it possible to determine an integral average of the measured physical quantity of the section from which the backscattered light originates in a specific time frame. In this way, the distribution of the physical measured quantity over the entire length of the optical fiber is obtained by combining counting of the backscattered photons in the different spectral bands with the determination of the propagation time of the laser light in the optical fiber. In order to detect possible small leakages in the cemented 13 ⅜“ casing of a brine production well as part of the evaluation of well integrity, two independent fiber optic measuring methods were used simultaneously:
Distributed Fiber Optic Temperature Sensing (DTS) and
Distributed Fiber Optic Acoustic Sensing (DAS).
3.1.1 Distributed Fiber Optic Temperature Sensing Method
The method of distributed fiber optical temperature sensing utilizes the Raman effect in glass fibers. The Raman scattering is generated by the interaction of the irradiated laser light with temperature dependent transversal oscillations of the glass molecules. This is used to measure the temperature distribution along the optical fiber. The method and its performance are described in detail in various publications (Hurtig et al. 1994, Großwig et al. 1998, Großwig et al. 2001). A SILIXA ULTIMATM gauge was used for the measurements. The absolute accuracy of temperature measurements performed is 1.0 K, which means that linking the measured values to the absolute temperature (Kelvin) - scale may be subject to an error of a maximum of 1.0 K. This error causes a corresponding offset of all measured values. This offset is the same for all measurements. The reproducibility and the resolution of the performed temperature measurements are better than 0.1 K. The sample rate of the measurements is approx. 0.126 m.
3.1.2 Distributed Fiber Optic Acoustic Sensing Method
The distributed fiber optical acoustic sensing technology detects vibrations and measures the acoustic energy along the entire length of an optical fiber. The fiber functions as if there were thousands of microphones installed. Complex detection and classification algorithms are used to identify and locate noise sources. The used "2-P-Squared" technology enables the detection of acoustic signals over long distances. For this purpose, a laser unit sends coherent laser pulses along an optical fiber. Light is continuously scattered back to the optical receiver from natural imperfections within the glass fiber. The intensity of the backscattered light is measured by the optical receiver of the measuring gauge. The coherent nature of the backscattered light allows for the interferometric recombination of closely spaced sections of fiber.
5
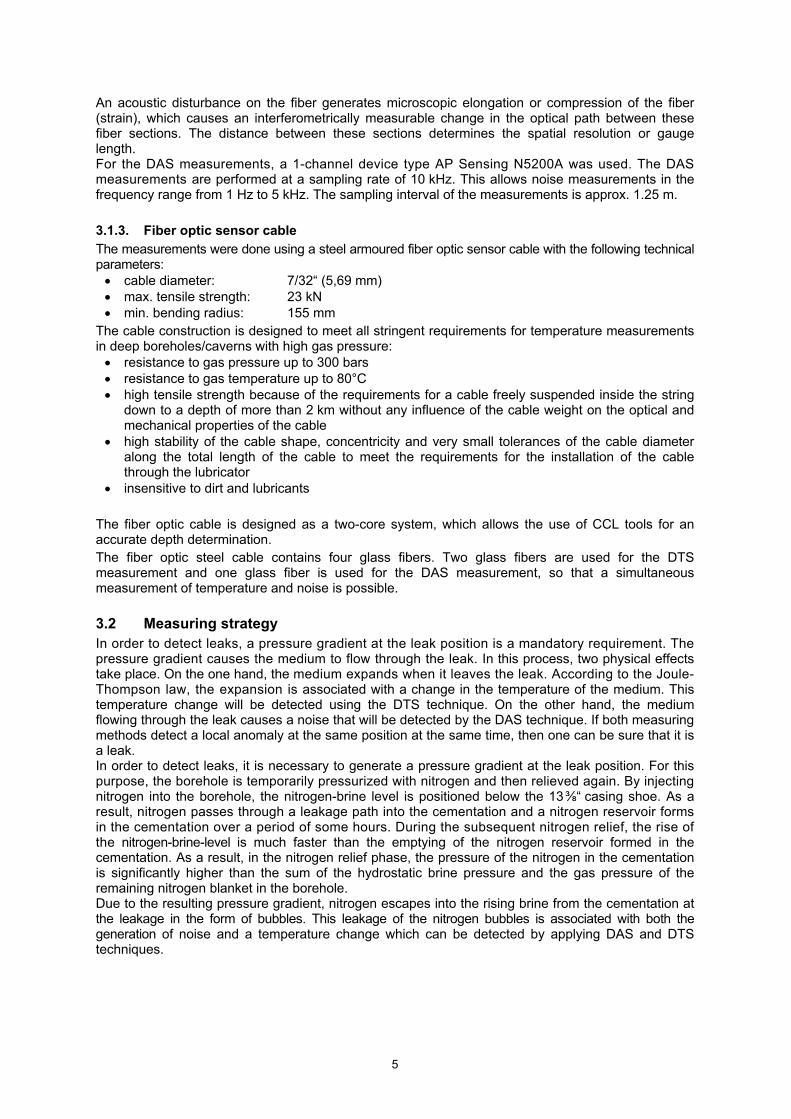
An acoustic disturbance on the fiber generates microscopic elongation or compression of the fiber (strain), which causes an interferometrically measurable change in the optical path between these fiber sections. The distance between these sections determines the spatial resolution or gauge length. For the DAS measurements, a 1-channel device type AP Sensing N5200A was used. The DAS measurements are performed at a sampling rate of 10 kHz. This allows noise measurements in the frequency range from 1 Hz to 5 kHz. The sampling interval of the measurements is approx. 1.25 m.
3.1.3. Fiber optic sensor cable
The measurements were done using a steel armoured fiber optic sensor cable with the following technical parameters: cable diameter: 7/32“ (5,69 mm) max. tensile strength: 23 kN min. bending radius: 155 mm
The cable construction is designed to meet all stringent requirements for temperature measurements in deep boreholes/caverns with high gas pressure: resistance to gas pressure up to 300 bars resistance to gas temperature up to 80°C high tensile strength because of the requirements for a cable freely suspended inside the string
down to a depth of more than 2 km without any influence of the cable weight on the optical and mechanical properties of the cable
high stability of the cable shape, concentricity and very small tolerances of the cable diameter along the total length of the cable to meet the requirements for the installation of the cable through the lubricator
insensitive to dirt and lubricants The fiber optic cable is designed as a two-core system, which allows the use of CCL tools for an accurate depth determination. The fiber optic steel cable contains four glass fibers. Two glass fibers are used for the DTS measurement and one glass fiber is used for the DAS measurement, so that a simultaneous measurement of temperature and noise is possible.
3.2 Measuring strategy In order to detect leaks, a pressure gradient at the leak position is a mandatory requirement. The pressure gradient causes the medium to flow through the leak. In this process, two physical effects take place. On the one hand, the medium expands when it leaves the leak. According to the Joule-Thompson law, the expansion is associated with a change in the temperature of the medium. This temperature change will be detected using the DTS technique. On the other hand, the medium flowing through the leak causes a noise that will be detected by the DAS technique. If both measuring methods detect a local anomaly at the same position at the same time, then one can be sure that it is a leak. In order to detect leaks, it is necessary to generate a pressure gradient at the leak position. For this purpose, the borehole is temporarily pressurized with nitrogen and then relieved again. By injecting nitrogen into the borehole, the nitrogen-brine level is positioned below the 13 ⅜“ casing shoe. As a result, nitrogen passes through a leakage path into the cementation and a nitrogen reservoir forms in the cementation over a period of some hours. During the subsequent nitrogen relief, the rise of the nitrogen-brine-level is much faster than the emptying of the nitrogen reservoir formed in the cementation. As a result, in the nitrogen relief phase, the pressure of the nitrogen in the cementation is significantly higher than the sum of the hydrostatic brine pressure and the gas pressure of the remaining nitrogen blanket in the borehole. Due to the resulting pressure gradient, nitrogen escapes into the rising brine from the cementation at the leakage in the form of bubbles. This leakage of the nitrogen bubbles is associated with both the generation of noise and a temperature change which can be detected by applying DAS and DTS techniques.
6
4. Measuring results Before bringing the fiber optic sensor cable installation into the borehole, the leaching strings had been completely removed. This allowed the fiber optic sensor cable to be installed directly into the cemented 13 ⅜“ casing string, which was completely filled with brine. The sensor cable was installed through a special wellhead with sensor cable sealing elements and a nitrogen pressurization device.
In the following, the results of the measurement of the temperature depth profiles and the noise floor distributions in the four different phases of the measurements are considered.
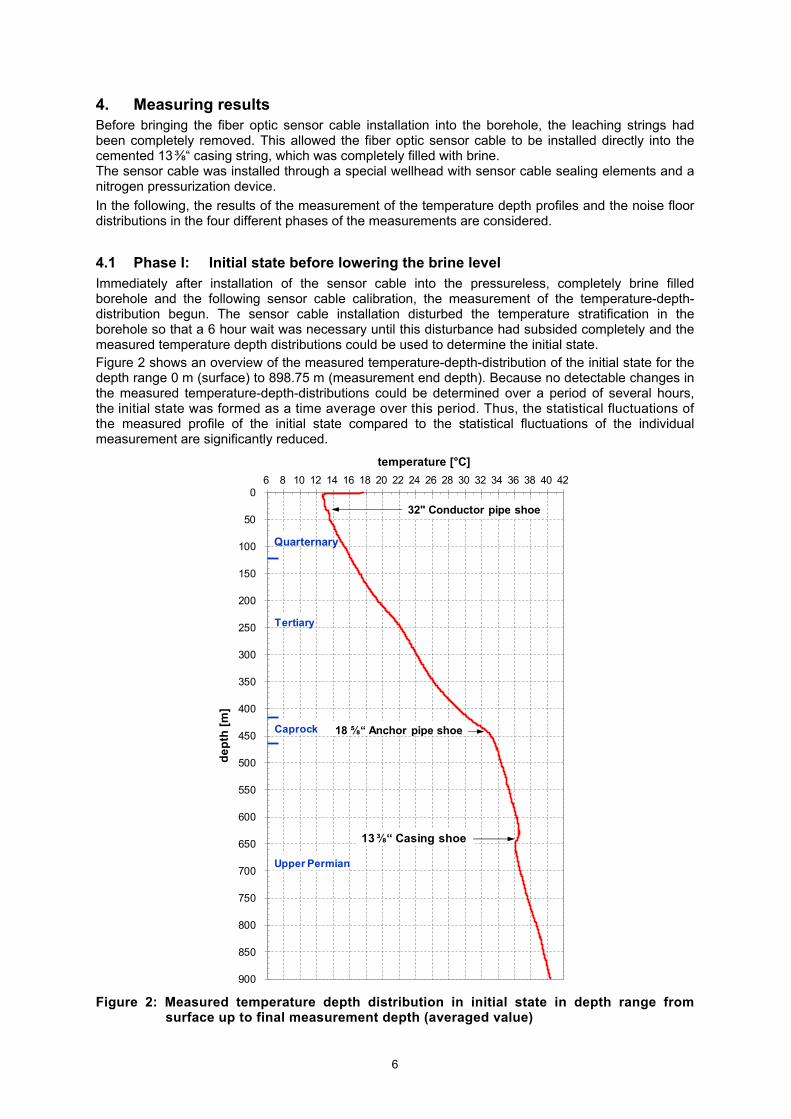
4.1 Phase I: Initial state before lowering the brine level Immediately after installation of the sensor cable into the pressureless, completely brine filled borehole and the following sensor cable calibration, the measurement of the temperature-depth-distribution begun. The sensor cable installation disturbed the temperature stratification in the borehole so that a 6 hour wait was necessary until this disturbance had subsided completely and the measured temperature depth distributions could be used to determine the initial state. Figure 2 shows an overview of the measured temperature-depth-distribution of the initial state for the depth range 0 m (surface) to 898.75 m (measurement end depth). Because no detectable changes in the measured temperature-depth-distributions could be determined over a period of several hours, the initial state was formed as a time average over this period. Thus, the statistical fluctuations of the measured profile of the initial state compared to the statistical fluctuations of the individual measurement are significantly reduced.
Figure 2: Measured temperature depth distribution in initial state in depth range from surface up to final measurement depth (averaged value)
0
50
100
150
200
250
300
350
400
450
500
550
600
650
700
750
800
850
900
6 8 10 12 14 16 18 20 22 24 26 28 30 32 34 36 38 40 42
de
pth
[m
]
temperature [°C]
13 ⅜“ Casing shoe
18 ⅝“ Anchor pipe shoe
Quarternary
Caprock
Upper Permian
Tertiary
32" Conductor pipe shoe
7
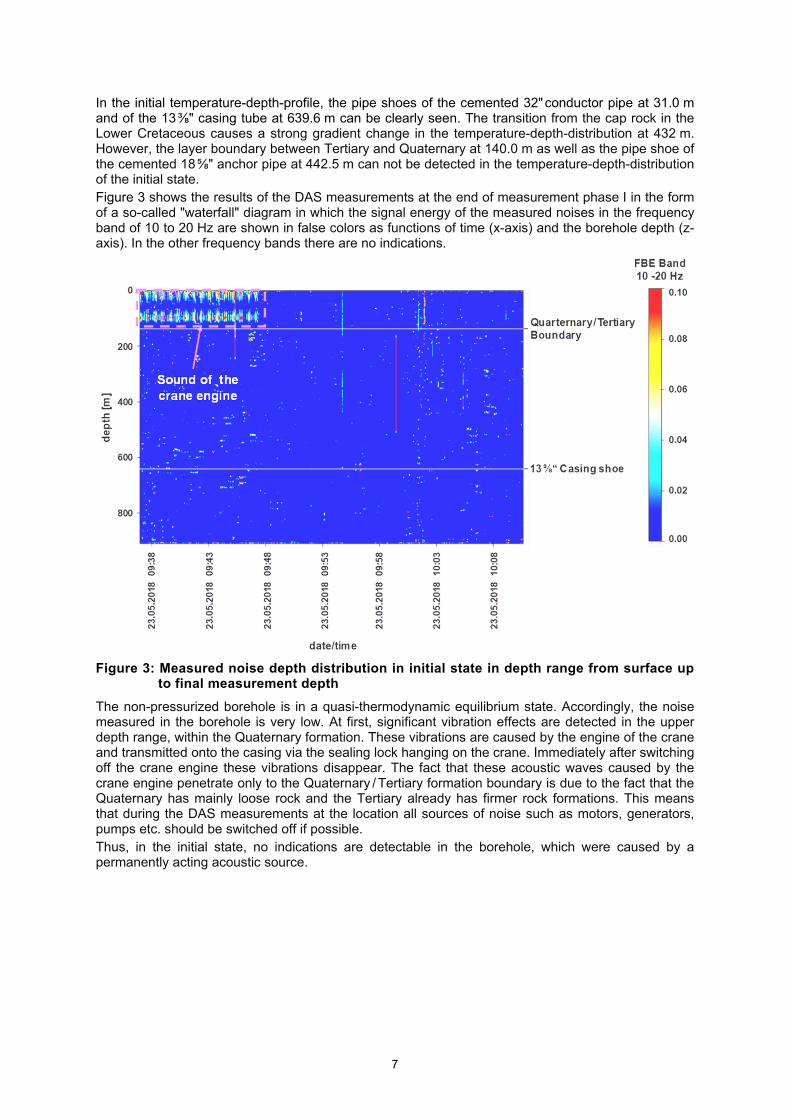
In the initial temperature-depth-profile, the pipe shoes of the cemented 32" conductor pipe at 31.0 m and of the 13 ⅜" casing tube at 639.6 m can be clearly seen. The transition from the cap rock in the Lower Cretaceous causes a strong gradient change in the temperature-depth-distribution at 432 m. However, the layer boundary between Tertiary and Quaternary at 140.0 m as well as the pipe shoe of the cemented 18 ⅝" anchor pipe at 442.5 m can not be detected in the temperature-depth-distribution of the initial state. Figure 3 shows the results of the DAS measurements at the end of measurement phase I in the form of a so-called "waterfall" diagram in which the signal energy of the measured noises in the frequency band of 10 to 20 Hz are shown in false colors as functions of time (x-axis) and the borehole depth (z-axis). In the other frequency bands there are no indications.
Figure 3: Measured noise depth distribution in initial state in depth range from surface up to final measurement depth
The non-pressurized borehole is in a quasi-thermodynamic equilibrium state. Accordingly, the noise measured in the borehole is very low. At first, significant vibration effects are detected in the upper depth range, within the Quaternary formation. These vibrations are caused by the engine of the crane and transmitted onto the casing via the sealing lock hanging on the crane. Immediately after switching off the crane engine these vibrations disappear. The fact that these acoustic waves caused by the crane engine penetrate only to the Quaternary / Tertiary formation boundary is due to the fact that the Quaternary has mainly loose rock and the Tertiary already has firmer rock formations. This means that during the DAS measurements at the location all sources of noise such as motors, generators, pumps etc. should be switched off if possible. Thus, in the initial state, no indications are detectable in the borehole, which were caused by a permanently acting acoustic source.
8
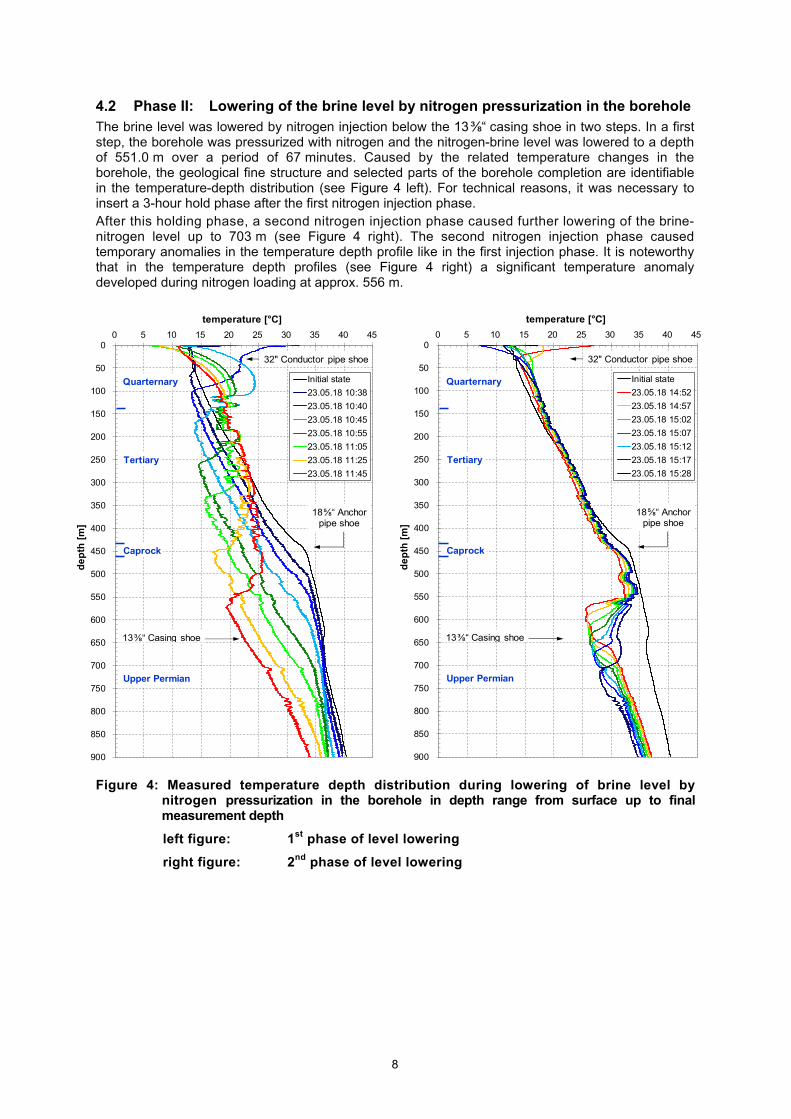
4.2 Phase II: Lowering of the brine level by nitrogen pressurization in the borehole The brine level was lowered by nitrogen injection below the 13 ⅜“ casing shoe in two steps. In a first step, the borehole was pressurized with nitrogen and the nitrogen-brine level was lowered to a depth of 551.0 m over a period of 67 minutes. Caused by the related temperature changes in the borehole, the geological fine structure and selected parts of the borehole completion are identifiable in the temperature-depth distribution (see Figure 4 left). For technical reasons, it was necessary to insert a 3-hour hold phase after the first nitrogen injection phase. After this holding phase, a second nitrogen injection phase caused further lowering of the brine-nitrogen level up to 703 m (see Figure 4 right). The second nitrogen injection phase caused temporary anomalies in the temperature depth profile like in the first injection phase. It is noteworthy that in the temperature depth profiles (see Figure 4 right) a significant temperature anomaly developed during nitrogen loading at approx. 556 m.
0
50
100
150
200
250
300
350
400
450
500
550
600
650
700
750
800
850
900
0 5 10 15 20 25 30 35 40 45
de
pth
[m
]
temperature [°C]
Initial state
23.05.18 14:52
23.05.18 14:57
23.05.18 15:02
23.05.18 15:07
23.05.18 15:12
23.05.18 15:17
23.05.18 15:28
13⅜“ Casing shoe
Quarternary
Caprock
Upper Permian
Tertiary
32" Conductor pipe shoe
18⅝“ Anchorpipe shoe
0
50
100
150
200
250
300
350
400
450
500
550
600
650
700
750
800
850
900
0 5 10 15 20 25 30 35 40 45
de
pth
[m
]
temperature [°C]
Initial state
23.05.18 10:38
23.05.18 10:40
23.05.18 10:45
23.05.18 10:55
23.05.18 11:05
23.05.18 11:25
23.05.18 11:45
13⅜“ Casing shoe
Quarternary
Caprock
Upper Permian
Tertiary
32" Conductor pipe shoe
18⅝“ Anchorpipe shoe
Figure 4: Measured temperature depth distribution during lowering of brine level bynitrogen pressurization in the borehole in depth range from surface up to finalmeasurement depth
left figure: 1st phase of level lowering
right figure: 2nd phase of level lowering
9
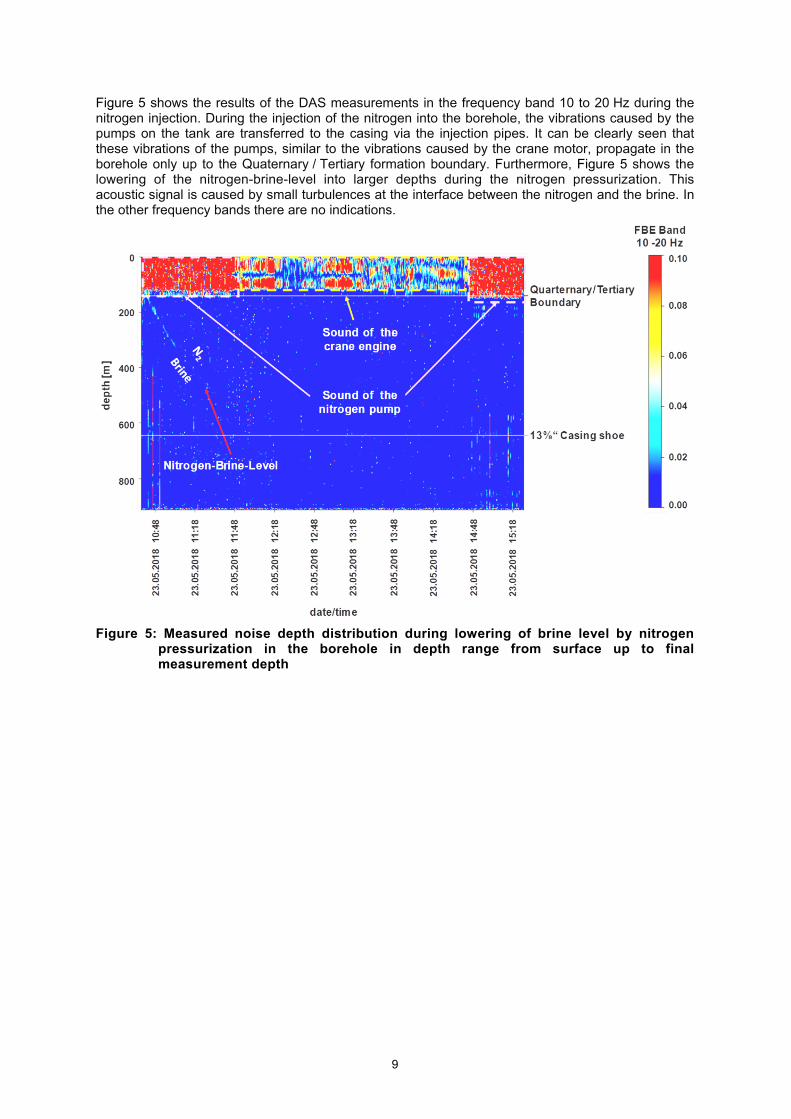
Figure 5 shows the results of the DAS measurements in the frequency band 10 to 20 Hz during the nitrogen injection. During the injection of the nitrogen into the borehole, the vibrations caused by the pumps on the tank are transferred to the casing via the injection pipes. It can be clearly seen that these vibrations of the pumps, similar to the vibrations caused by the crane motor, propagate in the borehole only up to the Quaternary / Tertiary formation boundary. Furthermore, Figure 5 shows the lowering of the nitrogen-brine-level into larger depths during the nitrogen pressurization. This acoustic signal is caused by small turbulences at the interface between the nitrogen and the brine. In the other frequency bands there are no indications.
Figure 5: Measured noise depth distribution during lowering of brine level by nitrogen pressurization in the borehole in depth range from surface up to final measurement depth
10
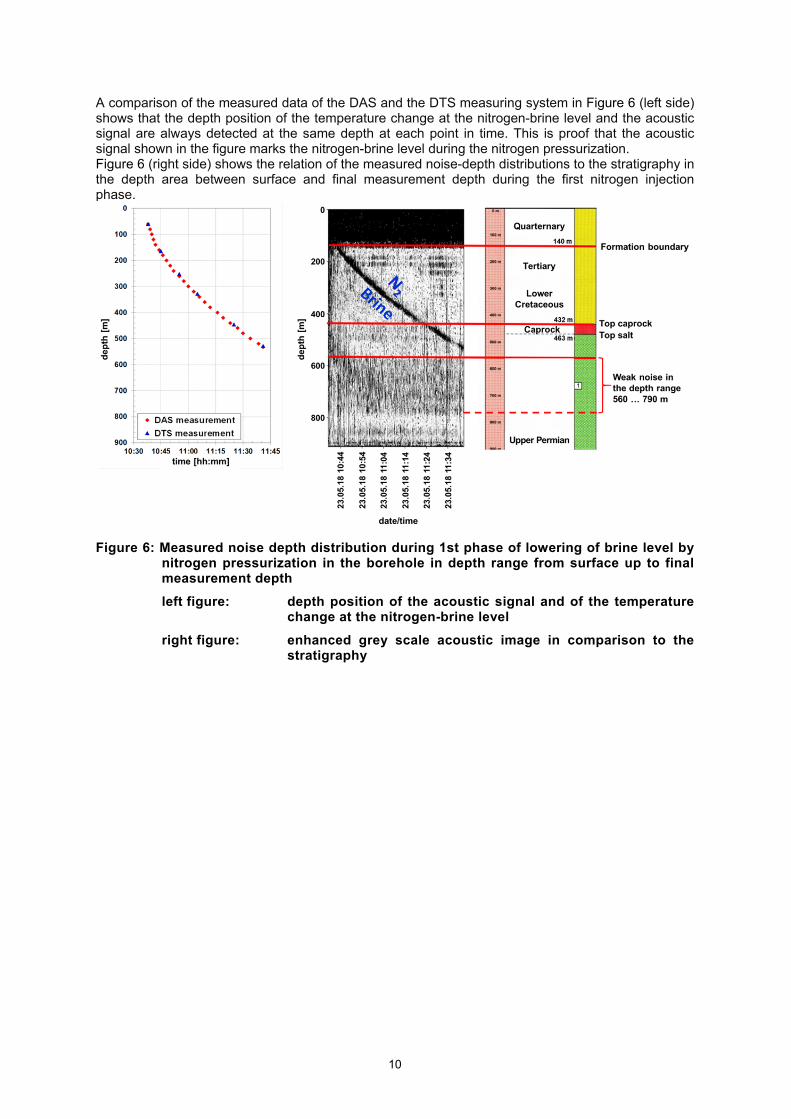
A comparison of the measured data of the DAS and the DTS measuring system in Figure 6 (left side) shows that the depth position of the temperature change at the nitrogen-brine level and the acoustic signal are always detected at the same depth at each point in time. This is proof that the acoustic signal shown in the figure marks the nitrogen-brine level during the nitrogen pressurization. Figure 6 (right side) shows the relation of the measured noise-depth distributions to the stratigraphy in the depth area between surface and final measurement depth during the first nitrogen injection phase.
Figure 6: Measured noise depth distribution during 1st phase of lowering of brine level by nitrogen pressurization in the borehole in depth range from surface up to final measurement depth
left figure: depth position of the acoustic signal and of the temperature change at the nitrogen-brine level
right figure: enhanced grey scale acoustic image in comparison to the stratigraphy
11
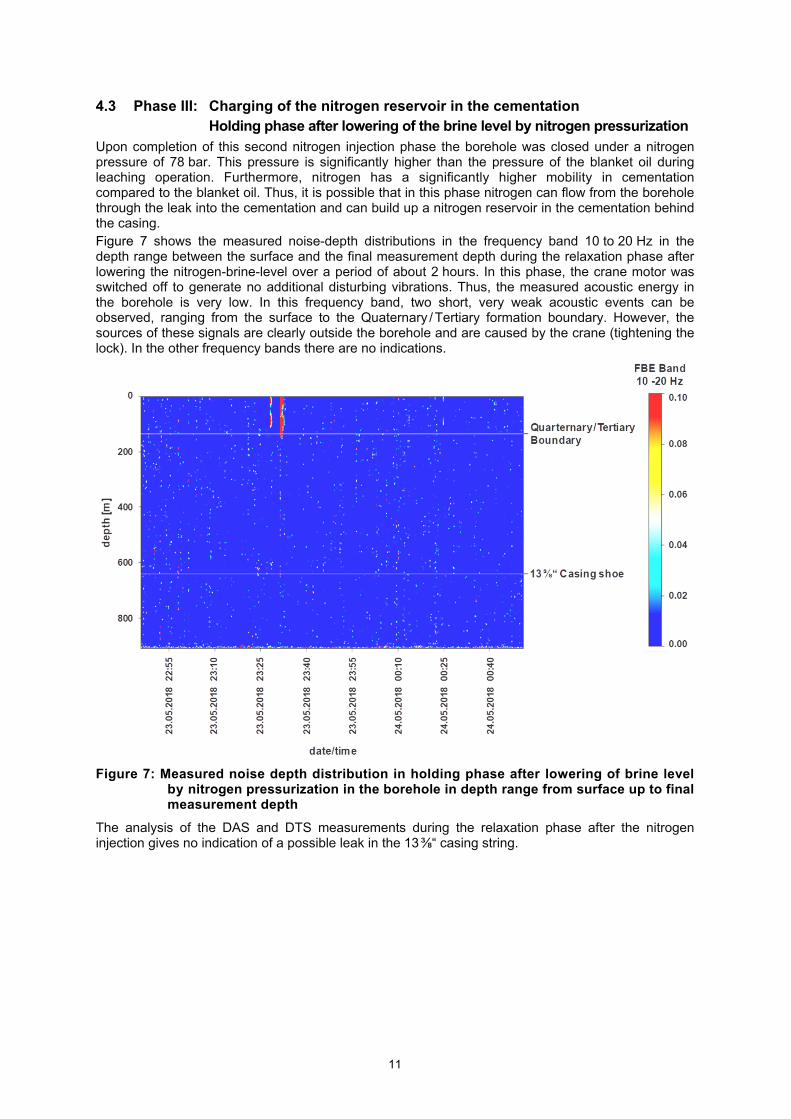
4.3 Phase III: Charging of the nitrogen reservoir in the cementation Holding phase after lowering of the brine level by nitrogen pressurization Upon completion of this second nitrogen injection phase the borehole was closed under a nitrogen pressure of 78 bar. This pressure is significantly higher than the pressure of the blanket oil during leaching operation. Furthermore, nitrogen has a significantly higher mobility in cementation compared to the blanket oil. Thus, it is possible that in this phase nitrogen can flow from the borehole through the leak into the cementation and can build up a nitrogen reservoir in the cementation behind the casing. Figure 7 shows the measured noise-depth distributions in the frequency band 10 to 20 Hz in the depth range between the surface and the final measurement depth during the relaxation phase after lowering the nitrogen-brine-level over a period of about 2 hours. In this phase, the crane motor was switched off to generate no additional disturbing vibrations. Thus, the measured acoustic energy in the borehole is very low. In this frequency band, two short, very weak acoustic events can be observed, ranging from the surface to the Quaternary / Tertiary formation boundary. However, the sources of these signals are clearly outside the borehole and are caused by the crane (tightening the lock). In the other frequency bands there are no indications.
Figure 7: Measured noise depth distribution in holding phase after lowering of brine level by nitrogen pressurization in the borehole in depth range from surface up to final measurement depth
The analysis of the DAS and DTS measurements during the relaxation phase after the nitrogen injection gives no indication of a possible leak in the 13 ⅜“ casing string.
12
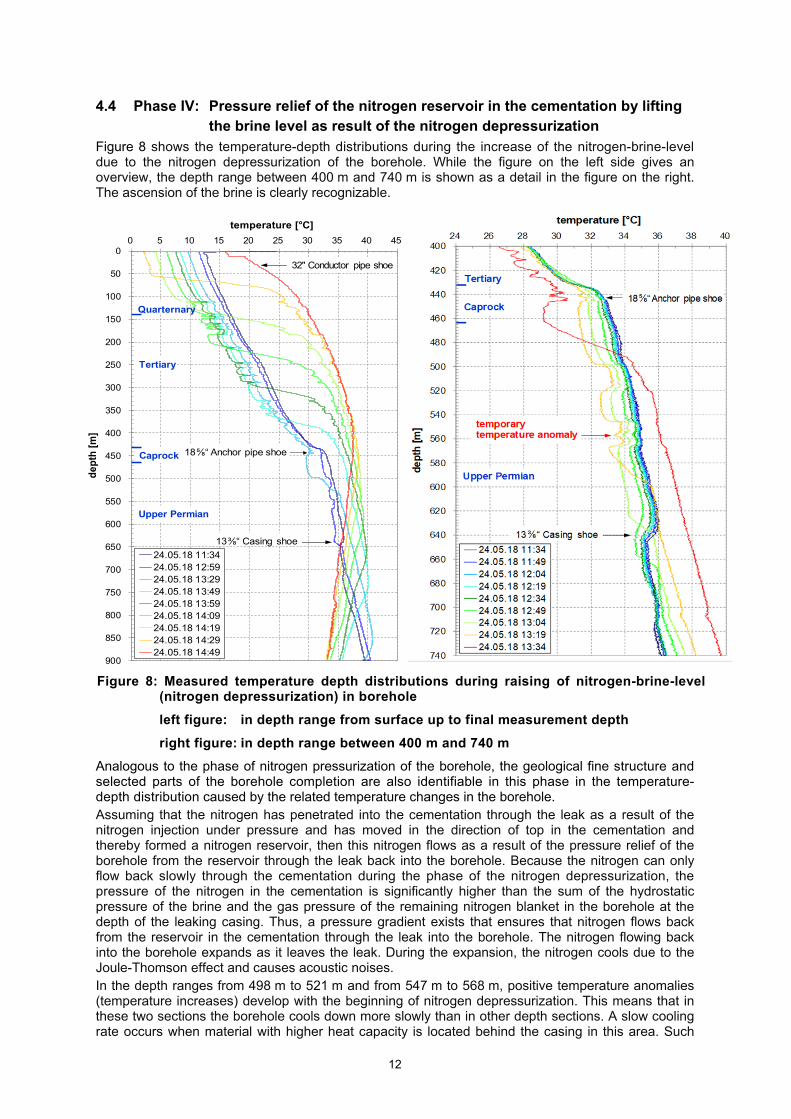
4.4 Phase IV: Pressure relief of the nitrogen reservoir in the cementation by lifting the brine level as result of the nitrogen depressurization Figure 8 shows the temperature-depth distributions during the increase of the nitrogen-brine-level due to the nitrogen depressurization of the borehole. While the figure on the left side gives an overview, the depth range between 400 m and 740 m is shown as a detail in the figure on the right. The ascension of the brine is clearly recognizable.
Analogous to the phase of nitrogen pressurization of the borehole, the geological fine structure and selected parts of the borehole completion are also identifiable in this phase in the temperature-depth distribution caused by the related temperature changes in the borehole. Assuming that the nitrogen has penetrated into the cementation through the leak as a result of the nitrogen injection under pressure and has moved in the direction of top in the cementation and thereby formed a nitrogen reservoir, then this nitrogen flows as a result of the pressure relief of the borehole from the reservoir through the leak back into the borehole. Because the nitrogen can only flow back slowly through the cementation during the phase of the nitrogen depressurization, the pressure of the nitrogen in the cementation is significantly higher than the sum of the hydrostatic pressure of the brine and the gas pressure of the remaining nitrogen blanket in the borehole at the depth of the leaking casing. Thus, a pressure gradient exists that ensures that nitrogen flows back from the reservoir in the cementation through the leak into the borehole. The nitrogen flowing back into the borehole expands as it leaves the leak. During the expansion, the nitrogen cools due to the Joule-Thomson effect and causes acoustic noises. In the depth ranges from 498 m to 521 m and from 547 m to 568 m, positive temperature anomalies (temperature increases) develop with the beginning of nitrogen depressurization. This means that in these two sections the borehole cools down more slowly than in other depth sections. A slow cooling rate occurs when material with higher heat capacity is located behind the casing in this area. Such
0
50
100
150
200
250
300
350
400
450
500
550
600
650
700
750
800
850
900
0 5 10 15 20 25 30 35 40 45
dep
th [
m]
temperature [°C]
24.05.18 11:3424.05.18 12:5924.05.18 13:2924.05.18 13:4924.05.18 13:5924.05.18 14:0924.05.18 14:1924.05.18 14:2924.05.18 14:49
13⅜“ Casing shoe
Quarternary
Caprock
Upper Permian
Tertiary
32" Conductor pipe shoe
18⅝“ Anchor pipe shoe
Figure 8: Measured temperature depth distributions during raising of nitrogen-brine-level(nitrogen depressurization) in borehole
left figure: in depth range from surface up to final measurement depth
right figure: in depth range between 400 m and 740 m
13
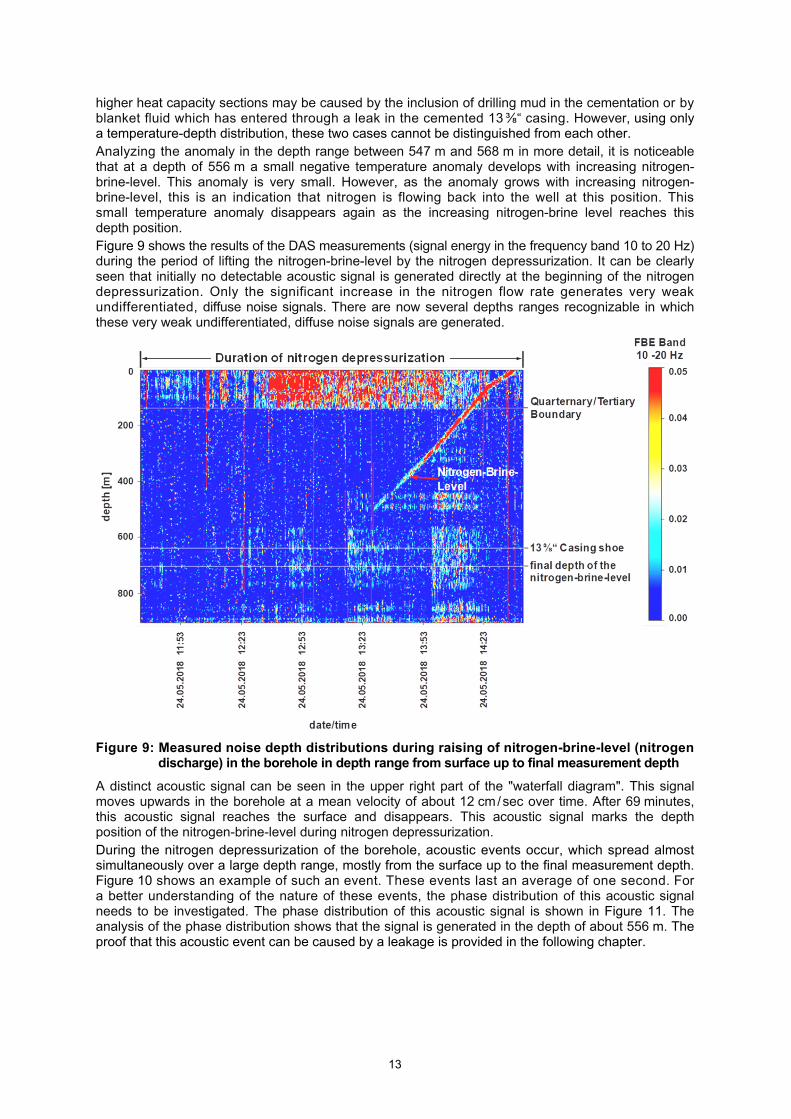
higher heat capacity sections may be caused by the inclusion of drilling mud in the cementation or by blanket fluid which has entered through a leak in the cemented 13 ⅜“ casing. However, using only a temperature-depth distribution, these two cases cannot be distinguished from each other. Analyzing the anomaly in the depth range between 547 m and 568 m in more detail, it is noticeable that at a depth of 556 m a small negative temperature anomaly develops with increasing nitrogen-brine-level. This anomaly is very small. However, as the anomaly grows with increasing nitrogen-brine-level, this is an indication that nitrogen is flowing back into the well at this position. This small temperature anomaly disappears again as the increasing nitrogen-brine level reaches this depth position. Figure 9 shows the results of the DAS measurements (signal energy in the frequency band 10 to 20 Hz) during the period of lifting the nitrogen-brine-level by the nitrogen depressurization. It can be clearly seen that initially no detectable acoustic signal is generated directly at the beginning of the nitrogen depressurization. Only the significant increase in the nitrogen flow rate generates very weak undifferentiated, diffuse noise signals. There are now several depths ranges recognizable in which these very weak undifferentiated, diffuse noise signals are generated.
Figure 9: Measured noise depth distributions during raising of nitrogen-brine-level (nitrogen discharge) in the borehole in depth range from surface up to final measurement depth
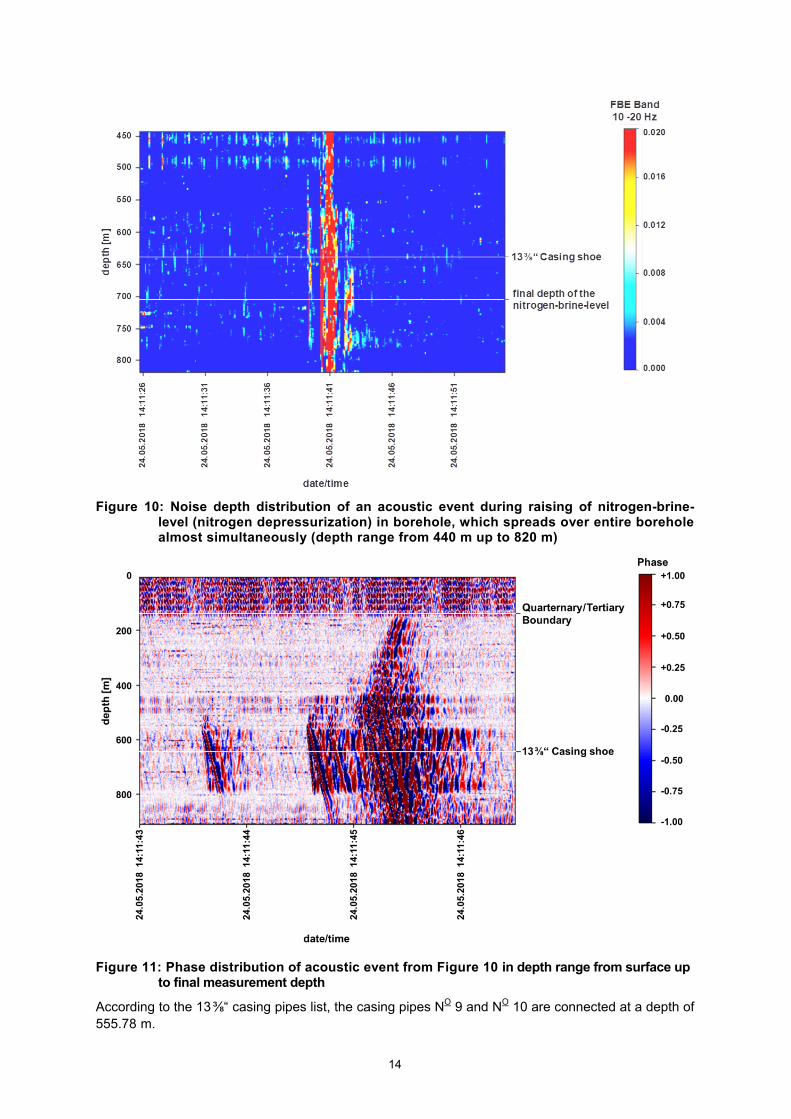
A distinct acoustic signal can be seen in the upper right part of the "waterfall diagram". This signal moves upwards in the borehole at a mean velocity of about 12 cm / sec over time. After 69 minutes, this acoustic signal reaches the surface and disappears. This acoustic signal marks the depth position of the nitrogen-brine-level during nitrogen depressurization. During the nitrogen depressurization of the borehole, acoustic events occur, which spread almost simultaneously over a large depth range, mostly from the surface up to the final measurement depth. Figure 10 shows an example of such an event. These events last an average of one second. For a better understanding of the nature of these events, the phase distribution of this acoustic signal needs to be investigated. The phase distribution of this acoustic signal is shown in Figure 11. The analysis of the phase distribution shows that the signal is generated in the depth of about 556 m. The proof that this acoustic event can be caused by a leakage is provided in the following chapter.
14
Figure 10: Noise depth distribution of an acoustic event during raising of nitrogen-brine-level (nitrogen depressurization) in borehole, which spreads over entire borehole almost simultaneously (depth range from 440 m up to 820 m)
Figure 11: Phase distribution of acoustic event from Figure 10 in depth range from surface up to final measurement depth
According to the 13 ⅜“ casing pipes list, the casing pipes NO 9 and NO 10 are connected at a depth of 555.78 m.
15
There are three facts that clearly indicate the existence of an untightness at the depth of about 556 m:
the temporary negative temperature anomaly during the nitrogen depressurization at the depth of 556 m
the acoustic source during the nitrogen depressurization at the depth of 556 m
the presence of a casing connector at a depth of 555.78 m
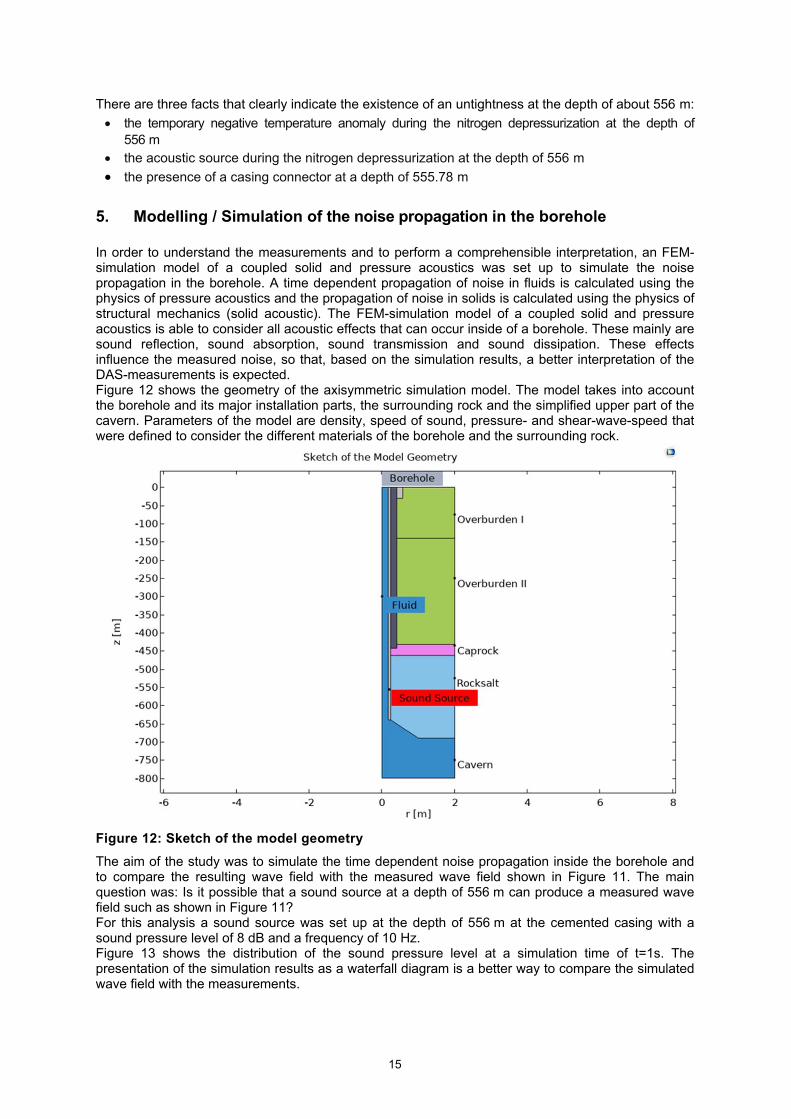
5. Modelling / Simulation of the noise propagation in the borehole In order to understand the measurements and to perform a comprehensible interpretation, an FEM-simulation model of a coupled solid and pressure acoustics was set up to simulate the noise propagation in the borehole. A time dependent propagation of noise in fluids is calculated using the physics of pressure acoustics and the propagation of noise in solids is calculated using the physics of structural mechanics (solid acoustic). The FEM-simulation model of a coupled solid and pressure acoustics is able to consider all acoustic effects that can occur inside of a borehole. These mainly are sound reflection, sound absorption, sound transmission and sound dissipation. These effects influence the measured noise, so that, based on the simulation results, a better interpretation of the DAS-measurements is expected. Figure 12 shows the geometry of the axisymmetric simulation model. The model takes into account the borehole and its major installation parts, the surrounding rock and the simplified upper part of the cavern. Parameters of the model are density, speed of sound, pressure- and shear-wave-speed that were defined to consider the different materials of the borehole and the surrounding rock.
Figure 12: Sketch of the model geometry
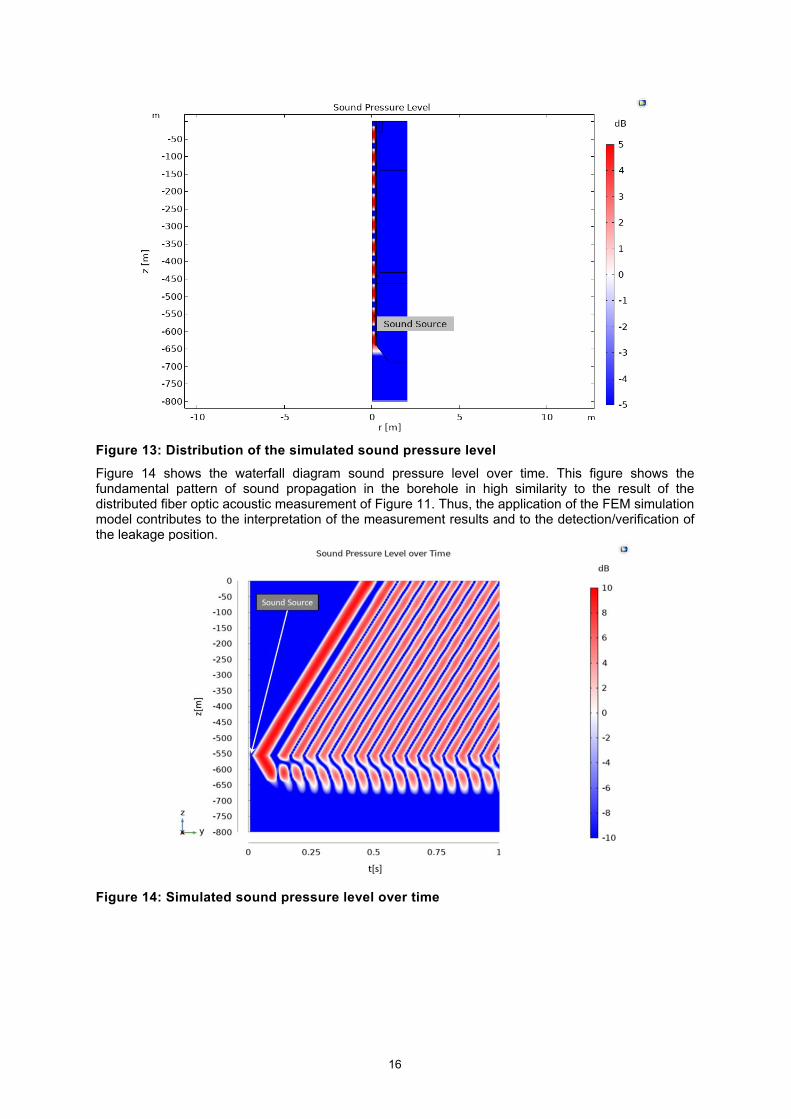
The aim of the study was to simulate the time dependent noise propagation inside the borehole and to compare the resulting wave field with the measured wave field shown in Figure 11. The main question was: Is it possible that a sound source at a depth of 556 m can produce a measured wave field such as shown in Figure 11? For this analysis a sound source was set up at the depth of 556 m at the cemented casing with a sound pressure level of 8 dB and a frequency of 10 Hz. Figure 13 shows the distribution of the sound pressure level at a simulation time of t=1s. The presentation of the simulation results as a waterfall diagram is a better way to compare the simulated wave field with the measurements.
16
Figure 13: Distribution of the simulated sound pressure level
Figure 14 shows the waterfall diagram sound pressure level over time. This figure shows the fundamental pattern of sound propagation in the borehole in high similarity to the result of the distributed fiber optic acoustic measurement of Figure 11. Thus, the application of the FEM simulation model contributes to the interpretation of the measurement results and to the detection/verification of the leakage position.
Figure 14: Simulated sound pressure level over time
17
6. Conclusions A methodology of simultaneously distributed fiber optic measurement of temperature (DTS) and acoustics (DAS) was successfully used for the first time to investigate the well integrity and to identify a leakage within the last cemented casing of a brine producing cavern in the Netherlands. A casing collar was identified as the cause of the leak. The application of a FEM model makes a successful contribution to the interpretation of the measurement results and to the verification of the located leakage. For future investigations a mathematical relationship will be evaluated between the noise generated by a leakage volume flow, that means the sound pressure level, and the acoustic frequency of the boundary condition of the simulation model. With the aid of the simulation model a quantitative estimation of the detected leakage volume flow will be possible in the future. As this was the first use of this methodology very little is known about the possibilities and the limits of this approach. There is a need for further focused research to develop a combined procedure to identify leakages in the small scale range below today’s technical detection limits. To achieve this, several conditions need to be fulfilled which are, amongst others, using a common fiber optic cable for acoustic and temperature signal generation and transmission, investigation of sound emissions in the low-flow range, developing a proven stimulation methodology, reducing the bandwidth of the acoustic frequency range to enable on-site evaluation and reducing misinterpretations with the combined approach. As can be seen in the presented example, acoustic noise could mask additional leakages in the upper part of the well. Therefore additional strategies for noise reduction also have to be developed. Due to the entanglement of the measurement data and the elimination of the motion-related disadvantages of a measuring probe, much more precise results for the evaluation of the borehole integrity are to be expected. With the help of this still to be developed simple but robust technique, quantitative on-site statements about the conditions in the borehole are the declared goal of this research.
18
Additional Items: Figure Labeling Figure 1. Well layout with production casings Figure 2. Measured temperature depth distribution in initial state in depth range from surface up to
final measurement depth (averaged value) Figure 3. Measured noise depth distribution in initial state in depth range from surface up to final
measurement depth Figure 4. Measured temperature depth distribution during lowering of brine level by nitrogen
pressurization in the borehole in depth range from surface up to final measurement depth left figure: 1st phase of level lowering right figure: 2nd phase of level lowering
Figure 5. Measured noise depth distribution during lowering of brine level by nitrogen pressurization in the borehole in depth range from surface up to final measurement depth
Figure 6. Measured noise depth distribution during 1st phase of lowering of brine level by nitrogen pressurization in the borehole in depth range from surface up to final measurement depth left figure: depth position of the acoustic signal and of the temperature change at the nitrogen-brine level right figure: enhanced grey scale acoustic image in comparison to the stratigraphy
Figure 7. Measured noise depth distribution in holding phase after lowering of brine level by nitrogen pressurization in the borehole in depth range from surface up to final measurement depth
Figure 8. Measured temperature depth distributions during raising of nitrogen-brine-level (nitrogen depressurization) in borehole left figure: in depth range from surface up to final measurement depth right figure: in depth range between 400 m and 740 m
Figure 9. Measured noise depth distributions during raising of nitrogen-brine-level (nitrogen discharge) in the borehole in depth range from surface up to final measurement depth
Figure 10. Noise depth distribution of an acoustic event during raising of nitrogen-brine-level (nitrogen depressurization) in borehole, which spreads over entire borehole almost simultaneously (depth range from 440 m up to 820 m)
Figure 11. Phase distribution of acoustic event from Figure 10 in depth range from surface up to final measurement depth
Figure 12. Sketch of the model geometry Figure 13. Distribution of the simulated sound pressure level Figure 14. Simulated sound pressure level over time References
E. Hurtig, S. Großwig, M. Jobmann, K. Kühn, P. Marschall: Fiber Optic Temperature Measurements in Shallow Boreholes: Application for Fluid Logging. Geothermics 23 (4), pp 355 - 364, 1994.
S. Großwig, E. Hurtig, M. Kasch, K. Kühn: Die ortsaufgelöste Temperaturmeßtechnik - Leistungsfähigkeit und Anwendungsmöglichkeiten im Umwelt- und Geobereich anhand ausgewählter Beispiele. Temperatur ´98, Verein Deutscher Ingenieure - VDI-Berichte Nr. 1379, VDI-Verlag Düsseldorf 1998 (ISBN 3-18-091379-7), pp. 87 - 92, 1998.
S. Großwig, E. Hurtig, K. Kühn, F. Rudolph: Distributed Fiber-optic Temperature Sensing Technique (DTS) for Surveying Underground Gas Storage Facilities. Oil Gas European Magazine 4 (2001), pp 31 - 34, 2001.
Nishigaki, M., Schreck, M., Matsuo, Y., Großwig, St.; Kühn, K. und Döring, H.: Intrinsic Distributed Fiber Optic Measurement - A new age of sensing ?, Sensor Magazin Vol. 4/1997, Seiten 24 - 29.