Embed Size (px)
Citation preview
Solution of IAEA International Collaborative Standard Problem on Integral PWR “Open Calculation” using KORSAR/GP Code
Yu.Sorokin, N.Fil, N.Bukin
Forth Technical Meeting/Workshop for the ICPS
on Integral Water Cooled Reactor Design,
Pisa 25-28 February 2013
2
ICSP Open Calculation Stage
Main Purposes:
- Comparison of the Blind & Open Calculation’s
results with the experimental data for SP-2 and SP-3
tests.
- Lessons learned during ICSP solution.
3
KORSAR/GP Code
Russian Thermal Hydraulic KORSAR/GP Code was
used for Blind and Open Calculations of MASLWR
parameters behavior during the SP-2 and SP-3
experiments.
KORSAR/GP is the Best Estimate Code and it is
intended for analyses of LWR processes in steady-state,
transient and accident conditions.
Modelling of Thermal Hydraulic processes in KORSAR/GP is carried out on the basis of completely nonequilibrium two-liquid model (three conservation equations for water and steam phases) in one-dimensional approach.
4 4
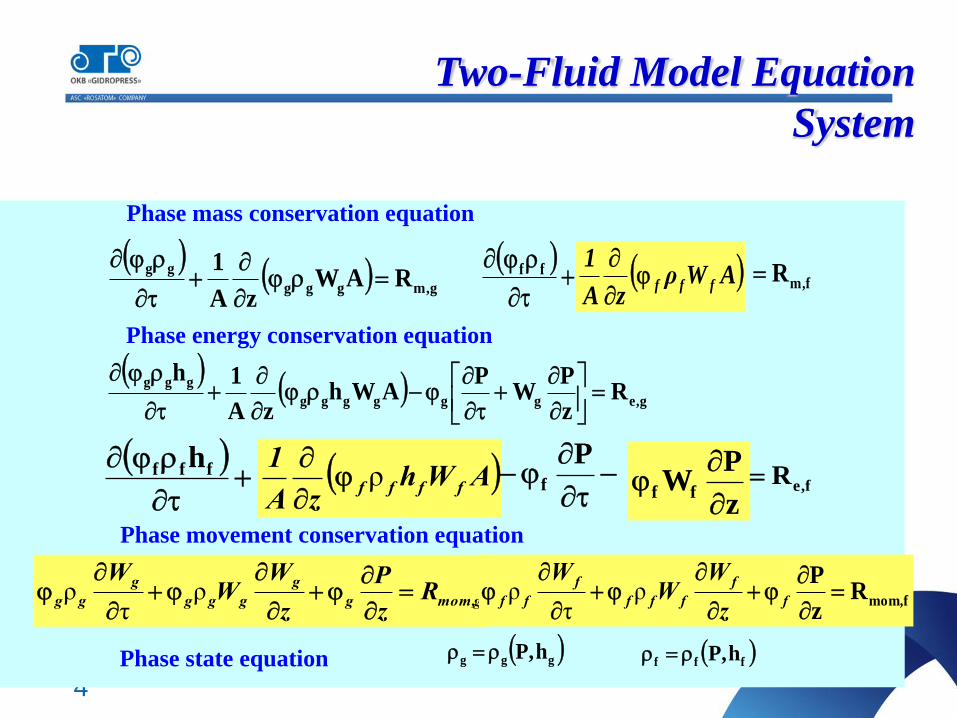
Two-Fluid Model Equation
System
g,mggg
ggRAW
zA
1
g,egggggg
gggR
z
PW
PAWh
zA
1h
Phase energy conservation equation
Phase mass conservation equation
Phase movement conservation equation
gmom,g
g
ggg
g
gg Rz
P
z
WW
W
ρ
τρ f,momR
z
P
f
f
fff
f
ffz
WW
Wρ
τρ
Phase state equation ggg h,P fff h,P
ff AWρzA
1fff
f,mR
fff h AWhzA
1ffffρ
Pf
z
PWff
f,eR
5
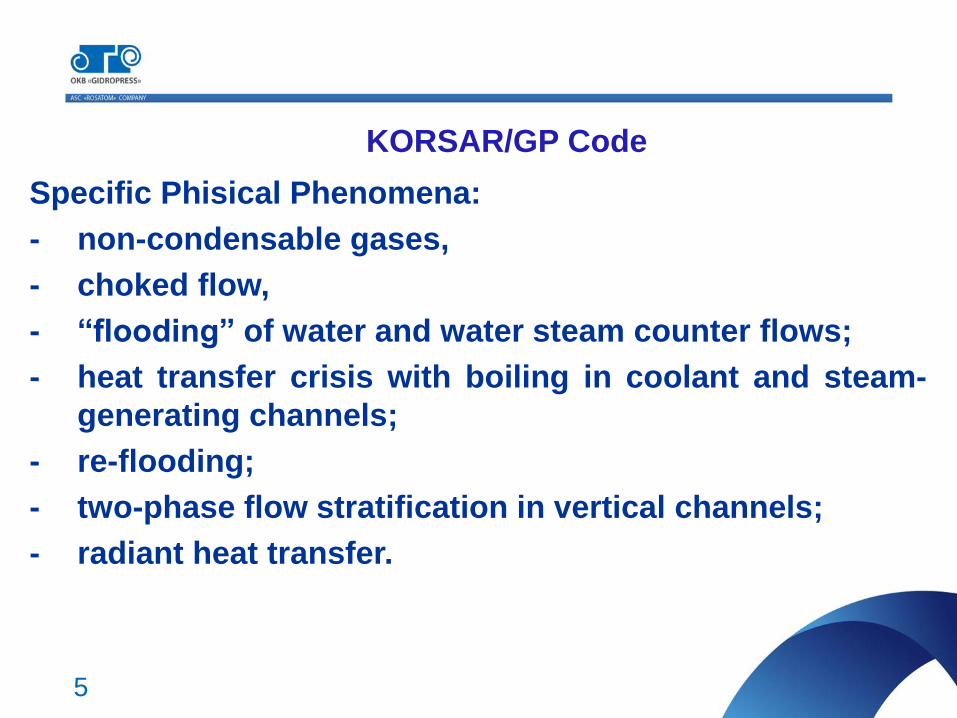
Specific Phisical Phenomena:
- non-condensable gases,
- choked flow,
- “flooding” of water and water steam counter flows;
- heat transfer crisis with boiling in coolant and steam-
generating channels;
- re-flooding;
- two-phase flow stratification in vertical channels;
- radiant heat transfer.
KORSAR/GP Code
6
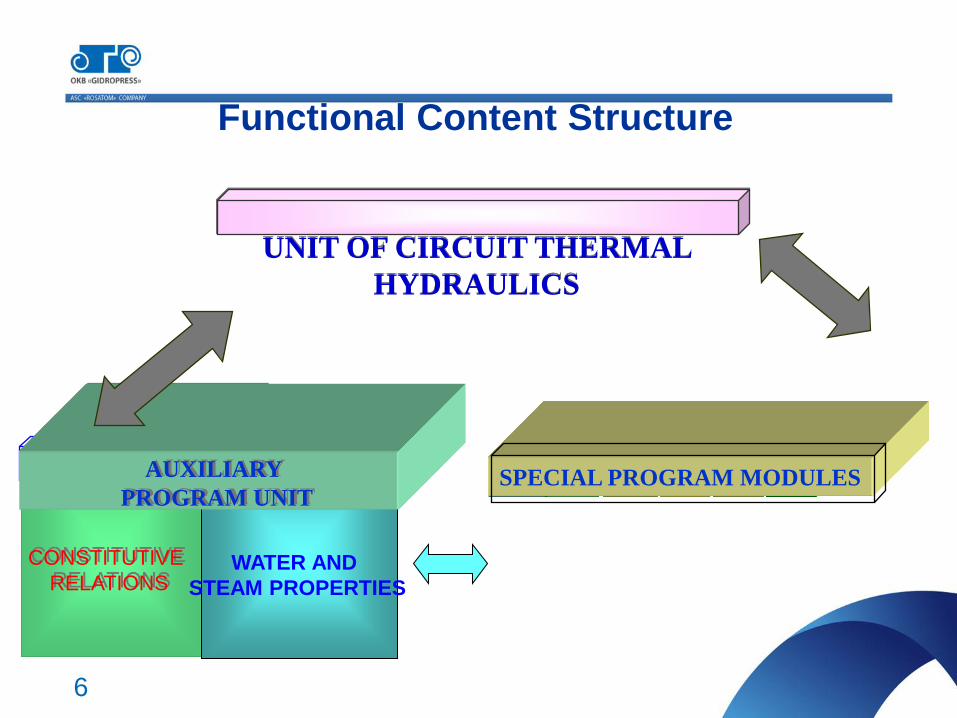
Functional Content Structure
SPECIAL PROGRAM MODULES
UNIT OF CIRCUIT THERMAL
HYDRAULICS
CONSTITUTIVE
RELATIONS WATER AND
STEAM PROPERTIES
AUXILIARY
PROGRAM UNIT
7
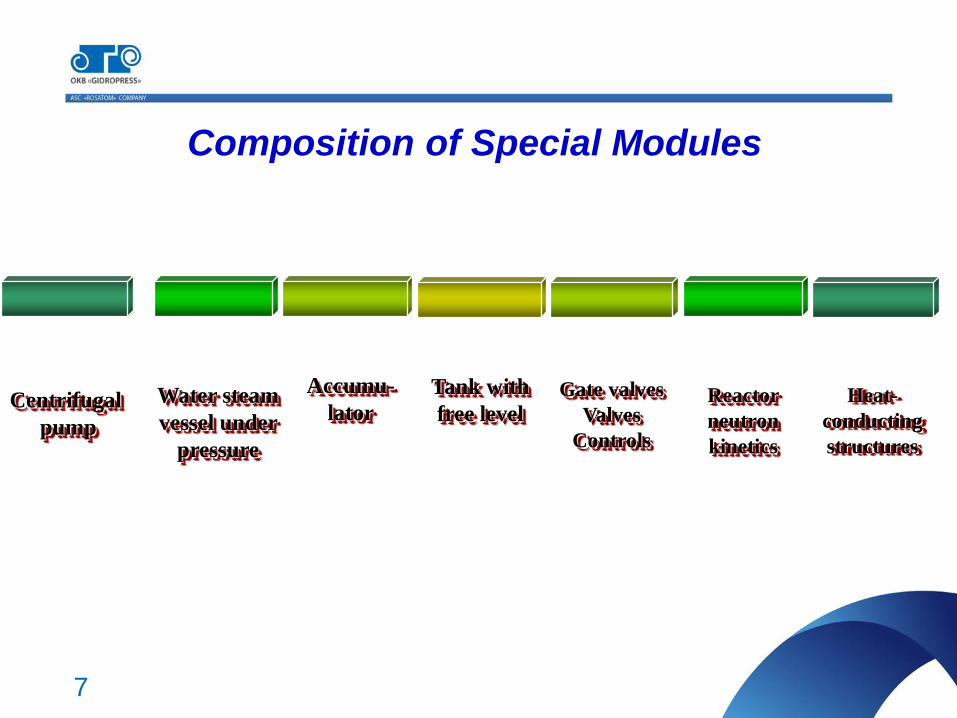
Composition of Special Modules
Centrifugal
pump
Water steam
vessel under
pressure
Accumu-
lator
Tank with
free level Gate valves
Valves
Controls
Reactor
neutron
kinetics
Heat-
conducting
structures
8
F
Fcr2
Fcr2
1
Diagram of the conditions of Diagram of the conditions of
heat exchange with the wallheat exchange with the wall
Diagram of fDiagram of flowlow conditions conditions inin
horizontal pipeshorizontal pipes
Film
condensation
4
Film boiling
6
Pre-crisis boiling
2
Heat convection
to liquid
3
Transient boiling
260
345 450
340
256
Tmin
Tcr
TS
Steam volume fraction0 1
Wa
ll t
emp
era
ture Dispersed conditions
5
250
560
TS - 2
Bubble Slug
Dis
per
sed
Annulardispersed
Stratified
StB B-St SB ADS SAD1
D2
D
F
Fcr2
Fcr2
Diagram of the conditions of Diagram of the conditions of
heat exchange with the wallheat exchange with the wall
Diagram of fDiagram of flowlow conditions conditions inin
horizontal pipeshorizontal pipes
Film
condensation
4
Film boiling
6
Pre-crisis boiling
2
Heat convection
to liquid
3
Transient boiling
260
345 450
340
256
Tmin
Tcr
TS
Steam volume fraction0 1
Wa
ll t
emp
era
ture Dispersed conditions
5
250
560
TS - 2 Film
condensation
4
Film boiling
6
Pre-crisis boiling
2
Heat convection
to liquid
3
Transient boiling
260
345 450
340
256
Tmin
Tcr
TS
Steam volume fraction0 1
Wa
ll t
emp
era
ture Dispersed conditions
5
250
560
TS - 2
Bubble Slug
Dis
per
sed
Annulardispersed
Stratified
StB B-St SB ADS SAD1
D2
D
F
Fcr2
Fcr2
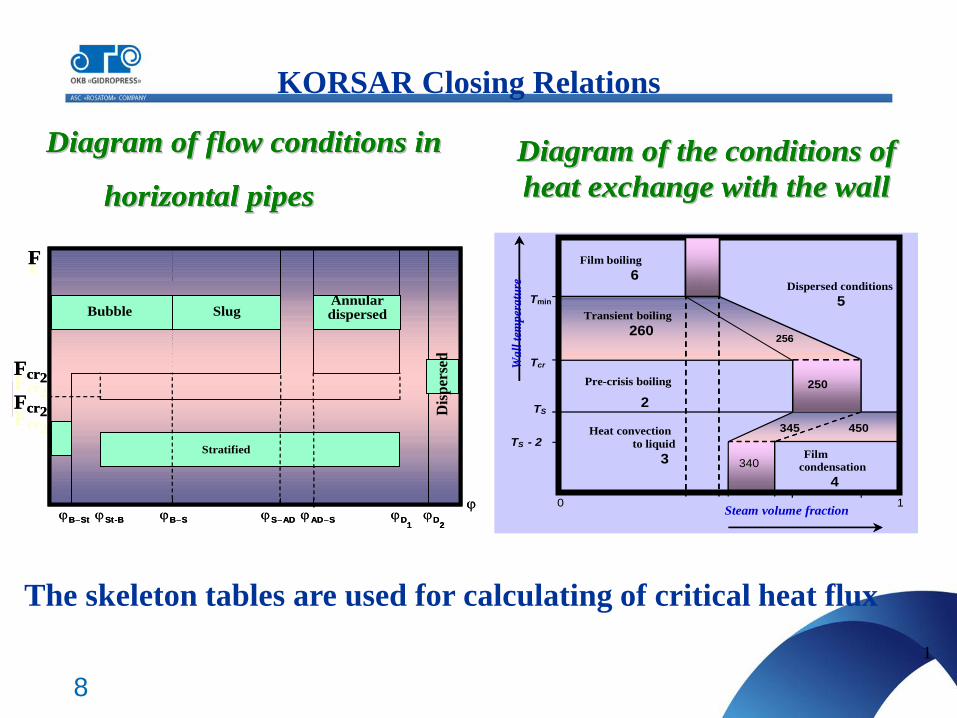
KORSAR Closing Relations
The skeleton tables are used for calculating of critical heat flux
9
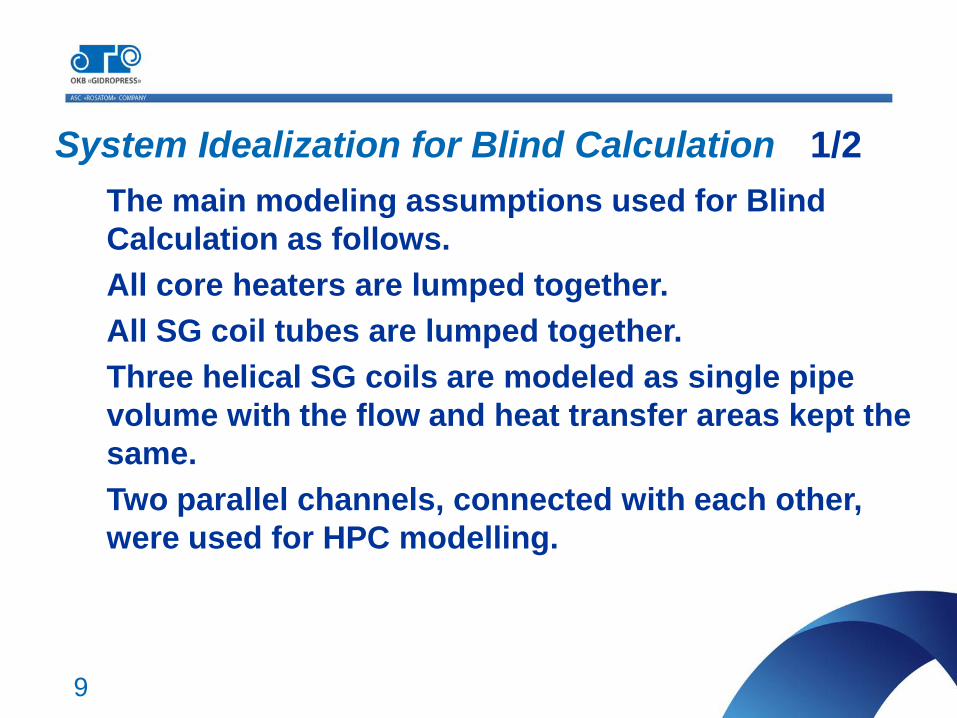
The main modeling assumptions used for Blind
Calculation as follows.
All core heaters are lumped together.
All SG coil tubes are lumped together.
Three helical SG coils are modeled as single pipe
volume with the flow and heat transfer areas kept the
same.
Two parallel channels, connected with each other,
were used for HPC modelling.
System Idealization for Blind Calculation 1/2
10
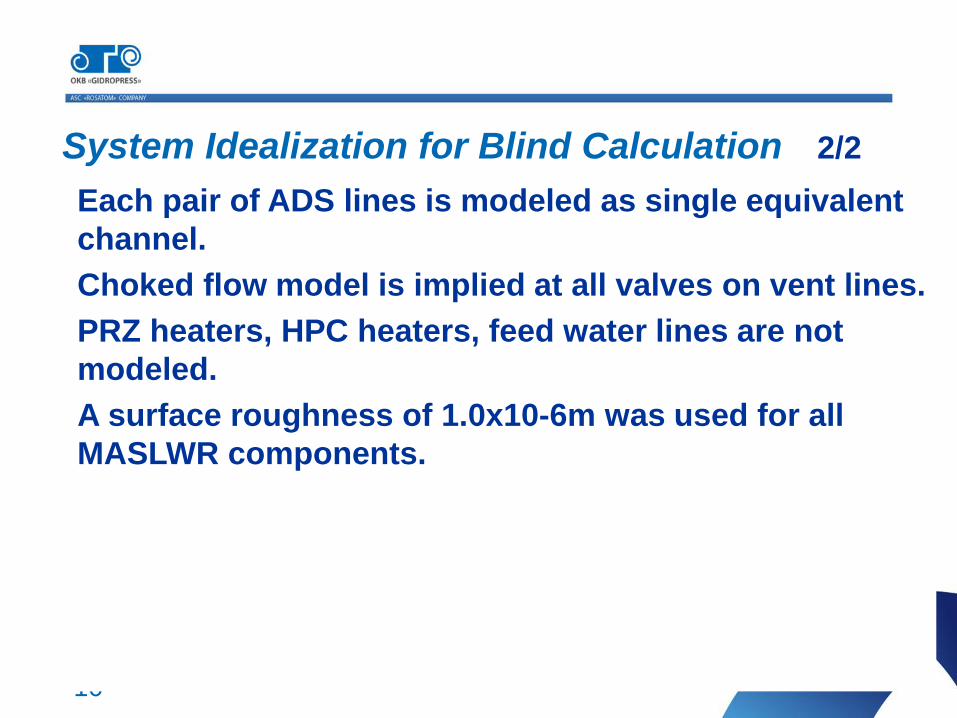
Each pair of ADS lines is modeled as single equivalent
channel.
Choked flow model is implied at all valves on vent lines.
PRZ heaters, HPC heaters, feed water lines are not
modeled.
A surface roughness of 1.0x10⁻⁶m was used for all
MASLWR components.
System Idealization for Blind Calculation 2/2
11
Input Data Preparing
The KORSAR Input Data has been prepared on the base of
information found in Problem Specification and it is similar
to the RELAP Data described in OSU-MASLWR-08002
(Draft). 1 Problem Specification for the IAEA International Collaborative
Standard Problem on Integral PWR Design Natural Circulation
Flow Stability and Thermo-hydraulic Coupling of Containment and
Primary System during Accidents. Draft.
2 Analysis of RELAP5-3D Modeling Techniques for Natural
Circulation Small Integral Light Water Reactors,
Draft. OSU-MASLWR-08002.
12
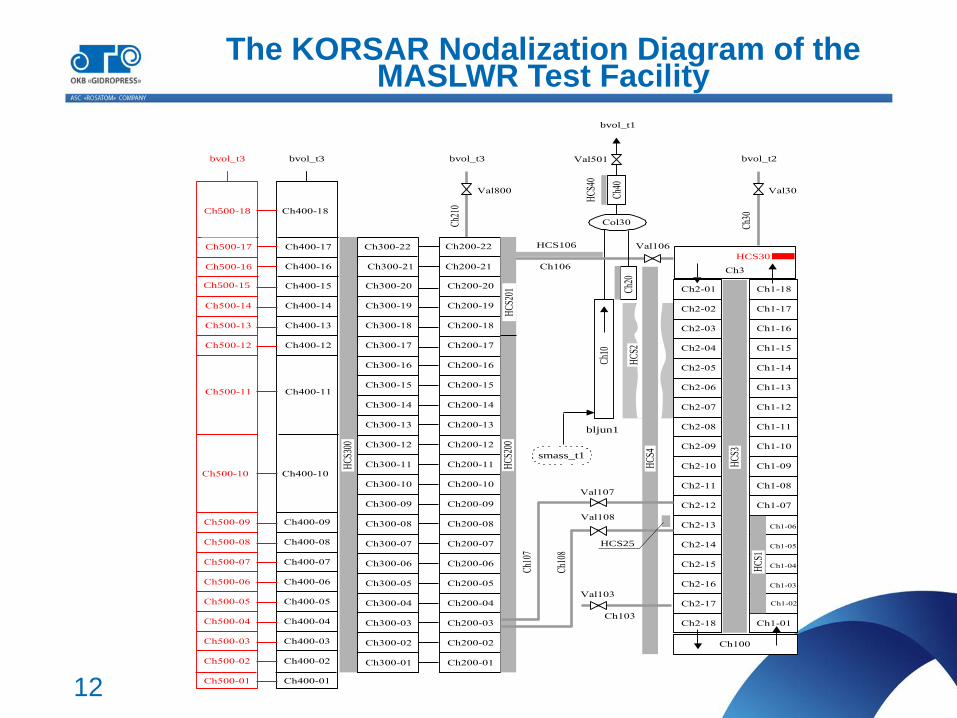
The KORSAR Nodalization Diagram of the MASLWR Test Facility
Val800
bljun1
Val107
Ch107
Ch108
Val108
Val103
Ch103
Val106
Ch106
Ch210
Val30
Ch30
smass_t1
bvol_t3
HC
S3
Ch2-01
Ch2-02
Ch2-03
Ch2-04
Ch2-05
Ch2-06
Ch2-07
Ch2-08
Ch2-09
Ch2-10
Ch2-11
Ch2-12
Ch2-13
Ch2-14
Ch2-15
Ch2-16
Ch2-17
Ch2-18
Ch1-18
Ch1-17
Ch1-16
Ch1-15
Ch1-14
Ch1-13
Ch1-12
Ch1-11
Ch1-10
Ch1-09
Ch1-08
Ch1-07
Ch1-06
Ch1-05
Ch1-04
Ch1-03
Ch1-02
Ch1-01
HC
S1
Ch100
Ch3
Ch1
0
Ch20
Col30
HCS40
HC
S2
HC
S4
bvol_t1
bvol_t2
Ch300-20
Ch300-19
Ch300-18
Ch300-17
Ch300-16
Ch300-15
Ch300-14
Ch300-13
Ch300-12
Ch300-11
Ch300-10
Ch300-09
Ch300-08
Ch300-07
Ch300-06
Ch300-05
Ch300-04
Ch300-03
Ch300-02
Ch300-01
Ch200-20
Ch200-19
Ch200-18
Ch200-17
Ch200-16
Ch200-15
Ch200-14
Ch200-13
Ch200-12
Ch200-11
Ch200-10
Ch200-09
Ch200-08
Ch200-07
Ch200-06
Ch200-05
Ch200-04
Ch200-03
Ch200-02
Ch200-01
HC
S300
Ch200-21Ch300-21
Ch300-22 Ch200-22
HC
S201
HC
S200
HCS106
Val501
Ch40
HCS25
Ch400-18
Ch400-17
Ch400-16
Ch400-15
Ch400-14
Ch400-13
Ch400-12
Ch400-11
Ch400-10
Ch400-09
Ch400-08
Ch400-07
Ch400-06
Ch400-05
Ch400-04
Ch400-03
Ch400-02
Ch400-01
Ch500-18
Ch500-17
Ch500-16
Ch500-15
Ch500-14
Ch500-13
Ch500-12
Ch500-11
Ch500-10
Ch500-09
Ch500-08
Ch500-07
Ch500-06
Ch500-05
Ch500-04
Ch500-03
Ch500-02
Ch500-01
bvol_t3bvol_t3
HCS30
13
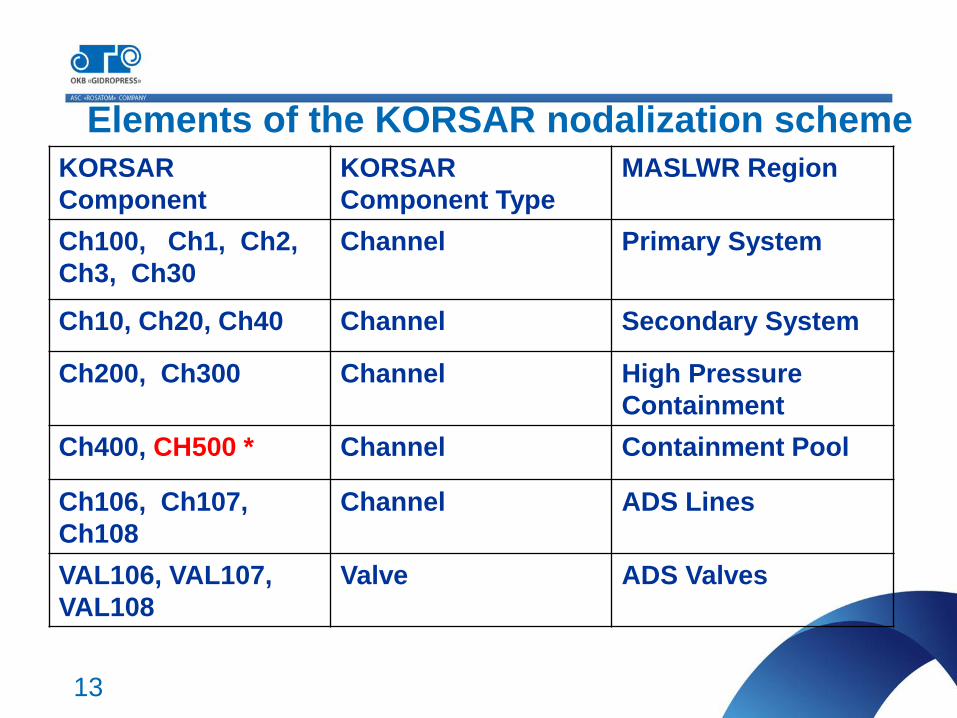
Elements of the KORSAR nodalization scheme
KORSAR
Component
KORSAR
Component Type
MASLWR Region
Ch100, Ch1, Ch2,
Ch3, Ch30
Channel
Primary System
Ch10, Ch20, Ch40 Channel Secondary System
Ch200, Ch300 Channel High Pressure
Containment
Ch400, CH500 * Channel Containment Pool
Ch106, Ch107,
Ch108
Channel ADS Lines
VAL106, VAL107,
VAL108
Valve ADS Valves
14
Elements of the KORSAR nodalization scheme
KORSAR
Component
KORSAR
Component Type
MASLWR Region
HCS1 Heat structure Core Heater Rods
HCS4,
HCS3, HCS22,
HCS25
Heat structure RPV Wall
RPV Features
HCS10 Heat structure SG tubes
HCS20, HCS23,
HCS24
Heat structure Steam Drum
HCS40 Heat structure Steam Line Wall
HCS200, HCS201 Heat structure HPC Wall
15
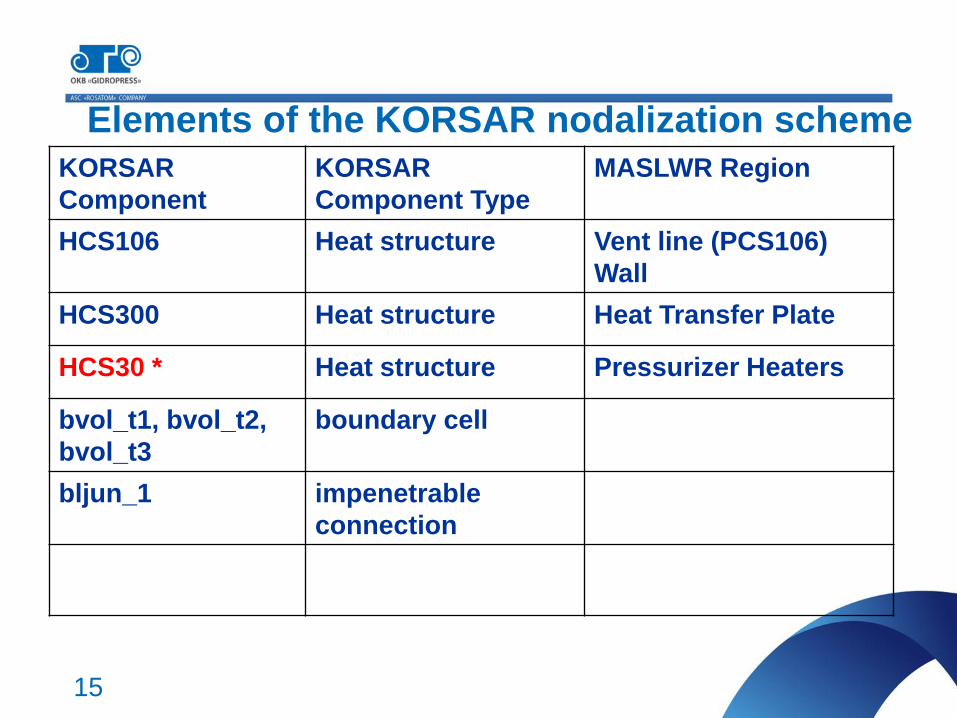
Elements of the KORSAR nodalization scheme
KORSAR
Component
KORSAR
Component Type
MASLWR Region
HCS106 Heat structure Vent line (PCS106)
Wall
HCS300 Heat structure Heat Transfer Plate
HCS30 * Heat structure Pressurizer Heaters
bvol_t1, bvol_t2,
bvol_t3
boundary cell
bljun_1 impenetrable
connection
16
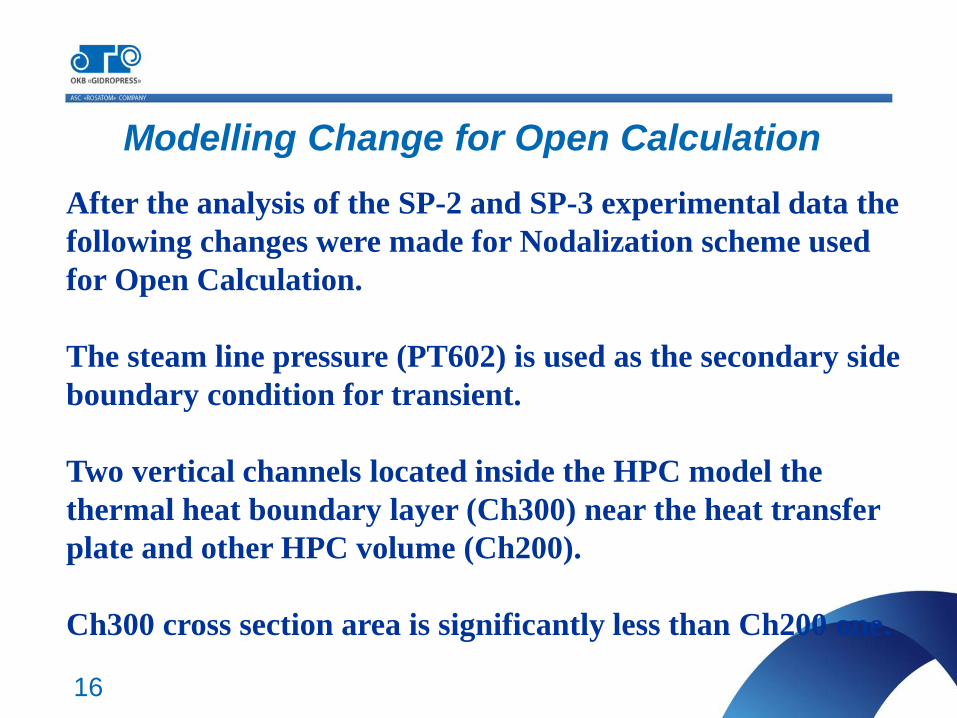
After the analysis of the SP-2 and SP-3 experimental data the
following changes were made for Nodalization scheme used
for Open Calculation.
The steam line pressure (PT602) is used as the secondary side
boundary condition for transient.
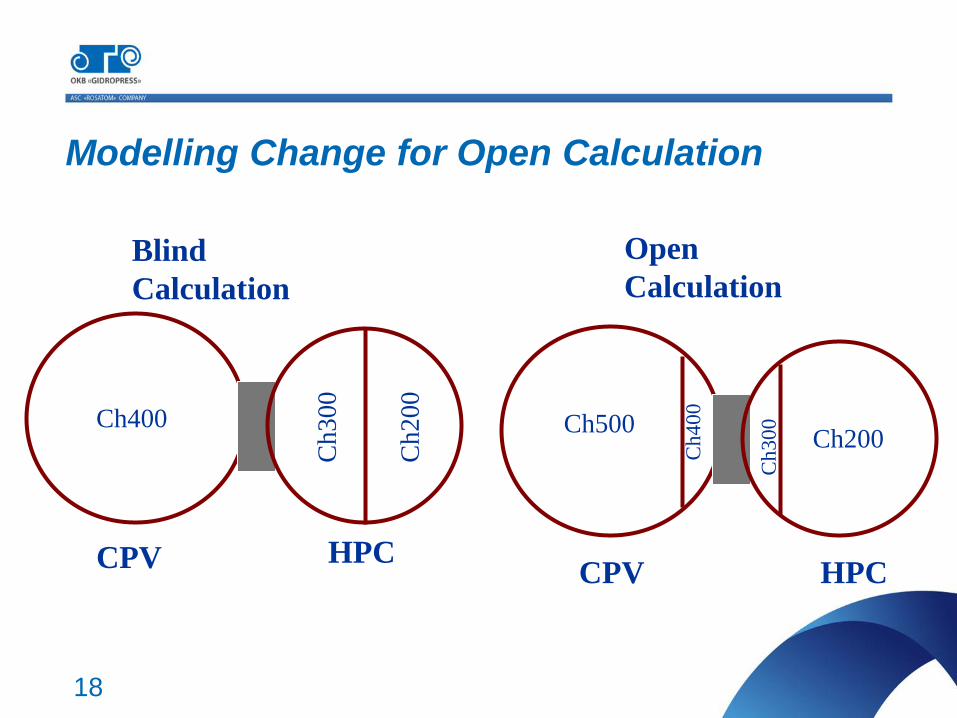
Two vertical channels located inside the HPC model the
thermal heat boundary layer (Ch300) near the heat transfer
plate and other HPC volume (Ch200).
Ch300 cross section area is significantly less than Ch200 one.
Modelling Change for Open Calculation
17
Two channels located inside the cooling pool vessel model the
thermal heat boundary layer near the heat transfer plate
(Ch400) and other CPV volume (Ch500).
The elements of the channels Ch400 and Ch500 are
connected by the junctions.
Ch400 cross section area is significantly less than Ch500 one.
Heat transfer plate is modeled as two dimensional heat
structure.
The pressurizer heaters and additional heat losses are
modeled for SP-3 Open Calculation.
Modelling Change for Open Calculation
18
Ch500
Ch
40
0
Ch200
Ch
30
0 Ch400
Ch
30
0
Ch
20
0
HPC HPC CPV
CPV
Modelling Change for Open Calculation
Blind
Calculation
Open
Calculation
19
SP-2 Control Logic 1/2
Control logic was realized in conformance to 1.SP_2_and
SP_3_Prosedures (OSU-MASLWR-10005-R1, App. C).
SP-2
The core power and feed water flow rate are equal to initial
values if time less than steady-time.
If time is equal to steady-time or grater it the feed water
flow to SG is stopped, RPV pressure boundary condition
(for ch3) is changed on impenetrable connection.
After the time when PZR pressure (PT-301) reaches
9.063 MPa, power change is set by the tables from
3. ICSP_SP2_CorePower.xls.
20
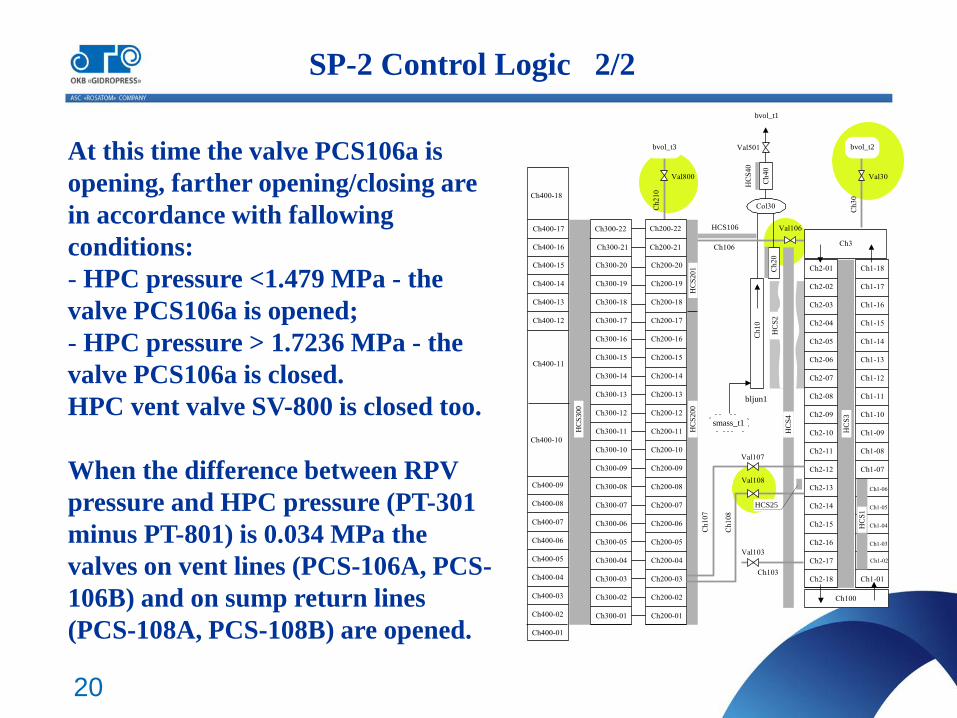
SP-2 Control Logic 2/2
At this time the valve PCS106a is
opening, farther opening/closing are
in accordance with fallowing
conditions:
- HPC pressure <1.479 MPa - the
valve PCS106a is opened;
- HPC pressure > 1.7236 MPa - the
valve PCS106a is closed.
HPC vent valve SV-800 is closed too.
When the difference between RPV
pressure and HPC pressure (PT-301
minus PT-801) is 0.034 MPa the
valves on vent lines (PCS-106A, PCS-
106B) and on sump return lines
(PCS-108A, PCS-108B) are opened.
Val800
bljun1
Val107
Ch107
Ch108
Val108
Val103
Ch103
Val106
Ch106
Ch210
Val30
Ch30
smass_t1
bvol_t3
HC
S3
Ch2-01
Ch2-02
Ch2-03
Ch2-04
Ch2-05
Ch2-06
Ch2-07
Ch2-08
Ch2-09
Ch2-10
Ch2-11
Ch2-12
Ch2-13
Ch2-14
Ch2-15
Ch2-16
Ch2-17
Ch2-18
Ch1-18
Ch1-17
Ch1-16
Ch1-15
Ch1-14
Ch1-13
Ch1-12
Ch1-11
Ch1-10
Ch1-09
Ch1-08
Ch1-07
Ch1-06
Ch1-05
Ch1-04
Ch1-03
Ch1-02
Ch1-01
HC
S1
Ch100
Ch3
Ch10
Ch20
Col30
HCS40
HC
S2
HC
S4
bvol_t1
bvol_t2
Ch400-18
Ch400-17
Ch400-16
Ch400-15
Ch400-14
Ch400-13
Ch400-12
Ch400-11
Ch400-10
Ch400-09
Ch400-08
Ch400-07
Ch400-06
Ch400-05
Ch400-04
Ch400-03
Ch400-02
Ch400-01
Ch300-20
Ch300-19
Ch300-18
Ch300-17
Ch300-16
Ch300-15
Ch300-14
Ch300-13
Ch300-12
Ch300-11
Ch300-10
Ch300-09
Ch300-08
Ch300-07
Ch300-06
Ch300-05
Ch300-04
Ch300-03
Ch300-02
Ch300-01
Ch200-20
Ch200-19
Ch200-18
Ch200-17
Ch200-16
Ch200-15
Ch200-14
Ch200-13
Ch200-12
Ch200-11
Ch200-10
Ch200-09
Ch200-08
Ch200-07
Ch200-06
Ch200-05
Ch200-04
Ch200-03
Ch200-02
Ch200-01
HC
S300
Ch200-21Ch300-21
Ch300-22 Ch200-22
HC
S201
HC
S200
HCS106
Val501
Ch40
HCS25
21
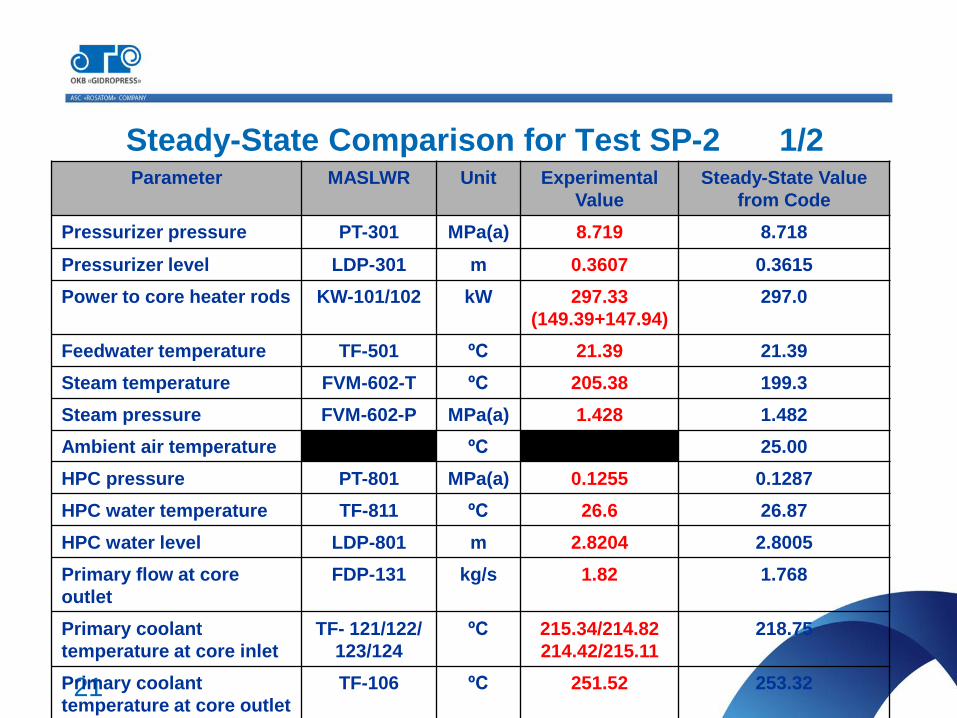
Steady-State Comparison for Test SP-2 1/2 Parameter MASLWR Unit Experimental
Value
Steady-State Value
from Code
Pressurizer pressure PT-301 MPa(a) 8.719 8.718
Pressurizer level LDP-301 m 0.3607 0.3615
Power to core heater rods KW-101/102 kW 297.33
(149.39+147.94)
297.0
Feedwater temperature TF-501 ºC 21.39 21.39
Steam temperature FVM-602-T ºC 205.38 199.3
Steam pressure FVM-602-P MPa(a) 1.428 1.482
Ambient air temperature ºC 25.00
HPC pressure PT-801 MPa(a) 0.1255 0.1287
HPC water temperature TF-811 ºC 26.6 26.87
HPC water level LDP-801 m 2.8204 2.8005
Primary flow at core
outlet
FDP-131 kg/s 1.82 1.768
Primary coolant
temperature at core inlet
TF- 121/122/
123/124
ºC 215.34/214.82
214.42/215.11
218.75
Primary coolant
temperature at core outlet
TF-106 ºC 251.52 253.32
22
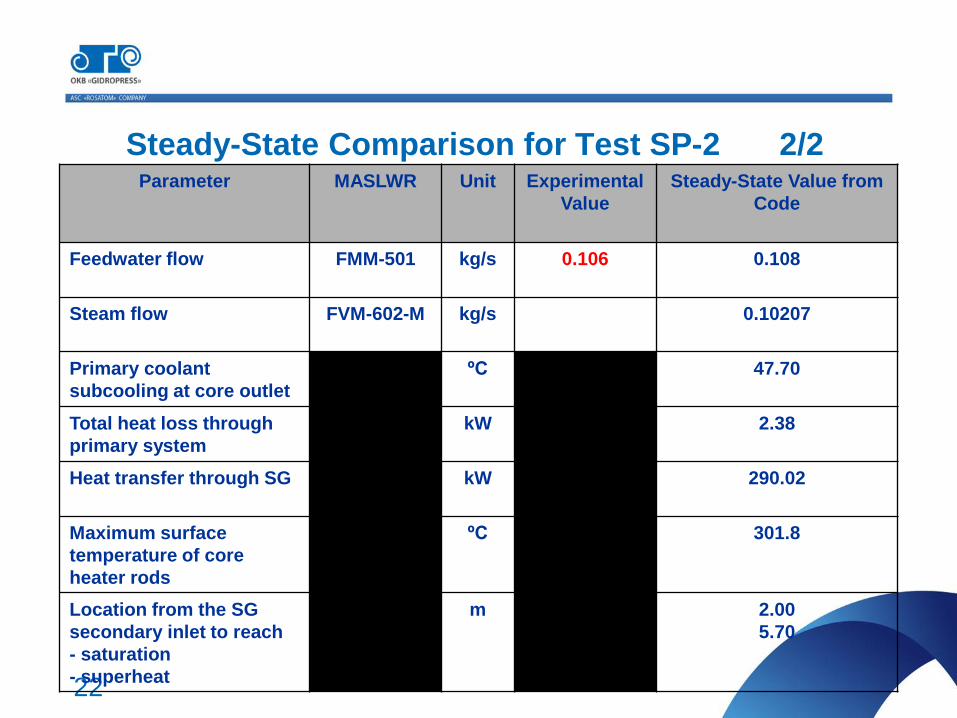
Steady-State Comparison for Test SP-2 2/2 Parameter MASLWR Unit Experimental
Value
Steady-State Value from
Code
Feedwater flow FMM-501 kg/s 0.106 0.108
Steam flow FVM-602-M kg/s 0.10207
Primary coolant
subcooling at core outlet
ºC 47.70
Total heat loss through
primary system
kW 2.38
Heat transfer through SG kW 290.02
Maximum surface
temperature of core
heater rods
ºC 301.8
Location from the SG
secondary inlet to reach
- saturation
- superheat
m 2.00
5.70
23
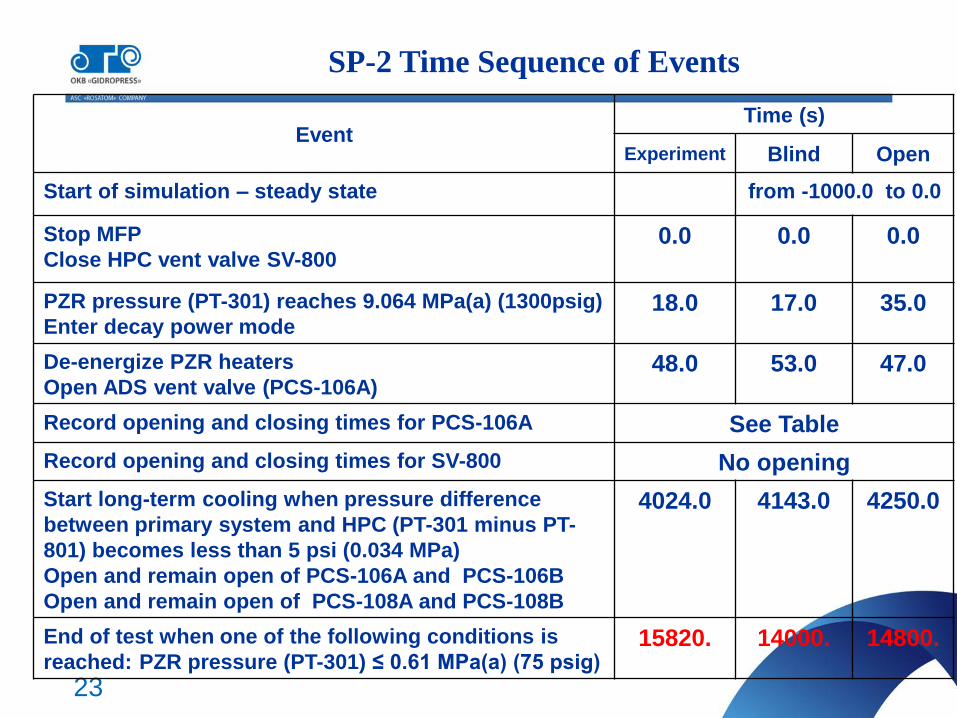
SP-2 Time Sequence of Events
Event Time (s)
Experiment Blind Open
Start of simulation – steady state from -1000.0 to 0.0
Stop MFP
Close HPC vent valve SV-800 0.0
0.0 0.0
PZR pressure (PT-301) reaches 9.064 MPa(a) (1300psig)
Enter decay power mode 18.0 17.0 35.0
De-energize PZR heaters
Open ADS vent valve (PCS-106A) 48.0 53.0 47.0
Record opening and closing times for PCS-106A See Table
Record opening and closing times for SV-800 No opening
Start long-term cooling when pressure difference
between primary system and HPC (PT-301 minus PT-
801) becomes less than 5 psi (0.034 MPa)
Open and remain open of PCS-106A and PCS-106B
Open and remain open of PCS-108A and PCS-108B
4024.0 4143.0 4250.0
End of test when one of the following conditions is
reached: PZR pressure (PT-301) ≤ 0.61 MPa(a) (75 psig) 15820. 14000. 14800.
24
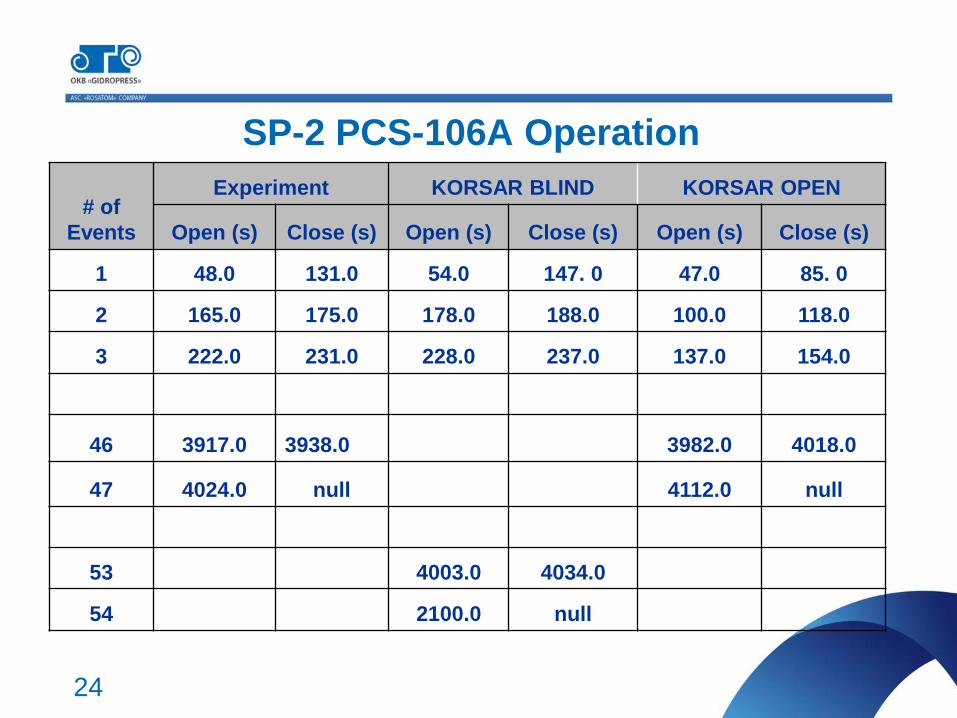
SP-2 PCS-106A Operation
# of
Events
Experiment KORSAR BLIND KORSAR OPEN
Open (s) Close (s) Open (s) Close (s) Open (s) Close (s)
1 48.0 131.0 54.0 147. 0 47.0 85. 0
2 165.0 175.0 178.0 188.0 100.0 118.0
3 222.0 231.0 228.0 237.0 137.0 154.0
46 3917.0 3938.0 3982.0 4018.0
47 4024.0 null 4112.0 null
53 4003.0 4034.0
54 2100.0 null
Table 4 SP-2 PCS-106A Operation
25
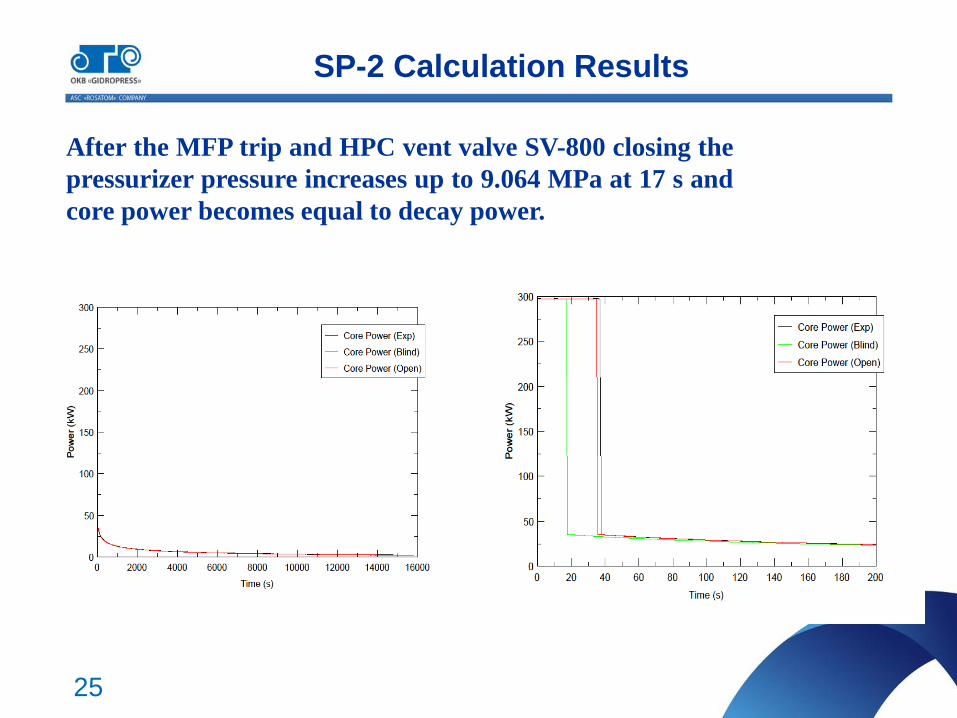
SP-2 Calculation Results
After the MFP trip and HPC vent valve SV-800 closing the
pressurizer pressure increases up to 9.064 MPa at 17 s and
core power becomes equal to decay power.
26
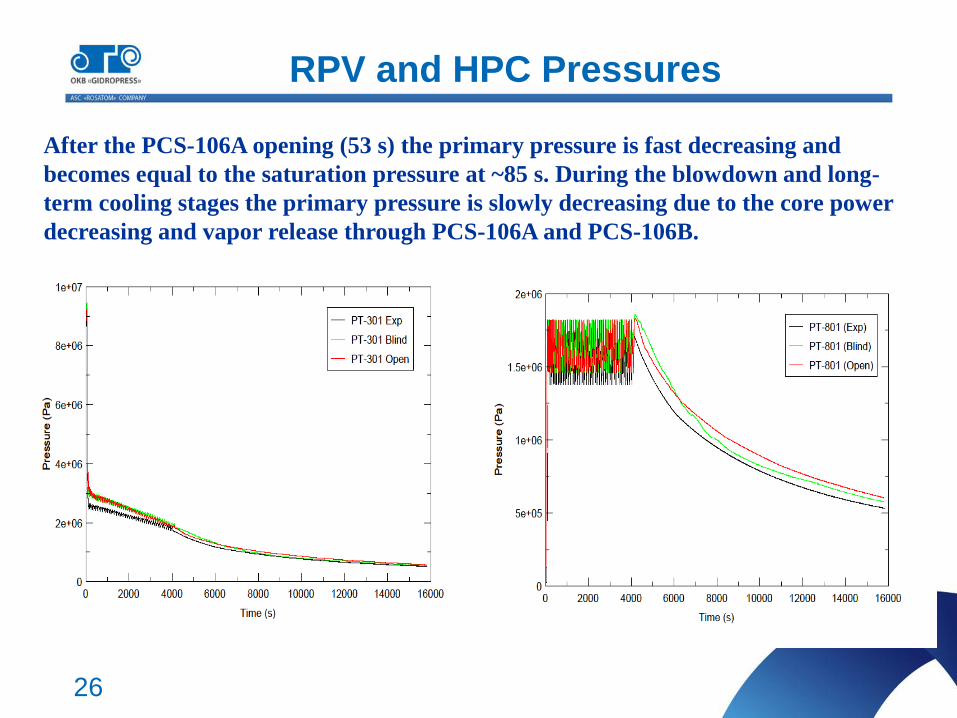
RPV and HPC Pressures
After the PCS-106A opening (53 s) the primary pressure is fast decreasing and
becomes equal to the saturation pressure at ~85 s. During the blowdown and long-
term cooling stages the primary pressure is slowly decreasing due to the core power
decreasing and vapor release through PCS-106A and PCS-106B.
27
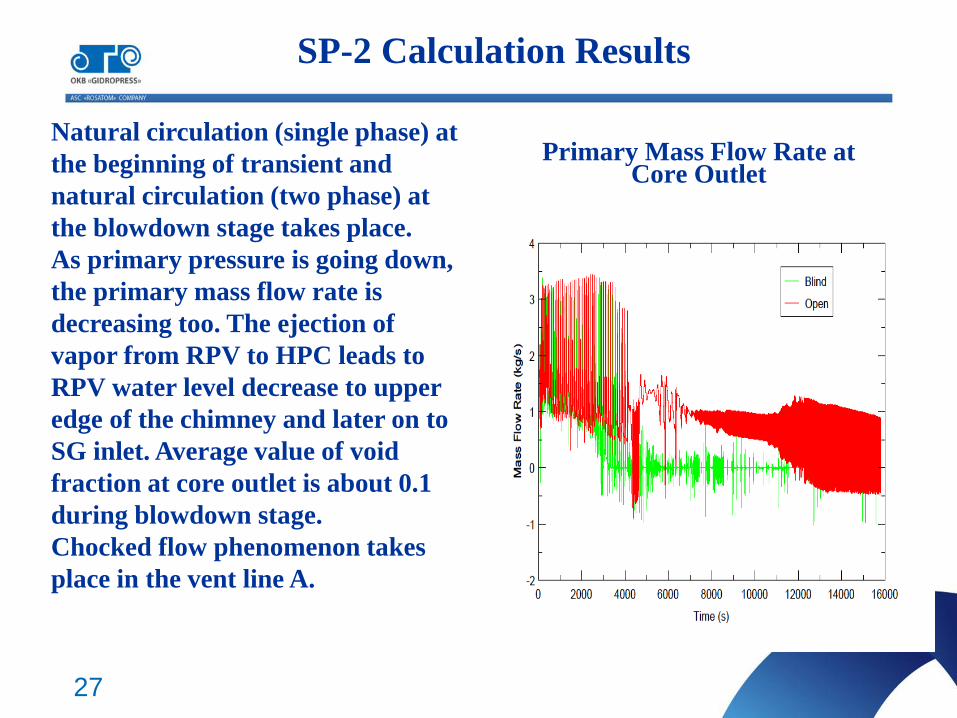
Primary Mass Flow Rate at Core Outlet
Natural circulation (single phase) at
the beginning of transient and
natural circulation (two phase) at
the blowdown stage takes place.
As primary pressure is going down,
the primary mass flow rate is
decreasing too. The ejection of
vapor from RPV to HPC leads to
RPV water level decrease to upper
edge of the chimney and later on to
SG inlet. Average value of void
fraction at core outlet is about 0.1
during blowdown stage.
Chocked flow phenomenon takes
place in the vent line A.
SP-2 Calculation Results
28
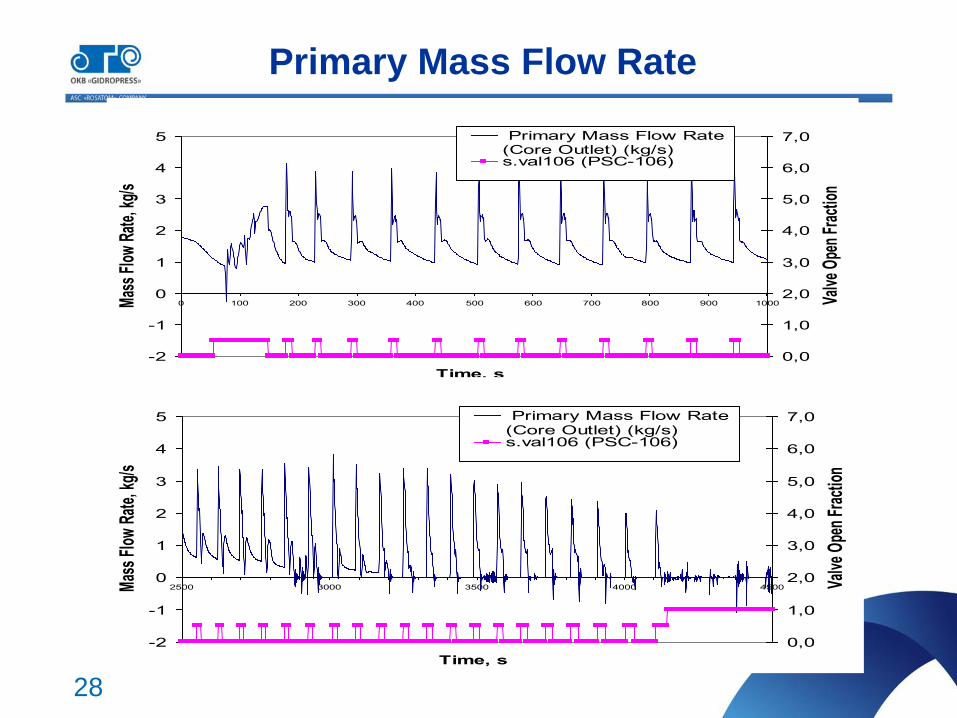
Primary Mass Flow Rate
-2
-1
0
1
2
3
4
5
0 100 200 300 400 500 600 700 800 900 1000
Time, s
Mas
s Fl
ow R
ate,
kg/
s
0,0
1,0
2,0
3,0
4,0
5,0
6,0
7,0
Valv
e O
pen
Frac
tion
Primary Mass Flow Rate(Core Outlet) (kg/s) s.val106 (PSC-106)
-2
-1
0
1
2
3
4
5
2500 3000 3500 4000 4500
Time, s
Mas
s Fl
ow R
ate,
kg/
s
0,0
1,0
2,0
3,0
4,0
5,0
6,0
7,0
Valv
e O
pen
Frac
tion
Primary Mass Flow Rate(Core Outlet) (kg/s) s.val106 (PSC-106)
29
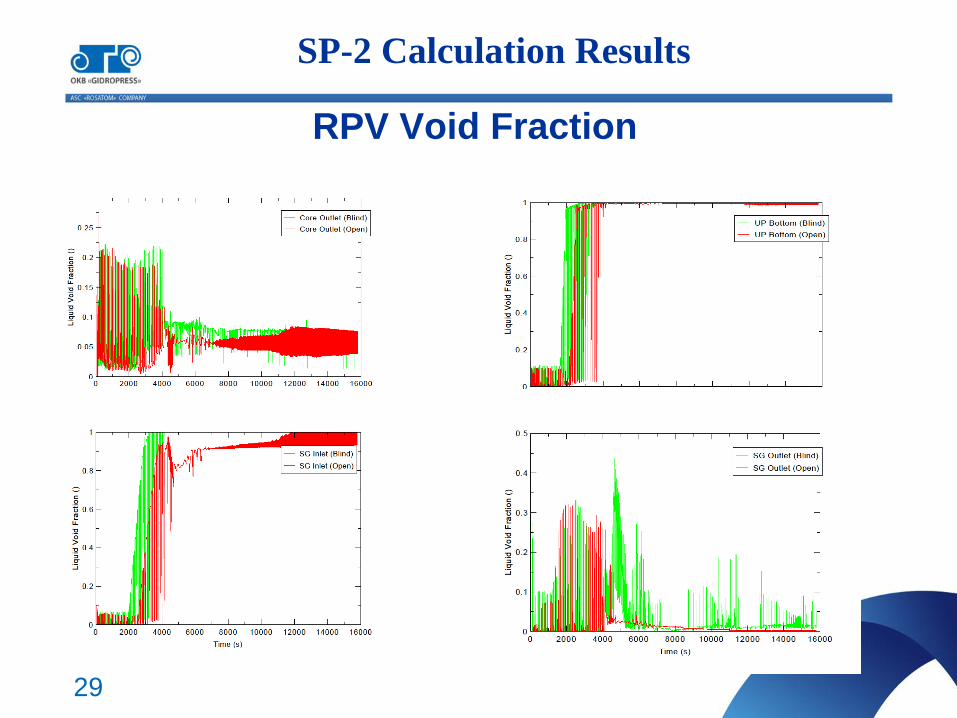
RPV Void Fraction
SP-2 Calculation Results
30
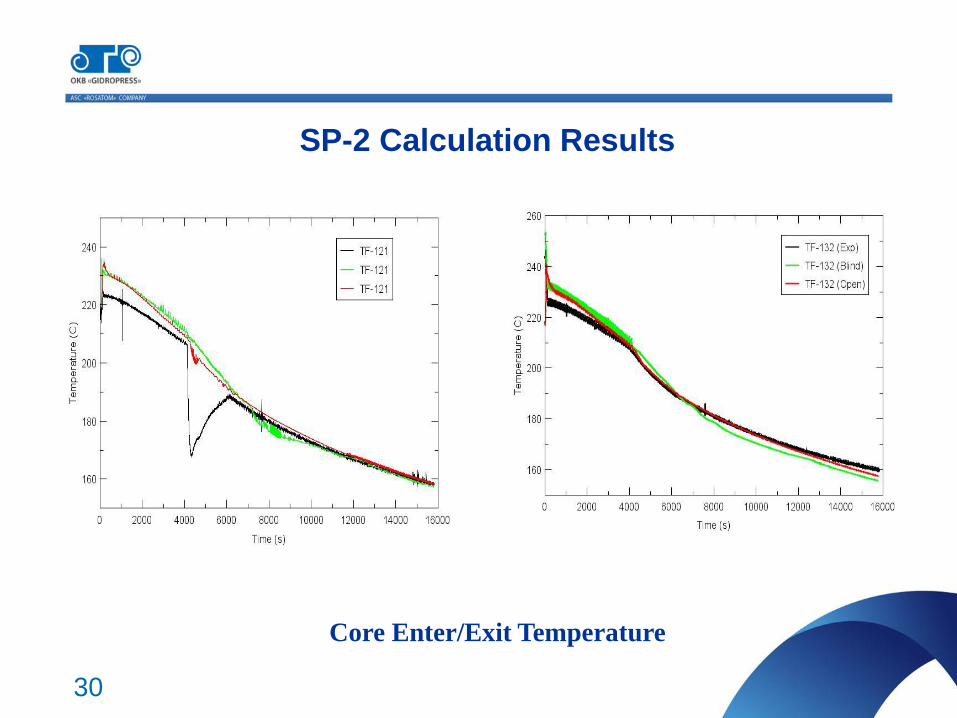
SP-2 Calculation Results
Core Enter/Exit Temperature
31
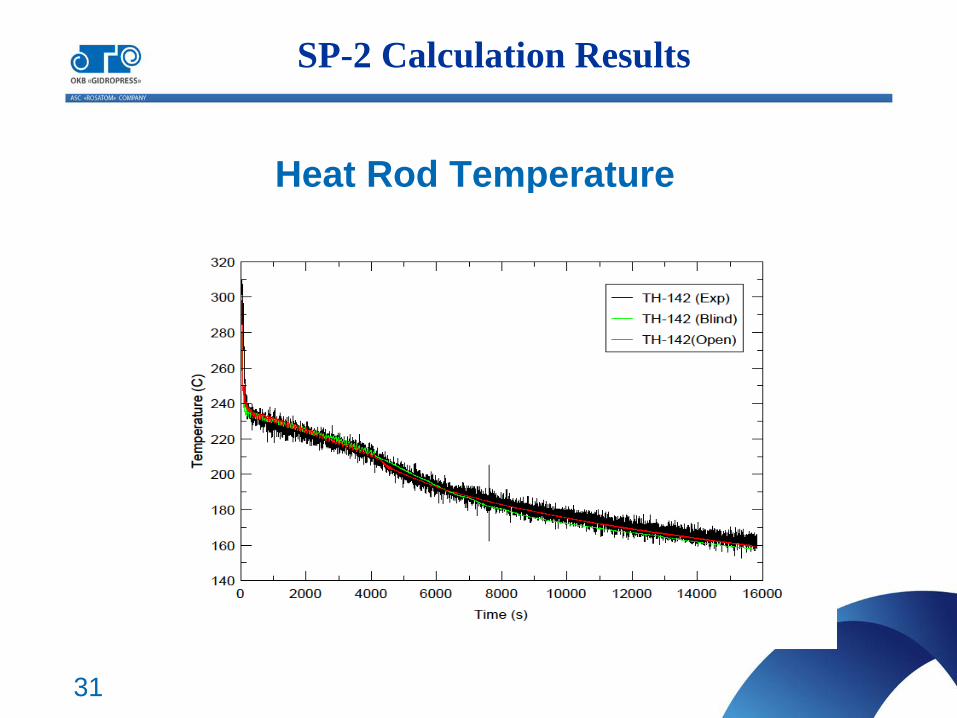
Heat Rod Temperature
SP-2 Calculation Results
32
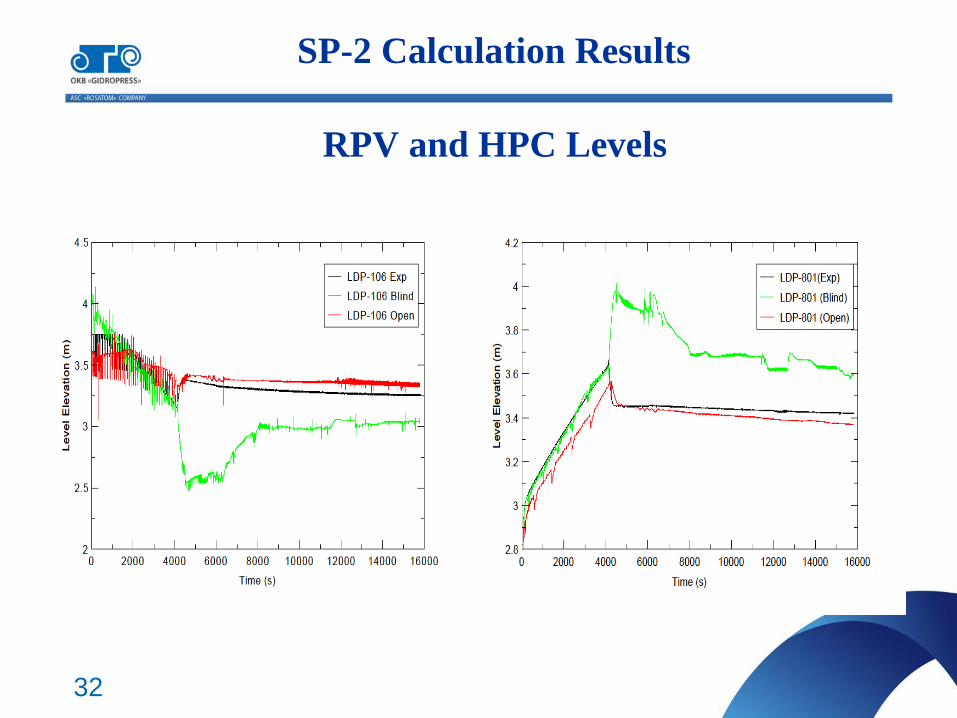
RPV and HPC Levels
SP-2 Calculation Results
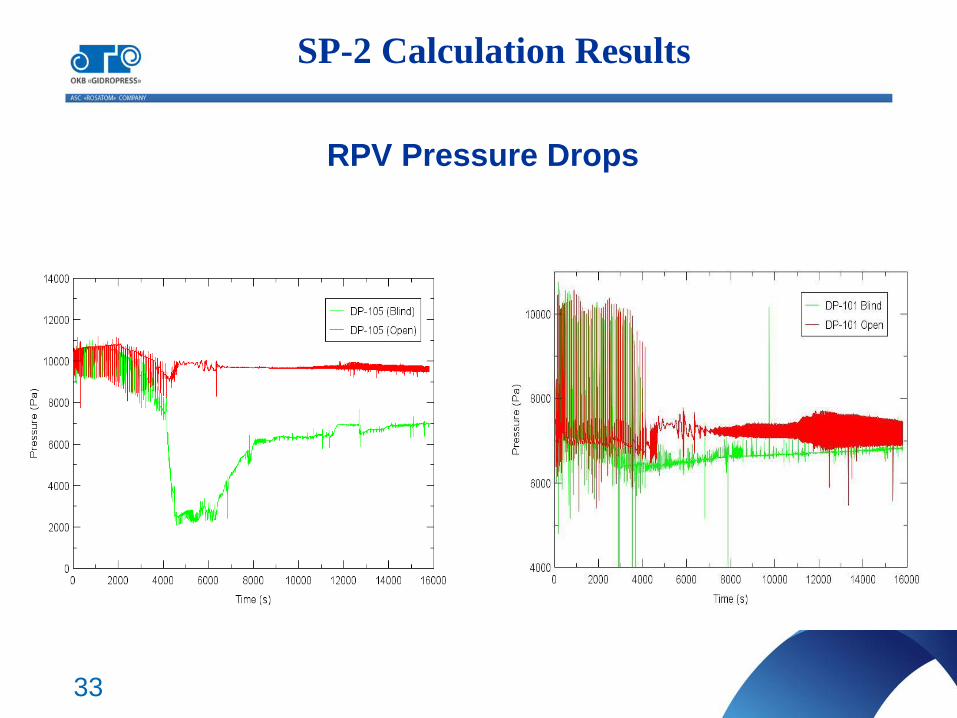
33
RPV Pressure Drops
SP-2 Calculation Results
34
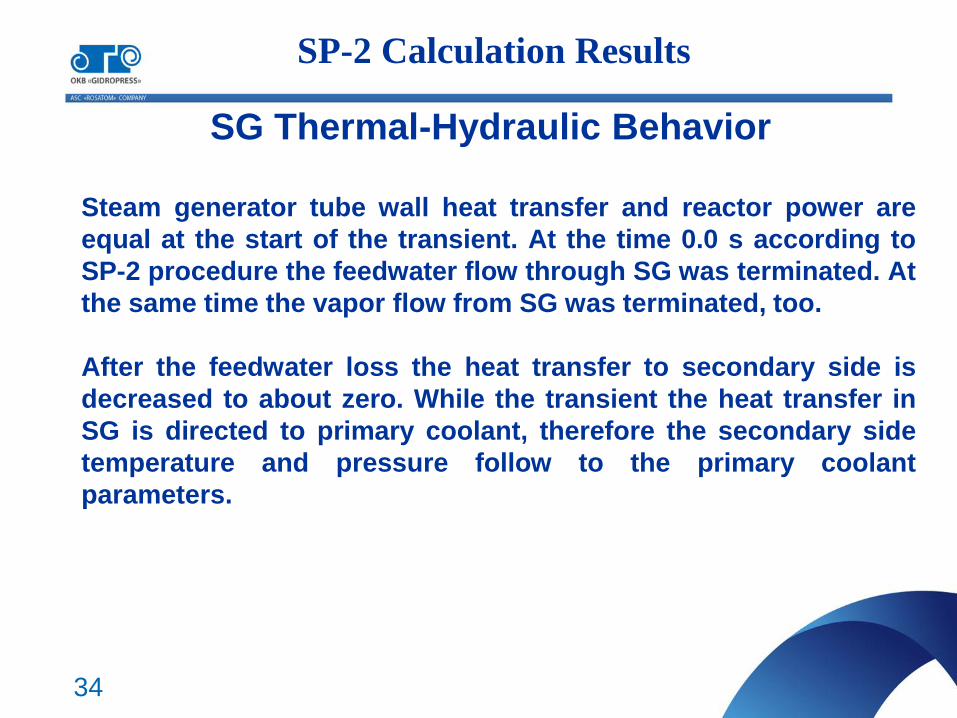
SG Thermal-Hydraulic Behavior
Steam generator tube wall heat transfer and reactor power are
equal at the start of the transient. At the time 0.0 s according to
SP-2 procedure the feedwater flow through SG was terminated. At
the same time the vapor flow from SG was terminated, too.
After the feedwater loss the heat transfer to secondary side is
decreased to about zero. While the transient the heat transfer in
SG is directed to primary coolant, therefore the secondary side
temperature and pressure follow to the primary coolant
parameters.
SP-2 Calculation Results
35
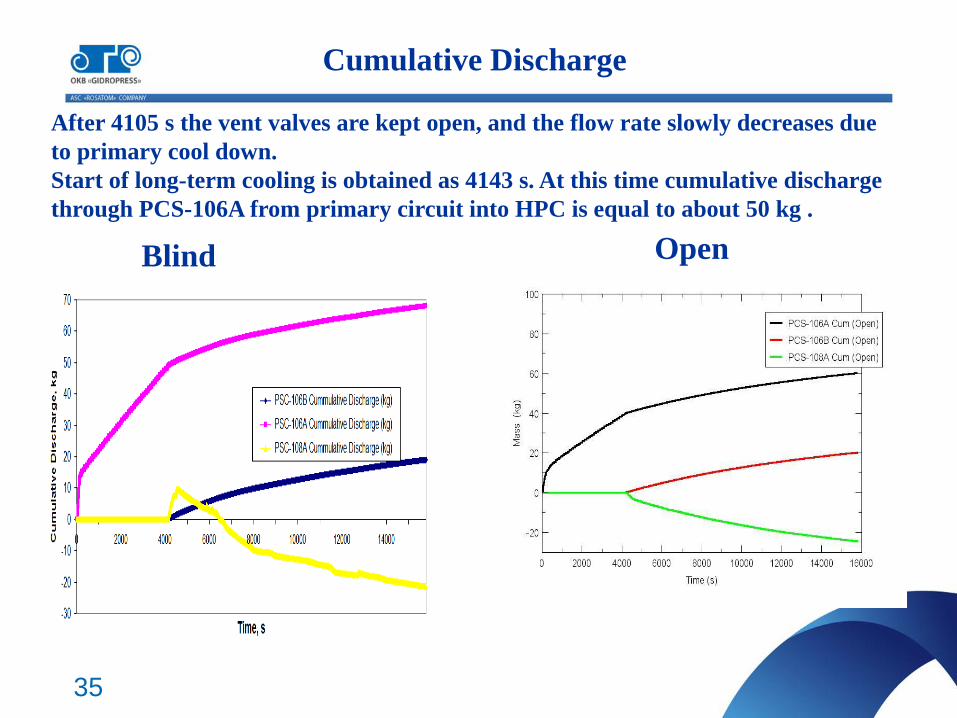
Cumulative Discharge
After 4105 s the vent valves are kept open, and the flow rate slowly decreases due
to primary cool down.
Start of long-term cooling is obtained as 4143 s. At this time cumulative discharge
through PCS-106A from primary circuit into HPC is equal to about 50 kg .
Blind Open
36
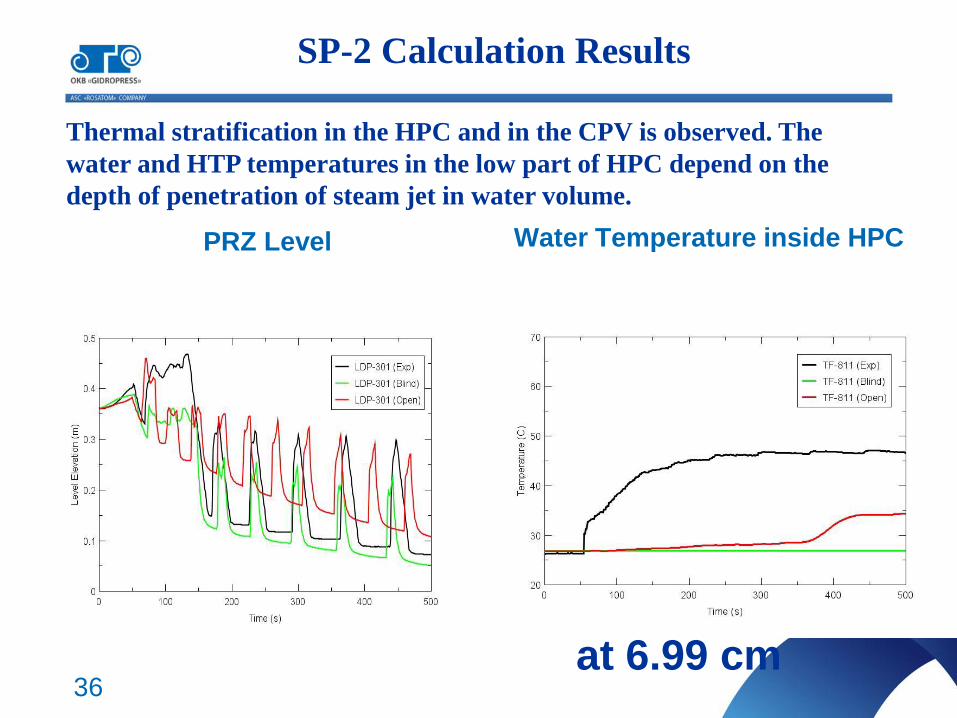
HPC Water Temperature at
at 6.99 cm
Water Temperature inside HPC PRZ Level
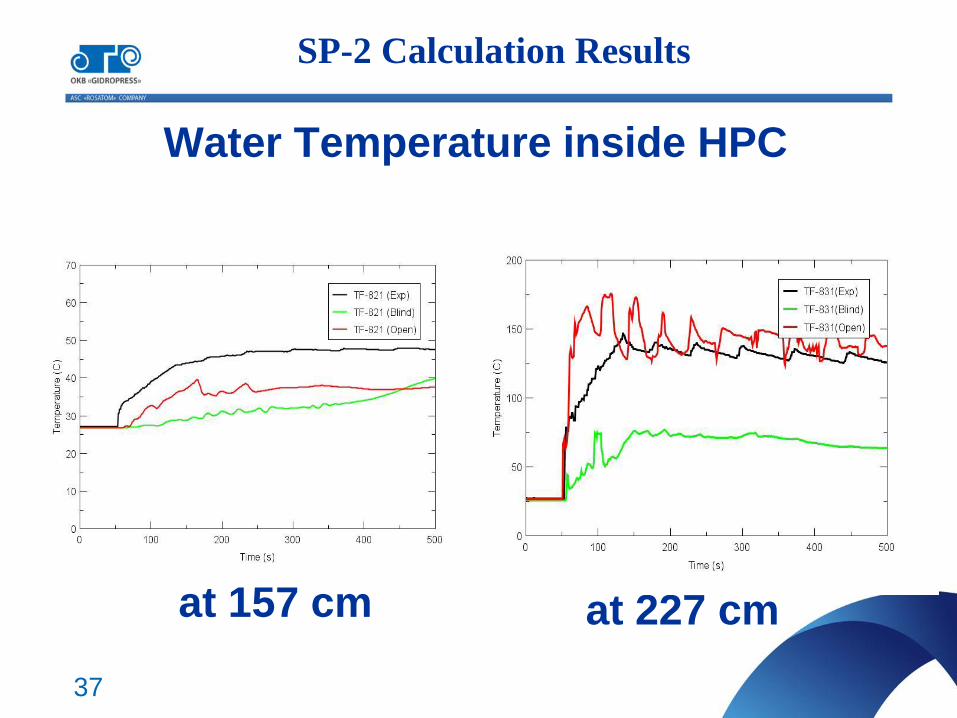
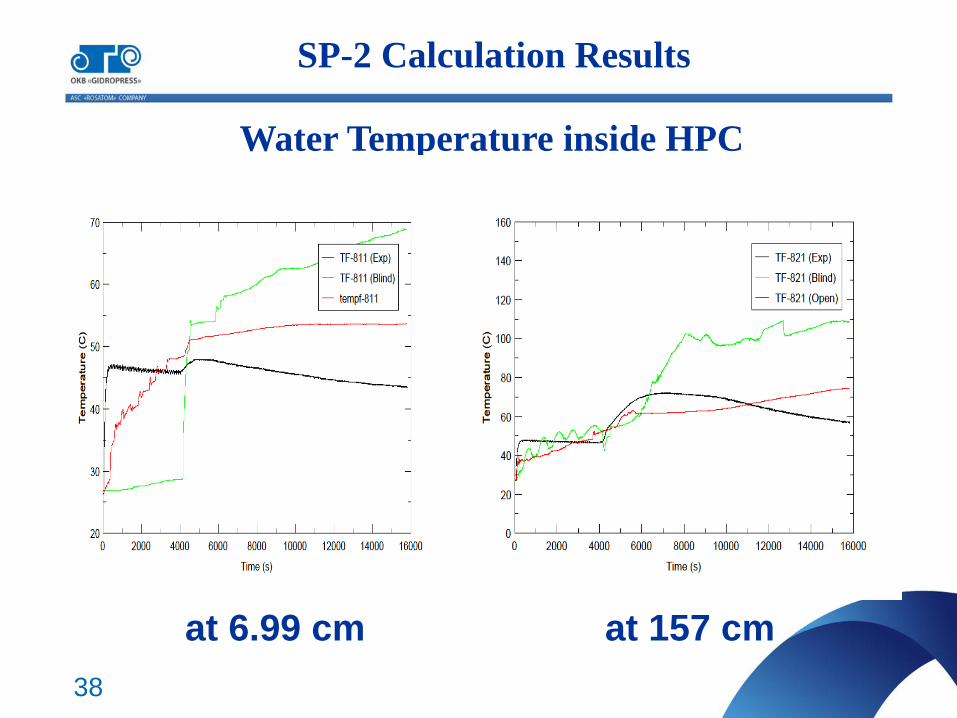
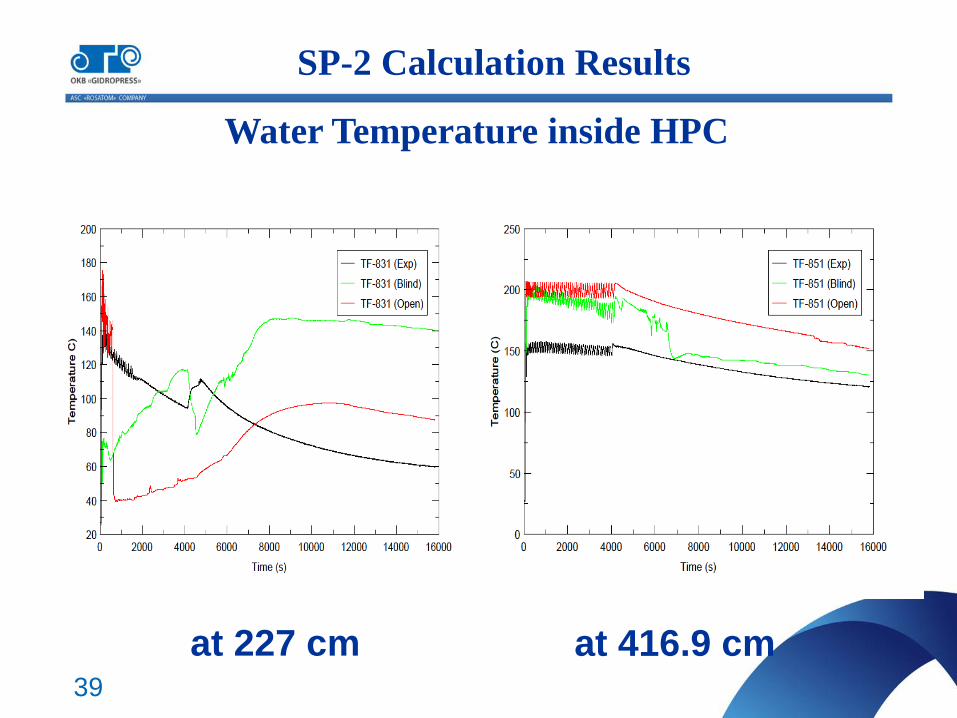
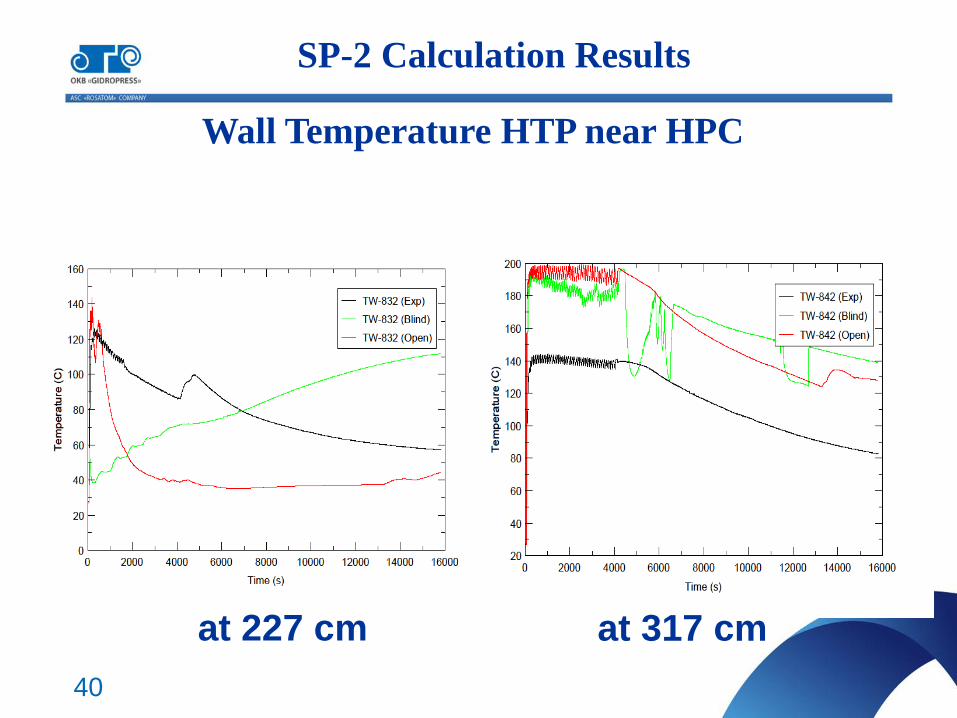
Thermal stratification in the HPC and in the CPV is observed. The
water and HTP temperatures in the low part of HPC depend on the
depth of penetration of steam jet in water volume.
SP-2 Calculation Results
37
Water Temperature inside HPC
at 157 cm at 227 cm
SP-2 Calculation Results
38
Water Temperature inside HPC
at 6.99 cm at 157 cm
SP-2 Calculation Results
39
Water Temperature inside HPC
at 227 cm at 416.9 cm
SP-2 Calculation Results
40
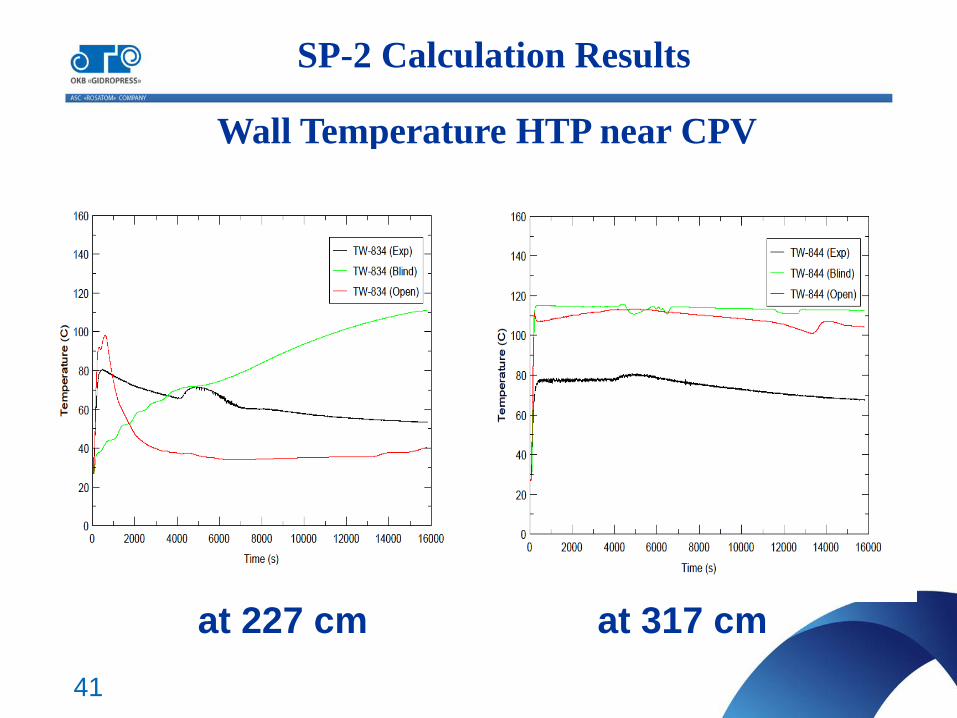
Wall Temperature HTP near HPC
at 227 cm at 317 cm
SP-2 Calculation Results
41
Wall Temperature HTP near CPV
at 227 cm at 317 cm
SP-2 Calculation Results
42
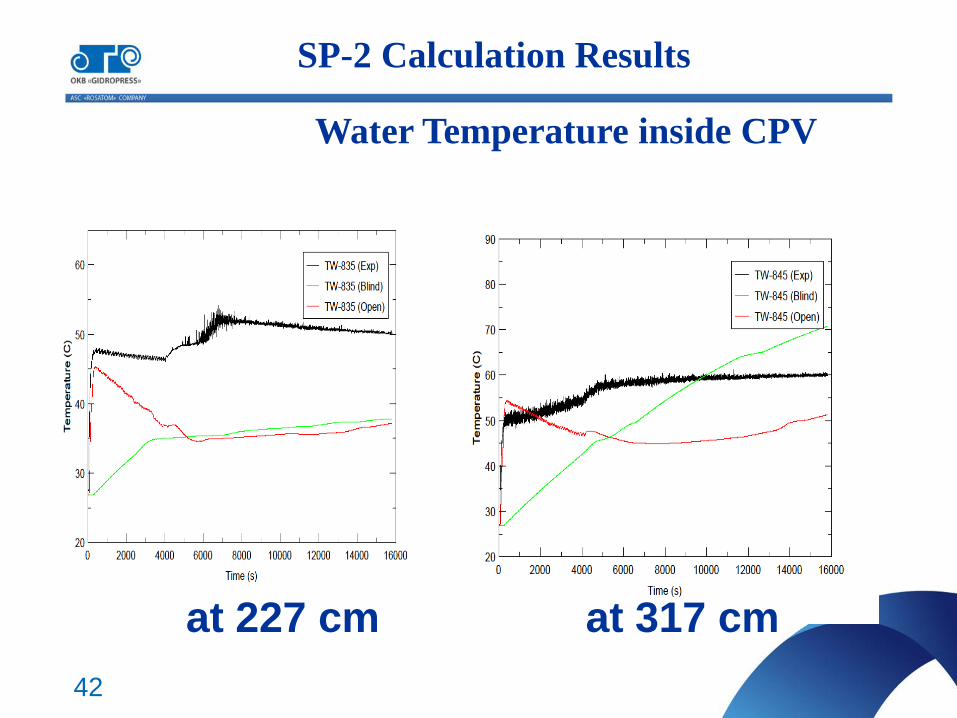
Water Temperature inside CPV
at 227 cm at 317 cm
SP-2 Calculation Results
43
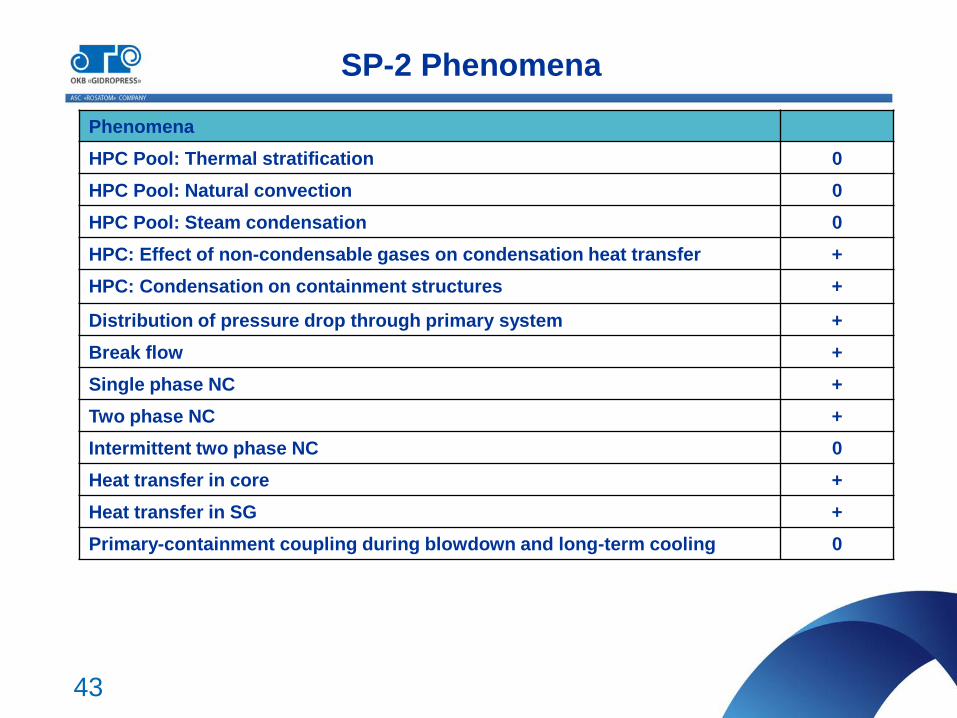
SP-2 Phenomena
Phenomena
HPC Pool: Thermal stratification 0
HPC Pool: Natural convection 0
HPC Pool: Steam condensation 0
HPC: Effect of non-condensable gases on condensation heat transfer +
HPC: Condensation on containment structures +
Distribution of pressure drop through primary system +
Break flow +
Single phase NC +
Two phase NC +
Intermittent two phase NC 0
Heat transfer in core +
Heat transfer in SG +
Primary-containment coupling during blowdown and long-term cooling 0
44
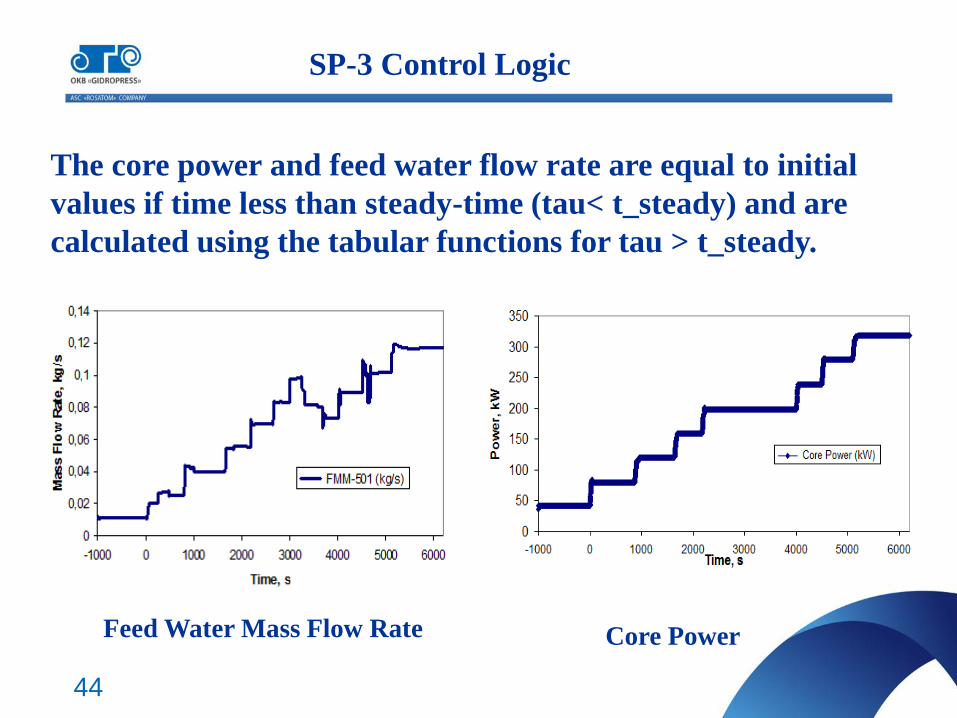
SP-3 Control Logic
The core power and feed water flow rate are equal to initial
values if time less than steady-time (tau< t_steady) and are
calculated using the tabular functions for tau > t_steady.
Feed Water Mass Flow Rate Core Power
45
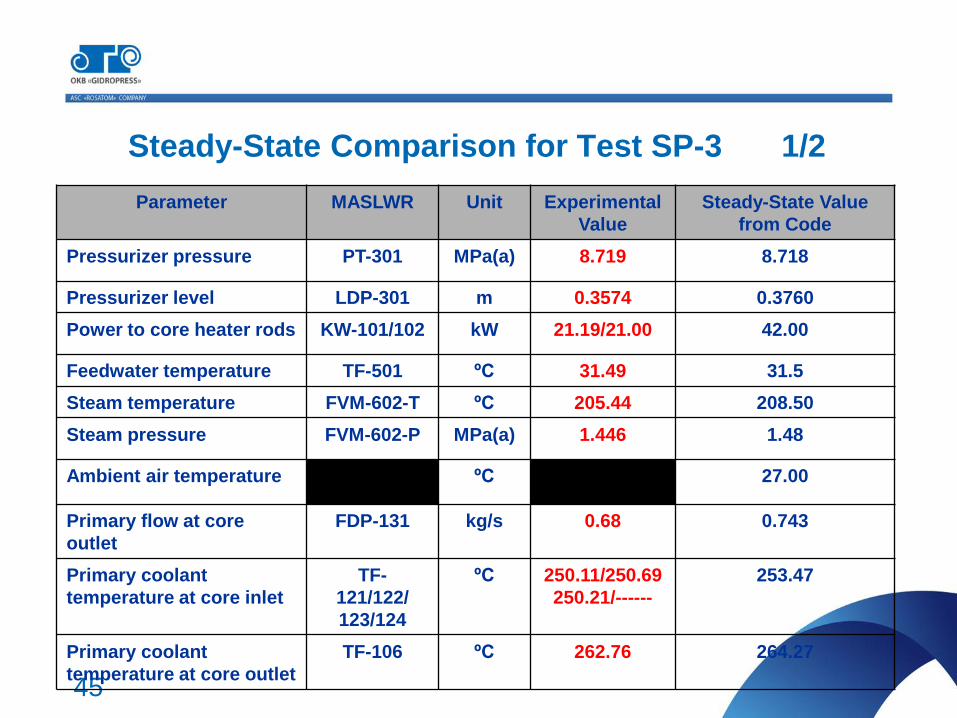
Steady-State Comparison for Test SP-3 1/2
Parameter MASLWR Unit Experimental
Value
Steady-State Value
from Code
Pressurizer pressure PT-301 MPa(a) 8.719 8.718
Pressurizer level LDP-301 m 0.3574 0.3760
Power to core heater rods KW-101/102 kW 21.19/21.00 42.00
Feedwater temperature TF-501 ºC 31.49 31.5
Steam temperature FVM-602-T ºC 205.44 208.50
Steam pressure FVM-602-P MPa(a) 1.446 1.48
Ambient air temperature ºC 27.00
Primary flow at core
outlet
FDP-131 kg/s 0.68 0.743
Primary coolant
temperature at core inlet
TF-
121/122/
123/124
ºC 250.11/250.69
250.21/------
253.47
Primary coolant
temperature at core outlet
TF-106 ºC 262.76 264.27
46
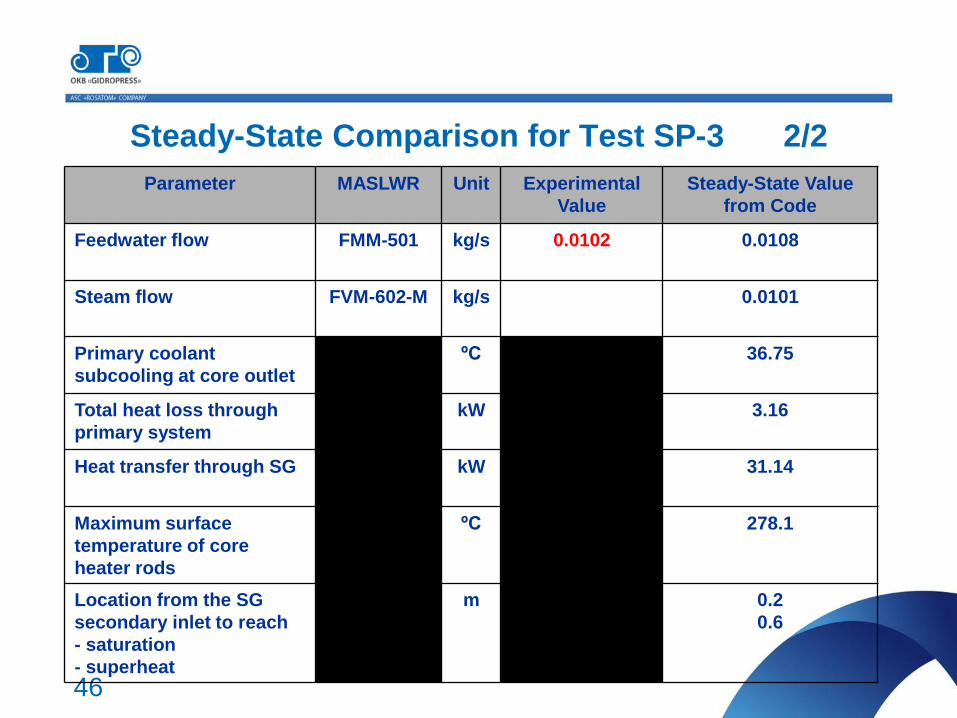
Steady-State Comparison for Test SP-3 2/2
Parameter MASLWR Unit Experimental
Value
Steady-State Value
from Code
Feedwater flow FMM-501 kg/s 0.0102 0.0108
Steam flow FVM-602-M kg/s 0.0101
Primary coolant
subcooling at core outlet
ºC 36.75
Total heat loss through
primary system
kW 3.16
Heat transfer through SG kW 31.14
Maximum surface
temperature of core
heater rods
ºC 278.1
Location from the SG
secondary inlet to reach
- saturation
- superheat
m 0.2
0.6
47
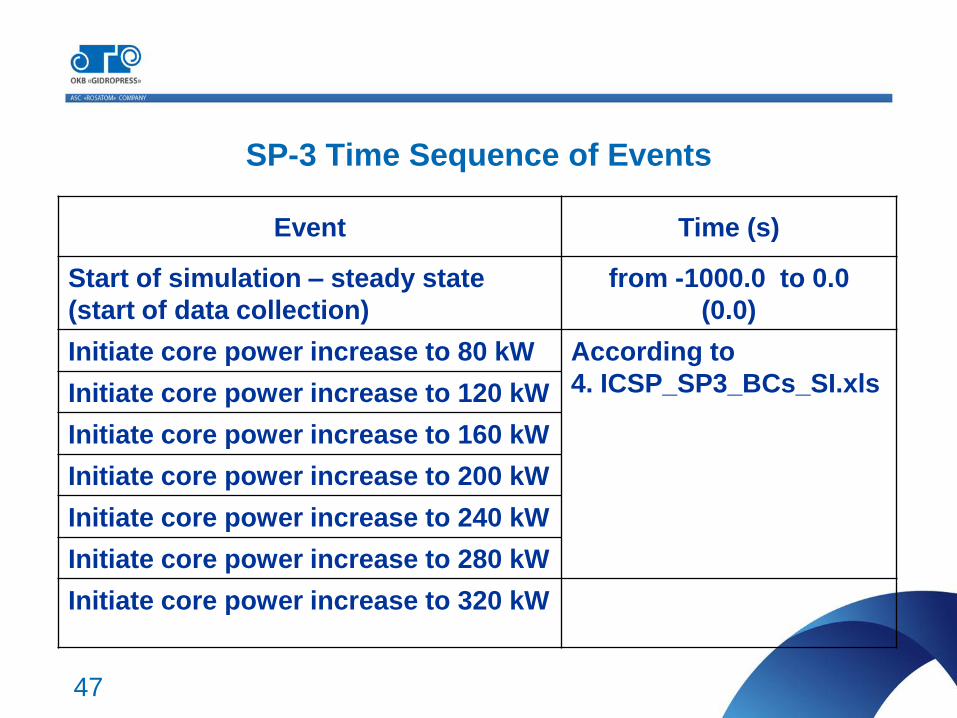
SP-3 Time Sequence of Events
Event Time (s)
Start of simulation – steady state
(start of data collection)
from -1000.0 to 0.0
(0.0)
Initiate core power increase to 80 kW According to
4. ICSP_SP3_BCs_SI.xls Initiate core power increase to 120 kW
Initiate core power increase to 160 kW
Initiate core power increase to 200 kW
Initiate core power increase to 240 kW
Initiate core power increase to 280 kW
Initiate core power increase to 320 kW
48
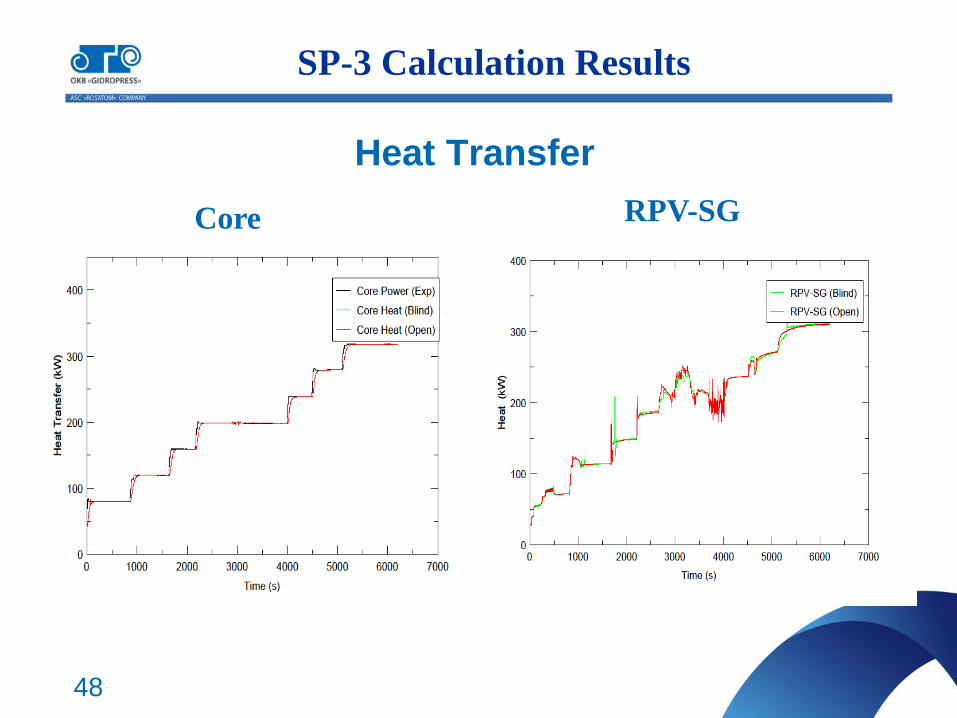
Heat Transfer
RPV-SG Core
SP-3 Calculation Results
49
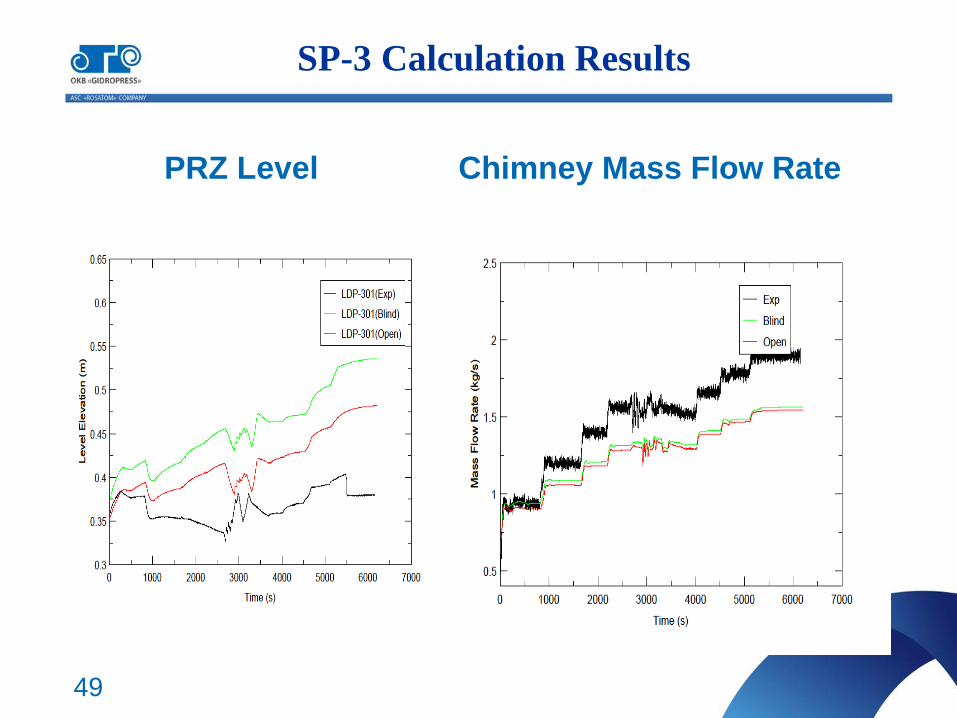
PRZ Level Chimney Mass Flow Rate
SP-3 Calculation Results
50
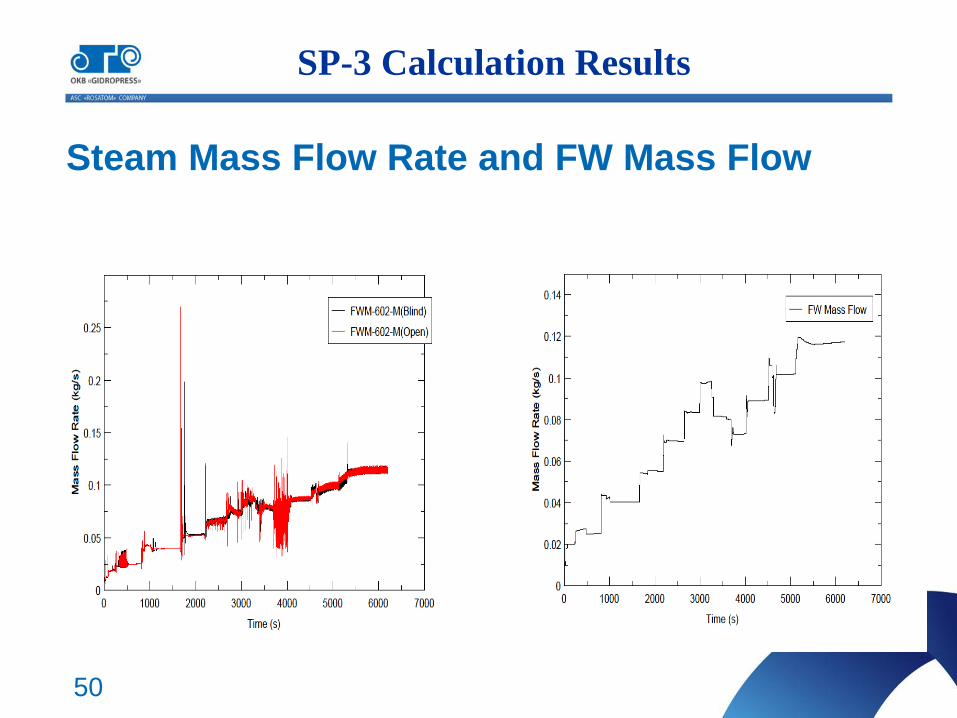
Steam Mass Flow Rate and FW Mass Flow
SP-3 Calculation Results
51
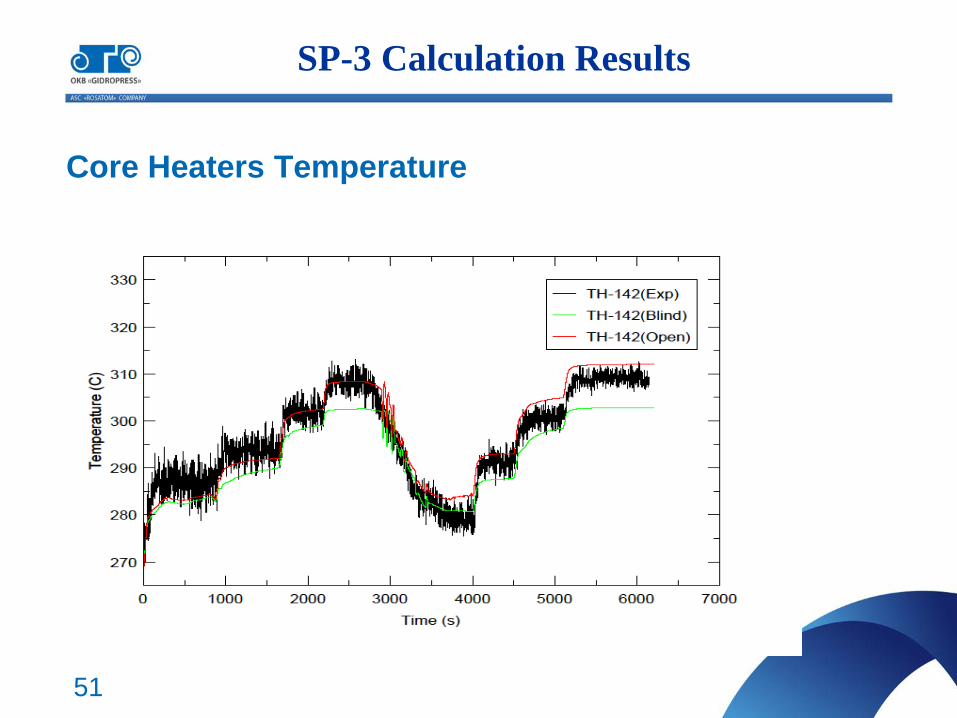
Core Heaters Temperature
SP-3 Calculation Results
52
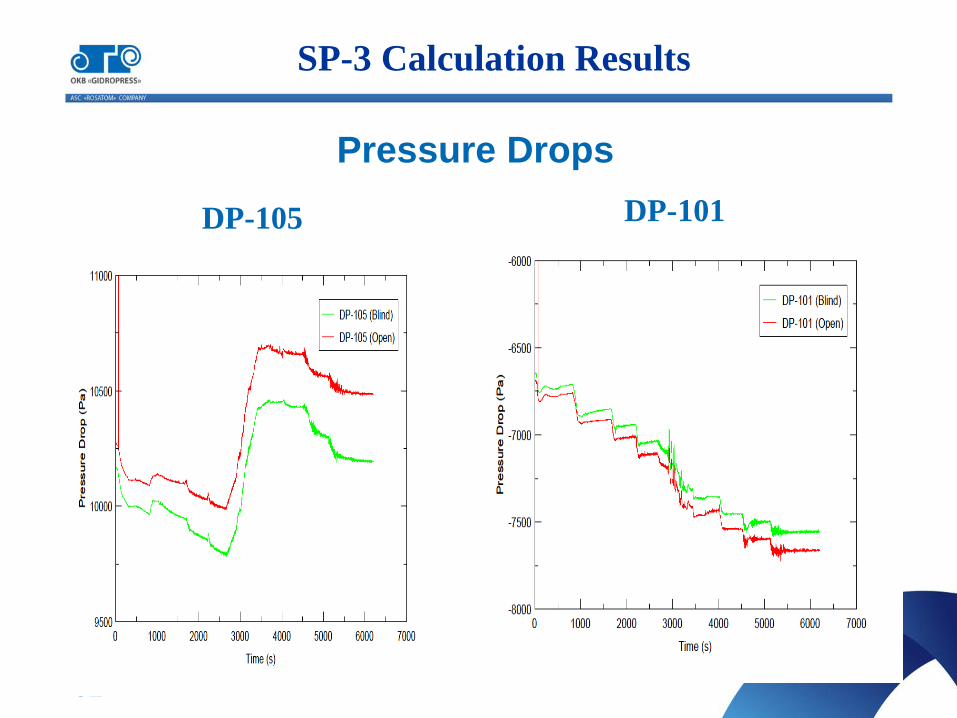
Pressure Drops
DP-101 DP-105
SP-3 Calculation Results
53
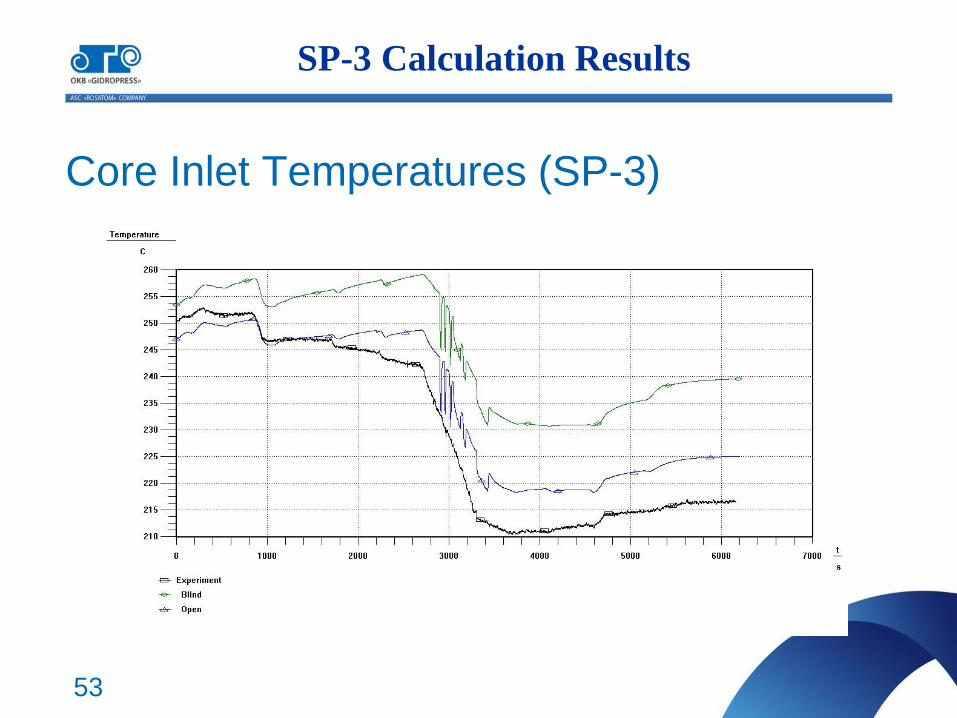
Core Inlet Temperatures (SP-3)
SP-3 Calculation Results
54
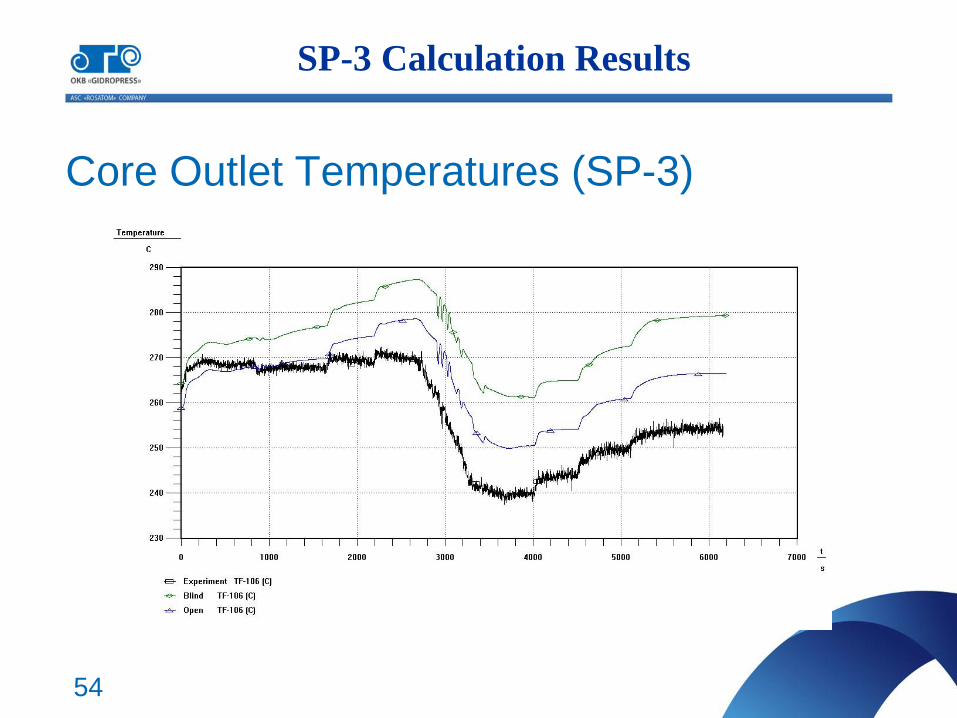
Core Outlet Temperatures (SP-3)
SP-3 Calculation Results
55
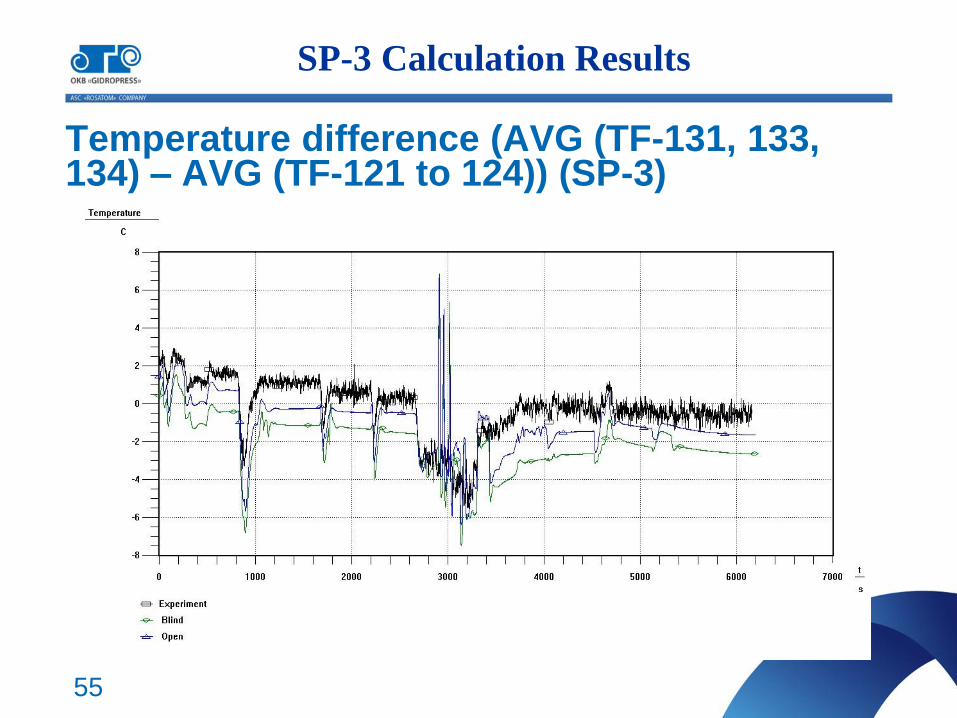
Temperature difference (AVG (TF-131, 133, 134) – AVG (TF-121 to 124)) (SP-3)
SP-3 Calculation Results
56
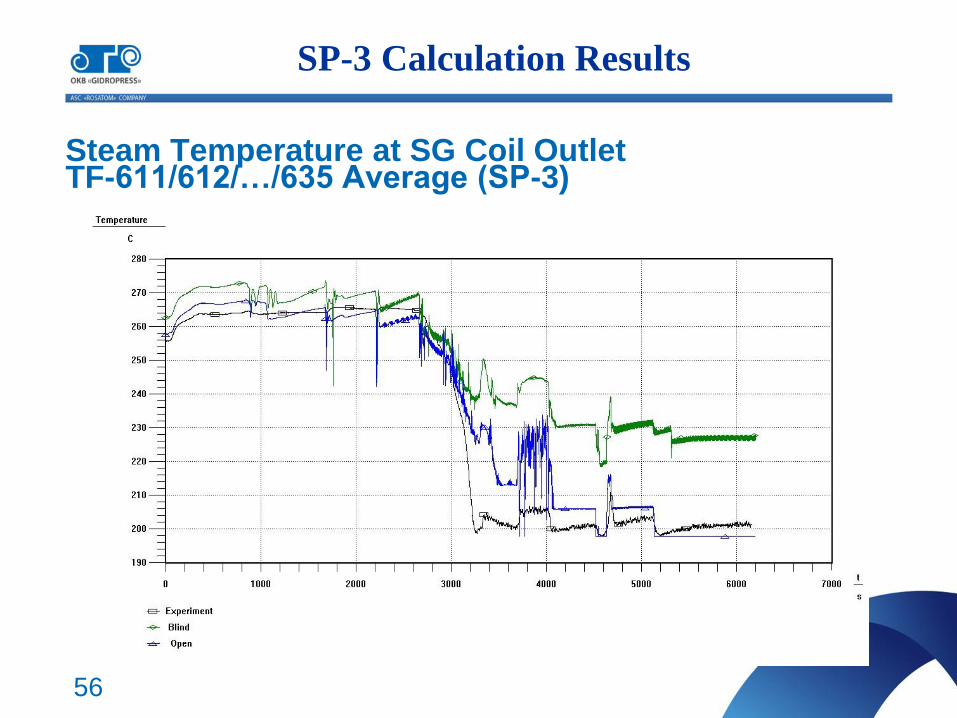
Steam Temperature at SG Coil Outlet TF-611/612/…/635 Average (SP-3)
SP-3 Calculation Results
57
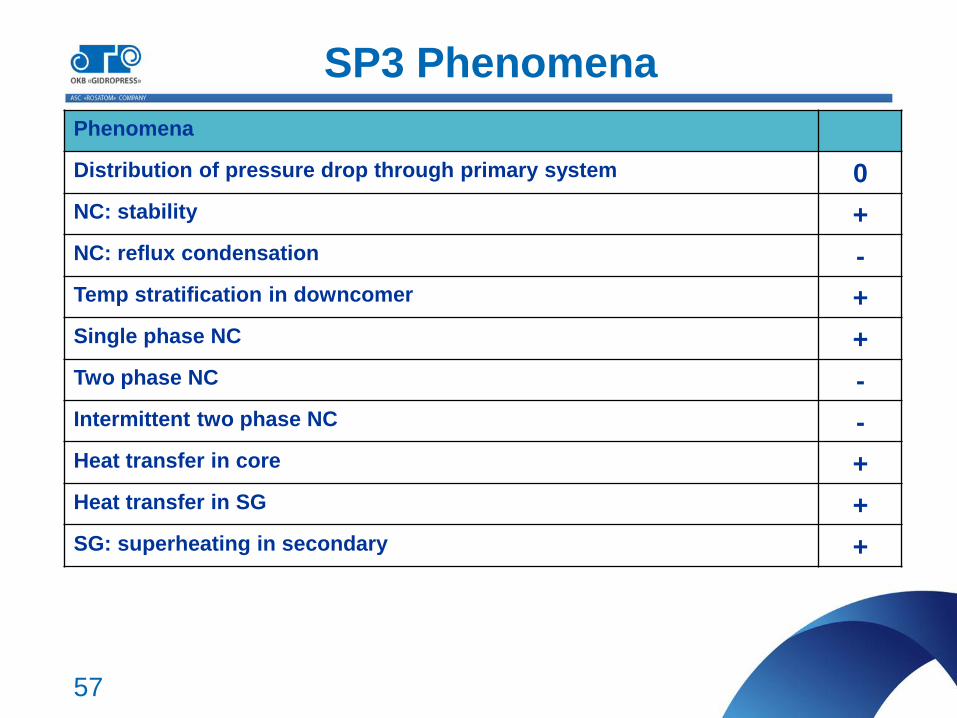
SP3 Phenomena
Phenomena
Distribution of pressure drop through primary system 0
NC: stability +
NC: reflux condensation -
Temp stratification in downcomer +
Single phase NC +
Two phase NC -
Intermittent two phase NC -
Heat transfer in core +
Heat transfer in SG +
SG: superheating in secondary +
58
SP-2
- The high dependence of the RPV&HPC&CPV parameters
behavior from ADS Lines characteristics while the transient .
- The assumption of formation of boundary layers nearby HTP
inside HPC (because of steam jet penetration into water volume)
and CPV is made. Modeling changes for the consideration of these
phenomena in Open Calculation are made.
- The SP-2 experimental data of temperatures distribution in HPC
and CPV may be used to verify of the 3-D heat and mass transfer
models in future.
SP-3
- There are need to take into account of the RPV heat losses
compensation system (PRZ Heaters) in SP-3 calculation.
Lessons learned
59
Conclusion
- Both Blind and Open Calculations were perform with
KORSAR/GP code.
- At the Open Calculation performance some discrepancies
of the model (input deck) used for Blind Calculation are
considered. In particular, the boundary condition at Steam Line
output is corrected, the value of loss coefficient for PCS-106A, B
line is corrected either.
- The assumption of formation of boundary layers nearby
HTP inside HPC (because of steam jet penetration into water
volume) and CPV is made. Modeling changes for the
consideration of these phenomena in Open Calculation are
made.
60
Conclusion (Cont)
- Open calculation using corrected model has allowed to
reduce the differences between calculated values of some
parameters and experimental data for SP-2 (RPV and HPC levels,
HPC and HTP and CPV temperatures, etc.).
- For the Open Calculation developed model of MASLWR
experimental facility on the basis of KORSAR code allows to
execute modeling of SP-2 and SP-3 natural circulation
experiments.
- Results of Blind and Open Calculations of SP-2 and SP-3
experiments quite well coincide with experimental data.