Embed Size (px)
Citation preview

Solutions and Dilutions

Partners in New York State Curriculum for Advanced Technology Education Hofstra University New York State Education Department Project Co-Principal Investigators Linda Hobart Finger Lakes Community College John E. Jablonski, Vice President and Dean of the College Fulton-Montgomery Community College Margarita Mayo, Director of Education, Training and Quality New York State Business Council Godfrey I. Nwoke, Ph.D. New York City College of Technology Jean Stevens, Assistant Commissioner, Office of Workforce Preparation and Continuing Education New York State Education Department Management Team Project Co-Directors M. David Burghardt, Ph.D. Michael Hacker Hofstra University Project Coordinator William Peruzzi, Ph.D. Hofstra University Project Administrative Assistant Lois Miceli Hofstra University Project Advisory Council Stuart Field (Chair), Manager, Saratoga Division Slack Chemical Company Dr. James C. Dawson, Member N.Y.S. Board of Regents Nancy Bryan, Past President New York State Technology Education Association James Cimino, Executive Director Association of Career and Technical Education Administrators Dr. Lorraine Hohenforst, Coordinator of Instructional Services Hamilton-Fulton Montgomery BOCES Dr. Elaine, A. Johnson, Director Bio-Link (ATE) Center, City College of San Francisco Dr. James V. Masi, Retired Executive Director, Northeast (ATE) Center for Telecommunications Technology Professor Emeritus, Western New England College Mr. Bernard McInerney, Statewide Tech Prep Coordinator New York State Education Department Mr. Gordon Snyder, Executive Director National Center for Telecommunications Technology Project Evaluation Team Bert Flugman, Ph.D. Director Deborah Hecht, Ph.D. Center for Advanced Study in Education City University of New York Principal Writer: Linda Hobart Consultant/Writer: Dorothy Rosenthal, Ed.D. Copy Editor: Barbara L. Kelly Publications Designer: Lesa Clark NYSCATE modules and ancillary materials such as the NYSCATE Pedagogical Framework may be downloaded from http://www.nyscate.net or www.hofstra.edu/nyscate
This material is based upon work supported by the National Science Foundation under Grant 0053269. Any opinions, findings, and conclusions or recommendations expressed in this material are those of the author(s) and do not necessarily reflect the views of the National Science Foundation.
Solutions and Dilutions NYSCATE Module Guide
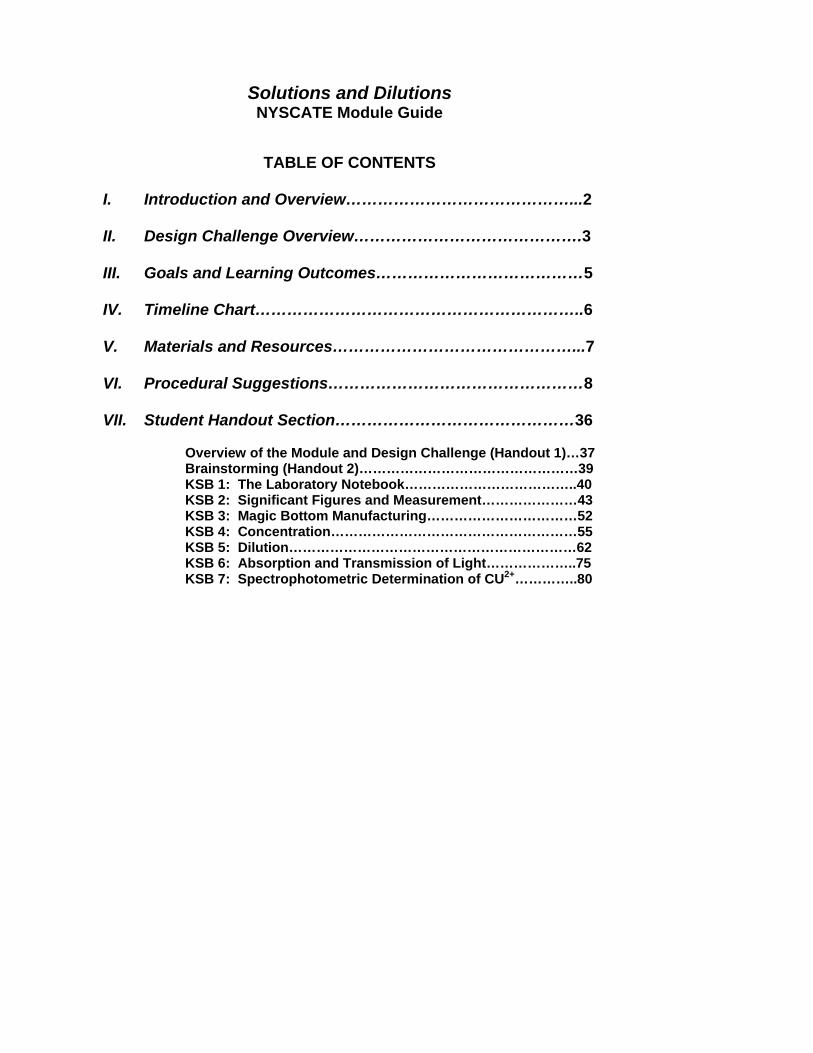
TABLE OF CONTENTS
I. Introduction and Overview……………………………………...2 II. Design Challenge Overview…………………………………….3 III. Goals and Learning Outcomes…………………………………5 IV. Timeline Chart……………………………………………………..6 V. Materials and Resources………………………………………...7 VI. Procedural Suggestions…………………………………………8 VII. Student Handout Section………………………………………36
Overview of the Module and Design Challenge (Handout 1)…37 Brainstorming (Handout 2)…………………………………………39 KSB 1: The Laboratory Notebook………………………………..40 KSB 2: Significant Figures and Measurement…………………43 KSB 3: Magic Bottom Manufacturing……………………………52 KSB 4: Concentration………………………………………………55 KSB 5: Dilution………………………………………………………62 KSB 6: Absorption and Transmission of Light………………..75 KSB 7: Spectrophotometric Determination of CU2+…………..80
2
I. INTRODUCTION AND OVERVIEW
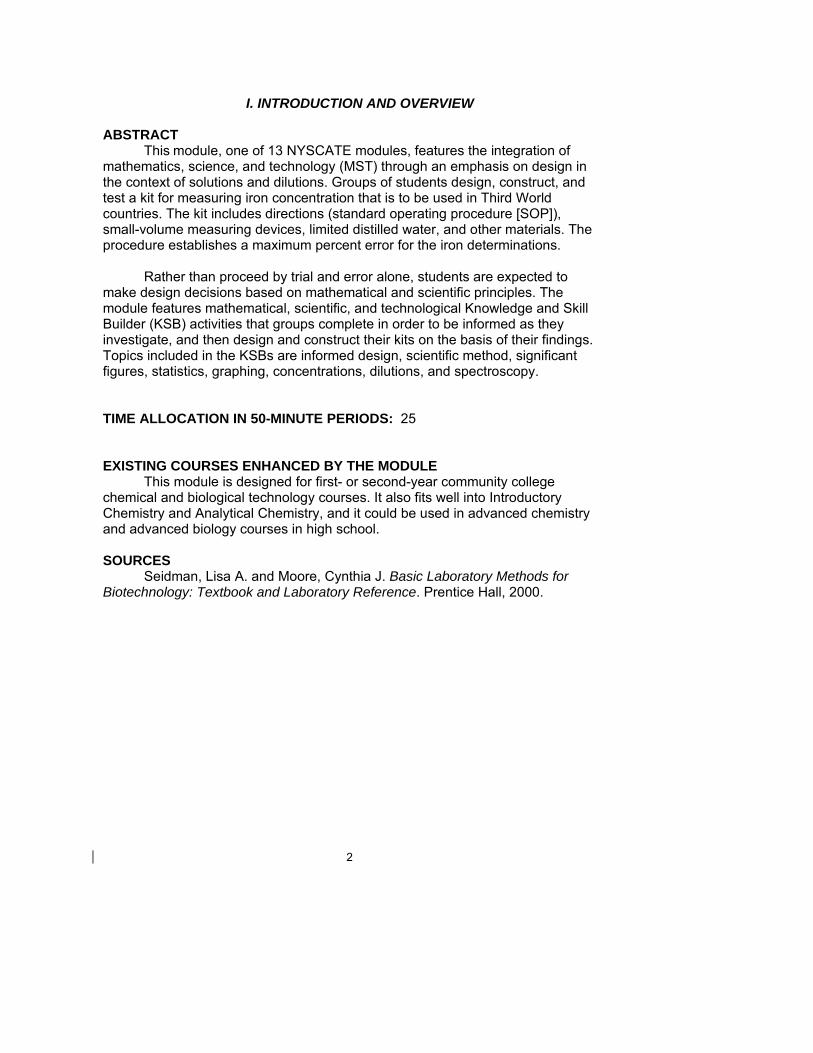
ABSTRACT This module, one of 13 NYSCATE modules, features the integration of mathematics, science, and technology (MST) through an emphasis on design in the context of solutions and dilutions. Groups of students design, construct, and test a kit for measuring iron concentration that is to be used in Third World countries. The kit includes directions (standard operating procedure [SOP]), small-volume measuring devices, limited distilled water, and other materials. The procedure establishes a maximum percent error for the iron determinations.
Rather than proceed by trial and error alone, students are expected to make design decisions based on mathematical and scientific principles. The module features mathematical, scientific, and technological Knowledge and Skill Builder (KSB) activities that groups complete in order to be informed as they investigate, and then design and construct their kits on the basis of their findings. Topics included in the KSBs are informed design, scientific method, significant figures, statistics, graphing, concentrations, dilutions, and spectroscopy. TIME ALLOCATION IN 50-MINUTE PERIODS: 25 EXISTING COURSES ENHANCED BY THE MODULE This module is designed for first- or second-year community college chemical and biological technology courses. It also fits well into Introductory Chemistry and Analytical Chemistry, and it could be used in advanced chemistry and advanced biology courses in high school. SOURCES Seidman, Lisa A. and Moore, Cynthia J. Basic Laboratory Methods for Biotechnology: Textbook and Laboratory Reference. Prentice Hall, 2000.
3
II. DESIGN CHALLENGE OVERVIEW
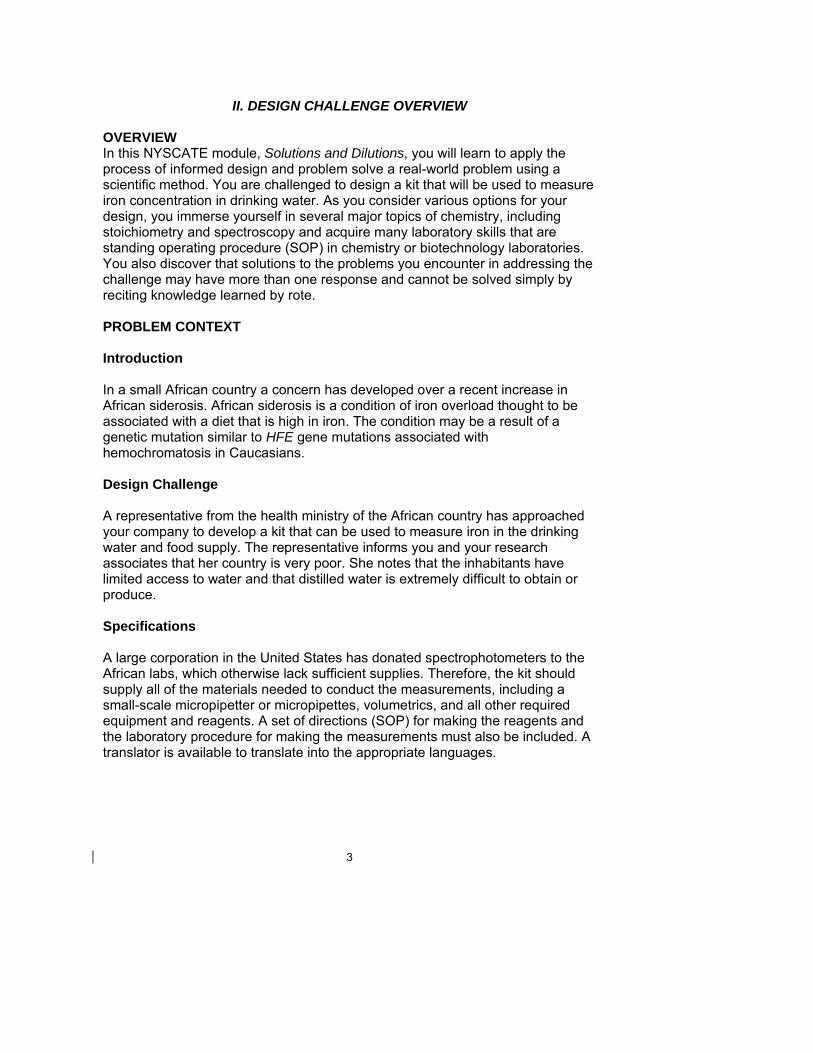
OVERVIEW In this NYSCATE module, Solutions and Dilutions, you will learn to apply the process of informed design and problem solve a real-world problem using a scientific method. You are challenged to design a kit that will be used to measure iron concentration in drinking water. As you consider various options for your design, you immerse yourself in several major topics of chemistry, including stoichiometry and spectroscopy and acquire many laboratory skills that are standing operating procedure (SOP) in chemistry or biotechnology laboratories. You also discover that solutions to the problems you encounter in addressing the challenge may have more than one response and cannot be solved simply by reciting knowledge learned by rote. PROBLEM CONTEXT Introduction In a small African country a concern has developed over a recent increase in African siderosis. African siderosis is a condition of iron overload thought to be associated with a diet that is high in iron. The condition may be a result of a genetic mutation similar to HFE gene mutations associated with hemochromatosis in Caucasians. Design Challenge A representative from the health ministry of the African country has approached your company to develop a kit that can be used to measure iron in the drinking water and food supply. The representative informs you and your research associates that her country is very poor. She notes that the inhabitants have limited access to water and that distilled water is extremely difficult to obtain or produce. Specifications A large corporation in the United States has donated spectrophotometers to the African labs, which otherwise lack sufficient supplies. Therefore, the kit should supply all of the materials needed to conduct the measurements, including a small-scale micropipetter or micropipettes, volumetrics, and all other required equipment and reagents. A set of directions (SOP) for making the reagents and the laboratory procedure for making the measurements must also be included. A translator is available to translate into the appropriate languages.
4
Constraints
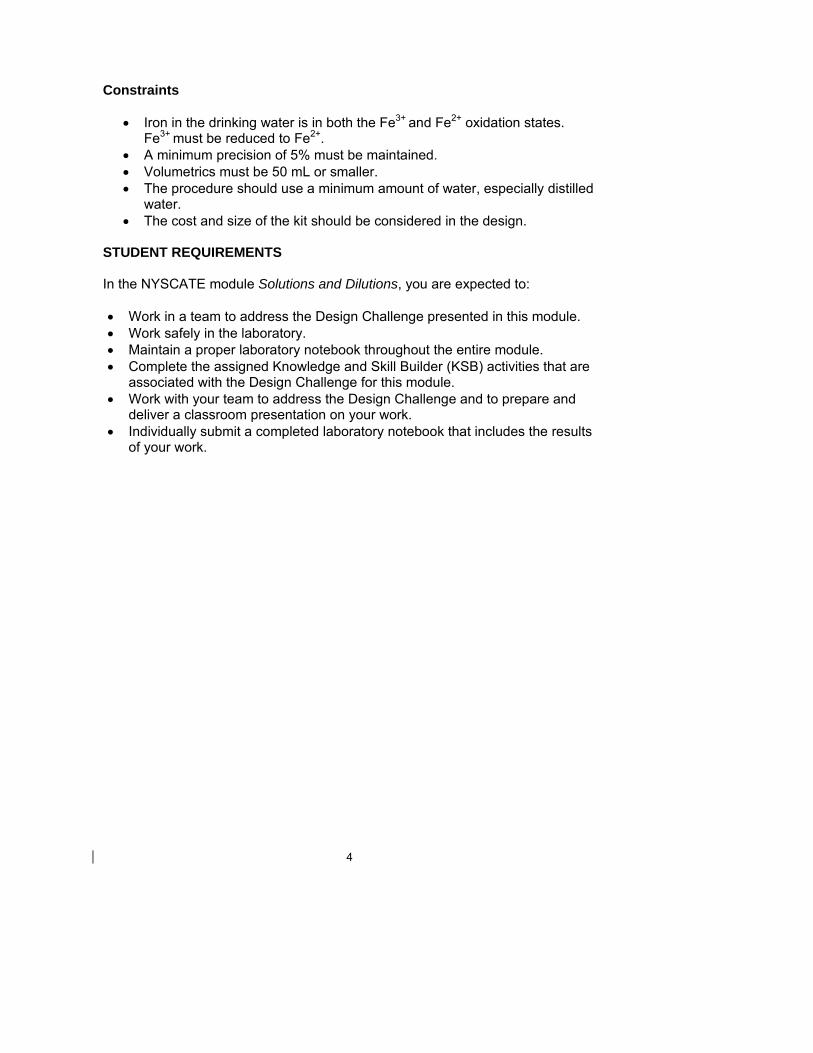
• Iron in the drinking water is in both the Fe3+ and Fe2+ oxidation states. Fe3+ must be reduced to Fe2+.
• A minimum precision of 5% must be maintained. • Volumetrics must be 50 mL or smaller. • The procedure should use a minimum amount of water, especially distilled
water. • The cost and size of the kit should be considered in the design.
STUDENT REQUIREMENTS In the NYSCATE module Solutions and Dilutions, you are expected to: • Work in a team to address the Design Challenge presented in this module. • Work safely in the laboratory. • Maintain a proper laboratory notebook throughout the entire module. • Complete the assigned Knowledge and Skill Builder (KSB) activities that are
associated with the Design Challenge for this module. • Work with your team to address the Design Challenge and to prepare and
deliver a classroom presentation on your work. • Individually submit a completed laboratory notebook that includes the results
of your work.
5
III. GOALS AND LEARNING OUTCOMES
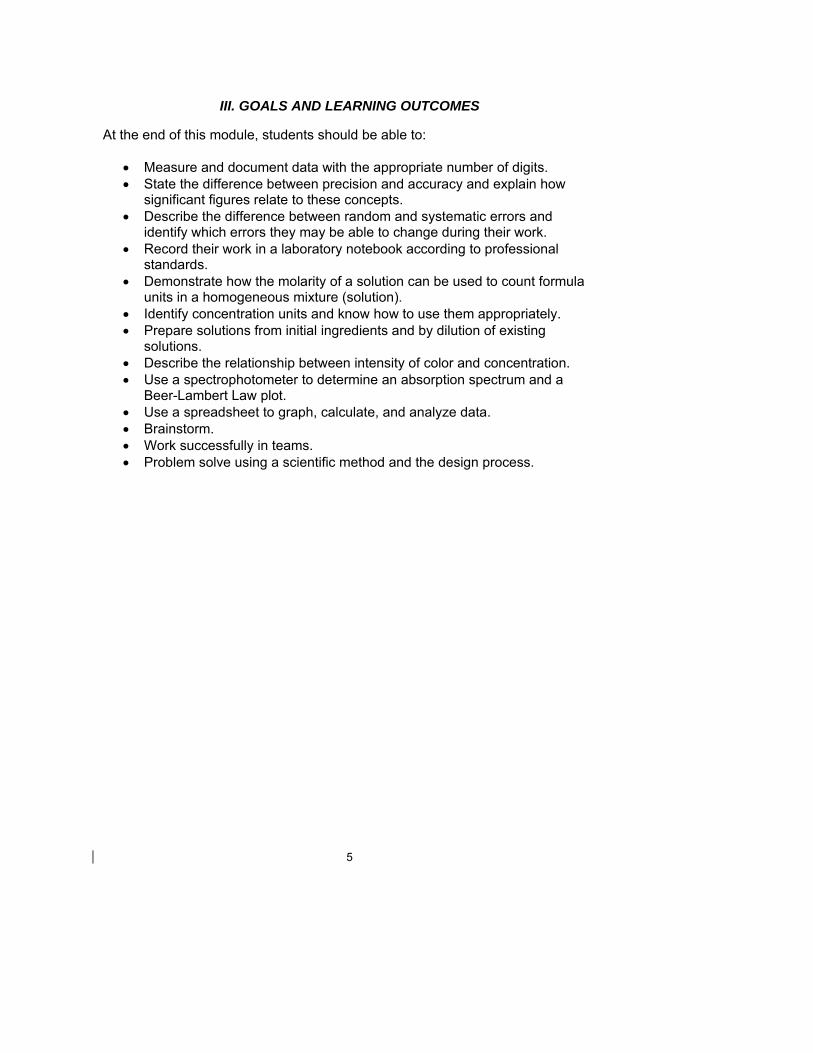
At the end of this module, students should be able to:
• Measure and document data with the appropriate number of digits. • State the difference between precision and accuracy and explain how
significant figures relate to these concepts. • Describe the difference between random and systematic errors and
identify which errors they may be able to change during their work. • Record their work in a laboratory notebook according to professional
standards. • Demonstrate how the molarity of a solution can be used to count formula
units in a homogeneous mixture (solution). • Identify concentration units and know how to use them appropriately. • Prepare solutions from initial ingredients and by dilution of existing
solutions. • Describe the relationship between intensity of color and concentration. • Use a spectrophotometer to determine an absorption spectrum and a
Beer-Lambert Law plot. • Use a spreadsheet to graph, calculate, and analyze data. • Brainstorm. • Work successfully in teams. • Problem solve using a scientific method and the design process.
6
IV. TIMELINE CHART
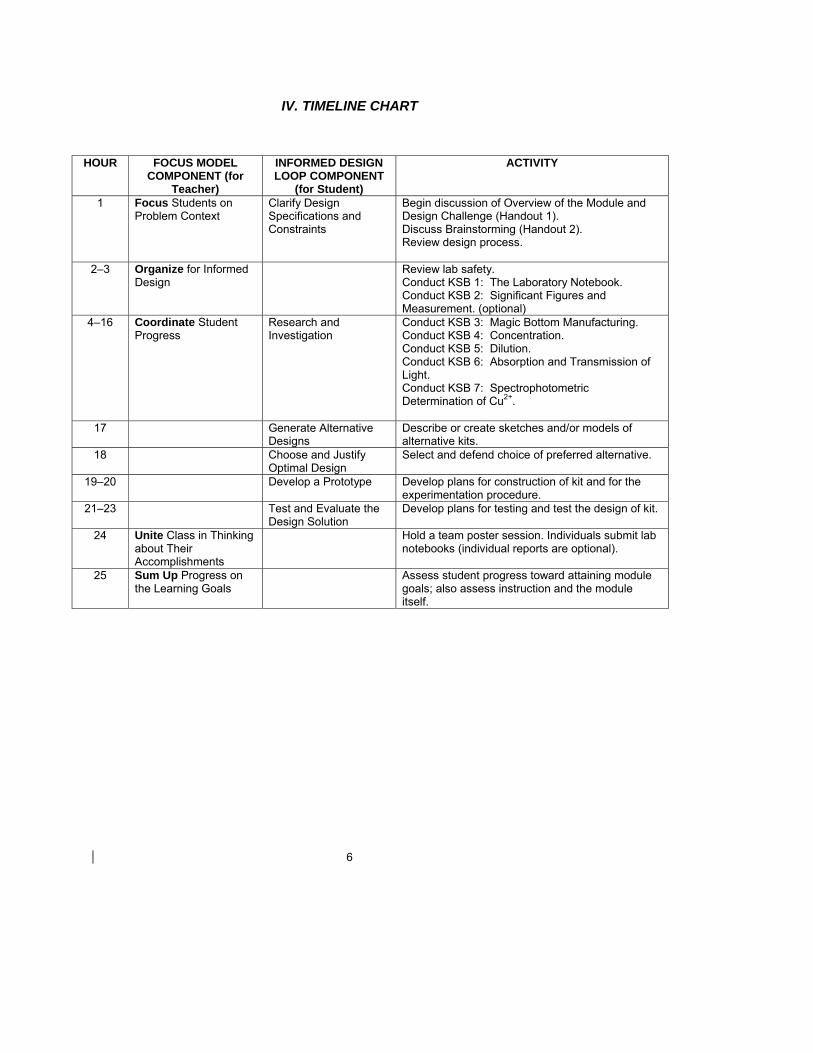
HOUR FOCUS MODEL COMPONENT (for
Teacher)
INFORMED DESIGN LOOP COMPONENT
(for Student)
ACTIVITY
1 Focus Students on Problem Context
Clarify Design Specifications and Constraints
Begin discussion of Overview of the Module and Design Challenge (Handout 1). Discuss Brainstorming (Handout 2). Review design process.
2–3 Organize for Informed Design
Review lab safety. Conduct KSB 1: The Laboratory Notebook. Conduct KSB 2: Significant Figures and Measurement. (optional)
4–16 Coordinate Student Progress
Research and Investigation
Conduct KSB 3: Magic Bottom Manufacturing. Conduct KSB 4: Concentration. Conduct KSB 5: Dilution. Conduct KSB 6: Absorption and Transmission of Light. Conduct KSB 7: Spectrophotometric Determination of Cu2+.
17 Generate Alternative Designs
Describe or create sketches and/or models of alternative kits.
18 Choose and Justify Optimal Design
Select and defend choice of preferred alternative.
19–20 Develop a Prototype Develop plans for construction of kit and for the experimentation procedure.
21–23 Test and Evaluate the Design Solution
Develop plans for testing and test the design of kit.
24 Unite Class in Thinking about Their Accomplishments
Hold a team poster session. Individuals submit lab notebooks (individual reports are optional).
25 Sum Up Progress on the Learning Goals
Assess student progress toward attaining module goals; also assess instruction and the module itself.
7
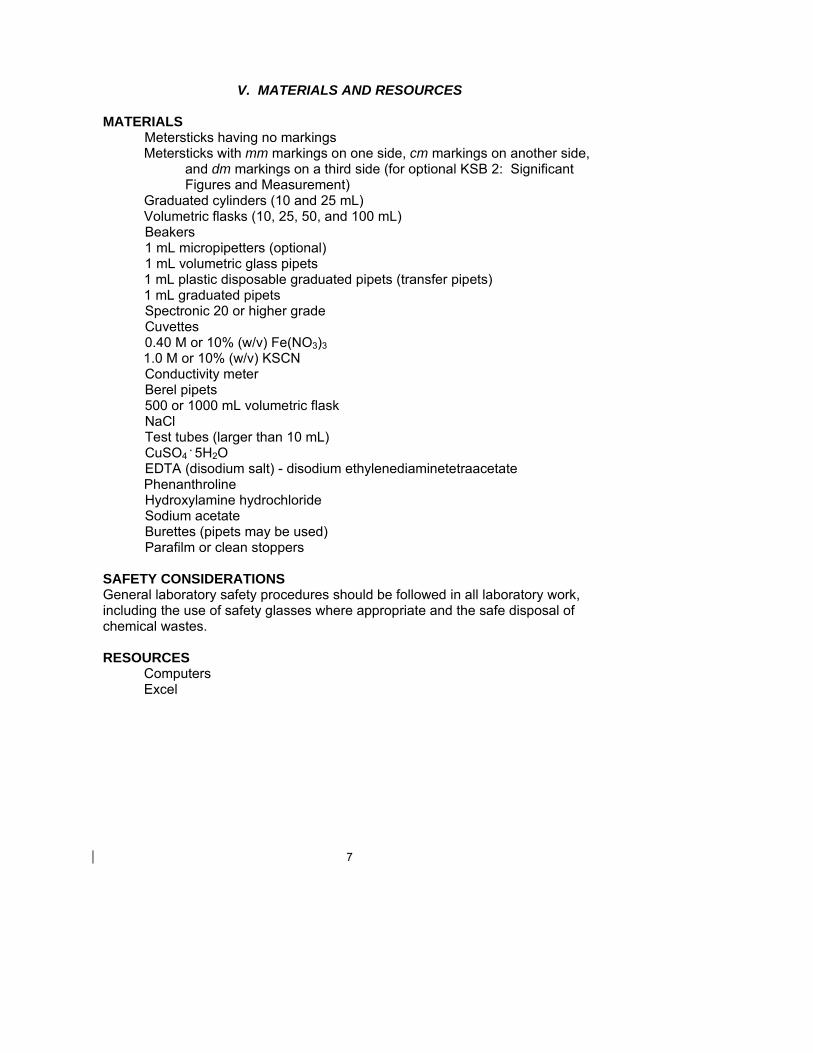
V. MATERIALS AND RESOURCES
MATERIALS Metersticks having no markings
Metersticks with mm markings on one side, cm markings on another side, and dm markings on a third side (for optional KSB 2: Significant Figures and Measurement)
Graduated cylinders (10 and 25 mL) Volumetric flasks (10, 25, 50, and 100 mL)
Beakers 1 mL micropipetters (optional) 1 mL volumetric glass pipets 1 mL plastic disposable graduated pipets (transfer pipets) 1 mL graduated pipets Spectronic 20 or higher grade Cuvettes 0.40 M or 10% (w/v) Fe(NO3)3
1.0 M or 10% (w/v) KSCN Conductivity meter Berel pipets 500 or 1000 mL volumetric flask NaCl Test tubes (larger than 10 mL) CuSO4
. 5H2O EDTA (disodium salt) - disodium ethylenediaminetetraacetate
Phenanthroline Hydroxylamine hydrochloride Sodium acetate Burettes (pipets may be used) Parafilm or clean stoppers
SAFETY CONSIDERATIONS General laboratory safety procedures should be followed in all laboratory work, including the use of safety glasses where appropriate and the safe disposal of chemical wastes. RESOURCES Computers Excel
8
INTRODUCTION (STUDENT HANDOUT 1) OVERVIEW OF THE MODULE AND DESIGN CHALLENGE
OVERVIEW In the NYSCATE module Solutions and Dilutions, you will learn to apply the process of informed design and problem solve a real-world problem using a scientific method. You are challenged to design a kit that will be used to measure iron concentration in drinking water. As you consider various options for your design, you immerse yourself in several major topics of chemistry, including stoichiometry and spectroscopy, and acquire many skills that are standard operating procedure (SOP) in chemistry or biotechnology laboratories. You also discover that solutions to the problems you encounter in addressing the challenge have more than one answer and cannot be solved simply by reciting knowledge learned by rote. At the conclusion of this module, you should be able to:
• Measure and document data with the appropriate number of digits.
• State the difference between precision and accuracy and explain how significant figures relate to these concepts.
• Describe the difference between random and systematic errors.
• Record your work in a laboratory notebook according to professional standards.
• Demonstrate how the molarity of a solution can be
VI. PROCEDURAL SUGGESTIONS
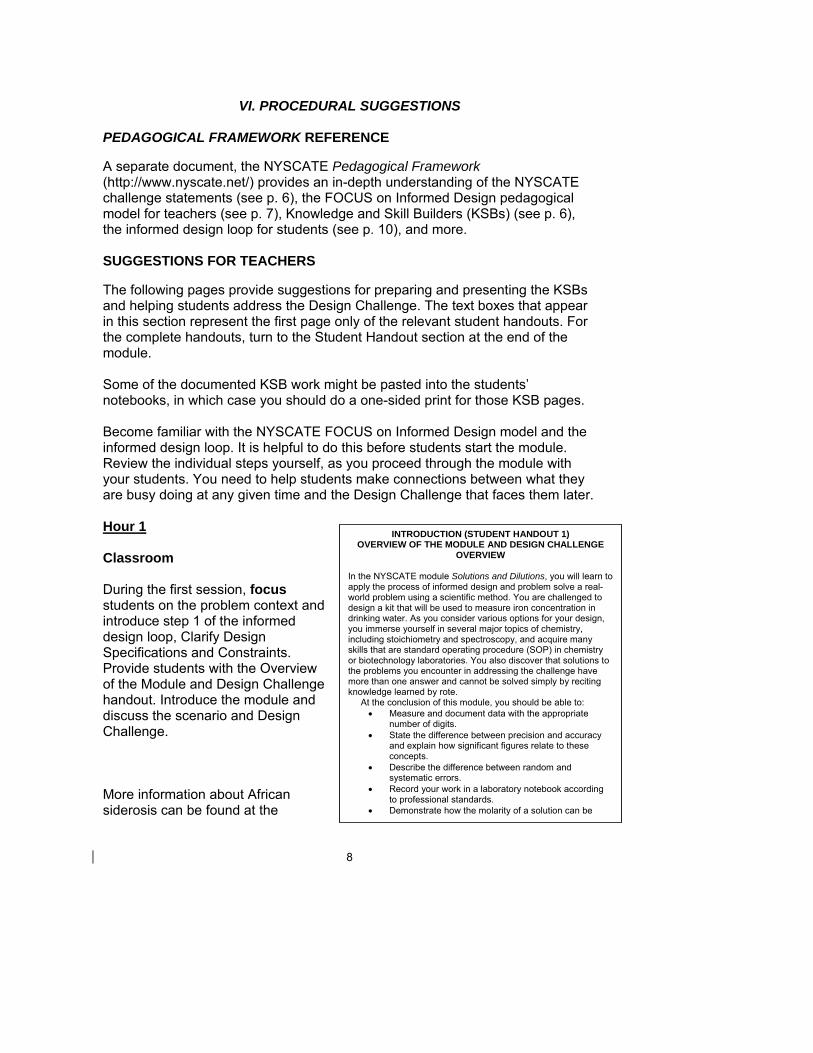
PEDAGOGICAL FRAMEWORK REFERENCE A separate document, the NYSCATE Pedagogical Framework (http://www.nyscate.net/) provides an in-depth understanding of the NYSCATE challenge statements (see p. 6), the FOCUS on Informed Design pedagogical model for teachers (see p. 7), Knowledge and Skill Builders (KSBs) (see p. 6), the informed design loop for students (see p. 10), and more. SUGGESTIONS FOR TEACHERS The following pages provide suggestions for preparing and presenting the KSBs and helping students address the Design Challenge. The text boxes that appear in this section represent the first page only of the relevant student handouts. For the complete handouts, turn to the Student Handout section at the end of the module. Some of the documented KSB work might be pasted into the students’ notebooks, in which case you should do a one-sided print for those KSB pages. Become familiar with the NYSCATE FOCUS on Informed Design model and the informed design loop. It is helpful to do this before students start the module. Review the individual steps yourself, as you proceed through the module with your students. You need to help students make connections between what they are busy doing at any given time and the Design Challenge that faces them later. Hour 1 Classroom During the first session, focus students on the problem context and introduce step 1 of the informed design loop, Clarify Design Specifications and Constraints. Provide students with the Overview of the Module and Design Challenge handout. Introduce the module and discuss the scenario and Design Challenge. More information about African siderosis can be found at the
9
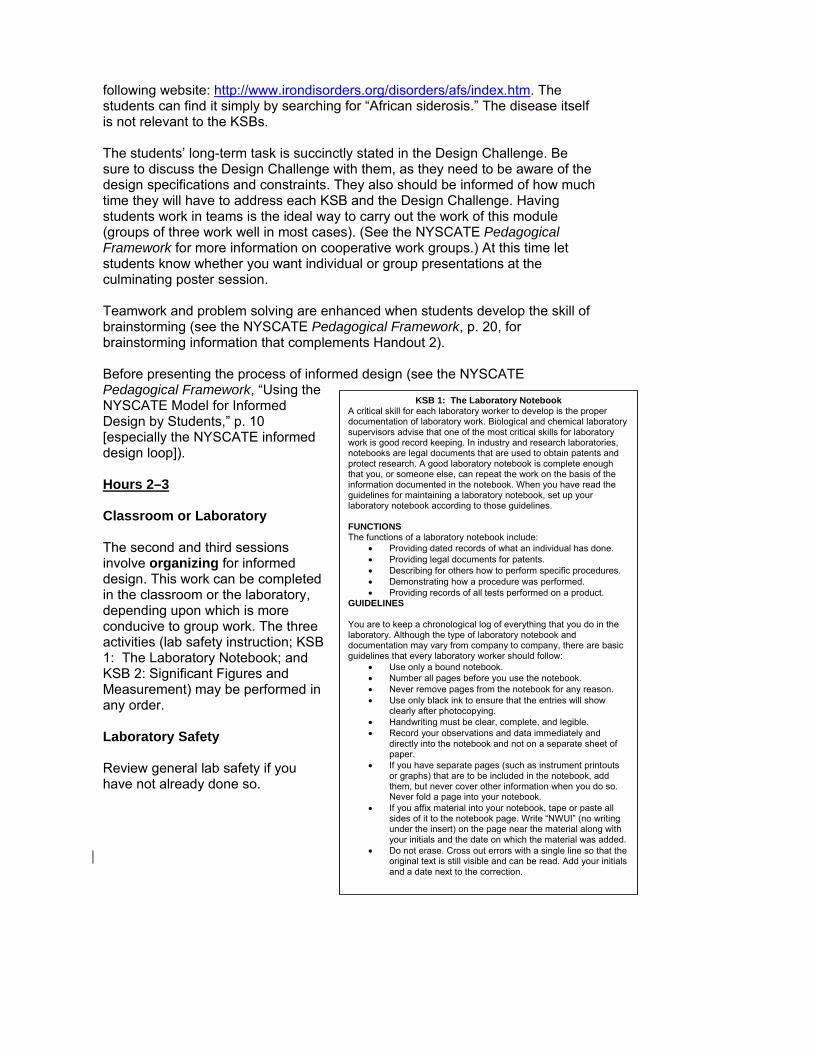
KSB 1: The Laboratory Notebook A critical skill for each laboratory worker to develop is the proper documentation of laboratory work. Biological and chemical laboratory supervisors advise that one of the most critical skills for laboratory work is good record keeping. In industry and research laboratories, notebooks are legal documents that are used to obtain patents and protect research. A good laboratory notebook is complete enough that you, or someone else, can repeat the work on the basis of the information documented in the notebook. When you have read the guidelines for maintaining a laboratory notebook, set up your laboratory notebook according to those guidelines. FUNCTIONS The functions of a laboratory notebook include:
• Providing dated records of what an individual has done. • Providing legal documents for patents. • Describing for others how to perform specific procedures. • Demonstrating how a procedure was performed. • Providing records of all tests performed on a product.
GUIDELINES You are to keep a chronological log of everything that you do in the laboratory. Although the type of laboratory notebook and documentation may vary from company to company, there are basic guidelines that every laboratory worker should follow:
• Use only a bound notebook. • Number all pages before you use the notebook. • Never remove pages from the notebook for any reason. • Use only black ink to ensure that the entries will show
clearly after photocopying. • Handwriting must be clear, complete, and legible. • Record your observations and data immediately and
directly into the notebook and not on a separate sheet of paper.
• If you have separate pages (such as instrument printouts or graphs) that are to be included in the notebook, add them, but never cover other information when you do so. Never fold a page into your notebook.
• If you affix material into your notebook, tape or paste all sides of it to the notebook page. Write “NWUI” (no writing under the insert) on the page near the material along with your initials and the date on which the material was added.
• Do not erase. Cross out errors with a single line so that the original text is still visible and can be read. Add your initials and a date next to the correction.
following website: http://www.irondisorders.org/disorders/afs/index.htm. The students can find it simply by searching for “African siderosis.” The disease itself is not relevant to the KSBs. The students’ long-term task is succinctly stated in the Design Challenge. Be sure to discuss the Design Challenge with them, as they need to be aware of the design specifications and constraints. They also should be informed of how much time they will have to address each KSB and the Design Challenge. Having students work in teams is the ideal way to carry out the work of this module (groups of three work well in most cases). (See the NYSCATE Pedagogical Framework for more information on cooperative work groups.) At this time let students know whether you want individual or group presentations at the culminating poster session. Teamwork and problem solving are enhanced when students develop the skill of brainstorming (see the NYSCATE Pedagogical Framework, p. 20, for brainstorming information that complements Handout 2). Before presenting the process of informed design (see the NYSCATE Pedagogical Framework, “Using the NYSCATE Model for Informed Design by Students,” p. 10 [especially the NYSCATE informed design loop]). Hours 2–3 Classroom or Laboratory The second and third sessions involve organizing for informed design. This work can be completed in the classroom or the laboratory, depending upon which is more conducive to group work. The three activities (lab safety instruction; KSB 1: The Laboratory Notebook; and KSB 2: Significant Figures and Measurement) may be performed in any order. Laboratory Safety Review general lab safety if you have not already done so.
10
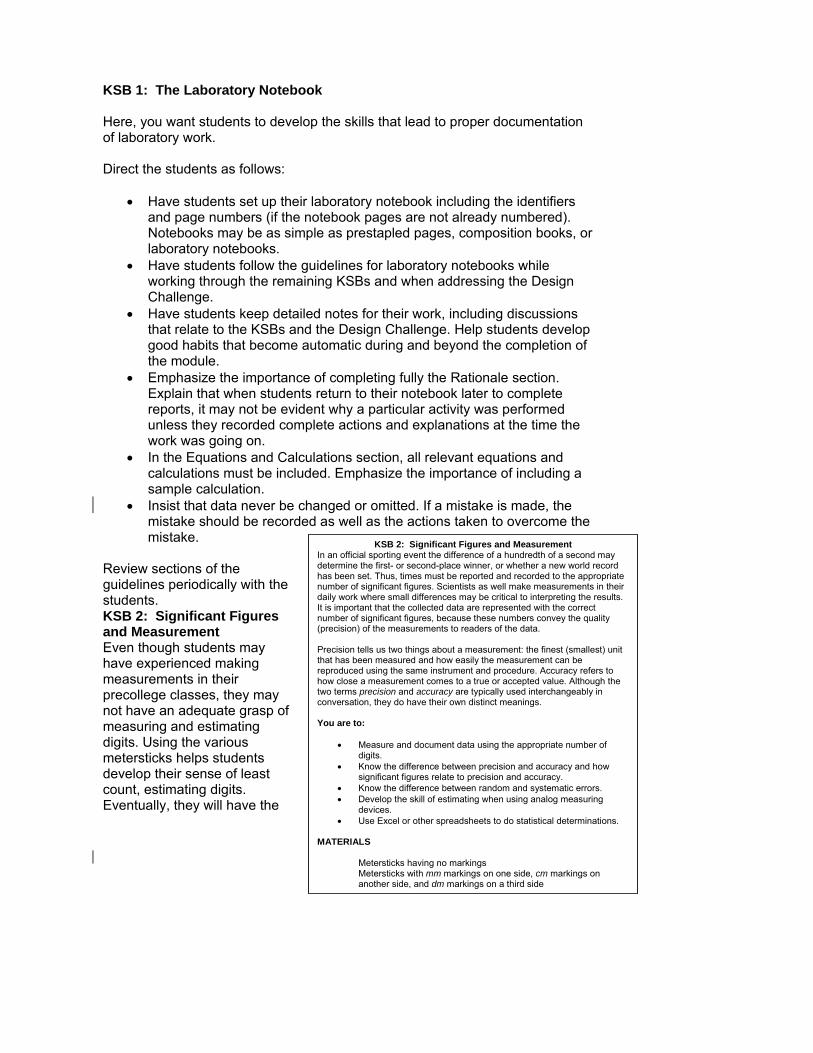
KSB 2: Significant Figures and Measurement In an official sporting event the difference of a hundredth of a second may determine the first- or second-place winner, or whether a new world record has been set. Thus, times must be reported and recorded to the appropriate number of significant figures. Scientists as well make measurements in their daily work where small differences may be critical to interpreting the results. It is important that the collected data are represented with the correct number of significant figures, because these numbers convey the quality (precision) of the measurements to readers of the data. Precision tells us two things about a measurement: the finest (smallest) unit that has been measured and how easily the measurement can be reproduced using the same instrument and procedure. Accuracy refers to how close a measurement comes to a true or accepted value. Although the two terms precision and accuracy are typically used interchangeably in conversation, they do have their own distinct meanings. You are to:
• Measure and document data using the appropriate number of digits.
• Know the difference between precision and accuracy and how significant figures relate to precision and accuracy.
• Know the difference between random and systematic errors. • Develop the skill of estimating when using analog measuring
devices. • Use Excel or other spreadsheets to do statistical determinations.
MATERIALS
Metersticks having no markings Metersticks with mm markings on one side, cm markings on another side, and dm markings on a third side
KSB 1: The Laboratory Notebook Here, you want students to develop the skills that lead to proper documentation of laboratory work. Direct the students as follows:
• Have students set up their laboratory notebook including the identifiers and page numbers (if the notebook pages are not already numbered). Notebooks may be as simple as prestapled pages, composition books, or laboratory notebooks.
• Have students follow the guidelines for laboratory notebooks while working through the remaining KSBs and when addressing the Design Challenge.
• Have students keep detailed notes for their work, including discussions that relate to the KSBs and the Design Challenge. Help students develop good habits that become automatic during and beyond the completion of the module.
• Emphasize the importance of completing fully the Rationale section. Explain that when students return to their notebook later to complete reports, it may not be evident why a particular activity was performed unless they recorded complete actions and explanations at the time the work was going on.
• In the Equations and Calculations section, all relevant equations and calculations must be included. Emphasize the importance of including a sample calculation.
• Insist that data never be changed or omitted. If a mistake is made, the mistake should be recorded as well as the actions taken to overcome the mistake.
Review sections of the guidelines periodically with the students. KSB 2: Significant Figures and Measurement Even though students may have experienced making measurements in their precollege classes, they may not have an adequate grasp of measuring and estimating digits. Using the various metersticks helps students develop their sense of least count, estimating digits. Eventually, they will have the
11
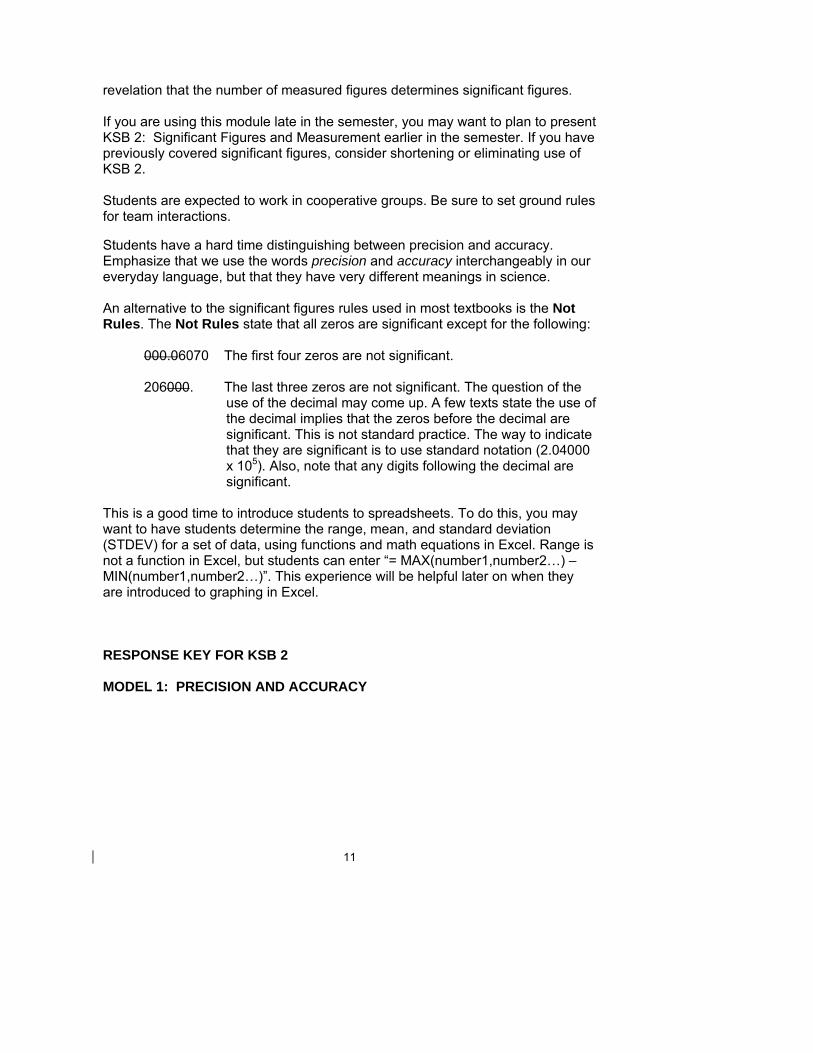
revelation that the number of measured figures determines significant figures. If you are using this module late in the semester, you may want to plan to present KSB 2: Significant Figures and Measurement earlier in the semester. If you have previously covered significant figures, consider shortening or eliminating use of KSB 2. Students are expected to work in cooperative groups. Be sure to set ground rules for team interactions. Students have a hard time distinguishing between precision and accuracy. Emphasize that we use the words precision and accuracy interchangeably in our everyday language, but that they have very different meanings in science. An alternative to the significant figures rules used in most textbooks is the Not Rules. The Not Rules state that all zeros are significant except for the following: 000.06070 The first four zeros are not significant.
206000. The last three zeros are not significant. The question of the
use of the decimal may come up. A few texts state the use of the decimal implies that the zeros before the decimal are significant. This is not standard practice. The way to indicate that they are significant is to use standard notation (2.04000 x 10⁵). Also, note that any digits following the decimal are significant.
This is a good time to introduce students to spreadsheets. To do this, you may want to have students determine the range, mean, and standard deviation (STDEV) for a set of data, using functions and math equations in Excel. Range is not a function in Excel, but students can enter “= MAX(number1,number2…) – MIN(number1,number2…)”. This experience will be helpful later on when they are introduced to graphing in Excel. RESPONSE KEY FOR KSB 2 MODEL 1: PRECISION AND ACCURACY
12
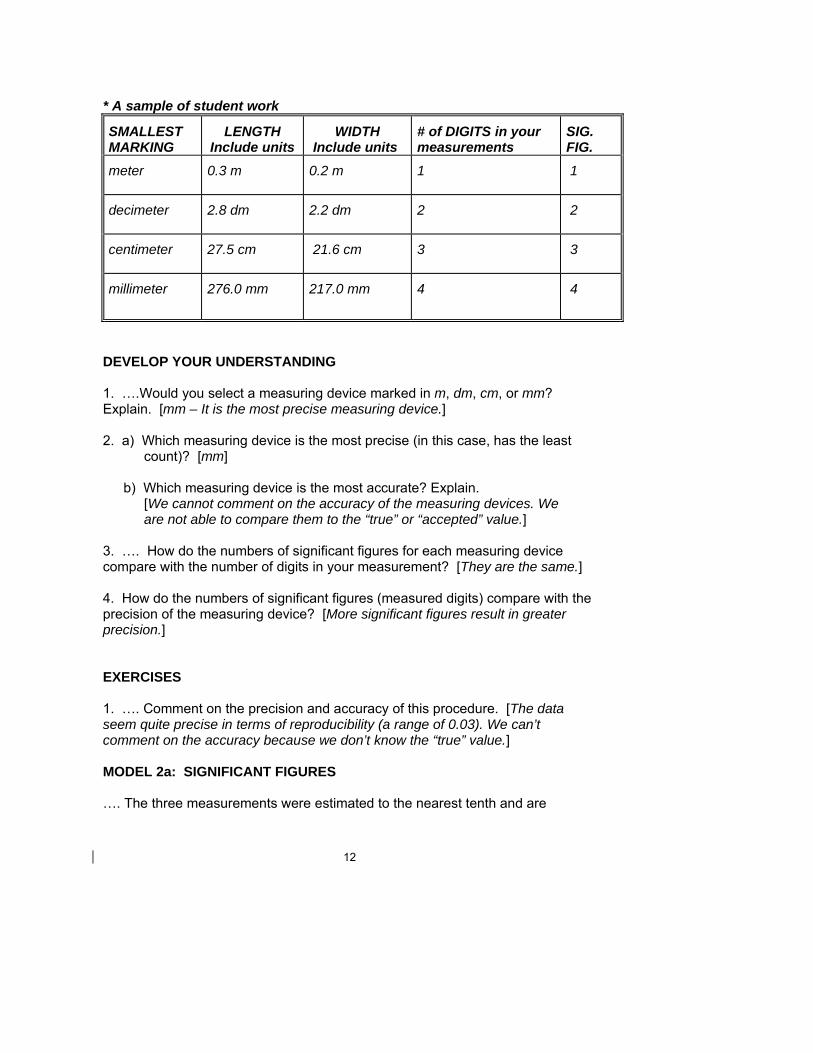
* A sample of student work
SMALLEST MARKING
LENGTH Include units
WIDTH Include units
# of DIGITS in your measurements
SIG. FIG.
meter 0.3 m 0.2 m
1 1
decimeter 2.8 dm 2.2 dm
2 2
centimeter 27.5 cm 21.6 cm
3 3
millimeter
276.0 mm 217.0 mm 4 4
DEVELOP YOUR UNDERSTANDING 1. ….Would you select a measuring device marked in m, dm, cm, or mm? Explain. [mm – It is the most precise measuring device.] 2. a) Which measuring device is the most precise (in this case, has the least
count)? [mm]
b) Which measuring device is the most accurate? Explain. [We cannot comment on the accuracy of the measuring devices. We are not able to compare them to the “true” or “accepted” value.] 3. …. How do the numbers of significant figures for each measuring device compare with the number of digits in your measurement? [They are the same.] 4. How do the numbers of significant figures (measured digits) compare with the precision of the measuring device? [More significant figures result in greater precision.] EXERCISES 1. …. Comment on the precision and accuracy of this procedure. [The data seem quite precise in terms of reproducibility (a range of 0.03). We can’t comment on the accuracy because we don’t know the “true” value.] MODEL 2a: SIGNIFICANT FIGURES …. The three measurements were estimated to the nearest tenth and are
13
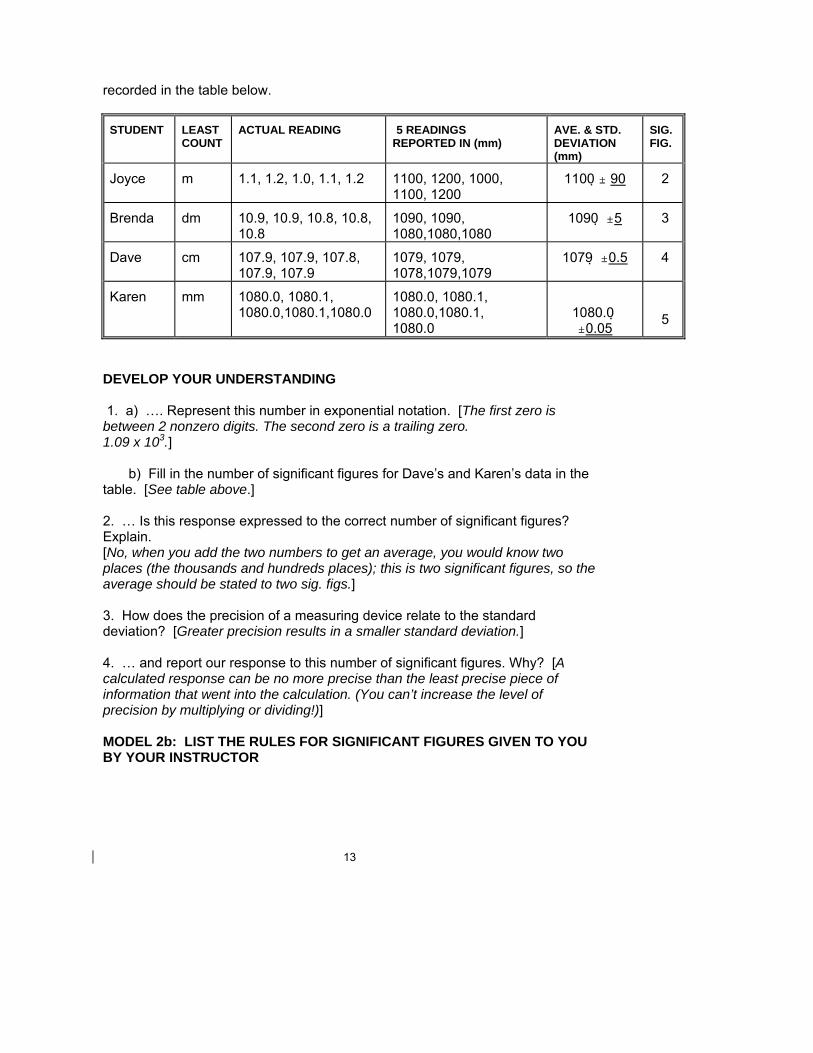
recorded in the table below.
STUDENT LEAST COUNT
ACTUAL READING 5 READINGS REPORTED IN (mm)
AVE. & STD. DEVIATION (mm)
SIG. FIG.
Joyce m 1.1, 1.2, 1.0, 1.1, 1.2 1100, 1200, 1000, 1100, 1200
1100 " 90 2
Brenda dm 10.9, 10.9, 10.8, 10.8, 10.8
1090, 1090, 1080,1080,1080
1090 "5 3
Dave cm 107.9, 107.9, 107.8, 107.9, 107.9
1079, 1079, 1078,1079,1079
1079 "0.5 4
Karen mm 1080.0, 1080.1, 1080.0,1080.1,1080.0
1080.0, 1080.1, 1080.0,1080.1, 1080.0
1080.0 "0.05
5
DEVELOP YOUR UNDERSTANDING 1. a) …. Represent this number in exponential notation. [The first zero is between 2 nonzero digits. The second zero is a trailing zero. 1.09 x 10³.]
b) Fill in the number of significant figures for Dave’s and Karen’s data in the table. [See table above.] 2. … Is this response expressed to the correct number of significant figures? Explain. [No, when you add the two numbers to get an average, you would know two places (the thousands and hundreds places); this is two significant figures, so the average should be stated to two sig. figs.] 3. How does the precision of a measuring device relate to the standard deviation? [Greater precision results in a smaller standard deviation.] 4. … and report our response to this number of significant figures. Why? [A calculated response can be no more precise than the least precise piece of information that went into the calculation. (You can’t increase the level of precision by multiplying or dividing!)] MODEL 2b: LIST THE RULES FOR SIGNIFICANT FIGURES GIVEN TO YOU BY YOUR INSTRUCTOR
14
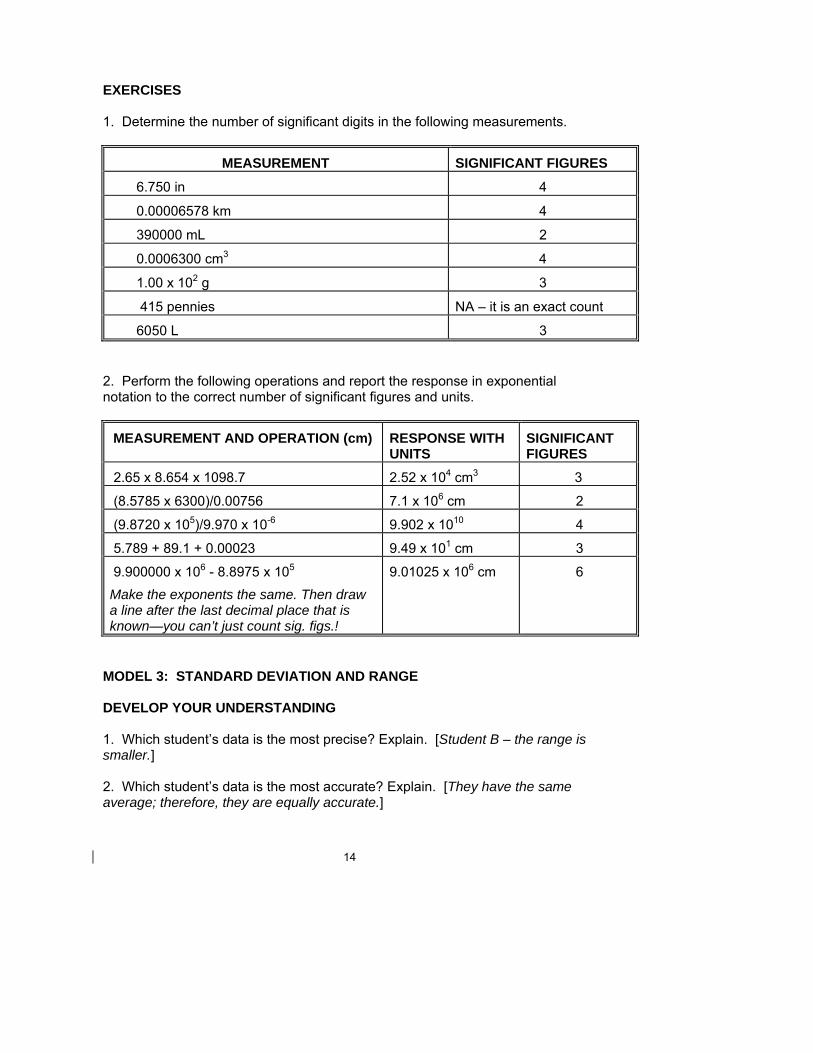
EXERCISES 1. Determine the number of significant digits in the following measurements.
MEASUREMENT SIGNIFICANT FIGURES
6.750 in 4
0.00006578 km 4
390000 mL 2
0.0006300 cm3 4
1.00 x 10² g 3
415 pennies NA – it is an exact count
6050 L 3 2. Perform the following operations and report the response in exponential notation to the correct number of significant figures and units.
MEASUREMENT AND OPERATION (cm) RESPONSE WITH UNITS
SIGNIFICANT FIGURES
2.65 x 8.654 x 1098.7 2.52 x 104 cm3 3
(8.5785 x 6300)/0.00756 7.1 x 106 cm 2
(9.8720 x 10⁵)/9.970 x 10-6 9.902 x 10¹⁰ 4
5.789 + 89.1 + 0.00023 9.49 x 101 cm 3
9.900000 x 10⁶ - 8.8975 x 10⁵ Make the exponents the same. Then draw a line after the last decimal place that is known—you can’t just count sig. figs.!
9.01025 x 106 cm
6
MODEL 3: STANDARD DEVIATION AND RANGE DEVELOP YOUR UNDERSTANDING 1. Which student’s data is the most precise? Explain. [Student B – the range is smaller.] 2. Which student’s data is the most accurate? Explain. [They have the same average; therefore, they are equally accurate.]
15
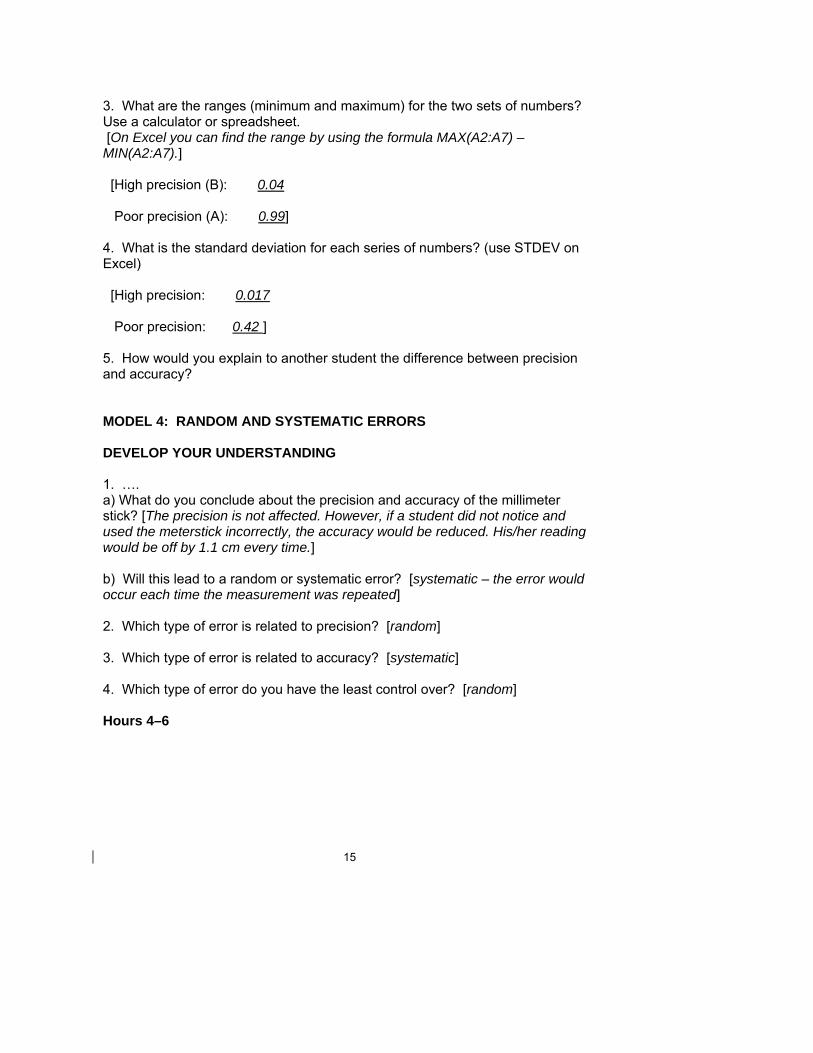
3. What are the ranges (minimum and maximum) for the two sets of numbers? Use a calculator or spreadsheet. [On Excel you can find the range by using the formula MAX(A2:A7) – MIN(A2:A7).] [High precision (B): 0.04 Poor precision (A): 0.99] 4. What is the standard deviation for each series of numbers? (use STDEV on Excel) [High precision: 0.017 Poor precision: 0.42 ] 5. How would you explain to another student the difference between precision and accuracy? MODEL 4: RANDOM AND SYSTEMATIC ERRORS DEVELOP YOUR UNDERSTANDING 1. …. a) What do you conclude about the precision and accuracy of the millimeter stick? [The precision is not affected. However, if a student did not notice and used the meterstick incorrectly, the accuracy would be reduced. His/her reading would be off by 1.1 cm every time.] b) Will this lead to a random or systematic error? [systematic – the error would occur each time the measurement was repeated] 2. Which type of error is related to precision? [random] 3. Which type of error is related to accuracy? [systematic] 4. Which type of error do you have the least control over? [random] Hours 4–6
16
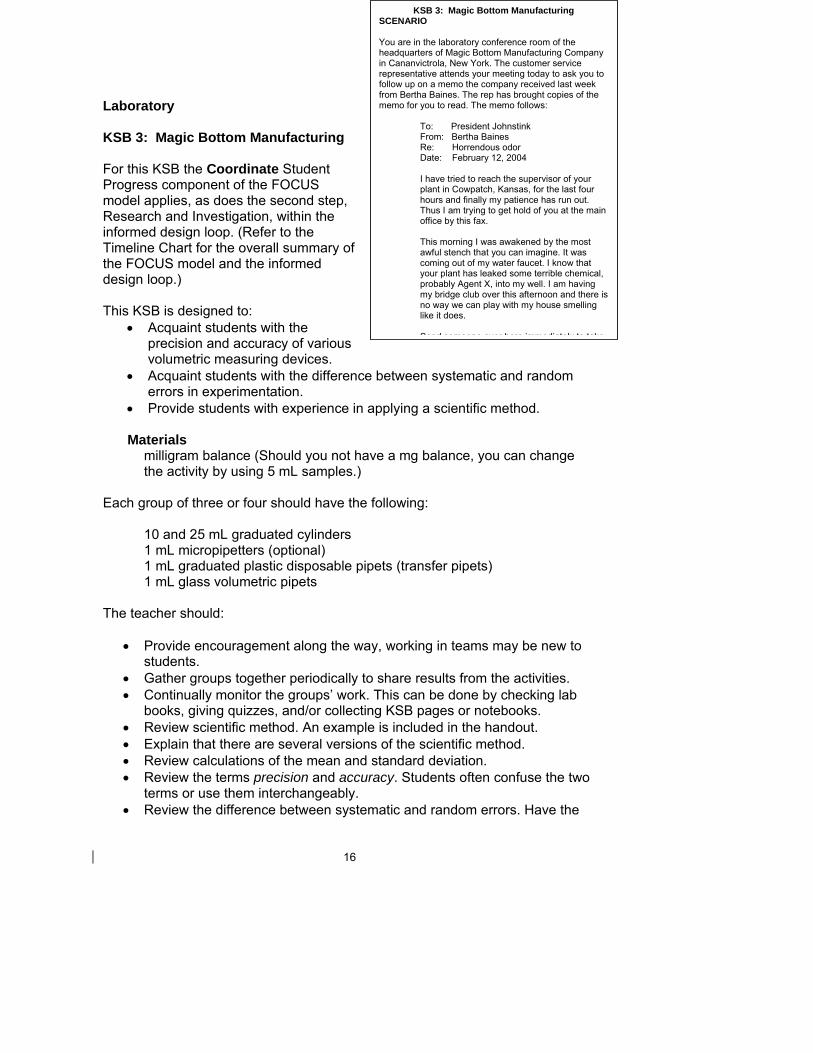
KSB 3: Magic Bottom Manufacturing SCENARIO You are in the laboratory conference room of the headquarters of Magic Bottom Manufacturing Company in Cananvictrola, New York. The customer service representative attends your meeting today to ask you to follow up on a memo the company received last week from Bertha Baines. The rep has brought copies of the memo for you to read. The memo follows:
To: President Johnstink From: Bertha Baines Re: Horrendous odor Date: February 12, 2004 I have tried to reach the supervisor of your plant in Cowpatch, Kansas, for the last four hours and finally my patience has run out. Thus I am trying to get hold of you at the main office by this fax. This morning I was awakened by the most awful stench that you can imagine. It was coming out of my water faucet. I know that your plant has leaked some terrible chemical, probably Agent X, into my well. I am having my bridge club over this afternoon and there is no way we can play with my house smelling like it does. Send someone over here immediately to take
Laboratory KSB 3: Magic Bottom Manufacturing For this KSB the Coordinate Student Progress component of the FOCUS model applies, as does the second step, Research and Investigation, within the informed design loop. (Refer to the Timeline Chart for the overall summary of the FOCUS model and the informed design loop.) This KSB is designed to:
• Acquaint students with the precision and accuracy of various volumetric measuring devices.
• Acquaint students with the difference between systematic and random errors in experimentation.
• Provide students with experience in applying a scientific method.
Materials milligram balance (Should you not have a mg balance, you can change the activity by using 5 mL samples.)
Each group of three or four should have the following:
10 and 25 mL graduated cylinders 1 mL micropipetters (optional) 1 mL graduated plastic disposable pipets (transfer pipets) 1 mL glass volumetric pipets
The teacher should:
• Provide encouragement along the way, working in teams may be new to students.
• Gather groups together periodically to share results from the activities. • Continually monitor the groups’ work. This can be done by checking lab
books, giving quizzes, and/or collecting KSB pages or notebooks. • Review scientific method. An example is included in the handout. • Explain that there are several versions of the scientific method. • Review calculations of the mean and standard deviation. • Review the terms precision and accuracy. Students often confuse the two
terms or use them interchangeably. • Review the difference between systematic and random errors. Have the
17
students discuss how these errors play a role in measurements. • Weighing water seems to be the best way to initiate this activity. Help
students decide on the number of trials to use. Don’t tell them how many trials to use. Instead, let them start out with too few or too many and then help them think about the results and settle on a better number. Five trials seem to result in acceptable data.
• The use of micropipetters is optional. • This activity also works well using 5 mL quantities. Use 30 mL beakers, 10
mL and 25 or 50 mL graduated cylinders, and 5 mL TD pipettes. • Sample data are present in the response section.
RESPONSE KEY FOR KSB 3 REPORT RESULTS Eventually, you may need to inform students that the density of water is 1.0 g/mL. Usually a few students are aware of this and the word gets around. Be alert that they may have a hard time formulating a hypothesis. Notice that some are likely to start by determining the density of water, rather than realizing that because the density is 1.0 g/mL, they can weigh the 1 mL of water to determine the accuracy and precision of the measuring devices. Students typically expect to get the best results from the micropipetter and they often do. However, many groups also get good results from the glass volumetric pipets and sometimes also with the disposable plastic pipets. Later, when addressing the Design Challenge, they need to consider cost of equipment. Accordingly, you may want to get them thinking now about the differences in cost between a micropipetter and a glass pipet and a bulb! Students typically become very focused on the precision and, therefore, the standard deviation. They are less likely to notice whether the average was close to 1.00. Students should be encouraged to practice in advance using each of the measuring devices. They do get better at it with practice. You may want to have students make a table in Excel that includes the experimental data and the average and the standard deviation (STDEV) for each measuring device. Put the data on the chalkboard to compare results from the whole class (they are sometimes fairly different). Have them seek trends on how the number of trials performed may have affected the results. Also, get them thinking about whether it is more appropriate to have one group member do all of the trials for one device and another do all of the trials for another device, or whether each member should do some of the trials for each device. Students are not likely to consider such variables when they design their experiment.
18
KSB 4: Concentration
Concentration is actually a part of our daily lives. For example, when you buy milk, you may choose milk that is 4% fat (whole), 2% fat, 1% fat, or 0% fat (skimmed). Fruit juice containers have to report the actual percentage of juice in them. These percentages express how much of a particular substance is in the liquid. In the case of milk, the percentages express the quantity of fat in the milk; in the case of fruit juice, they express how much pure juice has been mixed with water. Chemists concern themselves with the interactions among substances; thus they must determine how many formula units (molecules, atoms, and ions) are present in a liquid. Previously we used mass to count formula units (one formula mass is equal to one formula unit). When working with liquids, it is usually easier to measure volume than mass. We will now use volume and concentration to count formula units.
You are to:
• Become familiar with the concepts of solute, solvent, and solution. • Show how the molarity of a solution can be used to count formula units in a homogeneous mixture (solution).
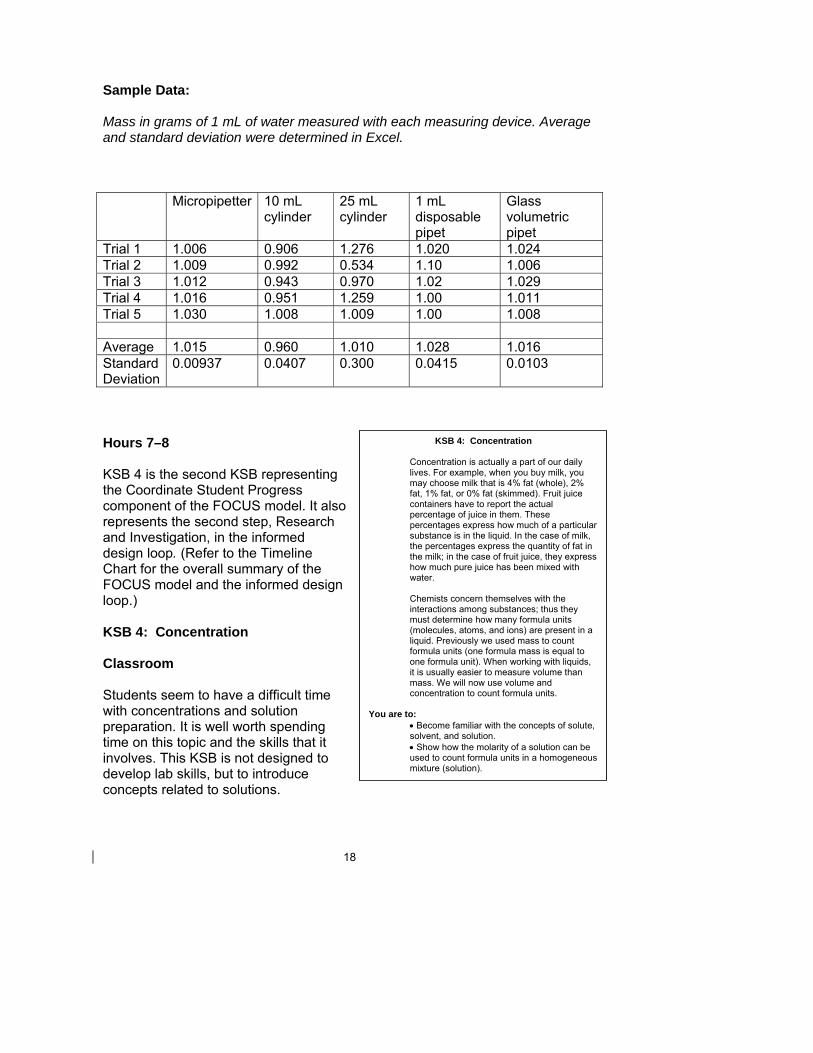
Sample Data: Mass in grams of 1 mL of water measured with each measuring device. Average and standard deviation were determined in Excel. Micropipetter 10 mL
cylinder 25 mL cylinder
1 mL disposable pipet
Glass volumetric pipet
Trial 1 1.006 0.906 1.276 1.020 1.024 Trial 2 1.009 0.992 0.534 1.10 1.006 Trial 3 1.012 0.943 0.970 1.02 1.029 Trial 4 1.016 0.951 1.259 1.00 1.011 Trial 5 1.030 1.008 1.009 1.00 1.008 Average 1.015 0.960 1.010 1.028 1.016 Standard Deviation
0.00937 0.0407 0.300 0.0415 0.0103
Hours 7–8 KSB 4 is the second KSB representing the Coordinate Student Progress component of the FOCUS model. It also represents the second step, Research and Investigation, in the informed design loop. (Refer to the Timeline Chart for the overall summary of the FOCUS model and the informed design loop.) KSB 4: Concentration Classroom Students seem to have a difficult time with concentrations and solution preparation. It is well worth spending time on this topic and the skills that it involves. This KSB is not designed to develop lab skills, but to introduce concepts related to solutions.
19
Materials 500 mL volumetric flask NaCl The teacher should:
• Review gram formula mass (gfm or molar mass). • Introduce the concepts of solute, solvent, and solution. • Show how the molarity of a solution can be used to count formula units in
a homogeneous mixture (solution). • Demonstrate how to prepare solutions.
o In KSB 4, see Model 3: Preparing Solutions of Known Concentration (Direct Addition). Select a solute, such as NaCl, that has a high solubility and is inexpensive. Sodium chloride solutions of 1 M typically require heating to clear the solution; 0.5 M will work fine without heating. This is 14.61 g NaCl for 500 mL of solution.
o Take students through the calculations necessary to make the solution.
o You can show that if you add 500 mL of water rather than diluting to 500 mL, that amount is really too much water. This helps the students see that it is important not to add 1000 mL of water when making a liter of solution.
• Demonstrate how to read a meniscus, and have students practice doing so.
• Discuss the concentration units: molarity, parts per million, and percent. • Emphasize the need to properly label percent solutions—if they are not
properly identified, incorrect concentrations might result. • Check that the students correctly respond to item 6 in KSB 4, Model 4.
(See response key below.) This item involves a particle diagram that should help students conceptualize concentration.
RESPONSE KEY FOR KSB 4 MODEL 1: Define the following terms: SOLUTE – [the material dissolved in a solution; normally the component of a solution that is present in the smaller amount] SOLVENT – [the medium in which a solute is dissolved to form a solution; normally the component that is present in the larger amount] CONCENTRATION – [the quantity of solute dissolved in a given amount of solvent or solution] MOLARITY – [concentration of a solution expressed as the moles of
20
solute per liter of solution; abbreviated M] PERCENT (%) – [percent (parts per 100 parts)]
INTENSIVE – [properties do not depend on how much of a substance we have (examples: density, temperature, melting and boiling points)]
EXTENSIVE – [properties depend on how much of a substance we have (size and mass)]
DEVELOP YOUR UNDERSTANDING 1. Could a substance be a solute in one solution and a solvent in another solution? Explain. [Yes; you could have a solution of ethanol in water (ethanol is the solute), or you could have a different solution with another substance dissolved in ethanol (ethanol is the solvent).] 2. Is the concentration of a solution an intensive or an extensive property? Explain. [Intensive. (The concentration does not change as the size of the sample changes. You could have a drop of a 1 M HCl solution or a large beaker of a 1 M HCl solution. Both are 1 M HCl.] 3. What is the difference between having 1.6 moles of NaCl and 1.6 M NaCl? [1.6 moles describes a definite mass of NaCl (93.50 grams); this is an extensive property. 1.6 M NaCl is a concentration; it does not specify the amount of material present—only relative amounts. This is an intensive property.] MODEL 2: CONCENTRATION AS A RATIO DEVELOP YOUR UNDERSTANDING 1. What concentration unit do chemists usually use? [molarity] 2. What concentration units are often used in biological research and biotechnology laboratories? [percent weight/volume and molarity] 3. What is meant when it is said that a solution is 5.6% by weight sodium chloride? [5.6 g NaCl in 100 g solution] 4. One common feature of concentration is that it is usually equal to:
[concentration = amount of solute amount of solution]
21
5. Which concentration unit is related to the number of particles rather than the mass of the particles? [molarity – moles solute/L solution] MODEL 3: PREPARING SOLUTIONS OF KNOWN CONCENTRATION (Direct Addition) Your instructor will model preparation of a solution of known molarity (M). Describe the methodology used by the instructor below. [To prepare 500.0 mL of 0.500 M NaCl solution: Use 14.61 g of NaCl. To illustrate the point that it doesn’t require 500.0 mL of water to make the solution, you need to measure exactly 500.0 mL of water using the volumetric flask, and then pour the water into another container. Add the NaCl to the volumetric, add back approx. ¾ of the water, and swirl to dissolve the salt. Fill carefully to the line (you should have water left over) and invert several times to mix thoroughly.] Note: If you measure 500.0 mL using a large plastic graduated cylinder, you may find that you won’t have enough water to prepare the solution! Clearly the accuracy of a graduated cylinder may not be sufficient. That is why using the volumetric to measure 500.0 mL of water likely will give more accurate results. DEVELOP YOUR UNDERSTANDING 1. Why is it important to mix the solution to dissolve all of the solute before you dilute to the final volume mark? [As the solute dissolves, the volume may change slightly. It is difficult to mix them once the volumetric is filled to the mark.] 2. Describe how you would prepare one liter of 1.0 M NaBr. (One mole of NaBr weighs 102.90 g.) [Weigh out 102.90 grams of NaBr. Add the NaBr to a one-liter volumetric flask. Fill the volumetric flask about ¾ of the way with water and swirl until the solid is completely dissolved. Fill to the line and invert several times to mix thoroughly.] MODEL 4: MOLARITY CALCULATIONS How would you prepare 500.0 mL of 0.00445 M NaBr? [Given: V = 500.0 mL Find: mass of NaBr M = 0.00445 M NaBr NTK: M = moles of solute/L of solution
22
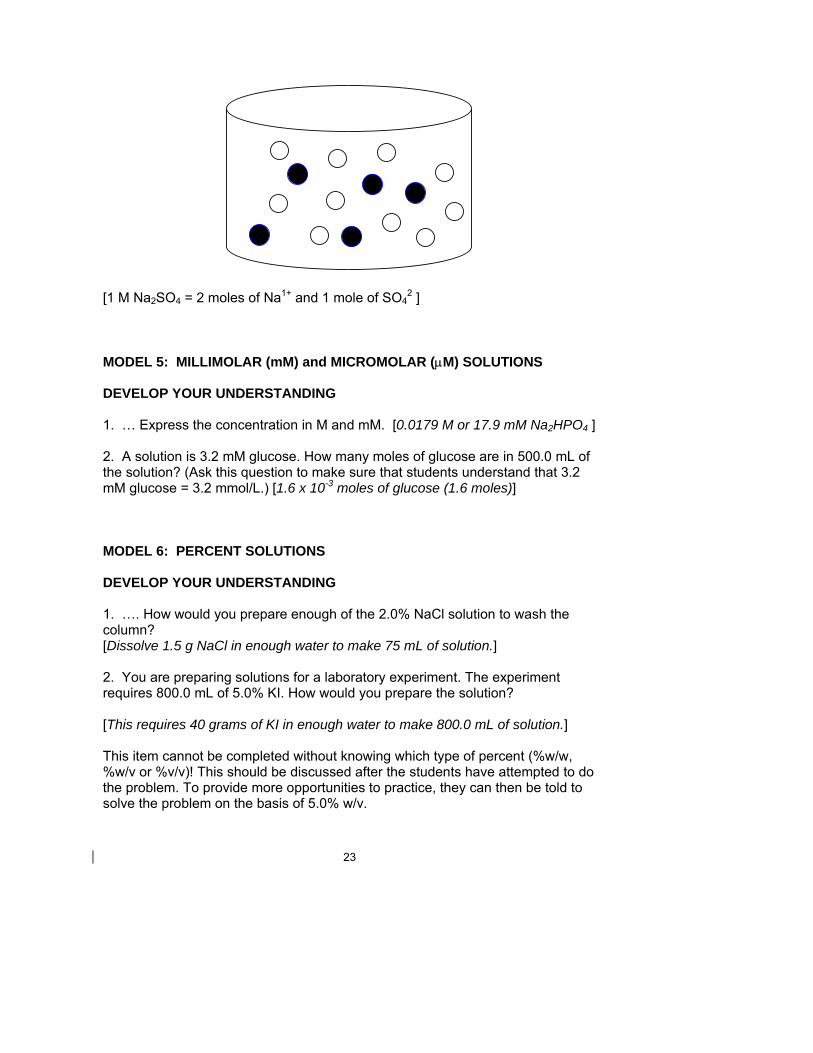
V. M = moles of solute gfm (molar mass) of NaBr Setup: 500.0 mL 1L 0.00445 mol NaBr 102.90 g NaBr 1000 mL L mol NaBr = 0.229 g NaBr 1. Weigh out 0.229 g NaBr. 2. Fill a 500 mL volumetric flask about 2/3 full of water. 3. Add the NaBr to the volumetric flask and mix until all of the NaBr is dissolved. Add more water, if necessary, but do not go over the fill mark. 4. Add water so that the bottom of the meniscus is at the fill line. 5. Cover and mix.] DEVELOP YOUR UNDERSTANDING 1. What information is needed to determine the molarity of a solution? [moles of solute and L of solution] 2. When you make 1 L of solution, do you add 1000 mL of water? Explain. [No, the presence of solute changes the volume.] 3. What would the molarity of the NaBr solution in Model 4 be if the 0.229 g of NaBr was dissolved in enough water to make 100.0 mL of solution instead of 500.0 mL? [0.0223 M NaBr] 4. The gram formula mass (molar mass) of KBr is 119.01 g/mol. What is the molarity of a solution prepared by adding 5.86 g of KBr to a 250 mL volumetric flask and diluting to volume with H2O? [0.197 M KBr] 5. How would you prepare 500.0 mL of 0.0767 M KBr? [Weigh out 4.56 g of KBr. Add the KBr to a 500 mL volumetric flask. Add approximately 300 mL of water. Swirl to dissolve. Fill to the line, invert several times to mix thoroughly.] 6. Draw a particle diagram for a 1M Na2SO4 solution. Let Na1+ = SO4
2- = Let 5 circles = 1 mole of each of the ions.
23
1 Liter [1 M Na2SO4 = 2 moles of Na1+ and 1 mole of SO4
2 ] MODEL 5: MILLIMOLAR (mM) and MICROMOLAR (µM) SOLUTIONS DEVELOP YOUR UNDERSTANDING 1. … Express the concentration in M and mM. [0.0179 M or 17.9 mM Na2HPO4 ] 2. A solution is 3.2 mM glucose. How many moles of glucose are in 500.0 mL of the solution? (Ask this question to make sure that students understand that 3.2 mM glucose = 3.2 mmol/L.) [1.6 x 10⁻³ moles of glucose (1.6 moles)] MODEL 6: PERCENT SOLUTIONS DEVELOP YOUR UNDERSTANDING 1. …. How would you prepare enough of the 2.0% NaCl solution to wash the column? [Dissolve 1.5 g NaCl in enough water to make 75 mL of solution.] 2. You are preparing solutions for a laboratory experiment. The experiment requires 800.0 mL of 5.0% KI. How would you prepare the solution? [This requires 40 grams of KI in enough water to make 800.0 mL of solution.] This item cannot be completed without knowing which type of percent (%w/w, %w/v or %v/v)! This should be discussed after the students have attempted to do the problem. To provide more opportunities to practice, they can then be told to solve the problem on the basis of 5.0% w/v.
24
KSB 5: Dilution There are many laboratory situations that call for researchers and technicians to make solutions. Commercially available solutions are typically concentrated. When solutions of lower concentrations are needed, researchers and technicians are able to prepare them from the concentrated solutions. The process of preparing a more dilute solution by adding a solvent (usually but not always water) to a more concentrated stock solution is called dilution. Increasing the accuracy of measurements is almost always important. Stock solutions are convenient to store and dispense and they also can be used to increase the precision and accuracy of measurements. The precision of a measurement is determined by the precision of the measuring devices. A centigram balance weighs ten grams to four significant figures (10.00 g). A milligram balance weighs ten grams to five significant figures (10.000 g). If you make up 10 mL of a 1% w/v solution, you weigh out 0.10 g (two significant figures). If you make a 10% w/v solution and dilute it 1:9 (i.e., create a 1% w/v solution), then you have three significant figures (because you weighed out 1.00 g) and, accordingly, more precision. Dilution terminology is very confusing and variations in word use may lead to errors. Be sure of what the directions mean, and for future reference, realize that it is critical to use proper notation in your laboratory notebook. You are to:
• Prepare solutions by making dilutions of stock solutions. • Use dilution calculations based on the concepts of molarity, percent concentration, and parts per million to prepare solutions. • Learn the correct terminology for dilutions.
MODEL 1: PREPARING SOLUTIONS OF KNOWN
CONCENTRATION (Solution by Dilution)
In this activity, you prepare a solution and multiple dilutions of that stock solution. The concentrations of these solutions are then compared both visually and using a conductivity meter. Calculations When calculating concentrations of solutions that have been prepared by diluting another solution, you can use the following formula: Ci Vi = Cf Vf where: Ci = initial concentration,
Hours 9–12 KSB 5: Dilution is the third KSB representing the Coordinate Student Progress component of the FOCUS model and also represents the second step, Research and Investigation, in the informed design loop. (Refer to the Timeline Chart for the overall summary of the FOCUS model and the informed design loop.) The major purpose of this KSB is to help students grasp the concepts of concentration and dilution. The focus here is not on lab activity, but rather on providing an introduction to dilutions. The spectroscopy lab places emphasis on development of solution preparation and dilution lab skills. Classroom or Laboratory KSB 5: Dilution Materials (per group of two) This activity is written as a microscale activity, but it could be done on a large scale as well. Although microscale saves lab time and decreases cleanup, if microscale equipment is unavailable, students can use regular pipets and volumetrics. Consider having students make 0.40 M solutions to give them practice making solutions. 0.5 mL of 0.40 M or 10% w/v Fe(NO3)3. 0.5 mL of 1.0 M or 10% w/v KSCN Wash bottle of distilled water Conductivity detector 2 disposable micropipetters Wipes The teacher should:
• Note that the stock iron nitrate is 0.40 M Fe3+.
• Be sure that students use the particle diagrams. Students typically have a hard time conceptualizing concentration changes in
25
dilutions. • Note that Model 3: Solution Terminology is particularly important. Many
mistakes might be made in the dilution notation. Students have a difficult time comprehending “diluting one solution with another.”
• An extra homework activity has been included because of the importance of this KSB. Both biotechnology and chemical technology groups and industries have called attention to the importance of the topic “solutions and dilutions.”
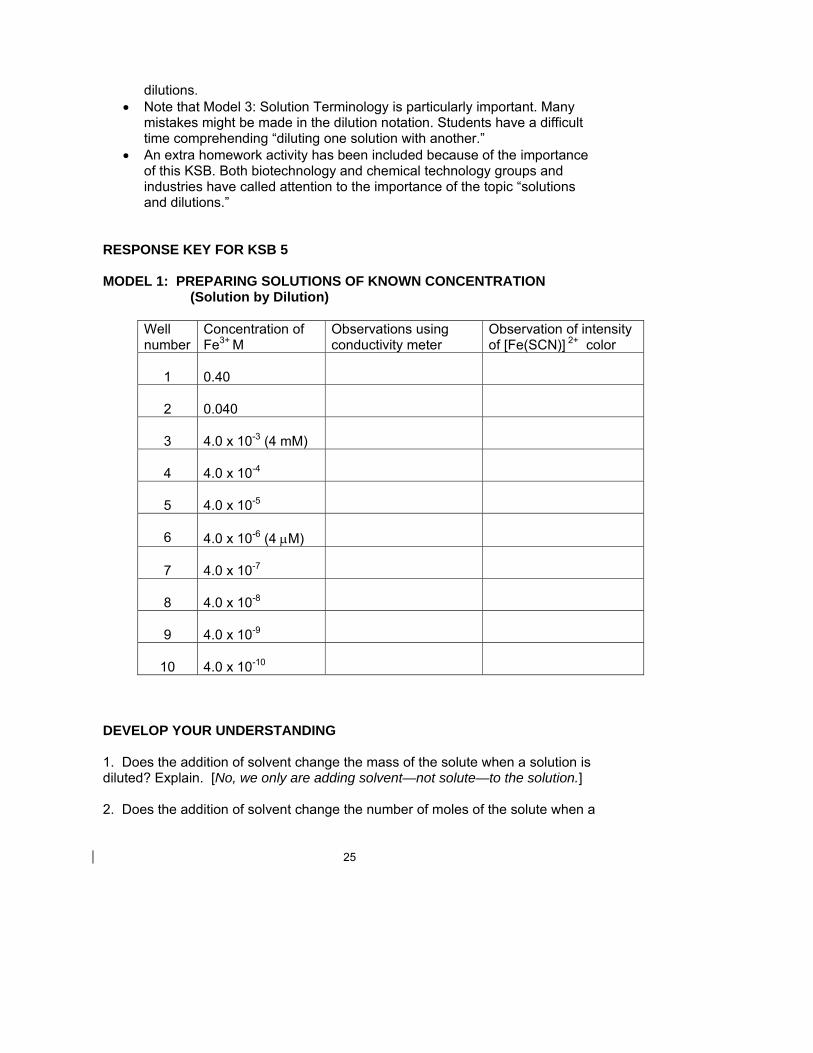
RESPONSE KEY FOR KSB 5 MODEL 1: PREPARING SOLUTIONS OF KNOWN CONCENTRATION
(Solution by Dilution) Well number
Concentration of Fe3+ M
Observations using conductivity meter
Observation of intensity of [Fe(SCN)] 2+ color
1
0.40
2
0.040
3
4.0 x 10⁻³ (4 mM)
4
4.0 x 10⁻⁴
5
4.0 x 10⁻⁵
6
4.0 x 10⁻⁶ (4 µM)
7
4.0 x 10⁻⁷
8
4.0 x 10⁻⁸
9
4.0 x 10⁻⁹
10
4.0 x 10⁻¹⁰
DEVELOP YOUR UNDERSTANDING 1. Does the addition of solvent change the mass of the solute when a solution is diluted? Explain. [No, we only are adding solvent—not solute—to the solution.] 2. Does the addition of solvent change the number of moles of the solute when a
26
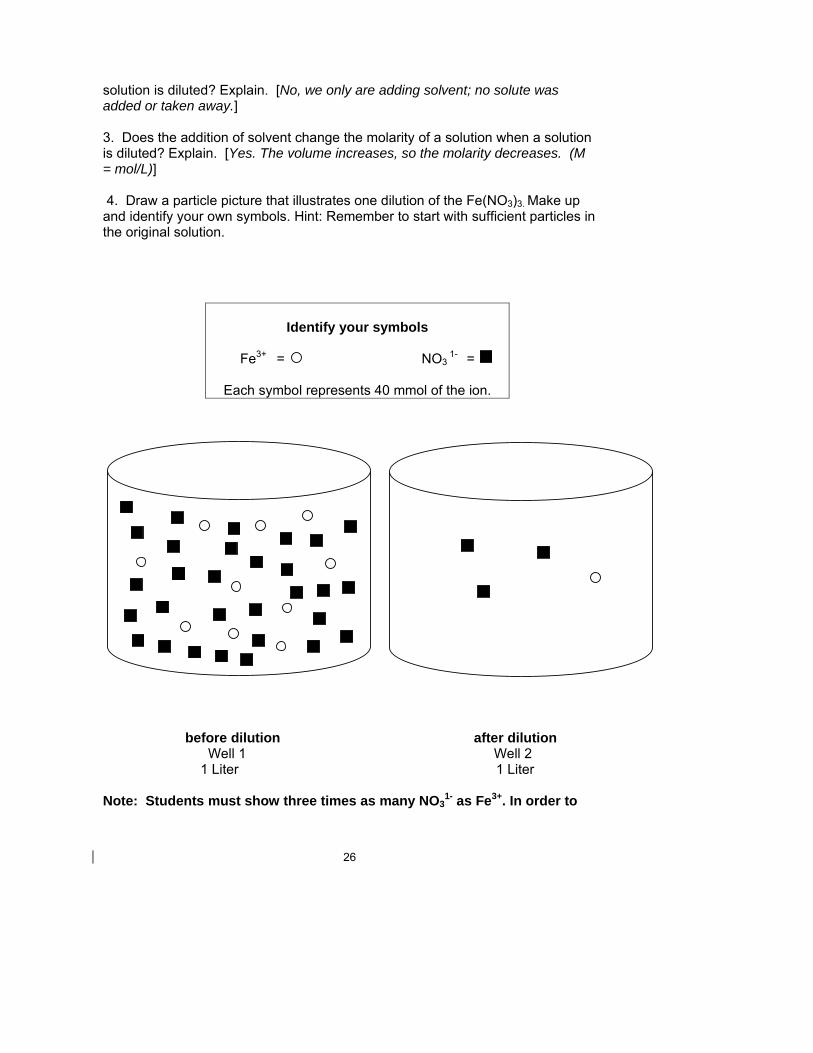
solution is diluted? Explain. [No, we only are adding solvent; no solute was added or taken away.] 3. Does the addition of solvent change the molarity of a solution when a solution is diluted? Explain. [Yes. The volume increases, so the molarity decreases. (M = mol/L)] 4. Draw a particle picture that illustrates one dilution of the Fe(NO3)3. Make up and identify your own symbols. Hint: Remember to start with sufficient particles in the original solution.
Identify your symbols
Fe3+ = NO3
1- =
Each symbol represents 40 mmol of the ion.
before dilution after dilution Well 1 Well 2 1 Liter 1 Liter Note: Students must show three times as many NO3
1- as Fe3+. In order to
27
show the 10-fold dilution, it is convenient to have multiples of 10 in Well 1. The drawing above shows that there are 10 Fe3+ and 30 NO3
1- in Well 1. Given that each symbol represents 40 mmol of the ion, the picture represents a molarity of 0.40 M Fe(NO3)3 in Well 1. 5. Calculate the concentration of the Fe3+ ions in the solutions and record the results in your data table. Show one set of sample calculations. Remember to include the formula. [Cf = Ci(Vi/Vf) = 0.40 M (1/10) = 0.040 M Fe3+] 6. What was the lowest concentration of Fe3+ ions you were able to detect by: Thiocyanate complex ________________
Conductivity meter ________________ Audio conductivity meter (Optional) ________________
7. … Which methodology would you select to detect Fe3+ ions? Why? [The response depends on the conductivity meter used. There is no one correct response.] 8. Did the conductivity meter detect only Fe3+ ions? Explain. [No, the meter detects any ions present.] EXERCISES 1. What is the final concentration of 0.997 M HCl when 5.0 mL of this stock solution is diluted to a final volume of 250.0 mL? [0.020 M HCl] 2. How many mL of 4.256 M Ba(NO3)2 would be required to make 500.0 mL of 0.04987 M NO3 1-? [2.93 mL of 4.256 M Ba(NO3)2.] Note: We are interested in the final concentration of NO3
1-! Students typically forget to account for 2 NO3
1-/1 Ba(NO3)2 . DEVELOP YOUR UNDERSTANDING 1. A can of grape juice concentrate directs us to add 4 cans of water to the concentrate. Which of the following statements are correct? Correct the statement when it is incorrect. a) The final juice solution is 1 part grape juice in 4 parts total. [Incorrect, 1 part grape juice in 5 parts total.]
28
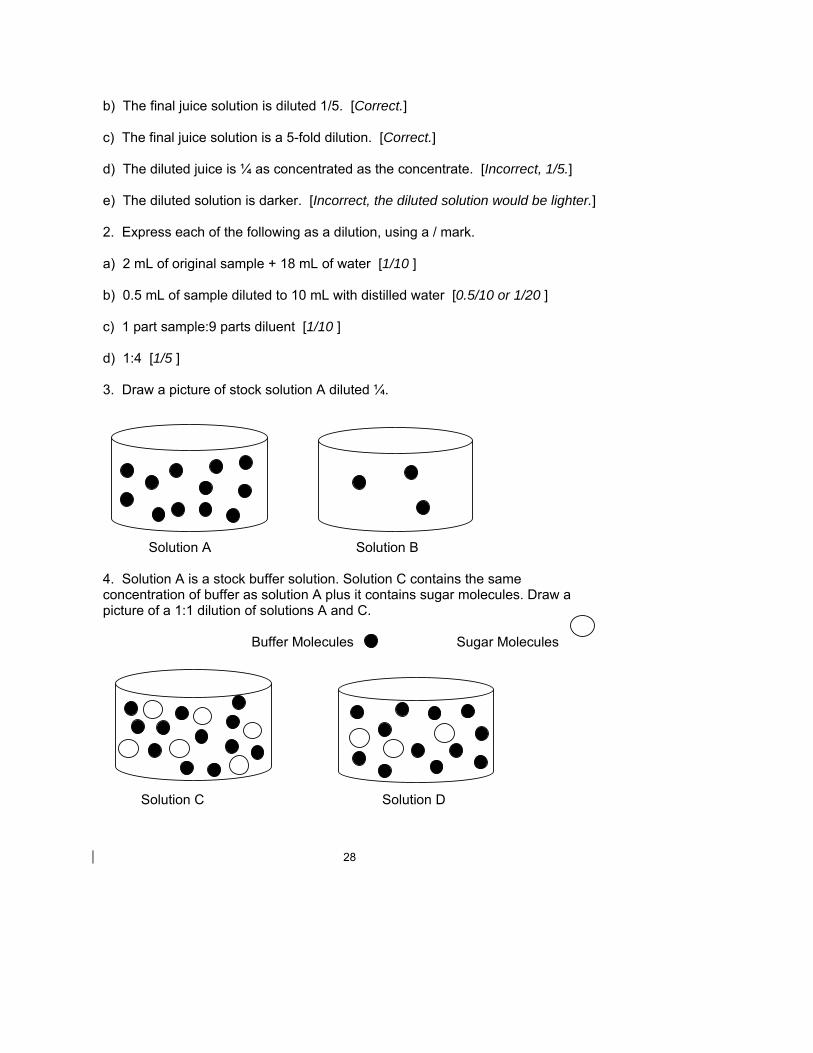
b) The final juice solution is diluted 1/5. [Correct.] c) The final juice solution is a 5-fold dilution. [Correct.] d) The diluted juice is ¼ as concentrated as the concentrate. [Incorrect, 1/5.] e) The diluted solution is darker. [Incorrect, the diluted solution would be lighter.] 2. Express each of the following as a dilution, using a / mark. a) 2 mL of original sample + 18 mL of water [1/10 ] b) 0.5 mL of sample diluted to 10 mL with distilled water [0.5/10 or 1/20 ] c) 1 part sample:9 parts diluent [1/10 ] d) 1:4 [1/5 ] 3. Draw a picture of stock solution A diluted ¼.
Solution A Solution B 4. Solution A is a stock buffer solution. Solution C contains the same concentration of buffer as solution A plus it contains sugar molecules. Draw a picture of a 1:1 dilution of solutions A and C. Buffer Molecules Sugar Molecules
Solution C Solution D
29
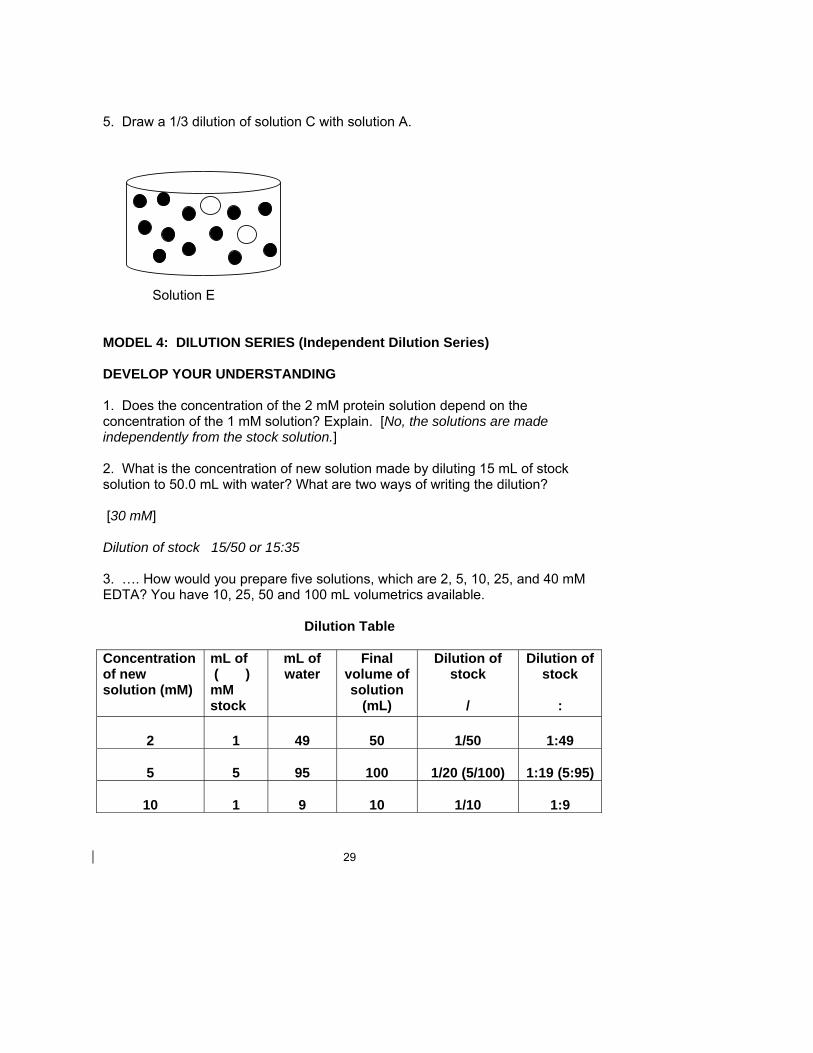
5. Draw a 1/3 dilution of solution C with solution A.
Solution E MODEL 4: DILUTION SERIES (Independent Dilution Series) DEVELOP YOUR UNDERSTANDING 1. Does the concentration of the 2 mM protein solution depend on the concentration of the 1 mM solution? Explain. [No, the solutions are made independently from the stock solution.] 2. What is the concentration of new solution made by diluting 15 mL of stock solution to 50.0 mL with water? What are two ways of writing the dilution? [30 mM] Dilution of stock 15/50 or 15:35 3. …. How would you prepare five solutions, which are 2, 5, 10, 25, and 40 mM EDTA? You have 10, 25, 50 and 100 mL volumetrics available.
Dilution Table
Concentration of new solution (mM)
mL of ( ) mM stock
mL of water
Final volume of solution
(mL)
Dilution of stock
/
Dilution of stock
:
2
1
49
50
1/50
1:49
5
5
95
100
1/20 (5/100)
1:19 (5:95)
10
1
9
10
1/10
1:9
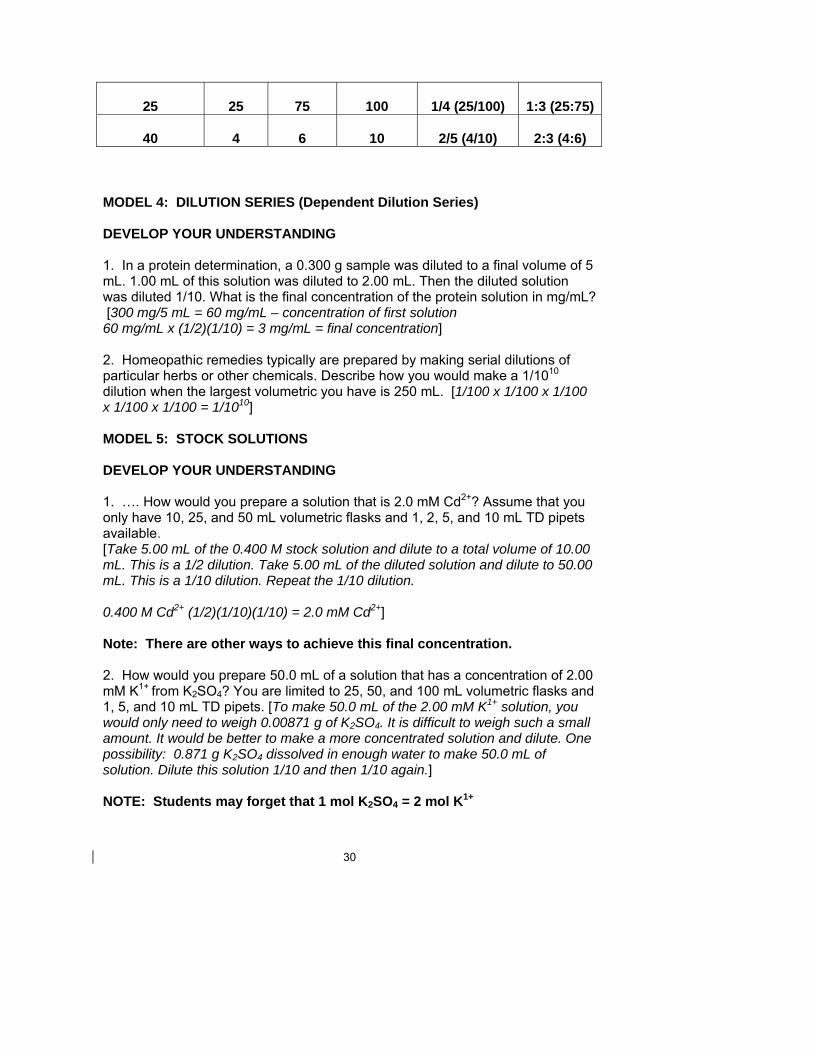
30
25
25
75
100
1/4 (25/100)
1:3 (25:75)
40
4
6
10
2/5 (4/10)
2:3 (4:6)
MODEL 4: DILUTION SERIES (Dependent Dilution Series) DEVELOP YOUR UNDERSTANDING 1. In a protein determination, a 0.300 g sample was diluted to a final volume of 5 mL. 1.00 mL of this solution was diluted to 2.00 mL. Then the diluted solution was diluted 1/10. What is the final concentration of the protein solution in mg/mL? [300 mg/5 mL = 60 mg/mL – concentration of first solution 60 mg/mL x (1/2)(1/10) = 3 mg/mL = final concentration] 2. Homeopathic remedies typically are prepared by making serial dilutions of particular herbs or other chemicals. Describe how you would make a 1/1010 dilution when the largest volumetric you have is 250 mL. [1/100 x 1/100 x 1/100 x 1/100 x 1/100 = 1/1010] MODEL 5: STOCK SOLUTIONS DEVELOP YOUR UNDERSTANDING
1. …. How would you prepare a solution that is 2.0 mM Cd2+? Assume that you only have 10, 25, and 50 mL volumetric flasks and 1, 2, 5, and 10 mL TD pipets available. [Take 5.00 mL of the 0.400 M stock solution and dilute to a total volume of 10.00 mL. This is a 1/2 dilution. Take 5.00 mL of the diluted solution and dilute to 50.00 mL. This is a 1/10 dilution. Repeat the 1/10 dilution. 0.400 M Cd2+ (1/2)(1/10)(1/10) = 2.0 mM Cd2+] Note: There are other ways to achieve this final concentration. 2. How would you prepare 50.0 mL of a solution that has a concentration of 2.00 mM K1+ from K2SO4? You are limited to 25, 50, and 100 mL volumetric flasks and 1, 5, and 10 mL TD pipets. [To make 50.0 mL of the 2.00 mM K1+ solution, you would only need to weigh 0.00871 g of K2SO4. It is difficult to weigh such a small amount. It would be better to make a more concentrated solution and dilute. One possibility: 0.871 g K2SO4 dissolved in enough water to make 50.0 mL of solution. Dilute this solution 1/10 and then 1/10 again.] NOTE: Students may forget that 1 mol K2SO4 = 2 mol K1+
31
KSB 6: Absorption and Transmission of Light Various events occur when light strikes matter. The light can be transmitted, reflected, scattered, or absorbed. It is light absorption that provides the basis of spectrophotometric determinations. A spectrophotometric determination assesses the amount of a substance in a sample, and in some cases, identifies elements or compounds. You are to:
• Determine the difference between transmitted, reflected, scattered, and absorbed light.
• Know what is meant by a molecule’s natural frequency and how that relates to the maximum in an absorbance spectra.
• Determine the wavelength of light emitted from a source when you know what has passed into the sample and which frequencies were absorbed by the sample.
• Know what is meant by absorbance and transmittance and be able to work with related equations.
• Know the relationships of the variables in the Beer-Lambert Law and be able to use the equation.
• Identify the maximum in an absorption spectra. MODEL 1: TRANSMISSION AND ABSORPTION OF VISIBLE LIGHT Transparent materials allow one or more frequencies of visible light to be transmitted through them. The appearance of light that is transmitted through the object depends on the incident light and what colors of light are absorbed by the object.
Name_______________________
Homework
You must turn in all work stapled to this cover sheet. Put your responses in the spaces provided with each item. 1. A solution of potassium chloride is prepared by diluting 18.6 g of KCl with water to a final volume of 250.0 mL. What is the molarity of the KCl solution? [______0.998 M______________ M KCl ] 2. 50.0 mL of a 0.357 M KCl solution is diluted to 250.0 mL with water. What is the molar concentration of the final solution? [______0.0714 M______________ M KCl ] 3. How would you prepare 250.0 mL of a 5.00% (w/v) I2 in ethanol solution? [Dissolve 12.5 g I2 in enough ethanol to make 250.0 mL of solution.] 4. How would you prepare a solution that has a concentration of 1.5 mM Na1+
from solid NaCl? You are limited to 25, 50, and 100 mL volumetric flasks and 1, 5, and 10 mL TD pipets. [There is more than one approach to this problem. The main point is that to make the 1.5 mM directly would require
32
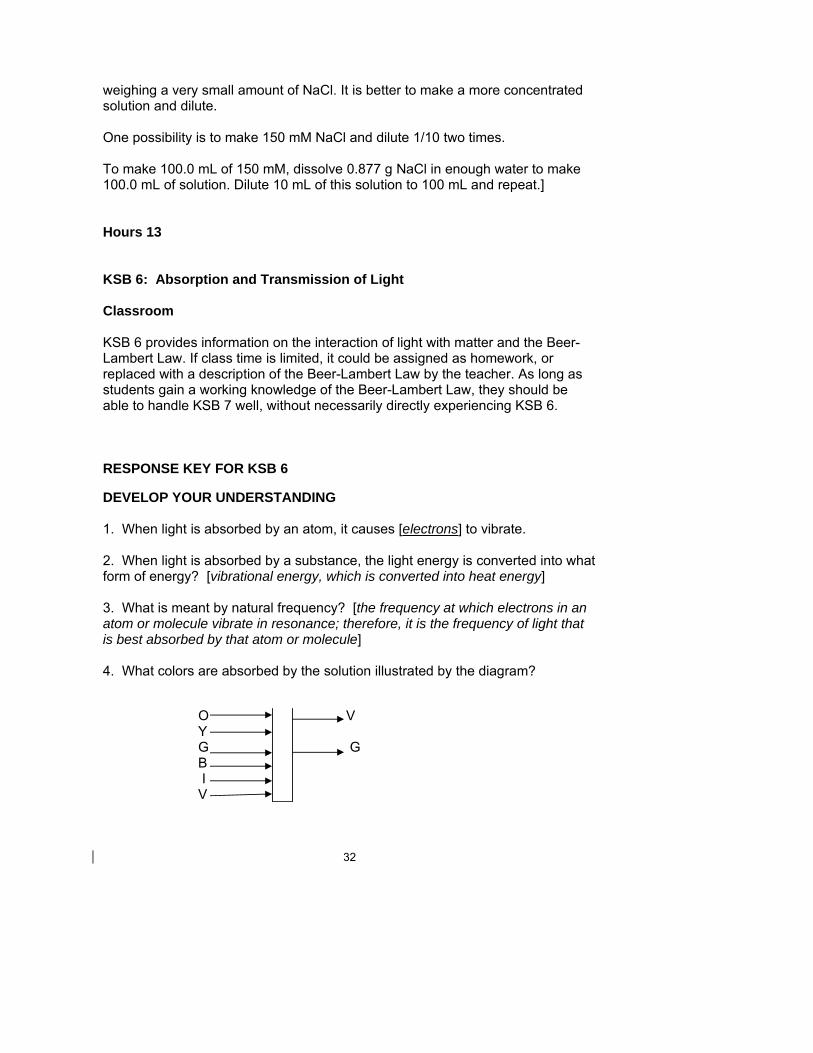
weighing a very small amount of NaCl. It is better to make a more concentrated solution and dilute. One possibility is to make 150 mM NaCl and dilute 1/10 two times. To make 100.0 mL of 150 mM, dissolve 0.877 g NaCl in enough water to make 100.0 mL of solution. Dilute 10 mL of this solution to 100 mL and repeat.] Hours 13 KSB 6: Absorption and Transmission of Light Classroom KSB 6 provides information on the interaction of light with matter and the Beer-Lambert Law. If class time is limited, it could be assigned as homework, or replaced with a description of the Beer-Lambert Law by the teacher. As long as students gain a working knowledge of the Beer-Lambert Law, they should be able to handle KSB 7 well, without necessarily directly experiencing KSB 6. RESPONSE KEY FOR KSB 6 DEVELOP YOUR UNDERSTANDING 1. When light is absorbed by an atom, it causes [electrons] to vibrate. 2. When light is absorbed by a substance, the light energy is converted into what form of energy? [vibrational energy, which is converted into heat energy] 3. What is meant by natural frequency? [the frequency at which electrons in an atom or molecule vibrate in resonance; therefore, it is the frequency of light that is best absorbed by that atom or molecule] 4. What colors are absorbed by the solution illustrated by the diagram? O V Y G G B I V
33
KSB 7: Spectrophotometric Determination of Cu2+
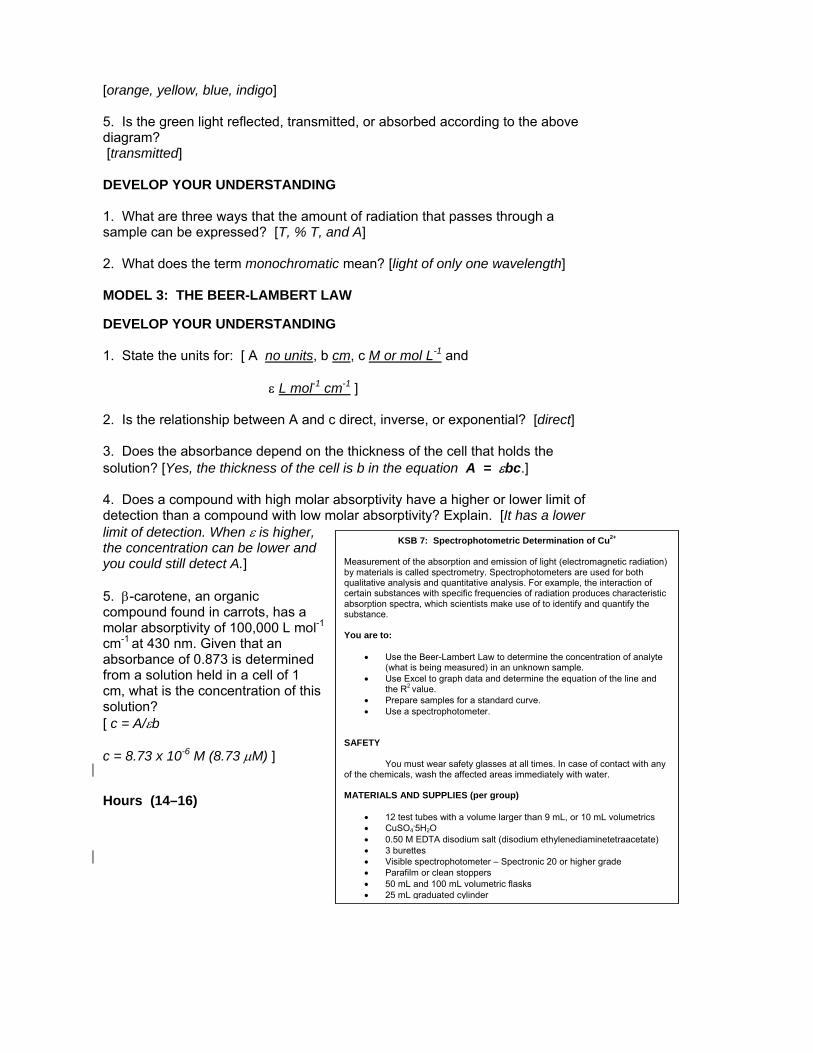
Measurement of the absorption and emission of light (electromagnetic radiation) by materials is called spectrometry. Spectrophotometers are used for both qualitative analysis and quantitative analysis. For example, the interaction of certain substances with specific frequencies of radiation produces characteristic absorption spectra, which scientists make use of to identify and quantify the substance. You are to:
• Use the Beer-Lambert Law to determine the concentration of analyte (what is being measured) in an unknown sample.
• Use Excel to graph data and determine the equation of the line and the R2 value.
• Prepare samples for a standard curve. • Use a spectrophotometer.
SAFETY You must wear safety glasses at all times. In case of contact with any of the chemicals, wash the affected areas immediately with water. MATERIALS AND SUPPLIES (per group)
• 12 test tubes with a volume larger than 9 mL, or 10 mL volumetrics • CuSO4
.5H2O • 0.50 M EDTA disodium salt (disodium ethylenediaminetetraacetate) • 3 burettes • Visible spectrophotometer – Spectronic 20 or higher grade • Parafilm or clean stoppers • 50 mL and 100 mL volumetric flasks • 25 mL graduated cylinder
[orange, yellow, blue, indigo] 5. Is the green light reflected, transmitted, or absorbed according to the above diagram? [transmitted] DEVELOP YOUR UNDERSTANDING 1. What are three ways that the amount of radiation that passes through a sample can be expressed? [T, % T, and A] 2. What does the term monochromatic mean? [light of only one wavelength] MODEL 3: THE BEER-LAMBERT LAW DEVELOP YOUR UNDERSTANDING 1. State the units for: [ A no units, b cm, c M or mol L-1 and ε L mol-1 cm-1 ] 2. Is the relationship between A and c direct, inverse, or exponential? [direct] 3. Does the absorbance depend on the thickness of the cell that holds the solution? [Yes, the thickness of the cell is b in the equation A = εbc.] 4. Does a compound with high molar absorptivity have a higher or lower limit of detection than a compound with low molar absorptivity? Explain. [It has a lower limit of detection. When ε is higher, the concentration can be lower and you could still detect A.] 5. β-carotene, an organic compound found in carrots, has a molar absorptivity of 100,000 L mol-1
cm-1 at 430 nm. Given that an absorbance of 0.873 is determined from a solution held in a cell of 1 cm, what is the concentration of this solution? [ c = A/εb c = 8.73 x 10⁻⁶ M (8.73 µM) ] Hours (14–16)
34
Laboratory KSB 7: Spectrophotometric Determination of Cu2+ is the fifth KSB representing the Coordinate Student Progress component of the FOCUS model. KSB 7 also represents the second step, Research and Investigation, in the informed design loop. (Refer to the Timeline Chart for the overall summary of the FOCUS model and the informed design loop.) This KSB is designed to:
• Introduce students to spectroscopy. • Provide practice in solution preparation and dilution of a stock solution. • Review linear equations. • Make use of Beer’s Law to find unknown concentrations.
Note: To prepare the EDTA (ethylenediaminetetraacetate) 0.5 M solution at pH = 8, add 186.1 g disodium EDTA-2H2O to 800mL H2O. Stir vigorously on a magnetic stirrer. Adjust the pH to 8.0 with NaOH (approximately 20 g of NaOH pellets). CAUTION: NaOH is toxic and caustic. Adjust the volume of the solution to 1 liter with H2O. Sterilization by autoclaving is optional. Note: The disodium salt of EDTA will not go into solution until the pH is adjusted to approximately 8.0. Step 2 of the Procedure, Part A, has students weigh the CuSO4
.5H2 O to the nearest 1 mg. The mass should be within ±10 mg of the theoretical mass calculated in step 1. Remind students to recalculate the actual molarity of their solution. They should use the actual molarity for the rest of their calculations. The teacher should:
• Check the students’ calculations before having them make their solutions. • Review proper procedures for using a burette. • Have students record their visual observations of the standard solution
and their unknowns. • Realize that students typically do not make the connection between color
intensity and concentration, especially with unknowns. • Go over use of the spectrophotometer. • Remind students to continue to use the same cuvet they used to zero the
machine. • Have students read the solutions from the lowest color intensity to the
greatest intensity to eliminate the necessity to rinse the cuvet with water. Have them rinse once with the next solution.
• Use the graphing calculator if students do not have access to Excel or other computer spreadsheet software.
• Remind students not to include their unknowns in the table to calculate
35
concentration of Cu2+ or in their graph. Some students forget that they have to determine the concentration of Cu2+ in the unknowns from the equation of the line and the absorbance of the unknown.
• Review the equation for a linear line, y = mx + b. Relate the Beer-Lambert Law, A = abc, to equation.
• Know that sample data can be found in the response section. RESPONSE KEY FOR KSB7 PROCEDURE A. Preparation of Solutions and Standards
Stock solution of 0.0200 M CuSO4 1. How many grams of CuSO4
.5H2O are needed to prepare 100.0 mL of the 0.0200 M CuSO4 solution? [0.499 g of CuSO4
.5H2O to make 100.0 mL of 0.0200 M CuSO4 ] 0. 200 M EDTA 1. How many mL of 0.50 M EDTA disodium salt (EDTA) are needed to prepare 50.0 mL of 0.20 M EDTA? [20.0 mL of 0.50 M EDTA diluted to 50 mL. They can use a graduated cylinder to measure the 20 mL.] Hours 17–20 Classroom or Laboratory The students are ready to concentrate on the third, fourth, and fifth steps in the design process: Generate Alternative Designs, Choose and Justify Optimal Design, and Develop a Prototype. Review the design process with the students and allow them time to consider what they have learned and how it will help them address the kit Design Challenge. A web search will lead them to a few different determinations of iron. The most common use is either thiocyanate or phenanthroline. Iron can be present in water as Fe+3 or Fe+2. Phenanthroline complexes the Fe+2 form. Hydroxylamine or another reducing agent is needed to reduce Fe+3 to Fe+2. Different search engines give different results. Students who use MSN as their search engine tend to miss some of the better options. Google works very well.
36
The teacher should: • Review the design process with students. • Review web searches. These can be done out of class. • Remind students to consider the toxicity and disposal of their chemicals of
choice. • Remind students that cost and size of their designs are to be considered. • Have students submit their design ahead of the time during which they will
test it. This provides a safety check and an opportunity to set out chemicals and glassware. It also allows for guiding students in a different direction should you prefer that they have a successful determination of the iron in a timely way.
• Review the rubric that will be used to assess their work. Do not wait until the end of the module.
Hours 21–23 Laboratory At this time, students test and evaluate the design solution (the sixth step in the informed design loop). Hours 24–25 Classroom Unite the class in thinking about what has been accomplished (the fourth component of the FOCUS model). Have students design a poster or a PowerPoint presentation for delivery during a poster session. This provides each of them with an opportunity to experience making presentations and it gives you an opportunity for authentic assessment. The teacher should:
• Provide poster boards and/or access to computers for PowerPoint presentations.
• Grade the posters and provide constructive feedback to the students. • Collect and grade the individual lab notebooks.
Then, it is time to sum up progress on the learning goals (the final component of the FOCUS model). Deal with students collegially as you and they discuss what was right and wrong about the mod, their performance, and your performance.
37
VII. STUDENT HANDOUT SECTION
(STUDENT HANDOUT SECTION FOLLOWS)
INTRODUCTION (STUDENT HANDOUT 1)
OVERVIEW OF THE MODULE AND DESIGN CHALLENGE
OVERVIEW In the NYSCATE module Solutions and Dilutions, you will learn to apply the process of informed design and problem solve a real-world problem using a scientific method. You are challenged to design a kit that will be used to measure iron concentration in drinking water. As you consider various options for your design, you immerse yourself in several major topics of chemistry, including stoichiometry and spectroscopy, and acquire many skills that are standard operating procedure (SOP) in chemistry or biotechnology laboratories. You also discover that solutions to the problems you encounter in addressing the challenge have more than one answer and cannot be solved simply by reciting knowledge learned by rote. At the conclusion of this module, you should be able to:
• Measure and document data with the appropriate number of digits. • State the difference between precision and accuracy and explain how
significant figures relate to these concepts. • Describe the difference between random and systematic errors. • Record your work in a laboratory notebook according to professional
standards. • Demonstrate how the molarity of a solution can be used to count formula
units in a homogeneous mixture (solution). • Identify concentration units and know how to use them appropriately. • Prepare solutions from scratch and by dilution. • Describe the relationship between intensity of color and concentration. • Use a spectrophotometer to determine an absorption spectrum and a
Beer’s Law plot. • Use a spreadsheet to graph, calculate, and analyze data.
PROBLEM CONTEXT Introduction In a small African country a concern has developed over a recent increase in African siderosis. African siderosis is a condition of iron overload thought to be
38
associated with a diet that is high in iron. The condition may be a result of a genetic mutation similar to HFE gene mutations associated with hemochromatosis in Caucasians. Design Challenge A representative from the health ministry of the African country has approached your company to develop a kit that can be used to measure iron in the drinking water and food supply. The representative informs you and your research associates that her country is very poor. She notes that the inhabitants have limited access to water and that distilled water is extremely difficult to obtain or produce. Specifications A large corporation in the United States has donated spectrophotometers to the African labs, which otherwise lack sufficient lab supplies. Therefore, the kit should supply all of the materials needed to conduct the measurements, including a small-scale micropipetter or micropipettes, volumetrics, and all other required equipment and reagents. A set of directions (SOP) for making the reagents and the laboratory procedure for making the measurements must also be included. A translator is available to translate into the appropriate languages.
Constraints
• A minimum precision of 5%. • Volumetrics must be 50 mL or, preferably, smaller. • The procedure should use a minimum amount of water, especially distilled
water. STUDENT REQUIREMENTS In the NYSCATE module Solutions and Dilutions, you are expected to: • Work in a team to address the Design Challenge presented in this module. • Work safely in the laboratory. • Maintain a proper laboratory notebook throughout the entire module. • Complete the necessary Knowledge and Skill Builder (KSB) activities that
are associated with the Design Challenge for this module. • Work with your team to address the Design Challenge and to prepare and
deliver a classroom presentation on your work. • Individually submit a completed laboratory notebook that includes the results
of your work.
39
(STUDENT HANDOUT 2)
BRAINSTORMING
HOW TO BRAINSTORM
• Group members may call out ideas spontaneously, or the team leader can call upon each member, in turn, for one of his/her ideas. In the latter case, members may pass if they don't have an idea at that time. Be aware that introverts and extroverts react to brainstorming quite differently.
• The scribe records all ideas verbatim; no editing or
summarizing may be done without permission.
• An important group processing goal is to develop mutual trust. BRAINSTORMING RULES
• This is not a time for discussion. It is a time to generate ideas quickly. Discussion will follow brainstorming.
• Do not evaluate ideas out loud. For example, do not make
comments such as “That is a very good idea” or “That suggestion was just plain stupid.” All ideas are potentially beneficial.
• Encourage a wide range of ideas—from obvious to subtle, to
out of the box, or off the wall. No idea is ridiculous. • Ideas may rebuild on the ideas of others. • Each idea presented belongs to the group, not the person who
said it.
• Strive for quantity. Narrow down later.
40
KSB 1: The Laboratory Notebook A critical skill for each laboratory worker to develop is the proper documentation of laboratory work. Biological and chemical laboratory supervisors advise that one of the most critical skills for laboratory work is good record keeping. In industry and research laboratories, notebooks are legal documents that are used to obtain patents and protect research. A good laboratory notebook is complete enough that you, or someone else, can repeat the work on the basis of the information documented in the notebook. When you have read the guidelines for maintaining a laboratory notebook, set up your laboratory notebook according to those guidelines. FUNCTIONS The functions of a laboratory notebook include:
• Providing dated records of what an individual has done. • Providing legal documents for patents. • Describing for others how to perform specific procedures. • Demonstrating how a procedure was performed. • Providing records of all tests performed on a product.
GUIDELINES You are to keep a chronological log of everything that you do in the laboratory. Although the type of laboratory notebook and documentation may vary from company to company, there are basic guidelines that every laboratory worker should follow:
• Use only a bound notebook. • Number all pages before you use the notebook. • Never remove pages from the notebook for any reason. • Use only black ink to ensure that the entries show clearly after
photocopying. • Handwriting must be clear, complete, and legible. • Record your observations and data immediately and directly into the
notebook and not on a separate sheet of paper. • If you have separate pages (such as instrument printouts or graphs) that
are to be included in the notebook, add them, but never cover other information up when you do so. Never fold a page into your notebook.
• If you affix material into your notebook, tape or paste all sides of it to the notebook page. Write “NWUI” (no writing under the insert) on the page near the material along with your initials and the date on which the material was added.
• Do not erase. Cross out errors with a single line so that the original text is still visible and can be read. Add your initials and a date next to the correction.
41
• Make clear notes of problems encountered. Do not try to erase or hide mistakes. Unused portions of a laboratory notebook page should be crossed out with a diagonal line so that nothing can be added to the page at a later time.
• Be objective in your documentation. (Avoid personal commentary and notes.)
• Make sure that the information on materials and methods is detailed enough that the generated designs and experiments can be repeated using the information in your laboratory notebook (including such things as vendor names, equipment model numbers).
Include the following components in your laboratory notebooks: MAIN COMPONENTS
• Identifying Information — The front of the notebook is for identifying information. This should include your name, company name, project name, date, an identification number for the notebook (number the notebook if it is part of a series of notebooks), and other important identifiers that may be appropriate.
• Contents — A table of contents with page numbers referenced. • Page Numbers — A page number should appear on every page. All of
the pages should be numbered before using the notebook for the first time.
• Statement of Responsibility — At the top of every page should appear: “prepared by,” or “recorded by,” with your name and date. At the bottom of every page should appear: “witnessed by,” or “read and understood by,” with the initials of the lab manager. (The lab manager should initial or sign the lab notebooks at the end of each classroom and laboratory session.)
• Information Sources — Include literature and web sources or notes from colleagues.
• Dates, Titles, and Descriptions — For each day’s work, provide a date, title, purpose, and description of the day’s activities. Each day should begin on a new page; a diagonal line is to be drawn through any unused portion of the previous day’s work.
• Rationale — A statement of the rationale for the activities that will be documented should explain the reason for performing a documented task.
• Equations and Calculations — Relevant equations and calculations must be included. Show a sample calculation.
• Equipment and Materials — A complete description of all materials and equipment is to be included. Sometimes a drawing is very helpful.
• Procedural Details — The steps for all protocols are to be documented in the notebook. This may be a reference to a standard operating procedure (SOP) that a company keeps on file. Another option may be to cut and paste a written protocol into the notebook to avoid having to rewrite every step. Such additions should be properly referenced.

42
• Data — All data that are collected are to be documented in the notebook. Should this involves printouts or other forms of output, they are to be clearly labeled and affixed in the notebook according to the directions in the guidelines (see above).
• Observations — All observations should be recorded. • Summaries — When an activity is interrupted, a brief summary should be
produced. • Conclusions and Interpretations — It is appropriate in the notebook to
summarize preliminary interpretations of observations and data. When you have read and understood the guidelines for maintaining a laboratory notebook, set up your laboratory notebook according to those guidelines.
43
KSB 2: Significant Figures and Measurement
In an official sporting event the difference of a hundredth of a second may determine the first- or second-place winner, or whether a new world record has been set. Thus, times must be reported and recorded to the appropriate number of significant figures. Scientists as well make measurements in their daily work where small differences may be critical to interpreting the results. It is important that the collected data are represented with the correct number of significant figures, because these numbers convey the quality (precision) of the measurements to readers of the data. Precision tells us two things about a measurement: the finest (smallest) unit that has been measured and how easily the measurement can be reproduced using the same instrument and procedure. Accuracy refers to how close a measurement comes to a true or accepted value. Although the two terms precision and accuracy are typically used interchangeably in conversation, they do have their own distinct meanings. You are to:
• Measure and document data using the appropriate number of digits. • Know the difference between precision and accuracy and how significant
figures relate to precision and accuracy. • Know the difference between random and systematic errors. • Develop the skill of estimating when using analog measuring devices. • Use Excel or other spreadsheets to do statistical determinations.
MATERIALS
Metersticks having no markings Metersticks with mm markings on one side, cm markings on another side, and dm markings on a third side
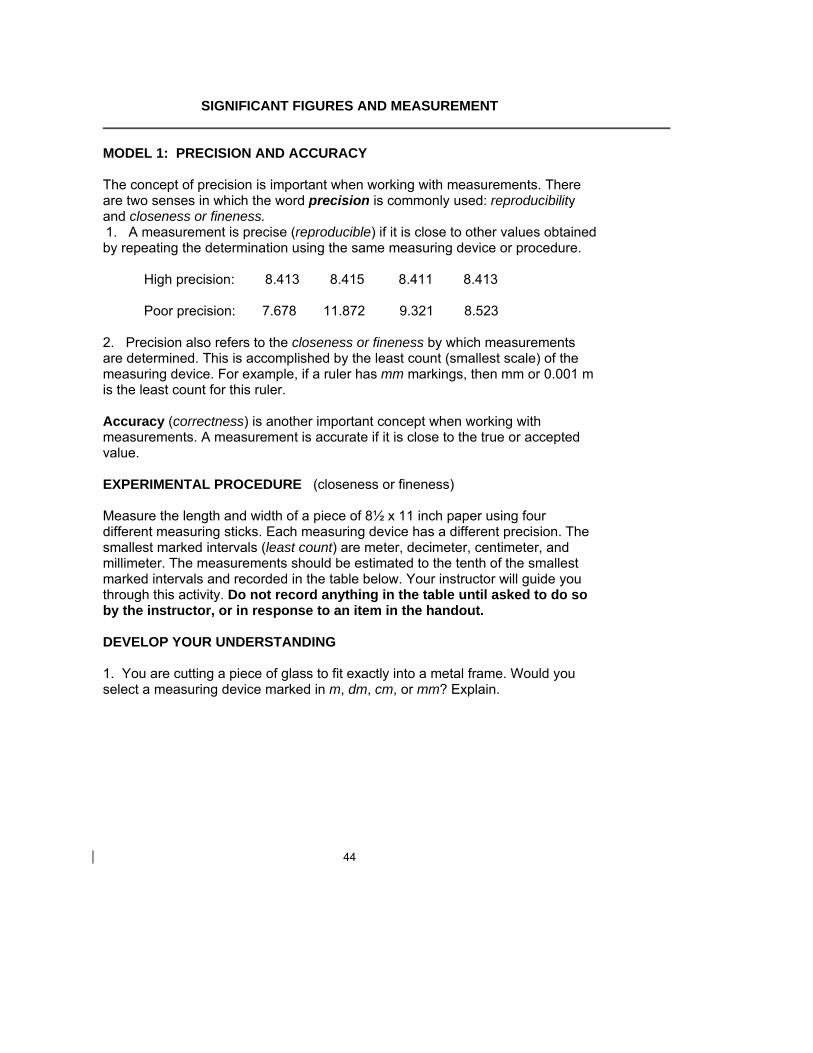
44
SIGNIFICANT FIGURES AND MEASUREMENT
MODEL 1: PRECISION AND ACCURACY The concept of precision is important when working with measurements. There are two senses in which the word precision is commonly used: reproducibility and closeness or fineness. 1. A measurement is precise (reproducible) if it is close to other values obtained by repeating the determination using the same measuring device or procedure. High precision: 8.413 8.415 8.411 8.413 Poor precision: 7.678 11.872 9.321 8.523 2. Precision also refers to the closeness or fineness by which measurements are determined. This is accomplished by the least count (smallest scale) of the measuring device. For example, if a ruler has mm markings, then mm or 0.001 m is the least count for this ruler. Accuracy (correctness) is another important concept when working with measurements. A measurement is accurate if it is close to the true or accepted value. EXPERIMENTAL PROCEDURE (closeness or fineness) Measure the length and width of a piece of 8½ x 11 inch paper using four different measuring sticks. Each measuring device has a different precision. The smallest marked intervals (least count) are meter, decimeter, centimeter, and millimeter. The measurements should be estimated to the tenth of the smallest marked intervals and recorded in the table below. Your instructor will guide you through this activity. Do not record anything in the table until asked to do so by the instructor, or in response to an item in the handout. DEVELOP YOUR UNDERSTANDING 1. You are cutting a piece of glass to fit exactly into a metal frame. Would you select a measuring device marked in m, dm, cm, or mm? Explain.
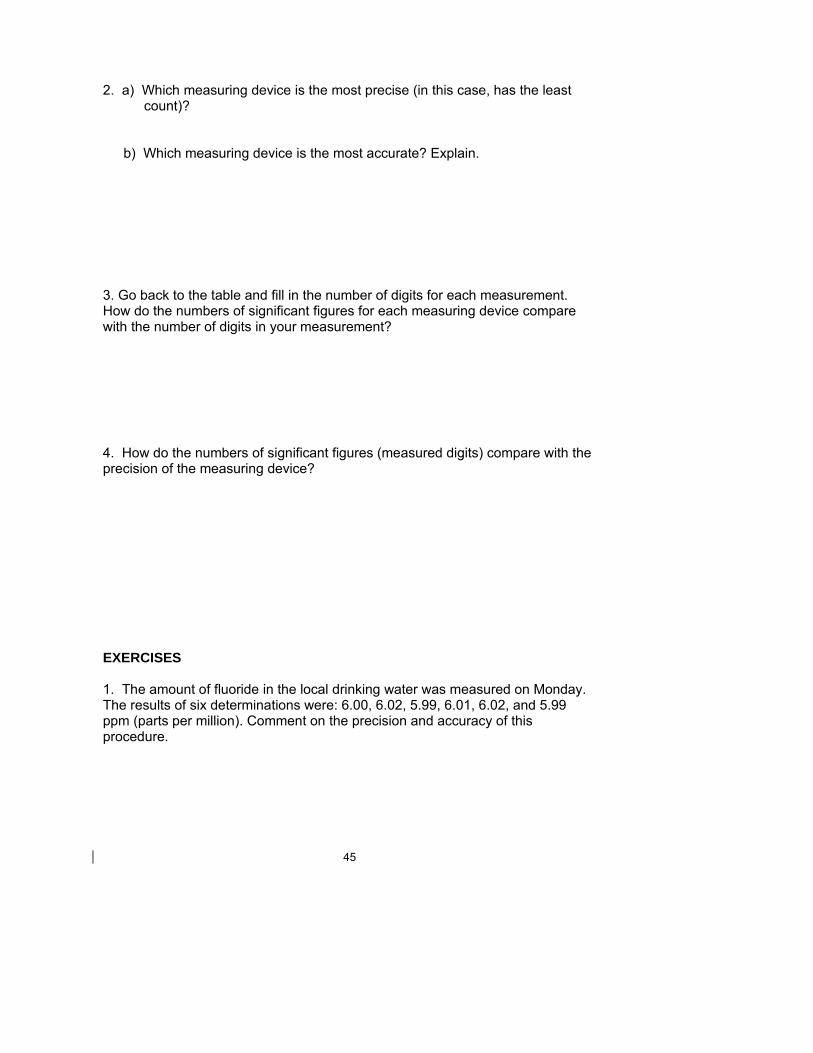
45
2. a) Which measuring device is the most precise (in this case, has the least count)?
b) Which measuring device is the most accurate? Explain.
3. Go back to the table and fill in the number of digits for each measurement. How do the numbers of significant figures for each measuring device compare with the number of digits in your measurement? 4. How do the numbers of significant figures (measured digits) compare with the precision of the measuring device? EXERCISES 1. The amount of fluoride in the local drinking water was measured on Monday. The results of six determinations were: 6.00, 6.02, 5.99, 6.01, 6.02, and 5.99 ppm (parts per million). Comment on the precision and accuracy of this procedure.
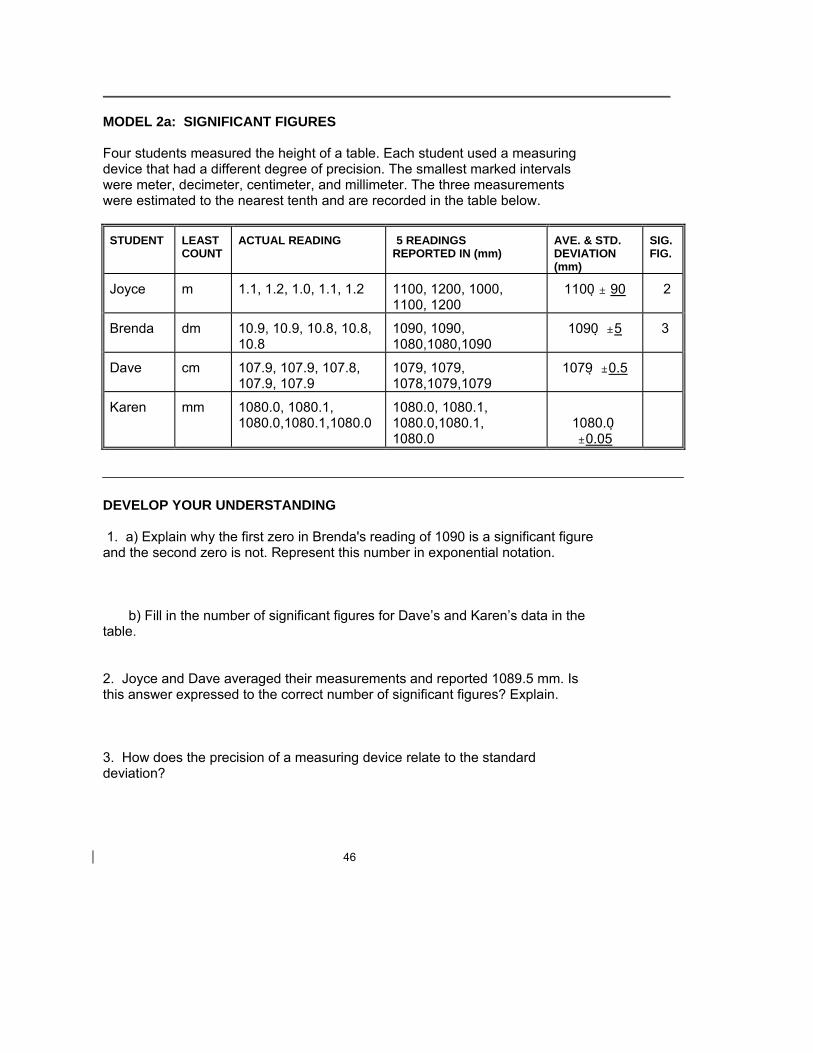
46
MODEL 2a: SIGNIFICANT FIGURES Four students measured the height of a table. Each student used a measuring device that had a different degree of precision. The smallest marked intervals were meter, decimeter, centimeter, and millimeter. The three measurements were estimated to the nearest tenth and are recorded in the table below.
STUDENT LEAST COUNT
ACTUAL READING 5 READINGS REPORTED IN (mm)
AVE. & STD. DEVIATION (mm)
SIG. FIG.
Joyce m 1.1, 1.2, 1.0, 1.1, 1.2 1100, 1200, 1000, 1100, 1200
1100 " 90 2
Brenda dm 10.9, 10.9, 10.8, 10.8, 10.8
1090, 1090, 1080,1080,1090
1090 "5 3
Dave cm 107.9, 107.9, 107.8, 107.9, 107.9
1079, 1079, 1078,1079,1079
1079 "0.5
Karen mm 1080.0, 1080.1, 1080.0,1080.1,1080.0
1080.0, 1080.1, 1080.0,1080.1, 1080.0
1080.0 "0.05
DEVELOP YOUR UNDERSTANDING 1. a) Explain why the first zero in Brenda's reading of 1090 is a significant figure and the second zero is not. Represent this number in exponential notation.
b) Fill in the number of significant figures for Dave’s and Karen’s data in the table.
2. Joyce and Dave averaged their measurements and reported 1089.5 mm. Is this answer expressed to the correct number of significant figures? Explain. 3. How does the precision of a measuring device relate to the standard deviation?
47
4. In multiplication and division we determine which number has the least number of significant figures and report our answer to this number of significant figures. Why is this done? MODEL 2b: List the rules for significant figures given to you by your instructor.
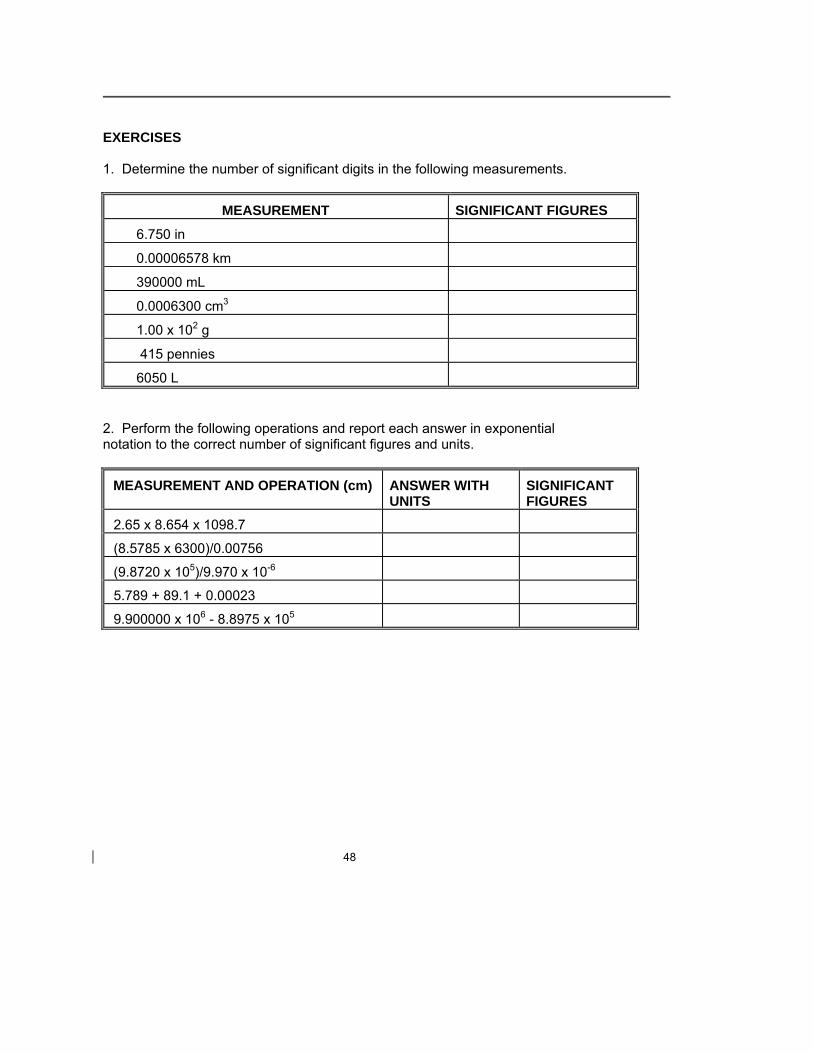
48
EXERCISES 1. Determine the number of significant digits in the following measurements.
MEASUREMENT SIGNIFICANT FIGURES
6.750 in
0.00006578 km
390000 mL
0.0006300 cm3
1.00 x 10² g
415 pennies
6050 L 2. Perform the following operations and report each answer in exponential notation to the correct number of significant figures and units.
MEASUREMENT AND OPERATION (cm) ANSWER WITH UNITS
SIGNIFICANT FIGURES
2.65 x 8.654 x 1098.7
(8.5785 x 6300)/0.00756
(9.8720 x 10⁵)/9.970 x 10-6
5.789 + 89.1 + 0.00023
9.900000 x 10⁶ - 8.8975 x 10⁵
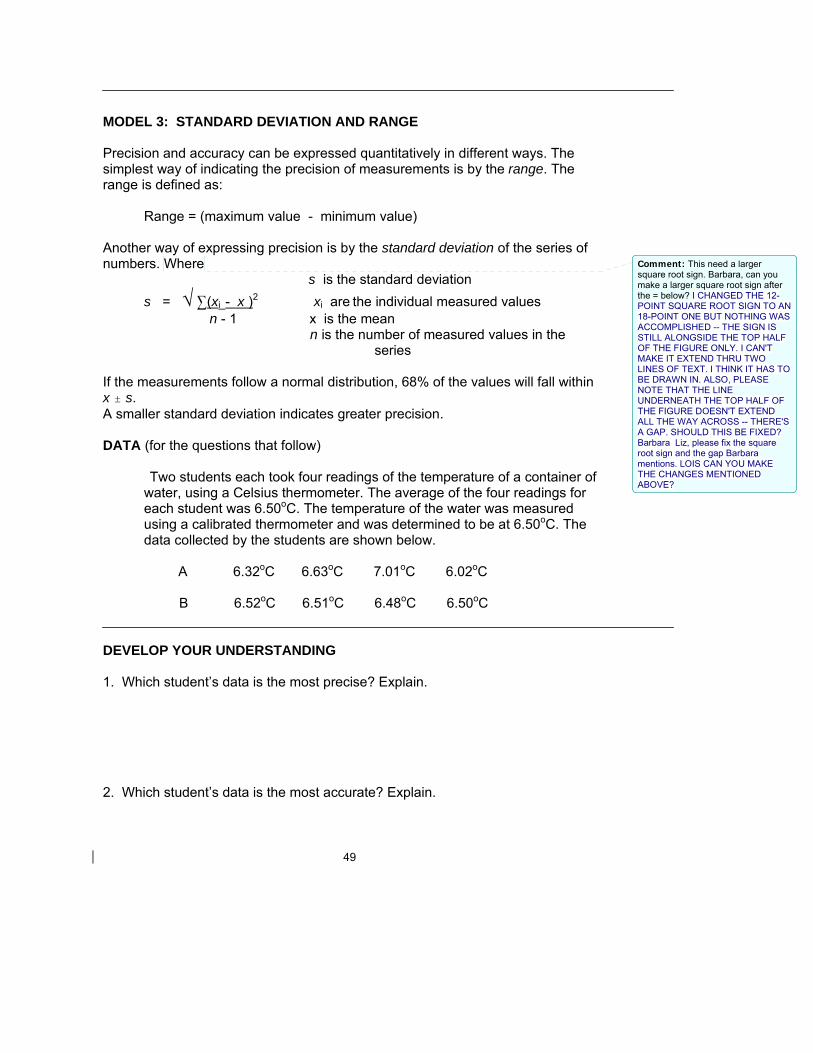
49
MODEL 3: STANDARD DEVIATION AND RANGE Precision and accuracy can be expressed quantitatively in different ways. The simplest way of indicating the precision of measurements is by the range. The range is defined as: Range = (maximum value - minimum value) Another way of expressing precision is by the standard deviation of the series of numbers. Where s is the standard deviation s = √ 3(xi - x )2 xi are the individual measured values n - 1 x is the mean
n is the number of measured values in the series
If the measurements follow a normal distribution, 68% of the values will fall within x " s. A smaller standard deviation indicates greater precision. DATA (for the questions that follow)
Two students each took four readings of the temperature of a container of water, using a Celsius thermometer. The average of the four readings for each student was 6.50oC. The temperature of the water was measured using a calibrated thermometer and was determined to be at 6.50oC. The data collected by the students are shown below.
A 6.32oC 6.63oC 7.01oC 6.02oC B 6.52oC 6.51oC 6.48oC 6.50oC DEVELOP YOUR UNDERSTANDING 1. Which student’s data is the most precise? Explain. 2. Which student’s data is the most accurate? Explain.
Comment: This need a larger square root sign. Barbara, can you make a larger square root sign after the = below? I CHANGED THE 12-POINT SQUARE ROOT SIGN TO AN 18-POINT ONE BUT NOTHING WAS ACCOMPLISHED -- THE SIGN IS STILL ALONGSIDE THE TOP HALF OF THE FIGURE ONLY. I CAN'T MAKE IT EXTEND THRU TWO LINES OF TEXT. I THINK IT HAS TO BE DRAWN IN. ALSO, PLEASE NOTE THAT THE LINE UNDERNEATH THE TOP HALF OF THE FIGURE DOESN'T EXTEND ALL THE WAY ACROSS -- THERE'S A GAP. SHOULD THIS BE FIXED? Barbara Liz, please fix the square root sign and the gap Barbara mentions. LOIS CAN YOU MAKE THE CHANGES MENTIONED ABOVE?
50
3. What are the ranges (minimum and maximum) for the two sets of numbers? Use a calculator or spreadsheet. High precision (B): ______________________ Poor precision (A): ______________________ 4. What is the standard deviation of each series of numbers? High precision: _______________________ Poor precision: _______________________ 5. How would you explain to another student the difference between precision and accuracy?
MODEL 4: RANDOM AND SYSTEMATIC ERRORS Errors are of two general types: systematic (determinate) and random (indeterminate). Systematic errors occur each time a measurement is repeated. If a centimeter is cut off from a meterstick, the meterstick will always measure one centimeter short. In general, systematic errors can be corrected by a calibration. Random errors occur inconsistently each time a measurement is made. They cause replicate measurements to differ in spite of one’s best efforts to keep everything the same. In general, systematic errors cause a set of measurements to be inaccurate and random errors introduce the standard deviation about the mean.
51
DEVELOP YOUR UNDERSTANDING 1. You observe that one of the millimeter sticks in Model 2a starts at about 1.1 cm instead of 0.0. a) What do you conclude about the precision and accuracy of the millimeter stick? b) Will this stick lead to random or systematic error? 2. Which type of error is related to precision? 3. Which type of error is related to accuracy? 4. For which type of error do you have the least control?
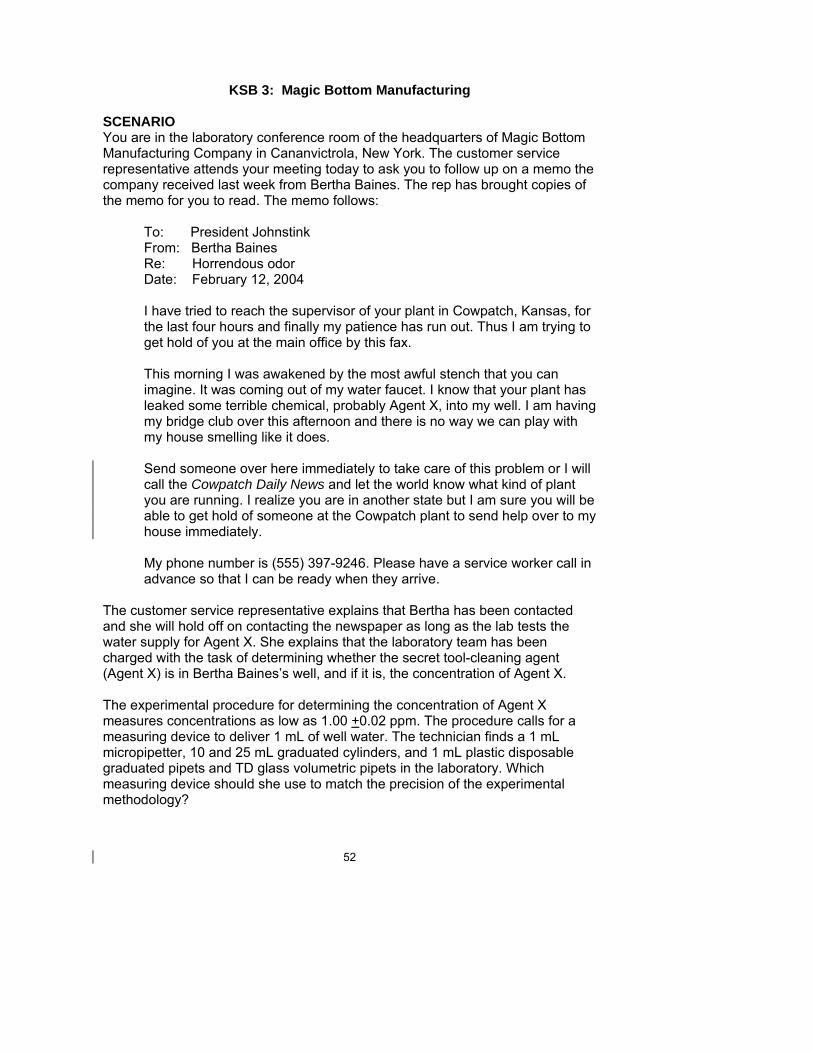
52
KSB 3: Magic Bottom Manufacturing SCENARIO You are in the laboratory conference room of the headquarters of Magic Bottom Manufacturing Company in Cananvictrola, New York. The customer service representative attends your meeting today to ask you to follow up on a memo the company received last week from Bertha Baines. The rep has brought copies of the memo for you to read. The memo follows:
To: President Johnstink From: Bertha Baines Re: Horrendous odor Date: February 12, 2004 I have tried to reach the supervisor of your plant in Cowpatch, Kansas, for the last four hours and finally my patience has run out. Thus I am trying to get hold of you at the main office by this fax. This morning I was awakened by the most awful stench that you can imagine. It was coming out of my water faucet. I know that your plant has leaked some terrible chemical, probably Agent X, into my well. I am having my bridge club over this afternoon and there is no way we can play with my house smelling like it does. Send someone over here immediately to take care of this problem or I will call the Cowpatch Daily News and let the world know what kind of plant you are running. I realize you are in another state but I am sure you will be able to get hold of someone at the Cowpatch plant to send help over to my house immediately. My phone number is (555) 397-9246. Please have a service worker call in advance so that I can be ready when they arrive.
The customer service representative explains that Bertha has been contacted and she will hold off on contacting the newspaper as long as the lab tests the water supply for Agent X. She explains that the laboratory team has been charged with the task of determining whether the secret tool-cleaning agent (Agent X) is in Bertha Baines’s well, and if it is, the concentration of Agent X. The experimental procedure for determining the concentration of Agent X measures concentrations as low as 1.00 +0.02 ppm. The procedure calls for a measuring device to deliver 1 mL of well water. The technician finds a 1 mL micropipetter, 10 and 25 mL graduated cylinders, and 1 mL plastic disposable graduated pipets and TD glass volumetric pipets in the laboratory. Which measuring device should she use to match the precision of the experimental methodology?
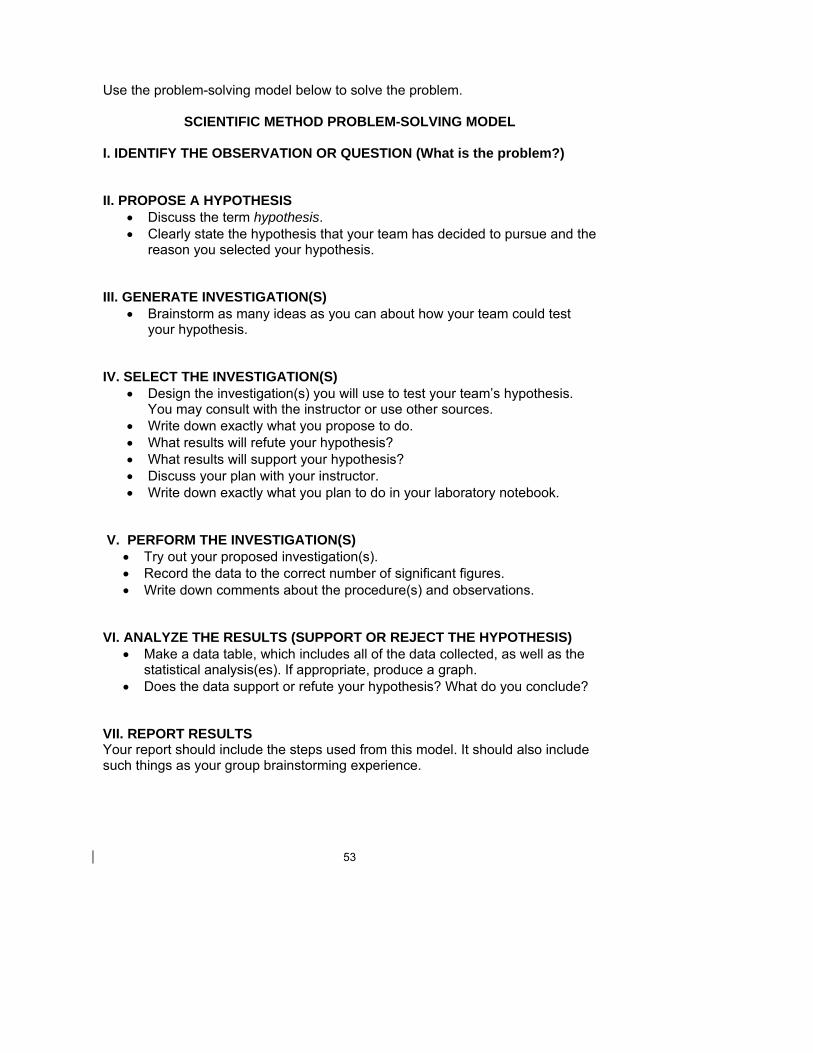
53
Use the problem-solving model below to solve the problem.
SCIENTIFIC METHOD PROBLEM-SOLVING MODEL I. IDENTIFY THE OBSERVATION OR QUESTION (What is the problem?) II. PROPOSE A HYPOTHESIS
• Discuss the term hypothesis. • Clearly state the hypothesis that your team has decided to pursue and the
reason you selected your hypothesis. III. GENERATE INVESTIGATION(S)
• Brainstorm as many ideas as you can about how your team could test your hypothesis.
IV. SELECT THE INVESTIGATION(S)
• Design the investigation(s) you will use to test your team’s hypothesis. You may consult with the instructor or use other sources.
• Write down exactly what you propose to do. • What results will refute your hypothesis? • What results will support your hypothesis? • Discuss your plan with your instructor. • Write down exactly what you plan to do in your laboratory notebook.
V. PERFORM THE INVESTIGATION(S)
• Try out your proposed investigation(s). • Record the data to the correct number of significant figures. • Write down comments about the procedure(s) and observations.
VI. ANALYZE THE RESULTS (SUPPORT OR REJECT THE HYPOTHESIS)
• Make a data table, which includes all of the data collected, as well as the statistical analysis(es). If appropriate, produce a graph.
• Does the data support or refute your hypothesis? What do you conclude?
VII. REPORT RESULTS Your report should include the steps used from this model. It should also include such things as your group brainstorming experience.
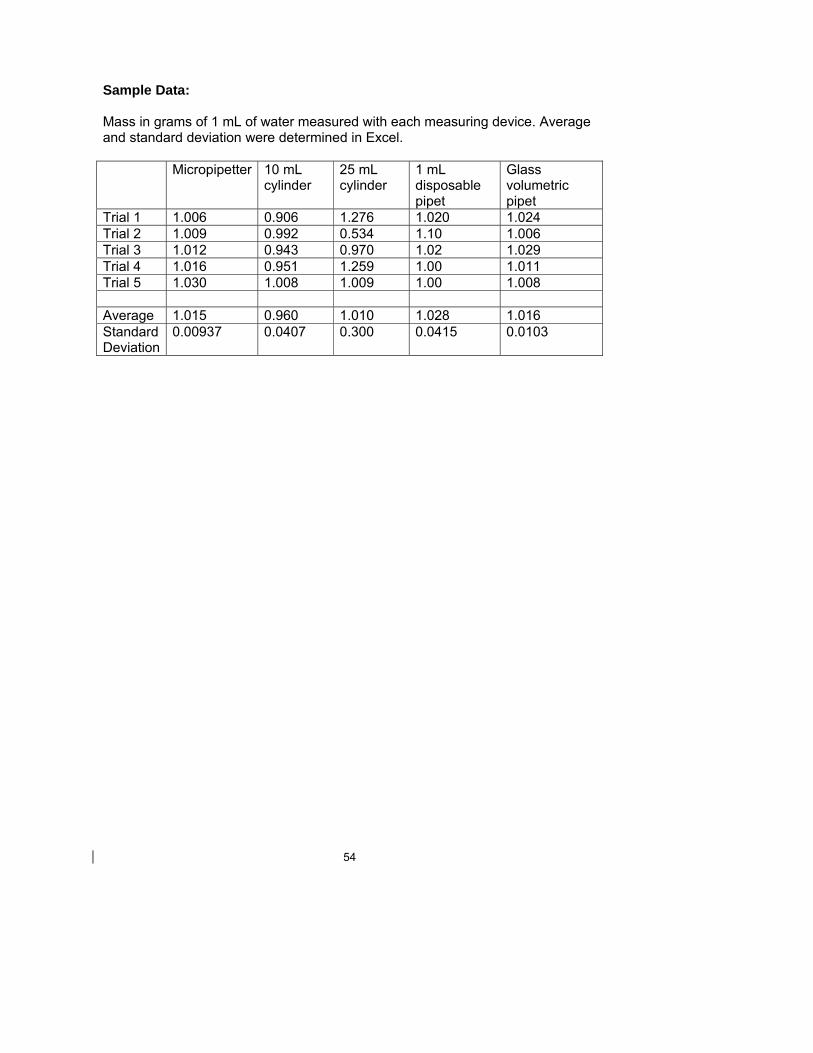
54
Sample Data: Mass in grams of 1 mL of water measured with each measuring device. Average and standard deviation were determined in Excel. Micropipetter 10 mL
cylinder 25 mL cylinder
1 mL disposable pipet
Glass volumetric pipet
Trial 1 1.006 0.906 1.276 1.020 1.024 Trial 2 1.009 0.992 0.534 1.10 1.006 Trial 3 1.012 0.943 0.970 1.02 1.029 Trial 4 1.016 0.951 1.259 1.00 1.011 Trial 5 1.030 1.008 1.009 1.00 1.008 Average 1.015 0.960 1.010 1.028 1.016 Standard Deviation
0.00937 0.0407 0.300 0.0415 0.0103
55
KSB 4: Concentration
Concentration is actually a part of our daily lives. For example, when you buy milk, you may choose milk that is 4% fat (whole), 2% fat, 1% fat, or 0% fat (skimmed). Fruit juice containers have to report the actual percentage of juice in them. These percentages express how much of a particular substance is in the liquid. In the case of milk, the percentages express the quantity of fat in the milk; in the case of fruit juice, they express how much pure juice has been mixed with water. Chemists concern themselves with the interactions among substances; thus they must determine how many formula units (molecules, atoms, and ions) are present in a liquid. Previously we used mass to count formula units (one formula mass is equal to one formula unit). When working with liquids, it is usually easier to measure volume than mass. Here we use volume and concentration to count formula units.
You are to: • Become familiar with the concepts of solute, solvent, and solution.
• Show how the molarity of a solution can be used to count formula units in a homogeneous mixture (solution). • Prepare solutions. • Use concentration units of molarity, parts per million, and percent.
MODEL 1: Define the following terms: SOLUTE - SOLVENT - CONCENTRATION - MOLARITY - % -
INTENSIVE PROPERTIES
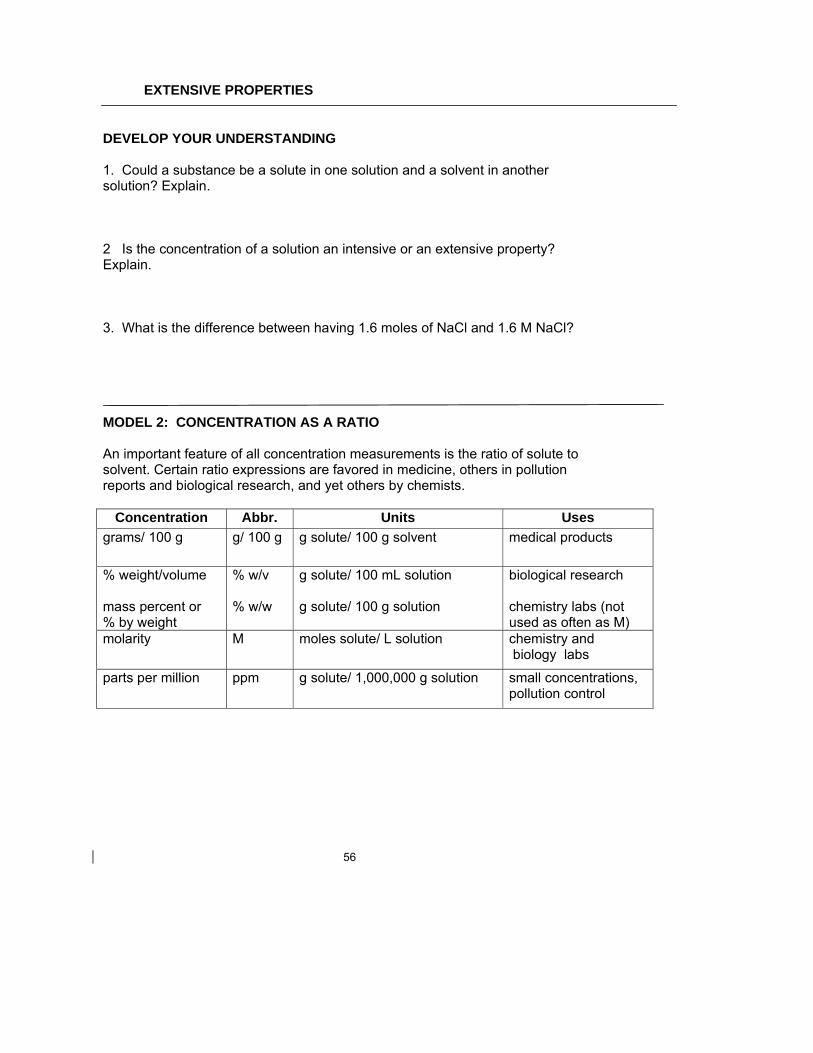
56
EXTENSIVE PROPERTIES DEVELOP YOUR UNDERSTANDING 1. Could a substance be a solute in one solution and a solvent in another solution? Explain. 2 Is the concentration of a solution an intensive or an extensive property? Explain. 3. What is the difference between having 1.6 moles of NaCl and 1.6 M NaCl? MODEL 2: CONCENTRATION AS A RATIO An important feature of all concentration measurements is the ratio of solute to solvent. Certain ratio expressions are favored in medicine, others in pollution reports and biological research, and yet others by chemists.
Concentration Abbr. Units Uses grams/ 100 g g/ 100 g g solute/ 100 g solvent medical products
% weight/volume mass percent or % by weight
% w/v % w/w
g solute/ 100 mL solution g solute/ 100 g solution
biological research chemistry labs (not used as often as M)
molarity
M moles solute/ L solution chemistry and biology labs
parts per million ppm g solute/ 1,000,000 g solution small concentrations, pollution control
57
DEVELOP YOUR UNDERSTANDING 1. What concentration unit do chemists typically use? 2. What concentration units are routinely used in biological research and biotechnology laboratories? 3. What is meant when it is said that a solution is 5.6% by weight sodium chloride? 4. One common feature of concentration is that it is usually equal to: concentration = amount of_____________ amount of 5. Which concentration unit is related to the number of particles rather than the mass of the particles? MODEL 3: PREPARING SOLUTIONS OF KNOWN CONCENTRATION (Direct Addition) Your instructor will model preparation of a solution of known molarity (M). Describe the methodology used by the instructor.
58
DEVELOP YOUR UNDERSTANDING 1. Why is it important to mix the solution to dissolve all of the solute before you dilute to the final volume mark? 2. Describe how you would prepare one liter of 1.0 M NaBr.
MODEL 4: MOLARITY CALCULATIONS Example: How would you prepare 500.0 mL of 0.00445 M NaBr? Given: V = 500.0 mL Find: mass of NaBr M = 0.00445 M NaBr NTK: M = moles of solute/L of solution V. M = moles of solute gfm (molar mass) of NaBr Setup: 500.0 mL 1L 0.00445 mol NaBr 102.90 g NaBr 1000 mL L mol NaBr = 0.229 g NaBr 1. Weigh out 0.229 g NaBr. 2. Fill a 500 mL volumetric flask about 2/3 full of water. 3. Add the NaBr to the volumetric flask and mix until all of the NaBr is dissolved. Add more water if necessary, but do not go over the fill mark. 4. Add water so that the bottom of the meniscus is at the fill line. 5. Cover and mix.
59
DEVELOP YOUR UNDERSTANDING 1. What information is needed to determine the molarity of a solution? 2. When you make 1 L of solution, do you add 1000 mL of water? Explain. 3. What would the molarity of the NaBr solution in Model 4 be if the 0.229 g of NaBr was dissolved in enough water to make 100.0 mL of solution instead of 500.0 mL? 4. The gram formula mass (molar mass) of KBr is 119.01 g/mol. What is the molarity of a solution prepared by adding 5.86 g of KBr to a 250 mL volumetric flask and diluting to volume with H2O? 5. How would you prepare 500.0 mL of 0.0767 M KBr?
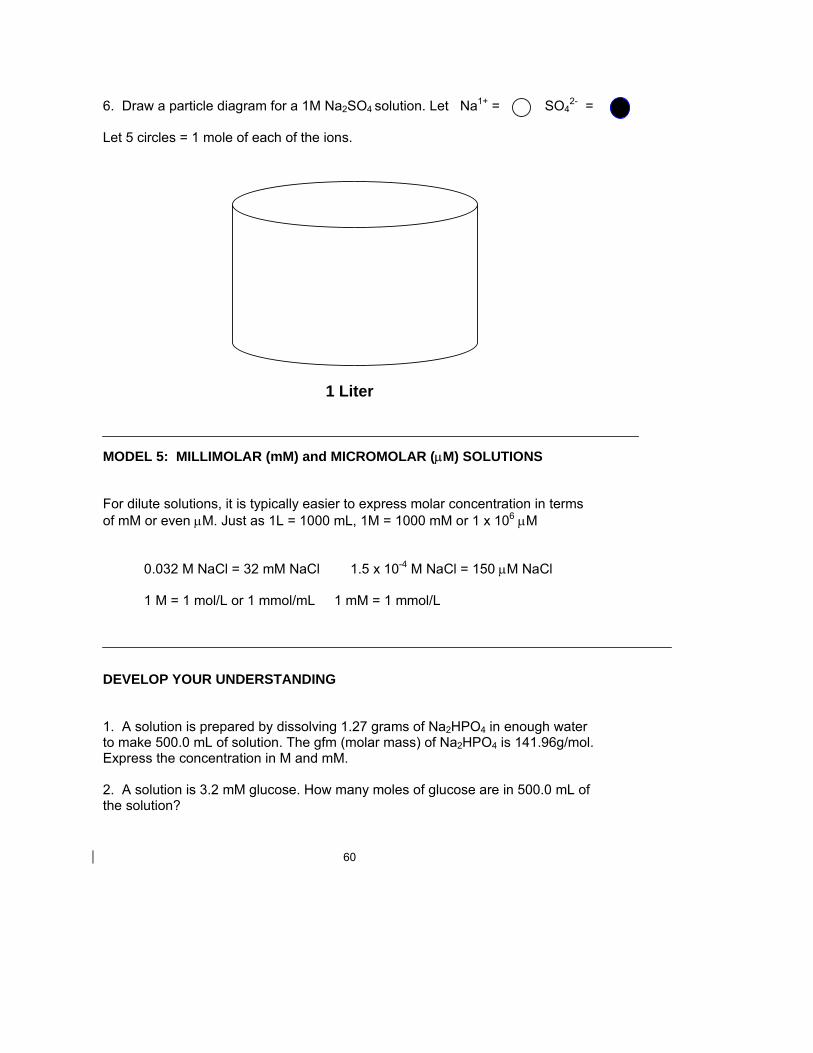
60
6. Draw a particle diagram for a 1M Na2SO4 solution. Let Na1+ = SO4
2- = Let 5 circles = 1 mole of each of the ions.
1 Liter MODEL 5: MILLIMOLAR (mM) and MICROMOLAR (µM) SOLUTIONS For dilute solutions, it is typically easier to express molar concentration in terms of mM or even µM. Just as 1L = 1000 mL, 1M = 1000 mM or 1 x 10⁶ µM 0.032 M NaCl = 32 mM NaCl 1.5 x 10⁻⁴ M NaCl = 150 µM NaCl 1 M = 1 mol/L or 1 mmol/mL 1 mM = 1 mmol/L DEVELOP YOUR UNDERSTANDING 1. A solution is prepared by dissolving 1.27 grams of Na2HPO4 in enough water to make 500.0 mL of solution. The gfm (molar mass) of Na2HPO4 is 141.96g/mol. Express the concentration in M and mM. 2. A solution is 3.2 mM glucose. How many moles of glucose are in 500.0 mL of the solution?
61
MODEL 6: PERCENT SOLUTIONS Percent solutions tend to be very confusing. They can be: % by mass (weight) = g solute/ 100 g solution (w/w) % by volume = mL solute/ 100 mL solution (v/v)
% by mass (weight)/volume = g solute/ 100 mL solution (w/v)
DEVELOP YOUR UNDERSTANDING 1. A column wash solution requires 75 mL of 2.0% NaCl (mass/volume) solution. How would you prepare enough of the 2.0% NaCl solution to wash the column? 2. You are preparing solutions for a laboratory experiment. The experiment requires 800.0 mL of 5.0% KI. How would you prepare the solution?
62
KSB 5: Dilution There are many laboratory situations that call for researchers and technicians to make solutions. Commercially available solutions are typically concentrated. When solutions of lower concentrations are needed, researchers and technicians are able to prepare them from concentrated solutions. The process of preparing a more dilute solution by adding a solvent (usually but not always water) to a more concentrated stock solution is called dilution. Increasing the accuracy of measurements is almost always important. Stock solutions are convenient to store and dispense and they also can be used to increase the precision and accuracy of measurements. The precision of a measurement is determined by the precision of the measuring devices. A centigram balance weighs ten grams to four significant figures (10.00 g). A milligram balance weighs ten grams to five significant figures (10.000 g). If you make up 10 mL of a 1% w/v solution, you weigh out 0.10 g (two significant figures). If you make a 10% w/v solution and dilute it 1:9 (i.e., create a 1% w/v solution), then you have three significant figures (because you weighed out 1.00 g) and, accordingly, more precision. Dilution terminology is very confusing and variations in word use may lead to errors. Be sure of what the directions mean, and for future reference, realize that it is critical to use proper notation in your laboratory notebook. You are to:
• Prepare solutions by making dilutions of stock solutions. • Use dilution calculations based on the concept of molarity, percent concentration, and parts per million to prepare solutions. • Use the correct terminology for dilutions.
MODEL 1: PREPARING SOLUTIONS OF KNOWN CONCENTRATION
(Solution by Dilution) In this activity, you prepare a solution and multiple dilutions of that stock solution. The concentrations of these solutions are then compared both visually and using a conductivity meter. Calculations When calculating concentrations of solutions that have been prepared by diluting another solution, you can use the following formula:
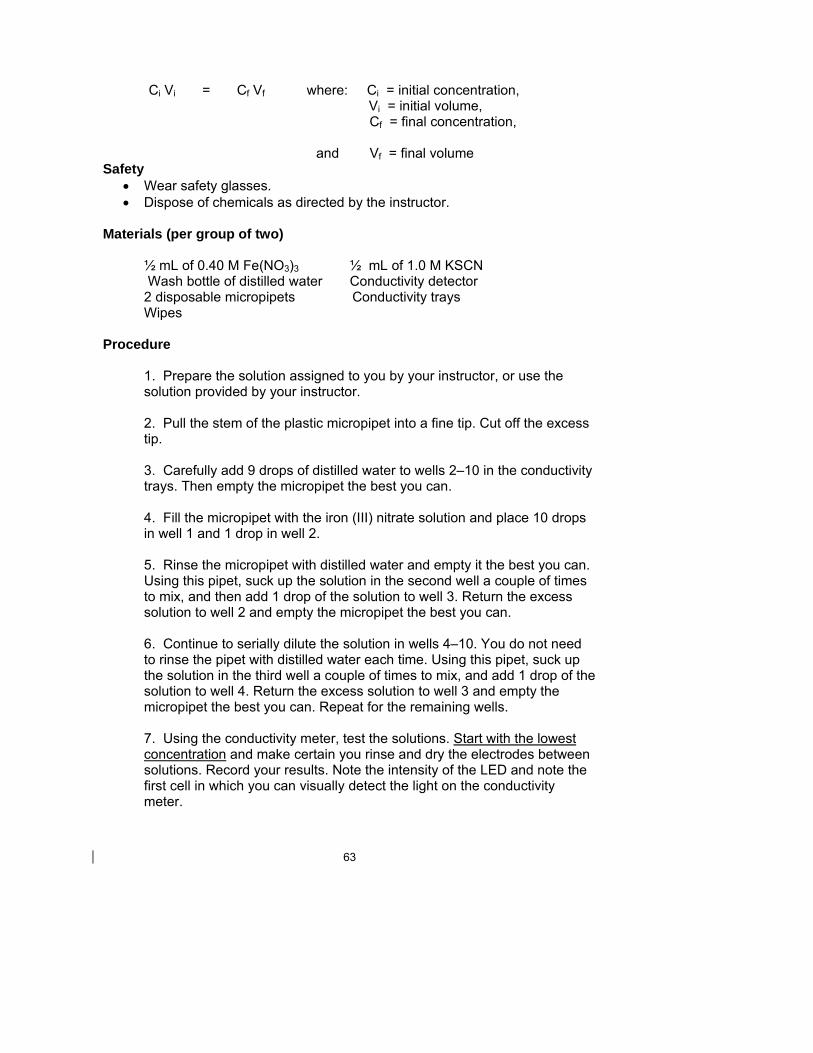
63
Ci Vi = Cf Vf where: Ci = initial concentration, Vi = initial volume, Cf = final concentration, and Vf = final volume Safety
• Wear safety glasses. • Dispose of chemicals as directed by the instructor.
Materials (per group of two) ½ mL of 0.40 M Fe(NO3)3 ½ mL of 1.0 M KSCN Wash bottle of distilled water Conductivity detector 2 disposable micropipets Conductivity trays Wipes Procedure
1. Prepare the solution assigned to you by your instructor, or use the solution provided by your instructor.
2. Pull the stem of the plastic micropipet into a fine tip. Cut off the excess tip.
3. Carefully add 9 drops of distilled water to wells 2–10 in the conductivity
trays. Then empty the micropipet the best you can.
4. Fill the micropipet with the iron (III) nitrate solution and place 10 drops in well 1 and 1 drop in well 2. 5. Rinse the micropipet with distilled water and empty it the best you can. Using this pipet, suck up the solution in the second well a couple of times to mix, and then add 1 drop of the solution to well 3. Return the excess solution to well 2 and empty the micropipet the best you can. 6. Continue to serially dilute the solution in wells 4–10. You do not need to rinse the pipet with distilled water each time. Using this pipet, suck up the solution in the third well a couple of times to mix, and add 1 drop of the solution to well 4. Return the excess solution to well 3 and empty the micropipet the best you can. Repeat for the remaining wells. 7. Using the conductivity meter, test the solutions. Start with the lowest concentration and make certain you rinse and dry the electrodes between solutions. Record your results. Note the intensity of the LED and note the first cell in which you can visually detect the light on the conductivity meter.
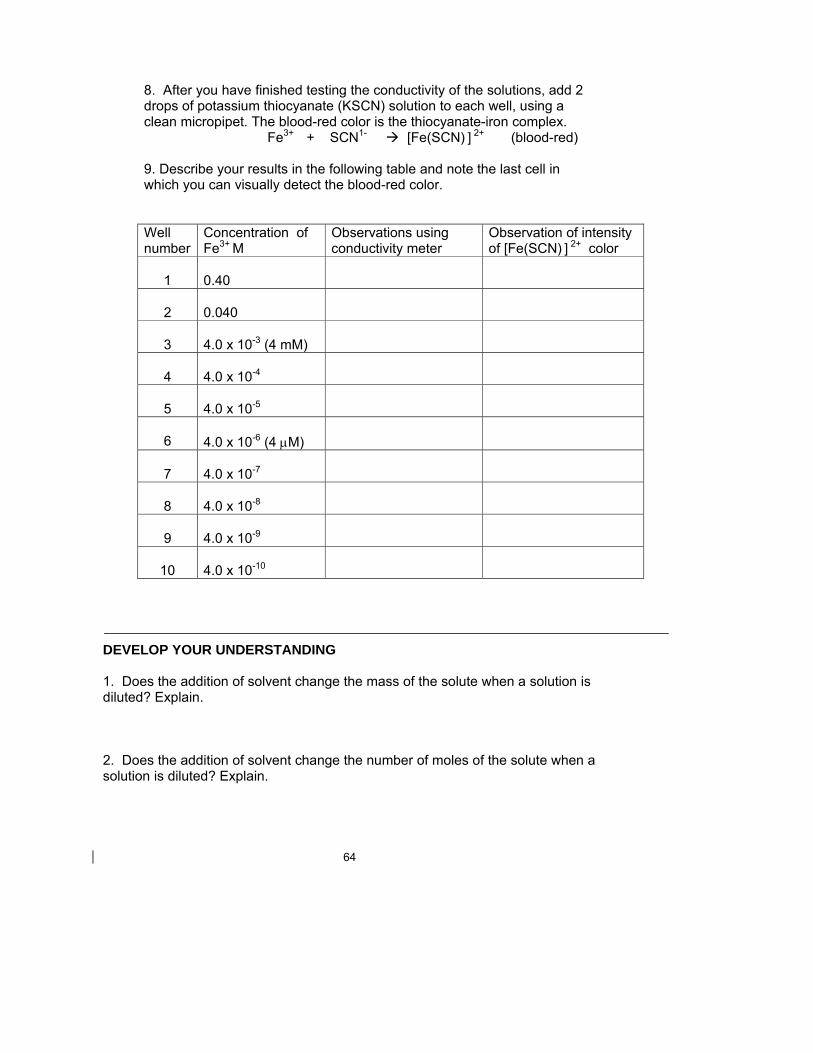
64
8. After you have finished testing the conductivity of the solutions, add 2 drops of potassium thiocyanate (KSCN) solution to each well, using a clean micropipet. The blood-red color is the thiocyanate-iron complex.
Fe3+ + SCN1- [Fe(SCN) ] 2+ (blood-red) 9. Describe your results in the following table and note the last cell in which you can visually detect the blood-red color.
Well number
Concentration of Fe3+ M
Observations using conductivity meter
Observation of intensity of [Fe(SCN) ] 2+ color
1
0.40
2
0.040
3
4.0 x 10⁻³ (4 mM)
4
4.0 x 10⁻⁴
5
4.0 x 10⁻⁵
6
4.0 x 10⁻⁶ (4 µM)
7
4.0 x 10⁻⁷
8
4.0 x 10⁻⁸
9
4.0 x 10⁻⁹
10
4.0 x 10⁻¹⁰
DEVELOP YOUR UNDERSTANDING 1. Does the addition of solvent change the mass of the solute when a solution is diluted? Explain. 2. Does the addition of solvent change the number of moles of the solute when a solution is diluted? Explain.
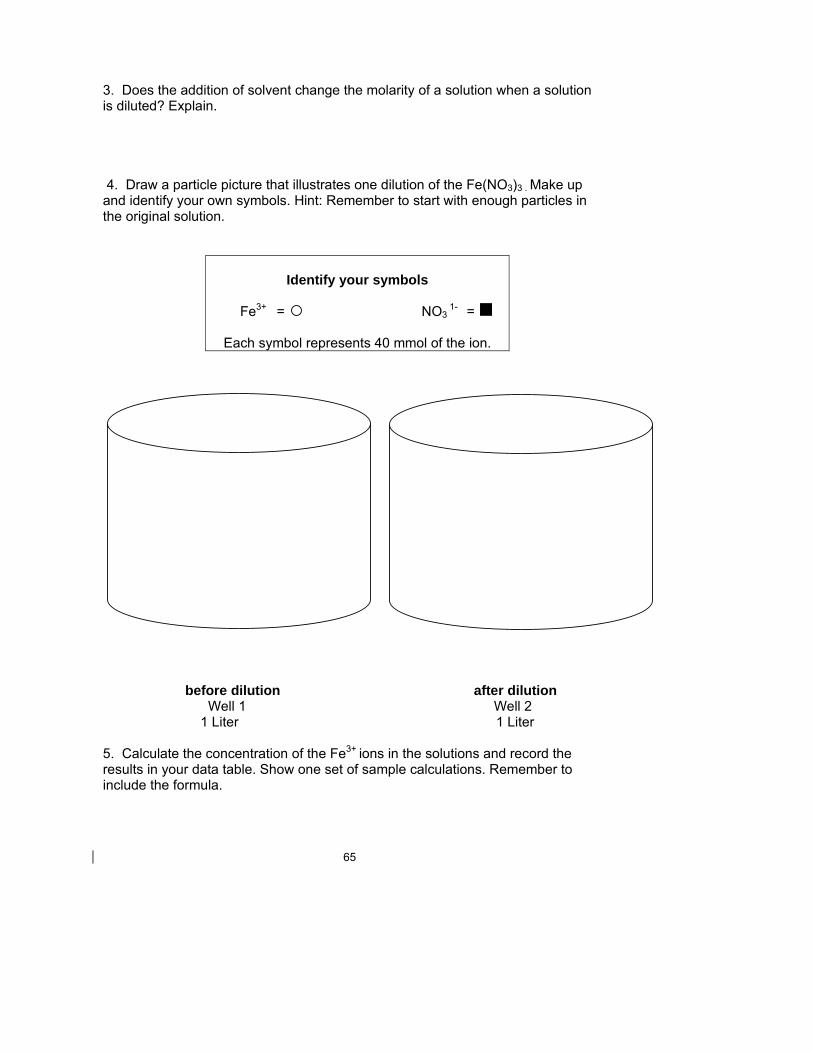
65
3. Does the addition of solvent change the molarity of a solution when a solution is diluted? Explain. 4. Draw a particle picture that illustrates one dilution of the Fe(NO3)3 . Make up and identify your own symbols. Hint: Remember to start with enough particles in the original solution.
Identify your symbols
Fe3+ = NO3
1- =
Each symbol represents 40 mmol of the ion.
before dilution after dilution Well 1 Well 2 1 Liter 1 Liter 5. Calculate the concentration of the Fe3+ ions in the solutions and record the results in your data table. Show one set of sample calculations. Remember to include the formula.
66
6. What was the lowest concentration of Fe3+ ions you were able to detect by: Thiocyanate complex ________________
Conductivity meter ________________ Audio conductivity meter (Optional) ________________
7. Given the conductivity meters available, which methodology would you select to detect Fe3+ ions? Why? 8. Did the conductivity meter detect only Fe3+ ions? Explain. EXERCISES 1. What is the final concentration of 0.997 M HCl when 5.0 mL of this stock solution is diluted to a final volume of 250.0 mL? 2. How many mL of 4.256 M Ba(NO3)2 would be required to make 500.0 mL of 0.04987 M NO3 1-?
67
MODEL 2: SOLUTION TERMINOLOGY (Recommended by Biological and Chemical Societies) 10.0 mL of 0.50 M CaCl2 solution is diluted to a final volume of 100.0 mL. Is this called a 1:10 dilution or a 1:9 dilution? Dilution notations have caused considerable confusion in science laboratories and classrooms for many years. What does it mean when you see a notation that a solution has been diluted 1:1 or 1:2? The two different notations may mean the same thing. Which is correct? Students beware. Example: 1.0 mL of a 20.0 mM solution of a red dye is diluted with 4.0 mL of water. The final volume is 5.0 mL. You find this represented in the following ways. Which ones are recommended? The diluted solution is a:
Correct Incorrect 1 to 4 dilution 1 to 5 dilution 1:4 dilution 1:5 dilution 1 in 5 dilution 1/5 dilution 5-fold dilution 5 X dilution What is the difference? The diluted red dye solution is 4.0 mM for the bold notations and 3.3 mM for the incorrect notations. The difference in the molarity is 0.7 mM, a 17% error for the solutions having the incorrect notations. DEVELOP YOUR UNDERSTANDING 1. A can of grape juice concentrate directs us to add 4 cans of water to the concentrate. Which of the following statements are correct? Correct the statement when it is incorrect. a) The final juice solution is 1 part grape juice in 4 parts total. b) The final juice solution is diluted 1/5. c) The final juice solution is a 5-fold dilution.
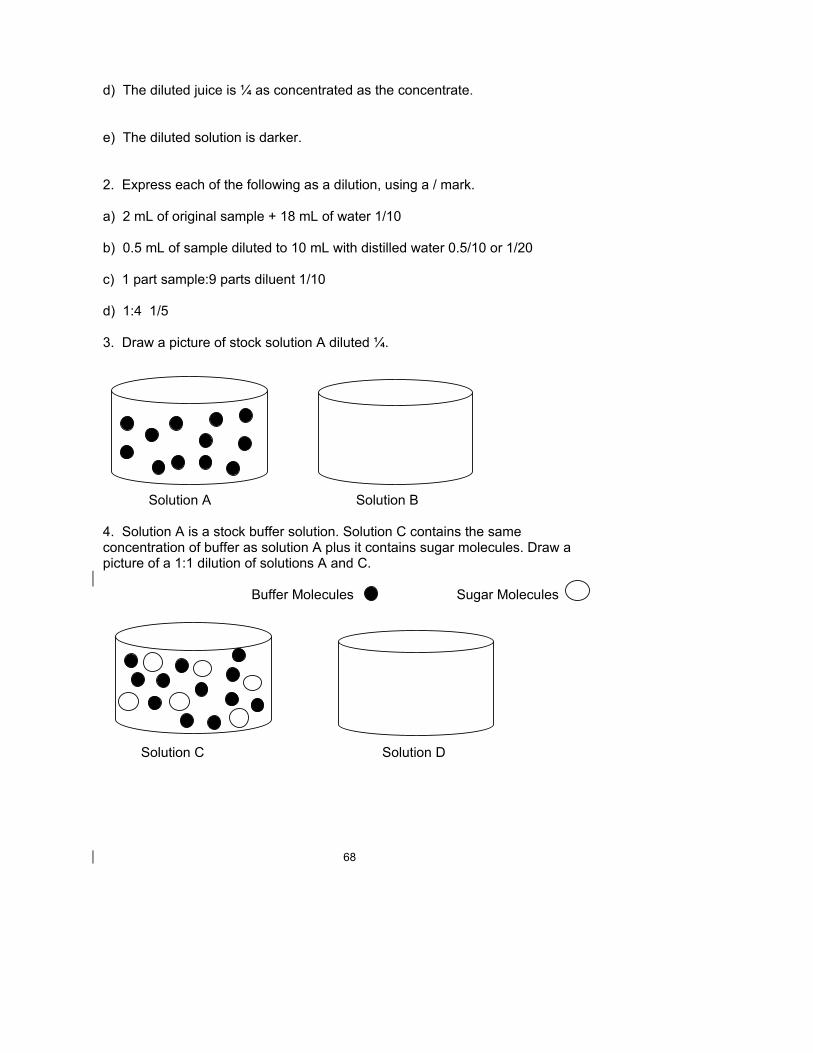
68
d) The diluted juice is ¼ as concentrated as the concentrate. e) The diluted solution is darker. 2. Express each of the following as a dilution, using a / mark. a) 2 mL of original sample + 18 mL of water 1/10 b) 0.5 mL of sample diluted to 10 mL with distilled water 0.5/10 or 1/20 c) 1 part sample:9 parts diluent 1/10 d) 1:4 1/5 3. Draw a picture of stock solution A diluted ¼.
Solution A Solution B 4. Solution A is a stock buffer solution. Solution C contains the same concentration of buffer as solution A plus it contains sugar molecules. Draw a picture of a 1:1 dilution of solutions A and C. Buffer Molecules Sugar Molecules
Solution C Solution D
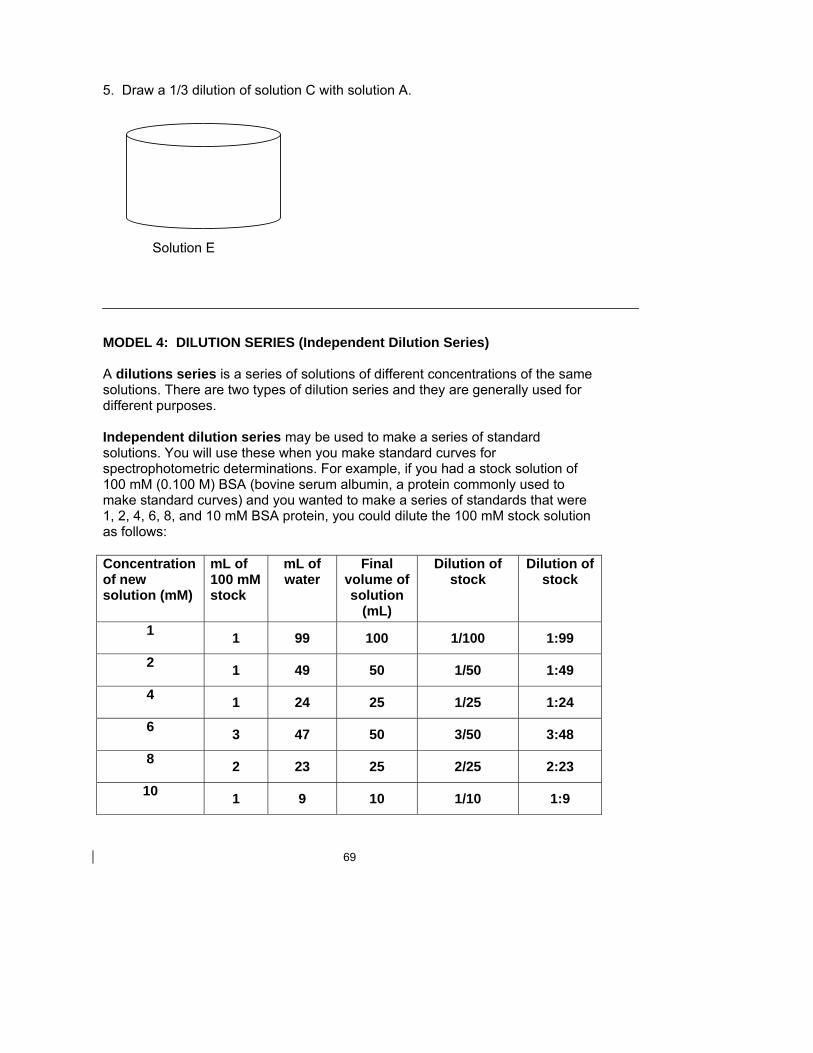
69
5. Draw a 1/3 dilution of solution C with solution A.
Solution E
MODEL 4: DILUTION SERIES (Independent Dilution Series) A dilutions series is a series of solutions of different concentrations of the same solutions. There are two types of dilution series and they are generally used for different purposes. Independent dilution series may be used to make a series of standard solutions. You will use these when you make standard curves for spectrophotometric determinations. For example, if you had a stock solution of 100 mM (0.100 M) BSA (bovine serum albumin, a protein commonly used to make standard curves) and you wanted to make a series of standards that were 1, 2, 4, 6, 8, and 10 mM BSA protein, you could dilute the 100 mM stock solution as follows: Concentration of new solution (mM)
mL of 100 mM stock
mL of water
Final volume of solution
(mL)
Dilution of stock
Dilution of stock
1 1 99 100 1/100 1:99
2 1 49 50 1/50 1:49
4 1 24 25 1/25 1:24
6 3 47 50 3/50 3:48
8 2 23 25 2/25 2:23
10 1 9 10 1/10 1:9
70
Dilution Table
Example: 1 mM solution CiVi = CfVf; Cf/Ci = Vi /Vf = dilution; 1 mM/100 mM = 1 mL/100 mL = 1/100 DEVELOP YOUR UNDERSTANDING 1. Does the concentration of the 2 mM protein solution depend on the concentration of the 1 mM solution? Explain. 2. What is the concentration of new solution made by diluting 15 mL of stock solution to 50.0 mL with water? What are two ways of writing the dilution? Dilution of stock _______________ or ______________________ 3. A stock solution is made by dissolving 16.85 grams of EDTA disodium salt (EDTA) in enough water to make 500.0 mL of solution. The molar mass (gfm) of EDTA is 336.21 g/mol. How would you prepare 5 solutions that are 2, 5, 10, 25, and 40 mM EDTA? You have 10, 25, 50, and 100 mL volumetrics available.
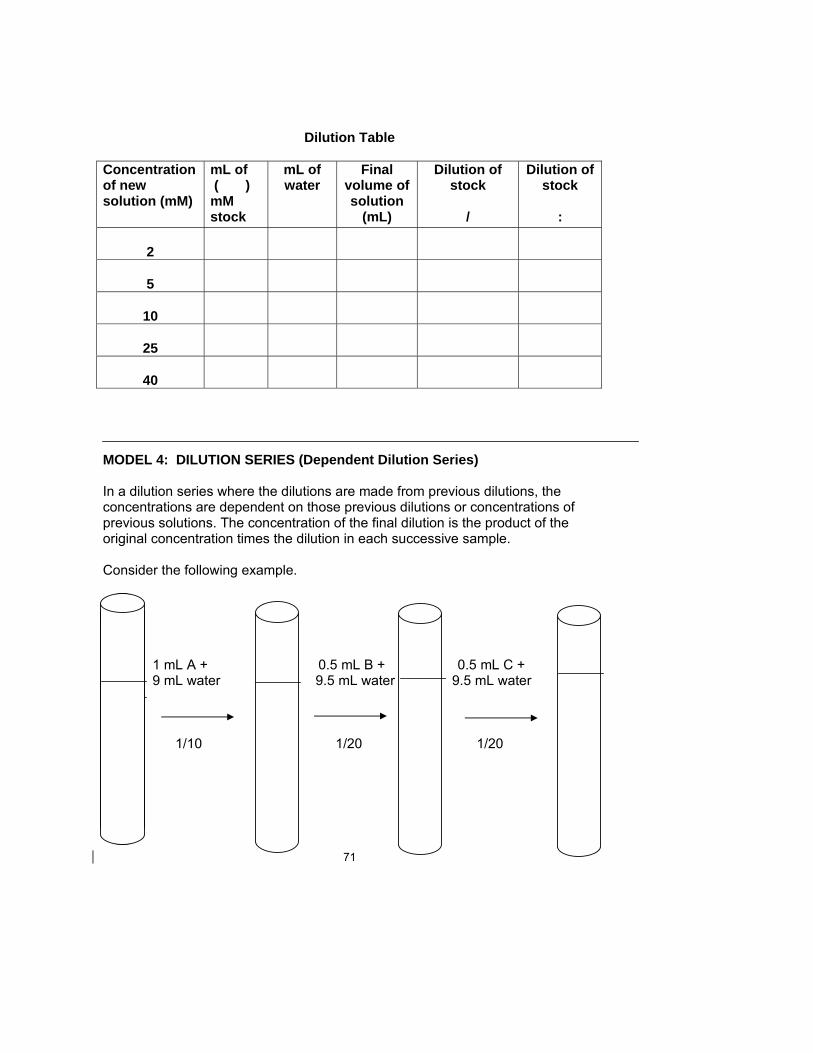
71
Dilution Table Concentration of new solution (mM)
mL of ( ) mM stock
mL of water
Final volume of solution
(mL)
Dilution of stock
/
Dilution of stock
:
2
5
10
25
40
MODEL 4: DILUTION SERIES (Dependent Dilution Series) In a dilution series where the dilutions are made from previous dilutions, the concentrations are dependent on those previous dilutions or concentrations of previous solutions. The concentration of the final dilution is the product of the original concentration times the dilution in each successive sample. Consider the following example.
1 mL A + 0.5 mL B + 0.5 mL C + 9 mL water 9.5 mL water 9.5 mL water
1/10 1/20 1/20
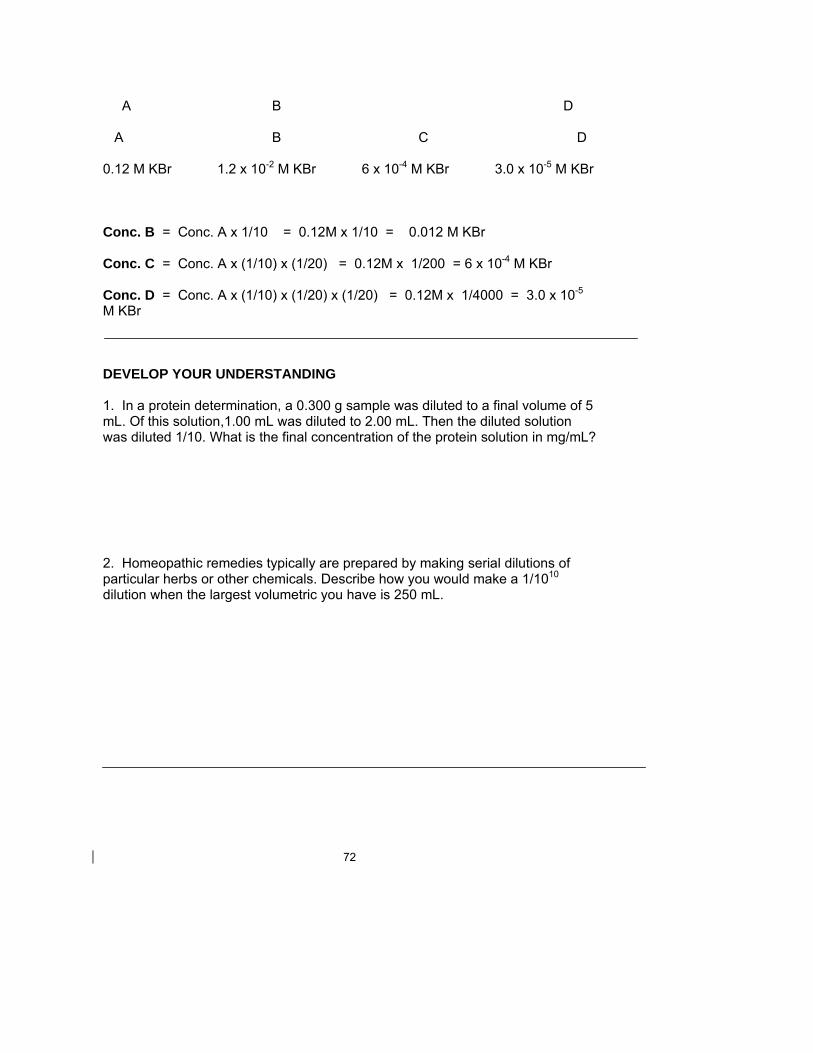
72
A B D A B C D 0.12 M KBr 1.2 x 10⁻² M KBr 6 x 10⁻⁴ M KBr 3.0 x 10⁻⁵ M KBr
Conc. B = Conc. A x 1/10 = 0.12M x 1/10 = 0.012 M KBr Conc. C = Conc. A x (1/10) x (1/20) = 0.12M x 1/200 = 6 x 10⁻⁴ M KBr
Conc. D = Conc. A x (1/10) x (1/20) x (1/20) = 0.12M x 1/4000 = 3.0 x 10⁻⁵ M KBr
DEVELOP YOUR UNDERSTANDING 1. In a protein determination, a 0.300 g sample was diluted to a final volume of 5 mL. Of this solution,1.00 mL was diluted to 2.00 mL. Then the diluted solution was diluted 1/10. What is the final concentration of the protein solution in mg/mL? 2. Homeopathic remedies typically are prepared by making serial dilutions of particular herbs or other chemicals. Describe how you would make a 1/1010 dilution when the largest volumetric you have is 250 mL.
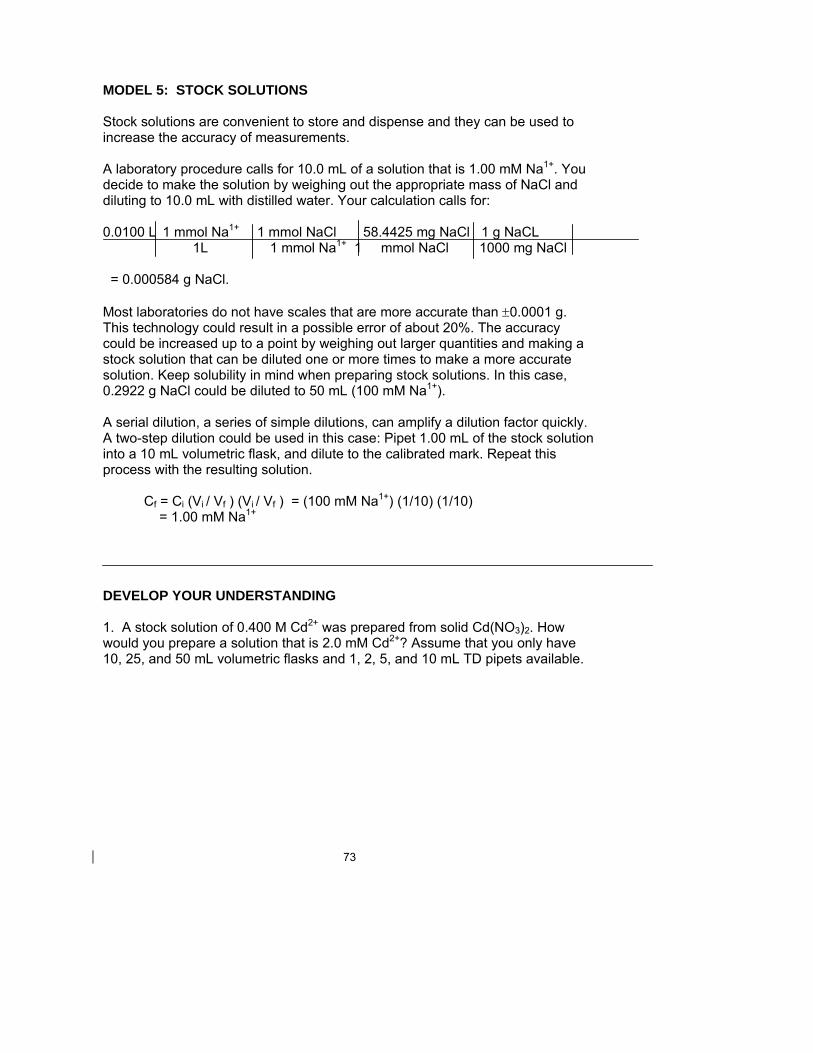
73
MODEL 5: STOCK SOLUTIONS Stock solutions are convenient to store and dispense and they can be used to increase the accuracy of measurements. A laboratory procedure calls for 10.0 mL of a solution that is 1.00 mM Na1+. You decide to make the solution by weighing out the appropriate mass of NaCl and diluting to 10.0 mL with distilled water. Your calculation calls for: 0.0100 L 1 mmol Na1+ 1 mmol NaCl 58.4425 mg NaCl 1 g NaCL 1L 1 mmol Na1+ 1 mmol NaCl 1000 mg NaCl = 0.000584 g NaCl. Most laboratories do not have scales that are more accurate than ±0.0001 g. This technology could result in a possible error of about 20%. The accuracy could be increased up to a point by weighing out larger quantities and making a stock solution that can be diluted one or more times to make a more accurate solution. Keep solubility in mind when preparing stock solutions. In this case, 0.2922 g NaCl could be diluted to 50 mL (100 mM Na1+). A serial dilution, a series of simple dilutions, can amplify a dilution factor quickly. A two-step dilution could be used in this case: Pipet 1.00 mL of the stock solution into a 10 mL volumetric flask, and dilute to the calibrated mark. Repeat this process with the resulting solution. Cf = Ci (Vi / Vf ) (Vi / Vf ) = (100 mM Na1+) (1/10) (1/10) = 1.00 mM Na1+ DEVELOP YOUR UNDERSTANDING
1. A stock solution of 0.400 M Cd2+ was prepared from solid Cd(NO3)2. How would you prepare a solution that is 2.0 mM Cd2+? Assume that you only have 10, 25, and 50 mL volumetric flasks and 1, 2, 5, and 10 mL TD pipets available.
74
2. How would you prepare 50.0 mL of a solution that has a concentration of 2.00 mM K1+ from K2SO4? You are limited to 25, 50, and 100 mL volumetric flasks and 1, 5, and 10 mL TD pipets. Name_______________________
HOMEWORK
You must turn in all work stapled to this cover sheet. Make your responses in the spaces provided for each item. 1. A solution of potassium chloride is prepared by diluting 18.6 g of KCl with water to a final volume of 250.0 mL. What is the molarity of the KCl solution? 2. 50.0 mL of a 0.357 M KCl solution is diluted to 250.0 mL with water. What is the molar concentration of the final solution? 3. How would you prepare 250.0 mL of a 5.00% (w/v) I2 in ethanol solution? 4. How would you prepare a solution that has a concentration of 1.5 mM Na1+
from solid NaCl? You are limited to 25, 50, and 100 mL volumetric flasks and 1, 5, and 10 mL TD pipets.
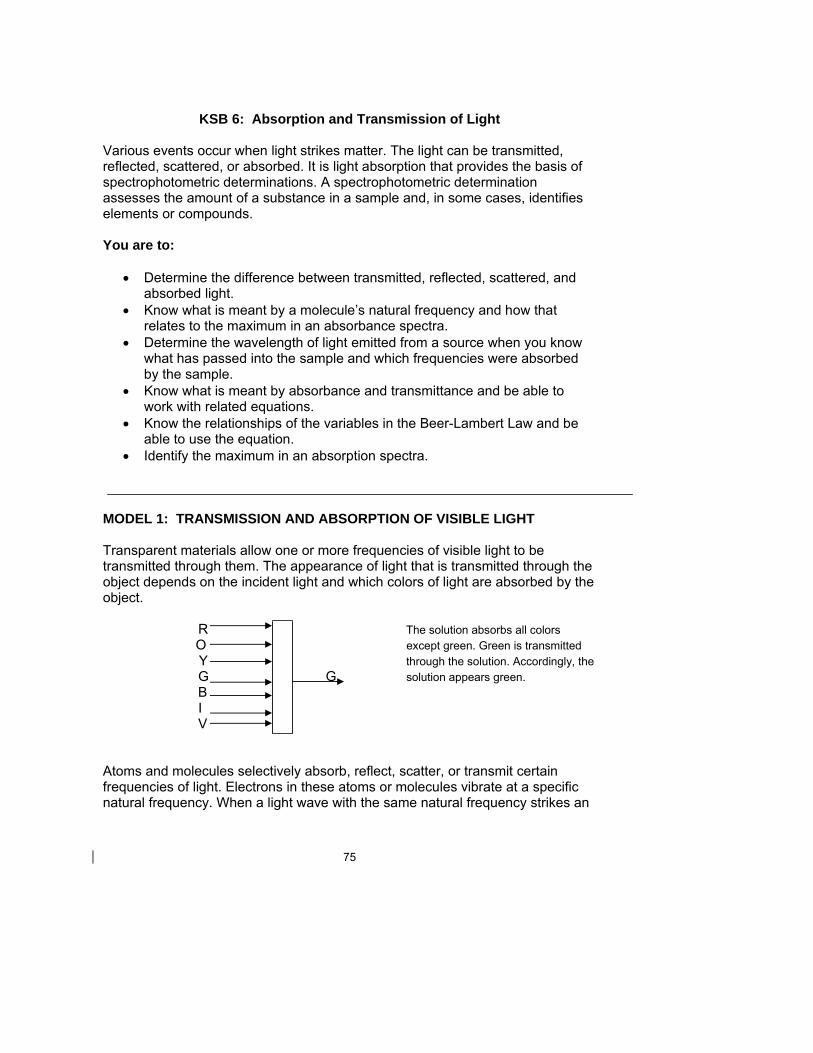
75
KSB 6: Absorption and Transmission of Light Various events occur when light strikes matter. The light can be transmitted, reflected, scattered, or absorbed. It is light absorption that provides the basis of spectrophotometric determinations. A spectrophotometric determination assesses the amount of a substance in a sample and, in some cases, identifies elements or compounds. You are to:
• Determine the difference between transmitted, reflected, scattered, and absorbed light.
• Know what is meant by a molecule’s natural frequency and how that relates to the maximum in an absorbance spectra.
• Determine the wavelength of light emitted from a source when you know what has passed into the sample and which frequencies were absorbed by the sample.
• Know what is meant by absorbance and transmittance and be able to work with related equations.
• Know the relationships of the variables in the Beer-Lambert Law and be able to use the equation.
• Identify the maximum in an absorption spectra. MODEL 1: TRANSMISSION AND ABSORPTION OF VISIBLE LIGHT Transparent materials allow one or more frequencies of visible light to be transmitted through them. The appearance of light that is transmitted through the object depends on the incident light and which colors of light are absorbed by the object. R The solution absorbs all colors O except green. Green is transmitted Y through the solution. Accordingly, the G G solution appears green. B I V Atoms and molecules selectively absorb, reflect, scatter, or transmit certain frequencies of light. Electrons in these atoms or molecules vibrate at a specific natural frequency. When a light wave with the same natural frequency strikes an
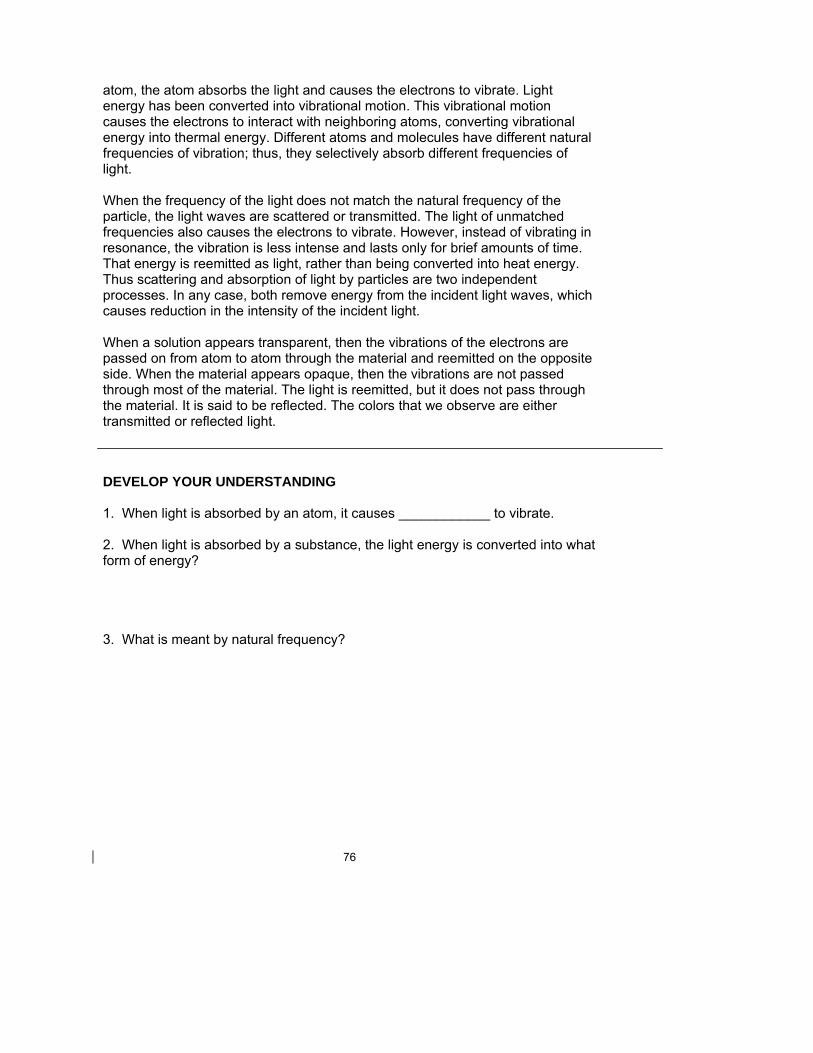
76
atom, the atom absorbs the light and causes the electrons to vibrate. Light energy has been converted into vibrational motion. This vibrational motion causes the electrons to interact with neighboring atoms, converting vibrational energy into thermal energy. Different atoms and molecules have different natural frequencies of vibration; thus, they selectively absorb different frequencies of light. When the frequency of the light does not match the natural frequency of the particle, the light waves are scattered or transmitted. The light of unmatched frequencies also causes the electrons to vibrate. However, instead of vibrating in resonance, the vibration is less intense and lasts only for brief amounts of time. That energy is reemitted as light, rather than being converted into heat energy. Thus scattering and absorption of light by particles are two independent processes. In any case, both remove energy from the incident light waves, which causes reduction in the intensity of the incident light. When a solution appears transparent, then the vibrations of the electrons are passed on from atom to atom through the material and reemitted on the opposite side. When the material appears opaque, then the vibrations are not passed through most of the material. The light is reemitted, but it does not pass through the material. It is said to be reflected. The colors that we observe are either transmitted or reflected light. DEVELOP YOUR UNDERSTANDING 1. When light is absorbed by an atom, it causes ____________ to vibrate. 2. When light is absorbed by a substance, the light energy is converted into what form of energy? 3. What is meant by natural frequency?
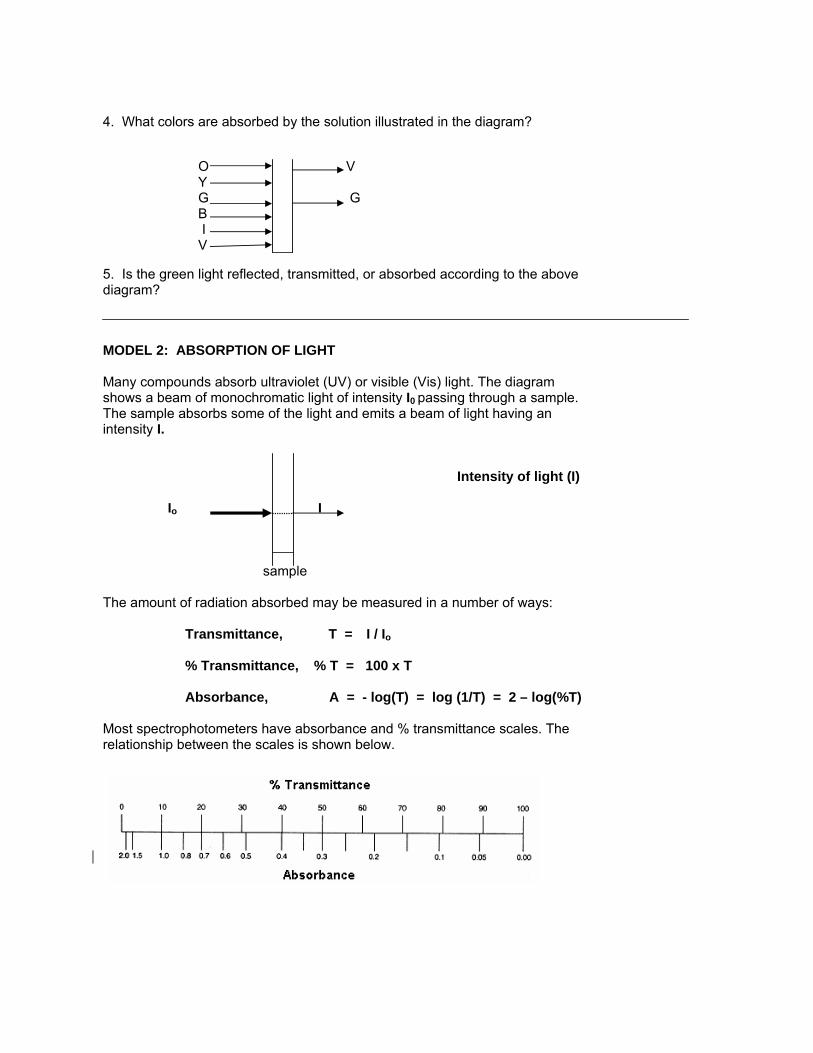
77
4. What colors are absorbed by the solution illustrated in the diagram? O V Y G G B I V 5. Is the green light reflected, transmitted, or absorbed according to the above diagram? MODEL 2: ABSORPTION OF LIGHT Many compounds absorb ultraviolet (UV) or visible (Vis) light. The diagram shows a beam of monochromatic light of intensity I0 passing through a sample. The sample absorbs some of the light and emits a beam of light having an intensity I. Intensity of light (I) Io I sample The amount of radiation absorbed may be measured in a number of ways: Transmittance, T = I / Io
% Transmittance, % T = 100 x T Absorbance, A = - log(T) = log (1/T) = 2 – log(%T)
Most spectrophotometers have absorbance and % transmittance scales. The relationship between the scales is shown below.
78
DEVELOP YOUR UNDERSTANDING 1. What are three ways that the amount of radiation that passes through a sample can be expressed? 2. What does the term monochromatic mean? MODEL 3: THE BEER-LAMBERT LAW As the name implies, there are two laws of colorimetry—Lambert’s Law and Beer’s Law. Lambert’s Law states that the amount of light absorbed is directly proportional to the logarithm of the thickness of the absorbing medium, or:
log (Io/ I) = A = kb b = thickness of the absorbing medium k = extinction coefficient of the medium Beer’s Law states that the amount of light absorbed is directly proportional to the logarithm of the concentration of the solute, or: log (Io/ I) = A = ac c = concentration k = extinction coefficient of the solute Combining these two laws gives the Beer-Lambert Law: A = abc a = extinction coefficient of the solute
b = cell length c = concentration When c is in molarity and b is in centimeters, the molar absorptivity (ε) is used instead of a: A = εbc A has no units because A = log (Io/ I) In Model 1, it was noted that the amount of light absorbed depends on the natural frequency of the molecule and the wavelength of the light. Thus, a plot of absorbance versus wavelength looks like the graph that follows.
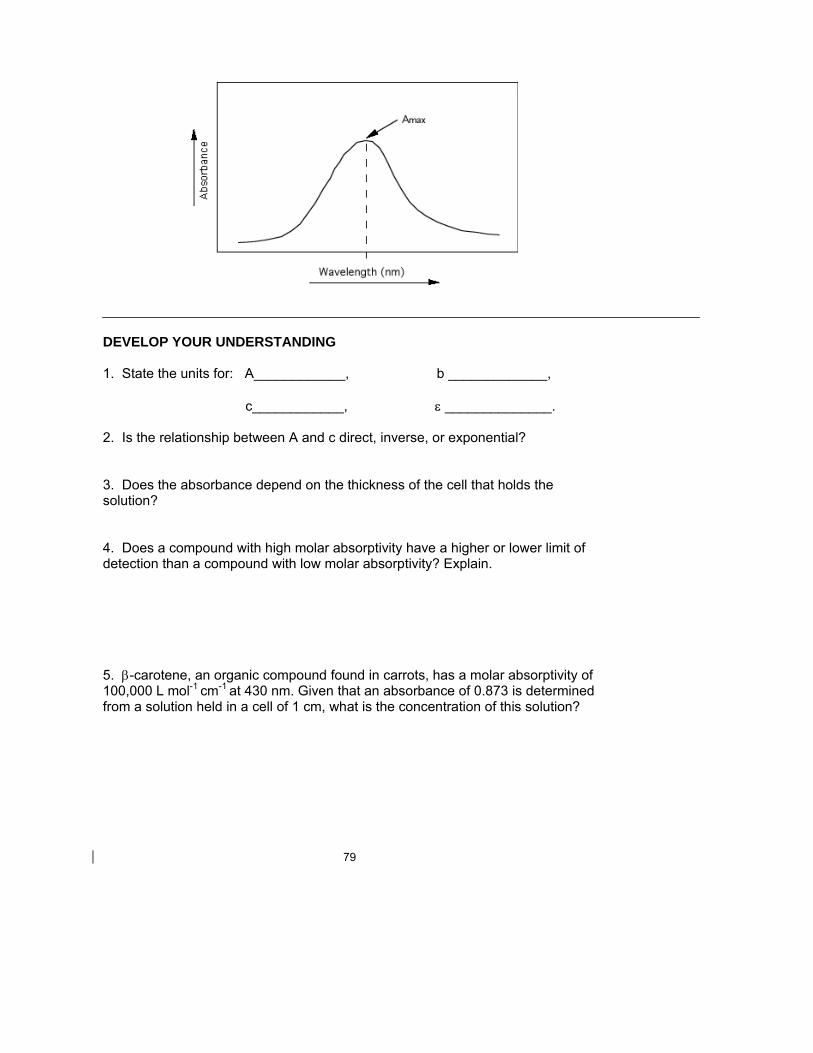
79
DEVELOP YOUR UNDERSTANDING 1. State the units for: A____________, b _____________,
c____________, ε ______________. 2. Is the relationship between A and c direct, inverse, or exponential? 3. Does the absorbance depend on the thickness of the cell that holds the solution? 4. Does a compound with high molar absorptivity have a higher or lower limit of detection than a compound with low molar absorptivity? Explain. 5. β-carotene, an organic compound found in carrots, has a molar absorptivity of 100,000 L mol-1 cm-1 at 430 nm. Given that an absorbance of 0.873 is determined from a solution held in a cell of 1 cm, what is the concentration of this solution?
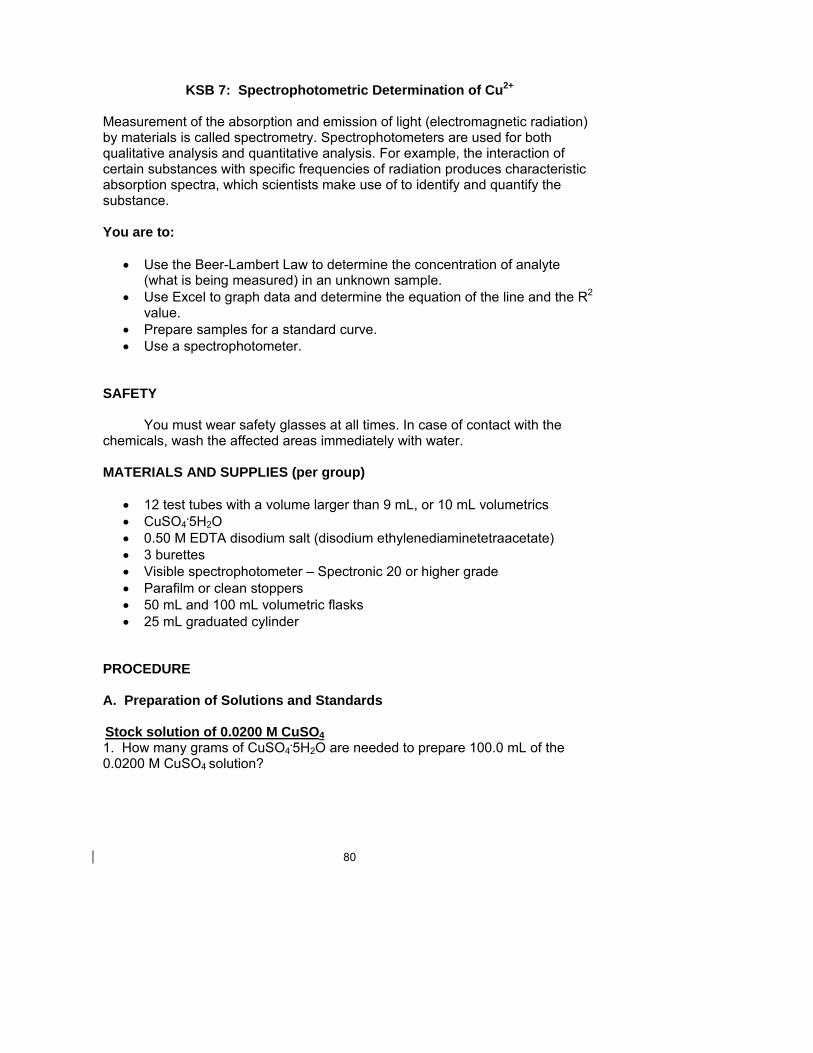
80
KSB 7: Spectrophotometric Determination of Cu2+
Measurement of the absorption and emission of light (electromagnetic radiation) by materials is called spectrometry. Spectrophotometers are used for both qualitative analysis and quantitative analysis. For example, the interaction of certain substances with specific frequencies of radiation produces characteristic absorption spectra, which scientists make use of to identify and quantify the substance. You are to:
• Use the Beer-Lambert Law to determine the concentration of analyte (what is being measured) in an unknown sample.
• Use Excel to graph data and determine the equation of the line and the R2
value. • Prepare samples for a standard curve. • Use a spectrophotometer.
SAFETY You must wear safety glasses at all times. In case of contact with the chemicals, wash the affected areas immediately with water. MATERIALS AND SUPPLIES (per group)
• 12 test tubes with a volume larger than 9 mL, or 10 mL volumetrics • CuSO4
.5H2O • 0.50 M EDTA disodium salt (disodium ethylenediaminetetraacetate) • 3 burettes • Visible spectrophotometer – Spectronic 20 or higher grade • Parafilm or clean stoppers • 50 mL and 100 mL volumetric flasks • 25 mL graduated cylinder
PROCEDURE A. Preparation of Solutions and Standards
Stock solution of 0.0200 M CuSO4 1. How many grams of CuSO4
.5H2O are needed to prepare 100.0 mL of the 0.0200 M CuSO4 solution?
81
2. Weigh the CuSO4.5H2 O to the nearest 1 mg. The mass should be within ±10
mg of the theoretical mass calculated in step 1. Remember to recalculate the actual molarity of the copper sulfate solution.
3. Transfer the copper sulfate to a clean 100 mL volumetric flask. The flask need not be dry. A funnel is recommended. After transferring the salt to the funnel, rinse the remaining salt from the weighing paper or boat with distilled water. Continue to spray the funnel with distilled water until all of the salt is rinsed into the volumetric flask. Fill the flask about half full with distilled water and mix until the salt is dissolved. Then dilute to the 100 mL mark. Cover the volumetric with Parafilm and invert 10 times. Rinse a clean burette with a small amount of the CuSO4 solution. Fill the burette with the solution. Note: If burettes are not available, the quantities can be measured using
pipets. 0.200 M EDTA 1. How many mL of 0.50 M EDTA disodium salt (EDTA) are needed to prepare 50.0 mL of 0.20 M EDTA?
2. Prepare this solution.
3. Rinse a clean burette with a small amount of the EDTA solution. Fill the burette with the EDTA solution. 4. Fill a third burette with distilled water. Note: If burettes are not available, use pipets to measure the indicated
quantities. Preparation of Samples Label 12 test tubes 1–12. Tubes 1–8 are for your standard curve, tubes 9–12 are your unknowns. Calculate the volume of water required to have a final volume of 10 mL in each test tube and fill in the “mL water” column in the table below. Note: If burettes are not available, the quantities can be measured using
pipets.
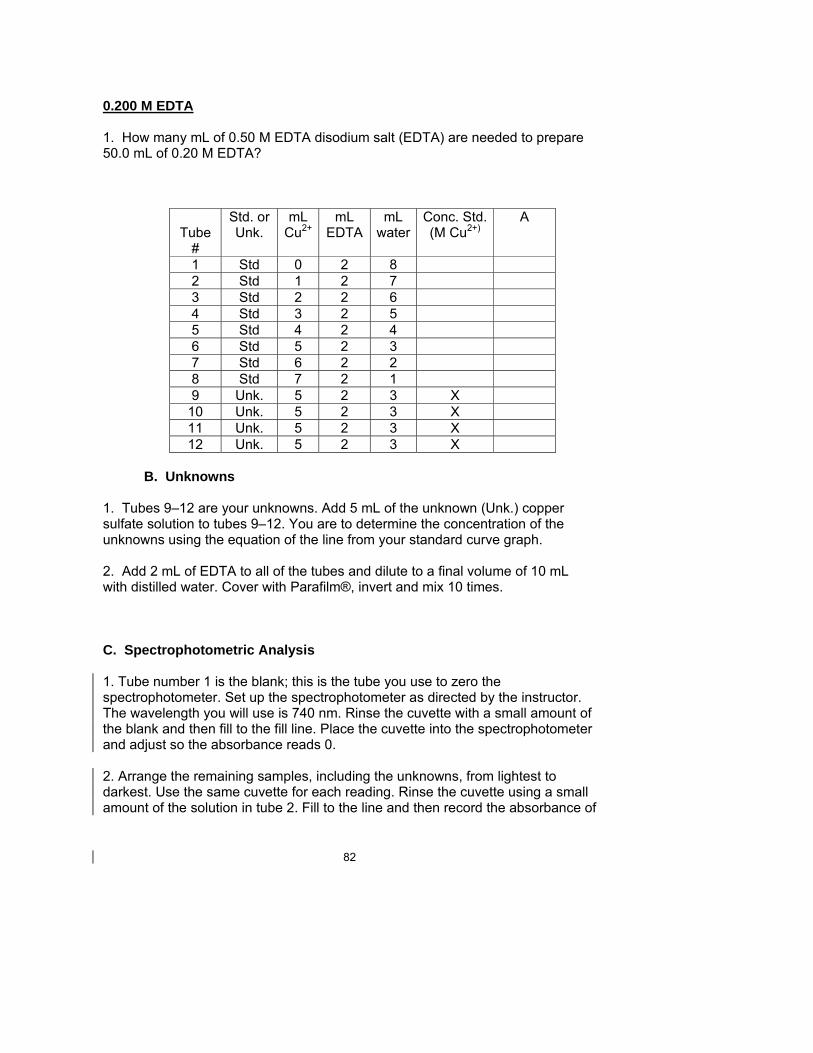
82
0.200 M EDTA 1. How many mL of 0.50 M EDTA disodium salt (EDTA) are needed to prepare 50.0 mL of 0.20 M EDTA?
Tube #
Std. or Unk.
mL Cu2+
mL EDTA
mL water
Conc. Std. (M Cu2+)
A
1 Std 0 2 8 2 Std 1 2 7 3 Std 2 2 6 4 Std 3 2 5 5 Std 4 2 4 6 Std 5 2 3 7 Std 6 2 2 8 Std 7 2 1 9 Unk. 5 2 3 X
10 Unk. 5 2 3 X 11 Unk. 5 2 3 X 12 Unk. 5 2 3 X
B. Unknowns 1. Tubes 9–12 are your unknowns. Add 5 mL of the unknown (Unk.) copper sulfate solution to tubes 9–12. You are to determine the concentration of the unknowns using the equation of the line from your standard curve graph. 2. Add 2 mL of EDTA to all of the tubes and dilute to a final volume of 10 mL with distilled water. Cover with Parafilm®, invert and mix 10 times. C. Spectrophotometric Analysis 1. Tube number 1 is the blank; this is the tube you use to zero the spectrophotometer. Set up the spectrophotometer as directed by the instructor. The wavelength you will use is 740 nm. Rinse the cuvette with a small amount of the blank and then fill to the fill line. Place the cuvette into the spectrophotometer and adjust so the absorbance reads 0.
2. Arrange the remaining samples, including the unknowns, from lightest to darkest. Use the same cuvette for each reading. Rinse the cuvette using a small amount of the solution in tube 2. Fill to the line and then record the absorbance of
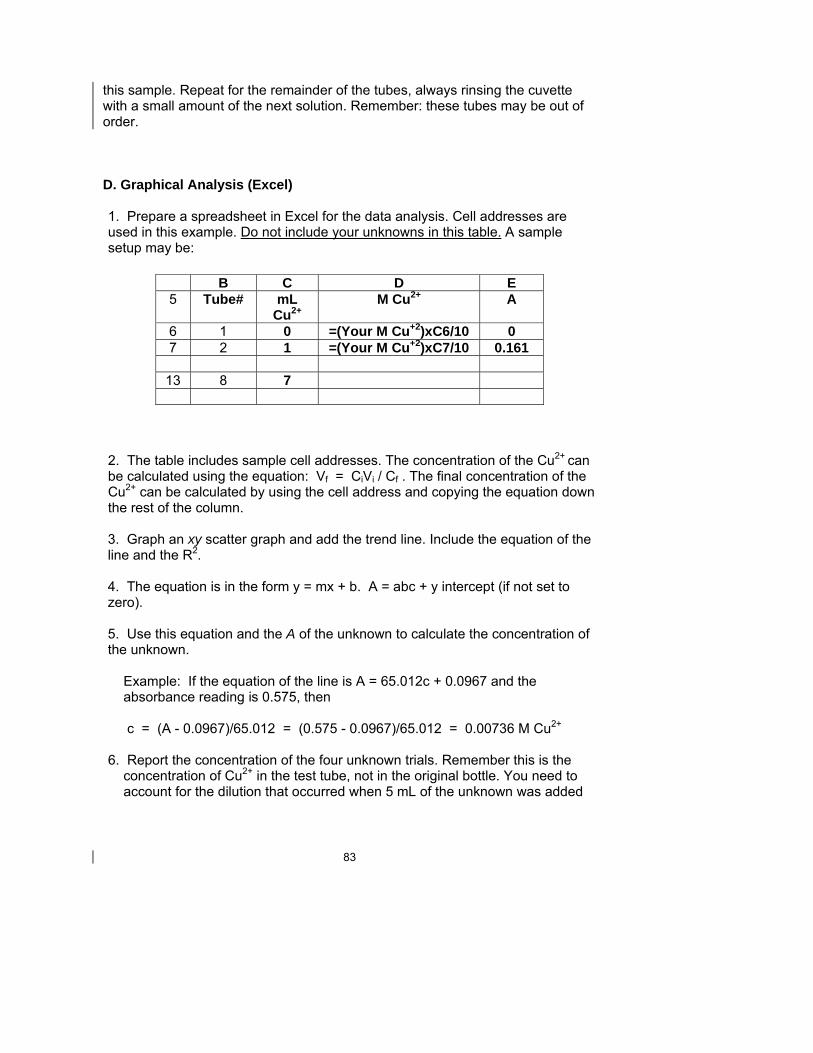
83
this sample. Repeat for the remainder of the tubes, always rinsing the cuvette with a small amount of the next solution. Remember: these tubes may be out of order. D. Graphical Analysis (Excel) 1. Prepare a spreadsheet in Excel for the data analysis. Cell addresses are used in this example. Do not include your unknowns in this table. A sample setup may be:
2. The table includes sample cell addresses. The concentration of the Cu2+ can be calculated using the equation: Vf = CiVi / Cf . The final concentration of the Cu2+ can be calculated by using the cell address and copying the equation down the rest of the column.
3. Graph an xy scatter graph and add the trend line. Include the equation of the line and the R2. 4. The equation is in the form y = mx + b. A = abc + y intercept (if not set to zero). 5. Use this equation and the A of the unknown to calculate the concentration of the unknown. Example: If the equation of the line is A = 65.012c + 0.0967 and the
absorbance reading is 0.575, then c = (A - 0.0967)/65.012 = (0.575 - 0.0967)/65.012 = 0.00736 M Cu2+
6. Report the concentration of the four unknown trials. Remember this is the concentration of Cu2+ in the test tube, not in the original bottle. You need to account for the dilution that occurred when 5 mL of the unknown was added
B C D E 5 Tube# mL
Cu2+ M Cu2+ A
6 1 0 =(Your M Cu+2)xC6/10 0 7 2 1 =(Your M Cu+2)xC7/10 0.161
13 8 7
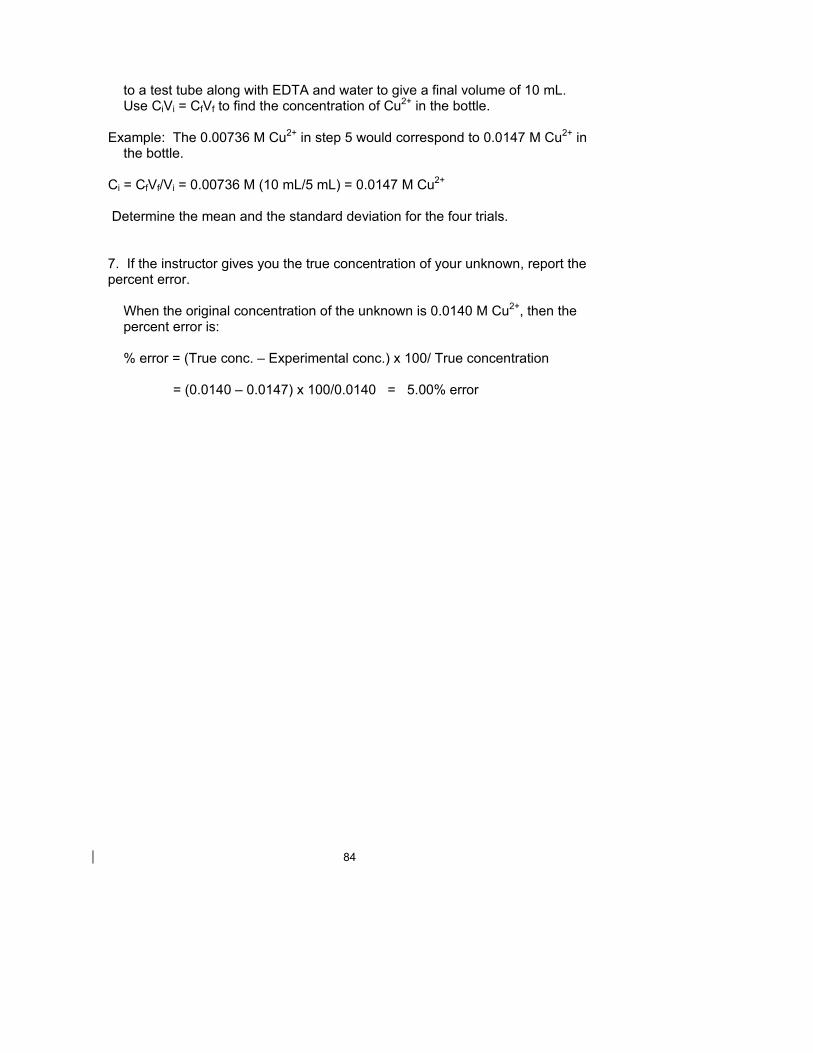
84
to a test tube along with EDTA and water to give a final volume of 10 mL. Use CiVi = CfVf to find the concentration of Cu2+ in the bottle.
Example: The 0.00736 M Cu2+ in step 5 would correspond to 0.0147 M Cu2+ in
the bottle. Ci = CfVf/Vi = 0.00736 M (10 mL/5 mL) = 0.0147 M Cu2+ Determine the mean and the standard deviation for the four trials. 7. If the instructor gives you the true concentration of your unknown, report the percent error. When the original concentration of the unknown is 0.0140 M Cu2+, then the
percent error is: % error = (True conc. – Experimental conc.) x 100/ True concentration = (0.0140 – 0.0147) x 100/0.0140 = 5.00% error