Embed Size (px)
Citation preview
Solutions for African Food Enterprises (SAFE)
Annual Progress Report
AID-OAA-A-12-00077
October 1, 2012 to September 30, 2013
SAFE Annual Progress Report Year 1 Page I
Jay Daniliuk
USAID, Bureau for Food Security (BFS)
Markets, Partnerships, and Innovation (MPI)
RRB, Room 2.11-063
1300 Pennsylvania Ave NW
Washington, DC 20523
October 31, 2013
Dear Mr. Daniliuk,
Subject: Annual Performance Report for the Solutions for African Food Enterprises (SAFE)
program (1 October 2012 to 30 September 2013)
We are pleased to submit our Year 1 Annual Performance Report for the SAFE program. This report
presents the program implementation performance status for results covering the period January 1 to
September 30, 2013 (Results for the period October 1 to December 31, 2012 were reported under AAIFP).
TechnoServe’s report is structured as follows:
Section 1 presents the executive summary of the report. It provides a summary of key program
achievements, and mechanisms adopted to address challenges experienced.
Section 2 covers the program performance, with specific focus on progress towards achievement of Year 1
targets, progress on implementation of key program components, and an overview of success stories from
the reporting period.
Section 3 contains a discussion of key challenges experienced in the implementation of the different
program components, and measures adopted to address these challenges.
The annexes attached to the main body of the report are: List of abbreviations (Annex 1), Success stories
(Annex 2), Profiles of assisted food processors (Annex 3), List of new technologies and management
practices made available to assisted food processors (Annex 4), List of food processors adopting new
technologies and management practices (Annex 5), List of new project charters developed (Annex 6), List
of completed capacity building projects (Annex 7), and Country specific details of sector-wide trainings
(Annex 8).
If you require clarification on any aspect of this report, please do not hesitate to contact me.
Sincerely,
Brent Wibberley
Chief of Party, SAFE Program
TechnoServe
SAFE Annual Progress Report Year 1 Page II
Table of Contents
1 Executive summary .................................................................................................................... 1
2 Program performance ................................................................................................................. 2
2.1 Progress towards achieving program targets ....................................................................... 2
2.2 Progress on implementation of key program components .................................................. 6
2.2.1 Knowledge and technology transfer to food processors .............................................. 6
2.2.2 Sustainable value chain/sector linkages ....................................................................... 7
2.2.3 Learning agenda ........................................................................................................... 8
2.2.4 Program expansion ....................................................................................................... 9
2.2.5 Gender audit ................................................................................................................. 9
2.2.6 Environmental Assessment ........................................................................................ 10
2.3 Success stories ................................................................................................................... 10
2.4 Challenges and lessons learnt ............................................................................................ 10
2.4.1 Knowledge and technology transfer to food processors ............................................ 10
2.4.2 Support in business planning and access to finance ................................................... 11
2.4.3 Sector-wide trainings.................................................................................................. 12
Annexes ............................................................................................................................................ 13
Annex 1: List of abbreviations ......................................................................................................... 13
Annex 2: Success stories .................................................................................................................. 14
Annex 3: Country level profile of assisted food processors ............................................................ 16
Annex 4: List of new technologies and management practices made available to assisted food
processors ......................................................................................................................................... 19
Annex 5: List of food processors adopting new technologies and management practices .............. 19
Annex 6: List of new project charters developed ............................................................................. 20
Annex 7: List of completed capacity building projects (charters) ................................................... 20
Annex 8: Details of sector-wide trainings by country ...................................................................... 21
SAFE Annual Progress Report Year 1 Page 1
1 Executive summary
Solutions for African Food Enterprises (SAFE) is a multi-year program implemented by TechnoServe (TNS) in
Malawi (three years), Kenya (four years) and Zambia (four years) through a partnership with USAID, TNS and
Partners in Food Solutions (PFS). SAFE seeks to increase the competitiveness of the African food processing sector
to expand availability of affordable and nutritious foods by facilitating the transfer of technology and knowledge
between skilled volunteer experts (from General Mills, Cargill, Royal DSM and Bühler, the corporate partners within
PFS) and African food processors.
This is the first annual program progress report, covering the period October 1, 2012 to September 30, 2013. It
contains cumulative results for Year 1 of program implementation, which covers the period January 1 to September
30, 2013 (results for the period October 1 – December 31, 2012 were reported under the prior African Alliance for
Improved Food Processing, AAIFP, program). The focus of this annual report is to provide an update on the progress
of key program components, challenges experienced, and mechanisms adopted to address these challenges.
In Year 1, the total program expenditure level was US$1,110,371.89 against a budget of US$1,605,161, representing
an expenditure rate of 69%. Under expenditure is attributed to a low spend on the allocated Technical Assistance fund
for program expansion and delays in implementation of some program activities, notably recruitment of new program
staff and delayed supply chain studies due to political uncertainty in Kenya (general elections on March 4, 2013). The
total leverage contributed by PFS to the SAFE program in Year 1 stood at US$1,238,184, comprising of US$648,974
as total value of volunteer hours (4,064.2 hours) and US$609,206 as PFS direct operating expenses on SAFE.
As of September 30, 2013, TNS provided customized technical assistance to 24 food processors. One of these
processors also graduated from the program after completing its technical assistance projects. During this reporting
period, SAFE offered 88 customized capacity building projects to assisted processors and completed 20 of these. In
Year 2, TNS plans to onboard 19 additional food processors. In collaboration with PFS and local training institutes,
we trained 315 people (225M, 90F) representing 106 firms through seven sector-wide trainings (SWTs) given on
identified industry knowledge gaps. In Kenya, trainings on fortification of maize, wheat flour and edible oils, as well
as business strategy and planning, were conducted. In Zambia, we facilitated trainings on mycotoxin control and
monitoring and access to finance. In Malawi, sector-wide trainings on aflatoxin control and testing, business strategy
and access to finance were conducted.
A gender audit was conducted in Malawi and is under way in Q1 of Year 2 in Kenya and Zambia. The Malawi audit
revealed that whilst reviewed companies complied with maternity laws, they all lacked a gender policy and sexual
harassment policy and two companies were found to discriminate against women during recruitment. The audit
findings will inform a specific gender plan to start in Year 2.
TNS, in partnership with PFS, provided direct support in business planning and access to finance to assisted food
processors. In Year 1, six food processors (two in each of the program countries) received assistance in loan
applications. To date, one of these companies was successful in its loan application and the remaining loan
applications are ongoing. To contribute to sustainable and improved value chain linkages in the food processing
sector, SAFE conducted a supply chain study of soy, maize and groundnuts in Zambia and presented findings to
industry stakeholders and assisted processors that helped them make better procurement and sales decisions. Similar
supply chain studies are ongoing in Kenya and Malawi and expect to be completed and presented in Q1 2014.
The program was allocated TA funds towards expansion planning. With the strong support of USAID and PFS, we are
assessing how to widen this approach to other priority countries. A mapping showing opportunities for SAFE
intervention was conducted in Mozambique and shared with the local USAID Mission; we are currently waiting on
their response. In Uganda, the local USAID Mission and other stakeholders (GAIN) were engaged to discuss potential
demand for the SAFE program there. Approval has been given for investigative mapping studies to be conducted in
Year 2 in Uganda and Ghana that may lead to program expansion in these countries.
A key challenge observed in Year 1 has been the difficulty many companies face in getting agreeable financing. The
high cost of financing has a ripple effect on the ability of companies to grow and adopt new technology practices. As
we enter the second year of the program, greater emphasis is being placed on overcoming this challenge to better
unlock the potential of our technology and knowledge transfer.

SAFE Annual Progress Report Year 1 Page 2
2 Program performance 2.1 Progress towards achieving program targets Program elements Indicators Classification Baseline Year 1
Targets Year 1 annual results
Comment
Goal: Expanded and increased competitiveness of (nutritious and other) food processing sector.
1. Number of jobs attributed to FtF implementation.
FtF (SPS 4.5-2) 0 60 54 (34M, 20F)
Comprised of 14 (10M, 4F) in Zambia, 2 (1M, 1F) in Kenya, and 38 (23M, 15F) in Malawi.
2. Number of firms (excluding farms) or Civil Society Organizations (CSOs) engaged in agricultural and food security-related manufacturing and services now operating more profitably (at or above cost) because of USG assistance.
FtF (SPS 4.5.2-43) 0 20 10 3 processors in Kenya and 7 in Zambia. There was non-disclosure of data on profits by processors in Malawi because of fear of risk of non-tax compliance penalties.
3. Incremental volume of processed foods sold by assisted processors.
Custom 0 20% (19%) 81% increase in Kenya, (56%) decrease in Zambia (production pegged to peak season of agricultural raw materials in December), and 1.4% increase in Malawi.
4. Value of incremental net profit by assisted food processers.
Custom 0 15% 3.6% 47% decrease in net profits in Kenya due to high cost of production inputs, 62% increase in profits in Zambia and non-disclosure of data on profits in Malawi.
5. Volume of improved nutritious food products sold by assisted food processors.
Custom 10,409Mt 5,000Mt 8,442.8Mt Kenya (1,461Mt), Malawi (6,562.8Mt), in Zambia (419Mt).
Outcome: Strengthened capacity of African based food processing companies to produce and market quality, safe nutritious foods.
6. Number of private enterprises, producers organizations, water users associations, women's groups, trade and business associations, and community-based organizations (CBOs) that applied new technologies or management practices as a result of USG assistance.
FtF (SPS 4.5.2-28) 0 10 7 3 in Kenya, 2 in Malawi and two in Zambia. Examples of new technologies and management practices applied include food safety systems, product formulation, product improvement, financial management system among others.
7. Value of new private sector investment in the agriculture sector or food chain leveraged by FTF implementation.
FtF (SPS 4.5.2-38) 0 $200,000 $461,724 Investments made by four processors on plant expansion and equipment acquisition in Kenya (Soy Afric), Zambia (Forest Fruits, Sylva Solutions and Chankwakwa).
8. Number of processors who have been certified in local, regional or food aid quality standards as a result of USG assistance.
Custom 0 2 1 PPB received an annual food safety certification from UNICEF in Malawi. ISO certification project was completed with one processor in Kenya, but it relocated to new premises before being ISO certified.
9. Number of assisted processors that successfully accessed bank loans as a result of USG assistance.
Custom 0 3 1 Chankwakwa in Zambia received funding of $35,849 from Market Improvement and Innovation Fund (MIIF). Others in progress.
SAFE Annual Progress Report Year 1 Page 3
Program elements Indicators Classification Baseline Year 1 Targets
Year 1 annual results
Comment
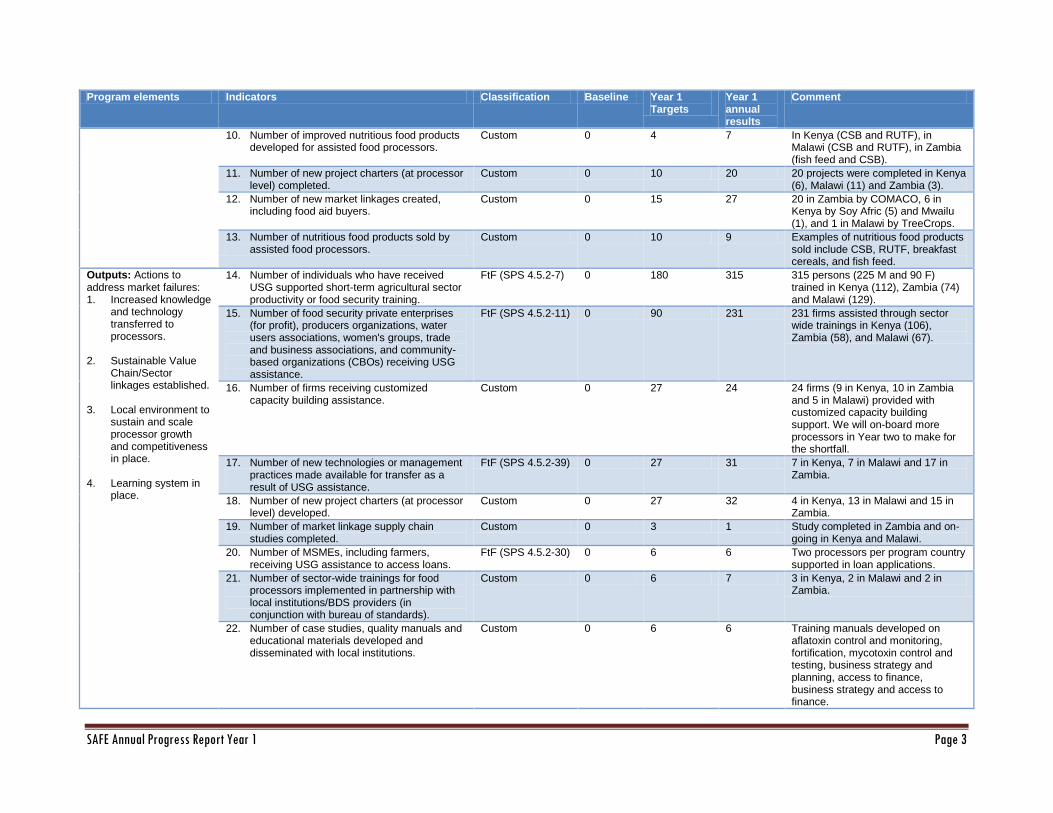
10. Number of improved nutritious food products developed for assisted food processors.
Custom 0 4 7 In Kenya (CSB and RUTF), in Malawi (CSB and RUTF), in Zambia (fish feed and CSB).
11. Number of new project charters (at processor level) completed.
Custom 0 10 20 20 projects were completed in Kenya (6), Malawi (11) and Zambia (3).
12. Number of new market linkages created, including food aid buyers.
Custom 0 15 27 20 in Zambia by COMACO, 6 in Kenya by Soy Afric (5) and Mwailu (1), and 1 in Malawi by TreeCrops.
13. Number of nutritious food products sold by assisted food processors.
Custom 0 10 9 Examples of nutritious food products sold include CSB, RUTF, breakfast cereals, and fish feed.
Outputs: Actions to address market failures: 1. Increased knowledge
and technology transferred to processors.
2. Sustainable Value
Chain/Sector linkages established.
3. Local environment to
sustain and scale processor growth and competitiveness in place.
4. Learning system in place.
14. Number of individuals who have received USG supported short-term agricultural sector productivity or food security training.
FtF (SPS 4.5.2-7) 0 180 315 315 persons (225 M and 90 F) trained in Kenya (112), Zambia (74) and Malawi (129).
15. Number of food security private enterprises (for profit), producers organizations, water users associations, women's groups, trade and business associations, and community-based organizations (CBOs) receiving USG assistance.
FtF (SPS 4.5.2-11) 0 90 231 231 firms assisted through sector wide trainings in Kenya (106), Zambia (58), and Malawi (67).
16. Number of firms receiving customized capacity building assistance.
Custom 0 27 24 24 firms (9 in Kenya, 10 in Zambia and 5 in Malawi) provided with customized capacity building support. We will on-board more processors in Year two to make for the shortfall.
17. Number of new technologies or management practices made available for transfer as a result of USG assistance.
FtF (SPS 4.5.2-39) 0 27 31 7 in Kenya, 7 in Malawi and 17 in Zambia.
18. Number of new project charters (at processor level) developed.
Custom 0 27 32 4 in Kenya, 13 in Malawi and 15 in Zambia.
19. Number of market linkage supply chain studies completed.
Custom 0 3 1 Study completed in Zambia and on-going in Kenya and Malawi.
20. Number of MSMEs, including farmers, receiving USG assistance to access loans.
FtF (SPS 4.5.2-30) 0 6 6 Two processors per program country supported in loan applications.
21. Number of sector-wide trainings for food processors implemented in partnership with local institutions/BDS providers (in conjunction with bureau of standards).
Custom 0 6 7 3 in Kenya, 2 in Malawi and 2 in Zambia.
22. Number of case studies, quality manuals and educational materials developed and disseminated with local institutions.
Custom 0 6 6 Training manuals developed on aflatoxin control and monitoring, fortification, mycotoxin control and testing, business strategy and planning, access to finance, business strategy and access to finance.
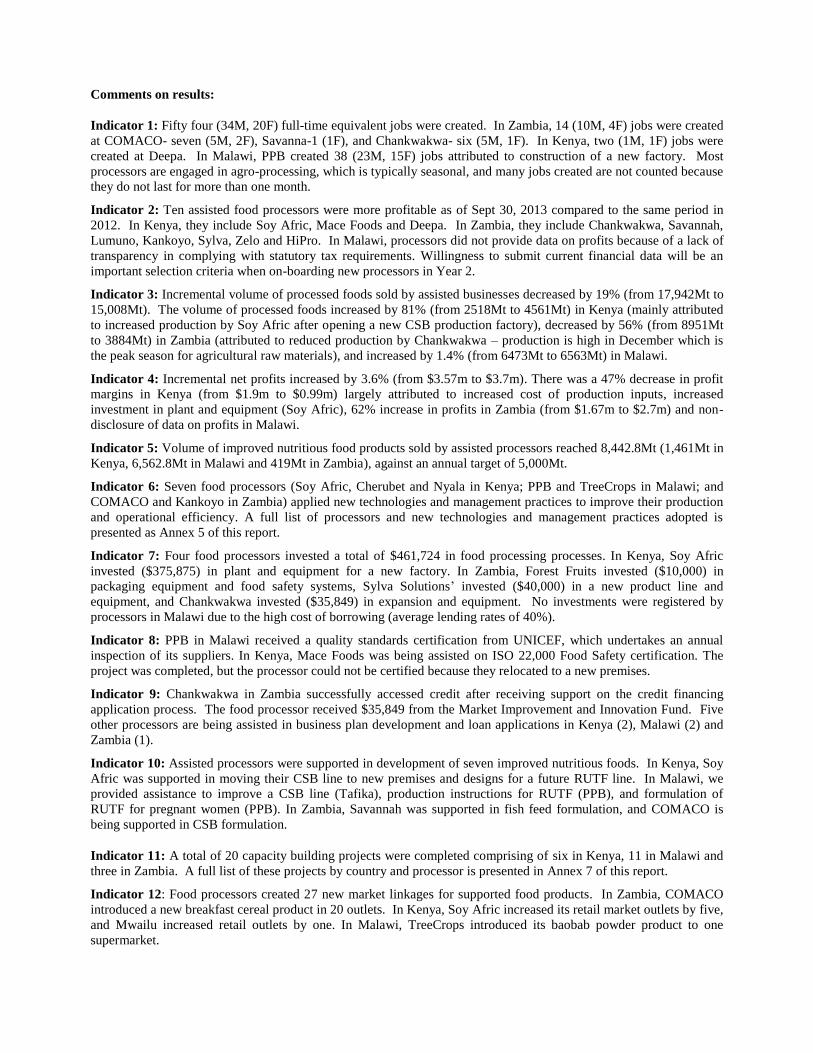
Comments on results:
Indicator 1: Fifty four (34M, 20F) full-time equivalent jobs were created. In Zambia, 14 (10M, 4F) jobs were created
at COMACO- seven (5M, 2F), Savanna-1 (1F), and Chankwakwa- six (5M, 1F). In Kenya, two (1M, 1F) jobs were
created at Deepa. In Malawi, PPB created 38 (23M, 15F) jobs attributed to construction of a new factory. Most
processors are engaged in agro-processing, which is typically seasonal, and many jobs created are not counted because
they do not last for more than one month.
Indicator 2: Ten assisted food processors were more profitable as of Sept 30, 2013 compared to the same period in
2012. In Kenya, they include Soy Afric, Mace Foods and Deepa. In Zambia, they include Chankwakwa, Savannah,
Lumuno, Kankoyo, Sylva, Zelo and HiPro. In Malawi, processors did not provide data on profits because of a lack of
transparency in complying with statutory tax requirements. Willingness to submit current financial data will be an
important selection criteria when on-boarding new processors in Year 2.
Indicator 3: Incremental volume of processed foods sold by assisted businesses decreased by 19% (from 17,942Mt to
15,008Mt). The volume of processed foods increased by 81% (from 2518Mt to 4561Mt) in Kenya (mainly attributed
to increased production by Soy Afric after opening a new CSB production factory), decreased by 56% (from 8951Mt
to 3884Mt) in Zambia (attributed to reduced production by Chankwakwa – production is high in December which is
the peak season for agricultural raw materials), and increased by 1.4% (from 6473Mt to 6563Mt) in Malawi.
Indicator 4: Incremental net profits increased by 3.6% (from $3.57m to $3.7m). There was a 47% decrease in profit
margins in Kenya (from $1.9m to $0.99m) largely attributed to increased cost of production inputs, increased
investment in plant and equipment (Soy Afric), 62% increase in profits in Zambia (from $1.67m to $2.7m) and non-
disclosure of data on profits in Malawi.
Indicator 5: Volume of improved nutritious food products sold by assisted processors reached 8,442.8Mt (1,461Mt in
Kenya, 6,562.8Mt in Malawi and 419Mt in Zambia), against an annual target of 5,000Mt.
Indicator 6: Seven food processors (Soy Afric, Cherubet and Nyala in Kenya; PPB and TreeCrops in Malawi; and
COMACO and Kankoyo in Zambia) applied new technologies and management practices to improve their production
and operational efficiency. A full list of processors and new technologies and management practices adopted is
presented as Annex 5 of this report.
Indicator 7: Four food processors invested a total of $461,724 in food processing processes. In Kenya, Soy Afric
invested ($375,875) in plant and equipment for a new factory. In Zambia, Forest Fruits invested ($10,000) in
packaging equipment and food safety systems, Sylva Solutions’ invested ($40,000) in a new product line and
equipment, and Chankwakwa invested ($35,849) in expansion and equipment. No investments were registered by
processors in Malawi due to the high cost of borrowing (average lending rates of 40%).
Indicator 8: PPB in Malawi received a quality standards certification from UNICEF, which undertakes an annual
inspection of its suppliers. In Kenya, Mace Foods was being assisted on ISO 22,000 Food Safety certification. The
project was completed, but the processor could not be certified because they relocated to a new premises.
Indicator 9: Chankwakwa in Zambia successfully accessed credit after receiving support on the credit financing
application process. The food processor received $35,849 from the Market Improvement and Innovation Fund. Five
other processors are being assisted in business plan development and loan applications in Kenya (2), Malawi (2) and
Zambia (1).
Indicator 10: Assisted processors were supported in development of seven improved nutritious foods. In Kenya, Soy
Afric was supported in moving their CSB line to new premises and designs for a future RUTF line. In Malawi, we
provided assistance to improve a CSB line (Tafika), production instructions for RUTF (PPB), and formulation of
RUTF for pregnant women (PPB). In Zambia, Savannah was supported in fish feed formulation, and COMACO is
being supported in CSB formulation.
Indicator 11: A total of 20 capacity building projects were completed comprising of six in Kenya, 11 in Malawi and
three in Zambia. A full list of these projects by country and processor is presented in Annex 7 of this report.
Indicator 12: Food processors created 27 new market linkages for supported food products. In Zambia, COMACO
introduced a new breakfast cereal product in 20 outlets. In Kenya, Soy Afric increased its retail market outlets by five,
and Mwailu increased retail outlets by one. In Malawi, TreeCrops introduced its baobab powder product to one
supermarket.
SAFE Annual Progress Report Year 1 Page 5
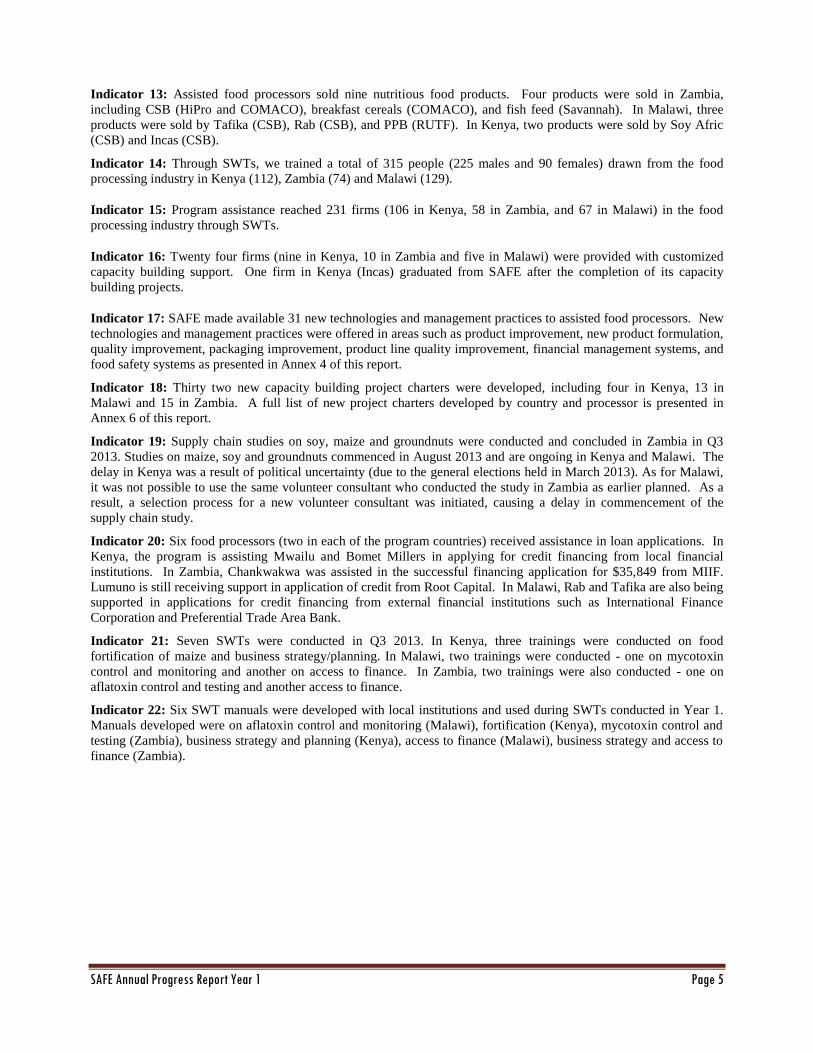
Indicator 13: Assisted food processors sold nine nutritious food products. Four products were sold in Zambia,
including CSB (HiPro and COMACO), breakfast cereals (COMACO), and fish feed (Savannah). In Malawi, three
products were sold by Tafika (CSB), Rab (CSB), and PPB (RUTF). In Kenya, two products were sold by Soy Afric
(CSB) and Incas (CSB).
Indicator 14: Through SWTs, we trained a total of 315 people (225 males and 90 females) drawn from the food
processing industry in Kenya (112), Zambia (74) and Malawi (129).
Indicator 15: Program assistance reached 231 firms (106 in Kenya, 58 in Zambia, and 67 in Malawi) in the food
processing industry through SWTs.
Indicator 16: Twenty four firms (nine in Kenya, 10 in Zambia and five in Malawi) were provided with customized
capacity building support. One firm in Kenya (Incas) graduated from SAFE after the completion of its capacity
building projects.
Indicator 17: SAFE made available 31 new technologies and management practices to assisted food processors. New
technologies and management practices were offered in areas such as product improvement, new product formulation,
quality improvement, packaging improvement, product line quality improvement, financial management systems, and
food safety systems as presented in Annex 4 of this report.
Indicator 18: Thirty two new capacity building project charters were developed, including four in Kenya, 13 in
Malawi and 15 in Zambia. A full list of new project charters developed by country and processor is presented in
Annex 6 of this report.
Indicator 19: Supply chain studies on soy, maize and groundnuts were conducted and concluded in Zambia in Q3
2013. Studies on maize, soy and groundnuts commenced in August 2013 and are ongoing in Kenya and Malawi. The
delay in Kenya was a result of political uncertainty (due to the general elections held in March 2013). As for Malawi,
it was not possible to use the same volunteer consultant who conducted the study in Zambia as earlier planned. As a
result, a selection process for a new volunteer consultant was initiated, causing a delay in commencement of the
supply chain study.
Indicator 20: Six food processors (two in each of the program countries) received assistance in loan applications. In
Kenya, the program is assisting Mwailu and Bomet Millers in applying for credit financing from local financial
institutions. In Zambia, Chankwakwa was assisted in the successful financing application for $35,849 from MIIF.
Lumuno is still receiving support in application of credit from Root Capital. In Malawi, Rab and Tafika are also being
supported in applications for credit financing from external financial institutions such as International Finance
Corporation and Preferential Trade Area Bank.
Indicator 21: Seven SWTs were conducted in Q3 2013. In Kenya, three trainings were conducted on food
fortification of maize and business strategy/planning. In Malawi, two trainings were conducted - one on mycotoxin
control and monitoring and another on access to finance. In Zambia, two trainings were also conducted - one on
aflatoxin control and testing and another access to finance.
Indicator 22: Six SWT manuals were developed with local institutions and used during SWTs conducted in Year 1.
Manuals developed were on aflatoxin control and monitoring (Malawi), fortification (Kenya), mycotoxin control and
testing (Zambia), business strategy and planning (Kenya), access to finance (Malawi), business strategy and access to
finance (Zambia).

SAFE Annual Progress Report Year 1 Page 6
2.2 Progress on implementation of key program components 2.2.1 Knowledge and technology transfer to food processors
2.2.1.1 Customized Knowledge and technology transfer to food processors.
SAFE worked directly with local food to strengthen their capacity to produce and market quality, safe and nutritious foods. In Year 1, SAFE offered a total of 88 capacity building projects to assisted food processors as presented in Figure 2.1.
Figure 2.1: Number of capacity building projects offered
Twenty capacity building projects were completed and 68 other projects are at various stages of implementation. The
number of capacity building projects is expected to increase as we on-board 19 additional food processors.
24 30
34
88
0
10
20
30
40
50
60
70
80
90
100
Kenya Malawi Zambia Total
See Annex 3 for a detailed
list of capacity building
projects by country.
Graphic representation of proposed milling equipment for Mwailu in Kenya
Graphic representation of honey bottle filling technology being offered to Forest fruits in Zambia
RUTF being packaged in a new cheaper sachet film at PPB in Malawi. Sachet developed with support from SAFE project.
Mrs Sylvia Banda, MD Sylva Food Solutions with Jeff Dykstra, CEO, Partners in Food Solutions after signing the Client Assistance Agreement.

SAFE Annual Progress Report Year 1 Page 7
2.2.1.2 Sector-wide trainings
In each of the three countries, TNS identified knowledge and technology gaps and collaborated with local institutions
and PFS to develop training materials and deliver trainings. In Year 1, we conducted seven SWTs comprising of
trainings in business strategy (four) and technical areas (three). Table 2.1 presents a summary of SWTs in Year 1. Table 2.1: Summary of sector-wide trainings
See Annex 8 for country specific details of SWTs conducted in Year 1.
2.2.2 Sustainable value chain/sector linkages
2.2.2.1 Supply chain studies
TNS planned to conduct one market linkages and supply chain study for selected products in each of the program
countries. In Q3 of Year 1, a supply chain study was conducted and concluded by a volunteer consultant in Zambia.
The study focused on three main products, namely: soy, maize and groundnuts. The findings of the study were shared
with processors which helped inform decision making around procurement of raw materials, pricing, marketing and
new formulations/varieties. In Q4 of Year 1, similar supply chain studies commenced and are on-going in Kenya and
Malawi.
2.2.2.2 Support in business planning and access to finance
TNS, in collaboration with PFS, provided support to processors to strengthen their financial systems and develop
business and investment plans. These efforts aimed at assisting processors to secure financing from financial
institutions. TNS identified financial institutions, assessed financing needs of processors and supported business plan
development and financial proposals to potential credit financiers, as presented in Table 2.2.
Country Year 1 Target
Year 1 Result
# of participants # of processors (firms) Male Female Total
Kenya 2 3 85 27 112 106
Zambia 2 2 52 22 74 58
Malawi 2 2 88 41 129 67
Total 6 7 225 90 315 231
“…thank you very much for the training. When you educate us, you are basically educating humanity as we will share this information with so many other people…’’ Catherine, a
participant during a SWT on fortification of maize and edible oils
held on July 4 in Nairobi, Kenya.
A delegate introduces her product during a business strategy and
planning training on July 5, 2013 in Eldoret, Kenya
A fortification expert demonstrates Vitamin A determination using iCheck on July 4, 2013 in Nairobi, Kenya
Group work during training on Mycotoxin control and testing on
August 30, 2013 in Lusaka, Zambia
SAFE Annual Progress Report Year 1 Page 8
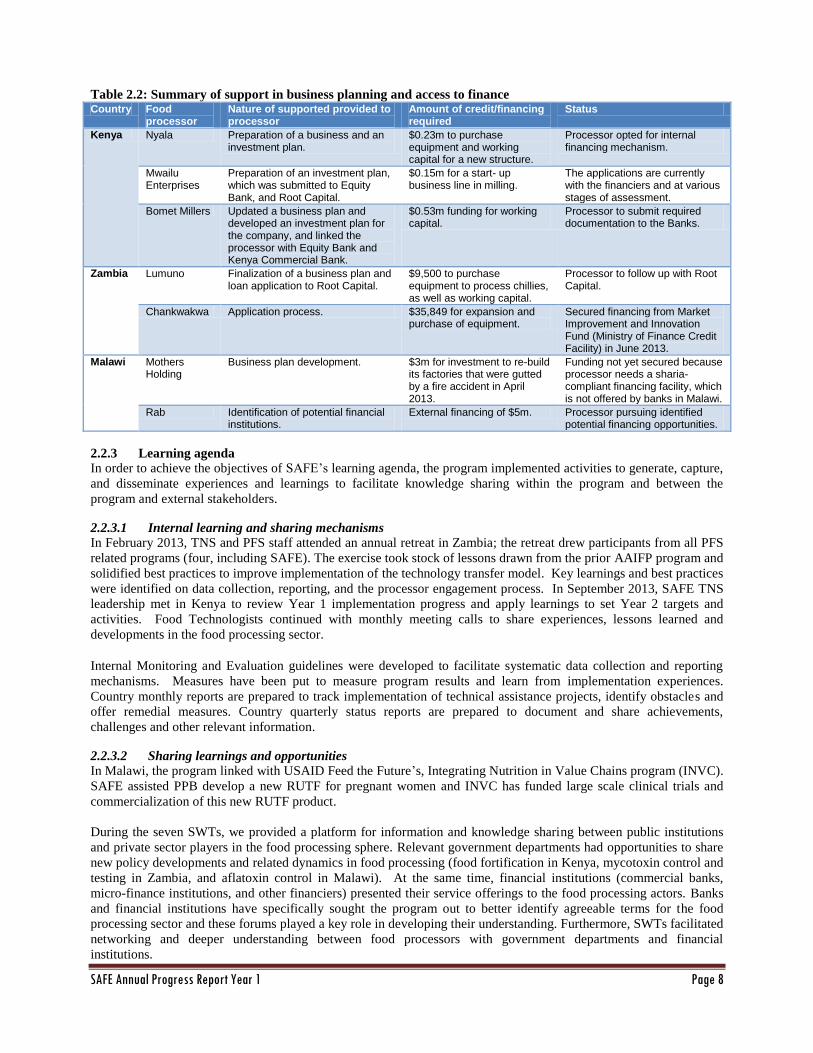
Table 2.2: Summary of support in business planning and access to finance Country Food
processor Nature of supported provided to processor
Amount of credit/financing required
Status
Kenya Nyala Preparation of a business and an investment plan.
$0.23m to purchase equipment and working capital for a new structure.
Processor opted for internal financing mechanism.
Mwailu Enterprises
Preparation of an investment plan, which was submitted to Equity Bank, and Root Capital.
$0.15m for a start- up business line in milling.
The applications are currently with the financiers and at various stages of assessment.
Bomet Millers Updated a business plan and developed an investment plan for the company, and linked the processor with Equity Bank and Kenya Commercial Bank.
$0.53m funding for working capital.
Processor to submit required documentation to the Banks.
Zambia Lumuno Finalization of a business plan and loan application to Root Capital.
$9,500 to purchase equipment to process chillies, as well as working capital.
Processor to follow up with Root Capital.
Chankwakwa Application process. $35,849 for expansion and purchase of equipment.
Secured financing from Market Improvement and Innovation Fund (Ministry of Finance Credit Facility) in June 2013.
Malawi Mothers Holding
Business plan development. $3m for investment to re-build its factories that were gutted by a fire accident in April 2013.
Funding not yet secured because processor needs a sharia-compliant financing facility, which is not offered by banks in Malawi.
Rab Identification of potential financial institutions.
External financing of $5m. Processor pursuing identified potential financing opportunities.
2.2.3 Learning agenda
In order to achieve the objectives of SAFE’s learning agenda, the program implemented activities to generate, capture,
and disseminate experiences and learnings to facilitate knowledge sharing within the program and between the
program and external stakeholders.
2.2.3.1 Internal learning and sharing mechanisms
In February 2013, TNS and PFS staff attended an annual retreat in Zambia; the retreat drew participants from all PFS
related programs (four, including SAFE). The exercise took stock of lessons drawn from the prior AAIFP program and
solidified best practices to improve implementation of the technology transfer model. Key learnings and best practices
were identified on data collection, reporting, and the processor engagement process. In September 2013, SAFE TNS
leadership met in Kenya to review Year 1 implementation progress and apply learnings to set Year 2 targets and
activities. Food Technologists continued with monthly meeting calls to share experiences, lessons learned and
developments in the food processing sector.
Internal Monitoring and Evaluation guidelines were developed to facilitate systematic data collection and reporting
mechanisms. Measures have been put to measure program results and learn from implementation experiences.
Country monthly reports are prepared to track implementation of technical assistance projects, identify obstacles and
offer remedial measures. Country quarterly status reports are prepared to document and share achievements,
challenges and other relevant information.
2.2.3.2 Sharing learnings and opportunities
In Malawi, the program linked with USAID Feed the Future’s, Integrating Nutrition in Value Chains program (INVC).
SAFE assisted PPB develop a new RUTF for pregnant women and INVC has funded large scale clinical trials and
commercialization of this new RUTF product.
During the seven SWTs, we provided a platform for information and knowledge sharing between public institutions
and private sector players in the food processing sphere. Relevant government departments had opportunities to share
new policy developments and related dynamics in food processing (food fortification in Kenya, mycotoxin control and
testing in Zambia, and aflatoxin control in Malawi). At the same time, financial institutions (commercial banks,
micro-finance institutions, and other financiers) presented their service offerings to the food processing actors. Banks
and financial institutions have specifically sought the program out to better identify agreeable terms for the food
processing sector and these forums played a key role in developing their understanding. Furthermore, SWTs facilitated
networking and deeper understanding between food processors with government departments and financial
institutions.

SAFE Annual Progress Report Year 1 Page 9
The previously mentioned supply chain study in Zambia was shared with local stakeholders (including USAID and
WFP) to inform a collaborative learning agenda around opportunities and best practices for improving these value
chains.
To promote the knowledge and technology transfer model, TNS liaised with local USAID and PEPFAR to share
learnings and investigate opportunities to align with their interests. In Sept 2013, the SAFE Chief of Party presented a
map of the Mozambique food processing industry to local USAID, GAIN and other stakeholders, highlighting key
knowledge gaps and potential areas for SAFE support. In Uganda, a meeting was held in June 2013 with GAIN and
USAID to share learnings from the SAFE model and discuss the need for a mapping exercise and collaboration with
GAIN’s ENABLE program.
2.2.4 Program expansion
The program has put mechanisms in place to replicate the technology transfer model by deepening interventions in the
current program countries and widening to other countries like Mozambique and Uganda.
2.2.4.1 Deepening within current program countries
In 2013, the program continued with efforts to deepen its presence in current program countries by onboarding two
additional processors (one each in Malawi and Zambia). In 2014, nineteen additional food processors will be on-
boarded into the program (ten in Kenya, five in Malawi and four in Zambia).
2.2.4.2 Widening to other priority countries
Efforts to expand the program to other countries were pursued in Mozambique and Uganda. In Mozambique USAID
approved a mapping of the processing industry, which was conducted from June and concluded in September 2013.
The mapping identified opportunities for the program in sectors such as maize and wheat flour milling, dairies, snacks,
oil and poultry, with a particular focus on fortification efforts and quality management systems. Broader opportunities
also exist in strengthening the education of the food processing workforce, supporting the food policy environment,
complimenting government and development initiatives around nutrition, the policy environment and business
development, teaching cross-cutting skills to the industry (i.e. GMP) and supporting access to finance. It also revealed
complexities in the local geo-political environment, difficulties in communications (in the infrastructure but also in
working with the local language) and a largely underdeveloped processing industry that faces strong import
competition. Mapping findings were presented to the local USAID Mission, GAIN and other stakeholders for
consideration. No progress has been made after the mapping exercise, as there has been no feedback from the local
USAID Mission.
In Uganda, meetings were held in June 2013 with USAID, FTF and GHI teams and GAIN, to discuss opportunities for
SAFE’s technical advice and alignment with GAIN’s ENABLE Program that would look to support the nutrition
policy environment. It was observed that there is a good opportunity for SAFE and ENABLE to partner to strengthen
the food processing industry in Uganda and plans are underway to map the processing industry in support of this
design in Year 2.
2.2.5 Gender audit
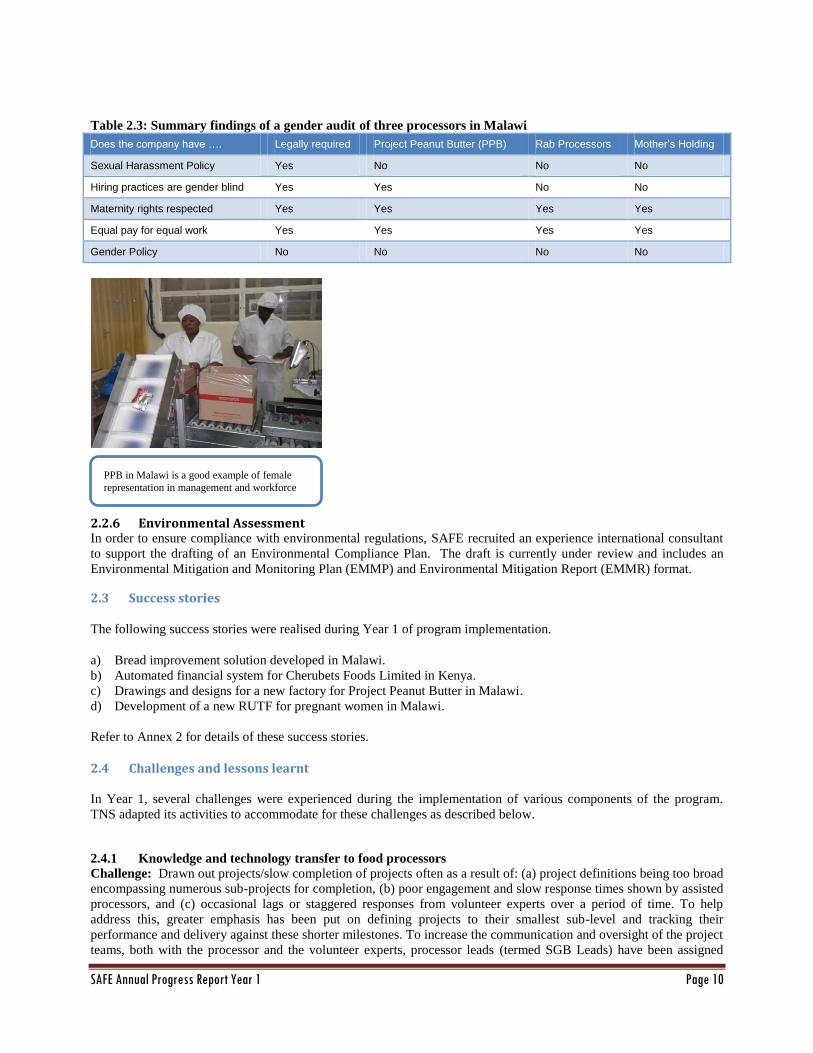
TNS staff conducted a gender audit of three processors in Malawi (Rab, PPB and Mothers) from September 2 – 6,
2013. The aim of the gender audit was to assess: (a) the level of female participation in production, operations and
management, and (b) processor’s compliance to gender laws and policies. The gender audit established female
participation in PPB was high but very low in Rab and Mothers. Furthermore, all of the firms assessed were in
compliance with maternity rights and equal pay for equal work. However, they were not compliant with other gender
equality laws and policies as presented in Table 2.3.
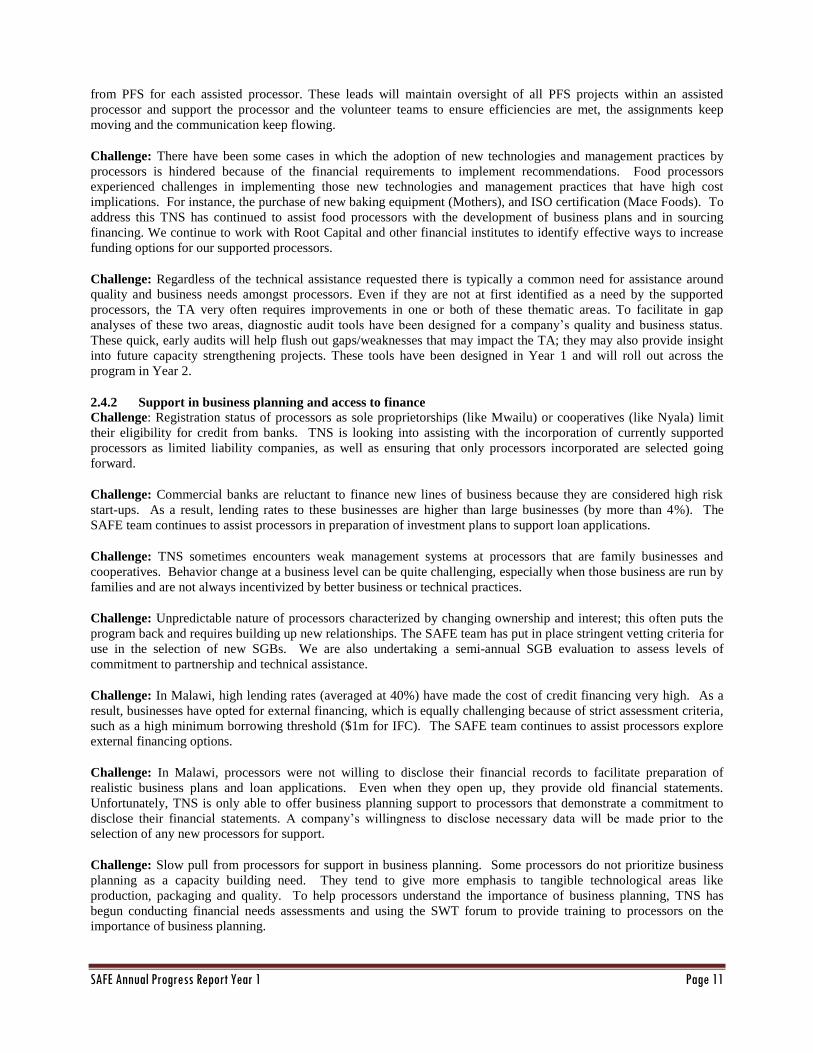
The assessed processors lacked a written Sexual Harassment Policy and associated procedures and two admitted there
was discrimination against women during hiring. Non-compliance is largely attributed to lack of awareness. In view of
this, the program will work with the processors to make them compliant with country-specific gender equality laws
and policies. Specific areas where processors require support and capacity building include developing sexual
harassment and discrimination policies and training of management and staff on gender integration. In Year 2, the
program will roll out gender audits in Kenya and Zambia.
SAFE Annual Progress Report Year 1 Page 10
Table 2.3: Summary findings of a gender audit of three processors in Malawi
Does the company have …. Legally required Project Peanut Butter (PPB) Rab Processors Mother’s Holding
Sexual Harassment Policy Yes No No No
Hiring practices are gender blind Yes Yes No No
Maternity rights respected Yes Yes Yes Yes
Equal pay for equal work Yes Yes Yes Yes
Gender Policy No No No No
2.2.6 Environmental Assessment In order to ensure compliance with environmental regulations, SAFE recruited an experience international consultant
to support the drafting of an Environmental Compliance Plan. The draft is currently under review and includes an
Environmental Mitigation and Monitoring Plan (EMMP) and Environmental Mitigation Report (EMMR) format.
2.3 Success stories
The following success stories were realised during Year 1 of program implementation.
a) Bread improvement solution developed in Malawi.
b) Automated financial system for Cherubets Foods Limited in Kenya.
c) Drawings and designs for a new factory for Project Peanut Butter in Malawi.
d) Development of a new RUTF for pregnant women in Malawi.
Refer to Annex 2 for details of these success stories.
2.4 Challenges and lessons learnt
In Year 1, several challenges were experienced during the implementation of various components of the program.
TNS adapted its activities to accommodate for these challenges as described below.
2.4.1 Knowledge and technology transfer to food processors
Challenge: Drawn out projects/slow completion of projects often as a result of: (a) project definitions being too broad
encompassing numerous sub-projects for completion, (b) poor engagement and slow response times shown by assisted
processors, and (c) occasional lags or staggered responses from volunteer experts over a period of time. To help
address this, greater emphasis has been put on defining projects to their smallest sub-level and tracking their
performance and delivery against these shorter milestones. To increase the communication and oversight of the project
teams, both with the processor and the volunteer experts, processor leads (termed SGB Leads) have been assigned
PPB in Malawi is a good example of female
representation in management and workforce
SAFE Annual Progress Report Year 1 Page 11
from PFS for each assisted processor. These leads will maintain oversight of all PFS projects within an assisted
processor and support the processor and the volunteer teams to ensure efficiencies are met, the assignments keep
moving and the communication keep flowing.
Challenge: There have been some cases in which the adoption of new technologies and management practices by
processors is hindered because of the financial requirements to implement recommendations. Food processors
experienced challenges in implementing those new technologies and management practices that have high cost
implications. For instance, the purchase of new baking equipment (Mothers), and ISO certification (Mace Foods). To
address this TNS has continued to assist food processors with the development of business plans and in sourcing
financing. We continue to work with Root Capital and other financial institutes to identify effective ways to increase
funding options for our supported processors.
Challenge: Regardless of the technical assistance requested there is typically a common need for assistance around
quality and business needs amongst processors. Even if they are not at first identified as a need by the supported
processors, the TA very often requires improvements in one or both of these thematic areas. To facilitate in gap
analyses of these two areas, diagnostic audit tools have been designed for a company’s quality and business status.
These quick, early audits will help flush out gaps/weaknesses that may impact the TA; they may also provide insight
into future capacity strengthening projects. These tools have been designed in Year 1 and will roll out across the
program in Year 2.
2.4.2 Support in business planning and access to finance
Challenge: Registration status of processors as sole proprietorships (like Mwailu) or cooperatives (like Nyala) limit
their eligibility for credit from banks. TNS is looking into assisting with the incorporation of currently supported
processors as limited liability companies, as well as ensuring that only processors incorporated are selected going
forward.
Challenge: Commercial banks are reluctant to finance new lines of business because they are considered high risk
start-ups. As a result, lending rates to these businesses are higher than large businesses (by more than 4%). The
SAFE team continues to assist processors in preparation of investment plans to support loan applications.
Challenge: TNS sometimes encounters weak management systems at processors that are family businesses and
cooperatives. Behavior change at a business level can be quite challenging, especially when those business are run by
families and are not always incentivized by better business or technical practices.
Challenge: Unpredictable nature of processors characterized by changing ownership and interest; this often puts the
program back and requires building up new relationships. The SAFE team has put in place stringent vetting criteria for
use in the selection of new SGBs. We are also undertaking a semi-annual SGB evaluation to assess levels of
commitment to partnership and technical assistance.
Challenge: In Malawi, high lending rates (averaged at 40%) have made the cost of credit financing very high. As a
result, businesses have opted for external financing, which is equally challenging because of strict assessment criteria,
such as a high minimum borrowing threshold ($1m for IFC). The SAFE team continues to assist processors explore
external financing options.
Challenge: In Malawi, processors were not willing to disclose their financial records to facilitate preparation of
realistic business plans and loan applications. Even when they open up, they provide old financial statements.
Unfortunately, TNS is only able to offer business planning support to processors that demonstrate a commitment to
disclose their financial statements. A company’s willingness to disclose necessary data will be made prior to the
selection of any new processors for support.
Challenge: Slow pull from processors for support in business planning. Some processors do not prioritize business
planning as a capacity building need. They tend to give more emphasis to tangible technological areas like
production, packaging and quality. To help processors understand the importance of business planning, TNS has
begun conducting financial needs assessments and using the SWT forum to provide training to processors on the
importance of business planning.
SAFE Annual Progress Report Year 1 Page 12
2.4.3 Sector-wide trainings
Challenge: Low female representation in SWTs. The total average female participation in SWTs was 26%, which is
below our target of 40%. Female representation was low in technical trainings because there are fewer females in
technical fields. To address this, preference is given to female applicants and supported processors are proactively
encouraged to nominate female employees to attend SWTs. Furthermore, a gender audit of three processors (Rab,
PPB and Mothers) was conducted in Malawi. This will be rolled out to all the countries in Year 2.
Challenge: It is not feasibly practical to follow up on adoption (of management practices and technologies) with all
the companies who attend SWTs. To better determine the level of education derived from such trainings, the program
has been working on pre and post training assessments. This will help determine the degree of improved knowledge
and the degree to which the training was understood. We plan to roll out these assessments during Year 2’s trainings.
Challenge: Oversubscription to SWTs in Malawi. Business strategy and access to finance training was oversubscribed
in Malawi. Ninety people expressed interest to attend the training, but there were only 50 slots available. In Year 2 of
the program, more SWTs will be on offer and similar trainings will be offered in different regions of the country.

SAFE Annual Progress Report Year 1 Page 13
Annexes
Annex 1: List of abbreviations
AAIFP African Alliance for Improved Food Processing
CSB Corn Soy Blend
CSO Civil Society Organization
GHI Global Health Initiative
FtF Feed the Future
GAIN Global Alliance for Improved Nutrition
Mt Metric Tons
M&E Monitoring and Evaluation
MIIF Market Improvement Innovation Fund
PEPFAR President’s Emergency Plan for Aids Relief
PFS Partners in Food Solution
PPB Project Peanut Butter
RUTF Ready for Use Therapeutic Foods
SGB Small and Growing Business
SAFE Solutions for African Food Enterprises
SWT Sector Wide Training
TA Technical Assistance
TNS TechnoServe
UNICEF United Nations Children Education Fund
USG United States Government
USAID United States Agency for International Development
SAFE Annual Progress Report Year 1 Page 14
Annex 2: Success stories
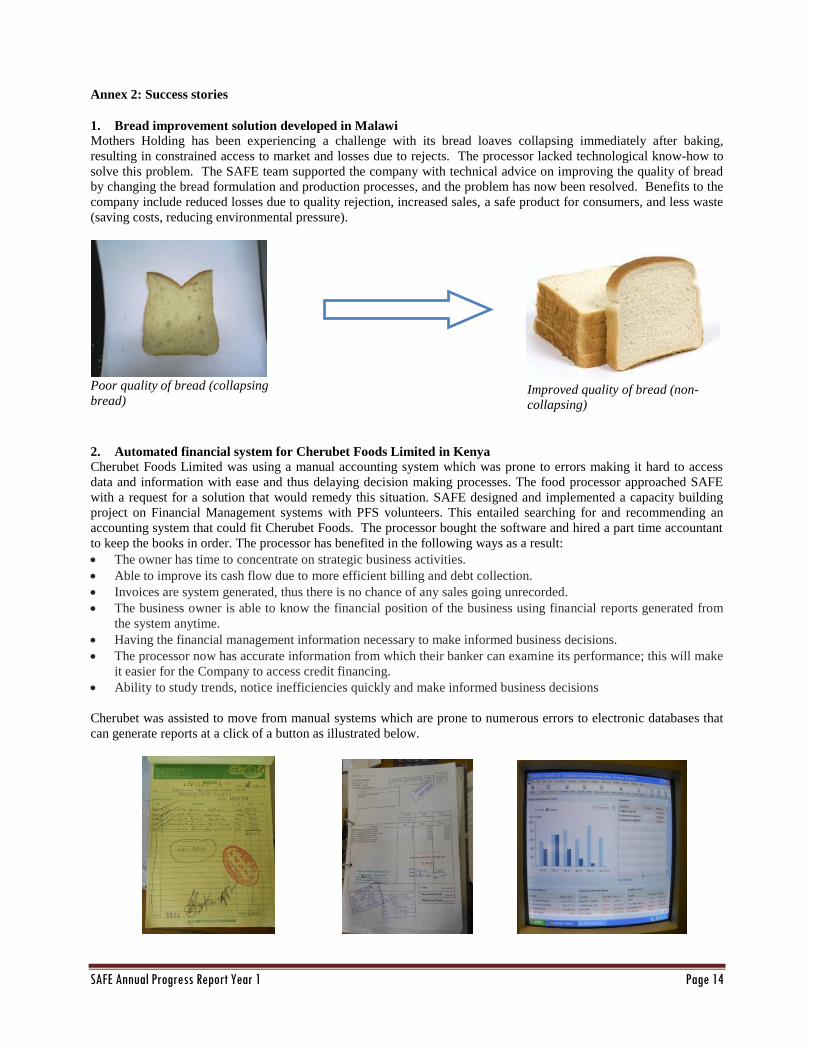
1. Bread improvement solution developed in Malawi
Mothers Holding has been experiencing a challenge with its bread loaves collapsing immediately after baking,
resulting in constrained access to market and losses due to rejects. The processor lacked technological know-how to
solve this problem. The SAFE team supported the company with technical advice on improving the quality of bread
by changing the bread formulation and production processes, and the problem has now been resolved. Benefits to the
company include reduced losses due to quality rejection, increased sales, a safe product for consumers, and less waste
(saving costs, reducing environmental pressure).
Poor quality of bread (collapsing
bread)
Improved quality of bread (non-
collapsing)
2. Automated financial system for Cherubet Foods Limited in Kenya
Cherubet Foods Limited was using a manual accounting system which was prone to errors making it hard to access
data and information with ease and thus delaying decision making processes. The food processor approached SAFE
with a request for a solution that would remedy this situation. SAFE designed and implemented a capacity building
project on Financial Management systems with PFS volunteers. This entailed searching for and recommending an
accounting system that could fit Cherubet Foods. The processor bought the software and hired a part time accountant
to keep the books in order. The processor has benefited in the following ways as a result:
The owner has time to concentrate on strategic business activities.
Able to improve its cash flow due to more efficient billing and debt collection.
Invoices are system generated, thus there is no chance of any sales going unrecorded.
The business owner is able to know the financial position of the business using financial reports generated from
the system anytime.
Having the financial management information necessary to make informed business decisions.
The processor now has accurate information from which their banker can examine its performance; this will make
it easier for the Company to access credit financing.
Ability to study trends, notice inefficiencies quickly and make informed business decisions
Cherubet was assisted to move from manual systems which are prone to numerous errors to electronic databases that
can generate reports at a click of a button as illustrated below.

SAFE Annual Progress Report Year 1 Page 15
3. Drawings and designs for a new factory for Project Peanut Butter in Malawi
PPB was asked to vacate its rented premises by the landlord. PPB had to either rent or build its own factory to be
ready within limited time. PPB requested technical assistance in construction of a new factory. TNS together with PFS
mobilized a team of volunteer experts who assisted in the preparation of designs and drawings of a new factory. The
new factory is currently under construction and has so far employed 150 people (90 women) and is contributing to
rural incomes by sourcing building materials (bricks, sand, quarry stones) from rural communities.
New factory under construction based on the designs and drawings of SAFE.
4. Development of a new RUTF for pregnant women in Malawi
PPB wanted to introduce a new RUTF for pregnant women in Malawi. The processor requested assistance from SAFE
in development of the new RUTF product. The SAFE team mobilized a team of expert volunteers who formulated
ingredients for this RUTF product, developed a micronutrient premix for RUTF for pregnant women, and assessed
viability of the product. The new RUTF for pregnant women has received funding from the USAID Feed the Future
through its Integrating Nutrition in Value Chains program in Malawi. This program will fund large scale clinical trials
(to be conducted in November and December of 2013) and commercialization of the new RUTF product, which will
be implemented in collaboration with PFS and University of California Polytechnic.
Manual Invoice with high chances of arithmetic errors,not sequentially numbered and hard to trace
A system generated invoice sequencially numbered,reflecting in total sales automatically,more presentable to customers with zero chances of arithmetic error. Able to pick from customers LPO.
A snapshot of the company finances on screen making it easy to know the company’s financial position and system generated financial statements

SAFE Annual Progress Report Year 1 Page 16
Annex 3: Country level profile of assisted food processors
Profiles of assisted food processors in Kenya Company & Products Ownership Profile Projects
1 Soy Afric CSB and blended flours. Annual turnover: $3m
Male Established in 1993, located in Nairobi, 47 employees, markets food aid and retail, supports about 8,000 small holder farmers.
1 Move CSB line to new premises(Complete)
2 Formulation of vitamin and mineral premix or sachets (Complete).
3 Product improvement (bora bora) (Complete).
4 SWOT analysis (Complete) 5 Peanut butter processing 6 RUTF processing. 7 Product promotion plan 8 Brand design(Complete)
2 Mwailu Enterprises Mill flours. Annual turnover: $0.1m
Male Established in 1981, Located in Makindu, Eastern Province, 15 employees, and supports small holder farmers, leverages other USAID support for grain aggregation, supports over 2,000 small holder farmers.
9 Design grain milling plant. 10 Put quality management system
in place. 11 Branding and packaging design.
3 Mace Foods Vegetable processing. Annual turnover: $0.16m
Female Established in 2002, Located in Eldoret, 78 employees, Rift valley, large support to small holders, retail market, supports 4,900 small holder farmers.
12 Implement ISO22000 (Complete).
4 Cherubet Foods Vegetable processing. Annual turnover: $0.1m
Female Established in 2007, Located in Nairobi, 10 employees, prepare cooked ready-to-eat beans to local retail market, supports 200 small holder farmers.
13 Process improvement (Complete).
14 Finance management system (Complete).
5 Sunripe Fruit processing. Annual turnover: $20m
Male Established in 1976,87 employees, source 90% from smallholders, produces pre-packed fresh fruits and vegetables, markets are both local and export, supports 2,000 small holder farmers.
15 Design process for baby food production.
16 Carry out a feasibility study for new products
17 Put together business strategy for value added products.
6 Nyala Dairy processing, Animal feed processing. Annual turnover: $6m
Mixed (cooperative)
Established in 2002 ,50 employees, source 100% from smallholders, collects milk from smallholder farmers for bulking and chilling before supplying to larger dairies and processing some value added products such as yoghurt, , supports 9,000 small holder farmers.
18 Establish a quality system for chilled milk.
19 Put together a business plan for animal feeds.
7 Deepa Potatoes, bananas, nuts and spices. Annual turnover: $8m
Male Established in 1974 ,230 employees, source 50% from smallholders, produces snacks from bananas, potatoes, peanuts as well as spices, supports 500 small holder farmers.
20 Set up a potato cold storage facility.
21 Upgrade their current laboratory.
8 Bomet Maize flour
Female Established in 2009, will source 100% from smallholders, will produced maize flour, will supports over 3,000 small holder farmers.
22 Business plan. 23 Financial linkage.
9 Incas (In graduation phase). CSB and blended flour. Annual turnover: $0.5m
Female Established in 2005, Female owned, 22 employees, located in Nairobi, markets food aid and retail, supports about 900 small holder farmers.
24 Business strategy (Complete).
SAFE Annual Progress Report Year 1 Page 17
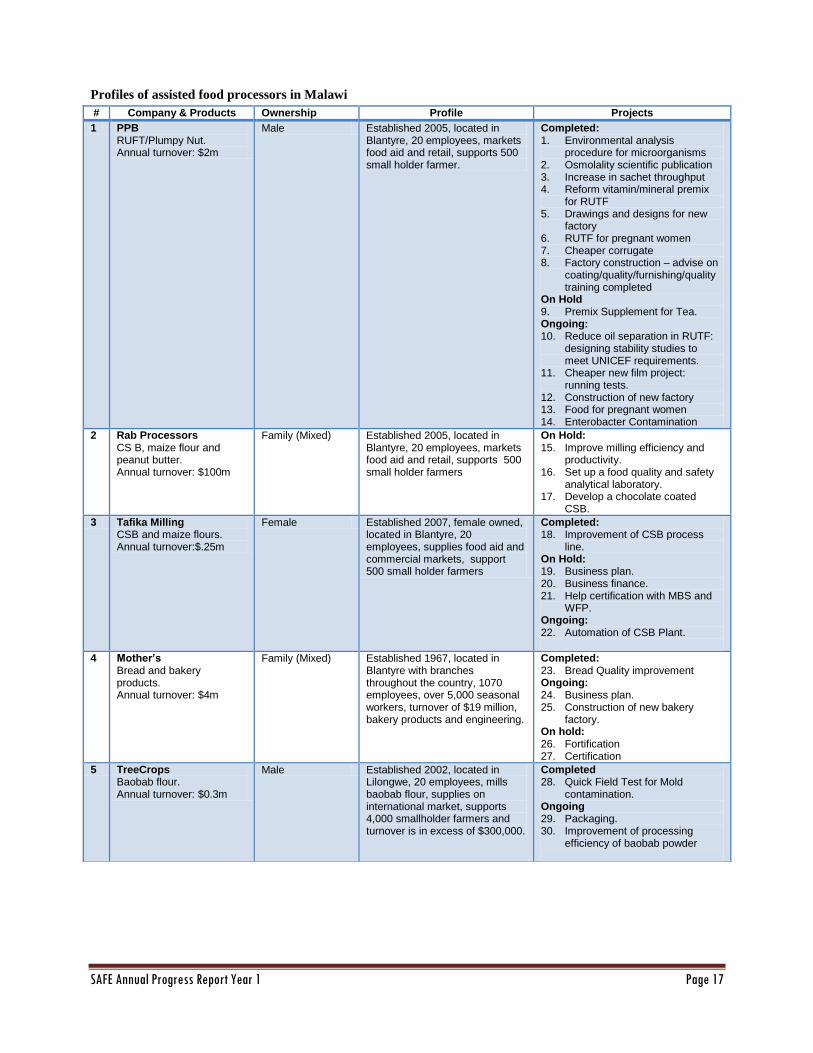
Profiles of assisted food processors in Malawi
# Company & Products Ownership Profile Projects
1 PPB RUFT/Plumpy Nut. Annual turnover: $2m
Male Established 2005, located in Blantyre, 20 employees, markets food aid and retail, supports 500 small holder farmer.
Completed: 1. Environmental analysis
procedure for microorganisms 2. Osmolality scientific publication 3. Increase in sachet throughput 4. Reform vitamin/mineral premix
for RUTF 5. Drawings and designs for new
factory 6. RUTF for pregnant women 7. Cheaper corrugate 8. Factory construction – advise on
coating/quality/furnishing/quality training completed
On Hold 9. Premix Supplement for Tea. Ongoing: 10. Reduce oil separation in RUTF:
designing stability studies to meet UNICEF requirements.
11. Cheaper new film project: running tests.
12. Construction of new factory 13. Food for pregnant women 14. Enterobacter Contamination
2 Rab Processors CS B, maize flour and peanut butter. Annual turnover: $100m
Family (Mixed) Established 2005, located in Blantyre, 20 employees, markets food aid and retail, supports 500 small holder farmers
On Hold: 15. Improve milling efficiency and
productivity. 16. Set up a food quality and safety
analytical laboratory. 17. Develop a chocolate coated
CSB.
3 Tafika Milling CSB and maize flours. Annual turnover:$.25m
Female Established 2007, female owned, located in Blantyre, 20 employees, supplies food aid and commercial markets, support 500 small holder farmers
Completed: 18. Improvement of CSB process
line. On Hold: 19. Business plan. 20. Business finance. 21. Help certification with MBS and
WFP. Ongoing: 22. Automation of CSB Plant.
4 Mother’s Bread and bakery products. Annual turnover: $4m
Family (Mixed) Established 1967, located in Blantyre with branches throughout the country, 1070 employees, over 5,000 seasonal workers, turnover of $19 million, bakery products and engineering.
Completed: 23. Bread Quality improvement Ongoing: 24. Business plan. 25. Construction of new bakery
factory. On hold: 26. Fortification 27. Certification
5 TreeCrops Baobab flour. Annual turnover: $0.3m
Male Established 2002, located in Lilongwe, 20 employees, mills baobab flour, supplies on international market, supports 4,000 smallholder farmers and turnover is in excess of $300,000.
Completed 28. Quick Field Test for Mold
contamination. Ongoing 29. Packaging. 30. Improvement of processing
efficiency of baobab powder
SAFE Annual Progress Report Year 1 Page 18
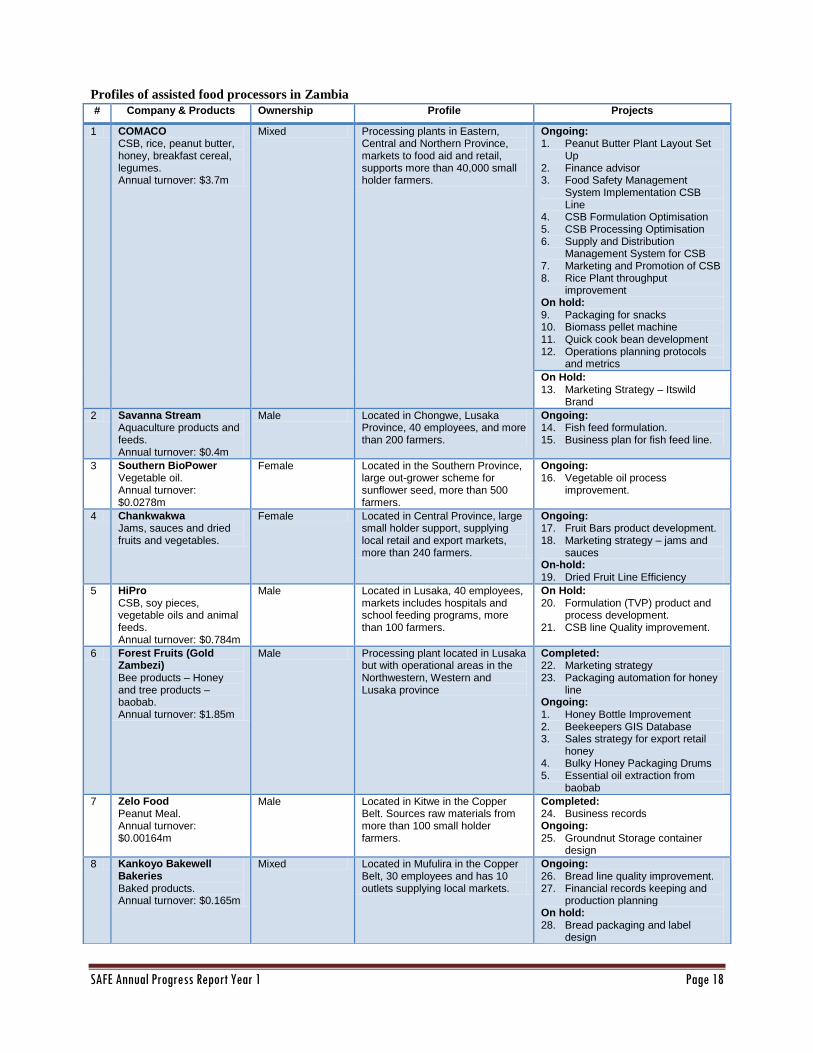
Profiles of assisted food processors in Zambia
# Company & Products Ownership Profile Projects
1 COMACO CSB, rice, peanut butter, honey, breakfast cereal, legumes. Annual turnover: $3.7m
Mixed Processing plants in Eastern, Central and Northern Province, markets to food aid and retail, supports more than 40,000 small holder farmers.
Ongoing: 1. Peanut Butter Plant Layout Set
Up 2. Finance advisor 3. Food Safety Management
System Implementation CSB Line
4. CSB Formulation Optimisation 5. CSB Processing Optimisation 6. Supply and Distribution
Management System for CSB 7. Marketing and Promotion of CSB 8. Rice Plant throughput
improvement On hold: 9. Packaging for snacks 10. Biomass pellet machine 11. Quick cook bean development 12. Operations planning protocols
and metrics
On Hold: 13. Marketing Strategy – Itswild
Brand
2 Savanna Stream Aquaculture products and feeds. Annual turnover: $0.4m
Male Located in Chongwe, Lusaka Province, 40 employees, and more than 200 farmers.
Ongoing: 14. Fish feed formulation. 15. Business plan for fish feed line.
3 Southern BioPower Vegetable oil. Annual turnover: $0.0278m
Female Located in the Southern Province, large out-grower scheme for sunflower seed, more than 500 farmers.
Ongoing: 16. Vegetable oil process
improvement.
4 Chankwakwa Jams, sauces and dried fruits and vegetables.
Female Located in Central Province, large small holder support, supplying local retail and export markets, more than 240 farmers.
Ongoing: 17. Fruit Bars product development. 18. Marketing strategy – jams and
sauces On-hold: 19. Dried Fruit Line Efficiency
5 HiPro CSB, soy pieces, vegetable oils and animal feeds. Annual turnover: $0.784m
Male Located in Lusaka, 40 employees, markets includes hospitals and school feeding programs, more than 100 farmers.
On Hold: 20. Formulation (TVP) product and
process development. 21. CSB line Quality improvement.
6 Forest Fruits (Gold Zambezi) Bee products – Honey and tree products – baobab. Annual turnover: $1.85m
Male Processing plant located in Lusaka but with operational areas in the Northwestern, Western and Lusaka province
Completed: 22. Marketing strategy 23. Packaging automation for honey
line Ongoing: 1. Honey Bottle Improvement 2. Beekeepers GIS Database 3. Sales strategy for export retail
honey 4. Bulky Honey Packaging Drums 5. Essential oil extraction from
baobab
7 Zelo Food Peanut Meal. Annual turnover: $0.00164m
Male Located in Kitwe in the Copper Belt. Sources raw materials from more than 100 small holder farmers.
Completed: 24. Business records Ongoing: 25. Groundnut Storage container
design
8 Kankoyo Bakewell Bakeries Baked products. Annual turnover: $0.165m
Mixed Located in Mufulira in the Copper Belt, 30 employees and has 10 outlets supplying local markets.
Ongoing: 26. Bread line quality improvement. 27. Financial records keeping and
production planning On hold: 28. Bread packaging and label
design

SAFE Annual Progress Report Year 1 Page 19
Annex 4: List of new technologies and management practices made available to assisted food processors Country Food processor New technology and management practice made available
Kenya
Cherubet 1. Financial Management System 2. Process improvement
Nyala 3. Good Manufacturing Practices
Soy Afric 4. Product improvement (Bora bora) 5. RUTF butter processing 6. Formulation of Vitamin and mineral premixes (sachets)
Mace food 7. ISO 22000 certification.
Malawi PPB
8. Designs and drawings for new factory 9. Sachet throughput 10. Vitamin and mineral premix for RUTF 11. Cheaper corrugate 12. Enterobacter root analysis from suppliers to factory 13. Cheaper new sachet film packaging for RUTF
TreeCrops 14. Rapid field test for moulds
Zambia
COMACO
15. Food Safety Management System 16. Tumbler/coating drum for flavouring snacks 17. Peanut Butter Plant Layout Set Up 18. Food Safety Management System Implementation CSB Line 19. CSB Formulation Optimisation 20. CSB Processing Optimisation 21. Supply and Distribution Management System for CSB 22. Rice Plant throughput improvement
BioPower 23. Vegetable oil process improvement.
HiPro 24. Formulation (TVP) product and process development. 25. CSB line Quality improvement.
Forest Fruits 26. Honey Bottle Improvement 27. Bulky Honey Packaging Drums
Zelo 28. Groundnut Storage container design
Kankoyo 29. Bread line quality improvement 30. Fish feed formulation
Savanna 31. Financial Management System
Annex 5: List of food processors adopting new technologies and management practices Country Food processor New technology and management practices applied
Kenya
Cherubet 1. Financial Management System 2. Process improvement
Nyala 3. Good Manufacturing Practices
Soy Afric 4. Product improvement (Bora bora)
Malawi PPB
5. Designs and drawings for new factory 6. Sachet throughput 7. Vitamin and mineral premix for RUTF 8. Cheaper corrugate 9. Enterobacter root analysis from suppliers to factory
TreeCrops 10. Rapid field test for moulds
Zambia
COMACO 11. Food safety systems 12. Tumbler/coating drum for flavouring snacks
Kankoyo 13. Financial Management System 14. Fish feed formulation
9 Sylva Food Solutions Dried vegetable, soups and porridges. Annual turnover: $1.7m
Female Located in Lusaka but sourcing raw materials from all the provinces of Zambia and supports more than 10,000 small holder farms.
Ongoing: 29. Dry soup reformulation 30. Dried soup plant layout 31. Marketing strategy for dried
Vegetable and soup
10 Lumuno Chilli Sauces. Annual turnover: $0.115m
Mixed Located in Chongwe of the Lusaka province. Runs an out-grower scheme with more than 150 farmers and supplies to local retail markets.
Ongoing: 32. Chilli Sauce reformulation 33. Formulation improvement for
sauces line On hold: 34. Quality management
improvement for sauces line
SAFE Annual Progress Report Year 1 Page 20
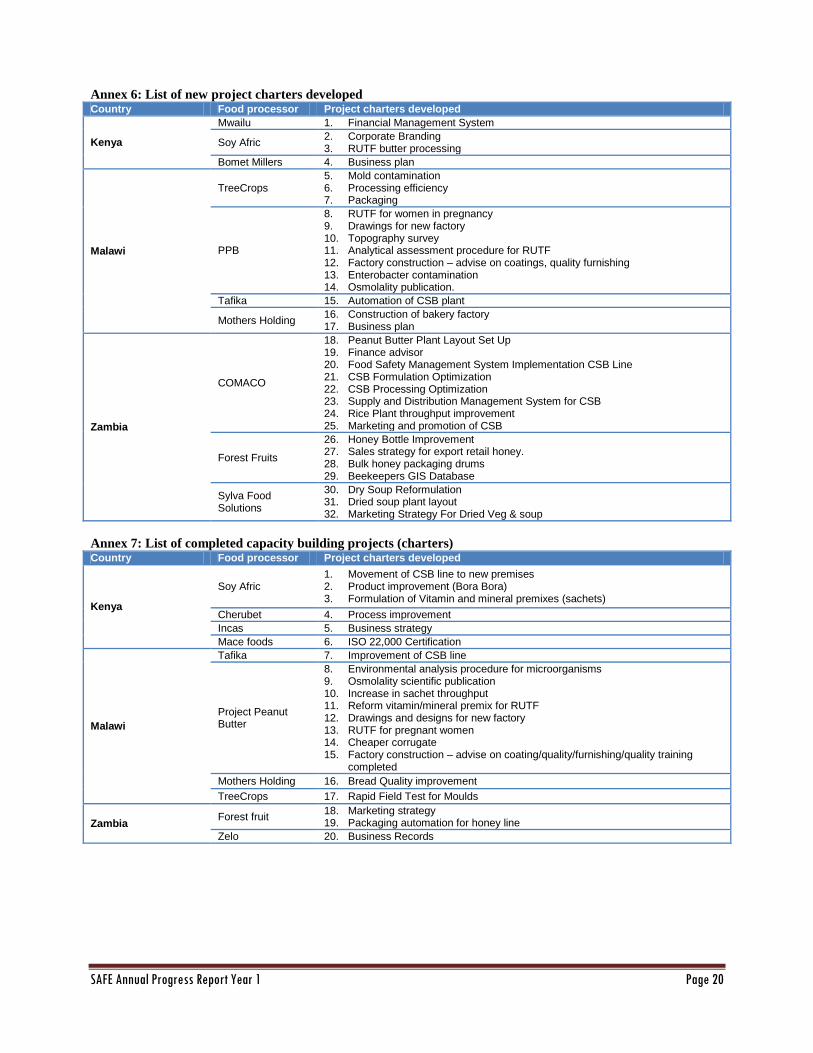
Annex 6: List of new project charters developed Country Food processor Project charters developed
Kenya
Mwailu 1. Financial Management System
Soy Afric 2. Corporate Branding 3. RUTF butter processing
Bomet Millers 4. Business plan
Malawi
TreeCrops 5. Mold contamination 6. Processing efficiency 7. Packaging
PPB
8. RUTF for women in pregnancy 9. Drawings for new factory 10. Topography survey 11. Analytical assessment procedure for RUTF 12. Factory construction – advise on coatings, quality furnishing 13. Enterobacter contamination 14. Osmolality publication.
Tafika 15. Automation of CSB plant
Mothers Holding 16. Construction of bakery factory 17. Business plan
Zambia
COMACO
18. Peanut Butter Plant Layout Set Up 19. Finance advisor 20. Food Safety Management System Implementation CSB Line 21. CSB Formulation Optimization 22. CSB Processing Optimization 23. Supply and Distribution Management System for CSB 24. Rice Plant throughput improvement 25. Marketing and promotion of CSB
Forest Fruits
26. Honey Bottle Improvement 27. Sales strategy for export retail honey. 28. Bulk honey packaging drums 29. Beekeepers GIS Database
Sylva Food Solutions
30. Dry Soup Reformulation 31. Dried soup plant layout 32. Marketing Strategy For Dried Veg & soup
Annex 7: List of completed capacity building projects (charters) Country Food processor Project charters developed
Kenya
Soy Afric 1. Movement of CSB line to new premises 2. Product improvement (Bora Bora) 3. Formulation of Vitamin and mineral premixes (sachets)
Cherubet 4. Process improvement
Incas 5. Business strategy
Mace foods 6. ISO 22,000 Certification
Malawi
Tafika 7. Improvement of CSB line
Project Peanut Butter
8. Environmental analysis procedure for microorganisms 9. Osmolality scientific publication 10. Increase in sachet throughput 11. Reform vitamin/mineral premix for RUTF 12. Drawings and designs for new factory 13. RUTF for pregnant women 14. Cheaper corrugate 15. Factory construction – advise on coating/quality/furnishing/quality training
completed
Mothers Holding 16. Bread Quality improvement
TreeCrops 17. Rapid Field Test for Moulds
Zambia Forest fruit
18. Marketing strategy 19. Packaging automation for honey line
Zelo 20. Business Records
SAFE Annual Progress Report Year 1 Page 21
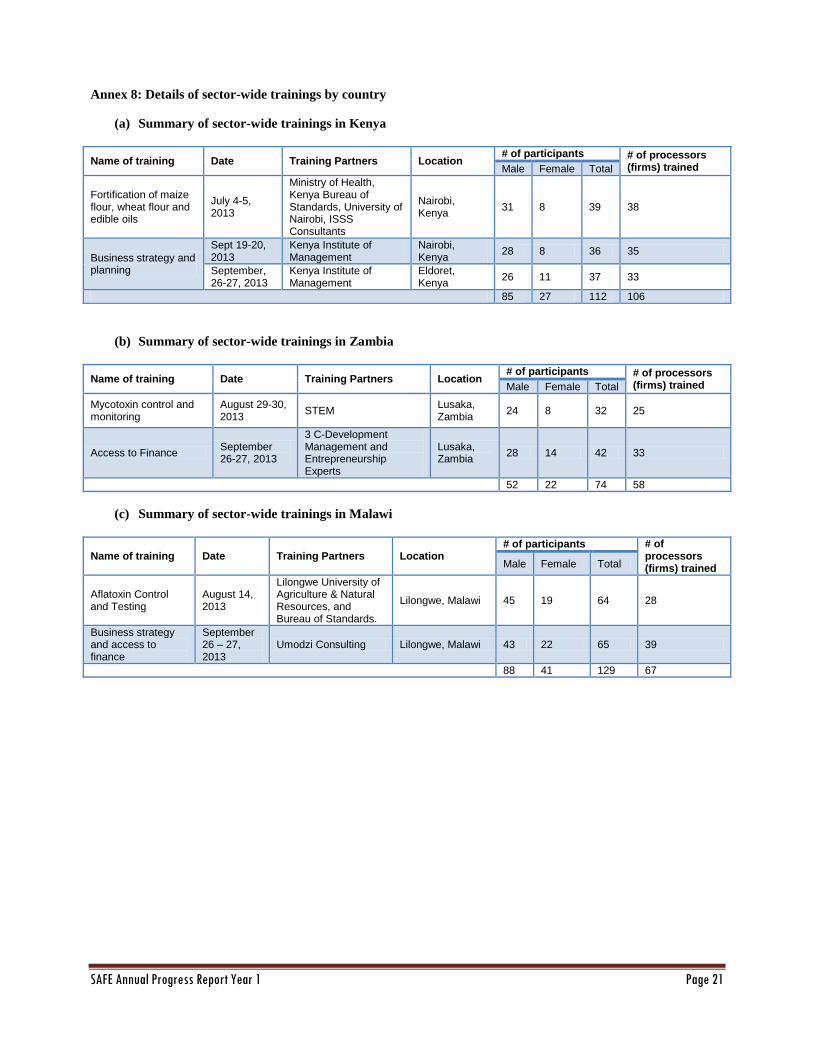
Annex 8: Details of sector-wide trainings by country
(a) Summary of sector-wide trainings in Kenya
Name of training Date Training Partners Location # of participants # of processors
(firms) trained Male Female Total
Fortification of maize flour, wheat flour and edible oils
July 4-5, 2013
Ministry of Health, Kenya Bureau of Standards, University of Nairobi, ISSS Consultants
Nairobi, Kenya
31 8 39 38
Business strategy and planning
Sept 19-20, 2013
Kenya Institute of Management
Nairobi, Kenya
28 8 36 35
September, 26-27, 2013
Kenya Institute of Management
Eldoret, Kenya
26 11 37 33
85 27 112 106
(b) Summary of sector-wide trainings in Zambia
Name of training Date Training Partners Location # of participants # of processors
(firms) trained Male Female Total
Mycotoxin control and monitoring
August 29-30, 2013
STEM Lusaka, Zambia
24 8 32 25
Access to Finance September 26-27, 2013
3 C-Development Management and Entrepreneurship Experts
Lusaka, Zambia
28 14 42 33
52 22 74 58
(c) Summary of sector-wide trainings in Malawi
Name of training Date Training Partners Location # of participants # of
processors (firms) trained Male Female Total
Aflatoxin Control and Testing
August 14, 2013
Lilongwe University of Agriculture & Natural Resources, and Bureau of Standards.
Lilongwe, Malawi 45 19 64 28
Business strategy and access to finance
September 26 – 27, 2013
Umodzi Consulting Lilongwe, Malawi 43 22 65 39
88 41 129 67