Embed Size (px)
Citation preview

FMC Technologies Inc
1803 Gears Road
Houston TX 77067
281 591 4000
fmctechnologies.com
Solutions
forour
customers’toughest
challengesPeople
TechnologyG
rowth
FMCTech
nologies
2009AnnualReport
People Technology Growth
2009 Annual Report
FMC Technologies is a pioneer in the
development of technologically sophisticated
systems and services for the oil and gas industry.
We hold leading positions in all markets we
serve, delivering the highest level of quality,
integrity and reliability to our customers.
Our subsea industry leadership position was
strengthened in 2009 with the receipt of a $90
million contract to support Petrobras’ Marlim
field. The development of Marlim began in 1985.
It is Brazil’s largest offshore field in the
northeastern Santos Basin, covering 50 square
miles (130 km2). Today, FMC is designing and
manufacturing innovative technologies to enable
Petrobras to achieve its goal of maximizing
production and recovery rates at this mature
field. This includes delivery of a separation and
sand management system that will utilize a novel
pipe separator design, licensed and developed by
FMC Technologies in cooperation with Statoil.
Marlim is the sixth subsea processing
project awarded to FMC Technologies since 2005
and it will achieve a number of milestones for
both FMC and the oil and gas industry, including
the first:
• deepwater deployment of a subsea
separation system in a mature field
• separation of heavy oil and water in a
subsea environment, and
• reinjection of water into a subsea reservoir
to boost production
At FMC Technologies, we understand our
customers’ businesses and we design solutions to
solve their most difficult operational challenges,
allowing us to put our customers first and keep
them ahead.
Corporate Office
FMC Technologies, Inc.
1803 Gears Road
Houston, TX 77067
281 591 4000
Investor Relations
Investor Relations may be contacted at the
following address:
FMC Technologies, Inc.
Investor Relations
Robert K. Cherry
1803 Gears Road
Houston, TX 77067
281 591 4560
ir.fmctechnologies.com
Stock Exchange
FMC Technologies is listed on the
New York Stock Exchange under
the symbol FTI.
Annual Meeting
The Annual Meeting of Stockholders will be held at
11:00 a.m. on Friday, May 7, 2010 at:
The Woodlands Waterway Marriott Hotel
1601 Lake Robbins Drive
The Woodlands, TX 77380
Notice of the meeting, together with proxy
materials, will be mailed to stockholders in
advance of the meeting.
Stock Transfer Agent
Address stockholder inquiries, including requests
for stock transfers, to:
Wells Fargo Bank, N. A.
161 N. Concord Exchange
South St. Paul, MN 55075-1139
Phone: 800-468-97166 or 651-450-4064
Fax: 651-450-4033
wellsfargo.com/com/shareowner_services
Form 10-K
A copy of the Company’s 2009 Annual Report on
Form 10-K, as filed with the U.S. Securities and
Exchange Commission, is available at
fmctechnologies.com or upon
written request to:
FMC Technologies, Inc.
Corporate Communications
1803 Gears Road
Houston,TX 77067
However, certain information required under Parts
II and III of the Company’s 2009 Annual Report on
Form 10-K have been incorporated by reference
from the Company’s Proxy Statement for its 2010
Annual Meeting of Shareholders.
Certifications required by Section 302 of the
Sarbanes-Oxley Act of 2002, as amended, are
attached as Exhibits to the Company’s 2009
Annual Report on Form 10-K. FMC Technologies’
CEO timely submitted the CEO Annual
Certification required by Section 303A.12(a) of the
New York Stock Exchange Listed Company Manual
in 2009 to the New York Stock Exchange.
FMC Technologies was incorporated in
Delaware in 2000.
Auditors
KPMG LLP
Houston ,TX 77067

1Annual Report 2009
(In millions, except per share and common stock data)
Financial Highlights
Contents
Letter to Shareholders .....................................................................................12
Business Review
Energy Production Systems .................................................................16
Energy Processing Systems..................................................................14
Board of Directors and Officers.....................................................................18
Financial Results Summary.............................................................................19
Form 10-K ...........................................................................................................20
Total Revenue $ 4,405.4 $ 4,550.9
Income from Continuing Operations $ 361.3 $ 352.9
Diluted EPS
GAAP - Continuing Operations $ 2.87 $ 2.72
Common Stock Closing Price Range $ 23.79 - 58.84 $ 20.34 - 80.86
Net Cash (Debt) $ 40.6 $ (154.9)
Order Backlog $ 2,545.4 $ 3,651.2
Number of Employees 10,400 9,800
Segment Revenue
Energy Production Systems $ 3,721.9 84% $ 3,670.7 81%
Energy Processing Systems $ 698.4 16% $ 883.2 19%
Eliminations $ (14.9) 0% $ (3.0) 0%
Total $ 4,405.4 $ 4,550.9
Energy Production Systems
Subsea Systems
Separation Systems
Surface Wellhead
Multi Phase Meters
Energy Processing Systems
Fluid Control
Measurement Solutions
Loading Systems
Material Handling Solutions
Blending and Transfer Systems
Direct Drive Systems
Our Businesses
2009 2008
FMC Technologies, Inc. (NYSE: FTI) is a diversified, global corporation and a leader within the oil and gas equipment and
services industry. We design, manufacture and service innovative technologies and unique solutions that allow our customers
to succeed in solving their most difficult business challenges. FMC Technologies maintains a persistent focus on health, safety
and the environment, and our 25 production facilities in 15 countries are committed to the communities in which they operate.
Our industry experience, management depth, high ethical standards, strong customer relationships and global presence provide
the foundation for our strong performance.
Team members celebrate the completion and shipment of
manifolds for the Jubilee project (see page 10).

2 FMC Technologies, Inc.
Letter to Shareholders
FMC Technologies had a solid year in 2009, successfully managing our businesses and
executing our strategies to support the long-term growth of the company. Revenue decreased
slightly, from $4.6 billion to $4.4 billion during the year, while earnings per share from
continuing operations were $2.87, an increase of 6 percent compared to last year.
Our continued strong performance in an uncertain global economy was due to a number of
factors, primarily a large backlog of projects in our subsea business and international successes
in surface wellhead. These events were partly offset by weakness in our Energy Processing
Systems businesses. Long-standing customer relationships, efforts to maximize supply chain
efficiencies and an added focus on project execution by our 10,400 employees also contributed
to the record performance in 2009. In addition, we continued to invest in developing
technologies that we believe will add value to our customers. All of these factors resulted in
FMC’s share price outperforming the oil service index (OSX) in what was perhaps the most
difficult operating environment in our history as a public company, given the significant
decline in North American drilling activity.
We completed our first full year operating as a 100 percent energy-focused company in 2009.
As a result, Energy Production Systems has grown to now represent 84 percent of overall sales,
recording $3.7 billion in revenue during the year. Energy Processing Systems contributed the
remaining 16 percent of sales, generating $698.4 million in revenue. At the end of the year,
total company backlog was $2.5 billion, including $2.0 billion in subsea backlog, and total
operating profit increased 6 percent to a record $618.5 million.
We are the company that providessolutions for our customers’toughest challenges.
Total Shareholder Return
0
50
100
150
200
250
300
350
%
400
12-31-04
FMC Technologies, Inc.
PHLX Oil Sector (OSX)
S&P 500 Index
12-31-05 12-31-06 12-31-07 12-31-08 12-31-09

3Annual Report 2009
Today, our customers work hard to discover new reserves that can replace the oil and gas that they
produce each year, and their ability to maintain current production levels remains challenging.
This has resulted in oil and gas companies exploring in harsh and remote deepwater environments
in search of new reserves. It also has led to a strong emphasis on solutions and designs that can
increase production and extend the lives of existing fields. Our customers require systems and
technologies that will provide increased oil recovery, enable deepwater developments and reduce
the overall costs to produce oil and gas fields. FMC has been able to meet these needs due to our
historical investments in technology, placing us in the leadership position within the subsea market.
As the global economy weakened, world oil consumption declined for the first time in nearly three
decades. This decline began in the second half of 2008 and continued into 2009. Facing the lower
demand, declining prices for oil and natural gas and a tightening credit market, many operators
trimmed their capital spending plans. Numerous projects planned for the year were delayed as oil
companies turned their focus toward maximizing the production levels and recovery rates of their
existing developments. FMC supported these efforts by providing customers with new technologies
such as Light Well Intervention (LWI) and Through Tubing Rotary Drilling (TTRD), emerging
solutions that cost-effectively extend the life of their fields and increase production.
Our goal is to continually focus on adding value to our oil and gas customers through the
development of strong relationships and the most talented workforce in the industry. That goal
also includes a commitment to a heightened level of safety, quality and equipment integrity,
while investing in the future by designing the industry’s most reliable, innovative and effective
technology solutions to address the needs of our customers.
FMC Technologies accepts our
responsibility to protect the
environment and the health
and safety of our employees,
their families and the public.
HSE – or health, safety and
the environment - is a core
value of the corporation. It is
managed as an integral part
of our business to benefit
employees, customers,
neighbors and shareholders.
All of our employees take an
active role in ensuring that we
achieve continuous and
measurable improvement in
our HSE performance.
(For HSE metrics, the lower
the number, the better the
performance.) FMC
completed 2009 with a total
recordable incident rate of
0.55 days per 200,000 hours
worked, outperforming the
industry average and
improving upon our prior-
year performance. We also
recorded 0.08 lost workday
incidents per 200,000 hours
worked, our second best
performance in our history.
HSE Performance
Recordable & Lost Workday Incident Rates
Rate = Incidents x 200,000
Exposure Hours
0
0.25
0.50
0.75
1.00
0.140.17
0.100.06 0.08
0.19
0.80
0.62
0.530.57 0.55
0.60
FMC Technologies
Recordable Incidents
Lost Workday Incidents
Best-in-ClassService
Companies
2005 2006 2007 2008 2009 2009
Pazflor team members celebrate the final stack-up of the first of three subsea separation units. The project progressed on
schedule in 2009 and the system is currently undergoing system integration testing in Norway.

4 FMC Technologies, Inc.
Letter to Shareholders
The introduction of Subsea OnDemandTM, a program designed to bring subsea developments
online quickly through the delivery of standardized equipment and services, is one example
of meeting customer needs. Subsea OnDemand minimizes delivery windows and lead times
for operators, characteristics that were vital components in receiving the $210 million Jubilee
award from the Integrated Project Team of Kosmos Energy, Anadarko Petroleum and Tullow
Oil and Gas. Installation of equipment has already begun at Jubilee, a deepwater development
located offshore Ghana in West Africa, and first oil is expected to occur by late 2010.
Another significant award in 2009 was the Petrobras Marlim project. Valued at $90 million,
Marlim is the sixth subsea processing contract awarded to FMC in the last five years. Our
increased oil recovery systems and other technologies, including separation and sand
management systems, will support Petrobras’ focus on revitalizing Marlim, a field with over
100 subsea wells, and other mature fields offshore Brazil.
Additional awards announced during the year included Statoil’s Gullfaks field in the North Sea
and Eni’s Kitan development located in the Timor Sea. FMC was also selected to provide
surface wellheads and trees for Statoil’s Peregrino deepwater platform development that will
produce to a floating production, storage and offloading unit in the Campos Basin offshore
Brazil.
Several of our energy businesses were impacted by the dramatic decline in rig counts.
In the United States, the land-based rig count, which had peaked in 2008, fell by more than
50 percent during 2009. By focusing on cost containment efforts, efficiency improvements and
low-cost sourcing of raw materials, those businesses remained competitive despite the eroding
market conditions, even recording sequential quarterly improvements in orders during the final
quarter of 2009.
Development of new technology solutions is the key to supporting customers and ensuring
future energy supplies. We do this by investing internally in the technologies our customers
need as well as through acquisitions.
FMC’s ability to identify, acquire and integrate companies has played, and will continue to play,
a vital role in our subsea market leadership position. In 2009, we acquired Direct Drive
Systems, Inc. (DDS) and Multi Phase Meters AS (MPM). Both companies offer unique
technologies that further strengthen our portfolio of innovative solutions. DDS is a world leader
in developing and manufacturing high-performance permanent magnet motors and bearings.
This acquisition will allow FMC to develop the next generation of pumping and compression
solutions for customers. MPM is a global leader in the development and manufacture of
high-performance multiphase flowmeters. Its meters measure the content of oil, gas and water
in the production flow more accurately than any other product available on the market, adding
value to operators as they seek to maximize production of their fields. Our focus for the
product line will be subsea applications, and onshore and offshore production facilities.
Total U.S. Rigcount
2,500
2,000
1,500
1,000
500
08/08 12/08 4/09 8/09 12/09

5Annual Report 2009
We also supported our internal growth efforts during the year by opening three technology and
engineering centers. These strategically located facilities will enhance FMC’s ability to develop
innovative equipment and services. The Houston Technology Center will serve as our global hub for
the development of concepts and equipment that can significantly reduce our customers’ total cost
of field ownership. The St. Petersburg, Russia, Engineering Center represents a milestone in our
efforts to support future demand for developing fields offshore Russia. The Increased Oil Recovery
Center in Asker, Norway, will focus on developing solutions to maximize recovery rates from both
mature fields and new discoveries.
During 2009, we made a number of key management appointments. These included naming
Jay A. Nutt as Vice President and Controller, and Bradley D. Beitler as Vice President, Technology.
In addition, two members of our Board of Directors, Asbjørn Larsen and Governor James R.
Thompson, retired during the year. Both gentlemen had served on FMC’s Board since our initial
public offering in 2001, and their contributions and perspectives were invaluable to our growth.
They were succeeded by Claire S. Farley and Dr. Thorleif Enger.
The future of FMC Technologies remains strong. We begin our tenth year as a public company in
2010, and we are positioned at the forefront of a growing subsea market. During our brief history,
all of FMC’s stakeholders have benefitted from the successful execution of our strategies.
Our pragmatic approach and strong balance sheet allowed FMC to become an even stronger
company during 2009. We will continue to pursue market and product expansion and assess
acquisition candidates in 2010 in an effort to continue growing backlog and increase our market
share and profits. The future holds many opportunities to further expand our market leadership.
By following our Core Values – including integrity; innovation; collaboration; respect;
accountability; and health, safety and environment – we will remain positioned for future
success and growth in the markets we serve.
Peter D. Kinnear
Chairman, President and CEO
FMC Technologies, Inc.
Integrity
We do what is right and
ensure there is consistency
between what we say and
what we do.
Core Values
Innovation
Ideas and technologies are
what set our company, and
our people, apart from all
others.
Collaboration
By collaborating with our key
stakeholders, we can address
their unique needs and exceed
their expectations.
Respect
We empower our people,
support our communities, and
respect and embrace diversity.
Accountability
Our sense of responsibility in
all aspects of our business will
never waver.
Health, Safety & Environment
We establish standards to
operate in the safest manner
possible, promote employee
health and protect the
environment.

6 FMC Technologies, Inc.
Our Energy Production Systems segment includes subsea systems, separation systems, multi phase
meters and surface wellhead. These businesses design, manufacture and integrate the equipment
and systems necessary for customers to produce oil and gas from both onshore and offshore
developments.
Revenue for Energy Production Systems was $3.7 billion in 2009, a slight improvement over last
year’s sales. Operating profit for Energy Production increased 23 percent during the year to
$516.1 million compared to $420.7 million. The segment also recorded $2.7 billion in inbound
orders and completed the year with a backlog of $2.3 billion.
Energy Production’s improved revenue performance in 2009 was primarily attributable to our
subsea business, which generated a 3 percent increase in revenues to a record $3.1 billion during
the year. Although 2009 was characterized by the uncertainty of the timing of several large subsea
projects – a result of the global economic crisis – several oil and gas companies turned their focus
to maximizing production and recovery at their mature producing fields. This included Petrobras,
Brazil’s national oil company, which awarded FMC the $90 million Marlim subsea processing
project located in the Campos Basin, offshore Brazil.
Marlim is the sixth subsea processing project awarded to FMC since 2005. The project will result in
a number of new accomplishments in subsea processing, including the industry’s first deepwater
deployment of subsea separation technologies at a mature field. Marlim will also be the first system
to separate heavy oil and water in a subsea environment, and will become the first separation
system to reinject water into a subsea reservoir to boost production.
Energy Production
The Marlim subsea separation system will separate heavy oil, gas, sand and water at a water depth of approximately
2,950 feet (900 meters). The system will apply FMC's separation and sand management technologies, utilizing a novel
pipe separator design, licensed and developed in cooperation with Statoil.

7Annual Report 2009
The Marlim project will enable a broader application of our technologies for future subsea
processing opportunities offshore Brazil. During 2009, Petrobras stated its intention to invest more
than $17o billion between 2009 and 2013 to double hydrocarbon output and for the development of
the region’s offshore reservoirs. This includes approximately $105 billion dedicated to exploration
and production activities to increase oil recovery at mature fields, and for the development of recent
pre-salt discoveries such as Tupi. The Tupi reservoir is the largest discovery to occur in the Western
Hemisphere in more than 30 years, holding a potential of 5 billion to 8 billion barrels of recoverable
oil and gas. With the addition of Petrobras’ other discoveries in Brazil’s Santos Basin (Guara, Iara
and Carioca fields), there is a production potential of between 50 billion and 70 billion barrels of oil
equivalent. Our subsea technologies will play a major role in recovering those hydrocarbons.
Our subsea processing success offshore Brazil also included the commencement of production and
first oil at Shell’s Parque das Conchas, formerly BC-10, field. Parque das Conchas is a two-phase
project with initial production drawn from three fields: Abalone, Ostra and Argonauta B-West.
The first phase, which came on-stream in July of 2009, utilizes nine producing wells and one gas
injector well. The heavy oil is pumped more than a mile from the seabed to the surface.
To accomplish this, a floating production, storage and offloading (FPSO) vessel feeds power through
electrical umbilical cables to the deepwater separation and electrical submersible pump (ESP)
systems. The subsea processing system addresses environmental concerns as well, since the natural
gas produced with the oil is separated and pumped back into the field rather than being flared at
the surface. The Parque das Conchas development is the first full-field development utilizing subsea
oil and gas separation and pumping in Brazil.
Schilling Robotics, LLC
As more subsea systems, such
as subsea processing
solutions, are installed on the
ocean floor, we envision an
increased use of remotely
operated vehicles (ROVs)
during the life of the subsea
field. This includes ROV
demand during the initial
installation, maintenance and
monitoring of equipment on
the seabed. These were the
guiding principles behind our
purchase of a 45 percent
interest in Schilling Robotics,
LLC (Schilling) in 2008. Based
in Davis, California, Schilling
manufactures manipulator
systems and other
high-technology equipment
used in subsea oil and gas
exploration. This relationship
provides an opportunity for
FMC to expand our subsea
business by more fully
participating in the increasing
integration of remote
activities, such as subsea
processing, well intervention
and production optimization.
Our position in Schilling
includes an option to
purchase the remaining
55 percent of the company
over a two-year period
beginning in 2012.
(Left) Schilling Robotics’ next-generation Heavy-Duty™ (HD™) remotely operated vehicle (ROV), is designed and optimized
for the field and drill support markets. The compact ROV technology complements Schilling’s current UltraHeavy-Duty™
(UHD™) system (right) to help customers perform a variety of offshore operations that are increasingly in demand.
8 FMC Technologies, Inc.
Energy Production
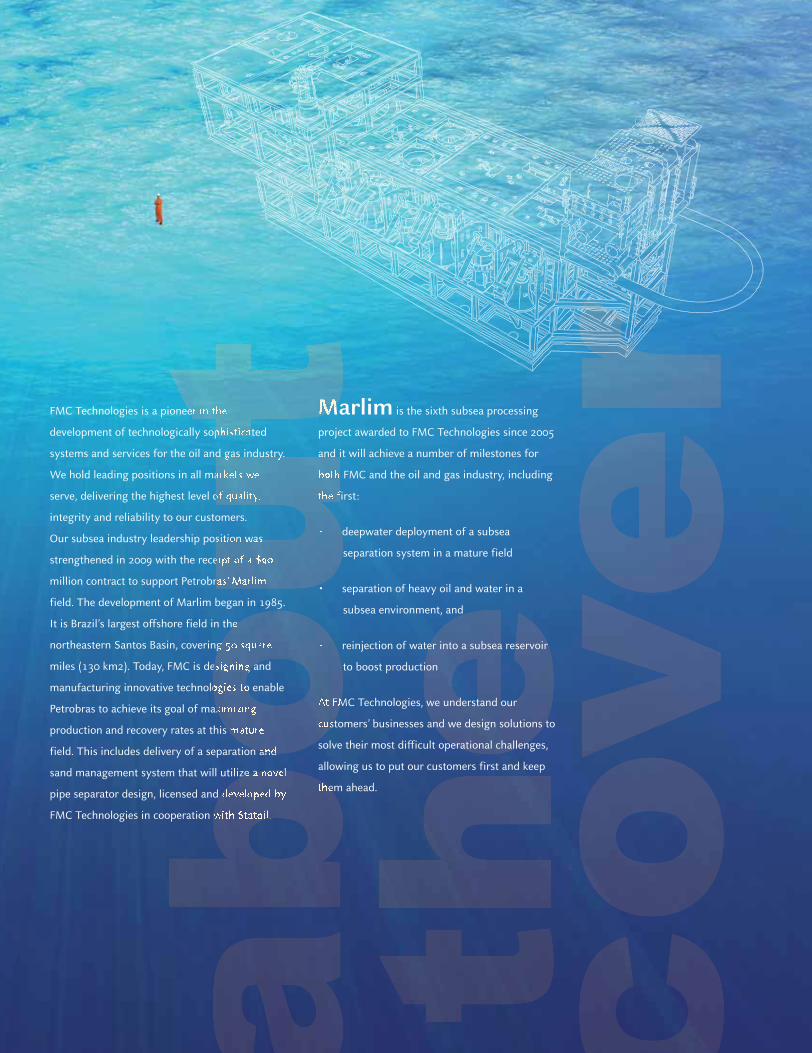
Our Light Well Intervention (LWI) system is one of many technologies designed to increase oil production from wells
located at mature fields. With more than 4,000 subsea wells in production today, customer demand for effective LWI
activities is expected to increase as operators seek to ensure their wells operate at peak performance.
A number of new and advanced technologies were designed for Shell to meet the project’s many
challenges, which include water depths to 6,500 feet (2,000 meters), low reservoir pressure and
heavy oil. FMC worked with Shell to design a system to successfully boost the oil from the seabed
to the surface platform. Ten FMC Enhanced Vertical Deepwater Trees (EVDT) were installed in the
field. The EVDT provides added value to customers by allowing them to use the same standard tree
design anywhere in the world, designed to bring versatility, installation savings and operational
efficiency to ultra-deepwater fields. Moreover, the EVDT system enables deepwater completions
from a small drilling rig containing only a surface blowout preventer (BOP). This allows customers
to avoid the need for an expensive deepwater rig with a subsea BOP system, saving significant time
and money.
The pumping and boosting technologies deployed at Parque das Conchas are being used in Shell’s
Perdido field as well, which will use the first full-field subsea separation and pumping system in the
Gulf of Mexico. The Perdido field is expected to achieve first oil in 2010, and will include 17 EVDTs,
rated to perform in high-pressure conditions up to 10,000 psi. The field also includes five caisson
separators that were installed on the seabed during 2009. These innovative systems will separate gas
from the liquids allowing the gas to free-flow to the surface facility while the liquids are pumped to
the surface. This enables increased oil recovery by removing about 2,000 psi of back pressure from
the wells.
Total’s Pazflor field is the first deepwater subsea processing system to include subsea gas/liquid
separation offshore Angola, West Africa. The project will develop hydrocarbons in water depths
between approximately 2,000 and 4,000 feet (600 to 1,200 meters), using three gas/liquid separation
systems as well as 49 FMC subsea trees connected via subsea flowlines and then risers to a spread
moored FPSO.

9Annual Report 2009
Multi Phase Meters AS
As operators continue to explore and develop reservoirs located in extreme deepwater
environments, their needs for advanced pumping, separation, boosting and compression systems to
produce hydrocarbons will also increase. FMC’s existing expertise in these areas was complemented
with the acquisition of Multi Phase Meters AS (MPM) in 2009. MPM’s innovative and high-accuracy
meters are well suited for permanent monitoring of individual wells and can accommodate and
self-adjust to both changes in flow composition and salinity of the produced water, providing
operators with more production knowledge and confidence in a well’s flow characteristics than
ever before. As the life of mature fields is extended and new fields are developed, we expect an
increasing number of subsea trees will be equipped with their own meters to monitor the flow
stream to enhance production and recovery rates.
In addition to growth by acquisition, FMC continued its long history of investing internally to
develop the innovative and value-adding technologies that operators require to succeed in their
increased oil recovery (IOR) efforts. This includes two IOR technologies that were utilized by
our customers during 2009 that also reduce operator costs: Light Well Intervention (LWI) and
Through Tubing Rotary Drilling (TTRD).
Statoil deployed two FMC LWI systems in the Norwegian sector of the North Sea last year from
the Island Wellserver and Island Frontier vessels. Our technology enabled Statoil to successfully
perform logging, plugging, perforating, scale removal, gauge replacement and various downhole
mechanical activities to enhance flow from the well. In addition to ensuring that a well operates at
peak capacity, other benefits include lower vessel costs compared to interventions performed from a
conventional rig, and the ability to quickly move the vessel to other well locations because of its
dynamic positioning capabilities, compared to using a moored semi-submersible rig. In the second
half of 2009, operator BP deployed our third LWI system in the UK sector of the North Sea and
reported excellent operating performance from our system. As the average age of existing subsea
wells grows and customers look to extend the production life of mature fields, we anticipate an
increased demand for cost-effective intervention activities through LWI, in the North Sea and
other international basins.
MPM’s unique and patented multi phase metering technologies provide customers with a step-change in metering
accuracy for multiphase, wetgas or dual (multiphase and wetgas) needs. MPM’s meters are virtually maintenance free,
designed to operate for more than 25 years in high-temperature/high-pressure conditions.
FMC Technologies acquired
Multi Phase Meters AS (MPM)
in October of 2009. Based in
Stavanger, Norway, MPM
is a global leader in the
development and
manufacture of high-
performance multiphase
flowmeters for the oil and
gas industry. The company’s
product line augments FMC's
portfolio of technologies for
optimizing oil and gas
recovery. MPM’s superior
metering technology delivers
high accuracy and
self-calibrating multiphase
(oil, water and gas) meters
that field operators need to
successfully develop and
produce offshore reservoirs.
MPM’s meters are also low
maintenance, a valuable
attribute as operators
continue to place systems in
more remote offshore
locations and in harsher,
deepwater environments.

10 FMC Technologies, Inc.
FMC delivered 10 production, injection and riser base manifolds that are currently installed at the Jubilee field, located
offshore Ghana. We are also providing 19 subsea production and injection trees, as well as topside and subsea
distribution controls. Components were supplied through FMC’s Subsea OnDemand™ program, providing accelerated
delivery to meet short lead-time requirements.
FMC’s Through Tubing Rotary Drilling (TTRD) technology, jointly developed with Statoil, produced
positive results when put into operation during the year at Statoil’s Åsgard field. TTRD technology
offers operators a less expensive way to drill new wells by drilling a sidetrack well directly through
the production tubing in an existing subsea well. Statoil reported that this approach resulted in
significant savings compared to the typical cost required to drill a new well. In addition to the cost
savings, other benefits include increased oil recovery from mature fields, extended production life
of a well and the safety benefits achieved through reduced handling of heavy equipment on the rig.
Subsea OnDemandTM, introduced in 2009, offers pre-engineered and field-proven equipment and
services that are designed to bring developments online quickly. By delivering pre-engineered and
field-proven equipment to customers on an accelerated delivery schedule, they are able to reduce
costs while minimizing the time required to achieve first oil. Subsea OnDemand also provides
operators with comprehensive technical support, system integration and interface management,
and experienced project teams to assist in their execution plans. Subsea OnDemand was a critical
element to FMC being awarded the $210 million Jubilee project. That deepwater development,
located offshore Ghana in West Africa, required an accelerated delivery schedule of subsea
equipment. Initial installations have begun at the field, and first oil from the Phase I development
is expected in late 2010.
Energy Production

11Annual Report 2009
We will continue to play a critical role in supporting operators as they face declining production
rates, a need to increase oil recovery while reducing costs, high-pressure/high-temperature
conditions and the entry into more remote and harsh subsea environments. Our innovative subsea
technology solutions have led to our market leadership position. We continue to listen to our
customers’ needs and develop and deliver the sophisticated technology solutions they need.
We continued to grow in 2009 by focusing on customer needs and differentiating our operations
through unsurpassed service. Part of our success was due to the demand for shallow-water subsea
trees and associated installation services. This includes the delivery of two systems to Wintershall
Noordzee B.V. for its P9 project in Holland. While the typical shallow-water completion system is
relatively simple and uses proven technology, the subsea system deployed for Wintershall was
adapted for a more stringent North Sea application, providing our customer with an ideal solution
to produce multiple zones from the well in a shallow-water environment.
Supported by a history of success throughout the Gulf of Mexico, FMC’s shallow-water subsea tree program has
expanded internationally with customers such as Wintershall, as they strive to access isolated pockets of hydrocarbons in
shallow-water environments.

12 FMC Technologies, Inc.
Our surface wellhead business provides oil and gas well drilling and completion products and
services for developments on land and offshore. One major award we received in 2009 was the
$30 million Peregrino project by Statoil. The project leverages our strong relationship and
technology with Statoil’s North Sea experience for a significant surface wellhead project offshore
Brazil. Located in approximately 400 feet (120 meters) of water in the Campos Basin, Peregrino is a
heavy oil field that will be completed in three phases, utilizing approximately 60 wells. FMC will
support phase one of the project through the manufacture and installation of 30 production wells
and seven injection wells. The award positions us as the leading supplier of advanced surface
wellheads and trees in South America.
As expected, our surface wellhead operations in North America were adversely impacted by the
steeply declining North American rig count and reduced demand for products and services
necessary to develop both conventional and unconventional oil and gas reserves. However, the
business experienced growth in new orders in December of 2009. This was driven by a slowly
improving North American rig count, providing optimism for a stronger performance in 2010.
A surface wellhead service technician installs a fracturing tree at a pad drilling location. Pad wells are common at drilling
locations such as the Marcellus, Barnett, and Fayetteville shale plays because they minimize the environmental impact
while lowering drilling costs. FMC’s equipment also includes a platform that provides an added level of safety for
employees.
Energy Production
13Annual Report 2009
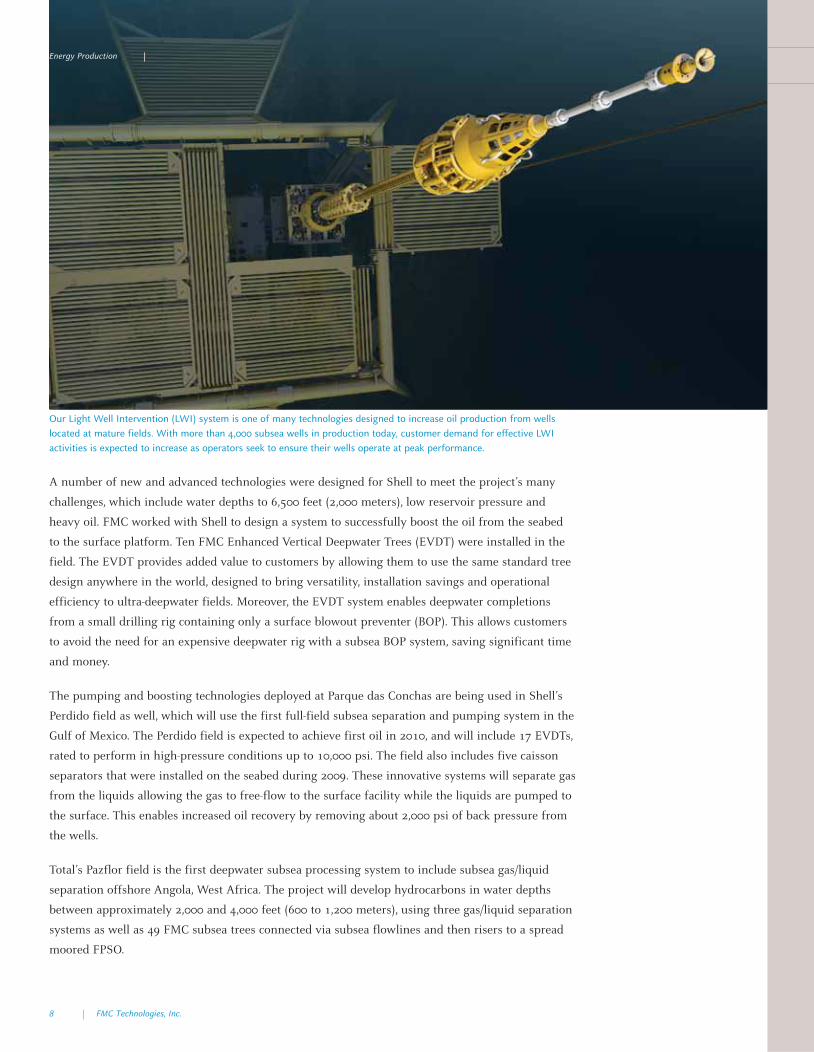
Surface wellhead also introduced the OBS-II mudline exploration wellhead system during the year.
This wellhead system allows customers to run mudline hanger systems much faster and safer than
conventional wellhead systems, saving up to 30 hours of jackup rig time during exploration drilling.
The OBS-II technology includes FMC’s Speedloc-II connections, which allow a faster and safer
makeup of the blowout preventers and the wellhead system, reducing operational risk and
improving rig safety.
Another achievement in 2009 was the establishment of a joint venture in Saudi Arabia that is
expected to result in increased market share in one of the largest markets in the world for surface
wellhead products.
During 2009, we also expanded our unitized wellhead product line of thru-bore systems with the
introduction of the UH-2 wellhead. This technology is uniquely designed and engineered to save
customers time and expense by allowing operators to run and set several casing strings without the
need to remove the blowout preventers. The UH-2 secures casing hangers and annular seals through
the use of an internal latch mechanism instead of conventional lockdown screws, providing
additional safety for rig workers by greatly reducing the time they spend working under the
rig floor.
The OBS-II drill-through rental wellhead system has positively impacted operations in the North Sea saving valuable rig
time during exploration drilling.

14 FMC Technologies, Inc.
FMC’s Energy Processing Systems segment supports a variety of customers throughout the energy
industry. The segment includes our fluid control, measurement solutions, loading systems, material
handling and blending and transfer operations, as well as the recently acquired Direct Drive
Systems, Inc. (DDS) business. Energy Processing was also impacted by the global recession and
depressed industry fundamentals throughout 2009. While all businesses in this segment continued
to report positive earnings, the segment’s revenue of $698.4 million for the year was a decrease of
21 percent compared to 2008. Segment operating profit of $102.4 million was 38 percent lower than
the prior year’s results.
The acquisition of DDS represented a significant addition to our future technology capabilities.
DDS’ proprietary systems and designs will enhance FMC’s existing pumping, compression and
boosting technologies. Their portfolio of equipment includes world-class permanent magnet motors
that are designed to power pumps and compressors more efficiently, offer a longer life cycle than
competing technologies, are more compact in size and require less power to operate. These features
make the permanent magnet motor technology unique and applicable to both subsea and surface
applications. DDS motors and magnetic bearings will complement FMC’s existing processing
systems and offer numerous potential cost savings and production enhancements for our
customers.
Our loading systems business provides equipment used in the loading and offloading of crude oil,
liquefied natural gas (LNG), refined products and chemicals to and from vessels, railcars and trucks.
The business was able to build upon its industry-leading offshore LNG technology during the year.
Loading systems delivered patented LNG targeting systems to the Peru LNG project during the year,
as well as the floating, storage and regasification unit (FSRU) for Saipem’s Offshore Livorono
Toscana (OLT) project. This equipment sets the standard for side-by-side transfer of LNG and
represents the first use of side-by-side loading arms on an FSRU.
Loading systems’ patented targeting system allows operators to safely and reliably connect and disconnect marine
loading arms during side-by-side offshore loading of LNG between two vessels. The system also enables the safe transfer
of LNG in challenging open-sea conditions, including vessel movements caused by high and rapid wave motions.
(Image© Terminale GNL Adriatico S.r.l.)
Energy Processing

15Annual Report 2009
The business continued executing its largest-ever contract award, the Samsung and Flex LNG
project for offshore LNG offloading. FMC’s LNG offloading systems will allow a floating production
storage and offloading vessel (FPSO) or an FSRU to perform side-by-side offshore loading, to or
from an LNG shuttle carrier. The system is designed to compensate for vessel movements
encountered at sea. Each system also contains a patented, enhanced-connection targeting system,
developed and qualified together with Shell Global Solutions, that ensures safe and reliable
connection and disconnection between vessels while transferring fluids in open-sea operating
environments.
Other LNG successes in 2009 included the commissioning and start-up of operations at
ExxonMobil’s Rovigo Adriatic project and Total’s Yemen project, marking the first LNG targeting
system installations to begin service in open-sea conditions.
Loading systems is also developing the next generation of transfer systems that customers can use
in even more severe offshore conditions. The Articulated Tandem Offshore Loader (ATOL) is being
designed to meet the industry’s need to safely and effectively load oil and gas in more harsh sea
states. Our Chiksan® brand ATOL system enables stern-to-bow LNG transfer, offering vessels the
ability to perform the transfer activities in more severe wave conditions.
Fluid control sets the standard for flowline products, production manifold systems and pumps
through its Chiksan® and Weco® brand valves, swivel joints and actuators as well as advanced well
service and industrial pumps. In 2009, fluid control’s performance was significantly impacted by
the decrease in demand for pressure pumping products and services. Despite the challenges posed
by the depressed market, the business maintained its market leadership and positioned itself to
emerge from the downturn in a more streamlined and competitive position through effective cost
reduction, improved efficiencies, effective supply chain management and by continuing to innovate
while bringing new products and services to market.
In response to operators’ needs for added safety and operational efficiencies while performing well
fracturing (frac) operations, the fluid control business introduced the Articulating Frac Arm (AFA)
during 2009. This patent-pending equipment is a preassembled piping system that extends from the
frac truck to the manifold, reducing setup and demobilization time and eliminating potential safety
issues that can occur during traditional field make-up. Since the AFA does not touch the ground, it
also eliminates fatigue load, is easier to maintain and remains free from equipment wear and tear
inherent with ground vibrations during frac operations.
Direct Drive Systems, Inc.
DDS’ Frame 2 (left) and Frame 8 (right) technologies can be utilized as motors to drive pumps and compressors for
pipeline, marine, offshore platform and subsea applications. They can also be utilized as generators to provide power
for offshore platforms, FPSOs, ships and other applications.
FMC completed the
acquisition of Direct Drive
Systems, Inc. (DDS) in
November of 2009. The
Fullerton, California-based
company is a world leader in
the development and
manufacture of
high-performance permanent
magnet motors and bearings
for the oil and gas industry.
On a per-megawatt basis,
DDS’ permanent magnet
systems are significantly
smaller, lighter and more
efficient than conventional
motors and generators.
In addition, because of their
high-speed operation, they
can be directly connected to
other turbomachinery without
using large and inefficient
gearboxes. The combined
expertise and innovative
technologies of FMC and DDS
will allow for the creation of
next-generation pumping and
compression solutions for our
customers, strengthening
FMC's leading position in the
important area of increased
oil recovery.

16 FMC Technologies, Inc.
In addition, we also introduced the Temporary Pipework Restraint (TPR) in response to our
customers’ requirement to continue enhancing the safety of their operations. This product,
incorporating several proprietary technologies, brings an additional level of operator safety.
The TPR can be installed in a third of the time needed for alternative restraints, providing increased
value for our customers.
Aftermarket services are a major differentiator in fluid control’s market, and the business continued
to drive forward with service improvements in 2009. We set up a new service base to support
customers who are operating in the Marcellus Shale in the eastern U.S. In addition, we introduced
Radio Frequency Identification (RFID) as a way to improve the efficiency, reduce the cost, and
improve the reliability of tracking and servicing our customers’ assets.
We are also seeing increased demand for fluid control’s well service pumps, and we expect this
trend to continue into 2010. The Triplex and the Quintuplex models were developed in response to
requests throughout the pressure pumping industry for a better performing pump with higher
durability and performance. These high pressure pumps are designed for fracturing, acidizing and
matrix stimulation applications and are capable of delivering flow rates of up to 1,575 gallons per
minute at pressures of up to 20,000 psi. In addition, they are designed to operate at higher loads
than any other competitive pump in the industry. The result is a product that performs at higher
capacity with greater reliability than the competitive alternatives.
FMC’s measurement solutions business, the world leader in the supply of flow measurement
equipment for the petroleum industry, recorded another strong year in 2009. The business
continued to deliver technically superior systems used for the custody transfer of liquid and
gas products.
This custom designed metering facility will be an integral part of the FPSO for the Pazflor project. The metering facility
has a capacity exceeding one million barrels of oil per day. The intricate assembly is typical of the many oil export
metering systems that FMC supplies.
Energy Processing

17Annual Report 2009
One high profile project that measurement solutions delivered in 2009 was TransCanada’s Keystone
and Keystone XL Pipeline. The pipeline is used to transfer crude oil from Canada’s oil sands.
The 4,150 miles (6,700 kilometers) of pipeline will transport crude oil from Alberta, Canada, to U.S.
markets in the Midwest and along the Texas Gulf Coast regions. The project includes the conversion
of 540 miles (870 kilometers) of Canadian natural gas pipelines into crude oil transmission service
and the construction of approximately 230 miles (370 kilometers) of pipeline, pump stations and
terminal facilities in Canada. In the U.S., the project will require construction of approximately
1,380 miles (2,220 kilometers) of pipeline and pump stations. Upon completion, the pipeline will be
one of the largest oil delivery systems in North America, with the capacity to deliver 1.1 million
barrels per day.
Measurement’s aftermarket group also expanded its product offering with several strategic asset
management contracts, including the Shell PROMISE (PROduction, Measurement Integrity
SErvices) award - providing operation, calibration, support and maintenance for all of Shell’s
onshore and offshore measurement assets in Europe.
As a result of the success of PROMISE, measurement solutions was awarded the operation and
maintenance contract for Kuwait Oil Company (KOC). That contract is a three-year maintenance
agreement that commenced in the second quarter of 2009, providing day-to-day preventative
maintenance, calibrations and consulting services for KOC’s measurement infrastructure.
The material handling business also invested for future growth by expanding to support growth
opportunities for coal-fired power generation in China and India. This included the opening of a
sales development office in India and the continued development of sales, engineering and sourcing
capabilities in China.
Our blending and transfer business continues to be a recognized global leader in the turnkey
development, manufacture and installation of blending and control systems for petroleum
applications. The business achieved record sales in 2009, supported by its largest project in history,
a turnkey solution to expand Quaker Chemical’s Middletown, Ohio, lube oil plant. FMC served as
general contractor for the project, which included the addition of a state-of-the-art, computer-
controlled plant system that increased Quaker’s productivity by 60 percent. The blending and
transfer business also received a contract to supply the TURPAS project in Turkey, a refinery
upgrade that will commence in 2010.
FMC Technologies is a world leader in providing a full supply of bulk material handling systems and associated services
for coal-fired power plants.
Material Handling Solutions
Our material handling
business supplies
state-of-the-art material
handling products and
systems to a wide array of
industries worldwide and is a
market leader for coal
handling systems used in
coal-fired power generation
plants. The business achieved
a key milestone during 2009
with the delivery of the
coal-handling system to
Bechtel for the Prairie State
Energy Campus (PSEC).
The PSEC is one of the
largest energy projects
currently under construction
in the United States
and is comprised of a
1,600-megawatt coal-fired
power plant. The power plant
will use a domestic coal
source and deploy advanced
environmental control
technologies to generate
enough electricity to serve
approximately 2.5 million
families in at least
nine states.

18 FMC Technologies, Inc.
Board of Directors & Officers
Board of DirectorsPeter D. KinnearChairman, President and Chief Executive Officer
FMC Technologies, Inc.
Mike R. BowlinRetired Chairman of the Board
Atlantic Richfield Co.
Philip J. BurguieresChairman and Chief Executive Officer
EMC Holdings, LLC
C. Maury DevineRetired President and Managing Director
ExxonMobil Norway, Inc.
Dr. Thorleif EngerRetired President and Chief Executive Officer
Yara International
1 Audit Committee
2 Compensation Committee
3 Nominating and
Governance Committee
Claire S. FarleyAdvisory Director
Jeffries Randall & Dewey
Thomas M. HamiltonRetired Chairman, President and Chief Executive Officer
EEX Corporation
Edward J. MooneyRetired Délégué Général – North America
Suez Lyonnaise des Eaux
Joseph H. NetherlandRetired Chairman
FMC Technologies, Inc.
Richard A. PattarozziRetired Vice President
Shell Oil Company
James M. RinglerRetired Vice Chairman
Illinois Tool Works Inc.
Off icersPeter D. KinnearChairman, President and Chief Executive Officer
William H. Schumann, IIIExecutive Vice President, Chief Financial Officer
and Treasurer
John T. GrempExecutive Vice President
Energy Systems
Robert L. PotterSenior Vice President
Energy Processing and Global Surface Wellhead
Tore HalvorsenSenior Vice President
Global Subsea Production Systems
Jeffrey W. CarrVice President, General Counsel and Secretary
Maryann T. SeamanVice President
Administration
Jay A. NuttVice President and Controller
Bradley D. BeitlerVice President
Technology
FMC Technologies’ Directors are (seated, left to right) Joseph Netherland, Claire Farley, Peter Kinnear,
C. Maury Devine and James Ringler; (standing, left to right) Thomas Hamilton, Dr. Thorleif Enger, Mike Bowlin,
Richard Pattarozzi, Edward Mooney and Philip Burguieres.
19Annual Report 2009
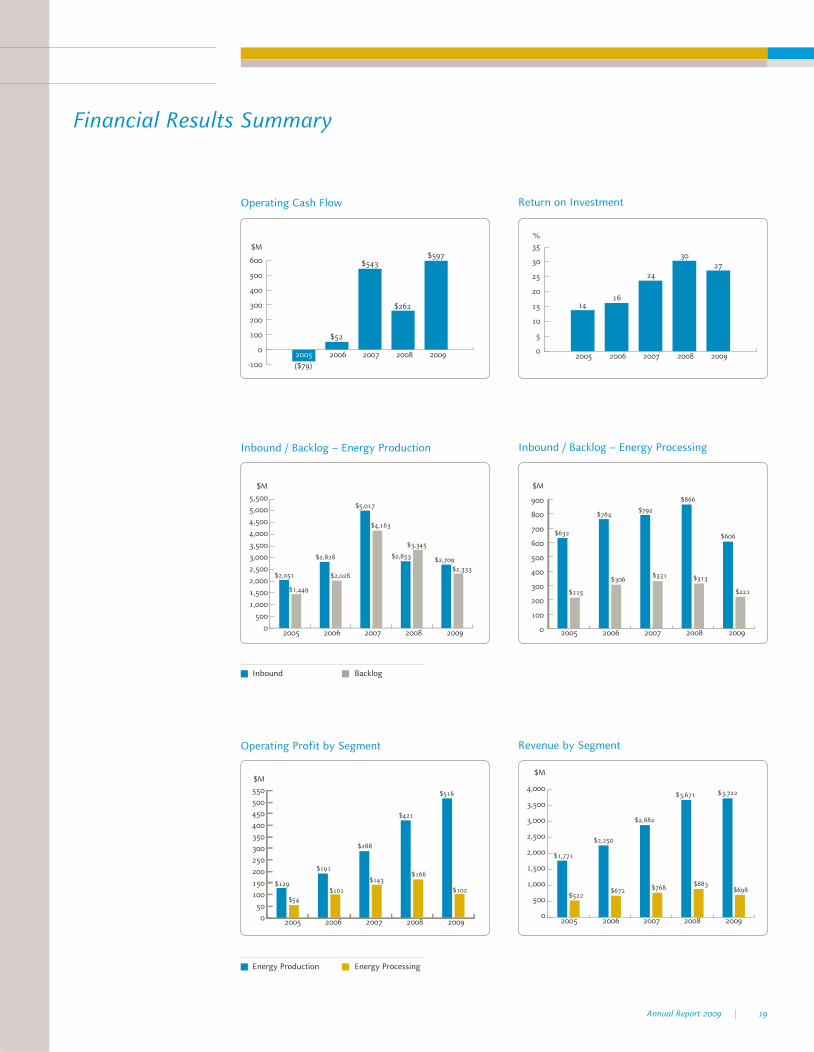
Financial Results Summary
Operating Profit by Segment
2005
$129
$54
$191
$101
$288
$143
$421
$166
$516
$102
2006 2007 2008 2009
$M
550
500
450
400
350
300
250
200
150
100
50
0
Revenue by Segment
2005
$1,771
$522$672 $768
$883$698
$2,250
$2,882
$3,671 $3,722
2006 2007 2008 2009
$M
4,000
3,500
3,000
2,500
2,000
1,500
1,000
500
0
2005
$2,051
$1,449
$2,828
$2,028
$5,017
$4,163
$2,853
$3,345
$2,709
$2,333
2006 2007 2008 2009
$M
5,500
5,000
4,500
4,000
3,500
3,000
2,500
2,000
1,500
1,000
500
02005
$632
$764
$215
$306
$792
$331
$866
$313
$606
$221
2006 2007 2008 2009
$M
900
800
700
600
500
400
300
200
100
0
-100
0
100
200
300
400
500
600
2005 2006
$M
($79)
$52
$543
$262
$597
2007 2008 2009 0
5
10
15
20
25
30
35
2005
1416
24
3027
%
2006 2007 2008 2009
Inbound / Backlog – Energy Production Inbound / Backlog – Energy Processing
Operating Cash Flow Return on Investment
Energy Production Energy Processing
Inbound Backlog

20 FMC Technologies, Inc.
Form 10K

UNITED STATESSECURITIES AND EXCHANGE COMMISSION
WASHINGTON, D.C. 20549
FORM 10-K(Mark One)
È ANNUAL REPORT PURSUANT TO SECTION 13 OR 15(d) OF THE SECURITIES EXCHANGE ACT OF 1934
For the fiscal year ended December 31, 2009OR
‘ TRANSITION REPORT PURSUANT TO SECTION 13 OR 15(d) OF THE SECURITIES EXCHANGE ACT OF 1934
For the transition period from toCommission file number 1-16489
FMC TECHNOLOGIES, INC.(Exact name of registrant as specified in its charter)
Delaware 36-4412642(State or other jurisdiction ofincorporation or organization)
(I.R.S. EmployerIdentification No.)
1803 Gears Road,Houston, Texas 77067
(Address of principal executive offices) (Zip Code)
Registrant’s telephone number, including area code: 281/591-4000
Securities registered pursuant to Section 12(b) of the Act:Title of each class Name of each exchange on which registered
Common Stock, $0.01 par value New York Stock ExchangePreferred Share Purchase Rights New York Stock Exchange
Securities registered pursuant to Section 12(g) of the Act: None
INDICATE BY CHECK MARK IF THE REGISTRANT IS A WELL-KNOWN SEASONED ISSUER, AS DEFINED IN RULE 405 OF THESECURITIES ACT. YES È NO ‘
INDICATE BY CHECK MARK IF THE REGISTRANT IS NOT REQUIRED TO FILE REPORTS PURSUANT TO SECTION 13 OR 15(d) OF THEEXCHANGE ACT. YES ‘ NO È
INDICATE BY CHECK MARK WHETHER THE REGISTRANT (1) HAS FILED ALL REPORTS REQUIRED TO BE FILED BY SECTION 13 OR15(d) OF THE SECURITIES EXCHANGE ACT OF 1934 DURING THE PRECEDING 12 MONTHS (OR FOR SUCH SHORTER PERIOD THAT THEREGISTRANT WAS REQUIRED TO FILE SUCH REPORTS), AND (2) HAS BEEN SUBJECT TO SUCH FILING REQUIREMENTS FOR THE PAST 90DAYS. YES È NO ‘
INDICATE BY CHECK MARK WHETHER THE REGISTRANT HAS SUBMITTED ELECTRONICALLY AND POSTED ON ITS CORPORATEWEBSITE, IF ANY, EVERY INTERACTIVE DATA FILE REQUIRED TO BE SUBMITTED AND POSTED PURSUANT TO RULE 405 OFREGULATION S-T (§ 232.405 OF THIS CHAPTER) DURING THE PRECEDING 12 MONTHS (OR FOR SUCH SHORTER PERIOD THAT THEREGISTRANT WAS REQUIRED TO SUBMIT AND POST SUCH FILES). YES È NO ‘
INDICATE BY CHECK MARK IF DISCLOSURE OF DELINQUENT FILERS PURSUANT TO ITEM 405 OF REGULATION S-K IS NOTCONTAINED HEREIN, AND WILL NOT BE CONTAINED, TO THE BEST OF REGISTRANT’S KNOWLEDGE, IN DEFINITIVE PROXY ORINFORMATION STATEMENTS INCORPORATED BY REFERENCE IN PART III OF THIS FORM 10-K OR ANY AMENDMENT TO THIS FORM10-K. ‘
INDICATE BY CHECK MARK WHETHER THE REGISTRANT IS A LARGE ACCELERATED FILER, AN ACCELERATED FILER, ANON-ACCELERATED FILER, OR A SMALLER REPORTING COMPANY. SEE DEFINITION OF “ACCELERATED FILER AND LARGEACCELERATED FILER” IN RULE 12b-2 OF THE EXCHANGE ACT.
LARGE ACCELERATED FILER È ACCELERATED FILER ‘ NON-ACCELERATED FILER ‘ SMALLER REPORTING COMPANY ‘
INDICATE BY CHECK MARK WHETHER THE REGISTRANT IS A SHELL COMPANY (AS DEFINED IN RULE 12b-2 OF THE EXCHANGEACT). YES ‘ NO È
THE AGGREGATE MARKET VALUE OF THE REGISTRANT’S COMMON STOCK HELD BY NON-AFFILIATES OF THE REGISTRANT,DETERMINED BY MULTIPLYING THE OUTSTANDING SHARES ON JUNE 30, 2009, BY THE CLOSING PRICE ON SUCH DAY OF $37.58 ASREPORTED ON THE NEW YORK STOCK EXCHANGE, WAS $2,631,292,606.*
THE NUMBER OF SHARES OF THE REGISTRANT’S COMMON STOCK, $0.01 PAR VALUE, OUTSTANDING AS OF FEBRUARY 22, 2010WAS 121,986,139.
DOCUMENTS INCORPORATED BY REFERENCE
DOCUMENT FORM 10-K REFERENCE
Portions of Proxy Statement for the 2010 Annual Meeting of Stockholders Part III
* Excludes 52,883,211 shares of the registrant’s Common Stock held by directors, officers and holders of more than 5% of the registrant’s Common Stock asof June 30, 2009. Exclusion of shares held by any person should not be construed to indicate that such person or entity possesses the power, direct orindirect, to direct or cause the direction of the management or policies of the registrant, or that such person or entity is controlled by or under commoncontrol with the registrant.
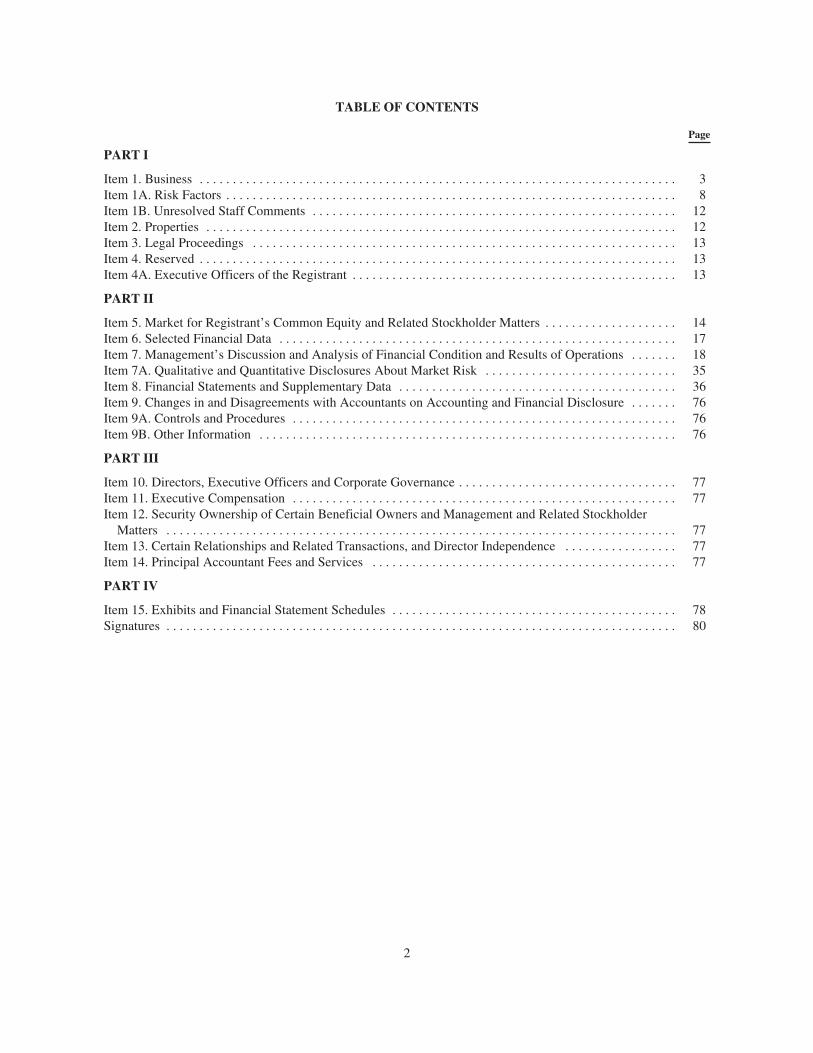
TABLE OF CONTENTS
Page
PART I
Item 1. Business . . . . . . . . . . . . . . . . . . . . . . . . . . . . . . . . . . . . . . . . . . . . . . . . . . . . . . . . . . . . . . . . . . . . . . . . 3Item 1A. Risk Factors . . . . . . . . . . . . . . . . . . . . . . . . . . . . . . . . . . . . . . . . . . . . . . . . . . . . . . . . . . . . . . . . . . . . 8Item 1B. Unresolved Staff Comments . . . . . . . . . . . . . . . . . . . . . . . . . . . . . . . . . . . . . . . . . . . . . . . . . . . . . . . 12Item 2. Properties . . . . . . . . . . . . . . . . . . . . . . . . . . . . . . . . . . . . . . . . . . . . . . . . . . . . . . . . . . . . . . . . . . . . . . . 12Item 3. Legal Proceedings . . . . . . . . . . . . . . . . . . . . . . . . . . . . . . . . . . . . . . . . . . . . . . . . . . . . . . . . . . . . . . . . 13Item 4. Reserved . . . . . . . . . . . . . . . . . . . . . . . . . . . . . . . . . . . . . . . . . . . . . . . . . . . . . . . . . . . . . . . . . . . . . . . . 13Item 4A. Executive Officers of the Registrant . . . . . . . . . . . . . . . . . . . . . . . . . . . . . . . . . . . . . . . . . . . . . . . . . 13
PART II
Item 5. Market for Registrant’s Common Equity and Related Stockholder Matters . . . . . . . . . . . . . . . . . . . . 14Item 6. Selected Financial Data . . . . . . . . . . . . . . . . . . . . . . . . . . . . . . . . . . . . . . . . . . . . . . . . . . . . . . . . . . . . 17Item 7. Management’s Discussion and Analysis of Financial Condition and Results of Operations . . . . . . . 18Item 7A. Qualitative and Quantitative Disclosures About Market Risk . . . . . . . . . . . . . . . . . . . . . . . . . . . . . 35Item 8. Financial Statements and Supplementary Data . . . . . . . . . . . . . . . . . . . . . . . . . . . . . . . . . . . . . . . . . . 36Item 9. Changes in and Disagreements with Accountants on Accounting and Financial Disclosure . . . . . . . 76Item 9A. Controls and Procedures . . . . . . . . . . . . . . . . . . . . . . . . . . . . . . . . . . . . . . . . . . . . . . . . . . . . . . . . . . 76Item 9B. Other Information . . . . . . . . . . . . . . . . . . . . . . . . . . . . . . . . . . . . . . . . . . . . . . . . . . . . . . . . . . . . . . . 76
PART III
Item 10. Directors, Executive Officers and Corporate Governance . . . . . . . . . . . . . . . . . . . . . . . . . . . . . . . . . 77Item 11. Executive Compensation . . . . . . . . . . . . . . . . . . . . . . . . . . . . . . . . . . . . . . . . . . . . . . . . . . . . . . . . . . 77Item 12. Security Ownership of Certain Beneficial Owners and Management and Related StockholderMatters . . . . . . . . . . . . . . . . . . . . . . . . . . . . . . . . . . . . . . . . . . . . . . . . . . . . . . . . . . . . . . . . . . . . . . . . . . . . . 77
Item 13. Certain Relationships and Related Transactions, and Director Independence . . . . . . . . . . . . . . . . . 77Item 14. Principal Accountant Fees and Services . . . . . . . . . . . . . . . . . . . . . . . . . . . . . . . . . . . . . . . . . . . . . . 77
PART IV
Item 15. Exhibits and Financial Statement Schedules . . . . . . . . . . . . . . . . . . . . . . . . . . . . . . . . . . . . . . . . . . . 78Signatures . . . . . . . . . . . . . . . . . . . . . . . . . . . . . . . . . . . . . . . . . . . . . . . . . . . . . . . . . . . . . . . . . . . . . . . . . . . . . 80
2
PART I
ITEM 1. BUSINESS
OVERVIEW
We are a global provider of technology solutions for the energy industry. We design, manufacture and servicetechnologically sophisticated systems and products such as subsea production and processing systems, surfacewellhead production systems, high pressure fluid control equipment, measurement solutions, and marine loadingsystems for the oil and gas industry. Our operations are aggregated into two reportable segments: EnergyProduction Systems and Energy Processing Systems. Financial information about our business segments isincorporated herein by reference from Note 19 to our consolidated financial statements included in Item 8 of thisAnnual Report on Form 10-K.
We were incorporated in November 2000 under Delaware law and were a wholly owned subsidiary of FMCCorporation until our initial public offering in June 2001, when 17% of our common stock was sold to the public.On December 31, 2001, FMC Corporation distributed its remaining 83% ownership of our stock to FMCCorporation’s stockholders in the form of a dividend.
On July 31, 2008, we spun-off our FoodTech and Airport Systems businesses, which are now known as JohnBean Technologies Corporation (“JBT”), through a tax-free dividend to our shareholders. The results of JBThave been reported as discontinued operations for all periods presented. For additional information related to thespin-off of JBT, see Note 3 to our consolidated financial statements included in Item 8 of this Annual Report onForm 10-K.
Our principal executive offices are located at 1803 Gears Road, Houston, Texas 77067. As used in this report,except where otherwise stated or indicated by the context, all references to “FMC Technologies,” “we,” “us,” or“our” are to FMC Technologies, Inc. and its consolidated subsidiaries.
Our Annual Reports on Form 10-K, Quarterly Reports on Form 10-Q and Current Reports on Form 8-K andamendments to those reports filed or furnished pursuant to Section 13(a) or 15(d) of the Securities Exchange Actof 1934, as amended, are available free of charge through our website at www.fmctechnologies.com, under“Investors—Financial Information—SEC Filings.” Our Annual Report on Form 10-K for the year endedDecember 31, 2009, is also available in print to any stockholder free of charge upon written request submitted toJeffrey W. Carr, Vice President, General Counsel and Secretary, FMC Technologies, Inc., 1803 Gears Road,Houston, Texas 77067.
Throughout this Annual Report on Form 10-K, we incorporate by reference certain information from our ProxyStatement for the 2010 Annual Meeting of Stockholders. The SEC allows us to disclose important information byreferring to it in that manner. We provide stockholders with an annual report containing financial informationthat has been examined and reported upon, with an opinion expressed thereon by an independent registeredpublic accounting firm. On or about March 30, 2010, our Proxy Statement for the 2010 Annual Meeting ofStockholders will be available on our website under “Investors—Financial Information—SEC Filings.”Similarly, our 2009 Annual Report to Stockholders will be available on our website under “Investors—FinancialInformation—Annual Reports.”
BUSINESS SEGMENTS
Energy Production Systems
Energy Production Systems designs and manufactures systems and provides services used by oil and gascompanies involved in land and offshore, including deepwater, exploration and production of crude oil and gas.Our production systems control the flow of oil and gas from producing wells. We specialize in offshoreproduction systems and have manufacturing facilities near most of the world’s principal offshore oil and gasproducing basins. We market our products primarily through our own technical sales organization. EnergyProduction Systems revenue comprised approximately 84%, 81% and 79% of our consolidated revenue in 2009,2008 and 2007, respectively.
3

Principal Products and Services
Subsea Systems. Subsea systems represented approximately 70%, 66% and 62% of our consolidated revenues in2009, 2008 and 2007, respectively. Our systems are used in the offshore production of crude oil and natural gas.Subsea systems are placed on the seafloor and are used to control the flow of crude oil and natural gas from thereservoir to a host processing facility, such as a floating production facility, a fixed platform, or an onshorefacility. Our subsea equipment is controlled by the host processing facility.
The design and manufacture of our subsea systems require a high degree of technical expertise and innovation.Some of our systems are designed to withstand exposure to the extreme hydrostatic pressure that deepwaterenvironments present as well as internal pressures of up to 15,000 pounds per square inch (“psi”) andtemperatures in excess of 350º F. The foundation of this business is our technology and engineering expertise.
The development of our integrated subsea systems usually includes initial engineering design studies, subseatrees, control systems, manifolds, seabed template systems, flowline connection and tie-in systems, installationand workover tools, and subsea wellheads. In order to provide these systems and services, we utilize engineering,project management, global procurement, manufacturing, assembly and testing capabilities. Further, we provideservice technicians for installation assistance and field support for commissioning, intervention and maintenanceof our subsea systems throughout the life of the oilfield. Additionally, we provide tools such as our light wellintervention system for certain well workover and intervention tasks.
Surface Wellhead. In addition to our subsea systems, we provide a full range of surface wellheads and productionsystems for both standard service and critical service applications. Surface production systems, or trees, are usedto control and regulate the flow of oil and gas from the well. Our surface products and systems are usedworldwide on both land and offshore platforms and can be used in difficult climatic conditions, such as arcticcold or desert high temperatures. We support our customers through engineering, manufacturing, fieldinstallation support, and aftermarket services. Surface products and systems represented approximately 14%,14% and 16% of our consolidated revenues in 2009, 2008 and 2007, respectively.
Separation Systems. We design and manufacture systems that separate production flows from wells into oil, gas,sand and water. Our separation technology improves upon conventional separation technologies by moving theflow in a spiral, spinning motion. This causes the elements of the flow stream to separate more efficiently. Thesesystems are currently capable of operating onshore or offshore with successful subsea operation in 2007.
Multi Phase Meters. We acquired 100% of Multi Phase Meters AS (“MPM”) in October 2009. Through MPM,we now design and manufacture high-performance multiphase flow meters. MPM’s product applications includeproduction and surface well testing, reservoir monitoring, remote operation, fiscal allocation, process monitoringand control, and turbine and compressor monitoring. This technology delivers high accuracy and self-calibratingmultiphase meters, with low maintenance features to meet our customers’ increasingly demanding requirementsfor subsea applications as well as topside applications. The MPM product line augments our portfolio oftechnologies for optimizing oil and gas recovery.
Status of Product Development
We continue to advance the development of subsea separation processing technologies. Subsea processing is anemerging technology in the industry, which we believe offers considerable benefits to the oil and gas producer,enabling a more rapid and cost-efficient approach to separation. If separation is performed on the seabed, thehydrostatic pressure of the fluid going from the seabed to the surface is reduced, allowing the well to flow moreefficiently, accelerating production and enabling higher recoveries from the subsea reservoir. Also, it cansignificantly reduce the capital investment required for floating vessels or platforms, since the integration ofprocessing capabilities will not be required. We introduced this technology commercially with Statoil’s Tordisfield in the North Sea during 2007.
We are developing the world’s first system for deepwater subsea separation of heavy oil and water that includesreinjection of water to boost production in a mature field development with Petrobras’ Marlim field in Brazil.The subsea separation module will separate heavy oil, gas, sand and water at a water depth of 2,950 feet, or 900
4

meters. The system will apply our separation and sand management technologies, utilizing a novel pipe separatordesign, licensed and developed in cooperation with Statoil. The separation system also includes cyclone modulesthat will perform water treatment before reinjecting the water back into the reservoir.
We continue to advance our in-line separation technology, leveraging our patented products for gas, liquid, waterand sand separation. These in-line technologies enable operators to achieve complete phase separation by usingpipe segments and cyclonic technology instead of using conventional technology that requires several largevessels to do the same job. Inline separators will be a cost-effective option in a number of surface and subseaapplications, requiring approximately 20% of the weight and space required by most conventional separatorsystems.
Another subsea processing technology we believe will serve this industry in the future is gas compression insubsea applications. Subsea gas compression allows the operator to maintain gas production as the reservoirpressure declines. It also boosts gas pressure and allows for transportation of the gas to shore without the need forsurface facilities. We are currently developing subsea control systems for gas compression suitable for largepressure ratios and volume flow.
As the rapidly growing installed base of subsea wells matures and requires maintenance similar to those on land,we believe using wireline or coiled tubing to access the downhole portion of the well will require riserless wellservicing equipment that can be deployed from a small vessel. We have developed and deployed three wireline-based systems that are currently in operation in the North Sea.
Much of the subsea activity today is taking place in deeper waters, requiring enhancements of our existingtechnologies to increase the performance of our equipment and the value of our systems to our customers in thesechallenging environments. For this purpose we have developed an Enhanced Vertical Deepwater Tree (EVDT)system, which includes technologically advanced controls and communications capable of installation andoperation in water depths up to 10,000 feet, or 3,048 meters, and with well bore pressures up to 10,000 psi. Thesystem has been designed to minimize installation and operating costs borne by the operator, and provide ahighly reliable fixture on the seabed to control the flow of hydrocarbons from the well. The first EVDT unitswere installed in Brazil for Shell’s Parque das Conchas (formerly BC-10) field and in the Gulf of Mexico forShell’s Perdido field during 2008. One EVDT unit in the Perdido field was installed at a water depth of 9,356feet, or 2,852 meters, setting a new world record for the deepest subsea tree installation.
Capital Intensity
Most of the systems and products that we supply for subsea applications are highly engineered to meet the uniquedemands of our customers and are typically ordered one to two years prior to installation. We commonly receiveadvance and progress payments from our customers in order to fund initial development and our working capitalrequirements. In addition, due to factors such as higher engineering content and our manufacturing strategy ofoutsourcing certain low value-added manufacturing activities, we believe that our Energy Production Systemsbusiness is less capital intensive than our competitors’ businesses.
Dependence on Key Customers
Generally, our customers in this segment are major integrated oil or exploration and production companies.
With our integrated systems for subsea production, we have aggressively pursued alliances with oil and gascompanies that are actively engaged in the subsea development of crude oil and natural gas. Development ofsubsea fields, particularly in deepwater environments, involves substantial capital investments by our customers.Our customers have sought the security of alliances with us to ensure timely and cost-effective delivery of subseaand other energy-related systems that provide an integrated solution to their needs. Our alliances establishimportant ongoing relationships with our customers. While our alliances do not always contractually commit ourcustomers to purchase our systems and services, they have historically led to, and we expect that they willcontinue to result in such purchases. For instance, we have an alliance of this type with Statoil. In 2009, wegenerated approximately 16% of our consolidated revenues from Statoil.
The loss of one or more of our significant oil and gas company customers could have a material adverse effect onour Energy Production Systems business segment.
5

Competition
Energy Production Systems competes with other companies that supply subsea systems, surface productionequipment, and separation systems, and with smaller companies that are focused on a specific application,technology or geographical niche in which we operate. Companies such as Cameron International Corporation, GEOil & Gas, Aker Solutions, and Wood Group compete with us in the marketplace across our various product lines.
Some of the factors on which we compete include reliability, cost-effective technology, execution and delivery.Our competitive strengths include our intellectual capital, experience base and breadth of technologies andproducts that enable us to design a unique solution for our customers’ project requirements while incorporatingstandardized components to contain costs. We have a strong presence in all of the major producing basins. Ourdeepwater expertise, experience and technology help us to maintain a leadership position in subsea systems.
Energy Processing Systems
Energy Processing Systems designs, manufactures and supplies technologically advanced high pressure valvesand fittings for oilfield service customers. We also manufacture and supply liquid and gas measurement andtransportation equipment and systems to customers involved in the production, transportation and processing ofcrude oil, natural gas and petroleum-based refined products. We sell to the end user through authorizedrepresentatives, distributor networks and our own technical sales organization. The segment’s products includefluid control, measurement solutions, loading systems, material handling systems, blending and transfer systemsand direct drive systems. Energy Processing Systems revenue comprised approximately 16%, 19% and 21% ofour consolidated revenue in 2009, 2008 and 2007, respectively.
Principal Products and Services
Fluid Control. We design and manufacture flowline products, under the WECO®/Chiksan® trademarks, andpumps and valves used in well completion and stimulation activities by major oilfield service companies, such asSchlumberger Limited, BJ Services Company, Halliburton Company and Weatherford International Ltd.
Our flowline products are used in equipment that pumps corrosive and/or erosive fluid into a well during the wellconstruction, hydraulic fracturing or other stimulation processes. Our reciprocating pump product line includesduplex, triplex and quintuplex pumps utilized in a variety of applications. The performance of this businesstypically rises and falls with variations in the active rig count throughout the world.
Measurement Solutions. Our measurement systems provide solutions for use in custody transfer of crude oil,natural gas and refined products. We combine advanced measurement technology with state-of-the-artelectronics and supervisory control systems to provide the measurement of both liquids and gases for purposes ofverifying ownership and determining revenue and tax obligations. Our Smith Meter product lines are well-established in the industry.
Loading Systems. We provide land and marine-based fluid loading and transfer systems primarily to the oil andgas industry. Our systems are capable of loading and offloading marine vessels transporting a wide range offluids, such as crude oil, liquefied natural gas and refined products. While these systems are typically constructedon a fixed jetty platform, we have also developed advanced loading systems that can be mounted on a vessel orstructure to facilitate ship-to-ship or tandem loading and offloading operations in open seas or exposed locations.
Material Handling Systems. We provide material handling systems, including bulk conveying systems to thepower generation industry. We provide innovative solutions for conveying, feeding, screening and orienting bulkproduct for customers in diverse industries. Our process, engineering, mechanical design and projectmanagement expertise enable us to execute these projects on a turnkey basis.
Blending and Transfer Systems. We provide engineering, design and construction management services inconnection with the application of blending technology, process controls and automation for manufacturers in thelubricant, petroleum, additive, fuel and chemical industries.
6

Direct Drive Systems. We acquired Direct Drive Systems, Inc. (“DDS”) in October 2009. As such, we nowdevelop and manufacture high-performance permanent magnet motors and bearings. DDS provides operationallysuperior machines for a variety of primary energy related applications, including integral motors and relatedsystem components for compression and pumping for natural gas pipelines, offshore platform and subseaprocessing markets. The compact size, efficiency and reliability of the motors make them ideal for thesedemanding applications.
Dependence on Key Customers
No single Energy Processing Systems customer accounts for more than 10% of our annual consolidated revenue.
Competition
Energy Processing Systems currently has the first or second largest market share for its primary products andservices. Some of the factors upon which we compete include technological innovation, reliability and productquality. Energy Processing Systems competes with a number of companies primarily in the gas and liquidcustody transfer, high-pressure pumping services, and fluid loading and transfer systems industries.
OTHER BUSINESS INFORMATION RELEVANT TO OUR BUSINESS SEGMENTS
Order Backlog
Information regarding order backlog is incorporated herein by reference from the section entitled “InboundOrders and Order Backlog” in Item 7 of this Annual Report on Form 10-K.
Sources and Availability of Raw Materials
Our business segments purchase carbon steel, stainless steel, aluminum and steel castings and forgings bothdomestically and internationally. We do not use single source suppliers for the majority of our raw materialpurchases and believe the available supplies of raw materials are adequate to meet our needs.
Research and Development
We are engaged in research and development activities directed largely toward the improvement of existingproducts and services, the design of specialized products to meet customer needs and the development of newproducts, processes and services. A large part of our product development spending in the past has focused on thestandardization of our subsea and surface product lines. With standardized products, we can minimizeengineering content, improve inventory utilization, and reduce cost through value engineering. Additionalfinancial information about Company-sponsored research and development activities is incorporated herein byreference from Note 19 to our consolidated financial statements included in Item 8 of this Annual Report onForm 10-K.
Patents, Trademarks and Other Intellectual Property
We own a number of U.S. and foreign patents, trademarks and licenses that are cumulatively important to ourbusinesses. As part of our ongoing research and development, we seek patents when appropriate for newproducts and product improvements. We have approximately 970 issued patents and pending patent applicationsworldwide. Further, we license intellectual property rights to or from third parties. We also own numerous U.S.and foreign trademarks and trade names and have approximately 300 registrations and pending applications inthe United States and abroad.
We protect and promote our intellectual property portfolio and take those actions we deem appropriate to enforceour intellectual property rights and to defend our right to sell our products. We do not believe, however, that theloss of any one patent, trademark, or license or group of related patents, trademarks, or licenses would have amaterial adverse effect on our overall business.
7

Employees
As of December 31, 2009, we had approximately 10,400 full-time employees; approximately 3,200 in the UnitedStates and 7,200 in non-U.S. locations. A small percentage of our U.S. employees are represented by laborunions.
Financial Information about Geographic Areas
The majority of our consolidated revenue and segment operating profits are generated in markets outside of theUnited States. Energy Production Systems and Energy Processing Systems revenue is dependent upon worldwideoil and gas exploration and production activity. Financial information about geographic areas is incorporatedherein by reference from Note 19 to our consolidated financial statements in Item 8 of this Annual Report onForm 10-K.
ITEM 1A. RISK FACTORS
Important risk factors that could impact our ability to achieve our anticipated operating results and growth plangoals are presented below. The following risk factors should be read in conjunction with discussions of ourbusiness and the factors affecting our business located elsewhere in this Annual Report on Form 10-K and in ourother filings with the SEC.
INDUSTRY-RELATED RISKS
• Demand for the systems and services provided by our businesses depends on oil and gas industryactivity and expenditure levels, which are directly affected by trends in the demand for and price ofcrude oil and natural gas.
We are substantially dependent on conditions in the oil and gas industry and that industry’s willingness andability to spend capital on the exploration for and development of crude oil and natural gas. Any substantialor extended decline in these expenditures may result in the reduced discovery and development of newreserves of oil and gas and the reduced exploitation of existing wells, which could adversely affect demandfor our systems and services and, in certain instances, result in the cancellation, modification orrescheduling of existing orders. These factors could have an adverse effect on our revenue and profitability.The level of spending is generally dependent on current and anticipated supply and demand for crude oil andnatural gas and the corresponding impact on prices which have been volatile in the past.
• The industries in which we operate or have operated expose us to potential liabilities arising out of theinstallation or use of our systems that could adversely affect our financial condition.
We operate in an industry that is subject to equipment defects, malfunctions and failures, equipment misuseand natural disasters, the occurrence of which may result in uncontrollable flows of gas or well fluids, firesand explosions. Although we have obtained insurance against many of these risks, we cannot assure that ourinsurance will be adequate to cover our liabilities. Further, we cannot assure that insurance will generally beavailable in the future or, if available, that premiums will be commercially justifiable. If we incur substantialliability and the damages are not covered by insurance or are in excess of policy limits, or if we were toincur liability at a time when we are not able to obtain liability insurance, our business, results of operationsor financial condition could be materially adversely affected.
• Our customers’ industries are undergoing continuing consolidation that may impact our results ofoperations.
Some of our largest customers have consolidated and are using their size and purchasing power to achieveeconomies of scale and pricing concessions. This consolidation may result in reduced capital spending bysuch customers or the acquisition of one or more of our other primary customers, which may lead to
8

decreased demand for our products and services. We cannot assure you that we will be able to maintain ourlevel of sales to any customer that has consolidated or replaced that revenue with increased businessactivities with other customers. As a result, this consolidation activity could have a significant negativeimpact on our results of operations or financial condition. We are unable to predict what effectconsolidations in the industries may have on prices, capital spending by our customers, our sellingstrategies, our competitive position, our ability to retain customers or our ability to negotiate favorableagreements with our customers.
• Our operations and the industries in which we operate are subject to a variety of U.S. andinternational laws and regulations that may increase our costs, limit the demand for our products andservices or restrict our operations.
We depend on the demand for our systems and services from oil and gas companies. This demand isaffected by changing taxes, price controls and other laws and regulations relating to the oil and gas industry.For example, the adoption of laws and regulations curtailing exploration and development of drilling forcrude oil and natural gas in our areas of operation for economic, environmental or other reasons couldadversely affect our operations by limiting demand for our systems and services. In light of our foreignoperations and sales, we are also subject to changes in foreign laws and regulations that may encourage orrequire hiring of local contractors or require foreign contractors to employ citizens of, or purchase suppliesfrom, a particular non-U.S. jurisdiction.
In addition, environmental laws and regulations affect the systems and services we design, market and sell,as well as the facilities where we manufacture our systems. We are required to invest financial andmanagerial resources to comply with environmental laws and regulations and anticipate that we willcontinue to be required to do so in the future. Because these laws and regulations change frequently, we areunable to predict the cost or impact that they may have on our businesses. The modification of existinglaws or regulations or the adoption of new laws or regulations imposing more stringent environmentalrestrictions could adversely affect our operations.
COMPANY-RELATED RISKS
• Disruptions in the political, regulatory, economic and social conditions of the foreign countries inwhich we conduct business could adversely affect our business or results of operations.
We operate manufacturing facilities in 14 countries outside of the United States, and approximately 77% ofour 2009 revenue was generated internationally. Instability and unforeseen changes in the internationalmarkets in which we conduct business, including economically and politically volatile areas such as NorthAfrica, West Africa, the Middle East, Latin America and the Asia Pacific region, could cause or contributeto factors that could have an adverse effect on the demand for our systems and services, our financialcondition or our results of operations. These factors include:
• foreign currency fluctuations or currency restrictions;
• fluctuations in the interest rate component of forward foreign currency rates;
• nationalization and expropriation;
• potentially burdensome taxation;
• inflationary and recessionary markets, including capital and equity markets;
• civil unrest, labor issues, political instability, terrorist attacks, military activity and wars;
• supply disruptions in key oil producing countries;
• ability of the Organization of Petroleum Exporting Countries (OPEC) to set and maintain productionlevels and pricing;
9

• trade restrictions, trade protection measures or price controls;
• foreign ownership restrictions;
• import or export licensing requirements;
• restrictions on operations, trade practices, trade partners and investment decisions resulting fromdomestic and foreign laws and regulations;
• changes in and the administration of laws and regulations;
• inability to repatriate income or capital; and
• reductions in the availability of qualified personnel.
Because a significant portion of our revenue is denominated in foreign currencies, changes in exchange rateswill produce fluctuations in our revenues, costs and earnings, and may also affect the book value of ourassets located outside of the U.S. and the amount of our stockholders’ equity. Although it is our policy toseek to minimize our currency exposure by engaging in hedging transactions where appropriate, we cannotensure that our efforts will be successful. To the extent we sell our products and services in foreign markets,currency fluctuations may result in our products and services becoming too expensive for foreign customers.
• We may lose money on fixed-price contracts.
As is customary for the business areas in which we operate, we often agree to provide products and servicesunder fixed-price contracts. Under these contracts, we are typically responsible for cost overruns. Our actualcosts and any gross profit realized on these fixed-price contracts may vary from the estimated amounts onwhich these contracts were originally based. There is inherent risk in the estimation process, includingsignificant unforeseen technical and logistical challenges or longer than expected lead times. A fixed-pricecontract may prohibit our ability to mitigate the impact of unanticipated increases in raw material prices(including the price of steel) through increased pricing. Depending on the size of a project, variations fromestimated contract performance could have a significant impact on our operating results.
• Due to the types of contracts we enter into, the cumulative loss of several major contracts or alliancesmay have an adverse effect on our results of operations.
We often enter into large, long-term contracts that, collectively, represent a significant portion of ourrevenue. These agreements, if terminated or breached, may have a larger impact on our operating results orour financial condition than shorter-term contracts due to the value at risk. If we were to lose several keyalliances or agreements over a relatively short period of time we could experience a significant adverseimpact on our financial condition or results of operations.
• Our businesses are dependent on the continuing services of certain of our key managers andemployees.
We depend on our senior executive officers and other key personnel. The loss of any of these officers or keymanagement could adversely impact our business if we are unable to implement key strategies ortransactions in their absence. In addition, competition for qualified employees among companies that relyheavily on engineering and technology (as we do) is intense. The loss of qualified employees or an inabilityto attract, retain and motivate additional highly skilled employees required for the operation and expansionof our business could hinder our ability to conduct research activities successfully and develop marketableproducts and services.
10
• Increased costs of raw materials and other components may result in increased operating expensesand adversely affect our results of operations and cash flows.
Our results of operations may be adversely affected by our inability to manage the rising costs andavailability of raw materials and components used in our wide variety of products and systems. Unexpectedchanges in the size and timing of regional and/or product markets, particularly for short lead-time products,could affect our results of operations and our cash flows.
• Our success depends on our ability to implement new technologies and services.
Our success depends on the ongoing development and implementation of new product designs andimprovements, and on our ability to protect and maintain critical intellectual property assets related to thesedevelopments. If we are not able to obtain patent or other protection of our technology, we may not be ableto continue to develop systems, services and technologies to meet evolving industry requirements, and if so,at prices acceptable to our customers.
Some of our competitors are large national and multinational companies that may be able to devote greaterfinancial, technical, manufacturing and marketing resources to research and development of new systems,services and technologies than we are able to do. If we are unable to compete effectively given these risks,our business, results of operations and financial condition could be adversely affected.
• Our failure to deliver our backlog on time could affect our future sales and profitability and ourrelationships with our customers.
Many of the contracts we enter into with our customers require long manufacturing lead times and maycontain penalty clauses relating to on-time delivery. A failure by us to deliver in accordance with customerexpectations could subject us to financial penalties and may result in damage to existing customerrelationships. Additionally, we include our expectations regarding the timing of delivery of productcurrently in backlog within our earnings guidance to the financial markets. Failure to deliver backlog inaccordance with expectations could negatively impact our financial performance.
• Our businesses are subject to a variety of governmental regulations.
We are exposed to a variety of federal, state, local and international laws and regulations relating to matterssuch as environmental, health and safety, labor and employment, import/export control, currency exchange,bribery and corruption and taxation. These laws and regulations are complex, change frequently and havetended to become more stringent over time. In the event the scope of these laws and regulations expand inthe future, the incremental cost of compliance could adversely impact our financial condition, results ofoperations or cash flows.
• Many of our customers’ activity levels, spending for our products and services, and ability to payamounts owed us may be impacted by continued disruptions in the financial and credit markets aswell as volatility in commodity prices.
Ongoing disruptions in the financial and credit markets that began in late 2008 could have an adverse effecton our revenue and profitability. Many of our customers finance their activities through cash flow fromoperations, the incurrence of debt or the issuance of equity. Limited access to external sources of fundingmay cause our customers to reduce their capital spending plans. A reduction of cash flow resulting fromdeclines in commodity prices, a reduction in borrowing bases under reserve based credit facilities, or thelack of availability of debt or equity financing may result in a significant reduction in our customers’spending for our products and services. While crude oil price and natural gas prices have increased sincetheir lows during early 2009, such prices are lower than they were during much of 2008 and continue to
11
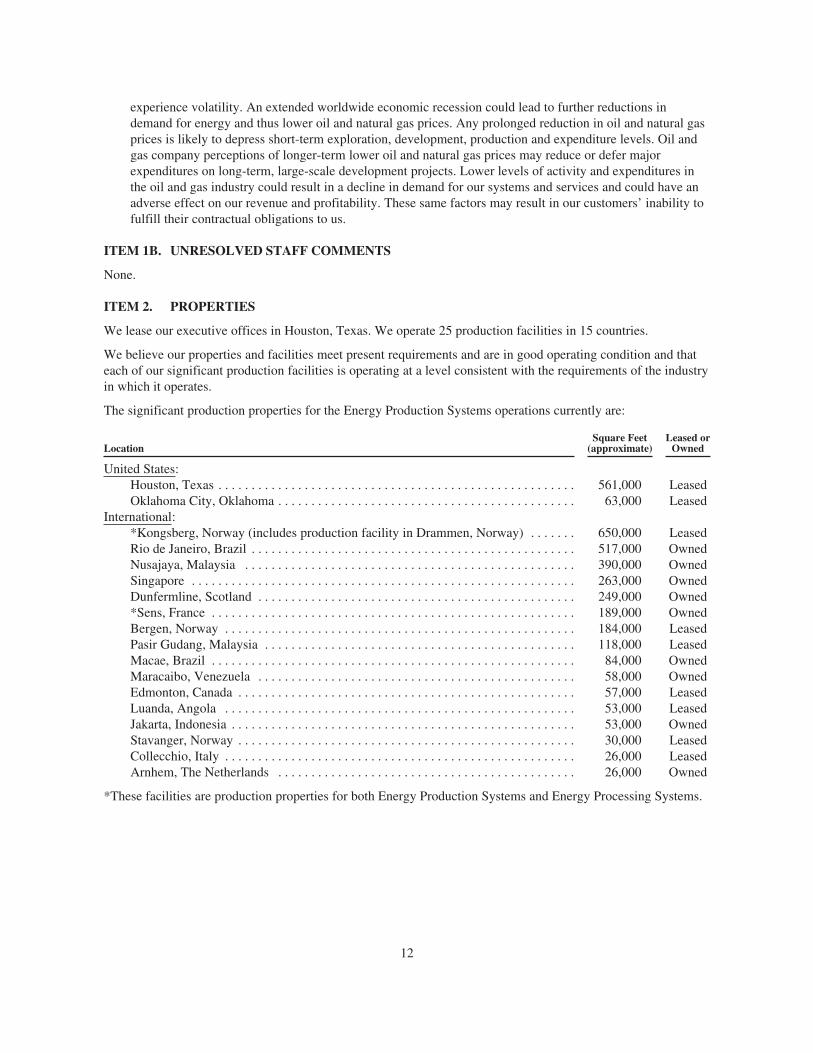
experience volatility. An extended worldwide economic recession could lead to further reductions indemand for energy and thus lower oil and natural gas prices. Any prolonged reduction in oil and natural gasprices is likely to depress short-term exploration, development, production and expenditure levels. Oil andgas company perceptions of longer-term lower oil and natural gas prices may reduce or defer majorexpenditures on long-term, large-scale development projects. Lower levels of activity and expenditures inthe oil and gas industry could result in a decline in demand for our systems and services and could have anadverse effect on our revenue and profitability. These same factors may result in our customers’ inability tofulfill their contractual obligations to us.
ITEM 1B. UNRESOLVED STAFF COMMENTS
None.
ITEM 2. PROPERTIES
We lease our executive offices in Houston, Texas. We operate 25 production facilities in 15 countries.
We believe our properties and facilities meet present requirements and are in good operating condition and thateach of our significant production facilities is operating at a level consistent with the requirements of the industryin which it operates.
The significant production properties for the Energy Production Systems operations currently are:
LocationSquare Feet(approximate)
Leased orOwned
United States:Houston, Texas . . . . . . . . . . . . . . . . . . . . . . . . . . . . . . . . . . . . . . . . . . . . . . . . . . . . . . 561,000 LeasedOklahoma City, Oklahoma . . . . . . . . . . . . . . . . . . . . . . . . . . . . . . . . . . . . . . . . . . . . . 63,000 Leased
International:*Kongsberg, Norway (includes production facility in Drammen, Norway) . . . . . . . 650,000 LeasedRio de Janeiro, Brazil . . . . . . . . . . . . . . . . . . . . . . . . . . . . . . . . . . . . . . . . . . . . . . . . . 517,000 OwnedNusajaya, Malaysia . . . . . . . . . . . . . . . . . . . . . . . . . . . . . . . . . . . . . . . . . . . . . . . . . . 390,000 OwnedSingapore . . . . . . . . . . . . . . . . . . . . . . . . . . . . . . . . . . . . . . . . . . . . . . . . . . . . . . . . . . 263,000 OwnedDunfermline, Scotland . . . . . . . . . . . . . . . . . . . . . . . . . . . . . . . . . . . . . . . . . . . . . . . . 249,000 Owned*Sens, France . . . . . . . . . . . . . . . . . . . . . . . . . . . . . . . . . . . . . . . . . . . . . . . . . . . . . . . 189,000 OwnedBergen, Norway . . . . . . . . . . . . . . . . . . . . . . . . . . . . . . . . . . . . . . . . . . . . . . . . . . . . . 184,000 LeasedPasir Gudang, Malaysia . . . . . . . . . . . . . . . . . . . . . . . . . . . . . . . . . . . . . . . . . . . . . . . 118,000 LeasedMacae, Brazil . . . . . . . . . . . . . . . . . . . . . . . . . . . . . . . . . . . . . . . . . . . . . . . . . . . . . . . 84,000 OwnedMaracaibo, Venezuela . . . . . . . . . . . . . . . . . . . . . . . . . . . . . . . . . . . . . . . . . . . . . . . . 58,000 OwnedEdmonton, Canada . . . . . . . . . . . . . . . . . . . . . . . . . . . . . . . . . . . . . . . . . . . . . . . . . . . 57,000 LeasedLuanda, Angola . . . . . . . . . . . . . . . . . . . . . . . . . . . . . . . . . . . . . . . . . . . . . . . . . . . . . 53,000 LeasedJakarta, Indonesia . . . . . . . . . . . . . . . . . . . . . . . . . . . . . . . . . . . . . . . . . . . . . . . . . . . . 53,000 OwnedStavanger, Norway . . . . . . . . . . . . . . . . . . . . . . . . . . . . . . . . . . . . . . . . . . . . . . . . . . . 30,000 LeasedCollecchio, Italy . . . . . . . . . . . . . . . . . . . . . . . . . . . . . . . . . . . . . . . . . . . . . . . . . . . . . 26,000 LeasedArnhem, The Netherlands . . . . . . . . . . . . . . . . . . . . . . . . . . . . . . . . . . . . . . . . . . . . . 26,000 Owned
*These facilities are production properties for both Energy Production Systems and Energy Processing Systems.
12

The significant production properties for the Energy Processing Systems operations currently are:
LocationSquare Feet(approximate)
Leased orOwned
United States:Tupelo, Mississippi . . . . . . . . . . . . . . . . . . . . . . . . . . . . . . . . . . . . . . . . . . . . . . . . . . 348,000 OwnedStephenville, Texas . . . . . . . . . . . . . . . . . . . . . . . . . . . . . . . . . . . . . . . . . . . . . . . . . . 261,000 OwnedErie, Pennsylvania . . . . . . . . . . . . . . . . . . . . . . . . . . . . . . . . . . . . . . . . . . . . . . . . . . . 258,000 OwnedCorpus Christi, Texas . . . . . . . . . . . . . . . . . . . . . . . . . . . . . . . . . . . . . . . . . . . . . . . . . 53,000 LeasedFullerton, California . . . . . . . . . . . . . . . . . . . . . . . . . . . . . . . . . . . . . . . . . . . . . . . . . . 51,000 Leased
International:Ellerbek, Germany . . . . . . . . . . . . . . . . . . . . . . . . . . . . . . . . . . . . . . . . . . . . . . . . . . . 131,000 OwnedChangshu, China . . . . . . . . . . . . . . . . . . . . . . . . . . . . . . . . . . . . . . . . . . . . . . . . . . . . 64,000 Leased
ITEM 3. LEGAL PROCEEDINGS
We are the named defendant in a number of lawsuits; however, while the results of litigation cannot be predictedwith certainty, management believes that the most probable, ultimate resolution of these matters will not have amaterial adverse effect on our consolidated financial position, results of operations or cash flows.
ITEM 4. RESERVED
ITEM 4A. EXECUTIVE OFFICERS OF THE REGISTRANT
Pursuant to General Instruction G(3), the information regarding our executive officers called for by Item 401(b)of Regulation S-K is hereby included in Part I of this Form 10-K.
The executive officers of FMC Technologies, together with the offices currently held by them, their businessexperience and their ages as of March 1, 2010, are as follows:
Name Age Office, year of election and other information for past five years
Peter D. Kinnear 62 Chairman, President and Chief Executive Officer (2008); President andChief Executive Officer (2007); President and Chief Operating Officer(2006); Executive Vice President (2004); Vice President (2001)
William H. Schumann, III 59 Executive Vice President, Chief Financial Officer and Treasurer (2010);Executive Vice President and Chief Financial Officer (2007); Senior VicePresident and Chief Financial Officer (2001); Treasurer (2002-2004)
John T. Gremp 58 Executive Vice President—Energy Systems (2007); Vice President andGroup Manager—Energy Production (2004), General Manager (2002)
Tore H. Halvorsen 55 Senior Vice President—Global Subsea Production Systems (2007); VicePresident—Subsea Systems Eastern Hemisphere (2004); ManagingDirector of FMC Kongsberg Subsea AS (1994)
Robert L. Potter 59 Senior Vice President—Energy Processing and Global Surface Wellhead(2007); Vice President—Energy Processing Systems (2001)
Jeffrey W. Carr 53 Vice President, General Counsel and Secretary (2001)Maryann T. Seaman 47 Vice President, Administration (2007); Director of Investor Relations and
Corporate Development (2003)Jay A. Nutt 46 Vice President and Controller (2009); Controller (2008); Controller—
Energy Systems (2007); Controller—Energy Production Systems (2001)Bradley D. Beitler 56 Vice President, Technology (2009); Director of Technology (2006);
Director of Business Development (2001)
13

No family relationships exist among any of the above-listed officers, and there are no arrangements orunderstandings between any of the above-listed officers and any other person pursuant to which they serve as anofficer. During the past five years, none of the above-listed officers have been involved in any legal proceedingsas defined in Item 401(f) of Regulation S-K. All officers are elected to hold office until their successors areelected and qualified.
PART II
ITEM 5. MARKET FOR REGISTRANT’S COMMON EQUITY AND RELATED STOCKHOLDERMATTERS
Our common stock is listed on the New York Stock Exchange under the symbol FTI. Market information withrespect to our common stock is incorporated herein by reference from Note 20 to our consolidated financialstatements in Item 8 of this Annual Report on Form 10-K.
As of February 22, 2010, there were 3,888 holders of record of FMC Technologies’ common stock. OnFebruary 22, 2010, the last reported sales price of our common stock on the New York Stock Exchange was$54.99.
We have not declared or paid cash dividends in 2009 or 2008, and we do not currently have a plan to pay cashdividends in the future.
On July 31, 2008, we spun-off our FoodTech and Airport Systems businesses, which are now known as JBT,through a tax-free dividend to our shareholders. We distributed 0.216 shares of JBT common stock for everyshare of our stock outstanding as of the close of business on July 22, 2008. We did not retain any shares of JBTcommon stock.
As of December 31, 2009, our securities authorized for issuance under equity compensation plans were asfollows:
Number of Securities to beIssued Upon Exercise ofOutstanding Options,Warrants and Rights
Weighted Average ExercisePrice of Outstanding Options,
Warrants and Rights
Number of SecuritiesRemaining Availablefor Future Issuance
under EquityCompensation Plans
Equity compensation plans approvedby security holders . . . . . . . . . . . . . . 499,611(1) $10.34 14,226,905(2)
Equity compensations plans notapproved by security holders . . . . . . — — —
Total . . . . . . . . . . . . . . . . . . . . . . . . . . . 499,611(1) $10.34 14,226,905(2)
(1) The table includes the number of shares that may be issued upon the exercise of outstanding options topurchase shares of FMC Technologies Common Stock under the Amended and Restated FMC TechnologiesIncentive Compensation and Stock Plan (the “Plan”). The table does not include shares of restricted stockthat have been awarded under the Plan but which have not yet vested.
(2) The table includes shares available for future issuance under the Plan, excluding the shares quantified in thefirst column. This number includes 2,875,578 shares available for issuance for nonvested stock awards thatvest after December 31, 2009.
We had no unregistered sales of equity securities during the three months ended December 31, 2009.
14

In 2005, we announced a repurchase plan approved by our Board of Directors authorizing the repurchase of up totwo million shares of our issued and outstanding common stock through open market purchases. The Board ofDirectors authorized extensions of this program, adding five million shares in February 2006 and eight millionshares in February 2007 for a total of 15 million shares of common stock authorized for repurchase. As a resultof the two-for-one stock split on August 31, 2007, the authorization was increased to 30 million shares. In July2008, in connection with the JBT spin-off, and as required by the Internal Revenue Service (“IRS”), the Board ofDirectors authorized the repurchase of $95.0 million of our outstanding common stock in addition to the30 million shares described above.
The following table summarizes repurchases of our common stock during the three months ended December 31,2009.
ISSUER PURCHASES OF EQUITY SECURITIES
Period
Total Numberof Shares
Purchased (a)Average Price Paid
per Share
Total Number ofShares Purchased as
Part of PubliclyAnnounced Plans or
Programs
MaximumNumber
of Shares thatmay yet bePurchased
under the Plansor Programs
(b)
October 1, 2009 – October 31, 2009 . . . . . . . . . 14,376 $51.95 8,916 5,781,743November 1, 2009 – November 30, 2009 . . . . . 440 $54.48 — 5,781,743December 1, 2009 – December 31, 2009 . . . . . . 371,897 $57.45 366,667 5,415,076
Total . . . . . . . . . . . . . . . . . . . . . . . . . . . . . . . . . . 386,713 $57.24 375,583 5,415,076
(a) Represents 375,583 shares of common stock repurchased and held in treasury and 11,130 shares of commonstock purchased and held in an employee benefit trust established for the FMC Technologies, Inc.Non-Qualified Savings and Investment Plan. In addition to these shares purchased on the open market, wesold 13,610 shares of registered common stock held in this trust, as directed by the beneficiaries during thethree months ended December 31, 2009.
(b) As of December 31, 2009, there were no remaining shares available for purchase under the July 2008 Boardof Directors authorization.
15

12/31/2004 12/31/2005 12/31/2006 12/31/2007 12/31/2008 12/31/2009$0.00
$50.00
$100.00
$150.00
$200.00
$250.00
$300.00
$350.00
$400.00
DO
LL
AR
SCOMPARISON OF 5-YEAR CUMULATIVE TOTAL RETURN
AMONG FMC TECHNOLOGIES, INC., S&P 500 INDEX AND PEERGROUP INDEX
S&P 500 IndexFMC Technologies, Inc. PHLX Oil Sector
ASSUMES $100 INVESTED ON DEC. 31, 2004ASSUMES DIVIDEND REINVESTED
FISCAL YEAR ENDING DEC. 31, 2009
The chart compares the percentage change in the cumulative stockholder return on our common stock against thecumulative total return of the Philadelphia Oil Service Sector Index (OSX) and the S&P Composite 500 StockIndex. The comparison is for a period beginning December 31, 2004 and ending December 31, 2009. The chartassumes the investment of $100 on December 31, 2004 and the reinvestment of all dividends, including thereinvestment of the JBT stock dividend paid to our shareholders on July 31, 2008.
2004 2005 2006 2007 2008 2009
FMC TECHNOLOGIES, INC. . . . . . . . . . . . . . . . . . . . . . . . . . . . . . . $100 $133 $191 $352 $156 $378OSX . . . . . . . . . . . . . . . . . . . . . . . . . . . . . . . . . . . . . . . . . . . . . . . . . . . $100 $150 $171 $251 $102 $164S&P 500 . . . . . . . . . . . . . . . . . . . . . . . . . . . . . . . . . . . . . . . . . . . . . . . $100 $105 $121 $128 $ 81 $102
16

ITEM 6. SELECTED FINANCIAL DATA
The following table sets forth selected financial data derived from our audited financial statements. Auditedfinancial statements for the years ended December 31, 2009, 2008 and 2007 and as of December 31, 2009 and2008 are included elsewhere in this report.
(In millions)Years Ended December 31 2009 2008 2007 2006 2005
Revenue:Energy Production Systems . . . . . . . . . . . . . . . . . . . . . . . $3,721.9 $3,670.7 $2,882.2 $2,249.5 $1,770.5Energy Processing Systems . . . . . . . . . . . . . . . . . . . . . . . . 698.4 883.2 767.7 672.3 521.8Other revenue and intercompany eliminations . . . . . . . . . (14.9) (3.0) (1.0) (6.4) (9.9)
Total revenue . . . . . . . . . . . . . . . . . . . . . . . . . . . . . . . . . . . $4,405.4 $4,550.9 $3,648.9 $2,915.4 $2,282.4
Cost of sales . . . . . . . . . . . . . . . . . . . . . . . . . . . . . . . . . . . $3,434.5 $3,623.1 $2,921.9 $2,370.0 $1,858.5Selling, general and administrative expense . . . . . . . . . . . 389.5 351.7 310.6 271.0 228.7Research and development expense . . . . . . . . . . . . . . . . . 51.3 45.3 40.8 33.0 29.2
Total costs and expenses . . . . . . . . . . . . . . . . . . . . . . . . . . 3,875.3 4,020.1 3,273.3 2,674.0 2,116.4Other income (expense), net . . . . . . . . . . . . . . . . . . . . . . . (2.7) (23.0) 29.9 (7.0) (6.3)
Income from continuing operations before net interestexpense and income taxes . . . . . . . . . . . . . . . . . . . . . . . 527.4 507.8 405.5 234.4 159.7
Net interest expense . . . . . . . . . . . . . . . . . . . . . . . . . . . . . (9.5) (1.5) (9.3) (6.7) (5.4)
Income from continuing operations before incometaxes . . . . . . . . . . . . . . . . . . . . . . . . . . . . . . . . . . . . . . . . 517.9 506.3 396.2 227.7 154.3
Provision for income taxes . . . . . . . . . . . . . . . . . . . . . . . . 155.1 152.0 134.5 62.7 56.9
Income from continuing operations . . . . . . . . . . . . . . . . . 362.8 354.3 261.7 165.0 97.4Income from discontinued operations, net of incometaxes . . . . . . . . . . . . . . . . . . . . . . . . . . . . . . . . . . . . . . . . 0.5 8.4 42.2 113.8 12.2
Net income . . . . . . . . . . . . . . . . . . . . . . . . . . . . . . . . . . . . 363.3 362.7 303.9 278.8 109.6Less: net income attributable to noncontrollinginterests . . . . . . . . . . . . . . . . . . . . . . . . . . . . . . . . . . . . . (1.5) (1.4) (1.1) (2.5) (3.5)
Net income attributable to FMC Technologies, Inc. . . . . . $ 361.8 $ 361.3 $ 302.8 $ 276.3 $ 106.1
(In millions, except per share data)Years Ended December 31 2009 2008 2007 2006 2005
Diluted earnings per share attributable to FMCTechnologies:
Income from continuing operations . . . . . . . . . . . . . . . . . $ 2.87 $ 2.72 $ 1.95 $ 1.16 $ 0.66Diluted earnings per share . . . . . . . . . . . . . . . . . . . . . . . . . $ 2.88 $ 2.78 $ 2.26 $ 1.97 $ 0.75Diluted weighted average shares outstanding . . . . . . . . . . 125.7 129.7 133.8 140.3 141.6Common stock price range:
High . . . . . . . . . . . . . . . . . . . . . . . . . . . . . . . . . . . . . . $ 58.84 $ 80.86 $ 66.86 $ 35.67 $ 21.89Low . . . . . . . . . . . . . . . . . . . . . . . . . . . . . . . . . . . . . . $ 23.79 $ 20.34 $ 27.76 $ 22.50 $ 14.53
Cash dividends declared . . . . . . . . . . . . . . . . . . . . . . . . . . $ — $ — $ — $ — $ —
17
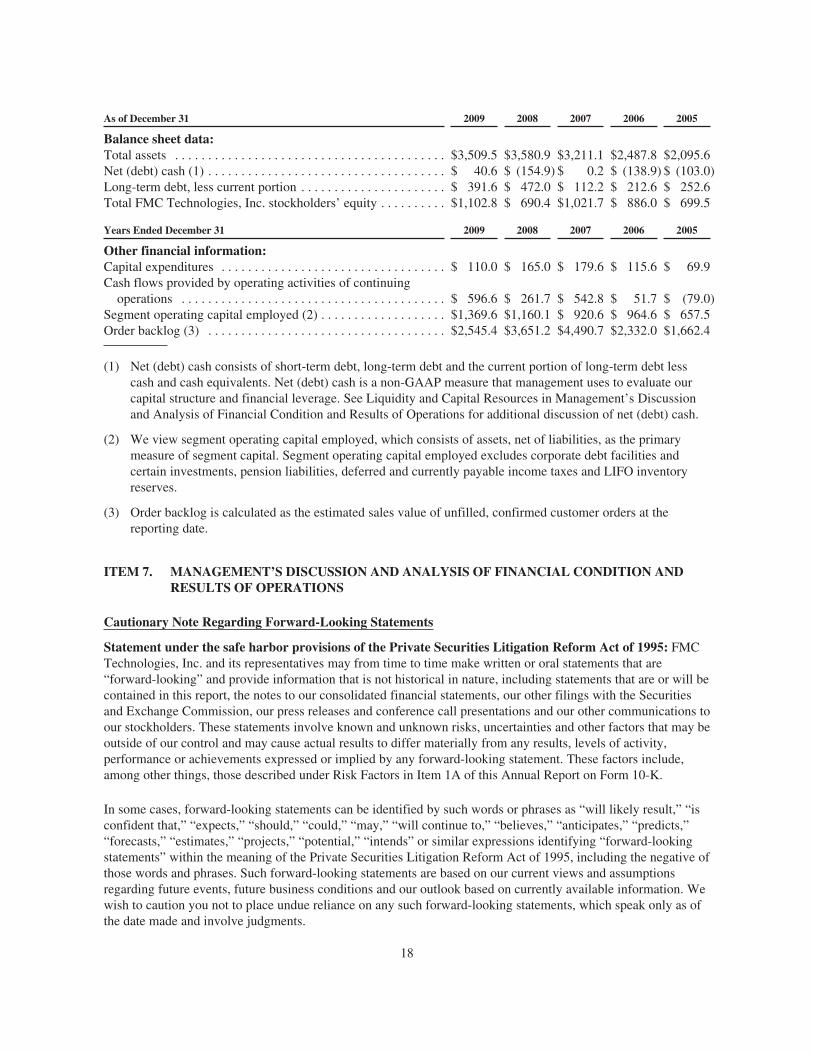
As of December 31 2009 2008 2007 2006 2005
Balance sheet data:Total assets . . . . . . . . . . . . . . . . . . . . . . . . . . . . . . . . . . . . . . . . . $3,509.5 $3,580.9 $3,211.1 $2,487.8 $2,095.6Net (debt) cash (1) . . . . . . . . . . . . . . . . . . . . . . . . . . . . . . . . . . . . $ 40.6 $ (154.9) $ 0.2 $ (138.9) $ (103.0)Long-term debt, less current portion . . . . . . . . . . . . . . . . . . . . . . $ 391.6 $ 472.0 $ 112.2 $ 212.6 $ 252.6Total FMC Technologies, Inc. stockholders’ equity . . . . . . . . . . $1,102.8 $ 690.4 $1,021.7 $ 886.0 $ 699.5
Years Ended December 31 2009 2008 2007 2006 2005
Other financial information:Capital expenditures . . . . . . . . . . . . . . . . . . . . . . . . . . . . . . . . . . $ 110.0 $ 165.0 $ 179.6 $ 115.6 $ 69.9Cash flows provided by operating activities of continuingoperations . . . . . . . . . . . . . . . . . . . . . . . . . . . . . . . . . . . . . . . . $ 596.6 $ 261.7 $ 542.8 $ 51.7 $ (79.0)
Segment operating capital employed (2) . . . . . . . . . . . . . . . . . . . $1,369.6 $1,160.1 $ 920.6 $ 964.6 $ 657.5Order backlog (3) . . . . . . . . . . . . . . . . . . . . . . . . . . . . . . . . . . . . $2,545.4 $3,651.2 $4,490.7 $2,332.0 $1,662.4
(1) Net (debt) cash consists of short-term debt, long-term debt and the current portion of long-term debt lesscash and cash equivalents. Net (debt) cash is a non-GAAP measure that management uses to evaluate ourcapital structure and financial leverage. See Liquidity and Capital Resources in Management’s Discussionand Analysis of Financial Condition and Results of Operations for additional discussion of net (debt) cash.
(2) We view segment operating capital employed, which consists of assets, net of liabilities, as the primarymeasure of segment capital. Segment operating capital employed excludes corporate debt facilities andcertain investments, pension liabilities, deferred and currently payable income taxes and LIFO inventoryreserves.
(3) Order backlog is calculated as the estimated sales value of unfilled, confirmed customer orders at thereporting date.
ITEM 7. MANAGEMENT’S DISCUSSION AND ANALYSIS OF FINANCIAL CONDITION ANDRESULTS OF OPERATIONS
Cautionary Note Regarding Forward-Looking Statements
Statement under the safe harbor provisions of the Private Securities Litigation Reform Act of 1995: FMCTechnologies, Inc. and its representatives may from time to time make written or oral statements that are“forward-looking” and provide information that is not historical in nature, including statements that are or will becontained in this report, the notes to our consolidated financial statements, our other filings with the Securitiesand Exchange Commission, our press releases and conference call presentations and our other communications toour stockholders. These statements involve known and unknown risks, uncertainties and other factors that may beoutside of our control and may cause actual results to differ materially from any results, levels of activity,performance or achievements expressed or implied by any forward-looking statement. These factors include,among other things, those described under Risk Factors in Item 1A of this Annual Report on Form 10-K.
In some cases, forward-looking statements can be identified by such words or phrases as “will likely result,” “isconfident that,” “expects,” “should,” “could,” “may,” “will continue to,” “believes,” “anticipates,” “predicts,”“forecasts,” “estimates,” “projects,” “potential,” “intends” or similar expressions identifying “forward-lookingstatements” within the meaning of the Private Securities Litigation Reform Act of 1995, including the negative ofthose words and phrases. Such forward-looking statements are based on our current views and assumptionsregarding future events, future business conditions and our outlook based on currently available information. Wewish to caution you not to place undue reliance on any such forward-looking statements, which speak only as ofthe date made and involve judgments.
18

Executive Overview
We design, manufacture and service sophisticated machinery and systems for customers in the energy industry.We have manufacturing operations worldwide strategically located to facilitate delivery of our products andservices to our customers. Our operations are aggregated into two reportable segments: Energy ProductionSystems and Energy Processing Systems. We focus on economic and industry-specific drivers and key riskfactors affecting our business segments as we formulate our strategic plans and make decisions related toallocating capital and human resources. The following discussion provides examples of the kinds of economicand industry factors and key risks that we consider.
The results of our businesses are primarily driven by changes in exploration and production spending by oil andgas companies, which in part depend upon current and anticipated future crude oil and natural gas demand,production volumes, and consequently prices. Our Energy Production Systems business is affected by trends inland and offshore oil and natural gas production, including shallow and deepwater development. Our EnergyProcessing Systems business results reflect spending by oilfield service companies and engineering constructioncompanies for equipment and systems that facilitate the flow, measurement and transportation of crude oil andnatural gas. We use crude oil and natural gas prices as an indicator of demand. While crude oil and natural gasprices have increased since their lows during early 2009, such prices are lower than they were during much of2008 and continue to experience volatility. The level of production activity worldwide influences spendingdecisions, and we use rig count as an additional indicator of demand.
We also focus on key risk factors when determining our overall strategy and making decisions for allocatingcapital. These factors include risks associated with the global economic outlook, product obsolescence, and thecompetitive environment. We address these risks in our business strategies, which incorporate continuingdevelopment of leading edge technologies, cultivating strong customer relationships, and growing our energybusiness.
In 2009, we expanded our portfolio of technology offerings through the acquisition of DDS and MPM to furtherenhance and strengthen our capabilities in the subsea processing market. DDS is a California-based manufacturerof high-performance permanent magnet motors and bearings for the oil and gas industry. MPM is a Norway-based manufacturer of high-performance multiphase flow meters.
We have developed close working relationships with our customers in our business segments. Our EnergyProduction Systems business results reflect our ability to build long-term alliances with oil and natural gascompanies that are actively engaged in offshore deepwater development, and to provide solutions for their needsin a timely and cost-effective manner. We have formed similar collaborative relationships with oilfield servicecompanies in Energy Processing Systems. We believe that by working closely with our customers we enhanceour competitive advantage, strengthen our market positions and improve our results.
As we evaluate our operating results, we view our business segments by product line and consider performanceindicators like segment revenue, operating profit and capital employed, in addition to the level of inbound ordersand order backlog. A significant and growing proportion of our revenues are recognized under the percentage ofcompletion method of accounting. Our payments for such arrangements are generally received according tomilestones achieved under stated contract terms. Consequently, the timing of revenue recognition is not alwayshighly correlated with the timing of customer payments. We may structure our contracts to receive advancepayments which we may use to fund engineering efforts and inventory purchases. Working capital (excludingcash) and net (debt) cash are therefore key performance indicators of cash flows.
On July 31, 2008, we spun-off our FoodTech and Airport Systems businesses, which are now known as JBT,through a tax-free dividend to our shareholders. The results of JBT have been reported as discontinued operationsfor all periods presented. For additional information related to the spin-off of JBT, see Note 3 to our consolidatedfinancial statements included in Item 8 of this Annual Report on Form 10-K.
19
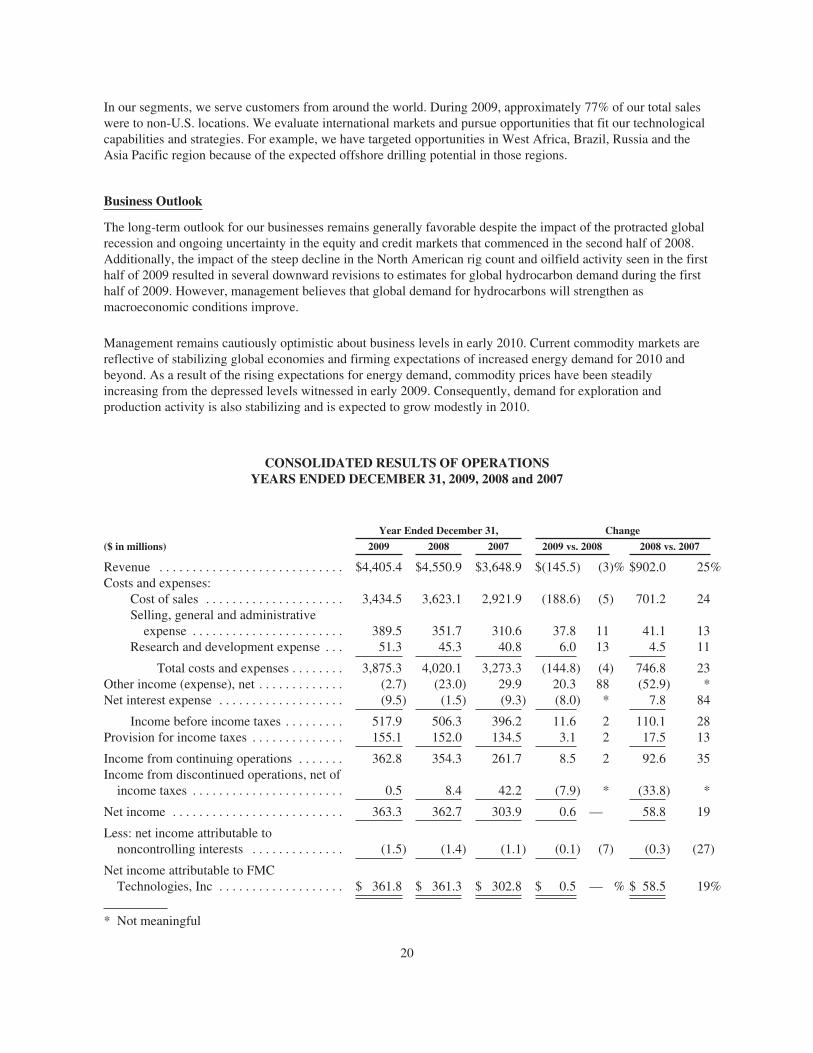
In our segments, we serve customers from around the world. During 2009, approximately 77% of our total saleswere to non-U.S. locations. We evaluate international markets and pursue opportunities that fit our technologicalcapabilities and strategies. For example, we have targeted opportunities in West Africa, Brazil, Russia and theAsia Pacific region because of the expected offshore drilling potential in those regions.
Business Outlook
The long-term outlook for our businesses remains generally favorable despite the impact of the protracted globalrecession and ongoing uncertainty in the equity and credit markets that commenced in the second half of 2008.Additionally, the impact of the steep decline in the North American rig count and oilfield activity seen in the firsthalf of 2009 resulted in several downward revisions to estimates for global hydrocarbon demand during the firsthalf of 2009. However, management believes that global demand for hydrocarbons will strengthen asmacroeconomic conditions improve.
Management remains cautiously optimistic about business levels in early 2010. Current commodity markets arereflective of stabilizing global economies and firming expectations of increased energy demand for 2010 andbeyond. As a result of the rising expectations for energy demand, commodity prices have been steadilyincreasing from the depressed levels witnessed in early 2009. Consequently, demand for exploration andproduction activity is also stabilizing and is expected to grow modestly in 2010.
CONSOLIDATED RESULTS OF OPERATIONSYEARS ENDED DECEMBER 31, 2009, 2008 and 2007
Year Ended December 31, Change
($ in millions) 2009 2008 2007 2009 vs. 2008 2008 vs. 2007
Revenue . . . . . . . . . . . . . . . . . . . . . . . . . . . . $4,405.4 $4,550.9 $3,648.9 $(145.5) (3)% $902.0 25%Costs and expenses:
Cost of sales . . . . . . . . . . . . . . . . . . . . . 3,434.5 3,623.1 2,921.9 (188.6) (5) 701.2 24Selling, general and administrativeexpense . . . . . . . . . . . . . . . . . . . . . . . 389.5 351.7 310.6 37.8 11 41.1 13
Research and development expense . . . 51.3 45.3 40.8 6.0 13 4.5 11
Total costs and expenses . . . . . . . . 3,875.3 4,020.1 3,273.3 (144.8) (4) 746.8 23Other income (expense), net . . . . . . . . . . . . . (2.7) (23.0) 29.9 20.3 88 (52.9) *Net interest expense . . . . . . . . . . . . . . . . . . . (9.5) (1.5) (9.3) (8.0) * 7.8 84
Income before income taxes . . . . . . . . . 517.9 506.3 396.2 11.6 2 110.1 28Provision for income taxes . . . . . . . . . . . . . . 155.1 152.0 134.5 3.1 2 17.5 13
Income from continuing operations . . . . . . . 362.8 354.3 261.7 8.5 2 92.6 35Income from discontinued operations, net ofincome taxes . . . . . . . . . . . . . . . . . . . . . . . 0.5 8.4 42.2 (7.9) * (33.8) *
Net income . . . . . . . . . . . . . . . . . . . . . . . . . . 363.3 362.7 303.9 0.6 — 58.8 19
Less: net income attributable tononcontrolling interests . . . . . . . . . . . . . . (1.5) (1.4) (1.1) (0.1) (7) (0.3) (27)
Net income attributable to FMCTechnologies, Inc . . . . . . . . . . . . . . . . . . . $ 361.8 $ 361.3 $ 302.8 $ 0.5 — % $ 58.5 19%
* Not meaningful
20

2009 Compared With 2008
Our total revenue for the year ended December 31, 2009, decreased by $145.5 million compared to the prioryear. Total revenue for 2009 included a $355.0 million unfavorable impact of foreign currency translation, ascompared to 2008. Excluding the impact of foreign currency translation, total revenue grew by $209.5 millionduring 2009, compared to the prior year, as a result of our Energy Production businesses. The revenue increasewas partially offset by a decline in Energy Processing revenue, largely driven by the weaker year-over-yearNorth American oilfield activity due to the deterioration of oil and gas prices in early 2009.
Gross profit (revenue less cost of sales) increased as a percentage of sales from 20.4% in 2008 to 22.0% in 2009.The margin improvement was largely attributable to a more profitable mix of projects in our subsea business, netof additional contract-related charges during 2009. On an absolute dollar basis, gross profit increased by $43.1million during the year ended December 31, 2009, as compared to the prior year. Excluding the impact of foreigncurrency translation, gross profit increased $100.4 million in 2009 as compared to 2008.
Selling, general and administrative (“SG&A”) expense increased as a percentage of sales from 7.7% in 2008 to8.8% in 2009. SG&A expense for 2009 included a $13.9 million favorable impact from foreign currencytranslation. The improvement in our common stock price and other investments held in an employee benefit trustfor our nonqualified deferred compensation plan resulted in $8.5 million of compensation expense in 2009,compared to a gain of $11.4 million in 2008. We also had increased pension expense of $11.4 million year-over-year as a result of lower plan asset performance during 2008. Additionally, we had increased spending in ourEnergy Production businesses due to increased bid activity for projects to be awarded in 2010.
We increased our research and development activities in 2009 as we continue to advance new technologies forsubsea processing capabilities.
Other income (expense), net, reflected non-operating losses of $6.3 million and $15.7 million on foreigncurrency exposures and derivative instruments, for which hedge accounting is not applied, for the years endedDecember 31, 2009 and 2008, respectively. Additionally, we recognized $3.5 million in gains during 2009,compared to $7.3 million in expense during 2008, associated with investments held in an employee benefit trustfor our non-qualified deferred compensation plan. Further discussion of our derivative instruments isincorporated herein by reference from Note 14 to our consolidated financial statements included in Item 8 of thisAnnual Report on Form 10-K.
Net interest expense was higher in 2009, primarily due to lower interest income in 2009, as compared to 2008,driven by lower yields on cash investments.
Our provision for income taxes reflected an effective tax rate of 30.0% in 2009. In 2008, our effective tax ratewas 30.1%. The decrease in the effective rate in 2009 is primarily related to a favorable change in country mix ofearnings, partially offset by a provision of U.S. tax on the earnings of certain foreign subsidiaries that we havedetermined are not indefinitely reinvested, an increase in the U.S. tax cost of deemed and actual dividends fromforeign subsidiaries, and an increased provision of U.S. tax on unrecognized tax benefits. The difference betweenthe effective tax rate and the statutory U.S. federal income tax rate related primarily to differing foreign and statetax rates and the impact of foreign earnings repatriation.
2008 Compared With 2007
Our total revenue for the year ended December 31, 2008, reflected growth in both business segments comparedto the prior year. Our Energy Production Systems businesses provided $788.5 million of the $902.0 millionincrease. We benefited from high demand for equipment and systems during 2007, especially subsea systems,used in major oil and gas producing regions throughout the world. The favorable market conditions during 2007
21

produced a strong backlog position at December 31, 2007, and subsequently, higher revenues for the year endedDecember 31, 2008, compared to the year ended December 31, 2007. Energy Processing Systems revenues grewby $115.5 million from the prior year largely reflecting continued infrastructure investment related to meteringsystems and coal-fired power generation.
Gross profit (revenue less cost of sales) increased $200.8 million, and as a percentage of sales from 19.9% in2007 to 20.4% in 2008. The increase was largely attributable to higher sales volume and to a lesser extent, highermargins in our Energy Production businesses, reflecting more complex subsea projects.
Selling, general and administrative (“SG&A”) expense for 2008 increased compared to 2007, but declined as apercentage of sales from 8.5% in 2007 to 7.7% in 2008 as we continued to leverage our SG&A spending. Themajority of our increased SG&A spending in 2008 was for Energy Production Systems relating to increased salesvolumes.
We increased our research and development activities in 2008 as we advanced new technologies for subseaprocessing capabilities.
Other income (expense), net, reflected non-operating losses of $15.7 million and gains of $27.9 million onforeign currency exposures and derivative instruments, for which hedge accounting was not applied, for the yearsended December 31, 2008 and 2007, respectively. Additionally, we had $7.3 million in compensation expenseduring 2008 associated with investments held in an employee benefit trust for our non-qualified deferredcompensation plan. Further discussion of our derivative instruments is incorporated herein by reference fromNote 14 to our consolidated financial statements included in Item 8 of this Annual Report on Form 10-K.
Net interest expense was lower in 2008, reflective of lower average debt levels and lower borrowing costs during2008.
Our provision for income taxes reflected an effective tax rate of 30.1% in 2008. In 2007, our effective tax ratewas 34.0%. The decrease in the effective tax rate was largely attributable to a favorable change in the countrymix of earnings, partially offset by an increase in U.S. tax cost of deemed and actual dividends from foreignsubsidiaries, and an increased provision of U.S. tax on unrecognized tax benefits. The difference between theeffective rate and the statutory U.S. federal income tax rate related primarily to differing foreign and state taxrates and the impact of foreign earnings repatriation.
Discontinued Operations
Income from discontinued operations, net of income taxes, for the year ended December 31, 2008, primarilyreflected $25.7 million, net of tax, in operating results of JBT for the seven months ended July 31, 2008, partiallyoffset by $17.8 million, net of tax, of expenses related to the spin-off of JBT. These expenses consist primarily ofnon-deductible legal, accounting and professional fees to complete activities associated with the spin-off.
Operating Results of Business Segments
Segment operating profit is defined as total segment revenue less segment operating expenses. The followingitems have been excluded in computing segment operating profit: corporate staff expense, interest income andexpense associated with corporate debt facilities and investments, income taxes and other expense, net.
22

The following table summarizes our operating results for the years ended December 31, 2009, 2008 and 2007:
Year Ended December 31, Favorable/(Unfavorable)
($ in millions) 2009 2008 2007 2009 vs. 2008 2008 vs. 2007
RevenueEnergy Production Systems . . . . . . . . . . . . . . . $3,721.9 $3,670.7 $2,882.2 $ 51.2 1 % $788.5 27%Energy Processing Systems . . . . . . . . . . . . . . . 698.4 883.2 767.7 (184.8) (21) 115.5 15Other revenue and intercompanyeliminations . . . . . . . . . . . . . . . . . . . . . . . . . (14.9) (3.0) (1.0) (11.9) * (2.0) *
Total revenue . . . . . . . . . . . . . . . . . . . . . . . . . . $4,405.4 $4,550.9 $3,648.9 $(145.5) (3)% $902.0 25%
Net incomeSegment operating profitEnergy Production Systems . . . . . . . . . . . . . . . $ 516.1 $ 420.7 $ 287.9 $ 95.4 23 % $132.8 46%Energy Processing Systems . . . . . . . . . . . . . . . 102.4 165.5 142.5 (63.1) (38) 23.0 16
Total segment operating profit . . . . . . . . . . . . . 618.5 586.2 430.4 32.3 6 155.8 36Corporate items:Corporate expense . . . . . . . . . . . . . . . . . . . . . . (35.4) (37.5) (35.1) 2.1 6 (2.4) (7)Other revenue and other (expense), net . . . . . . (57.2) (42.3) 9.1 (14.9) (35) (51.4) *Net interest expense . . . . . . . . . . . . . . . . . . . . . (9.5) (1.5) (9.3) (8.0) * 7.8 84
Total corporate items . . . . . . . . . . . . . . . . . . . . (102.1) (81.3) (35.3) (20.8) (26) (46.0) (130)
Income from continuing operations beforeincome taxes . . . . . . . . . . . . . . . . . . . . . . . . . 516.4 504.9 395.1 11.5 2 109.8 28
Provision for income taxes . . . . . . . . . . . . . . . . 155.1 152.0 134.5 (3.1) (2) (17.5) (13)
Income from continuing operations . . . . . . . . . 361.3 352.9 260.6 8.4 2 92.3 35Income from discontinued operations, net ofincome taxes . . . . . . . . . . . . . . . . . . . . . . . . . 0.5 8.4 42.2 (7.9) * (33.8) *
Net income attributable to FMC Technologies,Inc. . . . . . . . . . . . . . . . . . . . . . . . . . . . . . . . . $ 361.8 $ 361.3 $ 302.8 $ 0.5 — % $ 58.5 19%
* Not meaningful
We report our results of operations in U.S. dollars; however, our earnings are generated in a number of currenciesworldwide. We generate a significant amount of revenue, and incur a significant amount of costs, in NorwegianKrone, Brazilian Real, and the Euro, for example. The earnings of subsidiaries functioning in their localcurrencies are translated into U.S. dollars based upon the average exchange rate for the period, in order toprovide worldwide consolidated results. While the U.S. dollar results reported reflect the actual economics of theperiod reported upon, the variances from prior periods include the impact of translating earnings at differentrates.
A summary of the translation impact on our consolidated results follows:
(In millions)Year Ended
December 31, 2009Year Ended
December 31, 2008Year Ended
December 31, 2007
Revenue (decline) growth:Reported . . . . . . . . . . . . . . . . . . . . . . . . $(145.5) $902.0 $733.5Due to translation . . . . . . . . . . . . . . . . . $(355.0) $ 92.4 $225.8
Segment operating profit growth:Reported . . . . . . . . . . . . . . . . . . . . . . . . $ 32.3 $155.8 $138.3Due to translation . . . . . . . . . . . . . . . . . $ (41.8) $ 15.3 $ 17.9
23
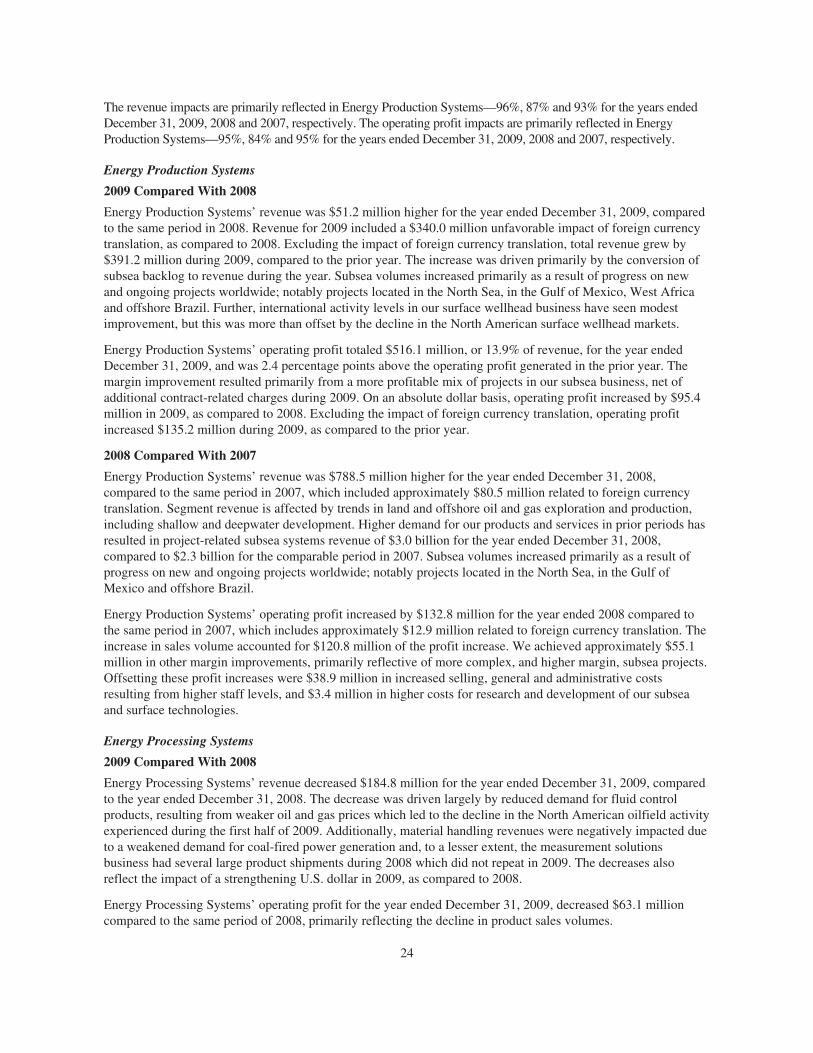
The revenue impacts are primarily reflected in Energy Production Systems—96%, 87% and 93% for the years endedDecember 31, 2009, 2008 and 2007, respectively. The operating profit impacts are primarily reflected in EnergyProduction Systems—95%, 84% and 95% for the years ended December 31, 2009, 2008 and 2007, respectively.
Energy Production Systems
2009 Compared With 2008
Energy Production Systems’ revenue was $51.2 million higher for the year ended December 31, 2009, comparedto the same period in 2008. Revenue for 2009 included a $340.0 million unfavorable impact of foreign currencytranslation, as compared to 2008. Excluding the impact of foreign currency translation, total revenue grew by$391.2 million during 2009, compared to the prior year. The increase was driven primarily by the conversion ofsubsea backlog to revenue during the year. Subsea volumes increased primarily as a result of progress on newand ongoing projects worldwide; notably projects located in the North Sea, in the Gulf of Mexico, West Africaand offshore Brazil. Further, international activity levels in our surface wellhead business have seen modestimprovement, but this was more than offset by the decline in the North American surface wellhead markets.
Energy Production Systems’ operating profit totaled $516.1 million, or 13.9% of revenue, for the year endedDecember 31, 2009, and was 2.4 percentage points above the operating profit generated in the prior year. Themargin improvement resulted primarily from a more profitable mix of projects in our subsea business, net ofadditional contract-related charges during 2009. On an absolute dollar basis, operating profit increased by $95.4million in 2009, as compared to 2008. Excluding the impact of foreign currency translation, operating profitincreased $135.2 million during 2009, as compared to the prior year.
2008 Compared With 2007
Energy Production Systems’ revenue was $788.5 million higher for the year ended December 31, 2008,compared to the same period in 2007, which included approximately $80.5 million related to foreign currencytranslation. Segment revenue is affected by trends in land and offshore oil and gas exploration and production,including shallow and deepwater development. Higher demand for our products and services in prior periods hasresulted in project-related subsea systems revenue of $3.0 billion for the year ended December 31, 2008,compared to $2.3 billion for the comparable period in 2007. Subsea volumes increased primarily as a result ofprogress on new and ongoing projects worldwide; notably projects located in the North Sea, in the Gulf ofMexico and offshore Brazil.
Energy Production Systems’ operating profit increased by $132.8 million for the year ended 2008 compared tothe same period in 2007, which includes approximately $12.9 million related to foreign currency translation. Theincrease in sales volume accounted for $120.8 million of the profit increase. We achieved approximately $55.1million in other margin improvements, primarily reflective of more complex, and higher margin, subsea projects.Offsetting these profit increases were $38.9 million in increased selling, general and administrative costsresulting from higher staff levels, and $3.4 million in higher costs for research and development of our subseaand surface technologies.
Energy Processing Systems
2009 Compared With 2008
Energy Processing Systems’ revenue decreased $184.8 million for the year ended December 31, 2009, comparedto the year ended December 31, 2008. The decrease was driven largely by reduced demand for fluid controlproducts, resulting from weaker oil and gas prices which led to the decline in the North American oilfield activityexperienced during the first half of 2009. Additionally, material handling revenues were negatively impacted dueto a weakened demand for coal-fired power generation and, to a lesser extent, the measurement solutionsbusiness had several large product shipments during 2008 which did not repeat in 2009. The decreases alsoreflect the impact of a strengthening U.S. dollar in 2009, as compared to 2008.
Energy Processing Systems’ operating profit for the year ended December 31, 2009, decreased $63.1 millioncompared to the same period of 2008, primarily reflecting the decline in product sales volumes.
24

2008 Compared With 2007
Energy Processing Systems’ revenue increased $115.5 million for the year ended December 31, 2008, comparedto the year ended December 31, 2007. The increase was driven primarily by higher volume in the measurementsolutions and material handling businesses, reflecting continued infrastructure investment related to meteringsystems and coal-fired power generation.
Energy Processing Systems’ operating profit for the year ended December 31, 2008, increased $23.0 millioncompared to the same period of 2007. Higher product sales volumes contributed $34.5 million of increasedoperating profit, primarily in the measurement solutions and material handling businesses, partially offset by anunfavorable product mix, increased headcount related selling and administrative costs, higher commissionexpense and higher research and development spending in support of improved sales volume.
Corporate Items
2009 Compared With 2008
Our corporate items reduced earnings by $102.1 million in 2009, compared to $81.3 million in 2008. Werecognized $5.0 million in expense during 2009, compared to $4.1 million in gains during 2008, associated withinvestments held in an employee benefit trust for our non-qualified deferred compensation plan. We also hadincreased pension expense of $8.6 million year-over-year as a result of lower plan asset performance during 2008and an $8.0 million increase in interest expense, net, primarily due to lower interest income in 2009, as comparedto 2008, driven by lower yields on cash investments. These costs were partially offset by favorable adjustmentsto our LIFO reserve of $5.3 million, attributable to lower inventory levels and lower cost indexes and a decreasein other corporate costs of $2.1 million resulting from cost containment efforts to align staffing with currentbusiness activities.
2008 Compared With 2007
Our corporate items reduced earnings by $81.3 million in 2008 compared to $35.3 million in 2007. The increasein expense in 2008 primarily reflected mark-to-market losses on foreign currency forward contracts of $8.7million in 2008, compared to gains in the prior year of $30.9 million, combined with increased stock-basedcompensation of $6.5 million and other corporate staff costs of $2.4 million. These costs were partially offset bya $7.8 million decrease in interest expense, net, attributable to reduced borrowing levels and lower interest ratesin 2008.
Inbound Orders and Order Backlog
Inbound orders represent the estimated sales value of confirmed customer orders received during the reportingperiod and the impact of translation on the previous year’s backlog. Backlog translation positively affected ordersby $363.3 million in the year ended December 31, 2009, and negatively affected orders by $593.1 million in thecomparable period of 2008.
Inbound OrdersYear Ended December 31,
(In millions) 2009 2008
Energy Production Systems . . . . . . . . . . . . . . . . . . . . . . . . . . . . . . . . . . . . . . $2,709.4 $2,853.2Energy Processing Systems . . . . . . . . . . . . . . . . . . . . . . . . . . . . . . . . . . . . . . . 606.4 865.9Intercompany eliminations . . . . . . . . . . . . . . . . . . . . . . . . . . . . . . . . . . . . . . . (16.9) (7.6)
Total inbound orders . . . . . . . . . . . . . . . . . . . . . . . . . . . . . . . . . . . . . . . . . . $3,298.9 $3,711.5
25

Order backlog is calculated as the estimated sales value of unfilled, confirmed customer orders at the reportingdate.
Order BacklogDecember 31,
(In millions) 2009 2008
Energy Production Systems . . . . . . . . . . . . . . . . . . . . . . . . . . . . . . . . . . . . . . . . . . . . $2,332.6 $3,345.0Energy Processing Systems . . . . . . . . . . . . . . . . . . . . . . . . . . . . . . . . . . . . . . . . . . . . . 221.1 313.2Intercompany eliminations . . . . . . . . . . . . . . . . . . . . . . . . . . . . . . . . . . . . . . . . . . . . . (8.3) (7.0)
Total order backlog . . . . . . . . . . . . . . . . . . . . . . . . . . . . . . . . . . . . . . . . . . . . . . . . . . $2,545.4 $3,651.2
Order backlog for Energy Productions Systems at December 31, 2009, decreased by $1.0 billion compared toyear-end 2008, as new orders in 2009 did not fully replace the prior year backlog that was converted into revenuein 2009. Lower inbound orders are the result of the weak global economic climate and some lingering uncertaintyregarding the recovery from the global economic recession and its impact on energy demand. Inbound orders areexpected to improve during the last half of 2010. Backlog of $2.3 billion at December 31, 2009, includes variousprojects for BP; Petrobras’ Cascade, Tambau and GLL-9; Shell’s Gumusut; Statoil’s Ormen Lange Phase II,Vega, Asgard, and Gjoa; Total’s Pazflor; Tullow’s Jubilee and Woodside’s Pluto subsea projects. We expect toconvert approximately 80% of December 31, 2009 backlog into revenue during 2010.
Order backlog for Energy Processing Systems at December 31, 2009, decreased by 29% compared to year-end2008, due largely from the drawdown on significant projects in the material handling and loading systemsbusinesses and decreased demand for fluid control products resulting from weaker oil and gas prices and loweryear-over-year North American oilfield activity during early 2009. We are beginning to see some recovery in theoil and gas markets, and consequently, we anticipate an increase in orders in 2010. However, there is still someuncertainty as to the stability of the recovery. We expect to convert approximately 70% of the December 31,2009 backlog into revenue during 2010.
Liquidity and Capital Resources
We generate our capital resources largely through operations and, when needed, through various credit facilities.
Our net cash at December 31, 2009, was $40.6 million, compared with net debt of $154.9 million atDecember 31, 2008. Net debt, or net cash, is a non-GAAP measure reflecting debt, net of cash and cashequivalents. Management uses this non-GAAP measure to evaluate our capital structure and financial leverage.We believe that net debt, or net cash, is a meaningful measure which will assist investors in understanding ourresults and recognizing underlying trends. This measure supplements disclosures required by GAAP. Thefollowing table provides details of the balance sheet classifications included in net debt.
(In millions)December 31,
2009December 31,
2008
Cash and cash equivalents . . . . . . . . . . . . . . . . . . . . . . . . . . . . . . . . . . . . . . . . . $ 460.7 $ 340.1Short-term debt and current portion of long-term debt . . . . . . . . . . . . . . . . . . . (28.5) (23.0)Long-term debt, less current portion . . . . . . . . . . . . . . . . . . . . . . . . . . . . . . . . . (391.6) (472.0)
Net cash (debt) . . . . . . . . . . . . . . . . . . . . . . . . . . . . . . . . . . . . . . . . . . . . . . $ 40.6 $(154.9)
The change in our net cash (debt) position reflects cash generated from operations, which more than offsetrepurchases of our common stock of $155.7 million, capital expenditures of $110.0 million, and payments foracquisitions of $162.6 million.
26

Cash flows for each of the years in the three-year period ended December 31, 2009, were as follows:
Year Ended December 31,
(In millions) 2009 2008 2007
Cash provided by operating activities of continuing operations . . . . . . . . . . . . . . . . $ 596.6 $ 261.7 $ 542.8Cash required by investing activities of continuing operations . . . . . . . . . . . . . . . . . (253.7) (282.9) (181.0)Cash provided (required) by financing activities . . . . . . . . . . . . . . . . . . . . . . . . . . . . (237.6) 252.7 (355.6)Cash provided (required) by discontinued operations . . . . . . . . . . . . . . . . . . . . . . . . (2.1) (15.8) 29.0Effect of exchange rate changes on cash and cash equivalents . . . . . . . . . . . . . . . . . 17.4 (5.1) 14.8
Increase (decrease) in cash and cash equivalents . . . . . . . . . . . . . . . . . . . . . . . . $ 120.6 $ 210.6 $ 50.0
Operating Cash Flows
During the year ended December 31, 2009, we generated $596.6 million in cash flows from operating activitiesof continuing operations, which represented a $334.9 million increase compared to the prior year. The year-over-year improvement is largely attributable to lower working capital investment associated with our portfolio ofprojects. Our working capital balances can vary significantly depending on the payment terms and timing ofdelivery on key contracts.
Our cash flows from operating activities in 2008 were $281.1 million lower than the prior year. The decrease isdue primarily to the higher investments in working capital resulting from required investments in accountsreceivable and inventory in the Energy Production segment.
Investing Cash Flows
Our cash requirements for investing activities of continuing operations were $253.7 million and $282.9 millionduring 2009 and 2008, respectively, primarily consisting of amounts to fund acquisitions and capitalexpenditures. Acquisition funding in 2009, which largely related to the purchase of DDS and MPM, resulted incash outflows, net of cash acquired of $120.2 million and $32.4 million, respectively. We spent $121.3 millionon investments in 2008, related primarily to our purchase of a 45% interest in Schilling Robotics, LLC. Capitalexpenditures, net of cash proceeds associated with certain asset and investment disposals, decreased year-over-year, reflecting lower spending on subsea capacity additions and offshore tooling and the completion ofintervention assets in early 2009 for Energy Production Systems.
Cash required by investing activities in 2007 was $181.0 million, primarily reflecting the investment in subseaintervention assets, offshore tooling and subsea capacity additions. Additionally, we spent $64.4 million foracquisitions, including $59.7 million for the purchase of the remaining interest in CDS Engineering BV, partiallyoffset by proceeds from the sale and leaseback of land and property in Houston, Texas.
Financing Cash Flows
Cash required by financing activities was $237.6 million in 2009, compared to cash provided of $252.7 millionfor 2008. We reduced our net borrowings by $80.2 million in 2009, compared to increased net borrowings of$369.4 million in 2008. Additionally, we received proceeds from JBT of $196.2 million in 2008, in conjunctionwith the spin-off of JBT. Cash was used for both years to repurchase common stock under our share repurchaseauthorization program.
Cash outflows in 2007 related primarily to the reduction in net borrowings of $98.4 million and the repurchase ofcommon stock under our share repurchase authorization program.
Discontinued Operations Cash Flows
We reported an immaterial amount of cash required by discontinued operations in 2009, related to the spin-off ofJBT which occurred in July 2008. Cash required by and provided by discontinued operations in 2008 and 2007,respectively, primarily reflected the operating and investing activities of JBT.
27
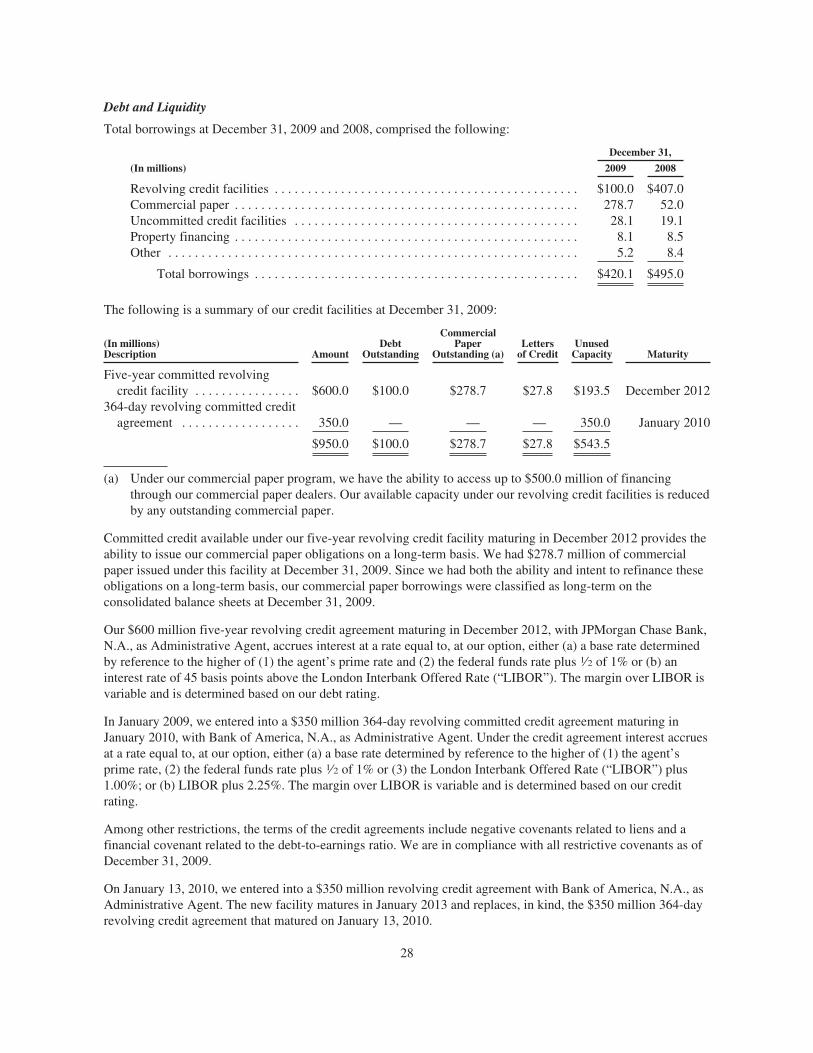
Debt and Liquidity
Total borrowings at December 31, 2009 and 2008, comprised the following:
December 31,
(In millions) 2009 2008
Revolving credit facilities . . . . . . . . . . . . . . . . . . . . . . . . . . . . . . . . . . . . . . . . . . . . . . $100.0 $407.0Commercial paper . . . . . . . . . . . . . . . . . . . . . . . . . . . . . . . . . . . . . . . . . . . . . . . . . . . . 278.7 52.0Uncommitted credit facilities . . . . . . . . . . . . . . . . . . . . . . . . . . . . . . . . . . . . . . . . . . . 28.1 19.1Property financing . . . . . . . . . . . . . . . . . . . . . . . . . . . . . . . . . . . . . . . . . . . . . . . . . . . . 8.1 8.5Other . . . . . . . . . . . . . . . . . . . . . . . . . . . . . . . . . . . . . . . . . . . . . . . . . . . . . . . . . . . . . . 5.2 8.4
Total borrowings . . . . . . . . . . . . . . . . . . . . . . . . . . . . . . . . . . . . . . . . . . . . . . . . . $420.1 $495.0
The following is a summary of our credit facilities at December 31, 2009:
(In millions)Description Amount
DebtOutstanding
CommercialPaper
Outstanding (a)Lettersof Credit
UnusedCapacity Maturity
Five-year committed revolvingcredit facility . . . . . . . . . . . . . . . . $600.0 $100.0 $278.7 $27.8 $193.5 December 2012
364-day revolving committed creditagreement . . . . . . . . . . . . . . . . . . 350.0 — — — 350.0 January 2010
$950.0 $100.0 $278.7 $27.8 $543.5
(a) Under our commercial paper program, we have the ability to access up to $500.0 million of financingthrough our commercial paper dealers. Our available capacity under our revolving credit facilities is reducedby any outstanding commercial paper.
Committed credit available under our five-year revolving credit facility maturing in December 2012 provides theability to issue our commercial paper obligations on a long-term basis. We had $278.7 million of commercialpaper issued under this facility at December 31, 2009. Since we had both the ability and intent to refinance theseobligations on a long-term basis, our commercial paper borrowings were classified as long-term on theconsolidated balance sheets at December 31, 2009.
Our $600 million five-year revolving credit agreement maturing in December 2012, with JPMorgan Chase Bank,N.A., as Administrative Agent, accrues interest at a rate equal to, at our option, either (a) a base rate determinedby reference to the higher of (1) the agent’s prime rate and (2) the federal funds rate plus 1⁄2 of 1% or (b) aninterest rate of 45 basis points above the London Interbank Offered Rate (“LIBOR”). The margin over LIBOR isvariable and is determined based on our debt rating.
In January 2009, we entered into a $350 million 364-day revolving committed credit agreement maturing inJanuary 2010, with Bank of America, N.A., as Administrative Agent. Under the credit agreement interest accruesat a rate equal to, at our option, either (a) a base rate determined by reference to the higher of (1) the agent’sprime rate, (2) the federal funds rate plus 1⁄2 of 1% or (3) the London Interbank Offered Rate (“LIBOR”) plus1.00%; or (b) LIBOR plus 2.25%. The margin over LIBOR is variable and is determined based on our creditrating.
Among other restrictions, the terms of the credit agreements include negative covenants related to liens and afinancial covenant related to the debt-to-earnings ratio. We are in compliance with all restrictive covenants as ofDecember 31, 2009.
On January 13, 2010, we entered into a $350 million revolving credit agreement with Bank of America, N.A., asAdministrative Agent. The new facility matures in January 2013 and replaces, in kind, the $350 million 364-dayrevolving credit agreement that matured on January 13, 2010.
28

Outlook for 2010
Historically, we have generated our capital resources primarily through operations and, when needed, throughcredit facilities. We continue to witness volatility in the credit, equity and commodity markets that began in2008. While this creates some degree of uncertainty for our business, management believes we have securedsufficient credit capacity to mitigate potential negative impacts on our operations. We expect to continue to meetour cash requirements with a combination of cash on hand, cash generated from operations and our creditfacilities.
We are projecting to spend approximately $140.0 million during 2010 for capital expenditures, largely forenhancements to our manufacturing and service capabilities. We anticipate contributing approximately $14.5million to our pension plans in 2010. Further, we expect to continue our stock repurchases authorized by ourBoard, with the timing and amounts of these repurchases dependent upon market conditions and liquidity.
We have $543.5 million in capacity available under our bank lines that we expect to utilize if working capitaltemporarily increases in response to market demand, and when opportunities for business acquisitions meet ourstandards. Our intent is to maintain a level of financing sufficient to meet this objective. We continue to evaluateacquisitions, divestitures and joint ventures in the ordinary course of business.
Contractual Obligations and Off-Balance Sheet Arrangements
The following is a summary of our contractual obligations at December 31, 2009:
Payments Due by Period
(In millions)Contractual obligations
Totalpayments
Less than1 year
1-3years
3 -5years
After 5years
Long-term debt (a) . . . . . . . . . . . . . . . . . . . . . . . . . . . . . . . . . . . . $ 392.0 $ 0.4 $385.3 $ — $ 6.3Short-term debt . . . . . . . . . . . . . . . . . . . . . . . . . . . . . . . . . . . . . . . 28.1 28.1 — — —Operating leases . . . . . . . . . . . . . . . . . . . . . . . . . . . . . . . . . . . . . . 405.8 57.0 95.2 75.4 178.2Unconditional purchase obligations (b) . . . . . . . . . . . . . . . . . . . . 593.3 568.0 25.3 — —Pension and other postretirement benefits (c) . . . . . . . . . . . . . . . . 14.5 14.5 — — —Unrecognized tax benefits (d) . . . . . . . . . . . . . . . . . . . . . . . . . . . . 5.3 5.3 — — —
Total contractual obligations . . . . . . . . . . . . . . . . . . . . . . . . . $1,439.0 $673.3 $505.8 $75.4 $184.5
(a) Our available long-term debt is dependent upon our compliance with covenants, including negativecovenants related to liens, and a financial covenant related to the debt-to-earnings ratio. Any violation ofcovenants or other events of default, which are not waived or cured, or changes in our credit rating couldhave a material impact on our ability to maintain our committed financing arrangements.
Interest on long-term debt is not included in the table. As of December 31, 2009, we have commercial paperborrowings with short-term maturities that we have both the ability and intent to refinance on a long-termbasis. However, we are uncertain as to the level of commercial paper or other borrowings and marketinterest rates that will be applicable throughout 2010. During 2009, we paid $10.4 million for interestexpense.
(b) In the normal course of business, we enter into agreements with our suppliers to purchase raw materials orservices. These agreements include a requirement that our supplier provide products or services to ourspecifications and require us to make a firm purchase commitment to our supplier. As substantially all ofthese commitments are associated with purchases made to fulfill our customers’ orders, the costs associatedwith these agreements will ultimately be reflected in cost of sales on our consolidated statements of income.
(c) We expect to make $14.5 million in contributions to our pension and other postretirement benefit plansduring 2010. This amount does not include discretionary contributions to our U.S. qualified pension plan.Required contributions for future years depend on factors that cannot be determined at this time.
29

(d) As of December 31, 2009, we have a liability for unrecognized tax benefits of $41.2 million. It is reasonablypossible that $5.3 million of the liability will be settled during 2010, and this amount is reflected in incometaxes payable in our consolidated balance sheet as of December 31, 2009. Due to the high degree ofuncertainty regarding the timing of potential future cash flows associated with the remaining $35.9 millionin liabilities, we are unable to make a reasonable estimate of the period in which such liabilities might bepaid.
The following is a summary of other off-balance sheet arrangements at December 31, 2009:
Amount of Commitment Expiration per Period
(In millions)Other off-balance sheet arrangements
Totalamount
Less than1 year
1-3years
3-5years
After 5years
Letters of credit and bank guarantees . . . . . . . . . . . . . . . . . . . . . . . . $569.1 $208.2 $221.6 $58.2 $81.1Surety bonds . . . . . . . . . . . . . . . . . . . . . . . . . . . . . . . . . . . . . . . . . . . 62.5 46.9 15.6 — —
Total other off-balance sheet arrangements . . . . . . . . . . . . . . . . . . . $631.6 $255.1 $237.2 $58.2 $81.1
As collateral for our performance on certain sales contracts or as part of our agreements with insurancecompanies, we are contingently liable under letters of credit, surety bonds and other bank guarantees. In order toobtain these financial instruments, we pay fees to various financial institutions in amounts competitivelydetermined in the marketplace. Our ability to generate revenue from certain contracts is dependent upon ourability to obtain these off-balance sheet financial instruments. These off-balance sheet financial instruments maybe renewed, revised or released based on changes in the underlying commitment. Historically, our commercialcommitments have not been drawn upon to a material extent; consequently, management believes it is not likelythat there will be claims against these commitments that will have a negative impact on our key financial ratiosor our ability to obtain financing.
In connection with the spin-off of JBT, we retained liability for various contingent obligations totaling $12.8million at December 31, 2009. Contingent obligations include guarantees on certain performance bonds issued byJBT. We are fully indemnified by JBT pursuant to the terms and conditions of the Separation and DistributionAgreement, dated July 31, 2008, between FMC Technologies and JBT. Management does not expect any of thesefinancial instruments to result in losses that if incurred, would have a material effect on our consolidatedfinancial position, results of operations or cash flows. The majority of these obligations will expire before the endof 2012.
Qualitative and Quantitative Disclosures about Market Risk
We are subject to financial market risks, including fluctuations in foreign currency exchange rates and interestrates. In order to manage and mitigate our exposure to these risks, we may use derivative financial instruments inaccordance with established policies and procedures. We do not use derivative financial instruments where theobjective is to generate profits solely from trading activities. At December 31, 2009 and 2008 our derivativeholdings consisted of foreign currency forward contracts and foreign currency instruments embedded in purchaseand sale contracts. At December 31, 2009, our derivative portfolio also held interest rate swap agreements.
These forward-looking disclosures only address potential impacts from market risks as they affect our financialinstruments. They do not include other potential effects which could impact our business as a result of changes inforeign currency exchange rates, interest rates, commodity prices or equity prices.
Foreign Currency Exchange Rate Risk
We conduct operations around the world in a number of different currencies. Most of our significant foreignsubsidiaries have designated the local currency as their functional currency. Our earnings are therefore subject tochange due to fluctuations in foreign currency exchange rates when the earnings in foreign currencies aretranslated into U.S. Dollars. We do not hedge these fluctuations in earnings. A 10% increase or decrease in theaverage exchange rates of all foreign currencies in 2009 would have changed our revenue and income fromcontinuing operations by approximately 5% and 4%, respectively.
30

When transactions are denominated in currencies other than our subsidiaries respective functional currencies, wemanage these exposures through the use of derivative instruments to mitigate our risk. We use foreign currencyforward contracts to hedge the foreign currency fluctuation associated with firmly committed and forecastedforeign currency denominated payments and receipts. The derivative instruments are designated and qualify ascash flow hedges, and as such their gains and losses are recorded in other comprehensive income until such timethat the underlying transactions are recognized. When a forecasted transaction in a currency other than thefunctional currency of an entity is recognized as an asset or liability on the balance sheet, we also hedge theforeign currency fluctuation with derivative instruments after netting our exposures worldwide. These derivativeinstruments do not qualify as cash flow hedges.
Occasionally, we enter into contracts or other arrangements that are subject to foreign exchange fluctuations thatqualify as embedded derivative instruments. In those situations, we enter into derivative foreign exchangecontracts that hedge the price fluctuations due to movements in the foreign exchange rates. These hedges are nottreated as cash flow hedges.
We have prepared a sensitivity analysis of our foreign currency forward contracts hedging anticipatedtransactions that are accounted for as cash flow hedges. This analysis assumes that each foreign currency ratewould change 10% against a stronger and then weaker U.S. Dollar. A 10% increase in the value of theU.S. Dollar would result in a loss of $50.0 million in the net fair value of cash flow hedges reflected on ourbalance sheet at December 31, 2009. Changes in the derivative fair value will not have an immediate impact onour results of operations since their gains and losses are recorded in other comprehensive income unless thesecontracts are deemed to be ineffective. When the anticipated transactions occur, these changes in value ofderivatives instrument positions will be offset against changes in the value of the underlying transaction.
Interest Rate Risk
Our debt instruments subject us to market risk associated with movements in interest rates. In March 2009, weentered into three floating-to-fixed interest rate swaps hedging interest payments on $100.0 million of ourvariable rate revolving debt. The effect of these interest rate swaps is to fix the effective annual interest rate onthese borrowings at an average rate of 2.1%.
We use a sensitivity analysis to measure the impact on fair values (for interest rate swaps) of an immediateadverse movement in the interest rates of 50 basis points. This analysis was based on a modeling technique thatmeasures the hypothetical market value resulting from a 50 basis point change in interest rates. This adversechange in the applicable interest rates would result in a decrease of $1.8 million in the net fair value of ourinterest rate swaps at December 31, 2009.
At December 31, 2009 we had unhedged variable rate debt of $307.0 million. Using sensitivity analysis tomeasure the impact of a 10% adverse movement in the interest rate, or 12 basis points, would result in animmaterial increase to interest expense.
We assess effectiveness of forward foreign currency contracts designated as cash flow hedges based on changesin fair value attributable to changes in spot rates. We exclude the impact attributable to changes in the differencebetween the spot rate and the forward rate for the assessment of hedge effectiveness, and recognize the change infair value of this component immediately in earnings. The difference between the spot rate and the forward rateis generally related to the differences in the interest rates of the countries of the currencies being traded.Consequently, we have exposure to relative changes in interest rates between countries in our results ofoperations. To the extent the U.S. interest rate decreases by 10%, or 12 basis points, and other countries interestrates remain fixed, we would expect to recognize an increase of $0.3 million in earnings in the period of change.Based on our portfolio as of December 31, 2009, we have exposure to the interest rates in the U.S., Brazil, theUnited Kingdom, Australia, the European Community and Norway.
Critical Accounting Estimates
We prepare our consolidated financial statements in conformity with United States generally accepted accountingprinciples. As such, we are required to make certain estimates, judgments and assumptions about matters that are
31

inherently uncertain. On an ongoing basis, our management re-evaluates these estimates, judgments andassumptions for reasonableness because of the critical impact that these factors have on the reported amounts ofassets and liabilities at the dates of the financial statements and the reported amounts of revenues and expensesduring the periods presented. Management has discussed the development and selection of these criticalaccounting estimates with the Audit Committee of our Board of Directors and the Audit Committee has reviewedthis disclosure. We believe that the following are the critical accounting estimates used in preparing our financialstatements.
Percentage of Completion Method of Accounting
We record revenue on construction-type manufacturing projects using the percentage of completion method,where revenue is recorded as work progresses on each contract. There are several acceptable methods ofmeasuring progress toward completion. Most frequently, we use the ratio of costs incurred to date to totalestimated contract costs at completion to measure this progress.
We execute contracts with our customers that clearly describe the equipment, systems and/or services that wewill provide and the amount of consideration we will receive. After analyzing the drawings and specifications ofthe contract requirements, our project engineers estimate total contract costs based on their experience withsimilar projects and then adjust these estimates for specific risks associated with each project, such as technicalrisks associated with a new design. Costs associated with specific risks are estimated by assessing the probabilitythat conditions will arise that will affect our total cost to complete the project. After work on a project begins,assumptions that form the basis for our calculation of total project cost are examined on a monthly basis and ourestimates are updated to reflect new information as it becomes available.
Revenue recorded using the percentage of completion method amounted to $2,731.3 million, $2,999.9 millionand $1,890.7 million for the years ended December 31, 2009, 2008 and 2007, respectively.
A significant portion of our total revenue recorded under the percentage of completion method relates to theEnergy Production Systems business segment, primarily for subsea petroleum exploration equipment projectsthat involve the design, engineering, manufacturing and assembly of complex, customer-specific systems. Thesystems are not entirely built from standard bills of material and typically require extended periods of time todesign and construct.
Total estimated contract cost affects both the revenue recognized in a period as well as the reported profit or losson a project. The determination of profit or loss on a contract requires consideration of contract revenue, changeorders and claims, less costs incurred to date and estimated costs to complete. Anticipated losses on contracts arerecorded in full in the period in which they are identified. Profits are recorded based on the estimated projectprofit multiplied by the percentage complete.
The total estimated contract cost in percentage of completion accounting is a critical accounting estimate becauseit can materially affect revenue and cost of sales, and it requires us to make judgments about matters that areuncertain. There are many factors, including but not limited to resource price inflation, labor availability,productivity and weather, that can affect the accuracy of our cost estimates and ultimately our future profitability.In the past, we have realized both lower and higher than expected margins and have incurred losses as a result ofunforeseen changes in our project costs.
The amount of revenue recognized using the percentage of completion method is sensitive to our changes inestimates of total contract costs. If we had used a different estimate of total contract costs for each contract inprogress at December 31, 2009, a 1% increase or decrease in the estimated margin earned on each contract wouldhave increased or decreased total revenue and pre-tax income for the year ended December 31, 2009 by $36.4million.
Inventory Valuation
Inventory is recorded at the lower of cost or net realizable value. In order to determine net realizable value, weevaluate each component of inventory on a regular basis to determine whether it is excess or obsolete. We record
32

the decline in the carrying value of estimated excess or obsolete inventory as a reduction of inventory and as anexpense included in cost of sales in the period in which it is identified. Our estimate of excess and obsoleteinventory is a critical accounting estimate because it is highly susceptible to change from period to period. Inaddition, it requires management to make judgments about the future demand for inventory.
In order to quantify excess or obsolete inventory, we begin by preparing a candidate listing of the components ofinventory that have a quantity on hand in excess of usage within the most recent two-year period. This list is thenreviewed with sales, engineering, production and materials management personnel to determine whether this list ofpotential excess or obsolete inventory items is accurate. Management considers as part of this evaluation whetherthere has been a change in the market for finished goods, whether there will be future demand for on-hand inventoryitems and whether there are components of inventory that incorporate obsolete technology. As a result, our estimateof excess or obsolete inventory is sensitive to changes in assumptions about future usage of the inventory.
Impairment of Long-Lived and Intangible Assets
Long-lived assets, including property, plant and equipment, identifiable intangible assets being amortized andcapitalized software costs are reviewed for impairment whenever events or changes in circumstances indicatethat the carrying amount of the long-lived asset may not be recoverable. The carrying amount of a long-livedasset is not recoverable if it exceeds the sum of the undiscounted cash flows expected to result from the use andeventual disposition of the asset. The determination of future cash flows as well as the estimated fair value oflong-lived assets involves significant estimates on the part of our management. If it is determined that animpairment loss has occurred, the loss is measured as the amount by which the carrying amount of the long-livedasset exceeds its fair value.
Goodwill and Other Intangible Assets
We record the excess of purchase price over fair value of the tangible and the identifiable intangible assetsacquired as goodwill. Goodwill is not subject to amortization but is tested for impairment on an annual basis (ormore frequently if impairment indicators arise). We have established October 31 as the date of our annual test forimpairment of goodwill. Impairment losses are calculated at the reporting unit level, and represent the excess ofthe carrying value of reporting unit goodwill over its implied fair value. The implied fair value of goodwill isdetermined by a two-step process. The first compares the fair value of the reporting unit (measured as the presentvalue of expected future cash flows) to its carrying amount. The determination of the fair value of a reportingunit is a matter of judgment and often involves the use of significant estimates and assumptions. If the fair valueof the reporting unit is less than its carrying amount, a second step is performed. In this step, the fair value of thereporting unit is allocated to its assets and liabilities to determine the implied fair value of goodwill, which isused to measure the impairment loss. We have not recognized any impairment for the years ended December 31,2009 or 2008, as the fair values of our reporting units with goodwill balances exceed our carrying amounts. Inaddition, there were no negative conditions, or triggering events, that occurred in 2009 or 2008 requiring us toperform additional impairment reviews.
Accounting for Income Taxes
Our income tax expense, deferred tax assets and liabilities, and reserves for uncertain tax positions reflectmanagement’s best assessment of estimated future taxes to be paid. We are subject to income taxes in the U.S.and numerous foreign jurisdictions. Significant judgments and estimates are required in determining ourconsolidated income tax expense.
In determining our current income tax provision, we assess temporary differences resulting from differingtreatments of items for tax and accounting purposes. These differences result in deferred tax assets and liabilities,which are recorded in our consolidated balance sheets. When we maintain deferred tax assets, we must assess thelikelihood that these assets will be recovered through adjustments to future taxable income. To the extent webelieve recovery is not likely, we establish a valuation allowance. We record an allowance reducing the asset to a
33
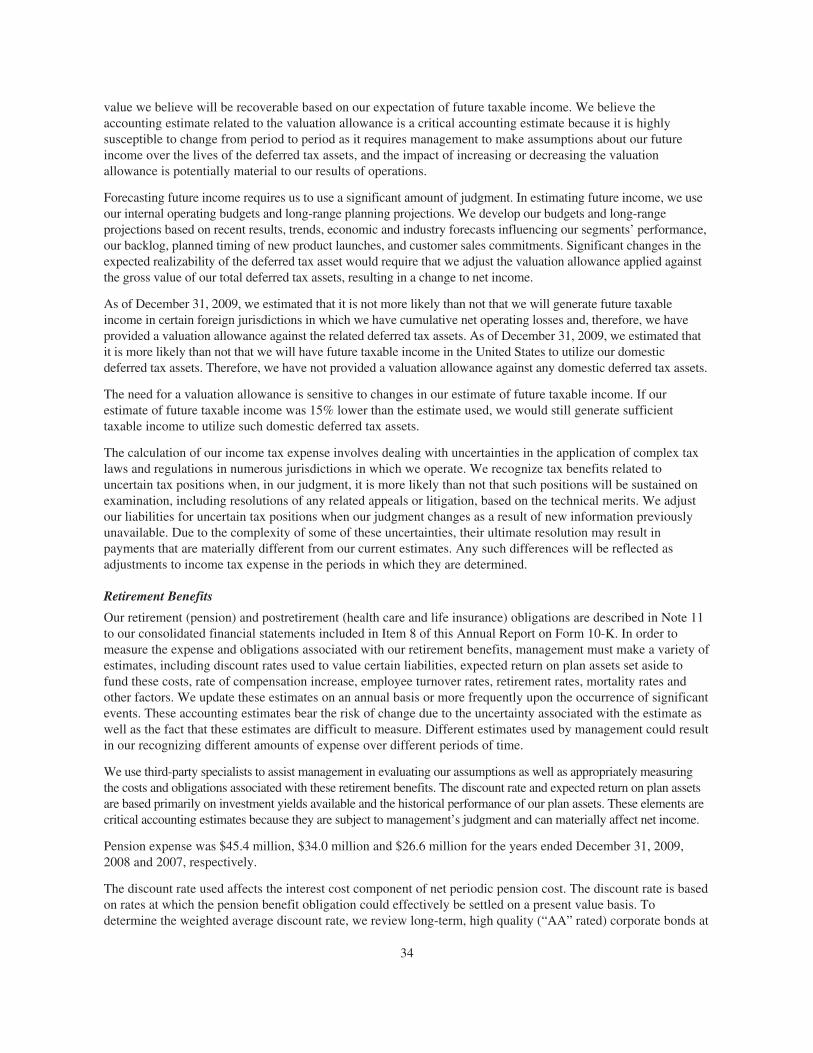
value we believe will be recoverable based on our expectation of future taxable income. We believe theaccounting estimate related to the valuation allowance is a critical accounting estimate because it is highlysusceptible to change from period to period as it requires management to make assumptions about our futureincome over the lives of the deferred tax assets, and the impact of increasing or decreasing the valuationallowance is potentially material to our results of operations.
Forecasting future income requires us to use a significant amount of judgment. In estimating future income, we useour internal operating budgets and long-range planning projections. We develop our budgets and long-rangeprojections based on recent results, trends, economic and industry forecasts influencing our segments’ performance,our backlog, planned timing of new product launches, and customer sales commitments. Significant changes in theexpected realizability of the deferred tax asset would require that we adjust the valuation allowance applied againstthe gross value of our total deferred tax assets, resulting in a change to net income.
As of December 31, 2009, we estimated that it is not more likely than not that we will generate future taxableincome in certain foreign jurisdictions in which we have cumulative net operating losses and, therefore, we haveprovided a valuation allowance against the related deferred tax assets. As of December 31, 2009, we estimated thatit is more likely than not that we will have future taxable income in the United States to utilize our domesticdeferred tax assets. Therefore, we have not provided a valuation allowance against any domestic deferred tax assets.
The need for a valuation allowance is sensitive to changes in our estimate of future taxable income. If ourestimate of future taxable income was 15% lower than the estimate used, we would still generate sufficienttaxable income to utilize such domestic deferred tax assets.
The calculation of our income tax expense involves dealing with uncertainties in the application of complex taxlaws and regulations in numerous jurisdictions in which we operate. We recognize tax benefits related touncertain tax positions when, in our judgment, it is more likely than not that such positions will be sustained onexamination, including resolutions of any related appeals or litigation, based on the technical merits. We adjustour liabilities for uncertain tax positions when our judgment changes as a result of new information previouslyunavailable. Due to the complexity of some of these uncertainties, their ultimate resolution may result inpayments that are materially different from our current estimates. Any such differences will be reflected asadjustments to income tax expense in the periods in which they are determined.
Retirement Benefits
Our retirement (pension) and postretirement (health care and life insurance) obligations are described in Note 11to our consolidated financial statements included in Item 8 of this Annual Report on Form 10-K. In order tomeasure the expense and obligations associated with our retirement benefits, management must make a variety ofestimates, including discount rates used to value certain liabilities, expected return on plan assets set aside tofund these costs, rate of compensation increase, employee turnover rates, retirement rates, mortality rates andother factors. We update these estimates on an annual basis or more frequently upon the occurrence of significantevents. These accounting estimates bear the risk of change due to the uncertainty associated with the estimate aswell as the fact that these estimates are difficult to measure. Different estimates used by management could resultin our recognizing different amounts of expense over different periods of time.
We use third-party specialists to assist management in evaluating our assumptions as well as appropriately measuringthe costs and obligations associated with these retirement benefits. The discount rate and expected return on plan assetsare based primarily on investment yields available and the historical performance of our plan assets. These elements arecritical accounting estimates because they are subject to management’s judgment and can materially affect net income.
Pension expense was $45.4 million, $34.0 million and $26.6 million for the years ended December 31, 2009,2008 and 2007, respectively.
The discount rate used affects the interest cost component of net periodic pension cost. The discount rate is basedon rates at which the pension benefit obligation could effectively be settled on a present value basis. Todetermine the weighted average discount rate, we review long-term, high quality (“AA” rated) corporate bonds at
34

our determination date and use a model that matches the projected benefit payments for our plans to coupons andmaturities from high quality bonds. Significant changes in the discount rate, such as those caused by changes inthe yield curve, the mix of bonds available in the market, the duration of selected bonds, and the timing ofexpected benefit payments may result in volatility in pension expense and pension liabilities. The weightedaverage discount rate used to compute net periodic benefit cost decreased from 6.02% in 2008 to 5.92% in 2009.
Our pension expense is sensitive to changes in our estimate of discount rate. Holding other assumptions constant,for a 50 basis point reduction in the discount rate, annual pension expense would increase by approximately $6.7million before taxes. Holding other assumptions constant, for a 50 basis point increase in the discount rate,annual pension expense would decrease by approximately $6.3 million before taxes.
Net periodic pension cost includes an underlying expected long-term rate of asset return. Our estimate of the expectedrate of return on plan assets is based primarily on the historical performance of plan assets, current market conditions,our asset allocation and long-term growth expectations. We assumed a weighted average expected rate of return for ourpension plans of 8.35% and 8.21% in 2009 and 2008, respectively. The expected return on plan assets is recognized aspart of the net periodic pension cost. The difference between the expected return and the actual return on plan assets isamortized over the expected remaining service life of employees, so there is a lag time between the market’sperformance and its impact on plan results. Holding other assumptions constant, an increase of 50 basis points in theexpected rate of return on plan assets would decrease annual pension expense by approximately $3.0 million beforetaxes. Holding other assumptions constant, a decrease of 50 basis points in the expected rate of return on plan assetswould increase annual pension expense by approximately $2.8 million before taxes.
Recently Issued Accounting Standards
In October 2009, the Financial Accounting Standards Board (“FASB”) issued an update to existing guidance onrevenue recognition for arrangements with multiple deliverables. This update will allow companies to allocateconsideration received for qualified separate deliverables based on estimated selling price for both delivered andundelivered items when vendor-specific or third-party evidence is unavailable. Additionally, disclosure of thenature of multiple element arrangements, the types of deliverables under the arrangements, the general timing oftheir delivery, and significant factors and estimates used to determine estimated selling prices are required. Wewill adopt this update for new revenue arrangements entered into or materially modified beginning January 1,2011. We are currently evaluating the provisions of the update and have not yet determined the impact, if any, onour consolidated financial statements.
In June 2009, the FASB issued a new accounting standard which provides amendments to previous guidance onthe consolidation of variable interest entities. This standard clarifies the characteristics that identify a variableinterest entity (“VIE”) and changes how a reporting entity identifies a primary beneficiary that would consolidatethe VIE from a quantitative risk and rewards calculation to a qualitative approach based on which variableinterest holder has controlling financial interest and the ability to direct the most significant activities that impactthe VIE’s economic performance. This statement requires the primary beneficiary assessment to be performed ona continuous basis. It also requires additional disclosures about an entity’s involvement with a VIE, restrictionson the VIE’s assets and liabilities that are included in the reporting entity’s consolidated balance sheet,significant risk exposures due to the entity’s involvement with the VIE, and how its involvement with a VIEimpacts the reporting entity’s consolidated financial statements. The standard is effective for fiscal yearsbeginning after November 15, 2009. We will adopt the standard on January 1, 2010 and have not yet determinedthe impact on our consolidated financial statements.
Management believes that other recently issued accounting standards, which are not yet effective, will not have amaterial impact on our consolidated financial statements upon adoption.
ITEM 7A. QUALITATIVE AND QUANTITATIVE DISCLOSURES ABOUTMARKET RISK
Information regarding market risks is incorporated herein by reference from the section entitled “Qualitative andQuantitative Disclosures about Market Risk” in Item 7 of this Annual Report on Form 10-K.
35

ITEM 8. FINANCIAL STATEMENTS AND SUPPLEMENTARY DATA
REPORT OF INDEPENDENT REGISTERED PUBLIC ACCOUNTING FIRM
The Board of Directors and Stockholders of FMC Technologies, Inc.:
We have audited FMC Technologies, Inc.’s internal control over financial reporting as of December 31, 2009,based on criteria established in Internal Control—Integrated Framework issued by the Committee of SponsoringOrganizations of the Treadway Commission (COSO). FMC Technologies, Inc.’s management is responsible formaintaining effective internal control over financial reporting and for its assessment of the effectiveness ofinternal control over financial reporting, included in the accompanying Management’s Annual Report on InternalControl over Financial Reporting. Our responsibility is to express an opinion on the FMC Technologies, Inc.’sinternal control over financial reporting based on our audit.
We conducted our audit in accordance with the standards of the Public Company Accounting Oversight Board(United States). Those standards require that we plan and perform the audit to obtain reasonable assurance aboutwhether effective internal control over financial reporting was maintained in all material respects. Our auditincluded obtaining an understanding of internal control over financial reporting, assessing the risk that a materialweakness exists, and testing and evaluating the design and operating effectiveness of internal control based onthe assessed risk. Our audit also included performing such other procedures as we considered necessary in thecircumstances. We believe that our audit provides a reasonable basis for our opinion.
A company’s internal control over financial reporting is a process designed to provide reasonable assuranceregarding the reliability of financial reporting and the preparation of financial statements for external purposes inaccordance with generally accepted accounting principles. A company’s internal control over financial reportingincludes those policies and procedures that (1) pertain to the maintenance of records that, in reasonable detail,accurately and fairly reflect the transactions and dispositions of the assets of the company; (2) provide reasonableassurance that transactions are recorded as necessary to permit preparation of financial statements in accordancewith generally accepted accounting principles, and that receipts and expenditures of the company are being madeonly in accordance with authorizations of management and directors of the company; and (3) provide reasonableassurance regarding prevention or timely detection of unauthorized acquisition, use, or disposition of thecompany’s assets that could have a material effect on the financial statements.
Because of its inherent limitations, internal control over financial reporting may not prevent or detectmisstatements. Also, projections of any evaluation of effectiveness to future periods are subject to the risk thatcontrols may become inadequate because of changes in conditions, or that the degree of compliance with thepolicies or procedures may deteriorate.
In our opinion, FMC Technologies, Inc. maintained, in all material respects, effective internal control overfinancial reporting as of December 31, 2009, based on criteria established in Internal Control—IntegratedFramework issued by the Committee of Sponsoring Organizations of the Treadway Commission.
We also have audited, in accordance with the standards of the Public Company Accounting Oversight Board(United States), the consolidated balance sheets of FMC Technologies, Inc. and subsidiaries as of December 31,2009 and 2008, and the related consolidated statements of income, cash flows, and changes in stockholders’equity for each of the years in the three-year period ended December 31, 2009, and our report dated March 1,2010 expressed an unqualified opinion on those consolidated financial statements.
/s/ KPMG LLP
Houston, TexasMarch 1, 2010
36

REPORT OF INDEPENDENT REGISTERED PUBLIC ACCOUNTING FIRM
The Board of Directors and Stockholders of FMC Technologies, Inc.:
We have audited the accompanying consolidated balance sheets of FMC Technologies, Inc. and subsidiaries (theCompany) as of December 31, 2009 and 2008, and the related consolidated statements of income, cash flows,and changes in stockholders’ equity for each of the years in the three-year period ended December 31, 2009. Inconnection with our audits of the consolidated financial statements, we also have audited financial statementschedule II. These consolidated financial statements and financial statement schedule are the responsibility of theCompany’s management. Our responsibility is to express an opinion on these consolidated financial statementsand financial statement schedule based on our audits.
We conducted our audits in accordance with the standards of the Public Company Accounting Oversight Board(United States). Those standards require that we plan and perform the audit to obtain reasonable assurance aboutwhether the financial statements are free of material misstatement. An audit includes examining, on a test basis,evidence supporting the amounts and disclosures in the financial statements. An audit also includes assessing theaccounting principles used and significant estimates made by management, as well as evaluating the overallfinancial statement presentation. We believe that our audits provide a reasonable basis for our opinion.
In our opinion, the consolidated financial statements referred to above present fairly, in all material respects, thefinancial position of the Company as of December 31, 2009 and 2008, and the results of their operations and theircash flows for each of the years in the three-year period ended December 31, 2009, in conformity withU.S. generally accepted accounting principles. Also in our opinion, the related financial statement schedule II,when considered in relation to the basic consolidated financial statements taken as a whole, presents fairly, in allmaterial respects, the information set forth therein.
We also have audited, in accordance with the standards of the Public Company Accounting Oversight Board(United States), the Company’s internal control over financial reporting as of December 31, 2009, based oncriteria established in Internal Control—Integrated Framework issued by the Committee of SponsoringOrganizations of the Treadway Commission, and our report dated March 1, 2010 expressed an unqualifiedopinion on the effectiveness of the Company’s internal control over financial reporting.
/s/ KPMG LLP
Houston, TexasMarch 1, 2010
37

FMC TECHNOLOGIES, INC. AND CONSOLIDATED SUBSIDIARIES
CONSOLIDATED STATEMENTS OF INCOME
(In millions, except per share data)
Year Ended December 31,
2009 2008 2007
Revenue . . . . . . . . . . . . . . . . . . . . . . . . . . . . . . . . . . . . . . . . . . . . . . . . . . . . . . . . . $4,405.4 $4,550.9 $3,648.9Costs and expenses:Cost of sales . . . . . . . . . . . . . . . . . . . . . . . . . . . . . . . . . . . . . . . . . . . . . . . . . . . . . 3,434.5 3,623.1 2,921.9Selling, general and administrative expense . . . . . . . . . . . . . . . . . . . . . . . . . . . . . 389.5 351.7 310.6Research and development expense . . . . . . . . . . . . . . . . . . . . . . . . . . . . . . . . . . . 51.3 45.3 40.8
Total costs and expenses . . . . . . . . . . . . . . . . . . . . . . . . . . . . . . . . . . . . . . . . . . . . 3,875.3 4,020.1 3,273.3Other income (expense), net . . . . . . . . . . . . . . . . . . . . . . . . . . . . . . . . . . . . . . . . . (2.7) (23.0) 29.9
Income before interest income, interest expense and income taxes . . . . . . . . . . . 527.4 507.8 405.5Interest income . . . . . . . . . . . . . . . . . . . . . . . . . . . . . . . . . . . . . . . . . . . . . . . . . . . 2.4 6.6 6.8Interest expense . . . . . . . . . . . . . . . . . . . . . . . . . . . . . . . . . . . . . . . . . . . . . . . . . . . (11.9) (8.1) (16.1)
Income from continuing operations before income taxes . . . . . . . . . . . . . . . . . . . 517.9 506.3 396.2Provision for income taxes . . . . . . . . . . . . . . . . . . . . . . . . . . . . . . . . . . . . . . . . . . 155.1 152.0 134.5
Income from continuing operations . . . . . . . . . . . . . . . . . . . . . . . . . . . . . . . . . . . 362.8 354.3 261.7Income from discontinued operations, net of income taxes (Note 3) . . . . . . . . . . 0.5 8.4 42.2
Net income . . . . . . . . . . . . . . . . . . . . . . . . . . . . . . . . . . . . . . . . . . . . . . . . . . . . . . 363.3 362.7 303.9Less: net income attributable to noncontrolling interests . . . . . . . . . . . . . . . . . . . (1.5) (1.4) (1.1)
Net income attributable to FMC Technologies, Inc. . . . . . . . . . . . . . . . . . . . . . . . $ 361.8 $ 361.3 $ 302.8
Basic earnings per share attributable to FMC Technologies, Inc. (Note 2):Income from continuing operations . . . . . . . . . . . . . . . . . . . . . . . . . . . . . . . $ 2.91 $ 2.76 $ 1.98Income from discontinued operations . . . . . . . . . . . . . . . . . . . . . . . . . . . . . . — 0.07 0.33
Basic earnings per share . . . . . . . . . . . . . . . . . . . . . . . . . . . . . . . . . . . . . . . . $ 2.91 $ 2.83 $ 2.31
Diluted earnings per share attributable to FMC Technologies, Inc. (Note 2):Income from continuing operations . . . . . . . . . . . . . . . . . . . . . . . . . . . . . . . $ 2.87 $ 2.72 $ 1.95Income from discontinued operations . . . . . . . . . . . . . . . . . . . . . . . . . . . . . . 0.01 0.06 0.31
Diluted earnings per share . . . . . . . . . . . . . . . . . . . . . . . . . . . . . . . . . . . . . . . $ 2.88 $ 2.78 $ 2.26
Weighted average shares outstanding (Note 2):Basic . . . . . . . . . . . . . . . . . . . . . . . . . . . . . . . . . . . . . . . . . . . . . . . . . . . . . . . 124.3 127.8 131.3
Diluted . . . . . . . . . . . . . . . . . . . . . . . . . . . . . . . . . . . . . . . . . . . . . . . . . . . . . . 125.7 129.7 133.8
Net income attributable to FMC Technologies, Inc.:Income from continuing operations . . . . . . . . . . . . . . . . . . . . . . . . . . . . . . . $ 361.3 $ 352.9 $ 260.6Income from discontinued operations, net of income taxes . . . . . . . . . . . . . 0.5 8.4 42.2
Net income attributable to FMC Technologies, Inc. . . . . . . . . . . . . . . . . . . . $ 361.8 $ 361.3 $ 302.8
The accompanying notes are an integral part of the consolidated financial statements.
38

FMC TECHNOLOGIES, INC. AND CONSOLIDATED SUBSIDIARIES
CONSOLIDATED BALANCE SHEETS
December 31,
(In millions, except per share data) 2009 2008
AssetsCurrent assets:
Cash and cash equivalents . . . . . . . . . . . . . . . . . . . . . . . . . . . . . . . . . . . . . . . . . . . . . . . . . . . . . . . . . . . . . . . $ 460.7 $ 340.1Trade receivables, net of allowances of $8.0 in 2009 and $9.4 in 2008 . . . . . . . . . . . . . . . . . . . . . . . . . . . . 879.2 996.1Inventories, net (Note 5) . . . . . . . . . . . . . . . . . . . . . . . . . . . . . . . . . . . . . . . . . . . . . . . . . . . . . . . . . . . . . . . . 591.8 559.3Derivative financial instruments (Note 14) . . . . . . . . . . . . . . . . . . . . . . . . . . . . . . . . . . . . . . . . . . . . . . . . . . 108.0 354.6Prepaid expenses . . . . . . . . . . . . . . . . . . . . . . . . . . . . . . . . . . . . . . . . . . . . . . . . . . . . . . . . . . . . . . . . . . . . . . 20.5 24.2Other current assets . . . . . . . . . . . . . . . . . . . . . . . . . . . . . . . . . . . . . . . . . . . . . . . . . . . . . . . . . . . . . . . . . . . . 165.4 151.2Income taxes benefit . . . . . . . . . . . . . . . . . . . . . . . . . . . . . . . . . . . . . . . . . . . . . . . . . . . . . . . . . . . . . . . . . . . — 12.8
Total current assets . . . . . . . . . . . . . . . . . . . . . . . . . . . . . . . . . . . . . . . . . . . . . . . . . . . . . . . . . . . . . . . . 2,225.6 2,438.3Investments . . . . . . . . . . . . . . . . . . . . . . . . . . . . . . . . . . . . . . . . . . . . . . . . . . . . . . . . . . . . . . . . . . . . . . . . . . . . . . 141.8 151.2Property, plant and equipment, net (Note 6) . . . . . . . . . . . . . . . . . . . . . . . . . . . . . . . . . . . . . . . . . . . . . . . . . . . . . 581.9 494.9Goodwill (Note 7) . . . . . . . . . . . . . . . . . . . . . . . . . . . . . . . . . . . . . . . . . . . . . . . . . . . . . . . . . . . . . . . . . . . . . . . . . 272.7 128.7Intangible assets, net (Note 7) . . . . . . . . . . . . . . . . . . . . . . . . . . . . . . . . . . . . . . . . . . . . . . . . . . . . . . . . . . . . . . . . 154.6 70.2Deferred income taxes (Note 10) . . . . . . . . . . . . . . . . . . . . . . . . . . . . . . . . . . . . . . . . . . . . . . . . . . . . . . . . . . . . . 69.8 123.4Derivative financial instruments (Note 14) . . . . . . . . . . . . . . . . . . . . . . . . . . . . . . . . . . . . . . . . . . . . . . . . . . . . . . 28.5 142.4Other assets . . . . . . . . . . . . . . . . . . . . . . . . . . . . . . . . . . . . . . . . . . . . . . . . . . . . . . . . . . . . . . . . . . . . . . . . . . . . . . 34.6 31.8
Total assets . . . . . . . . . . . . . . . . . . . . . . . . . . . . . . . . . . . . . . . . . . . . . . . . . . . . . . . . . . . . . . . . . . $3,509.5 $3,580.9
Liabilities and equityCurrent liabilities:
Short-term debt and current portion of long-term debt (Note 9) . . . . . . . . . . . . . . . . . . . . . . . . . . . . . . . . . . $ 28.5 $ 23.0Accounts payable, trade . . . . . . . . . . . . . . . . . . . . . . . . . . . . . . . . . . . . . . . . . . . . . . . . . . . . . . . . . . . . . . . . 343.9 439.8Advance payments and progress billings . . . . . . . . . . . . . . . . . . . . . . . . . . . . . . . . . . . . . . . . . . . . . . . . . . . 670.4 770.3Accrued payroll . . . . . . . . . . . . . . . . . . . . . . . . . . . . . . . . . . . . . . . . . . . . . . . . . . . . . . . . . . . . . . . . . . . . . . . 139.8 102.4Derivative financial instruments (Note 14) . . . . . . . . . . . . . . . . . . . . . . . . . . . . . . . . . . . . . . . . . . . . . . . . . . 111.5 444.4Income taxes payable . . . . . . . . . . . . . . . . . . . . . . . . . . . . . . . . . . . . . . . . . . . . . . . . . . . . . . . . . . . . . . . . . . 49.7 —Current portion of accrued pension and other postretirement benefits (Note 11) . . . . . . . . . . . . . . . . . . . . . 2.0 20.8Deferred income taxes (Note 10) . . . . . . . . . . . . . . . . . . . . . . . . . . . . . . . . . . . . . . . . . . . . . . . . . . . . . . . . . 59.3 0.1Other current liabilities . . . . . . . . . . . . . . . . . . . . . . . . . . . . . . . . . . . . . . . . . . . . . . . . . . . . . . . . . . . . . . . . . 272.3 159.0Liabilities of discontinued operations (Note 3) . . . . . . . . . . . . . . . . . . . . . . . . . . . . . . . . . . . . . . . . . . . . . . . 1.1 3.5
Total current liabilities . . . . . . . . . . . . . . . . . . . . . . . . . . . . . . . . . . . . . . . . . . . . . . . . . . . . . . . . . . . . . 1,678.5 1,963.3Long-term debt, less current portion (Note 9) . . . . . . . . . . . . . . . . . . . . . . . . . . . . . . . . . . . . . . . . . . . . . . . . . . . . 391.6 472.0Accrued pension and other postretirement benefits, less current portion (Note 11) . . . . . . . . . . . . . . . . . . . . . . . 140.0 182.1Other liabilities . . . . . . . . . . . . . . . . . . . . . . . . . . . . . . . . . . . . . . . . . . . . . . . . . . . . . . . . . . . . . . . . . . . . . . . . . . . 158.0 89.0Derivative financial instruments (Note 14) . . . . . . . . . . . . . . . . . . . . . . . . . . . . . . . . . . . . . . . . . . . . . . . . . . . . . . 29.6 175.8Commitments and contingent liabilities (Note 18)Stockholders’ equity (Note 13):
Preferred stock, $0.01 par value, 12.0 shares authorized; no shares issued in 2009 or 2008 . . . . . . . . . . . . — —Common stock, $0.01 par value, 300.0 and 195.0 shares authorized in 2009 and 2008, respectively; 143.2shares issued in 2009 and 2008; 121.8 and 124.9 shares outstanding in 2009 and 2008, respectively . . . . . . 1.4 1.4
Common stock held in employee benefit trust, at cost; 0.1 and 0.1 shares in 2009 and 2008,respectively . . . . . . . . . . . . . . . . . . . . . . . . . . . . . . . . . . . . . . . . . . . . . . . . . . . . . . . . . . . . . . . . . . . . . . . . (5.7) (6.3)
Common stock held in treasury, at cost, 21.2 and 18.1 shares in 2009 and 2008, respectively . . . . . . . . . . (816.1) (706.0)Capital in excess of par value of common stock . . . . . . . . . . . . . . . . . . . . . . . . . . . . . . . . . . . . . . . . . . . . . . 710.1 728.7Retained earnings . . . . . . . . . . . . . . . . . . . . . . . . . . . . . . . . . . . . . . . . . . . . . . . . . . . . . . . . . . . . . . . . . . . . . 1,438.9 1,081.0Accumulated other comprehensive loss . . . . . . . . . . . . . . . . . . . . . . . . . . . . . . . . . . . . . . . . . . . . . . . . . . . . (225.8) (408.4)
Total FMC Technologies, Inc. stockholders’ equity . . . . . . . . . . . . . . . . . . . . . . . . . . . . . . . . . . . . . . . 1,102.8 690.4Noncontrolling interests . . . . . . . . . . . . . . . . . . . . . . . . . . . . . . . . . . . . . . . . . . . . . . . . . . . . . . . . . . . . . . . . 9.0 8.3
Total equity . . . . . . . . . . . . . . . . . . . . . . . . . . . . . . . . . . . . . . . . . . . . . . . . . . . . . . . . . . . . . . . . . . . . . . 1,111.8 698.7
Total liabilities and equity . . . . . . . . . . . . . . . . . . . . . . . . . . . . . . . . . . . . . . . . . . . . . . . . . . . . . . . . . . . . . . . . . $3,509.5 $3,580.9
The accompanying notes are an integral part of the consolidated financial statements.
39

FMC TECHNOLOGIES, INC. AND CONSOLIDATED SUBSIDIARIES
CONSOLIDATED STATEMENTS OF CASH FLOWS
Year Ended December 31,
(In millions) 2009 2008 2007
Cash provided (required) by operating activities of continuing operations:Net income attributable to FMC Technologies, Inc. . . . . . . . . . . . . . . . . . . . . . . . . . . . . . . . . . . . . . . . . $ 361.8 $ 361.3 $ 302.8Income from discontinued operations, net of income taxes . . . . . . . . . . . . . . . . . . . . . . . . . . . . . . . . . . (0.5) (8.4) (42.2)
Income from continuing operations . . . . . . . . . . . . . . . . . . . . . . . . . . . . . . . . . . . . . . . . . . . . . . . . . . . . . 361.3 352.9 260.6Adjustments to reconcile income to cash provided (required) by operating activities of continuingoperations:Depreciation . . . . . . . . . . . . . . . . . . . . . . . . . . . . . . . . . . . . . . . . . . . . . . . . . . . . . . . . . . . . . . . . . . . 78.3 57.7 46.9Amortization . . . . . . . . . . . . . . . . . . . . . . . . . . . . . . . . . . . . . . . . . . . . . . . . . . . . . . . . . . . . . . . . . . 14.7 14.9 14.9Net gain (loss) on disposal of assets . . . . . . . . . . . . . . . . . . . . . . . . . . . . . . . . . . . . . . . . . . . . . . . . (0.2) 0.1 (2.0)Employee benefit plan costs . . . . . . . . . . . . . . . . . . . . . . . . . . . . . . . . . . . . . . . . . . . . . . . . . . . . . . 78.9 57.0 56.5Deferred income tax provision . . . . . . . . . . . . . . . . . . . . . . . . . . . . . . . . . . . . . . . . . . . . . . . . . . . . . 3.9 63.4 5.5Unrealized loss (gain) on derivative instruments . . . . . . . . . . . . . . . . . . . . . . . . . . . . . . . . . . . . . . . 15.0 8.8 (30.9)Other . . . . . . . . . . . . . . . . . . . . . . . . . . . . . . . . . . . . . . . . . . . . . . . . . . . . . . . . . . . . . . . . . . . . . . . . 3.8 7.6 6.1
Changes in operating assets and liabilities, net of effects of acquisitions:Trade receivables, net . . . . . . . . . . . . . . . . . . . . . . . . . . . . . . . . . . . . . . . . . . . . . . . . . . . . . . . . . . . 211.3 (322.7) 21.9Inventories, net . . . . . . . . . . . . . . . . . . . . . . . . . . . . . . . . . . . . . . . . . . . . . . . . . . . . . . . . . . . . . . . . . 7.5 (77.1) (25.6)Accounts payable, trade . . . . . . . . . . . . . . . . . . . . . . . . . . . . . . . . . . . . . . . . . . . . . . . . . . . . . . . . . . (142.8) 140.9 31.5Advance payments and progress billings . . . . . . . . . . . . . . . . . . . . . . . . . . . . . . . . . . . . . . . . . . . . . (182.4) 207.6 268.0Other assets and liabilities, net . . . . . . . . . . . . . . . . . . . . . . . . . . . . . . . . . . . . . . . . . . . . . . . . . . . . . 142.1 (101.8) (83.5)Income taxes payable . . . . . . . . . . . . . . . . . . . . . . . . . . . . . . . . . . . . . . . . . . . . . . . . . . . . . . . . . . . . 71.5 (48.2) 19.5Accrued pension and other postretirement benefits, net . . . . . . . . . . . . . . . . . . . . . . . . . . . . . . . . . (66.3) (99.4) (46.6)
Cash provided by operating activities of continuing operations . . . . . . . . . . . . . . . . . . . . . . . . . . . . 596.6 261.7 542.8Cash provided (required) by discontinued operations—operating . . . . . . . . . . . . . . . . . . . . . . . . . . . . . (2.1) (11.1) 41.1
Cash provided by operating activities . . . . . . . . . . . . . . . . . . . . . . . . . . . . . . . . . . . . . . . . . . . . . . . . . 594.5 250.6 583.9
Cash provided (required) by investing activities:Capital expenditures . . . . . . . . . . . . . . . . . . . . . . . . . . . . . . . . . . . . . . . . . . . . . . . . . . . . . . . . . . . . . (110.0) (165.0) (179.6)Acquisitions, net of cash and cash equivalents acquired . . . . . . . . . . . . . . . . . . . . . . . . . . . . . . . . . (152.6) — (64.4)Noncontrolling equity investments . . . . . . . . . . . . . . . . . . . . . . . . . . . . . . . . . . . . . . . . . . . . . . . . . (10.0) (121.3) —Proceeds from disposal of assets . . . . . . . . . . . . . . . . . . . . . . . . . . . . . . . . . . . . . . . . . . . . . . . . . . . 18.9 3.4 63.0
Cash required by investing activities of continuing operations . . . . . . . . . . . . . . . . . . . . . . . . . . . . . (253.7) (282.9) (181.0)Cash required by discontinued operations—investing . . . . . . . . . . . . . . . . . . . . . . . . . . . . . . . . . . . . . . — (4.7) (12.1)
Cash required by investing activities . . . . . . . . . . . . . . . . . . . . . . . . . . . . . . . . . . . . . . . . . . . . . . . . . . (253.7) (287.6) (193.1)
Cash provided (required) by financing activities:Net increase in short-term debt and current portion of long-term debt . . . . . . . . . . . . . . . . . . . . . . 4.0 14.5 0.8Net increase (decrease) in commercial paper . . . . . . . . . . . . . . . . . . . . . . . . . . . . . . . . . . . . . . . . . 226.6 (51.0) 103.0Net increase (decrease) in long-term debt . . . . . . . . . . . . . . . . . . . . . . . . . . . . . . . . . . . . . . . . . . . . (310.8) 405.9 (202.2)Proceeds from exercise of stock options . . . . . . . . . . . . . . . . . . . . . . . . . . . . . . . . . . . . . . . . . . . . . 3.1 4.8 19.2Purchase of treasury stock . . . . . . . . . . . . . . . . . . . . . . . . . . . . . . . . . . . . . . . . . . . . . . . . . . . . . . . . (155.7) (324.0) (287.4)Excess tax benefits . . . . . . . . . . . . . . . . . . . . . . . . . . . . . . . . . . . . . . . . . . . . . . . . . . . . . . . . . . . . . . 2.0 24.0 20.6Proceeds on spin-off of JBT Corporation and affiliates . . . . . . . . . . . . . . . . . . . . . . . . . . . . . . . . . — 196.2 —Other . . . . . . . . . . . . . . . . . . . . . . . . . . . . . . . . . . . . . . . . . . . . . . . . . . . . . . . . . . . . . . . . . . . . . . . . (6.8) (17.7) (9.6)
Cash provided (required) by financing activities . . . . . . . . . . . . . . . . . . . . . . . . . . . . . . . . . . . . . . . . (237.6) 252.7 (355.6)
Effect of exchange rate changes on cash and cash equivalents . . . . . . . . . . . . . . . . . . . . . . . . . . . . . . . . 17.4 (5.1) 14.8
Increase in cash and cash equivalents . . . . . . . . . . . . . . . . . . . . . . . . . . . . . . . . . . . . . . . . . . . . . . . . . . . 120.6 210.6 50.0Cash and cash equivalents, beginning of year . . . . . . . . . . . . . . . . . . . . . . . . . . . . . . . . . . . . . . . . . . . . . 340.1 129.5 79.5
Cash and cash equivalents, end of year . . . . . . . . . . . . . . . . . . . . . . . . . . . . . . . . . . . . . . . . . . . . . . . . . . $ 460.7 $ 340.1 $ 129.5
Supplemental disclosures of cash flow information:Cash paid for interest (net of interest capitalized) . . . . . . . . . . . . . . . . . . . . . . . . . . . . . . . . . . . . . . $ 10.4 $ 9.4 $ 17.5Cash paid for income taxes (net of refunds received) . . . . . . . . . . . . . . . . . . . . . . . . . . . . . . . . . . . $ 71.4 $ 132.3 $ 93.5
The accompanying notes are an integral part of the consolidated financial statements.
40

FMC TECHNOLOGIES, INC. AND CONSOLIDATED SUBSIDIARIES
CONSOLIDATED STATEMENTS OF CHANGES IN STOCKHOLDERS’ EQUITY
(In millions)CommonStock
Commonstock held intreasury andemployeebenefittrust
Capital inexcess of par
value ofcommon stock
Retainedearnings
Accumulatedother
comprehensiveincome(loss)
Total FMCTechnologiesStockholders’
Equity
Non-controllingInterest
TotalStockholders’
Equity
Balance at December 31, 2006 . . . . . . . . . $ 0.7 $(200.4) $728.4 $ 469.5 $(112.2) $ 886.0 $ 8.3 $ 894.3Net income . . . . . . . . . . . . . . . . . . . . . . . . . — — — 302.8 — 302.8 1.1 303.9Foreign currency translation adjustment . . . — — — — 53.7 53.7 — 53.7Net deferral of hedging gains (net ofincome taxes of $9.6) (Note 14) . . . . . . . — — — — 13.3 13.3 — 13.3
Change in pension and other postretirementbenefit losses (net of income taxes of$0.8) (Note 11) . . . . . . . . . . . . . . . . . . . . — — — — (2.0) (2.0) — (2.0)
Total comprehensive income . . . . . . . . . . . . — — — 302.8 65.0 367.8 1.1 368.9
Issuance of common stock . . . . . . . . . . . . . . — — 19.2 — — 19.2 — 19.2Excess tax benefits on stock-based paymentarrangements . . . . . . . . . . . . . . . . . . . . . . — — 20.6 — — 20.6 — 20.6
Taxes withheld on issuance of stock-basedawards . . . . . . . . . . . . . . . . . . . . . . . . . . . — — (8.7) — — (8.7) — (8.7)
Purchases of treasury stock (Note 13) . . . . . — (287.4) — — — (287.4) — (287.4)Reissuances of treasury stock (Note 13) . . . — 60.6 (60.6) — — — — —Net purchases of common stock foremployee benefit trust . . . . . . . . . . . . . . . — (0.9) — — — (0.9) — (0.9)
Stock-based compensation (Note 12) . . . . . — — 25.5 — — 25.5 — 25.5Stock split . . . . . . . . . . . . . . . . . . . . . . . . . . 0.7 — (0.7) — — — — —Other . . . . . . . . . . . . . . . . . . . . . . . . . . . . . . — — 0.3 (0.7) — (0.4) (1.8) (2.2)
Balance at December 31, 2007 . . . . . . . . . $ 1.4 $(428.1) $724.0 $ 771.6 $ (47.2) $1,021.7 $ 7.6 $1,029.3
Net income . . . . . . . . . . . . . . . . . . . . . . . . . — — — 361.3 — 361.3 1.4 362.7Foreign currency translation adjustment . . . — — — — (139.1) (139.1) — (139.1)Net deferral of hedging gains (net ofincome taxes of $64.8) (Note 14) . . . . . . — — — — (110.2) (110.2) — (110.2)
Change in pension and other postretirementbenefit losses (net of income taxes of$77.7) (Note 11) . . . . . . . . . . . . . . . . . . . — — — — (137.9) (137.9) — (137.9)
Changes in investments (net of incometaxes of $0.8) . . . . . . . . . . . . . . . . . . . . . . — — — — (1.9) (1.9) — (1.9)
Total comprehensive income . . . . . . . . . . . . — — — 361.3 (389.1) (27.8) 1.4 (26.4)
Issuance of common stock . . . . . . . . . . . . . . — — 4.8 — — 4.8 — 4.8Excess tax benefits on stock-based paymentarrangements . . . . . . . . . . . . . . . . . . . . . . — — 24.0 — — 24.0 — 24.0
Taxes withheld on issuance of stock-basedawards . . . . . . . . . . . . . . . . . . . . . . . . . . . — — (17.5) — — (17.5) — (17.5)
Purchases of treasury stock (Note 13) . . . . . — (324.0) — — — (324.0) — (324.0)Reissuances of treasury stock (Note 13) . . . — 40.7 (40.7) — — — — —Net purchases of common stock foremployee benefit trust . . . . . . . . . . . . . . . — (1.5) 3.2 — — 1.7 — 1.7
Stock-based compensation (Note 12) . . . . . — — 30.2 — — 30.2 — 30.2Spin-off of JBT . . . . . . . . . . . . . . . . . . . . . . — 0.6 0.7 (52.2) 27.9 (23.0) — (23.0)Other . . . . . . . . . . . . . . . . . . . . . . . . . . . . . . — — — 0.3 — 0.3 (0.7) (0.4)
Balance at December 31, 2008 . . . . . . . . . $ 1.4 $(712.3) $728.7 $1,081.0 $(408.4) $ 690.4 $ 8.3 $ 698.7
41

(In millions)Commonstock
Commonstock held intreasury andemployeebenefittrust
Capital inexcess of par
value ofcommon stock
Retainedearnings
Accumulatedother
comprehensiveincome (loss)
Total FMCTechnologiesStockholders’
Equity
Non-controllingInterest
TotalStockholders’
Equity
Balance at December 31, 2008 . . . . $ 1.4 $(712.3) $728.7 $1,081.0 $(408.4) $ 690.4 $ 8.3 $ 698.7Net income . . . . . . . . . . . . . . . . . . . . . — — — 361.8 — 361.8 1.5 363.3Foreign currency translationadjustment . . . . . . . . . . . . . . . . . . . — — — — 77.2 77.2 — 77.2
Net deferral of hedging gains (net ofincome taxes of $41.1)(Note 14) . . . . . . . . . . . . . . . . . . . . — — — — 71.9 71.9 — 71.9
Change in pension and otherpostretirement benefit losses (netof income taxes of $16.0) (Note11) . . . . . . . . . . . . . . . . . . . . . . . . . — — — — 31.6 31.6 — 31.6
Changes in investments (net ofincome taxes of $0.8) . . . . . . . . . . . — — — — 1.9 1.9 — 1.9
Total comprehensive income . . . . . . . — — — 361.8 182.6 544.4 1.5 545.9
Issuance of common stock . . . . . . . . . — — 3.1 — — 3.1 — 3.1Excess tax benefits on stock-basedpayment arrangements . . . . . . . . . . — — 2.0 — — 2.0 — 2.0
Taxes withheld on issuance of stock-based awards . . . . . . . . . . . . . . . . . — — (7.3) — — (7.3) — (7.3)
Purchases of treasury stock(Note 13) . . . . . . . . . . . . . . . . . . . . — (155.7) — — — (155.7) — (155.7)
Reissuances of treasury stock(Note 13) . . . . . . . . . . . . . . . . . . . . — 45.6 (45.6) — — — — —
Net purchases of common stock foremployee benefit trust . . . . . . . . . . — 0.6 0.2 — — 0.8 — 0.8
Stock-based compensation(Note 12) . . . . . . . . . . . . . . . . . . . . — — 29.2 — — 29.2 — 29.2
Spin-off of JBT . . . . . . . . . . . . . . . . . — — — (3.5) — (3.5) — (3.5)Other . . . . . . . . . . . . . . . . . . . . . . . . . — — (0.2) (0.4) — (0.6) (0.8) (1.4)
Balance at December 31, 2009 . . . . $ 1.4 $(821.8) $710.1 $1,438.9 $(225.8) $1,102.8 $ 9.0 $1,111.8
The accompanying notes are an integral part of the consolidated financial statements.
42
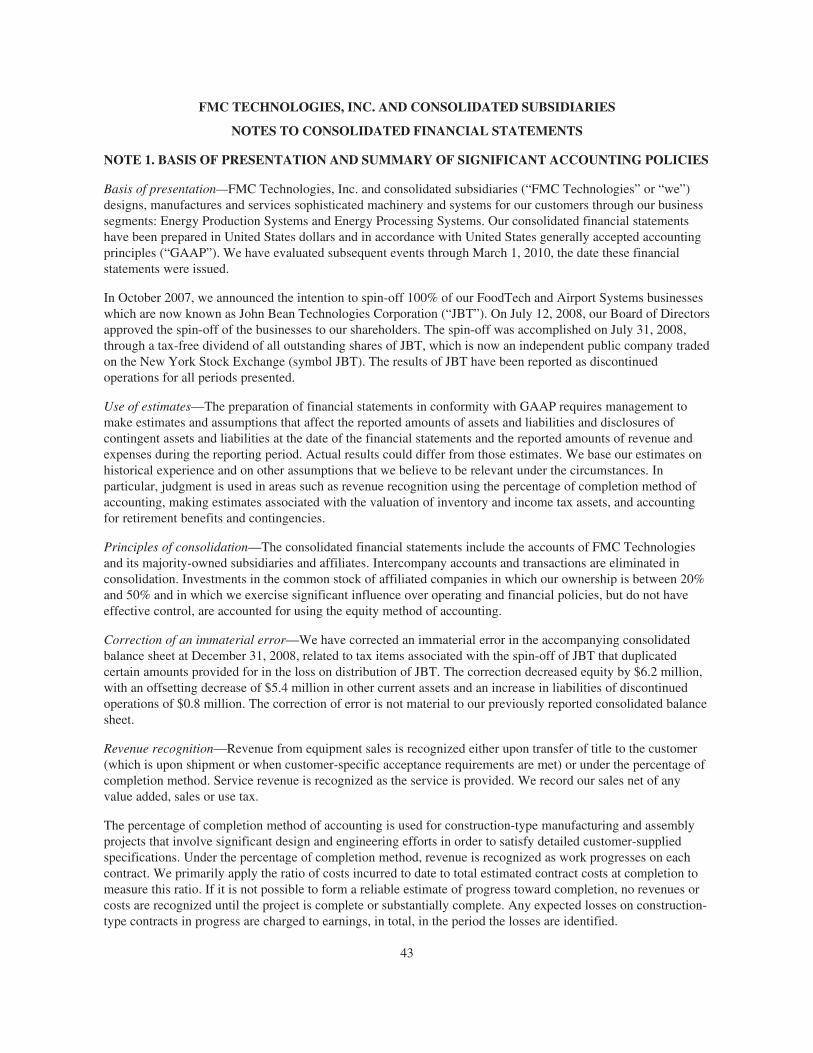
FMC TECHNOLOGIES, INC. AND CONSOLIDATED SUBSIDIARIES
NOTES TO CONSOLIDATED FINANCIAL STATEMENTS
NOTE 1. BASIS OF PRESENTATION AND SUMMARY OF SIGNIFICANT ACCOUNTING POLICIES
Basis of presentation—FMC Technologies, Inc. and consolidated subsidiaries (“FMC Technologies” or “we”)designs, manufactures and services sophisticated machinery and systems for our customers through our businesssegments: Energy Production Systems and Energy Processing Systems. Our consolidated financial statementshave been prepared in United States dollars and in accordance with United States generally accepted accountingprinciples (“GAAP”). We have evaluated subsequent events through March 1, 2010, the date these financialstatements were issued.
In October 2007, we announced the intention to spin-off 100% of our FoodTech and Airport Systems businesseswhich are now known as John Bean Technologies Corporation (“JBT”). On July 12, 2008, our Board of Directorsapproved the spin-off of the businesses to our shareholders. The spin-off was accomplished on July 31, 2008,through a tax-free dividend of all outstanding shares of JBT, which is now an independent public company tradedon the New York Stock Exchange (symbol JBT). The results of JBT have been reported as discontinuedoperations for all periods presented.
Use of estimates—The preparation of financial statements in conformity with GAAP requires management tomake estimates and assumptions that affect the reported amounts of assets and liabilities and disclosures ofcontingent assets and liabilities at the date of the financial statements and the reported amounts of revenue andexpenses during the reporting period. Actual results could differ from those estimates. We base our estimates onhistorical experience and on other assumptions that we believe to be relevant under the circumstances. Inparticular, judgment is used in areas such as revenue recognition using the percentage of completion method ofaccounting, making estimates associated with the valuation of inventory and income tax assets, and accountingfor retirement benefits and contingencies.
Principles of consolidation—The consolidated financial statements include the accounts of FMC Technologiesand its majority-owned subsidiaries and affiliates. Intercompany accounts and transactions are eliminated inconsolidation. Investments in the common stock of affiliated companies in which our ownership is between 20%and 50% and in which we exercise significant influence over operating and financial policies, but do not haveeffective control, are accounted for using the equity method of accounting.
Correction of an immaterial error—We have corrected an immaterial error in the accompanying consolidatedbalance sheet at December 31, 2008, related to tax items associated with the spin-off of JBT that duplicatedcertain amounts provided for in the loss on distribution of JBT. The correction decreased equity by $6.2 million,with an offsetting decrease of $5.4 million in other current assets and an increase in liabilities of discontinuedoperations of $0.8 million. The correction of error is not material to our previously reported consolidated balancesheet.
Revenue recognition—Revenue from equipment sales is recognized either upon transfer of title to the customer(which is upon shipment or when customer-specific acceptance requirements are met) or under the percentage ofcompletion method. Service revenue is recognized as the service is provided. We record our sales net of anyvalue added, sales or use tax.
The percentage of completion method of accounting is used for construction-type manufacturing and assemblyprojects that involve significant design and engineering efforts in order to satisfy detailed customer-suppliedspecifications. Under the percentage of completion method, revenue is recognized as work progresses on eachcontract. We primarily apply the ratio of costs incurred to date to total estimated contract costs at completion tomeasure this ratio. If it is not possible to form a reliable estimate of progress toward completion, no revenues orcosts are recognized until the project is complete or substantially complete. Any expected losses on construction-type contracts in progress are charged to earnings, in total, in the period the losses are identified.
43

Modifications to construction-type contracts, referred to as “change orders,” effectively change the provisions ofthe original contract, and may, for example, alter the specifications or design, method or manner of performance,equipment, materials, sites, and/or period for completion of the work. If a change order represents a firm pricecommitment from a customer, we account for the revised estimate as if it had been included in the originalestimate, effectively recognizing the pro rata impact of the new estimate on our calculation of progress towardcompletion in the period in which the firm commitment is received. If a change order is unpriced: (1) we includethe costs of contract performance in our calculation of progress toward completion in the period in which thecosts are incurred or become probable; and (2) when it is determined that the revenue is probable of recovery, weinclude the change order revenue, limited to the costs incurred to date related to the change order, in ourcalculation of progress toward completion. Margin is not recorded on unpriced change orders unless realization isassured beyond a reasonable doubt. The assessment of realization may be based upon our previous experiencewith the customer or based upon our receipt of a firm price commitment from the customer.
Progress billings generally are issued contingent on completion of certain phases of the work as stipulated in thecontract. Revenue in excess of progress billings on contracts accounted for under the percentage of completionmethod amounted to $236.2 million and $150.6 million at December 31, 2009 and 2008, respectively. Theseunbilled receivables are reported in trade receivables on the consolidated balance sheets. Progress billings andcash collections in excess of revenue recognized on a contract are classified as advance payments and progressbillings within current liabilities on the consolidated balance sheets.
Fair Value—We record our financial assets and financial liabilities at fair value. Fair value is defined as the pricethat would be received to sell an asset or paid to transfer a liability (an exit price) in an orderly transactionbetween market participants at the reporting date. The fair value framework requires the categorization of assetsand liabilities into three levels based upon the assumptions (inputs) used to price the assets or liabilities. Level 1provides the most reliable measure of fair value, whereas Level 3 generally requires significant managementjudgment. The three levels are defined as follows:
• Level 1: Unadjusted quoted prices in active markets for identical assets and liabilities.
• Level 2: Observable inputs other than those included in Level 1. For example, quoted prices for similarassets or liabilities in active markets or quoted prices for identical assets or liabilities in inactivemarkets.
• Level 3: Unobservable inputs reflecting management’s own assumptions about the inputs used inpricing the asset or liability.
Cash equivalents—We consider investments in all highly-liquid debt instruments with original maturities ofthree months or less to be cash equivalents.
Trade receivables—We provide an allowance for doubtful accounts on trade receivables equal to the estimateduncollectible amounts. This estimate is based on historical collection experience and a specific review of eachcustomer’s trade receivable balance.
Inventories—Inventories are stated at the lower of cost or net realizable value. Inventory costs include thosecosts directly attributable to products, including all manufacturing overhead but excluding costs to distribute.Cost is determined on the last-in, first-out (“LIFO”) basis for all significant domestic inventories, except certaininventories relating to construction-type contracts, which are stated at the actual production cost incurred to date,reduced by the portion of these costs identified with revenue recognized. The first-in, first-out (“FIFO”) methodis used to determine the cost for all other inventories.
Impairment of long-lived and intangible assets—Long-lived assets, including property, plant and equipment,identifiable intangible assets being amortized and capitalized software costs are reviewed for impairmentwhenever events or changes in circumstances indicate that the carrying amount of the long-lived asset may not berecoverable. The carrying amount of a long-lived asset is not recoverable if it exceeds the sum of the
44

undiscounted cash flows expected to result from the use and eventual disposition of the asset. If it is determinedthat an impairment loss has occurred, the loss is measured as the amount by which the carrying amount of thelong-lived asset exceeds its fair value.
Long-lived assets held for sale are reported at the lower of carrying value or fair value less cost to sell.
Investments—Investments in the common stock of affiliated companies in which our ownership is between 20%and 50% and in which we exercise significant influence over operating and financial policies, but do not haveeffective control, are accounted for using the equity method of accounting. In December 2008, we acquired a45% interest in Schilling Robotics, LLC (“Schilling”) for a total purchase price of $116.0 million, less certaintransaction expenses. The Securities Purchase Agreement between FMC Technologies and Schilling providedthat FMC Technologies directly withhold $10.0 million of the sale proceeds, pending the satisfactory completionof the audit of Schilling’s 2008 financial statements. The audit was completed in 2009 and the additional cashconsideration was paid to Schilling. We account for the investment using the equity method. The carrying valueof the investment at December 31, 2009 and 2008, was $116.6 million and $116.1 million, respectively, and isreported in the Energy Production segment.
We determine the appropriate classification of investments in marketable equity securities at the time of purchaseand re-evaluate such designation as of each subsequent reporting date. Securities classified as available-for-saleare carried at fair value with unrealized holding gains and losses on these securities recognized in accumulatedother comprehensive income (loss), net of related income tax. We had no available-for-sale securities atDecember 31, 2009.
Securities classified as trading securities are carried at fair value with gains and losses on these securitiesrecognized through other income (expense), net. Trading securities are comprised primarily of marketable equitymutual funds that approximate a portion of our liability under our Non-Qualified Savings and Investment Plan.Trading securities totaled approximately $25.2 million and $21.8 million at December 31, 2009 and 2008,respectively.
Investments are reviewed regularly to evaluate whether they have experienced an other than temporary decline infair value. If we believe that an other than temporary decline exists, the investment is written down to the fairmarket value with a charge to earnings.
Property, plant, and equipment—Property, plant, and equipment is recorded at cost. Depreciation for financialreporting purposes is provided principally on the straight-line basis over the estimated useful lives of the assets(land improvements—20 to 35 years, buildings—20 to 50 years; and machinery and equipment—3 to 20 years).Gains and losses are reflected in income upon the sale or retirement of assets. Expenditures that extend the usefullives of property, plant and equipment are capitalized and depreciated over the estimated new remaining life ofthe asset.
Capitalized software costs—Other assets include the capitalized cost of internal use software (including Internetwebsites). The assets are stated at cost less accumulated amortization and totaled $29.1 million and $25.3 millionat December 31, 2009 and 2008, respectively. These software costs include significant purchases of software andinternal and external costs incurred during the application development stage of software projects. These costsare amortized on a straight-line basis over the estimated useful lives of the assets. For internal use software, theuseful lives range from three to ten years. For Internet website costs, the estimated useful lives do not exceedthree years.
Goodwill and other intangible assets—Goodwill is not subject to amortization but is tested for impairment on anannual basis (or more frequently if impairment indicators arise). We have established October 31 as the date ofour annual test for impairment of goodwill. Impairment losses are calculated at the reporting unit level, andrepresent the excess of the carrying value of reporting unit goodwill over its implied fair value. The implied fair
45

value of goodwill is determined by a two-step process. The first compares the fair value of the reporting unit(measured as the present value of expected future cash flows) to its carrying amount. If the fair value of thereporting unit is less than its carrying amount, a second step is performed. In this step, the fair value of thereporting unit is allocated to its assets and liabilities to determine the implied fair value of goodwill, which isused to measure the impairment loss. We have not recognized any impairment for the years ended December 31,2009 or 2008, as the fair values of our reporting units with goodwill balances exceed our carrying amounts. Inaddition, there were no negative conditions, or triggering events, that occurred in 2009 or 2008 requiring us toperform additional impairment reviews.
Our acquired intangible assets are being amortized on a straight-line basis over their estimated useful lives,which generally range from 7 to 40 years. None of our acquired intangible assets have indefinite lives.
Income taxes—Current income taxes are provided on income reported for financial statement purposes, adjustedfor transactions that do not enter into the computation of income taxes payable in the same year. Deferred taxassets and liabilities are measured using enacted tax rates for the expected future tax consequences of temporarydifferences between the carrying amounts and the tax bases of assets and liabilities. A valuation allowance isestablished whenever management believes that it is more likely than not that deferred tax assets may not berealizable.
U.S. income taxes are not provided on our equity in undistributed earnings of foreign subsidiaries or affiliates tothe extent we have determined that the earnings are indefinitely reinvested. U.S. income taxes are provided onsuch earnings in the period in which we determine that the earnings are not indefinitely reinvested.
Stock-based employee compensation—We measure compensation cost on restricted stock awards based on themarket price at the grant date and the number of shares awarded. The compensation cost for each award isrecognized ratably over the applicable service period, after taking into account estimated forfeitures.
Common stock held in employee benefit trust—Shares of our common stock are purchased by the planadministrator of the FMC Technologies, Inc. Non-Qualified Savings and Investment Plan and placed in a trustowned by us. Purchased shares are recorded at cost and classified as a reduction of stockholders’ equity in theconsolidated balance sheets.
Earnings per common share (“EPS”)—Basic EPS is computed using the weighted-average number of commonshares outstanding. Diluted EPS gives effect to the potential dilution of earnings which could have occurred ifadditional shares were issued for stock option exercises and restricted stock under the treasury stock method. Thetreasury stock method assumes that proceeds that would be obtained upon exercise of common stock options andissuance of restricted stock are used to buy back outstanding common stock at the average market price duringthe period.
Foreign currency—Financial statements of operations for which the U.S. dollar is not the functional currency,and are located in non-highly inflationary countries, are translated into U.S. dollars prior to consolidation. Assetsand liabilities are translated at the exchange rate in effect at the balance sheet date, while income statementaccounts are translated at the average exchange rate for each period. For these operations, translation gains andlosses are recorded as a component of accumulated other comprehensive income (loss) in stockholders’ equityuntil the foreign entity is sold or liquidated. For operations in highly inflationary countries and where the localcurrency is not the functional currency, inventories, property, plant and equipment, and other non-current assetsare converted to U.S. dollars at historical exchange rates, and all gains or losses from conversion are included innet income. Foreign currency effects on cash, cash equivalents, and debt in hyperinflationary economies areincluded in interest income or expense.
Derivative financial instruments—Derivatives are recognized in the consolidated balance sheets at fair value,with classification as current or non-current based upon the maturity of the derivative instrument. Changes in the
46

fair value of derivative instruments are recorded in current earnings or deferred in accumulated othercomprehensive income (loss), depending on the type of hedging transaction and whether a derivative isdesignated as, and is effective as, a hedge.
Hedge accounting is only applied when the derivative is deemed to be highly effective at offsetting changes inanticipated cash flows of the hedged item or transaction. Changes in fair value of derivatives that are designatedas cash flow hedges are deferred in accumulated other comprehensive income (loss) until the underlyingtransactions are recognized in earnings. At such time, related deferred hedging gains or losses are also recordedin operating earnings on the same line as the hedged item. Effectiveness is assessed at the inception of the hedgeand on a quarterly basis. Effectiveness of forward contract cash flow hedges are assessed based solely on changesin fair value attributable to the change in the spot rate. The change in the fair value of the contract related to thechange in forward rates is excluded from the assessment of hedge effectiveness. Changes in this excludedcomponent of the derivative instrument, along with any ineffectiveness identified, are recorded in operatingearnings as incurred. We document our risk management strategy and hedge effectiveness at the inception of andduring the term of each hedge.
We also use forward contracts to hedge foreign currency assets and liabilities, for which we do not apply hedgeaccounting. The changes in fair value of these contracts are recognized in other income (expense), net, as theyoccur and offset gains or losses on the remeasurement of the related asset or liability.
Cash flows from derivative contracts are reported in the consolidated statements of cash flows in the samecategories as the cash flows from the underlying transactions.
Accounting standards recently adopted—Effective July 1, 2009, we adopted the provisions of a new accountingstandard issued by the Financial Accounting Standards Board (“FASB”) that established the AccountingStandards Codification (“Codification”). The codification is now the source of authoritative accountingprinciples recognized by the FASB to be applied by nongovernmental entities in the preparation of financialstatements in conformity with GAAP for SEC registrants. All guidance contained in the Codification carries anequal level of authority. The Codification supersedes all existing non-SEC accounting and reporting standards.
Effective June 30, 2009, we adopted the provisions of a new accounting standard issued by the FASB whichestablishes general standards of accounting for and disclosures of events that occur after the balance sheet datebut before the financial statements are issued or are available to be issued. It requires the disclosure of the datethrough which an entity has evaluated subsequent events.
Effective January 1, 2009, we adopted a new accounting standard issued by the FASB that relates to thepresentation and accounting for noncontrolling interests. In accordance with the new guidance, noncontrollinginterests (previously shown as minority interest) are reported below net income under the heading “Net incomeattributable to noncontrolling interests” in the consolidated statements of income and shown as a component ofequity in the consolidated balance sheets.
Effective January 1, 2009, we adopted a new accounting standard issued by the FASB that requires enhanceddisclosures regarding derivative instruments and hedging activities, enabling a better understanding of theireffects on an entity’s financial position, financial performance and cash flows. See Note 6 for additionaldisclosures included in accordance with the standard.
Effective January 1, 2009, we adopted an update to existing accounting standards issued by the FASB forbusiness combinations occurring on or after January 1, 2009, which revises the accounting and disclosurerequirements for acquisition transactions. The standard differs from the previous standard in that it requiresprofessional fees and other transaction-related costs to be expensed as incurred instead of capitalizing these costsas purchase price consideration. Additionally, the fair value for contingent assets, liabilities and transaction-related consideration must be estimated as of the purchase date, with future changes in the underlying estimates
47

recognized in the consolidated statement of income. Finally, the standard requires any adjustments to deferredtax asset valuation allowances and income tax uncertainties associated with acquisitions to be reflected as incometax expense rather than an adjustment to goodwill.
Effective January 1, 2008, we adopted the provisions of the fair value measurement standard issued by the FASBwith respect to recurring financial assets and liabilities. We adopted the provisions of the fair value measurementstandard as they relate to nonrecurring fair value measurement requirements for nonfinancial assets and liabilitieson January 1, 2009. The standard defines fair value, establishes a framework for measuring fair value ingenerally accepted accounting principles, and expands disclosures about fair value measurements. Our adoptionof the standard had no impact on our consolidated financial results. See Note 13 for additional disclosuresincluded in accordance with the standard.
NOTE 2. EARNINGS PER SHARE
Basic earnings per share (“EPS”) is computed using the weighted average number of common shares outstandingduring the period. Diluted EPS gives effect to the potential dilution of earnings that could have occurred ifadditional shares were issued for stock options and restricted stock awards under the treasury stock method.There were no outstanding stock-based awards excluded from the computation of diluted EPS for the years endedDecember 31, 2009, 2008 and 2007.
(In millions, except per share data)
Year Ended December 31,
2009 2008 2007
Basic earnings per share attributable to FMC Technologies:Income from continuing operations . . . . . . . . . . . . . . . . . . . . . . . . . . . . . . . . . . . . $361.3 $352.9 $260.6
Weighted average number of shares outstanding . . . . . . . . . . . . . . . . . . . . . . . . . . 124.3 127.8 131.3
Basic earnings per share from continuing operations . . . . . . . . . . . . . . . . . . . . . . $ 2.91 $ 2.76 $ 1.98
Diluted earnings per share attributable to FMC Technologies:Income from continuing operations . . . . . . . . . . . . . . . . . . . . . . . . . . . . . . . . . . . . $361.3 $352.9 $260.6
Weighted average number of shares outstanding . . . . . . . . . . . . . . . . . . . . . . . . . . 124.3 127.8 131.3Effect of dilutive securities:
Options on common stock . . . . . . . . . . . . . . . . . . . . . . . . . . . . . . . . . . . . . . . 0.3 0.5 1.0Restricted stock . . . . . . . . . . . . . . . . . . . . . . . . . . . . . . . . . . . . . . . . . . . . . . . 1.1 1.4 1.5
Total shares and dilutive securities . . . . . . . . . . . . . . . . . . . . . . . . . . . . . . . . . . . . 125.7 129.7 133.8
Diluted earnings per share from continuing operations . . . . . . . . . . . . . . . . . . . . . $ 2.87 $ 2.72 $ 1.95
NOTE 3. DISCONTINUED OPERATIONS
We report businesses or asset groups as discontinued operations when we commit to a plan to divest the businessor asset group and the sale of the business or asset group is deemed probable within the next 12 months.
In October 2007, we announced the intention to spin-off 100% of our FoodTech and Airport Systems businesseswhich are now known as JBT. On July 12, 2008, our Board of Directors approved the spin-off of the businessesto our shareholders. The spin-off was accomplished on July 31, 2008, through a tax-free dividend to ourshareholders of 0.216 shares of JBT common stock for every share of our stock outstanding as of the close ofbusiness on July 22, 2008. We did not retain any shares of JBT common stock. JBT is now an independent publiccompany traded on the New York Stock Exchange (symbol JBT).
Prior to the spin-off, we received necessary regulatory approvals, including a private letter ruling from theInternal Revenue Service (“IRS”) regarding the tax-free status of the transaction for U.S. federal income taxpurposes and a declaration of effectiveness from the SEC for JBT’s registration statement on Form 10. The
48

distribution resulted in a net decrease in our stockholders’ equity of $16.9 million which primarily represents a$46.1 million decrease in retained earnings partially offset by a $27.9 million decrease in accumulated othercomprehensive loss. In connection with this transaction, JBT distributed $196.2 million to us which was used torepurchase stock and reduce our outstanding debt, pursuant to certain terms of the IRS private letter ruling.
At the time of the spin-off of JBT, all outstanding stock options to purchase our common stock and all restrictedstock shares awarded in 2007 and held by employees of JBT were cancelled. Restricted stock shares awardedprior to 2007 and held by employees of JBT were maintained by us and vested in 2009. At the completion of thespin-off of JBT, outstanding stock options to purchase our common stock and outstanding restricted stock unitsheld by our directors and employees who remained with us were adjusted to preserve the intrinsic value of theshares held prior to the spin-off.
During 2007, we sold two units from our FoodTech segment, one of which generated an after-tax gain of $3.1million. During 2008, we sold certain tangible assets related to our FoodTech segment which generated anafter-tax gain of $0.5 million.
The results of the businesses, including the gains on disposition, have been reported as discontinued operationsfor all periods presented.
Liabilities of businesses reported as discontinued operations included in the accompanying consolidated balancesheets represent other liabilities of $1.1 million and $3.5 million at December 31, 2009 and 2008, respectively.
The consolidated statements of income include the following in discontinued operations:
(In millions)
Year Ended December 31,
2009 2008 2007
Revenue . . . . . . . . . . . . . . . . . . . . . . . . . . . . . . . . . . . . . . . . . . . . . . . . . . . . . . . . . . . . . . . $— $612.5 $997.2Income (loss) before income taxes . . . . . . . . . . . . . . . . . . . . . . . . . . . . . . . . . . . . . . . . . . $(0.3) $ 35.3 $ 66.3Income tax provision (benefit) . . . . . . . . . . . . . . . . . . . . . . . . . . . . . . . . . . . . . . . . . . . . . (0.8) 26.9 24.1
Income from discontinued operations . . . . . . . . . . . . . . . . . . . . . . . . . . . . . . . . . . . . . . . . $ 0.5 $ 8.4 $ 42.2
NOTE 4. BUSINESS COMBINATIONS
Direct Drive Systems, Inc. (“DDS”) and Multi Phase Meters AS (“MPM”)—On October 30, 2009, we acquiredall of the equity interests of California-based DDS, a leader in the development and manufacture of high-performance permanent magnet motors and bearings for the oil and gas industry, to leverage our experience as asystems integrator and technology leader and to further strengthen our capabilities in the subsea processingmarket. On October 20, 2009, we acquired 100 percent ownership of Norway-based MPM, a leader in thedevelopment and manufacture of high-performance multiphase flow meters, to further enhance and expand ourportfolio of subsea technologies. The acquisitions have been recorded using the acquisition method of accountingand, accordingly, DDS and MPM have been included in the consolidated subsidiaries reported in the EnergyProcessing segment and Energy Production segment, respectively, since their acquisition dates.
The acquisition-date fair value of the consideration transferred totaled $213.7 million which consisted of thefollowing:
(In millions) DDS MPM Total
Cash . . . . . . . . . . . . . . . . . . . . . . . . . . . . . . . . . . . . . . . . . . . . . . . . . . . . . . . . . . . . . . . . . $120.4 $33.1 $153.5Earn-out contingent consideration . . . . . . . . . . . . . . . . . . . . . . . . . . . . . . . . . . . . . . . . . . — 56.1 56.1Debt assumed . . . . . . . . . . . . . . . . . . . . . . . . . . . . . . . . . . . . . . . . . . . . . . . . . . . . . . . . . . — 4.1 4.1
Total . . . . . . . . . . . . . . . . . . . . . . . . . . . . . . . . . . . . . . . . . . . . . . . . . . . . . . . . . . . . . . . . . $120.4 $93.3 $213.7
49

The contingent consideration arrangement requires us to pay additional consideration to MPM’s formershareholders in 2013 and 2014, based on a multiple of 2012 and 2013 earnings before income taxes, depreciationand amortization (“EBITDA”), less net interest-bearing debt. We estimated the fair value of the contingentconsideration using a discounted cash flow model. The key assumption in applying the income approach was adiscount rate of 3.48% and 4.10% for 2012 and 2013, respectively, which reflects our debt credit rating. We haveestimated that the total undiscounted payment required under the contingent consideration arrangement willapproximate $64.6 million, with no set maximum payment. The fair value measurement is based on significantinputs not observable in the market and thus represents a Level 3 measurement as defined by the FASB. As ofDecember 31, 2009, there were no changes in the range of outcomes for the contingent consideration.
The following table summarizes the fair values of the assets acquired and liabilities assumed at the acquisitiondate.
(In millions) DDS MPM Total
Cash . . . . . . . . . . . . . . . . . . . . . . . . . . . . . . . . . . . . . . . . . . . . . . . . . . . . . . . . . . . . . . . . . $ 0.2 $ 0.7 $ 0.9Accounts receivable . . . . . . . . . . . . . . . . . . . . . . . . . . . . . . . . . . . . . . . . . . . . . . . . . . . . . 0.3 3.9 4.2Inventory . . . . . . . . . . . . . . . . . . . . . . . . . . . . . . . . . . . . . . . . . . . . . . . . . . . . . . . . . . . . . 0.1 4.1 4.2Other current assets . . . . . . . . . . . . . . . . . . . . . . . . . . . . . . . . . . . . . . . . . . . . . . . . . . . . . 0.1 0.9 1.0Property, plant and equipment . . . . . . . . . . . . . . . . . . . . . . . . . . . . . . . . . . . . . . . . . . . . . 2.8 2.1 4.9Intangible assets (Note 7) . . . . . . . . . . . . . . . . . . . . . . . . . . . . . . . . . . . . . . . . . . . . . . . . . 63.9 28.4 92.3Other long-term assets . . . . . . . . . . . . . . . . . . . . . . . . . . . . . . . . . . . . . . . . . . . . . . . . . . . 0.1 0.2 0.3
Total identifiable assets acquired . . . . . . . . . . . . . . . . . . . . . . . . . . . . . . . . . . . . . . . 67.5 40.3 107.8Current liabilities . . . . . . . . . . . . . . . . . . . . . . . . . . . . . . . . . . . . . . . . . . . . . . . . . . . . . . . (1.7) (2.4) (4.1)Deferred tax liability . . . . . . . . . . . . . . . . . . . . . . . . . . . . . . . . . . . . . . . . . . . . . . . . . . . . (12.4) (6.0) (18.4)
Total liabilities assumed . . . . . . . . . . . . . . . . . . . . . . . . . . . . . . . . . . . . . . . . . . . . . . (14.1) (8.4) (22.5)
Net identifiable assets acquired . . . . . . . . . . . . . . . . . . . . . . . . . . . . . . . . . . . . . . . . . . . . 53.4 31.9 85.3Goodwill (all non-deductible for tax purposes) (Note 7) . . . . . . . . . . . . . . . . . . . . . . . . . 67.0 61.4 128.4
Net assets acquired . . . . . . . . . . . . . . . . . . . . . . . . . . . . . . . . . . . . . . . . . . . . . . . . . . . . . . $120.4 $93.3 $213.7
The goodwill recognized is attributable primarily to expected synergies and the assembled workforce of DDS andMPM. As of December 31, 2009, there were no changes in the recognized amounts of goodwill resulting fromthe acquisitions of DDS and MPM.
The acquired intangibles include the following:
(In millions)
DDS MPM
Fair ValueWgtd. Avg.
Amort. Period Fair ValueWgtd. Avg.
Amort. Period
Technology/patents . . . . . . . . . . . . . . . . . . . . . . . . . . . . . . . . . $62.3 20 $22.8 15Trademarks/trade name . . . . . . . . . . . . . . . . . . . . . . . . . . . . . 1.6 10 1.9 8Customer relationships . . . . . . . . . . . . . . . . . . . . . . . . . . . . . . — — 2.8 10Non-compete agreements . . . . . . . . . . . . . . . . . . . . . . . . . . . . — — 0.7 5Backlog . . . . . . . . . . . . . . . . . . . . . . . . . . . . . . . . . . . . . . . . . . — — 0.2 1
Total costs and expenses . . . . . . . . . . . . . . . . . . . . . . . . . . . . $63.9 19.7 $28.4 13.7
We recognized $0.7 million and $0.2 million of acquisition-related costs that were expensed in 2009 for DDSand MPM, respectively. These costs were recognized as selling, general and administrative expense in theconsolidated statement of income.
The amounts of revenues and earnings of DDS and MPM included in our consolidated statement of income arenot material. Pro forma schedules have not been included as the impact on the periods presented is not material.
50
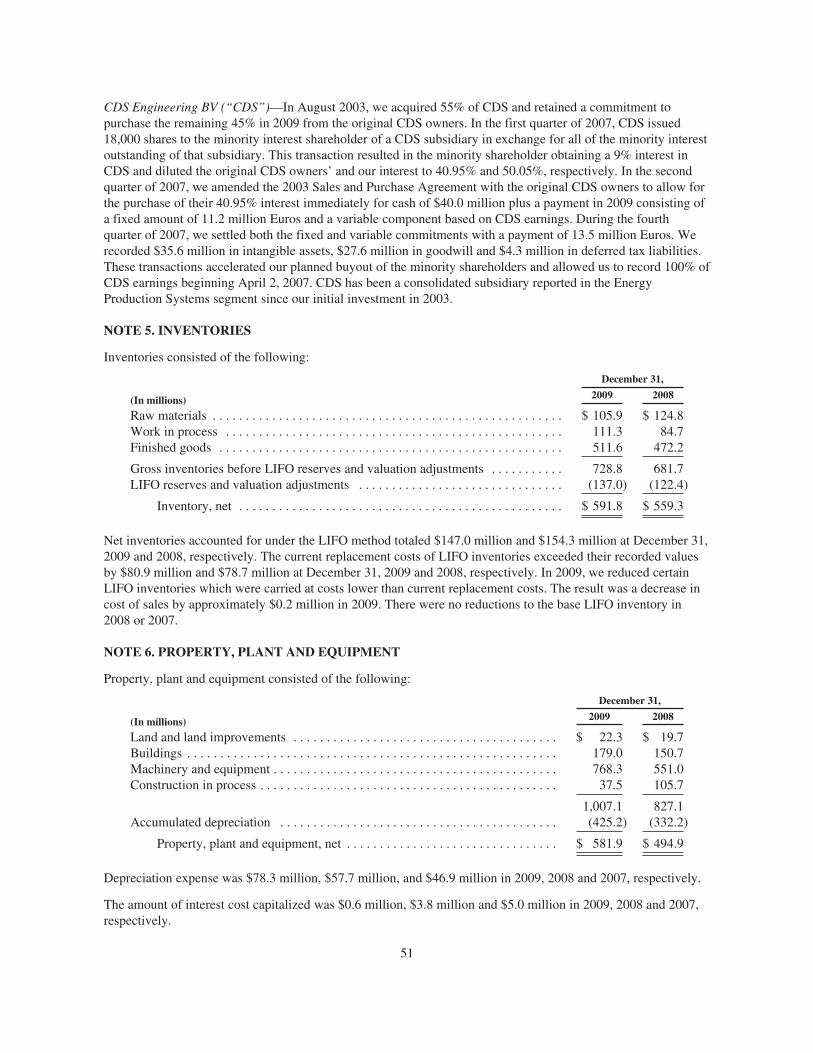
CDS Engineering BV (“CDS”)—In August 2003, we acquired 55% of CDS and retained a commitment topurchase the remaining 45% in 2009 from the original CDS owners. In the first quarter of 2007, CDS issued18,000 shares to the minority interest shareholder of a CDS subsidiary in exchange for all of the minority interestoutstanding of that subsidiary. This transaction resulted in the minority shareholder obtaining a 9% interest inCDS and diluted the original CDS owners’ and our interest to 40.95% and 50.05%, respectively. In the secondquarter of 2007, we amended the 2003 Sales and Purchase Agreement with the original CDS owners to allow forthe purchase of their 40.95% interest immediately for cash of $40.0 million plus a payment in 2009 consisting ofa fixed amount of 11.2 million Euros and a variable component based on CDS earnings. During the fourthquarter of 2007, we settled both the fixed and variable commitments with a payment of 13.5 million Euros. Werecorded $35.6 million in intangible assets, $27.6 million in goodwill and $4.3 million in deferred tax liabilities.These transactions accelerated our planned buyout of the minority shareholders and allowed us to record 100% ofCDS earnings beginning April 2, 2007. CDS has been a consolidated subsidiary reported in the EnergyProduction Systems segment since our initial investment in 2003.
NOTE 5. INVENTORIES
Inventories consisted of the following:
(In millions)
December 31,
2009 2008
Raw materials . . . . . . . . . . . . . . . . . . . . . . . . . . . . . . . . . . . . . . . . . . . . . . . . . . . . . $ 105.9 $ 124.8Work in process . . . . . . . . . . . . . . . . . . . . . . . . . . . . . . . . . . . . . . . . . . . . . . . . . . . 111.3 84.7Finished goods . . . . . . . . . . . . . . . . . . . . . . . . . . . . . . . . . . . . . . . . . . . . . . . . . . . . 511.6 472.2
Gross inventories before LIFO reserves and valuation adjustments . . . . . . . . . . . 728.8 681.7LIFO reserves and valuation adjustments . . . . . . . . . . . . . . . . . . . . . . . . . . . . . . . (137.0) (122.4)
Inventory, net . . . . . . . . . . . . . . . . . . . . . . . . . . . . . . . . . . . . . . . . . . . . . . . . . $ 591.8 $ 559.3
Net inventories accounted for under the LIFO method totaled $147.0 million and $154.3 million at December 31,2009 and 2008, respectively. The current replacement costs of LIFO inventories exceeded their recorded valuesby $80.9 million and $78.7 million at December 31, 2009 and 2008, respectively. In 2009, we reduced certainLIFO inventories which were carried at costs lower than current replacement costs. The result was a decrease incost of sales by approximately $0.2 million in 2009. There were no reductions to the base LIFO inventory in2008 or 2007.
NOTE 6. PROPERTY, PLANT AND EQUIPMENT
Property, plant and equipment consisted of the following:
(In millions)
December 31,
2009 2008
Land and land improvements . . . . . . . . . . . . . . . . . . . . . . . . . . . . . . . . . . . . . . . . $ 22.3 $ 19.7Buildings . . . . . . . . . . . . . . . . . . . . . . . . . . . . . . . . . . . . . . . . . . . . . . . . . . . . . . . . 179.0 150.7Machinery and equipment . . . . . . . . . . . . . . . . . . . . . . . . . . . . . . . . . . . . . . . . . . . 768.3 551.0Construction in process . . . . . . . . . . . . . . . . . . . . . . . . . . . . . . . . . . . . . . . . . . . . . 37.5 105.7
1,007.1 827.1Accumulated depreciation . . . . . . . . . . . . . . . . . . . . . . . . . . . . . . . . . . . . . . . . . . (425.2) (332.2)
Property, plant and equipment, net . . . . . . . . . . . . . . . . . . . . . . . . . . . . . . . . $ 581.9 $ 494.9
Depreciation expense was $78.3 million, $57.7 million, and $46.9 million in 2009, 2008 and 2007, respectively.
The amount of interest cost capitalized was $0.6 million, $3.8 million and $5.0 million in 2009, 2008 and 2007,respectively.
51

NOTE 7. GOODWILL AND INTANGIBLE ASSETS
Goodwill— The carrying amount of goodwill by business segment was as follows:
(In millions)
EnergyProductionSystems
EnergyProcessingSystems Total
December 31, 2008 . . . . . . . . . . . . . . . . . . . . . . . . . . . . . . . . . . . . . . . . . $114.7 $14.0 $128.7Additions due to business combinations (1) . . . . . . . . . . . . . . . . . . 61.4 67.0 128.4Translation . . . . . . . . . . . . . . . . . . . . . . . . . . . . . . . . . . . . . . . . . . . 15.6 — 15.6
December 31, 2009 . . . . . . . . . . . . . . . . . . . . . . . . . . . . . . . . . . . . . . . . . $191.7 $81.0 $272.7
(1) See additional disclosure related to business combinations in Note 4.
Intangible assets—The components of intangible assets were as follows:
(In millions)
December 31,
2009 2008
GrossCarryingAmount
AccumulatedAmortization
GrossCarryingAmount
AccumulatedAmortization
Customer lists . . . . . . . . . . . . . . . . . . . . . . . . . . . . . . . . . . . . . . . . $ 37.1 $ 9.2 $34.3 $ 6.6Patents and acquired technology . . . . . . . . . . . . . . . . . . . . . . . . . . 133.5 14.7 48.1 10.2Trademarks . . . . . . . . . . . . . . . . . . . . . . . . . . . . . . . . . . . . . . . . . . 10.2 3.1 6.6 2.6Other . . . . . . . . . . . . . . . . . . . . . . . . . . . . . . . . . . . . . . . . . . . . . . . 2.8 2.0 2.0 1.4
Total intangible assets . . . . . . . . . . . . . . . . . . . . . . . . . . . . . . $183.6 $29.0 $91.0 $20.8
Additions to our intangible assets during 2009 included $63.9 million and $28.4 million in assets associated withour acquisitions of DDS and MPM, respectively. There were no additions to our intangible assets during 2008.Refer to Note 4 for further disclosure related to business combinations.
All of our acquired identifiable intangible assets are subject to amortization and, where applicable, foreigncurrency translation adjustments. We recorded $7.8 million, $7.2 million and $6.5 million in amortizationexpense related to acquired intangible assets during the years ended December 31, 2009, 2008 and 2007,respectively. In the fourth quarter of 2007, management revised their estimate of the remaining lives of theintangible assets related to the acquisition of CDS. Therefore, we effected a change in estimate to reduce theremaining life for customer lists from 25 years to 15 years; for patents and acquired technology from 20 years to15 years; and for trademarks from 20 years to 10 years. We accounted for this change in estimate in the fourthquarter of 2007 and the impact was not material. During the years 2010 through 2014, annual amortizationexpense is expected to be as follows: $12.3 million in 2010, $12.0 million in 2011, $11.8 million in 2012, $11.5million in 2013, $11.4 million in 2014 and $95.6 million thereafter.
NOTE 8. SALE LEASEBACK TRANSACTION
In March 2007, we sold and leased back property in Houston, Texas consisting of land, corporate offices andproduction facilities primarily related to the Energy Production Systems segment. We received proceeds of $58.1million in connection with the sale. The carrying value of the property sold was $20.3 million. We accounted forthe transaction as a sale leaseback resulting in (i) first quarter 2007 recognition of $1.3 million of the $37.4million gain on the transaction and (ii) the deferral of the remaining $36.1 million of the gain, which will beamortized to rent expense over a noncancellable ten-year lease term. The deferred gain is presented in otherliabilities in the consolidated balance sheet. The lease expires in 2022 and provides for two 5-year optionalextensions as well as the option to terminate the lease in 2017, subject to a $3.3 million fee. Annual rent of $4.2million escalates 2% per year. The lease has been recorded as an operating lease.
52

NOTE 9. DEBT
Revolving credit facilities—We have a $600 million five-year revolving credit agreement which matures inDecember 2012 with JPMorgan Chase Bank, N.A., as Administrative Agent. Under the credit agreement interestaccrues at a rate equal to, at our option; either (a) a base rate determined by reference to the higher of (1) theagent’s prime rate and (2) the federal funds rate plus 1⁄2 of 1% or (b) an interest rate of 45 basis points above theLondon Interbank Offered Rate (“LIBOR”). The margin over LIBOR is variable and is determined based on ourdebt rating. Available capacity under the credit facility is reduced by outstanding letters of credit associated withthe facility, which totaled $27.8 million as of December 31, 2009, and any outstanding commercial paper.
In January 2009, we entered into a $350 million 364-day revolving committed credit agreement maturing inJanuary 2010 with Bank of America, N.A., as Administrative Agent. Under the credit agreement interest accruesat a rate equal to, at our option; either (a) a base rate determined by reference to the higher of (1) the agent’sprime rate, (2) the federal funds rate plus 1⁄2 of 1% or (3) the London Interbank Offered Rate (“LIBOR”) plus1.00%; or (b) LIBOR plus 2.25%. The margin over LIBOR is variable and is determined based on our creditrating.
Unused capacity under the credit facilities at December 31, 2009 totaled $543.5 million.
Among other restrictions, the terms of the credit agreements include negative covenants related to liens and afinancial covenant related to the debt-to-earnings ratio. We are in compliance with all restrictive covenants as ofDecember 31, 2009.
Commercial paper—Under our commercial paper program, we have the ability to access $500.0 million of short-term financing through our commercial paper dealers subject to the limit of unused capacity of the $600 millionfive-year revolving credit facility. Commercial paper borrowings are issued at market interest rates.
Property financing—In September 2004, we entered into agreements for the sale and leaseback of an officebuilding having a net book value of $8.5 million. Under the terms of the agreement, the building was sold for$9.7 million in net proceeds and leased back under a 10-year lease. We have subleased this property to a thirdparty under a lease agreement that is being accounted for as an operating lease. We have accounted for thetransaction as a financing transaction and are amortizing the related obligation using an effective annual interestrate of 5.37%.
Uncommitted credit—We have uncommitted credit lines at many of our international subsidiaries for immaterialamounts. We utilize these facilities to provide a more efficient daily source of liquidity. The effective interestrates depend upon the local national market.
Short-term debt and current portion of long-term debt—Short-term debt and current portion of long-term debtconsisted of the following:
(In millions)
December 31,
2009 2008
Property financing . . . . . . . . . . . . . . . . . . . . . . . . . . . . . . . . . . . . . . . . . . . . . . . . . . . . . $ 0.4 $ 0.4Foreign uncommitted credit facilities . . . . . . . . . . . . . . . . . . . . . . . . . . . . . . . . . . . . . . 28.1 19.1Other . . . . . . . . . . . . . . . . . . . . . . . . . . . . . . . . . . . . . . . . . . . . . . . . . . . . . . . . . . . . . . . — 3.5
Total short-term debt and current portion of long-term debt . . . . . . . . . . . . . . . . $28.5 $23.0
53

Long-term debt—Long-term debt consisted of the following:
(In millions)
December 31,
2009 2008
Revolving credit facilities . . . . . . . . . . . . . . . . . . . . . . . . . . . . . . . . . . . . . . . . . . . . . $100.0 $407.0Commercial paper (1) . . . . . . . . . . . . . . . . . . . . . . . . . . . . . . . . . . . . . . . . . . . . . . . . 278.7 52.0Property financing . . . . . . . . . . . . . . . . . . . . . . . . . . . . . . . . . . . . . . . . . . . . . . . . . . . 8.1 8.5Other . . . . . . . . . . . . . . . . . . . . . . . . . . . . . . . . . . . . . . . . . . . . . . . . . . . . . . . . . . . . . 5.2 8.4
Total long-term debt . . . . . . . . . . . . . . . . . . . . . . . . . . . . . . . . . . . . . . . . . . . . . . . . . 392.0 475.9Less: current portion . . . . . . . . . . . . . . . . . . . . . . . . . . . . . . . . . . . . . . . . . . . . . . . . . (0.4) (3.9)
Long-term debt, less current portion . . . . . . . . . . . . . . . . . . . . . . . . . . . . . . . . . $391.6 $472.0
(1) Committed credit available under our five-year revolving credit facility maturing in 2012 provides theability to refinance our commercial paper obligations on a long-term basis. Since we have both the abilityand intent to refinance these obligations on a long-term basis, our commercial paper borrowings wereclassified as long-term on the consolidated balance sheet at December 31, 2009. Commercial paperborrowings as of December 31, 2009 had an average interest rate of 0.38%.
Maturities of total long-term debt as of December 31, 2009, are payable as follows: $0.4 million in 2010, $5.6million in 2011, $379.7 million in 2012 and $6.3 million thereafter.
Interest rate swaps—On March 23, 2009, we took out interest rate swaps related to interest payments on $100.0million of our variable rate borrowings on our $600 million revolving credit facility. The effect of these interestrate swaps was to fix the effective annual interest rate of these variable rate borrowings at 2.08%. The swapswere accounted for as cash flow hedges.
NOTE 10. INCOME TAXES
Domestic and foreign components of income before income taxes are shown below:
(In millions)
Year Ended December 31,
2009 2008 2007
Domestic . . . . . . . . . . . . . . . . . . . . . . . . . . . . . . . . . . . . . . . . . . . . . . . . . . . . . . . . . . . . . $ 70.4 $ 63.4 $104.2Foreign . . . . . . . . . . . . . . . . . . . . . . . . . . . . . . . . . . . . . . . . . . . . . . . . . . . . . . . . . . . . . . 446.0 441.5 290.9
Income before income taxes . . . . . . . . . . . . . . . . . . . . . . . . . . . . . . . . . . . . . . . . . . $516.4 $504.9 $395.1
The provision for income taxes consisted of:
(In millions)
Year Ended December 31,
2009 2008 2007
Current:Federal . . . . . . . . . . . . . . . . . . . . . . . . . . . . . . . . . . . . . . . . . . . . . . . . . . . . . . . . . . $ 39.3 $ 19.7 $ 46.5State . . . . . . . . . . . . . . . . . . . . . . . . . . . . . . . . . . . . . . . . . . . . . . . . . . . . . . . . . . . . 1.9 0.8 3.9Foreign . . . . . . . . . . . . . . . . . . . . . . . . . . . . . . . . . . . . . . . . . . . . . . . . . . . . . . . . . . 95.9 58.9 74.7
Total current . . . . . . . . . . . . . . . . . . . . . . . . . . . . . . . . . . . . . . . . . . . . . . . . . . . . . . 137.1 79.4 125.1
Non-Current . . . . . . . . . . . . . . . . . . . . . . . . . . . . . . . . . . . . . . . . . . . . . . . . . . . . . . . . . . 14.1 9.2 3.9
Deferred:(Decrease) increase in the valuation allowance for deferred tax assets . . . . . . . . . 1.4 (0.5) 0.2Other deferred tax expense . . . . . . . . . . . . . . . . . . . . . . . . . . . . . . . . . . . . . . . . . . . 2.5 63.9 5.3
Total deferred . . . . . . . . . . . . . . . . . . . . . . . . . . . . . . . . . . . . . . . . . . . . . . . . . . . . . 3.9 63.4 5.5
Provision for income taxes . . . . . . . . . . . . . . . . . . . . . . . . . . . . . . . . . . . . . . . . . . . $155.1 $152.0 $134.5
54

Significant components of our deferred tax assets and liabilities were as follows:
(In millions)
December 31,
2009 2008
Deferred tax assets attributable to:Accrued expenses . . . . . . . . . . . . . . . . . . . . . . . . . . . . . . . . . . . . . . . . . . . . . . . . . . . . . . . . . $ 64.1 $ 50.4Foreign tax credit carryforwards . . . . . . . . . . . . . . . . . . . . . . . . . . . . . . . . . . . . . . . . . . . . . . 16.7 27.2Accrued pension and other postretirement benefits . . . . . . . . . . . . . . . . . . . . . . . . . . . . . . . 55.9 76.5Stock-based compensation . . . . . . . . . . . . . . . . . . . . . . . . . . . . . . . . . . . . . . . . . . . . . . . . . . 25.1 26.6Net operating loss carryforwards . . . . . . . . . . . . . . . . . . . . . . . . . . . . . . . . . . . . . . . . . . . . . 19.2 11.0Inventories . . . . . . . . . . . . . . . . . . . . . . . . . . . . . . . . . . . . . . . . . . . . . . . . . . . . . . . . . . . . . . . 17.9 17.1Foreign exchange . . . . . . . . . . . . . . . . . . . . . . . . . . . . . . . . . . . . . . . . . . . . . . . . . . . . . . . . . 23.0 52.2Other . . . . . . . . . . . . . . . . . . . . . . . . . . . . . . . . . . . . . . . . . . . . . . . . . . . . . . . . . . . . . . . . . . . 0.3 3.4
Deferred tax assets . . . . . . . . . . . . . . . . . . . . . . . . . . . . . . . . . . . . . . . . . . . . . . . . . . . . 222.2 264.4Valuation allowance . . . . . . . . . . . . . . . . . . . . . . . . . . . . . . . . . . . . . . . . . . . . . . . . . . . . . . . (3.4) (2.0)
Deferred tax assets, net of valuation allowance . . . . . . . . . . . . . . . . . . . . . . . . . . . . . . . . . . . . . . 218.8 262.4
Deferred tax liabilities attributable to:Revenue in excess of billings on contracts accounted for under the percentage ofcompletion method . . . . . . . . . . . . . . . . . . . . . . . . . . . . . . . . . . . . . . . . . . . . . . . . . . . . . . 118.1 87.7
Property, plant and equipment, goodwill and other assets . . . . . . . . . . . . . . . . . . . . . . . . . . 90.2 51.4
Deferred tax liabilities . . . . . . . . . . . . . . . . . . . . . . . . . . . . . . . . . . . . . . . . . . . . . . . . . . . . . . . . . . 208.3 139.1
Net deferred tax assets . . . . . . . . . . . . . . . . . . . . . . . . . . . . . . . . . . . . . . . . . . . . . . $ 10.5 $123.3
At December 31, 2009 and 2008, the carrying amount of net deferred tax assets and the related valuationallowance included the impact of foreign currency translation adjustments. Included in our deferred tax assets atDecember 31, 2009 are U.S. foreign tax credit carryforwards of $16.7 million, which, if not utilized, will begin toexpire after 2015. Realization of these deferred tax assets is dependent on the generation of sufficient U.S.taxable income prior to the above date. Based on long-term forecasts of operating results, management believesthat it is more likely than not that domestic earnings over the forecast period will result in sufficient U.S. taxableincome to fully realize these deferred tax assets. In its analysis, management has considered the effect of foreigndeemed dividends and other expected adjustments to domestic earnings that are required in determining U.S.taxable income. Foreign earnings taxable to us as dividends, including deemed dividends for U.S. tax purposes,were $275.5 million, $134.3 million and $62.2 million, in 2009, 2008 and 2007, respectively. Also included indeferred tax assets are tax benefits related to net operating loss carryforwards attributable to foreign entities. Ifnot utilized, these net operating loss carryforwards will begin to expire in 2010. Management believes it is morelikely than not that we will not be able to utilize certain of these operating loss carryforwards before expiration;therefore, we have established a valuation allowance against the related deferred tax assets.
By country, current and non-current deferred income taxes included in our consolidated balance sheet atDecember 31, 2009, were as follows:
(In millions)
December 31, 2009
Current Asset(Liability)
Non-Current Asset(Liability) Total
United States . . . . . . . . . . . . . . . . . . . . . . . . . . . . . . . . . . . . . . . . . . . . . $ 33.7 $74.2 $ 107.9Norway . . . . . . . . . . . . . . . . . . . . . . . . . . . . . . . . . . . . . . . . . . . . . . . . . (106.7) 4.1 (102.6)Brazil . . . . . . . . . . . . . . . . . . . . . . . . . . . . . . . . . . . . . . . . . . . . . . . . . . . 13.9 (1.3) 12.6Other foreign . . . . . . . . . . . . . . . . . . . . . . . . . . . . . . . . . . . . . . . . . . . . . (0.2) (7.2) (7.4)
Net deferred tax assets (liabilities) . . . . . . . . . . . . . . . . . . . . . . . . $ (59.3) $69.8 $ 10.5
55

A reconciliation of the beginning and ending amount of unrecognized tax benefits is as follows:
(In millions)
Federal,State and
Foreign Tax
AccruedInterestand
Penalties
GrossUnrecognizedIncome TaxBenefits
DeferredIncome TaxBenefits Net
Balance at January 1, 2009 . . . . . . . . . . . . . . . . . . . . . . . $28.0 $ 6.3 $34.3 $(3.3) $31.0Additions for tax positions related to the currentyear . . . . . . . . . . . . . . . . . . . . . . . . . . . . . . . . . . . . . . . 13.8 — 13.8 — 13.8
Additions for tax positions related to prior years . . . . . . 1.0 1.6 2.6 (0.4) 2.2Reductions for tax positions due to settlements . . . . . . . (3.1) (1.9) (5.0) 0.4 (4.6)Reductions due to a lapse of the statute oflimitations . . . . . . . . . . . . . . . . . . . . . . . . . . . . . . . . . . (0.3) — (0.3) — (0.3)
Other reductions for tax positions related to prioryears . . . . . . . . . . . . . . . . . . . . . . . . . . . . . . . . . . . . . . (1.7) — (1.7) 0.8 (0.9)
Balance at December 31, 2009 . . . . . . . . . . . . . . . . . . . . 37.7 6.0 43.7 (2.5) 41.2Less tax positions related to temporary differences . . . . (0.4) — (0.4) — (0.4)
Tax positions that, if recognized, would impact theeffective tax rate as of December 31, 2009 . . . . . . . . $37.3 $ 6.0 $43.3 $(2.5) $40.8
It is our policy to classify interest expense and penalties recognized on underpayments of income taxes as incometax expense. The gross amounts of interest expense and penalties included in unrecognized tax benefits as ofJanuary 1 and December 31, 2009 are reflected in the table above.
It is reasonably possible that within twelve months unrecognized tax benefits related to certain tax reportingpositions taken in prior periods could decrease by up to $5.3 million, due to either the expiration of the statute oflimitations in certain jurisdictions or the resolution of current income tax examinations, or both.
Tax years after 1998 remain subject to examination in Norway in addition to tax years after 2003 for Brazil andthe United States.
The effective income tax rate was different from the statutory U.S. federal income tax rate due to the following:
Year Ended December 31,
2009 2008 2007
Statutory U.S. federal income tax rate . . . . . . . . . . . . . . . . . . . . . . . . . . . . . . . . . . . . . . . . 35% 35% 35%Net difference resulting from:
Foreign earnings subject to different tax rates . . . . . . . . . . . . . . . . . . . . . . . . . . . . . . (12) (9) (5)Tax on foreign intercompany dividends and deemed dividends for tax purposes . . . 4 3 1Net change in unrecognized tax benefits . . . . . . . . . . . . . . . . . . . . . . . . . . . . . . . . . . . 3 2 1Other . . . . . . . . . . . . . . . . . . . . . . . . . . . . . . . . . . . . . . . . . . . . . . . . . . . . . . . . . . . . . . — (1) 2
Total difference . . . . . . . . . . . . . . . . . . . . . . . . . . . . . . . . . . . . . . . . . . . . . . . . . . (5) (5) (1)
Effective income tax rate . . . . . . . . . . . . . . . . . . . . . . . . . . . . . . . . . . . . . . . . . . . . . . . . . . . 30% 30% 34%
We have provided U.S. income taxes on $242.0 million of cumulative earnings of certain foreign subsidiarieswhere we have determined that the foreign subsidiaries’ earnings are not indefinitely reinvested. No provision forU.S. income taxes has been recorded on earnings of foreign subsidiaries that are indefinitely reinvested. Thecumulative balance of foreign earnings with respect to which no provision for U.S. income taxes has beenrecorded was $680.0 million at December 31, 2009. The amount of applicable U.S. income taxes that would beincurred if these earnings were repatriated is approximately $190.0 million.
56

NOTE 11. PENSIONS AND POSTRETIREMENT AND OTHER BENEFIT PLANS
We have funded and unfunded defined benefit pension plans which provide defined benefits based on years ofservice and final average salary. On October 2, 2009, the Board of Directors amended the U.S. Qualified andNon-Qualified Defined Benefit Pension Plans (“U.S. Pension Plans”) to freeze participation in the U.S. PensionPlans for all new nonunion employees hired on or after January 1, 2010, and current nonunion employees withless than five years of vesting service as of December 31, 2009. For current nonunion employees with less thanfive years of vesting service as of December 31, 2009, benefits accrued under the U.S. Pension Plans and earnedas of that date were frozen based on credited service and pay as of December 31, 2009.
Foreign-based employees are eligible to participate in FMC Technologies-sponsored or government-sponsoredbenefit plans to which we contribute. Several of the foreign defined benefit pension plans sponsored by usprovide for employee contributions; the remaining plans are noncontributory.
We have other postretirement benefit plans covering substantially all of our U.S. employees who were hired priorto January 1, 2003. The postretirement health care plans are contributory; the postretirement life insurance plansare noncontributory.
We are required to recognize the funded status of defined benefit postretirement plans as an asset or liability inthe consolidated balance sheet and recognize changes in that funded status in comprehensive income in the yearin which the changes occur. Further, we are required to measure plan’s assets and its obligations that determineits funded status as of the date of the consolidated balance sheet. We have applied this guidance to our domesticpension and other postretirement benefit plans as well as for many of our non-U.S. plans, including those in theUnited Kingdom, Norway, Germany, France and Canada. Pension expense measured in compliance with GAAPfor the other non-U.S. pension plans is not materially different from the locally reported pension expense.
57

The funded status of our U.S. qualified and nonqualified pension plans, certain foreign pension plans and U.S.postretirement health care and life insurance benefit plans, together with the associated balances recognized inour consolidated financial statements as of December 31, 2009 and 2008, were as follows:
Pensions
OtherPostretirement
Benefits
(In millions) 2009 2008 2009 2008
Accumulated benefit obligation . . . . . . . . . . . . . . . . . . . . . . . . . . . . . . . . . . . . . . . . . . . . . . . . . . . . . . . . $ 613.7 $ 547.1
Projected benefit obligation at January 1 . . . . . . . . . . . . . . . . . . . . . . . . . . . . . . . . . . . . . . . . . . . . . . . . . $ 669.4 $ 911.7 $11.0 $ 19.7Transfer of liability to JBT as a result of the spinoff . . . . . . . . . . . . . . . . . . . . . . . . . . . . . . . . . . . . — (219.6) — (6.4)Service cost . . . . . . . . . . . . . . . . . . . . . . . . . . . . . . . . . . . . . . . . . . . . . . . . . . . . . . . . . . . . . . . . . . . . 36.6 33.5 0.1 0.1Interest cost . . . . . . . . . . . . . . . . . . . . . . . . . . . . . . . . . . . . . . . . . . . . . . . . . . . . . . . . . . . . . . . . . . . . 39.7 38.9 0.6 0.7Actuarial (gain) loss . . . . . . . . . . . . . . . . . . . . . . . . . . . . . . . . . . . . . . . . . . . . . . . . . . . . . . . . . . . . . 18.3 17.6 (3.2) (1.7)Curtailment . . . . . . . . . . . . . . . . . . . . . . . . . . . . . . . . . . . . . . . . . . . . . . . . . . . . . . . . . . . . . . . . . . . . (5.2) — — —Settlement loss . . . . . . . . . . . . . . . . . . . . . . . . . . . . . . . . . . . . . . . . . . . . . . . . . . . . . . . . . . . . . . . . . — 5.4 — —Foreign currency exchange rate changes . . . . . . . . . . . . . . . . . . . . . . . . . . . . . . . . . . . . . . . . . . . . . 40.7 (86.4) — —Plan participants’ contributions . . . . . . . . . . . . . . . . . . . . . . . . . . . . . . . . . . . . . . . . . . . . . . . . . . . . 1.6 2.1 — —Benefits paid . . . . . . . . . . . . . . . . . . . . . . . . . . . . . . . . . . . . . . . . . . . . . . . . . . . . . . . . . . . . . . . . . . . (47.2) (33.8) (0.6) (1.4)
Projected benefit obligation at December 31 . . . . . . . . . . . . . . . . . . . . . . . . . . . . . . . . . . . . . . 753.9 669.4 7.9 11.0
Fair value of plan assets at January 1 . . . . . . . . . . . . . . . . . . . . . . . . . . . . . . . . . . . . . . . . . . . . . . . . . . . . 476.5 841.8 — —Transfer of assets to JBT as a result of the spinoff . . . . . . . . . . . . . . . . . . . . . . . . . . . . . . . . . . . . . . — (185.0) — —Actual return on plan assets . . . . . . . . . . . . . . . . . . . . . . . . . . . . . . . . . . . . . . . . . . . . . . . . . . . . . . . 89.3 (166.5) — —Company contributions . . . . . . . . . . . . . . . . . . . . . . . . . . . . . . . . . . . . . . . . . . . . . . . . . . . . . . . . . . . 63.9 91.7 0.7 1.4Foreign currency exchange rate changes . . . . . . . . . . . . . . . . . . . . . . . . . . . . . . . . . . . . . . . . . . . . . 35.7 (73.8) — —Plan participants’ contributions . . . . . . . . . . . . . . . . . . . . . . . . . . . . . . . . . . . . . . . . . . . . . . . . . . . . 1.6 2.1 — —Benefits paid . . . . . . . . . . . . . . . . . . . . . . . . . . . . . . . . . . . . . . . . . . . . . . . . . . . . . . . . . . . . . . . . . . . (47.2) (33.8) (0.7) (1.4)
Fair value of plan assets at December 31 . . . . . . . . . . . . . . . . . . . . . . . . . . . . . . . . . . . . . . . . . 619.8 476.5 — —
Funded status of the plans (liability) at December 31 . . . . . . . . . . . . . . . . . . . . . . . . . . . . . . . . . . . . . . . . $(134.1) $(192.9) $ (7.9) $(11.0)
Other noncurrent assets . . . . . . . . . . . . . . . . . . . . . . . . . . . . . . . . . . . . . . . . . . . . . . . . . . . . . . . . . . . . . . . $ — $ (1.0) $ — $ —Current portion of accrued pension and other postretirement benefits . . . . . . . . . . . . . . . . . . . . . . . . . . . (1.2) (20.1) (0.8) (0.7)Accrued pension and other postretirement benefits, net of current portion . . . . . . . . . . . . . . . . . . . . . . . (132.9) (171.8) (7.1) (10.3)
Funded status recognized in the consolidated balance sheets at December 31, 2009 and2008 . . . . . . . . . . . . . . . . . . . . . . . . . . . . . . . . . . . . . . . . . . . . . . . . . . . . . . . . . . . . . . . . . . . . $(134.1) $(192.9) $ (7.9) $(11.0)
Amounts recognized in accumulated other comprehensive (income) loss:Unrecognized actuarial (gain) loss (1) . . . . . . . . . . . . . . . . . . . . . . . . . . . . . . . . . . . . . . . . . . . . . . . $ 264.4 $ 311.2 $ (3.8) $ (0.7)Unrecognized prior service credit . . . . . . . . . . . . . . . . . . . . . . . . . . . . . . . . . . . . . . . . . . . . . . . . . . . (0.9) (1.7) (4.1) (5.4)Unrecognized transition asset . . . . . . . . . . . . . . . . . . . . . . . . . . . . . . . . . . . . . . . . . . . . . . . . . . . . . . (1.8) (2.0) — —
Accumulated other comprehensive (income) loss at December 31 . . . . . . . . . . . . . . . . . . . . . $ 261.7 $ 307.5 $ (7.9) $ (6.1)
Plans with underfunded or non-funded projected benefit obligation:Aggregate projected benefit obligation . . . . . . . . . . . . . . . . . . . . . . . . . . . . . . . . . . . . . . . . . . . . . . . $ 753.9 $ 669.4 $ 7.9 $ 11.0Aggregate fair value of plan assets . . . . . . . . . . . . . . . . . . . . . . . . . . . . . . . . . . . . . . . . . . . . . . . . . . 619.8 476.5 — —
Plans with underfunded or non-funded accumulated benefit obligation:Aggregate accumulated benefit obligation . . . . . . . . . . . . . . . . . . . . . . . . . . . . . . . . . . . . . . . . . . . . $ 386.6 $ 367.7Aggregate fair value of plan assets . . . . . . . . . . . . . . . . . . . . . . . . . . . . . . . . . . . . . . . . . . . . . . . . . . 316.3 260.6
(1) We reclassified accumulated other comprehensive losses of $15.1 million from cumulative foreign currency translation adjustments tocumulative deferral of pension and other postretirement benefit losses for the year ended December 31, 2008. Refer to Note 13 foradditional disclosure.
58

The following table summarizes the components of net periodic benefit cost:
PensionsOther Postretirement
Benefits
(In millions) 2009 2008 2007 2009 2008 2007
Components of net annual benefit cost:Service cost . . . . . . . . . . . . . . . . . . . . . . . . . . . . . . . . . . . . . $ 36.6 $ 33.5 $ 31.1 $ 0.1 $ 0.1 $ —Interest cost . . . . . . . . . . . . . . . . . . . . . . . . . . . . . . . . . . . . . 39.7 38.9 48.9 0.6 0.7 1.2Expected return on plan assets . . . . . . . . . . . . . . . . . . . . . . (45.8) (49.9) (62.8) — — —Curtailment . . . . . . . . . . . . . . . . . . . . . . . . . . . . . . . . . . . . . (0.5) — — — — —Settlement cost . . . . . . . . . . . . . . . . . . . . . . . . . . . . . . . . . . — 8.1 — — — —Amortization of transition asset . . . . . . . . . . . . . . . . . . . . . (0.5) (0.6) (0.6) — — —Amortization of prior service cost (credit) . . . . . . . . . . . . . (0.2) 0.3 0.5 (1.3) (1.4) (2.5)Amortization of net actuarial loss (gain) . . . . . . . . . . . . . . 16.1 3.7 9.5 (0.1) (0.1) —
Net annual benefit cost (income) . . . . . . . . . . . . . . . . $ 45.4 $ 34.0 $ 26.6 $(0.7) $(0.7) $ (1.3)
Other changes in plan assets and benefit obligations recognizedin other comprehensive income:Net actuarial loss (gain) (1) . . . . . . . . . . . . . . . . . . . . . . . . $(30.4) $189.2 $ 8.0 $(3.2) $(0.7) $ (0.7)Amortization of net actuarial loss (gain) . . . . . . . . . . . . . . (16.1) (3.7) (9.5) 0.1 0.2 —Prior service cost . . . . . . . . . . . . . . . . . . . . . . . . . . . . . . . . . — 0.9 0.6 — 4.4 0.1Amortization of prior service (cost) credit . . . . . . . . . . . . . 0.2 (0.3) (0.5) 1.3 2.0 2.5Amortization of transition asset . . . . . . . . . . . . . . . . . . . . . 0.5 0.6 0.6 — — —
Total recognized in other comprehensive loss(income) . . . . . . . . . . . . . . . . . . . . . . . . . . . . . . . . . (45.8) 186.7 (0.8) (1.8) 5.9 1.9
Total recognized in net periodic benefit cost andother comprehensive income . . . . . . . . . . . . . . . . . $ (0.4) $220.7 $ 25.8 $(2.5) $ 5.2 $ 0.6
(1) We reclassified accumulated other comprehensive losses of $15.1 million from cumulative foreign currencytranslation adjustments to cumulative deferral of pension and other postretirement benefit losses for the yearended December 31, 2008. Refer to Note 13 for additional disclosure.
The estimated net actuarial loss, prior service cost credit, and transition asset credit for the defined benefitpension plans that will be amortized from accumulated other comprehensive income into net periodic benefit costover the next fiscal year are $11.2 million, $0.1 million and $0.5 million, respectively. The estimated priorservice benefit for the other postretirement benefit plans that will be amortized from accumulated othercomprehensive income into net periodic benefit cost over the next fiscal year is $1.3 million. Prior service costsand the unrecognized actuarial losses are amortized on a straight-line basis over the average remaining serviceperiod of employees eligible to receive benefits under the plan.
Key assumptions—The following weighted-average assumptions were used to determine the benefit obligations:
Pensions
OtherPostretirement
Benefits
2009 2008 2009 2008
Discount rate . . . . . . . . . . . . . . . . . . . . . . . . . . . . . . . . . . . . . . . . . . . . . . . . . . . . 5.76% 5.92% 5.90% 6.10%Rate of compensation increase . . . . . . . . . . . . . . . . . . . . . . . . . . . . . . . . . . . . . . 4.07% 4.04% — —
The weighted average discount rate used in determining benefit obligations dropped from 5.92% in 2008 to5.76% in 2009, which resulted from a decrease in the discount rates used in determining the pension benefitsprincipally in the U.S. plans. The discount rate used for determining the U.K. pension benefit obligationsdecreased from 5.95% in 2008 to 5.87% in 2009. The discount rate used in determining U.S. pension benefitobligations decreased from 6.10% in 2008 to 5.90% in 2009.
59

The following weighted-average assumptions were used to determine net periodic benefit cost:
Pensions
OtherPostretirement
Benefits
2009 2008 2007 2009 2008 2007
Discount rate . . . . . . . . . . . . . . . . . . . . . . . . . . . . . . . . . . . . . 5.92% 6.02% 5.62% 6.10% 6.50% 6.00%Rate of compensation increase . . . . . . . . . . . . . . . . . . . . . . . 4.04% 4.00% 3.85% — — —Expected rate of return on plan assets . . . . . . . . . . . . . . . . . . 8.35% 8.21% 8.46% — — —
Our estimate of expected rate of return on plan assets is based primarily on the historical performance of planassets, current market conditions, our asset allocation and long-term growth expectations.
In 2008, we moved to a fully insured postretirement medical plan in which premium costs are paid by theemployee. The disclosed postretirement medical obligation (included in other postretirement benefits) reflects aflat dollar subsidy paid to retirees hired prior to 2003 that offsets employee premiums to the plan. This subsidywill not be indexed for inflation or expected healthcare cost increases.
Plan assets—Our pension plan assets measured at fair value are as follows at December 31, 2009. Please refer to“Fair Value” in Note 1 for a description of the levels.
December 31, 2009
(In millions) Total Level 1 Level 2 Level 3
Cash . . . . . . . . . . . . . . . . . . . . . . . . . . . . . . . . . . . . . . . . . . . . . . . . . . . . . . . . . . $ 22.9 $ 22.9 $ — $ —Equity securities (1):U.S. companies:Large cap . . . . . . . . . . . . . . . . . . . . . . . . . . . . . . . . . . . . . . . . . . . . . . . . . . 116.3 116.3 — —Small cap . . . . . . . . . . . . . . . . . . . . . . . . . . . . . . . . . . . . . . . . . . . . . . . . . . 51.3 51.3 — —
International companies . . . . . . . . . . . . . . . . . . . . . . . . . . . . . . . . . . . . . . . . . 235.6 235.6 — —Hedge funds (2) . . . . . . . . . . . . . . . . . . . . . . . . . . . . . . . . . . . . . . . . . . . . . . . . . 23.9 — — 23.9Limited partnerships (3) . . . . . . . . . . . . . . . . . . . . . . . . . . . . . . . . . . . . . . . . . . . 35.6 — — 35.6Insurance contracts (4) . . . . . . . . . . . . . . . . . . . . . . . . . . . . . . . . . . . . . . . . . . . . 131.5 — 131.5 —Emerging market bonds . . . . . . . . . . . . . . . . . . . . . . . . . . . . . . . . . . . . . . . . . . . 2.7 2.7 — —
Total assets . . . . . . . . . . . . . . . . . . . . . . . . . . . . . . . . . . . . . . . . . . . . . . . . . . . . . $619.8 $428.8 $131.5 $59.5
(1) This category is comprised of common stock, preferred stock and mutual funds. The investments are valuedusing quoted market prices or the net asset value (“NAV”) per share multiplied by the number of shares heldat December 31, 2009.
(2) This investment is a dedicated value-oriented fund of hedge funds. The fund invests in approximately 10 to20 funds that employ a range of value-oriented investment philosophies. The investment strategy centers onlong-term returns with a strong focus on capital preservation. Hedge funds are valued using the NAV asdetermined by the administrator or custodian of the fund. The investment has a one year lock-up period thatexpires on May 1, 2010 and an annual redemption frequency with a 120-day notice period.
(3) This category includes two limited partnership investments. One partnership seeks high long-term returnsfollowing a value-oriented investment approach. The partnership may invest in a variety of securities,including U.S. and international company equities, debt securities and preferred stocks. The secondinvestment is a partnership with a global asset manager focused on the stock of emerging market small-capcompanies. Limited partnerships are valued using the NAV as determined by the administrator or custodianof the fund. Investments representing approximately 79% of the value in this category have a one yearlock-up period that expires on April 1, 2010 and a quarterly redemption frequency with a 60-day noticeperiod.
60

(4) This primarily represents assets in our Norwegian pension plans. Our pension program for the Norwegianplans follows a pension insurance arrangement. We pay premiums to an insurance company in exchange fora guaranteed return. Our guaranteed return was 3% at December 31, 2009. We have elected a “moderaterisk” investment strategy based on the insurance company’s offerings which includes approximately 4% inU.S. company equities, 5% in international company equities, 65% in government and corporate bonds,16% in real estate and 10% in other types of investments. Insurance contracts are valued at book value,which approximates fair value, and is calculated using the prior year balance plus or minus investmentreturns and changes in cash flows.
The summary of changes in the fair value of the pension plan Level 3 assets for the year ended December 31,2009 is as follows:
(In millions) Hedge FundsLimited
Partnerships
Beginning balance . . . . . . . . . . . . . . . . . . . . . . . . . . . . . . . . . . . . . . . . . . . . . . . . . . . . . . $ — $ 4.2Unrealized gains relating to instruments still held at the reporting date . . . . . . . . . . . . . 3.9 10.6Purchases, sales, issuances and settlements, net . . . . . . . . . . . . . . . . . . . . . . . . . . . . . . . 20.0 20.8
Ending balance . . . . . . . . . . . . . . . . . . . . . . . . . . . . . . . . . . . . . . . . . . . . . . . . . . . . . . . . $23.9 $35.6
Our pension investment strategy emphasizes maximizing returns consistent with minimizing risk. Excluding ourinternational plans with insurance-based investments, 79% of our total pension assets represent the U.S. qualifiedplan, the U.K. and Canadian plans. These plans are invested primarily in equities to maximize the long-termreturns of the plans. The investment managers of these assets, including the hedge funds and limited partnerships,use Graham and Dodd fundamental investment analysis to select securities that have a margin of safety betweenthe price of the security and the estimated value of the security. This value-oriented approach tends to mitigatethe risk of a large equity allocation.
Contributions—We expect to contribute approximately $14.5 million to our pension and other postretirementbenefit plans in 2010. The pension contributions will be primarily for the U.K. and Norway qualified pensionplans. All of the contributions are expected to be in the form of cash. In 2009 and 2008, we contributed $63.9million and $91.7 million to the pension plans, respectively, which included $13.1 million and $61.8 million,respectively, to the U.S. qualified pension plan.
Estimated future benefit payments—The following table summarizes expected benefit payments from our variouspension and postretirement benefit plans through 2019. Actual benefit payments may differ from expectedbenefit payments.
(In millions) Pensions
OtherPostretirement
Benefits
2010 . . . . . . . . . . . . . . . . . . . . . . . . . . . . . . . . . . . . . . . . . . . . . . . . . . . . . . . . . $ 21.7 $0.82011 . . . . . . . . . . . . . . . . . . . . . . . . . . . . . . . . . . . . . . . . . . . . . . . . . . . . . . . . . 25.1 0.82012 . . . . . . . . . . . . . . . . . . . . . . . . . . . . . . . . . . . . . . . . . . . . . . . . . . . . . . . . . 31.7 0.82013 . . . . . . . . . . . . . . . . . . . . . . . . . . . . . . . . . . . . . . . . . . . . . . . . . . . . . . . . . 38.6 0.82014 . . . . . . . . . . . . . . . . . . . . . . . . . . . . . . . . . . . . . . . . . . . . . . . . . . . . . . . . . 36.2 0.82015-2019 . . . . . . . . . . . . . . . . . . . . . . . . . . . . . . . . . . . . . . . . . . . . . . . . . . . . 191.9 3.5
Savings Plans—The FMC Technologies, Inc. Savings and Investment Plan (“Qualified Plan”), a qualified salaryreduction plan under Section 401(k) of the Internal Revenue Code, is a defined contribution plan. Additionally,we have a non-qualified deferred compensation plan, the FMC Technologies, Inc. Non-Qualified Savings andInvestment Plan (“Non-Qualified Plan”), which allows certain highly compensated employees the option to deferthe receipt of a portion of their salary. We match a portion of the participants’ deferrals to both plans. OnOctober 2, 2009, the Board of Directors approved amendments to the U.S. Qualified Plan and U.S.
61

Non-Qualified Plan (“Amended Plans”). Under the Amended Plans, we will make a nonelective contributionequal to four percent of an employee’s eligible earnings every pay period to all new nonunion employees hiredon or after January 1, 2010, and current nonunion employees with less than five years of vesting service as ofDecember 31, 2009. The vesting schedule for the four percent nonelective contribution under the Amended Plansis three years of continuous service with FMC.
Participants in the Non-Qualified Plan earn a return based on hypothetical investments in the same options as our401(k) plan, including FMC Technologies stock. Changes in the market value of these participant investmentsare reflected as an adjustment to the deferred compensation liability with an offset to other income (expense),net. As of December 31, 2009 and 2008, our liability for the Non-Qualified Plan was $26.4 million and $20.5million, respectively, and was recorded in other non-current liabilities. We hedge the financial impact of changesin the participants’ hypothetical investments by purchasing the investments that the participants have chosen.With the exception of FMC Technologies stock, which is maintained at its cost basis, changes in the fair value ofthese investments are recognized as an offset to other income (expense), net. As of December 31, 2009 and 2008,we had investments for the Non-Qualified Plan totaling $19.2 million and $17.6 million, respectively, at fairmarket value and FMC Technologies stock held in trust of $5.7 million and $6.3 million, respectively, at its costbasis.
We recognized expense of $10.6 million, $10.6 million and $9.6 million, for matching contributions to theseplans in 2009, 2008 and 2007, respectively.
NOTE 12. STOCK-BASED COMPENSATION
We sponsor a stock-based compensation plan, which is described below, and have granted awards primarily inthe form of nonvested stock awards (also known as restricted stock in the plan document) and stock options. Thecompensation expense for awards under the plan for each of the years in the three year period endedDecember 31, 2009 is as follows:
2009 2008 2007
(In millions)
Stock-based compensation expenseRestricted stock . . . . . . . . . . . . . . . . . . . . . . . . . . . . . . . . . . . . . . . . . . . . . . . . . . . . . . $27.0 $26.2 $19.4Other . . . . . . . . . . . . . . . . . . . . . . . . . . . . . . . . . . . . . . . . . . . . . . . . . . . . . . . . . . . . . . . 2.2 1.8 1.7
Total stock-based compensation expense . . . . . . . . . . . . . . . . . . . . . . . . . . . . . . $29.2 $28.0 $21.1
Income tax benefits related to stock-based compensation expense . . . . . . . . . . . . . . . . . . . $10.8 $10.4 $ 7.8
Stock-based compensation expense is recognized over the lesser of the stated vesting period (three or four years)or the period until the employee reaches age 62 (the retirement eligible age under the plan). As of December 31,2009, a portion of the stock-based compensation expense related to outstanding awards remains to be recognizedin future periods. The compensation expense related to nonvested awards yet to be recognized totaled $23.5million for restricted stock. These costs are expected to be recognized over a weighted average period of 1.3years.
Incentive compensation and stock plan—The Amended and Restated FMC Technologies, Inc. IncentiveCompensation and Stock Plan (the “Plan”) provides certain incentives and awards to officers, employees,directors and consultants of FMC Technologies or its affiliates. The Plan allows our Board of Directors (the“Board”) to make various types of awards to non-employee directors and the Compensation Committee (the“Committee”) of the Board to make various types of awards to other eligible individuals. Awards includemanagement incentive awards, common stock, stock options, stock appreciation rights, restricted stock and stockunits. All awards are subject to the Plan’s provisions.
62

Under the Plan, 24.0 million shares of our common stock were authorized for awards. These shares are inaddition to shares previously granted by FMC Corporation and converted into approximately 9.0 million sharesof our common stock. As of December 31, 2009, 3.4 million shares are reserved to satisfy existing awards and11.3 million shares are available for future awards.
Management incentive awards may be awards of cash, common stock options, restricted stock or a combinationthereof. Grants of common stock options may be incentive and/or nonqualified stock options. Under the plan, theexercise price for options cannot be less than the market value of our common stock at the date of grant. Optionsvest in accordance with the terms of the award as determined by the Committee, which is generally after threeyears of service, and expire not later than 10 years after the grant date. Restricted stock grants specify anyapplicable performance goals, the time and rate of vesting and such other provisions as determined by theCommittee. Restricted stock grants generally vest after three to four years of service. Additionally, most awardsvest immediately upon a change of control as defined in the Plan agreement.
Stock-based compensation awards to non-employee directors consist of restricted stock units. Awards tonon-employee directors generally vest on the date of our annual stockholder meeting following the date of grant.Stock units are not settled until a director ceases services to the Board. At December 31, 2009, outstandingawards to active and retired non-employee directors included 354 thousand stock units.
Restricted stock—
A summary of the nonvested restricted stock awards as of December 31, 2009, and changes during the year ispresented below:
(Number of restricted stock shares in thousands) SharesWeighted-Average Grant
Date Fair Value
Nonvested at December 31, 2008 . . . . . . . . . . . . . . . . . . . . . . . . . . . . 2,494 $31.92Granted . . . . . . . . . . . . . . . . . . . . . . . . . . . . . . . . . . . . . . . . . . . . 1,075 $28.57Vested . . . . . . . . . . . . . . . . . . . . . . . . . . . . . . . . . . . . . . . . . . . . . (996) $22.34Cancelled . . . . . . . . . . . . . . . . . . . . . . . . . . . . . . . . . . . . . . . . . . . (51) $34.84
Nonvested at December 31, 2009 . . . . . . . . . . . . . . . . . . . . . . . . . . . . 2,522 $34.21
In 2009, we granted time-based restricted stock awards, as well as awards with performance and marketconditions.
For current year performance-based awards, the payout was dependent upon our performance relative to a peergroup of companies with respect to EBITDA growth and return on investment for the year ending December 31,2009. Based on results for the performance period, the payout will be 391 thousand shares at the vesting date inJanuary 2012. Compensation cost has been measured for 2009 based on the actual outcome of the performanceconditions.
For current year market-based awards, the payout was contingent upon our performance relative to the same peergroup of companies with respect to total shareholder return for the year ending December 31, 2009. Based onresults for the performance period, the payout will be 196 thousand shares at the vesting date in January 2012.Compensation cost for these awards has been calculated using the grant date fair market value, as estimated usinga Monte Carlo simulation.
The following summarizes values for restricted stock activity in each of the years in the three year period endedDecember 31, 2009:
2009 2008 2007
Weighted average grant date fair value of restricted stock awards granted . . . . . . . . . . $28.57 $51.01 $31.44Fair value of restricted stock vested (in millions) . . . . . . . . . . . . . . . . . . . . . . . . . . . . . $ 26.6 $ 62.9 $ 33.4
63

On January 4, 2010, restricted stock awards vested and approximately 826 thousand shares were issued toemployees.
Stock options—
There were no options granted, forfeited or expired during the year ended December 31, 2009.
The following shows stock option activity for the year ended December 31, 2009:
(Number of stock options in thousands, intrinsic value in millions)
SharesUnderOption
Weighted-AverageExercisePrice
Weighted-Average
RemainingContractual
TermAggregate
Intrinsic Value
Outstanding at December 31, 2008 . . . . . . . . . . . . . . . . . . . . . . . . 814 $10.14Exercised . . . . . . . . . . . . . . . . . . . . . . . . . . . . . . . . . . . . . . . . (314) $10.17
Outstanding and exercisable at December 31, 2009 . . . . . . . . . . . 500 $10.34 3.3 $23.7
The aggregate intrinsic value reflects the value to the option holders, or the difference between the market priceas of December 31, 2009, and the exercise price of the option, which would have been received by the optionholders had all options been exercised as of that date. While the intrinsic value is representative of the value to begained by the option holders, this value is not indicative of compensation expense recorded by us. Compensationexpense on stock options was calculated on the date of grant using the fair value of the options, as determined bya Black-Scholes option pricing model and the number of options granted, reduced by estimated forfeitures.
The intrinsic value of options exercised for each of the years in the three year period ended December 31, 2009,was $16.8 million, $26.9 million, and $59.5 million, respectively.
NOTE 13. STOCKHOLDERS’ EQUITY
Capital stock—The following is a summary of our capital stock activity during each of the years in the three-yearperiod ended December 31, 2009:
(Number of shares in thousands)Common
Stock Issued
Common StockHeld in EmployeeBenefit Trust
CommonStock Held inTreasury
December 31, 2006 . . . . . . . . . . . . . . . . . . . . . . . . . . . . . . . . . . . . . . . 142,748 226 7,992Stock awards . . . . . . . . . . . . . . . . . . . . . . . . . . . . . . . . . . . . . . . . 411 — (2,204)Treasury stock purchases . . . . . . . . . . . . . . . . . . . . . . . . . . . . . . — — 7,882Net stock sold from employee benefit trust . . . . . . . . . . . . . . . . — (56) —
December 31, 2007 . . . . . . . . . . . . . . . . . . . . . . . . . . . . . . . . . . . . . . . 143,159 170 13,670Stock awards . . . . . . . . . . . . . . . . . . . . . . . . . . . . . . . . . . . . . . . . — — (1,254)Treasury stock purchases . . . . . . . . . . . . . . . . . . . . . . . . . . . . . . — — 5,703Net stock sold from employee benefit trust . . . . . . . . . . . . . . . . — (48) —
December 31, 2008 . . . . . . . . . . . . . . . . . . . . . . . . . . . . . . . . . . . . . . . 143,159 122 18,119Stock awards . . . . . . . . . . . . . . . . . . . . . . . . . . . . . . . . . . . . . . . . — — (1,183)Treasury stock purchases . . . . . . . . . . . . . . . . . . . . . . . . . . . . . . — — 4,270Net stock purchased from employee benefit trust . . . . . . . . . . . . — 2 —
December 31, 2009 . . . . . . . . . . . . . . . . . . . . . . . . . . . . . . . . . . . . . . . 143,159 124 21,206
The plan administrator of the Non-Qualified Plan purchases shares of our common stock on the open market.Such shares are placed in a trust owned by FMC Technologies.
In 2005, we announced a repurchase plan approved by our Board of Directors authorizing the repurchase of up totwo million shares of our issued and outstanding common stock through open market purchases. The Board of
64

Directors authorized extensions of this program, adding five million shares in February 2006 and eight millionshares in February 2007 for a total of 15 million shares of common stock authorized for repurchase. As a resultof the two-for-one stock split on August 31, 2007, the authorization was increased to 30 million shares. In July2008, in connection with the JBT spin-off, and as required by the IRS, the Board of Directors authorized therepurchase of $95.0 million of our outstanding common stock in addition to the 30 million shares describedabove. We repurchased $155.7 million, $324.0 million and $287.4 million of common stock during 2009, 2008and 2007, respectively, under the authorized repurchase program. As of December 31, 2009, approximately5.4 million shares remained available for purchase under the current program which may be executed from timeto time in the open market. We intend to hold repurchased shares in treasury for general corporate purposes,including issuances under our employee stock plans. The treasury shares are accounted for using the cost method.
On May 15, 2009, we amended our Amended and Restated Certificate of Incorporation to increase the number ofauthorized shares of common stock from 195 million shares to 300 million shares.
No cash dividends were paid on our common stock in 2009, 2008 or 2007.
On June 7, 2001, our Board of Directors declared a dividend distribution to each recordholder of common stockof one Preferred Share Purchase Right for each share of common stock outstanding at that date. Each rightentitles the holder to purchase, under certain circumstances related to a change in control of FMC Technologies,one one-hundredth of a share of Series A junior participating preferred stock, without par value, at a price of $95per share (subject to adjustment), subject to the terms and conditions of a Rights Agreement dated June 5, 2001.The rights expire on June 6, 2011, unless redeemed by us at an earlier date. The redemption price of $0.01 perright is subject to adjustment to reflect stock splits, stock dividends or similar transactions. We have reserved800,000 shares of Series A junior participating preferred stock for possible issuance under the agreement.
Accumulated other comprehensive loss—Accumulated other comprehensive loss consisted of the following:
December 31,
(In millions) 2009 2008
Cumulative foreign currency translation adjustments . . . . . . . . . . . . . . . . . . . . . . . . . . . . . . . . $ (44.8) $(122.0)Cumulative deferral of hedging losses, net of tax of $7.3 million and $48.4 million,respectively (1) . . . . . . . . . . . . . . . . . . . . . . . . . . . . . . . . . . . . . . . . . . . . . . . . . . . . . . . . . . . . (13.0) (84.9)
Cumulative deferral of pension and other postretirement benefit losses, net of tax of $85.8million and $101.8 million, respectively . . . . . . . . . . . . . . . . . . . . . . . . . . . . . . . . . . . . . . . . (168.0) (199.6)
Cumulative unrealized losses on investments, net of tax of $0.8 million at December 31,2008 . . . . . . . . . . . . . . . . . . . . . . . . . . . . . . . . . . . . . . . . . . . . . . . . . . . . . . . . . . . . . . . . . . . . — (1.9)
Accumulated other comprehensive loss . . . . . . . . . . . . . . . . . . . . . . . . . . . . . . . . . . . . . . . $(225.8) $(408.4)
(1) We reclassified accumulated other comprehensive losses of $15.1 million, net of $4.2 million of taxes, fromcumulative foreign currency translation adjustments to cumulative deferral of pension and otherpostretirement benefit losses for the year ended December 31, 2008. Refer to Note 11 for related disclosure.
NOTE 14. DERIVATIVE FINANCIAL INSTRUMENTS
We hold derivative financial instruments for the purpose of hedging the risks of certain identifiable andanticipated transactions. The types of risks hedged are those relating to the variability of future earnings and cashflows caused by movements in foreign currency exchange rates and interest rates. We hold the following types ofderivative instruments:
Interest rate swap instruments—The purpose of these instruments is to hedge the uncertainty of anticipatedinterest expense from variable-rate debt obligations and achieve a fixed net interest rate. At December 31, 2009,we held three instruments which in aggregate hedge the interest expense on $100.0 million of variable-rate debt.
65

Foreign exchange rate forward contracts—The purpose of these instruments is to hedge the risk of changes infuture cash flows of purchase or sale commitments denominated in foreign currencies. At December 31, 2009,we held the following material positions:
(In millions)
Notional AmountBought (Sold)
USD Equivalent
Argentinean Peso . . . . . . . . . . . . . . . . . . . . . . . . . . . . . 95.6 25.2Australian Dollar . . . . . . . . . . . . . . . . . . . . . . . . . . . . . . 8.7 7.8Brazilian Real . . . . . . . . . . . . . . . . . . . . . . . . . . . . . . . . (71.2) (40.9)Euro . . . . . . . . . . . . . . . . . . . . . . . . . . . . . . . . . . . . . . . . 25.5 36.5British Pound . . . . . . . . . . . . . . . . . . . . . . . . . . . . . . . . . 102.2 165.3Norwegian Krone . . . . . . . . . . . . . . . . . . . . . . . . . . . . . 2,373.4 411.6Singapore Dollar . . . . . . . . . . . . . . . . . . . . . . . . . . . . . . 147.4 105.0U.S. Dollar . . . . . . . . . . . . . . . . . . . . . . . . . . . . . . . . . . (703.2) (703.2)
Foreign exchange rate instruments embedded in purchase and sale contracts—The purpose of these instrumentsis to match offsetting currency payments for particular projects, or comply with government restrictions on thecurrency used to purchase goods in certain countries. These exposures are in currencies other than the local orfunctional currency of the buyer or seller. At December 31, 2009, our portfolio of these instruments included thefollowing material positions:
(In millions)
Notional AmountBought (Sold)
USD Equivalent
Brazilian Real . . . . . . . . . . . . . . . . . . . . . . . . . . . . . . . . . . (40.6) (23.3)Euro . . . . . . . . . . . . . . . . . . . . . . . . . . . . . . . . . . . . . . . . . . 9.4 13.5British Pound . . . . . . . . . . . . . . . . . . . . . . . . . . . . . . . . . . 9.9 16.1Norwegian Krone . . . . . . . . . . . . . . . . . . . . . . . . . . . . . . . (67.4) (11.7)
The purpose of our foreign currency hedging activities is to manage the volatility associated with anticipatedforeign currency purchases and sales created in the normal course of business. We primarily utilize forwardexchange contracts with maturities of less than three years.
Our policy is to hold derivatives only for the purpose of hedging risks and not for trading purposes where theobjective is solely to generate profit. Generally, we enter into hedging relationships such that changes in the fairvalues or cash flows of the transactions being hedged are expected to be offset by corresponding changes in thefair value of the derivatives. For derivative instruments that qualify as a cash flow hedge, the effective portion ofthe gain or loss of the derivative, which does not include the time value component of a forward currency rate, isreported as a component of other comprehensive income (“OCI”) and reclassified into earnings in the sameperiod or periods during which the hedged transaction affects earnings.
66
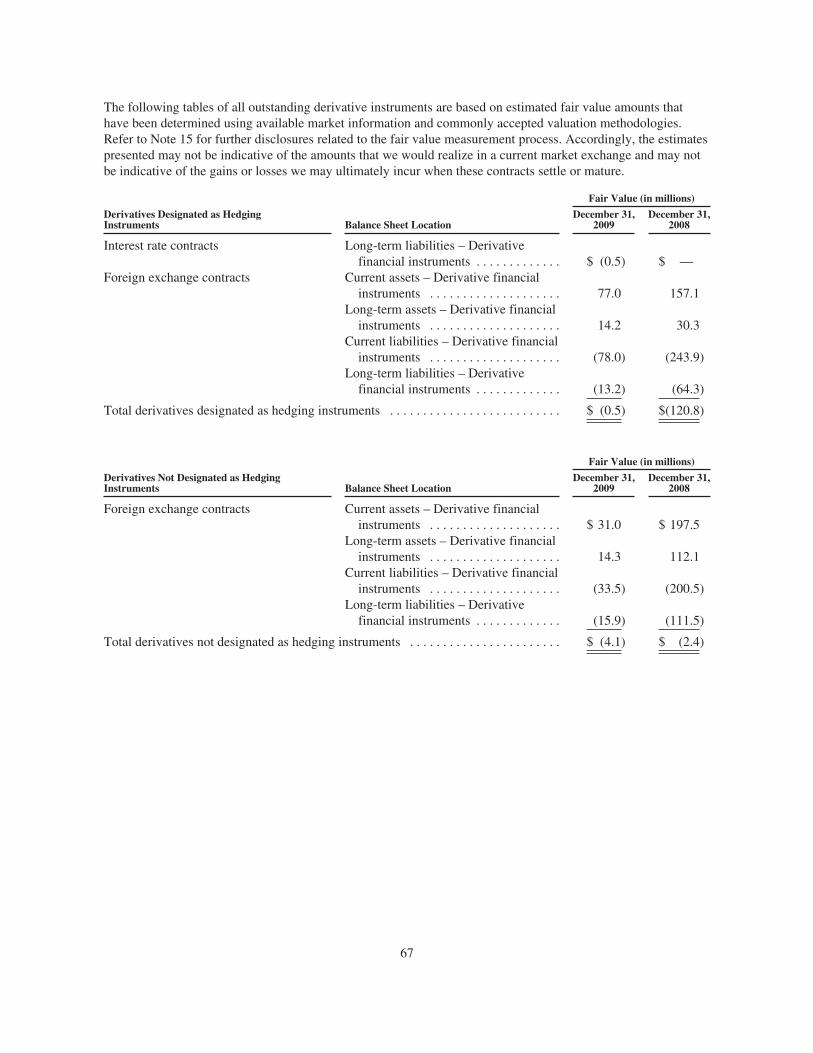
The following tables of all outstanding derivative instruments are based on estimated fair value amounts thathave been determined using available market information and commonly accepted valuation methodologies.Refer to Note 15 for further disclosures related to the fair value measurement process. Accordingly, the estimatespresented may not be indicative of the amounts that we would realize in a current market exchange and may notbe indicative of the gains or losses we may ultimately incur when these contracts settle or mature.
Derivatives Designated as HedgingInstruments Balance Sheet Location
Fair Value (in millions)
December 31,2009
December 31,2008
Interest rate contracts Long-term liabilities – Derivativefinancial instruments . . . . . . . . . . . . . $ (0.5) $ —
Foreign exchange contracts Current assets – Derivative financialinstruments . . . . . . . . . . . . . . . . . . . . 77.0 157.1
Long-term assets – Derivative financialinstruments . . . . . . . . . . . . . . . . . . . . 14.2 30.3
Current liabilities – Derivative financialinstruments . . . . . . . . . . . . . . . . . . . . (78.0) (243.9)
Long-term liabilities – Derivativefinancial instruments . . . . . . . . . . . . . (13.2) (64.3)
Total derivatives designated as hedging instruments . . . . . . . . . . . . . . . . . . . . . . . . . . $ (0.5) $(120.8)
Derivatives Not Designated as HedgingInstruments Balance Sheet Location
Fair Value (in millions)
December 31,2009
December 31,2008
Foreign exchange contracts Current assets – Derivative financialinstruments . . . . . . . . . . . . . . . . . . . . $ 31.0 $ 197.5
Long-term assets – Derivative financialinstruments . . . . . . . . . . . . . . . . . . . . 14.3 112.1
Current liabilities – Derivative financialinstruments . . . . . . . . . . . . . . . . . . . . (33.5) (200.5)
Long-term liabilities – Derivativefinancial instruments . . . . . . . . . . . . . (15.9) (111.5)
Total derivatives not designated as hedging instruments . . . . . . . . . . . . . . . . . . . . . . . $ (4.1) $ (2.4)
67
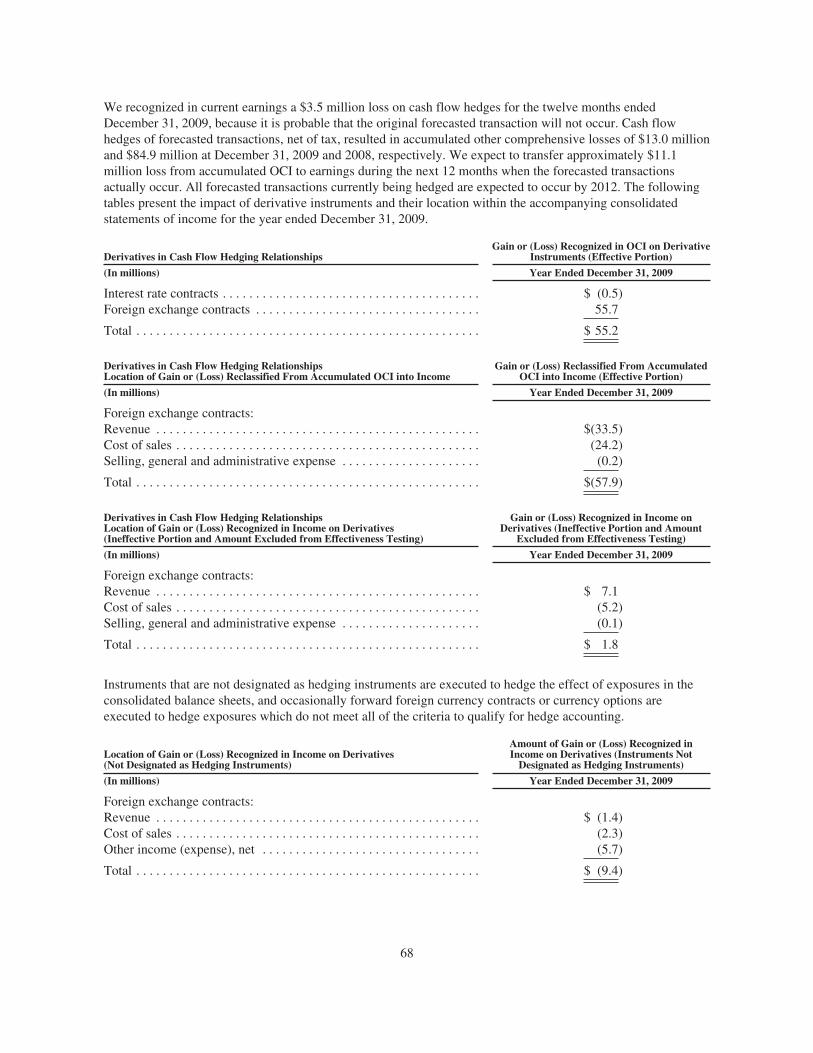
We recognized in current earnings a $3.5 million loss on cash flow hedges for the twelve months endedDecember 31, 2009, because it is probable that the original forecasted transaction will not occur. Cash flowhedges of forecasted transactions, net of tax, resulted in accumulated other comprehensive losses of $13.0 millionand $84.9 million at December 31, 2009 and 2008, respectively. We expect to transfer approximately $11.1million loss from accumulated OCI to earnings during the next 12 months when the forecasted transactionsactually occur. All forecasted transactions currently being hedged are expected to occur by 2012. The followingtables present the impact of derivative instruments and their location within the accompanying consolidatedstatements of income for the year ended December 31, 2009.
Derivatives in Cash Flow Hedging RelationshipsGain or (Loss) Recognized in OCI on Derivative
Instruments (Effective Portion)
(In millions) Year Ended December 31, 2009
Interest rate contracts . . . . . . . . . . . . . . . . . . . . . . . . . . . . . . . . . . . . . . . $ (0.5)Foreign exchange contracts . . . . . . . . . . . . . . . . . . . . . . . . . . . . . . . . . . 55.7
Total . . . . . . . . . . . . . . . . . . . . . . . . . . . . . . . . . . . . . . . . . . . . . . . . . . . . $ 55.2
Derivatives in Cash Flow Hedging RelationshipsLocation of Gain or (Loss) Reclassified From Accumulated OCI into Income
Gain or (Loss) Reclassified From AccumulatedOCI into Income (Effective Portion)
(In millions) Year Ended December 31, 2009
Foreign exchange contracts:Revenue . . . . . . . . . . . . . . . . . . . . . . . . . . . . . . . . . . . . . . . . . . . . . . . . . $(33.5)Cost of sales . . . . . . . . . . . . . . . . . . . . . . . . . . . . . . . . . . . . . . . . . . . . . . (24.2)Selling, general and administrative expense . . . . . . . . . . . . . . . . . . . . . (0.2)
Total . . . . . . . . . . . . . . . . . . . . . . . . . . . . . . . . . . . . . . . . . . . . . . . . . . . . $(57.9)
Derivatives in Cash Flow Hedging RelationshipsLocation of Gain or (Loss) Recognized in Income on Derivatives(Ineffective Portion and Amount Excluded from Effectiveness Testing)
Gain or (Loss) Recognized in Income onDerivatives (Ineffective Portion and Amount
Excluded from Effectiveness Testing)
(In millions) Year Ended December 31, 2009
Foreign exchange contracts:Revenue . . . . . . . . . . . . . . . . . . . . . . . . . . . . . . . . . . . . . . . . . . . . . . . . . $ 7.1Cost of sales . . . . . . . . . . . . . . . . . . . . . . . . . . . . . . . . . . . . . . . . . . . . . . (5.2)Selling, general and administrative expense . . . . . . . . . . . . . . . . . . . . . (0.1)
Total . . . . . . . . . . . . . . . . . . . . . . . . . . . . . . . . . . . . . . . . . . . . . . . . . . . . $ 1.8
Instruments that are not designated as hedging instruments are executed to hedge the effect of exposures in theconsolidated balance sheets, and occasionally forward foreign currency contracts or currency options areexecuted to hedge exposures which do not meet all of the criteria to qualify for hedge accounting.
Location of Gain or (Loss) Recognized in Income on Derivatives(Not Designated as Hedging Instruments)
Amount of Gain or (Loss) Recognized inIncome on Derivatives (Instruments NotDesignated as Hedging Instruments)
(In millions) Year Ended December 31, 2009
Foreign exchange contracts:Revenue . . . . . . . . . . . . . . . . . . . . . . . . . . . . . . . . . . . . . . . . . . . . . . . . . $ (1.4)Cost of sales . . . . . . . . . . . . . . . . . . . . . . . . . . . . . . . . . . . . . . . . . . . . . . (2.3)Other income (expense), net . . . . . . . . . . . . . . . . . . . . . . . . . . . . . . . . . (5.7)
Total . . . . . . . . . . . . . . . . . . . . . . . . . . . . . . . . . . . . . . . . . . . . . . . . . . . . $ (9.4)
68

NOTE 15. FAIR VALUEMEASUREMENTS
Financial assets and liabilities measured at fair value on a recurring basis at December 31, 2008 and 2009 are asfollows. Please refer to “Fair Value” in Note 1 for a description of the levels.
December 31, 2009
(In millions) Total Level 1 Level 2 Level 3
AssetsInvestments . . . . . . . . . . . . . . . . . . . . . . . . . . . . . . . . . . . $ 25.2 $25.2 $ — $—Derivatives (1) . . . . . . . . . . . . . . . . . . . . . . . . . . . . . . . . . 136.5 — 136.5 —
Total assets . . . . . . . . . . . . . . . . . . . . . . . . . . . . . . . . . . . . . . . $161.7 $25.2 $136.5 $—
LiabilitiesDerivatives (1) . . . . . . . . . . . . . . . . . . . . . . . . . . . . . . . . . $141.1 $ — $141.1 $—
December 31, 2008
(In millions) Total Level 1 Level 2 Level 3
AssetsInvestments . . . . . . . . . . . . . . . . . . . . . . . . . . . . . . . . . . . $ 35.1 $35.1 $ — $—Derivatives (1) . . . . . . . . . . . . . . . . . . . . . . . . . . . . . . . . . 497.0 — 497.0 —
Total assets . . . . . . . . . . . . . . . . . . . . . . . . . . . . . . . . . . . . . . . $532.1 $35.1 $497.0 $—
LiabilitiesDerivatives (1) . . . . . . . . . . . . . . . . . . . . . . . . . . . . . . . . . $620.2 $ — $620.2 $—
(1) See additional disclosure related to derivative financial instruments in Note 14.
Fair value measurements for assets or liabilities are valued based on quoted prices that we have the ability toaccess in public markets. We use the income approach as the valuation technique to measure the fair value offoreign currency derivative instruments on a recurring basis. This approach calculates the present value of thefuture cash flow by measuring the change from the derivative contract rate and the published market indicativecurrency rate, multiplied by the contract notional values. Credit risk is then incorporated by reducing thederivative’s fair value in asset positions by the result of multiplying the present value of the portfolio by thecounterparty’s published credit spread. Portfolios in a liability position are adjusted by the same calculation;however, a spread representing our credit spread is used. Our credit spread and the credit spread of othercounterparties not publicly available are approximated by using the spread of similar companies in the sameindustry, of similar size and with the same credit rating. The derivative asset values presented in the precedingtable were reduced by $0.2 million, and the derivative liability values reduced by $0.1 million to approximate fairvalue, including credit risk.
At the present time, we have no credit-risk-related contingent features in our agreements with the financialinstitutions which would require us to post collateral for derivative positions in a liability position.
Other fair value disclosures—The carrying amounts of cash and cash equivalents, trade receivables, accountspayable, short-term debt, commercial paper, and debt associated with revolving credit facilities, as well asamounts included in other current assets and other current liabilities that meet the definition of financialinstruments, approximate fair value because of their short-term maturities.
Credit risk—By their nature, financial instruments involve risk including credit risk for non-performance bycounterparties. Financial instruments that potentially subject us to credit risk primarily consist of tradereceivables and derivative contracts. We manage the credit risk on financial instruments by transacting only withwhat management believes are financially secure counterparties, requiring credit approvals and credit limits, andmonitoring counterparties’ financial condition. Our maximum exposure to credit loss in the event of
69
non-performance by the counterparty is limited to the amount drawn and outstanding on the financial instrument.Allowances for losses on trade receivables are established based on collectability assessments. We mitigate creditrisk on derivative contracts by executing contracts only with counterparties that consent to a master nettingagreement, which permits the net settlement of the gross derivative assets against the gross derivative liabilities.
NOTE 16. RELATED PARTY TRANSACTIONS
John Bean Technologies Corporation—On July 12, 2008, our Board of Directors approved the spin-off of 100%of our FoodTech and Airport Systems businesses to our shareholders. The spin-off was accomplished on July 31,2008 through a tax-free dividend of all outstanding shares of JBT, which is now an independent public companytraded on the New York Stock Exchange (symbol JBT).
We entered into certain agreements which defined key provisions related to the spin-off and the relationshipbetween the two companies after the spin-off, including, among others, a separation and distribution agreementbetween FMC Technologies and JBT (the “Separation and Distribution Agreement”) and a tax sharing agreementbetween FMC Technologies and JBT (the “Tax Sharing Agreement”). The Separation and DistributionAgreement required us to contribute certain business segments and their associated assets and liabilities to JBT.As a result of the contribution, we have no interest in JBT’s assets and business and, subject to certain exceptionsdescribed below, generally have no obligation with respect to JBT’s liabilities. Similarly, JBT has no interest inour assets and generally has no obligation with respect to our liabilities related to retained businesses after thedistribution. We generally made no representations or warranties as to the assets, businesses or liabilitiestransferred or assumed as part of the contribution, and generally made the transfers on an “as is, where is” basis.JBT agreed to use reasonable best efforts to cause us to be released from all FMC Technologies obligations toguarantee or otherwise support any liabilities or obligations of JBT not later than July 31, 2010. JBT agreed toreimburse and otherwise indemnify and hold us harmless for any and all costs and charges associated with andsuch liabilities or obligations of JBT or any guarantee to third parties not terminated prior to July 31, 2008.
As parties to the Separation and Distribution Agreement, FMC Technologies and JBT each indemnify the otherparty from liabilities arising from their respective businesses or contracts, from liabilities arising from breach ofthe Separation and Distribution Agreement and from certain claims made prior to the spin-off of JBT (Note 18).
The Tax Sharing Agreement sets forth the responsibilities of the parties with respect to, among other things,liabilities for federal, state, local and foreign taxes for periods before and including the spin-off, the preparationand filing of tax returns for such periods, and disputes with taxing authorities regarding taxes for such periods.The Tax Sharing Agreement also provides that JBT will indemnify us for any tax liability we may incur as aresult of any action taken by JBT after the spin-off which causes the distribution to not qualify as tax-free forU.S. federal income tax purposes under the terms of the private letter ruling received from the IRS. We willindemnify JBT against any tax liability in the case any action taken by us causes the distribution to not qualify astax-free.
FMC Corporation—FMC Technologies was a subsidiary of FMC Corporation until the distribution of FMCTechnologies’ common stock by FMC Corporation, which was completed on December 31, 2001.
In June 2001, FMC Corporation contributed to us substantially all of the assets and liabilities of the businessesthat comprise FMC Technologies (the “Separation”). FMC Technologies and FMC Corporation entered intocertain agreements which defined key provisions related to the Separation and the ongoing relationship betweenthe two companies after the Separation. These agreements included a Separation and Distribution Agreement(“SDA”) and a Tax Sharing Agreement, which provided that FMC Technologies and FMC Corporation wouldmake payments between them as appropriate to properly allocate tax liabilities for pre-Separation periods.
As parties to the SDA, FMC Corporation and FMC Technologies each indemnify the other party from liabilitiesarising from their respective businesses or contracts, from liabilities arising from breach of the SDA, from certainclaims made prior to our spin-off from FMC Corporation, and for claims related to discontinued operations(Note 18).
70
NOTE 17. WARRANTY OBLIGATIONS
We provide warranties of various lengths and terms to certain of our customers based on standard terms andconditions and negotiated agreements. We provide for the estimated cost of warranties at the time revenue isrecognized for products where reliable, historical experience of warranty claims and costs exists. We alsoprovide warranty liability when additional specific obligations are identified. The obligation reflected in othercurrent liabilities in the consolidated balance sheets is based on historical experience by product and considersfailure rates and the related costs in correcting a product failure. Warranty cost and accrual information is asfollows:
(In millions) 2009 2008
Balance at beginning of year . . . . . . . . . . . . . . . . . . . . . . . . . . . . . . . . . . . . . . . . . . . . . . . . . . . . . $ 13.5 $ 12.4Expenses for new warranties . . . . . . . . . . . . . . . . . . . . . . . . . . . . . . . . . . . . . . . . . . . . . . . . . . . . . 24.6 18.3Adjustments to existing accruals . . . . . . . . . . . . . . . . . . . . . . . . . . . . . . . . . . . . . . . . . . . . . . . . . . (6.5) (6.9)Claims paid . . . . . . . . . . . . . . . . . . . . . . . . . . . . . . . . . . . . . . . . . . . . . . . . . . . . . . . . . . . . . . . . . . . (14.7) (10.3)
Balance at end of year . . . . . . . . . . . . . . . . . . . . . . . . . . . . . . . . . . . . . . . . . . . . . . . . . . . . . . $ 16.9 $ 13.5
NOTE 18. COMMITMENTS AND CONTINGENT LIABILITIES
Commitments—We lease office space, manufacturing facilities and various types of manufacturing and dataprocessing equipment. Leases of real estate generally provide for payment of property taxes, insurance andrepairs by us. Substantially all leases are classified as operating leases for accounting purposes. Rent expenseunder operating leases amounted to $77.7 million, $72.6 million and $59.8 million in 2009, 2008 and 2007,respectively.
Minimum future rental payments under noncancelable operating leases amounted to $405.8 million as ofDecember 31, 2009, and are payable as follows: $57.0 million in 2010, $51.1 million in 2011, $44.1 million in2012, $38.5 million in 2013, $36.9 million in 2014 and $178.2 million thereafter. Minimum future rentalpayments to be received under noncancelable subleases totaled $9.5 million at December 31, 2009.
Contingent liabilities associated with guarantees—In the ordinary course of business with customers, vendorsand others, we issue standby letters of credit, performance bonds, surety bonds and other guarantees. Thesefinancial instruments, which totaled $607.0 million at December 31, 2009, represented guarantees of our futureperformance and $24.6 million of bank guarantees and letters of credit to secure a portion of our existingfinancial obligations. The majority of these financial instruments expire within two years; we expect to replacethem through the issuance of new or the extension of existing letters of credit and surety bonds.
We are the named guarantor on certain performance bonds totaling $12.8 million at December 31, 2009, issuedby our former subsidiary, JBT; however, we are fully indemnified by JBT pursuant to the terms and conditions ofthe Separation and Distribution Agreement, dated July 31, 2008, between FMC Technologies and JBT.Management does not expect any of these financial instruments to result in losses that if incurred, would have amaterial adverse effect on our consolidated financial position, results of operations or cash flows.
Management believes that the ultimate resolution of our known contingencies will not materially affect ourconsolidated financial position or results of operations.
Contingent liabilities associated with legal matters—We are the named defendant in a number of lawsuits;however, while the results of litigation cannot be predicted with certainty, management believes that the mostprobable, ultimate resolution of these matters will not have a material adverse effect on our consolidatedfinancial position, results of operations or cash flows.
71

In addition, under the SDA with FMC Corporation, which contains key provisions relating to our 2001 spin-offfrom FMC Corporation, FMC Corporation is required to indemnify us for certain claims made prior to the spin-off, as well as for other claims related to discontinued operations. We expect that FMC Corporation will bearresponsibility for the majority of these claims. We also have a Separation and Distribution Agreement with JBT,which contains key provisions relating to the spin-off of our Airport and FoodTech businesses in 2008. JBT isrequired to indemnify us for certain claims made prior to the spin-off, as well as for other claims related to JBTproducts or business operations. Some of these claims may include those described above involving FMCCorporation. While the ultimate responsibility for claims involving FMC Technologies, FMC Corporation or JBTcannot yet be determined due to lack of identification of the products or premises involved, we expect that FMCCorporation will bear responsibility for a majority of these claims initiated subsequent to the spin-off and thatJBT Corporation will bear responsibility for other claims initiated subsequent to the spin-off.
NOTE 19. BUSINESS SEGMENTS
Our determination of our reportable segments was made on the basis of our strategic business units and thecommonalities among the products and services within each segment, and corresponds to the manner in whichour management reviews and evaluates operating performance.
Our reportable segments are:
• Energy Production Systems—designs and manufactures systems and provides services used by oil and gascompanies involved in land and offshore, particularly deepwater, exploration and production of crude oiland gas.
• Energy Processing Systems—designs, manufactures and supplies technologically advanced high pressurevalves and fittings for oilfield service customers; also manufactures and supplies liquid and gasmeasurement and transportation equipment and systems to customers involved in the production,transportation and processing of crude oil, natural gas and petroleum-based refined products.
Total revenue by segment includes intersegment sales, which are made at prices approximating those that theselling entity is able to obtain on external sales. Segment operating profit is defined as total segment revenue lesssegment operating expenses. The following items have been excluded in computing segment operating profit:corporate staff expense, net interest income (expense) associated with corporate debt facilities, income taxes, andother revenue and other (expense), net.
72

Segment revenue and segment operating profit
Year Ended December 31,
(In millions) 2009 2008 2007
Revenue:Energy Production Systems (1) . . . . . . . . . . . . . . . . . . . . . . . . . . . . . . . . . . . . . . . $3,721.9 $3,670.7 $2,882.2Energy Processing Systems . . . . . . . . . . . . . . . . . . . . . . . . . . . . . . . . . . . . . . . . . . 698.4 883.2 767.7Other revenue (2) and intercompany eliminations . . . . . . . . . . . . . . . . . . . . . . . . (14.9) (3.0) (1.0)
Total revenue . . . . . . . . . . . . . . . . . . . . . . . . . . . . . . . . . . . . . . . . . . . . . . . . . . . . . $4,405.4 $4,550.9 $3,648.9
Income before income taxes:Segment operating profit:Energy Production Systems . . . . . . . . . . . . . . . . . . . . . . . . . . . . . . . . . . . . . . . . . $ 516.1 $ 420.7 $ 287.9Energy Processing Systems . . . . . . . . . . . . . . . . . . . . . . . . . . . . . . . . . . . . . . . . . . 102.4 165.5 142.5
Total segment operating profit . . . . . . . . . . . . . . . . . . . . . . . . . . . . . . . . . . . . . . . 618.5 586.2 430.4
Corporate items:Corporate expense (3) . . . . . . . . . . . . . . . . . . . . . . . . . . . . . . . . . . . . . . . . . . . . . . (35.4) (37.5) (35.1)Other revenue (2) and other (expense), net (4) . . . . . . . . . . . . . . . . . . . . . . . . . . . (57.2) (42.3) 9.1Net interest expense . . . . . . . . . . . . . . . . . . . . . . . . . . . . . . . . . . . . . . . . . . . . . . . (9.5) (1.5) (9.3)
Total corporate items . . . . . . . . . . . . . . . . . . . . . . . . . . . . . . . . . . . . . . . . . . . . . . . (102.1) (81.3) (35.3)
Income from continuing operations before income taxes attributable to FMCTechnologies, Inc. . . . . . . . . . . . . . . . . . . . . . . . . . . . . . . . . . . . . . . . . . . . . . . $ 516.4 $ 504.9 $ 395.1
(1) We have one customer in our Energy Production Systems segment that comprises approximately 16%, 19%and 10% of our consolidated revenue for the years ended December 31, 2009, 2008 and 2007, respectively.
(2) Other revenue comprises certain unrealized gains and losses on derivative instruments related to unexecutedsales contracts.
(3) Corporate expense primarily includes corporate staff expenses.
(4) Other expense, net, generally includes stock-based compensation, other employee benefits, LIFOadjustments, certain foreign exchange gains and losses, and the impact of unusual or strategic transactionsnot representative of segment operations.
73

Segment operating capital employed and segment assets
December 31,
(In millions) 2009 2008
Segment operating capital employed (1):Energy Production Systems . . . . . . . . . . . . . . . . . . . . . . . . . . . . . . . . . . . . . . . . . . . . . . $1,022.0 $ 917.2Energy Processing Systems . . . . . . . . . . . . . . . . . . . . . . . . . . . . . . . . . . . . . . . . . . . . . . . 347.6 243.0Intercompany eliminations . . . . . . . . . . . . . . . . . . . . . . . . . . . . . . . . . . . . . . . . . . . . . . . — (0.1)
Total segment operating capital employed . . . . . . . . . . . . . . . . . . . . . . . . . . . . . . . 1,369.6 1,160.1Segment liabilities included in total segment operating capital employed (2) . . . . . . . . 1,508.9 1,493.7Corporate (3) . . . . . . . . . . . . . . . . . . . . . . . . . . . . . . . . . . . . . . . . . . . . . . . . . . . . . . . . . . 631.0 927.1
Total assets . . . . . . . . . . . . . . . . . . . . . . . . . . . . . . . . . . . . . . . . . . . . . . . . . . . $3,509.5 $3,580.9
Segment assets:Energy Production Systems . . . . . . . . . . . . . . . . . . . . . . . . . . . . . . . . . . . . . . . . . . . . . . $2,397.7 $2,242.1Energy Processing Systems . . . . . . . . . . . . . . . . . . . . . . . . . . . . . . . . . . . . . . . . . . . . . . . 486.2 413.7Intercompany eliminations . . . . . . . . . . . . . . . . . . . . . . . . . . . . . . . . . . . . . . . . . . . . . . . (5.4) (2.0)
Total segment assets . . . . . . . . . . . . . . . . . . . . . . . . . . . . . . . . . . . . . . . . . . . . . . . . 2,878.5 2,653.8Corporate (3) . . . . . . . . . . . . . . . . . . . . . . . . . . . . . . . . . . . . . . . . . . . . . . . . . . . . . . . . . . 631.0 927.1
Total assets . . . . . . . . . . . . . . . . . . . . . . . . . . . . . . . . . . . . . . . . . . . . . . . . . . . $3,509.5 $3,580.9
(1) FMC Technologies’ management views segment operating capital employed, which consists of assets, netof its liabilities, as the primary measure of segment capital. Segment operating capital employed excludesdebt, pension liabilities, income taxes and LIFO inventory reserves.
(2) Segment liabilities included in total segment operating capital employed consist of trade and other accountspayable, advance payments and progress billings, accrued payroll and other liabilities.
(3) Corporate includes cash, LIFO inventory reserves, deferred income tax balances, property, plant andequipment not associated with a specific segment, pension assets and the fair value of derivatives.
Geographic segment information
Geographic segment sales were identified based on the location where our products and services were delivered.Geographic segment long-lived assets represent property, plant and equipment, net.
Year Ended December 31,
(In millions) 2009 2008 2007
Revenue (by location of customer):United States . . . . . . . . . . . . . . . . . . . . . . . . . . . . . . . . . . . . . . . . . . . . . . . . . $ 996.2 $1,110.1 $ 908.5Norway . . . . . . . . . . . . . . . . . . . . . . . . . . . . . . . . . . . . . . . . . . . . . . . . . . . . . 911.6 1,068.1 739.2All other countries . . . . . . . . . . . . . . . . . . . . . . . . . . . . . . . . . . . . . . . . . . . . . 2,497.6 2,372.7 2,001.2
Total revenue . . . . . . . . . . . . . . . . . . . . . . . . . . . . . . . . . . . . . . . . . . . . . $4,405.4 $4,550.9 $3,648.9
December 31,
(In millions) 2009 2008 (1) 2007 (1)
Long-lived assets:United States . . . . . . . . . . . . . . . . . . . . . . . . . . . . . . . . . . . . . . . . . . . . . . . . . . . . . $184.4 $178.5 $147.8Norway . . . . . . . . . . . . . . . . . . . . . . . . . . . . . . . . . . . . . . . . . . . . . . . . . . . . . . . . . . 160.3 118.2 114.2Brazil . . . . . . . . . . . . . . . . . . . . . . . . . . . . . . . . . . . . . . . . . . . . . . . . . . . . . . . . . . . 66.8 43.3 43.6All other countries . . . . . . . . . . . . . . . . . . . . . . . . . . . . . . . . . . . . . . . . . . . . . . . . . 170.4 154.9 146.7
Total long-lived assets . . . . . . . . . . . . . . . . . . . . . . . . . . . . . . . . . . . . . . . . . . $581.9 $494.9 $452.3
(1) We have revised long-lived assets at December 31, 2008 and 2007, by excluding goodwill; intangible assets,net; and certain other non-current assets.
74
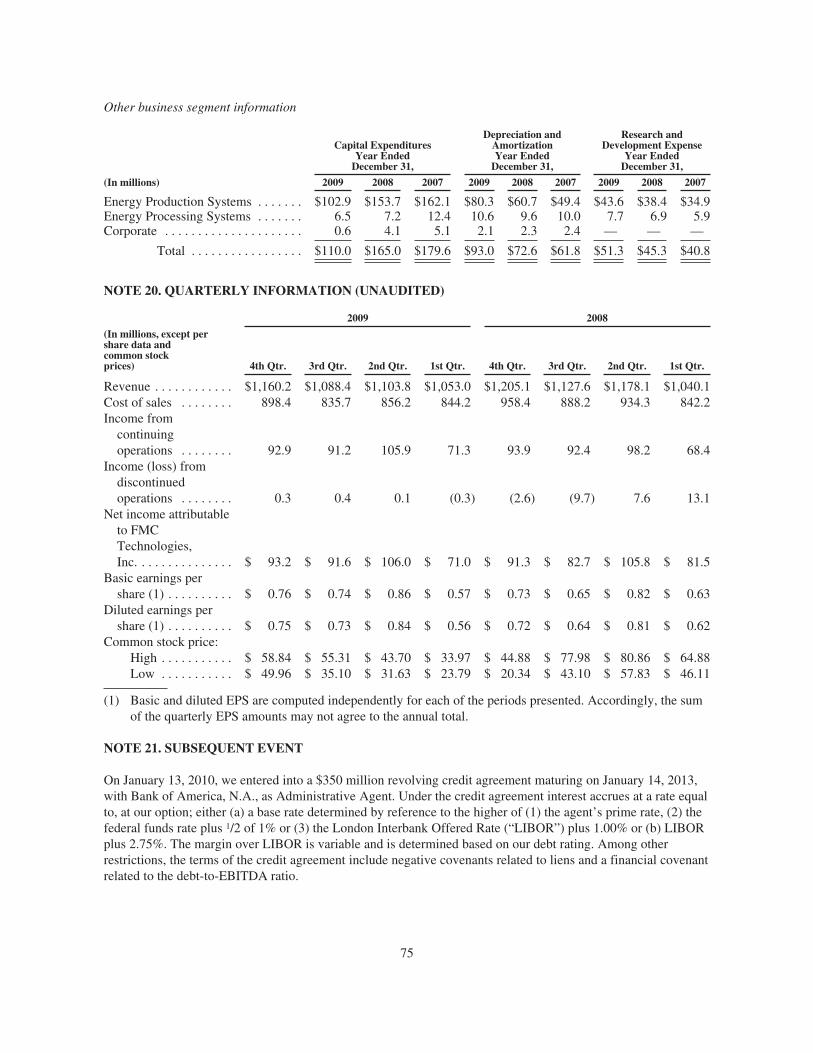
Other business segment information
Capital ExpendituresYear EndedDecember 31,
Depreciation andAmortizationYear EndedDecember 31,
Research andDevelopment Expense
Year EndedDecember 31,
(In millions) 2009 2008 2007 2009 2008 2007 2009 2008 2007
Energy Production Systems . . . . . . . $102.9 $153.7 $162.1 $80.3 $60.7 $49.4 $43.6 $38.4 $34.9Energy Processing Systems . . . . . . . 6.5 7.2 12.4 10.6 9.6 10.0 7.7 6.9 5.9Corporate . . . . . . . . . . . . . . . . . . . . . 0.6 4.1 5.1 2.1 2.3 2.4 — — —
Total . . . . . . . . . . . . . . . . . $110.0 $165.0 $179.6 $93.0 $72.6 $61.8 $51.3 $45.3 $40.8
NOTE 20. QUARTERLY INFORMATION (UNAUDITED)
2009 2008
(In millions, except pershare data andcommon stockprices) 4th Qtr. 3rd Qtr. 2nd Qtr. 1st Qtr. 4th Qtr. 3rd Qtr. 2nd Qtr. 1st Qtr.
Revenue . . . . . . . . . . . . $1,160.2 $1,088.4 $1,103.8 $1,053.0 $1,205.1 $1,127.6 $1,178.1 $1,040.1Cost of sales . . . . . . . . 898.4 835.7 856.2 844.2 958.4 888.2 934.3 842.2Income fromcontinuingoperations . . . . . . . . 92.9 91.2 105.9 71.3 93.9 92.4 98.2 68.4
Income (loss) fromdiscontinuedoperations . . . . . . . . 0.3 0.4 0.1 (0.3) (2.6) (9.7) 7.6 13.1
Net income attributableto FMCTechnologies,Inc. . . . . . . . . . . . . . . $ 93.2 $ 91.6 $ 106.0 $ 71.0 $ 91.3 $ 82.7 $ 105.8 $ 81.5
Basic earnings pershare (1) . . . . . . . . . . $ 0.76 $ 0.74 $ 0.86 $ 0.57 $ 0.73 $ 0.65 $ 0.82 $ 0.63
Diluted earnings pershare (1) . . . . . . . . . . $ 0.75 $ 0.73 $ 0.84 $ 0.56 $ 0.72 $ 0.64 $ 0.81 $ 0.62
Common stock price:High . . . . . . . . . . . $ 58.84 $ 55.31 $ 43.70 $ 33.97 $ 44.88 $ 77.98 $ 80.86 $ 64.88Low . . . . . . . . . . . $ 49.96 $ 35.10 $ 31.63 $ 23.79 $ 20.34 $ 43.10 $ 57.83 $ 46.11
(1) Basic and diluted EPS are computed independently for each of the periods presented. Accordingly, the sumof the quarterly EPS amounts may not agree to the annual total.
NOTE 21. SUBSEQUENT EVENT
On January 13, 2010, we entered into a $350 million revolving credit agreement maturing on January 14, 2013,with Bank of America, N.A., as Administrative Agent. Under the credit agreement interest accrues at a rate equalto, at our option; either (a) a base rate determined by reference to the higher of (1) the agent’s prime rate, (2) thefederal funds rate plus 1/2 of 1% or (3) the London Interbank Offered Rate (“LIBOR”) plus 1.00% or (b) LIBORplus 2.75%. The margin over LIBOR is variable and is determined based on our debt rating. Among otherrestrictions, the terms of the credit agreement include negative covenants related to liens and a financial covenantrelated to the debt-to-EBITDA ratio.
75
ITEM 9. CHANGES IN AND DISAGREEMENTSWITH ACCOUNTANTS ON ACCOUNTING ANDFINANCIAL DISCLOSURE
None.
ITEM 9A. CONTROLS AND PROCEDURES
Evaluation of Disclosure Controls and Procedures
Under the direction of our principal executive officer and principal financial officer, we have evaluated theeffectiveness of our disclosure controls and procedures as of December 31, 2009. We have concluded that ourdisclosure controls and procedures were
i) effective in ensuring that information required to be disclosed is recorded, processed, summarized andreported within the time periods specified in the SEC’s rules and forms; and
ii) effective in ensuring that information required to be disclosed is accumulated and communicated tomanagement, including our principal executive officer and principal financial officer, as appropriate toallow timely decisions regarding required disclosure.
Management’s Annual Report on Internal Control over Financial Reporting
Our management is responsible for establishing and maintaining adequate internal control over financialreporting, as such term is defined in Exchange Act Rules 13a-15(f). Our internal control over financial reportingis a process designed under the supervision of the Chief Executive Officer and Chief Financial Officer to providereasonable assurance regarding the reliability of financial reporting and the preparation of our financialstatements for external purposes in accordance with generally accepted accounting principles. Under thesupervision and with the participation of our management, including our principal executive officer and principalfinancial officer, we conducted an evaluation of the effectiveness of our internal control over financial reportingbased on the framework in Internal Control—Integrated Framework issued by the Committee of SponsoringOrganizations of the Treadway Commission. Based on our evaluation under the framework in Internal Control—Integrated Framework, our management concluded that our internal control over financial reporting waseffective in providing this reasonable assurance as of December 31, 2009. During the quarter endedDecember 31, 2009 there were no changes in our internal control over financial reporting that have materiallyaffected, or are reasonably likely to materially affect, our internal control over financial reporting.
The effectiveness of our internal control over financial reporting as of December 31, 2009, has been audited byKPMG LLP, an independent registered public accounting firm, as stated in their report which is included herein.
ITEM 9B. OTHER INFORMATION
None.
76
PART III
ITEM 10. DIRECTORS, EXECUTIVE OFFICERS AND CORPORATE GOVERNANCE
Information regarding our directors is incorporated herein by reference from the section entitled “Our Board ofDirectors” of the Proxy Statement for the 2010 Annual Meeting of Stockholders. Our Board of Directors hasthree standing committees: an Audit Committee, a Compensation Committee and a Nominating and GovernanceCommittee. Each of these committees operates pursuant to a written charter setting out the functions andresponsibilities of the committee. The charters for the Audit Committee, the Compensation Committee and theNominating and Governance Committee of the Board of Directors may be found on our website atwww.fmctechnologies.com under “About Us—Corporate Governance” and are also available in print to anystockholder upon request without charge by submitting a written request to Jeffrey W. Carr, Vice President,General Counsel and Secretary, FMC Technologies, Inc., 1803 Gears Road, Houston, Texas 77067. Informationconcerning audit committee financial experts on the Audit Committee of the Board of Directors is incorporatedherein by reference from the section entitled “Committees of the Board of Directors—Audit Committee” of theProxy Statement for the 2010 Annual Meeting of Stockholders.
Information regarding our executive officers is presented in the section entitled “Executive Officers of theRegistrant” in Part I of this Annual Report on Form 10-K.
Information regarding compliance by our directors and executive officers with Section 16(a) of the Securities andExchange Act of 1934, as amended, is incorporated herein by reference from the section entitled “Section 16(a)Beneficial Ownership Reporting Compliance” of the Proxy Statement for the 2010 Annual Meeting ofStockholders.
We have adopted a code of ethics, which includes provisions that apply to our principal executive officer,principal financial officer, principal accounting officer or controller and other key professionals serving in afinance, accounting, treasury, tax or investor relations role. A copy of our code of ethics may be found on ourwebsite at www.fmctechnologies.com under “About Us—Corporate Governance” and is available in print tostockholders without charge by submitting a request to the address set forth above.
ITEM 11. EXECUTIVE COMPENSATION
Information required by this item is incorporated herein by reference from the sections entitled “DirectorCompensation,” “Compensation Committee Interlocks and Insider Participation in Compensation Decisions” and“Executive Compensation” of the Proxy Statement for the 2010 Annual Meeting of Stockholders.
ITEM 12. SECURITY OWNERSHIP OF CERTAIN BENEFICIAL OWNERS ANDMANAGEMENTAND RELATED STOCKHOLDERMATTERS
Information required by this item is incorporated herein by reference from the section entitled “SecurityOwnership of FMC Technologies Management and Holders of More Than Five Percent of Outstanding Shares ofCommon Stock” of the Proxy Statement for the 2010 Annual Meeting of Stockholders. Additionally, Equity PlanCompensation Information is presented in Item 5 of Part II of this Annual Report on Form 10-K.
ITEM 13. CERTAIN RELATIONSHIPS AND RELATED TRANSACTIONS, AND DIRECTORINDEPENDENCE
Information required by this item is incorporated herein by reference from the sections entitled “Transactionswith Related Persons” and “Director Independence” of the Proxy Statement for the 2010 Annual Meeting ofStockholders.
ITEM 14. PRINCIPAL ACCOUNTANT FEES AND SERVICES
Information required by this item is incorporated herein by reference from the section entitled “Proposal to Ratifythe Appointment of KPMG LLP” of the Proxy Statement for the 2010 Annual Meeting of Stockholders.
77
PART IV
ITEM 15. EXHIBITS AND FINANCIAL STATEMENT SCHEDULES
(a) The following documents are filed as part of this Report:
1. Financial Statements and Related Report of Independent Registered Public Accounting Firm:
Report of Independent Registered Public Accounting Firm
Consolidated Statements of Income for the Years Ended December 31, 2009, 2008 and 2007
Consolidated Balance Sheets as of December 31, 2009 and 2008
Consolidated Statements of Cash Flows for the Years Ended December 31, 2009, 2008 and 2007
Consolidated Statements of Changes in Stockholders’ Equity for the Years Ended December 31, 2009,2008 and 2007
Notes to Consolidated Financial Statements
2. Financial Statement Schedule and related Report of Independent Registered Public Accounting Firm:
See “Schedule II—Valuation and Qualifying Accounts” and the related Report of IndependentRegistered Public Accounting Firm included herein. All other schedules are omitted because of theabsence of conditions under which they are required or because information called for is shown in theconsolidated financial statements and notes thereto in Item 8 of this Annual Report on Form 10-K.
3. Exhibits:
See Index of Exhibits beginning on page 82 of this Annual Report on Form 10-K.
78

Schedule II—Valuation and Qualifying Accounts
(In thousands)Additions
DescriptionBalance at
Beginning of PeriodCharged to Costsand Expenses
Charged toOther Accounts (a)
Deductionsand Other (b)
Balance atEnd of Period
Year ended December 31,2007:Allowance for doubtfulaccounts . . . . . . . . . . $3,576 $ 387 $ 507 $ 1,644 $2,826
Valuation allowance fordeferred tax assets . . . $2,253 $ 733 $ 58 $ 575 $2,469
Year ended December 31,2008:Allowance for doubtfulaccounts . . . . . . . . . . $2,826 $6,268 $(1,994) $(2,287) $9,387
Valuation allowance fordeferred tax assets . . . $2,469 $ 922 $ (86) $ 1,339 $1,966
Year ended December 31,2009:Allowance for doubtfulaccounts . . . . . . . . . . $9,387 $3,309 $ 295 $ 4,997 $7,994
Valuation allowance fordeferred tax assets . . . $1,966 $2,050 $ (15) $ 620 $3,381
(a)—“Additions charged to other accounts” includes translation adjustments and allowances acquired throughbusiness combinations.(b)—“Deductions and other” includes write-offs, net of recoveries, and reductions in the allowances credited toexpense.
See accompanying Report of Independent Registered Public Accounting Firm.
79

SIGNATURES
Pursuant to the requirements of Section 13 or 15(d) of the Securities Exchange Act of 1934, the Registranthas duly caused this report to be signed on its behalf by the undersigned, thereunto duly authorized.
FMC TECHNOLOGIES, INC.(Registrant)
By: /S/ WILLIAM H. SCHUMANN, IIIWilliam H. Schumann, III
Executive Vice President, Chief Financial Officer andTreasurer
Date: March 1, 2010
Pursuant to the requirements of the Securities Exchange Act of 1934, this report has been signed below bythe following persons on behalf of the Registrant and in the capacities and on the date indicated.
Date Signature
March 1, 2010 /S/ PETER D. KINNEAR
Peter D. KinnearChairman, President and Chief Executive Officer
(Principal Executive Officer)
March 1, 2010 /S/ WILLIAM H. SCHUMANN, IIIWilliam H. Schumann, III
Executive Vice President, Chief Financial Officer and Treasurer(Principal Financial Officer)
March 1, 2010 /S/ JAY A. NUTT
Jay A. NuttVice President and Controller(Principal Accounting Officer)
March 1, 2010 /S/ MIKE R. BOWLIN
Mike R. Bowlin,Director
March 1, 2010 /S/ PHILIP J. BURGUIERES
Philip J. Burguieres,Director
March 1, 2010 /S/ C. MAURY DEVINE
C. Maury Devine,Director
March 1, 2010 /S/ DR. THORLEIF ENGERDr. Thorleif Enger,
Director
March 1, 2010 /S/ CLAIRE S. FARLEYClaire S. Farley,
Director
March 1, 2010 /S/ THOMAS M. HAMILTON
Thomas M. Hamilton,Director
80

Date Signature
March 1, 2010 /S/ EDWARD J. MOONEY
Edward J. Mooney,Director
March 1, 2010 /S/ JOSEPH H. NETHERLAND
Joseph H. Netherland,Director
March 1, 2010 /S/ RICHARD A. PATTAROZZIRichard A. Pattarozzi,
Director
March 1, 2010 /S/ JAMES M. RINGLER
James M. Ringler,Director
81

INDEX OF EXHIBITS
ExhibitNo. Exhibit Description
2.1 Separation and Distribution Agreement by and between FMC Corporation and the Company, dated asof May 31, 2001 (incorporated by reference from Exhibit 2.1 to the Form S-1/A filed on June 6, 2001).
2.2 Separation and Distribution Agreement by and between FMC Technologies and John BeanTechnologies Corporation, dated July 31, 2008 (incorporated by reference from Exhibit 2.1 to the Form8-K filed on August 6, 2008).
3.1 Registrant’s Amended and Restated Certificate of Incorporation (incorporated by reference fromExhibit 3.1 to the Quarterly Report on Form 10-Q filed on August 7, 2009).
3.2 Registrant’s Amended and Restated Bylaws (incorporated by reference from Exhibit 3.2 to theQuarterly Report on Form 10-Q filed on May 5, 2009).
4.1 Form of Specimen Certificate for the Company’s Common Stock (incorporated by reference fromExhibit 4.1 to the Form S-1/A filed on May 4, 2001).
4.2 Preferred Share Purchase Rights Agreement (incorporated by reference from Exhibit 4.2 to theForm S-8 filed on June 14, 2001).
4.2.a Amendment to Preferred Share Purchase Rights Agreement (incorporated by reference from Exhibit4.2 to the Form 8-K filed on September 11, 2009).
10.1 Tax Sharing Agreement by and among FMC Corporation and the Company, dated as of May 31, 2001(incorporated by reference from Exhibit 10.1 to the Form S-1/A filed on June 6, 2001).
10.2 Employee Benefits Agreement by and between FMC Corporation and the Company, dated as ofMay 30, 2001 (incorporated by reference from Exhibit 10.2 to the Form S-1/A filed on June 6, 2001).
10.3 Transition Services Agreement between FMC Corporation and the Company, dated as of May 31, 2001(incorporated by reference from Exhibit 10.3 to the Form S-1/A filed on June 6, 2001).
10.4* Amended and Restated Incentive Compensation and Stock Plan, dated February 25, 2010.
10.4.a* Form of Grant Agreement for Long Term Incentive Restricted Stock Grant Pursuant to FMCTechnologies, Inc. Incentive Compensation and Stock Plan (Employee) (incorporated by referencefrom Exhibit 10.4d to the Quarterly Report on Form 10-Q filed on May 10, 2005).
10.4.b* Form of Grant Agreement for Long Term Incentive Restricted Stock Grant Pursuant to FMCTechnologies, Inc. Incentive Compensation and Stock Plan (Non-Employee Director) (incorporated byreference from Exhibit 10.4e to the Quarterly Report on Form 10-Q filed on May 10, 2005).
10.4.c* Form of Grant Agreement for Key Manager Restricted Stock Grant Pursuant to FMC Technologies,Inc. Incentive Compensation and Stock Plan (incorporated by reference from Exhibit 10.4f to theQuarterly Report on Form 10-Q filed on May 10, 2005).
10.4.d* Form of Grant Agreement for Non-Qualified Stock Option Grant Pursuant to FMC Technologies, Inc.Incentive Compensation and Stock Plan (Employee) (incorporated by reference from Exhibit 10.4g tothe Quarterly Report on Form 10-Q filed on May 10, 2005).
10.4.e* Form of Grant Agreement for Non-Qualified Stock Option Grant Pursuant to FMC Technologies, Inc.Incentive Compensation and Stock Plan (Non-Employee Director) (incorporated by reference fromExhibit 10.4h to the Quarterly Report on Form 10-Q filed on May 10, 2005).
10.4.f* Form of Grant Agreement for Stock Appreciation Rights Grant Pursuant to FMC Technologies, Inc.Incentive Compensation and Stock Plan (incorporated by reference from Exhibit 10.4i to the QuarterlyReport on Form 10-Q filed on May 10, 2005).
10.4.g* Form of Grant Agreement for Performance Units Grant Pursuant to FMC Technologies, Inc. IncentiveCompensation and Stock Plan (incorporated by reference from 10.4j to the Quarterly Report onForm 10-Q filed on May 10, 2005).
82

ExhibitNo. Exhibit Description
10.4.h* Form of Long Term Incentive Performance Share Restricted Stock Agreement Pursuant to the FMCTechnologies, Inc. Incentive Compensation and Stock Plan (incorporated by reference from 10.4k tothe Quarterly Report on Form 10-Q filed on May 9, 2006).
10.4.i* Form of Long Term Incentive Performance Share Restricted Stock Agreement Pursuant to the FMCTechnologies, Inc. Incentive Compensation and Stock Plan.
10.4.j* Form of Long Term Incentive Restricted Stock Unit Agreement for Employees of FMCTechnologies SA Pursuant to the Amended and Restated Incentive Compensation and Stock Plan.
10.5* Forms of Executive Severance Agreements (incorporated by reference from Exhibit 10.4.i to theAnnual Report on Form 10-K filed on February 27, 2009).
10.6* Amended and Restated FMC Technologies, Inc. Employees’ Retirement Program Part I Salaried andNonunion Hourly Employees’ Retirement Program.
10.6.a* First Amendment to the Amended and Restated FMC Technologies, Inc. Employees’ RetirementProgram Part I Salaried and Nonunion Hourly Employees’ Retirement Program.
10.6.b* Eighth Amendment to the FMC Technologies, Inc. Employees’ Retirement Program Part I Salariedand Nonunion Hourly Employees’ Retirement Program (incorporated by reference from Exhibit10.6h to the Quarterly Report on Form 10-Q filed on November 3, 2009).
10.6.c* Ninth Amendment to the FMC Technologies, Inc. Employees’ Retirement Program Part I Salariedand Nonunion Hourly Employees’ Retirement Program.
10.6.d* Amended and Restated FMC Technologies, Inc. Employees’ Retirement Program Part II UnionHourly Employees’ Retirement Plan.
10.6.e* First Amendment to the Amended and Restated FMC Technologies, Inc. Employees’ RetirementProgram Part II Union Hourly Employees’ Retirement Plan.
10.6.f* Sixth Amendment to the FMC Technologies, Inc. Employees’ Retirement Program Part II UnionHourly Employees’ Retirement Plan.
10.7* Amended and Restated FMC Technologies, Inc. Salaried Employees’ Equivalent Retirement Plan.
10.7.a* FMC Technologies, Inc. Equivalent Retirement Plan Grantor Trust Agreement.
10.7.b* First Amendment to the Amended and Restated FMC Technologies, Inc. Salaried Employees’Equivalent Retirement Plan (incorporated by reference from Exhibit 10.7 to the Quarterly Report onForm 10-Q filed on November 3, 2009).
10.8* Amended and Restated FMC Technologies, Inc. Savings and Investment Plan.
10.8.a* FMC Technologies, Inc. Savings and Investment Plan Trust.
10.8.b* First Amendment to the Amended and Restated FMC Technologies, Inc. Savings and InvestmentPlan.
10.8.c* Ninth Amendment to the FMC Technologies, Inc. Savings and Investment Plan (incorporated byreference from Exhibit 10.8.i to the Quarterly Report on Form 10-Q filed on November 3, 2009).
10.8.d* Tenth Amendment to the FMC Technologies, Inc. Savings and Investment Plan (incorporated byreference from Exhibit 10.8.j to the Quarterly Report on Form 10-Q filed on November 3, 2009).
10.8.e* Eleventh Amendment to the FMC Technologies, Inc. Savings and Investment Plan.
10.9* Amended and Restated FMC Technologies, Inc. Non-Qualified Savings and Investment Plan.
10.9.a* FMC Technologies, Inc. Non-Qualified Savings and Investment Plan Trust Agreement.
10.9.b* First Amendment to the FMC Technologies, Inc. Non-Qualified Savings and Investment Plan(incorporated by reference from Exhibit 10.9 to the Quarterly Report on Form 10-Q filed onNovember 3, 2009).
83

ExhibitNo. Exhibit Description
10.10 Commercial Paper Dealer Agreement 4(2) Program between Banc of America Securities LLC andthe Company, dated as of January 24, 2003.
10.11 Commercial Paper Dealer Agreement 4(2) Program between Wells Fargo Brokerage Services, LLC.and the Company, dated as of December 21, 2007.
10.12 Commercial Paper Dealer Agreement 4(2) Program between J.P. Morgan Securities Inc. and theCompany, dated as of March 7, 2008.
10.13 Commercial Paper Dealer Agreement 4(2) Program between Citigroup Global Markets, Inc. and theCompany, dated as of January 2010.
10.14 Issuing and Paying Agency Agreement between Wells Fargo Bank, National Association and theCompany, dated as of January 3, 2004.
10.15 $600,000,000 Five-Year Credit Agreement dated December 6, 2007, between FMC Technologies,Inc. and JPMorgan Chase Bank, N.A., as Administrative Agent (incorporated by reference fromExhibit 10.15 to the Form 8-K filed on December 7, 2007).
10.16 $350,000,000 Credit Agreement dated January 13, 2010, between FMC Technologies, Inc. and Bankof America, N.A., as Administrative Agent (incorporated by reference from Exhibit 10 to theForm 8-K filed on January 15, 2010).
10.17 Tax Sharing Agreement between FMC Technologies, Inc. and John Bean Technologies Corporation,dated July 31, 2008 (incorporated by reference from Exhibit 10.1 to the Form 8-K filed on August 6,2008).
10.18 Securities Purchase Agreement among FMC Technologies, Inc. and Schilling Robotics, Inc.,Schilling Robotics, LLC and Tyler Schilling, dated December 24, 2008 (incorporated by referencefrom Exhibit 10.15 to the Annual Report on Form 10-K filed on February 27, 2009).
10.19 Unit Holders Agreement among FMC Technologies, Inc., Schilling Robotics, Inc., and TylerSchilling, dated December 26, 2008 (incorporated by reference from Exhibit 10.16 to the AnnualReport on Form 10-K filed on February 27, 2009).
10.20 Amended and Restated Operating Agreement among FMC Technologies, Inc., Schilling Robotics,Inc., Schilling Robotics Newco, LLC, Schilling Robotics, LLC and Tyler Schilling, datedDecember 26, 2008 (incorporated by reference from Exhibit 10.17 to the Annual Report onForm 10-K filed on February 27, 2009).
10.21 Purchase Agreement, dated September 9, 2009, among FMC Technologies, Inc. and Direct DriveSystems, Inc., (“DDS”) each stakeholder in DDS signatory thereto (individually, a “Seller” andcollectively, the “Sellers”) and Vatche Artinian as the Sellers’ Representative (incorporated byreference from Exhibit 10.10 to the Quarterly Report on Form 10-Q filed on November 3, 2009).
14.1 FMC Technologies, Inc. Code of Business Conduct and Ethics Including Provisions for PrincipalExecutive and Financial Officers (incorporated by reference from Exhibit 10.12 to the AnnualReport on Form 10-K filed on March 12, 2004).
21.1 Significant Subsidiaries of the Registrant.
23.1 Consent of Independent Registered Public Accounting Firm.
31.1 Certification of Chief Executive Officer Pursuant to Rule 13a-14(a).
31.2 Certification of Chief Financial Officer Pursuant to Rule 13a-14(a).
32.1 Certification of Chief Executive Officer Pursuant to 18 U.S.C. 1350, as adopted pursuant toSection 906 of the Sarbanes-Oxley Act of 2002.
84

ExhibitNo. Exhibit Description
32.2 Certification of Chief Financial Officer Pursuant to 18 U.S.C. 1350, as adopted pursuant toSection 906 of the Sarbanes-Oxley Act of 2002.
**101.INS XBRL Instance Document
**101.SCH XBRL Schema Document
**101.CAL XBRL Calculation Linkbase Document
**101.DEF XBRL Definition Linkbase Document
**101.LAB XBRL Label Linkbase Document
**101.PRE XBRL Presentation Linkbase Document
* Indicates a management contract or compensatory plan or arrangement.** Furnished herewith
85

FMC Technologies is a pioneer in the
development of technologically sophisticated
systems and services for the oil and gas industry.
We hold leading positions in all markets we
serve, delivering the highest level of quality,
integrity and reliability to our customers.
Our subsea industry leadership position was
strengthened in 2009 with the receipt of a $90
million contract to support Petrobras’ Marlim
field. The development of Marlim began in 1985.
It is Brazil’s largest offshore field in the
northeastern Santos Basin, covering 50 square
miles (130 km2). Today, FMC is designing and
manufacturing innovative technologies to enable
Petrobras to achieve its goal of maximizing
production and recovery rates at this mature
field. This includes delivery of a separation and
sand management system that will utilize a novel
pipe separator design, licensed and developed by
FMC Technologies in cooperation with Statoil.
Marlim is the sixth subsea processing
project awarded to FMC Technologies since 2005
and it will achieve a number of milestones for
both FMC and the oil and gas industry, including
the first:
• deepwater deployment of a subsea
separation system in a mature field
• separation of heavy oil and water in a
subsea environment, and
• reinjection of water into a subsea reservoir
to boost production
At FMC Technologies, we understand our
customers’ businesses and we design solutions to
solve their most difficult operational challenges,
allowing us to put our customers first and keep
them ahead.
Corporate Office
FMC Technologies, Inc.
1803 Gears Road
Houston, TX 77067
281 591 4000
Investor Relations
Investor Relations may be contacted at the
following address:
FMC Technologies, Inc.
Investor Relations
Robert K. Cherry
1803 Gears Road
Houston, TX 77067
281 591 4560
ir.fmctechnologies.com
Stock Exchange
FMC Technologies is listed on the
New York Stock Exchange under
the symbol FTI.
Annual Meeting
The Annual Meeting of Stockholders will be held at
11:00 a.m. on Friday, May 7, 2010 at:
The Woodlands Waterway Marriott Hotel
1601 Lake Robbins Drive
The Woodlands, TX 77380
Notice of the meeting, together with proxy
materials, will be mailed to stockholders in
advance of the meeting.
Stock Transfer Agent
Address stockholder inquiries, including requests
for stock transfers, to:
Wells Fargo Bank, N. A.
161 N. Concord Exchange
South St. Paul, MN 55075-1139
Phone: 800-468-97166 or 651-450-4064
Fax: 651-450-4033
wellsfargo.com/com/shareowner_services
Form 10-K
A copy of the Company’s 2009 Annual Report on
Form 10-K, as filed with the U.S. Securities and
Exchange Commission, is available at
fmctechnologies.com or upon
written request to:
FMC Technologies, Inc.
Corporate Communications
1803 Gears Road
Houston,TX 77067
However, certain information required under Parts
II and III of the Company’s 2009 Annual Report on
Form 10-K have been incorporated by reference
from the Company’s Proxy Statement for its 2010
Annual Meeting of Shareholders.
Certifications required by Section 302 of the
Sarbanes-Oxley Act of 2002, as amended, are
attached as Exhibits to the Company’s 2009
Annual Report on Form 10-K. FMC Technologies’
CEO timely submitted the CEO Annual
Certification required by Section 303A.12(a) of the
New York Stock Exchange Listed Company Manual
in 2009 to the New York Stock Exchange.
FMC Technologies was incorporated in
Delaware in 2000.
Auditors
KPMG LLP
Houston ,TX 77067

FMC Technologies Inc
1803 Gears Road
Houston TX 77067
281 591 4000
fmctechnologies.com
Solutions
forour
customers’toughest
challengesPeople
TechnologyG
rowth
FMCTech
nologies
2009AnnualReport
People Technology Growth
2009 Annual Report