Embed Size (px)
Citation preview
WWW.JAGRANJOSH.COM Solved MAT 2012 Question Paper:
Data Analysis and Data Sufficiency
Solved MAT 2012 Question Paper: Data Analysis and Data Sufficiency
2
Data Analysis and Data Sufficiency
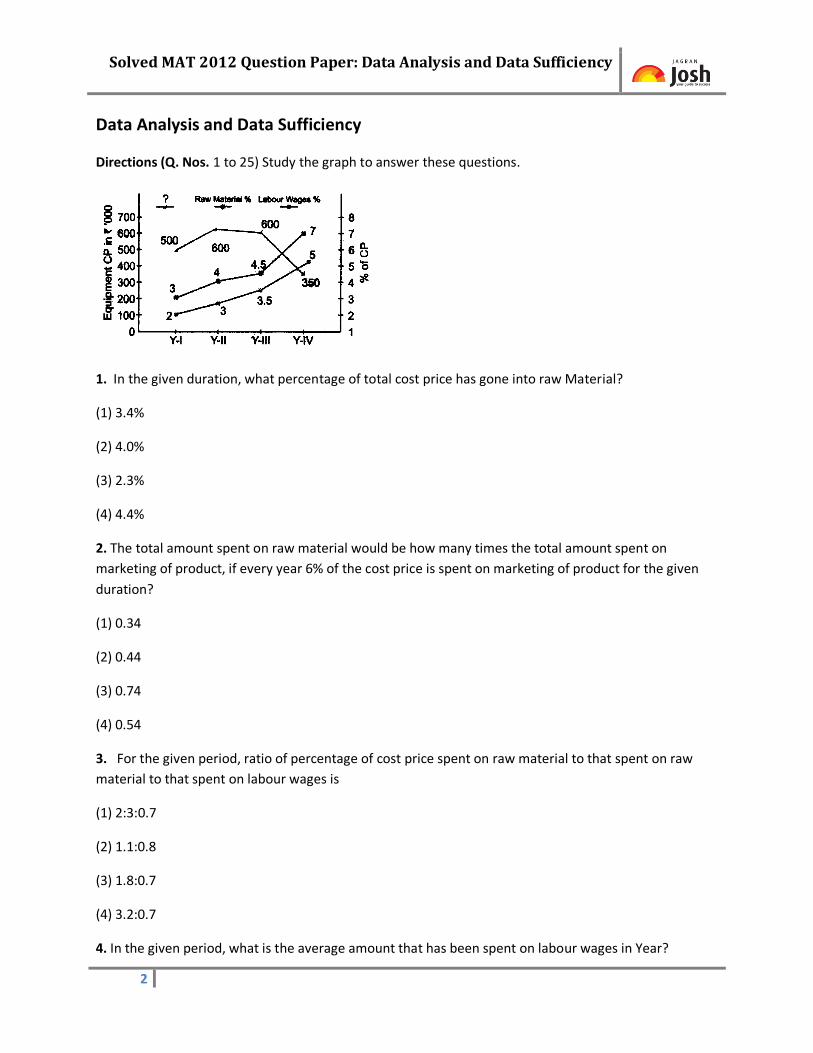
Directions (Q. Nos. 1 to 25) Study the graph to answer these questions.
1. In the given duration, what percentage of total cost price has gone into raw Material?
(1) 3.4%
(2) 4.0%
(3) 2.3%
(4) 4.4%
2. The total amount spent on raw material would be how many times the total amount spent on
marketing of product, if every year 6% of the cost price is spent on marketing of product for the given
duration?
(1) 0.34
(2) 0.44
(3) 0.74
(4) 0.54
3. For the given period, ratio of percentage of cost price spent on raw material to that spent on raw
material to that spent on labour wages is
(1) 2:3:0.7
(2) 1.1:0.8
(3) 1.8:0.7
(4) 3.2:0.7
4. In the given period, what is the average amount that has been spent on labour wages in Year?
Solved MAT 2012 Question Paper: Data Analysis and Data Sufficiency
3
(1) 16625
(2)18625
(3) 19625
(4) 17625
5. Due to some circumstances if in Y-V, Rs 40000 is to be spent on labour wages, provided labour wages
spending as a percentage of the cost price does not exceed 10%, then what is the least cost price in Y-V?
(1) 600000
(2) 300000
(3) 700000
(4) 400000
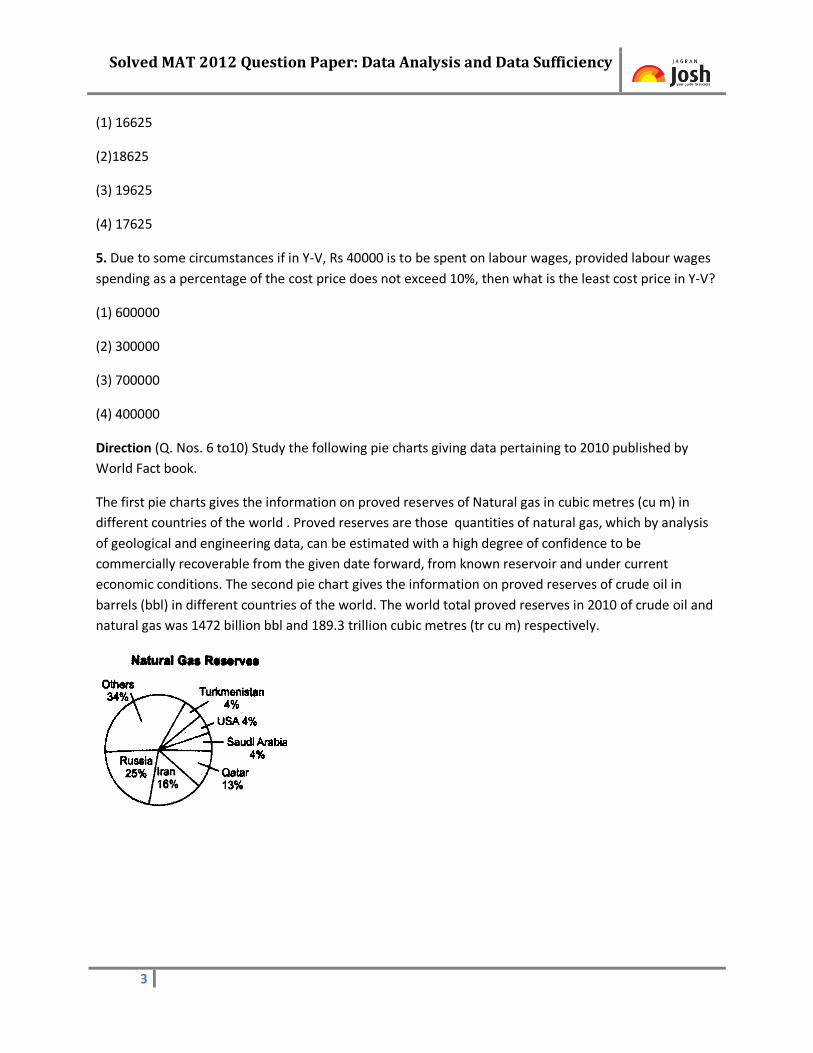
Direction (Q. Nos. 6 to10) Study the following pie charts giving data pertaining to 2010 published by
World Fact book.
The first pie charts gives the information on proved reserves of Natural gas in cubic metres (cu m) in
different countries of the world . Proved reserves are those quantities of natural gas, which by analysis
of geological and engineering data, can be estimated with a high degree of confidence to be
commercially recoverable from the given date forward, from known reservoir and under current
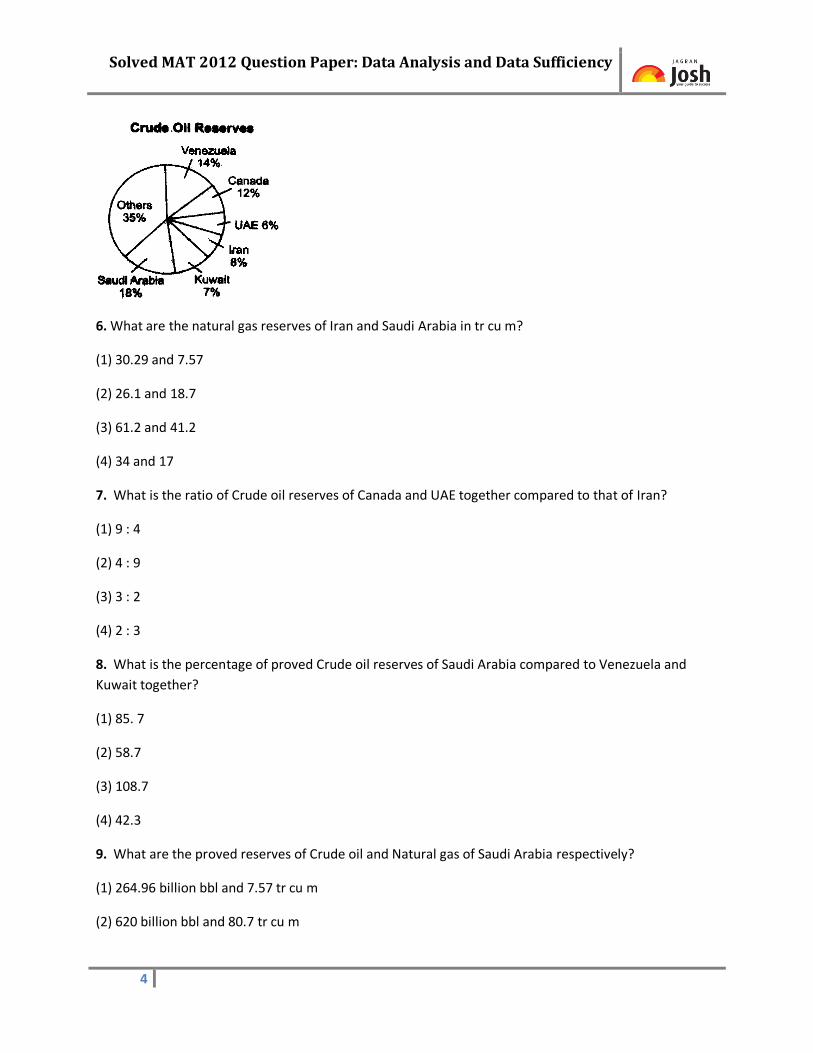
economic conditions. The second pie chart gives the information on proved reserves of crude oil in
barrels (bbl) in different countries of the world. The world total proved reserves in 2010 of crude oil and
natural gas was 1472 billion bbl and 189.3 trillion cubic metres (tr cu m) respectively.
Solved MAT 2012 Question Paper: Data Analysis and Data Sufficiency
4
6. What are the natural gas reserves of Iran and Saudi Arabia in tr cu m?
(1) 30.29 and 7.57
(2) 26.1 and 18.7
(3) 61.2 and 41.2
(4) 34 and 17
7. What is the ratio of Crude oil reserves of Canada and UAE together compared to that of Iran?
(1) 9 : 4
(2) 4 : 9
(3) 3 : 2
(4) 2 : 3
8. What is the percentage of proved Crude oil reserves of Saudi Arabia compared to Venezuela and
Kuwait together?
(1) 85. 7
(2) 58.7
(3) 108.7
(4) 42.3
9. What are the proved reserves of Crude oil and Natural gas of Saudi Arabia respectively?
(1) 264.96 billion bbl and 7.57 tr cu m
(2) 620 billion bbl and 80.7 tr cu m
Solved MAT 2012 Question Paper: Data Analysis and Data Sufficiency
5
(3) 26.26 billion bbl and 0.78 tr cu m
(4) 6.2 billion bbl and 8.07 tr cu m
10. A married couple appear in an interview for two vacancies in a company. The probability of Man’s
selection is ¼ and that of woman’s selection is 1/3 What is the probability that atleast one of them will
be selected?
(1) 5/12
(2) ½
(3) 1/12
(4) None of these
Directions (Q. Nos. 11 t0 15) Read the following passage to answer these questions.
In a huge Jewellery shop, the electric gadgets being used are 17 tubelights of 40 W each. 14 fans of 80
W each, 16 bulbs of 60 W each. 11 bulbs of 100 W each, 11AC’s of 2100 W each, 9 laptops of 200 W
each and 10 TV’s of 120 W each. In a day, tubelights and TV’s are used for 7 h and 100 W bulbs are
used for 9 h whereas laptops and AC’s are used for 9 h whereas laptops and AC’s are used for 5 h and 9
h respectively. However, fans are used for 11h.
Note: 1000 W = 1 unit
11. What is the total electronic energy consumed( in units) by 60 W bulbs in the whole month ?
(1) 432
(2) 576
(3) 67.2
(4) 201.6
12. Electricity consumed by all fans is what per cent of energy consumed by all the laptops ?
(1) 132.2%
(2) 136.88%
(3) 122.68
(4) 169.62%
13. Out of the following, which type of gadgets consume more electricity in the shop ?
Solved MAT 2012 Question Paper: Data Analysis and Data Sufficiency
6
(1) Fans
(2) Tube lights
(3)Laptops
(4) TVs
14. If one electric units costs Rs 2.70 and power (used by ACs) Unit costs Rs 3.70, then what money is
paid to the electricity department for one month?
(1) Rs 27368
(2) 28683
(3) 78600
(4) 29000
15. what is the ratio of consumption of electricity in units by 60 W and 100 W bulbs in a months ?
(1) 5 : 6
(2) 4 : 5
(3) 3 : 4
(4) 2 : 3
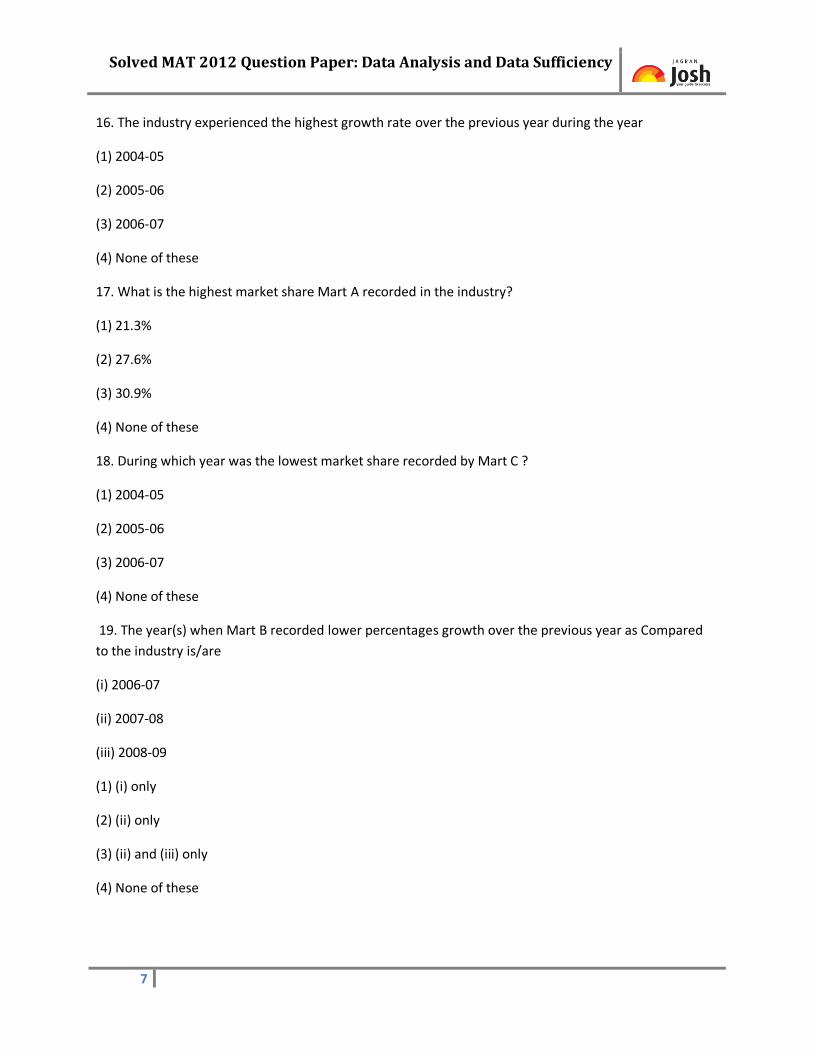
Directions (Q. Nos 16 to 20) Study the graph to answer these questions.
There are three retail marts in a city. The revenues of Retail Marts of India are shown in the following
graph.
(All figures are in US $ Million).
Solved MAT 2012 Question Paper: Data Analysis and Data Sufficiency
7
16. The industry experienced the highest growth rate over the previous year during the year
(1) 2004-05
(2) 2005-06
(3) 2006-07
(4) None of these
17. What is the highest market share Mart A recorded in the industry?
(1) 21.3%
(2) 27.6%
(3) 30.9%
(4) None of these
18. During which year was the lowest market share recorded by Mart C ?
(1) 2004-05
(2) 2005-06
(3) 2006-07
(4) None of these
19. The year(s) when Mart B recorded lower percentages growth over the previous year as Compared
to the industry is/are
(i) 2006-07
(ii) 2007-08
(iii) 2008-09
(1) (i) only
(2) (ii) only
(3) (ii) and (iii) only
(4) None of these
Solved MAT 2012 Question Paper: Data Analysis and Data Sufficiency
8
20. The year(s) when Mart C recorded higher percentage growth over the previous year as compared to
the industry is/are
(i) 2006-07
(ii) 2007-08
(iii) 2008-09
(1) (i) only
(2) (ii) only
(3) (ii) and (iii) only
(4) None of these
Directions (Q. Nos.21 to 25) Each of these has a question followed by two statements numbered as I and
II.
(1) if statement I alone is sufficient but statement II alone is not sufficient to answer the question.
(2) if statement II alone is sufficient but statement I alone is not sufficient to answer the question.
(3) if both statements I and II together are required to answer the question but neither statement alone
is sufficient.
(4) if statements I and II together are not sufficient to answer the question.
21. What is the rate of the compound interest?
I. A Certain amount invested at the compound interest rate amount to Rs 1331.
II. The amount was invested for a period of three years.
22. What is the difference between the two digits in a two-digit number?
I. The sum of the two digits is 8
II. 1/5 of that number is 15 less than ½ of 44.
23. On Which day of the week did Rakesh reach Delhi?
I. Rakesh’s brother reached Delhi one day earlier than Rakesh.
II. Rakesh mother reached Delhi on Thursday. Which was two days later than the arrival of his brother.
Solved MAT 2012 Question Paper: Data Analysis and Data Sufficiency
9
24. What is the present age of the mother ?
I. Father’s age is more than the mother’s age.
II. Present age of the father is 30 yr. Four years back the ratio of mother’s age to father’s age was 12 :
13.
25. Is x+3y is integer?
I. (x+y)3 is an integer.
II. (x+y)3 is an integer.
Directions (Q. Nos. 26 to 30) Each of these questions consists of two quantities marked as A and B.
Compare the two quantities. Mark answer as
(1) if the quantity in A is greater
(2) if the quantity in B is greater
(3) if the two quantities are equal
(4) if comparison cannot be made from the information given
26. A. Area of square with side 1.8m.
B. Area of a circle with diameter 1 m.
27. A Number of way to arrange 5 different books on a shelf.
B. Number of minutes in 2 h.
28. A 6% of 42
B 7% of 36
29. A (16 4 +8 x 2-8)
B (3x4+1 5-3)
30. A 0.01 divided by 0.1
B 0.01 times 0.1
Solved MAT 2012 Question Paper: Data Analysis and Data Sufficiency
10
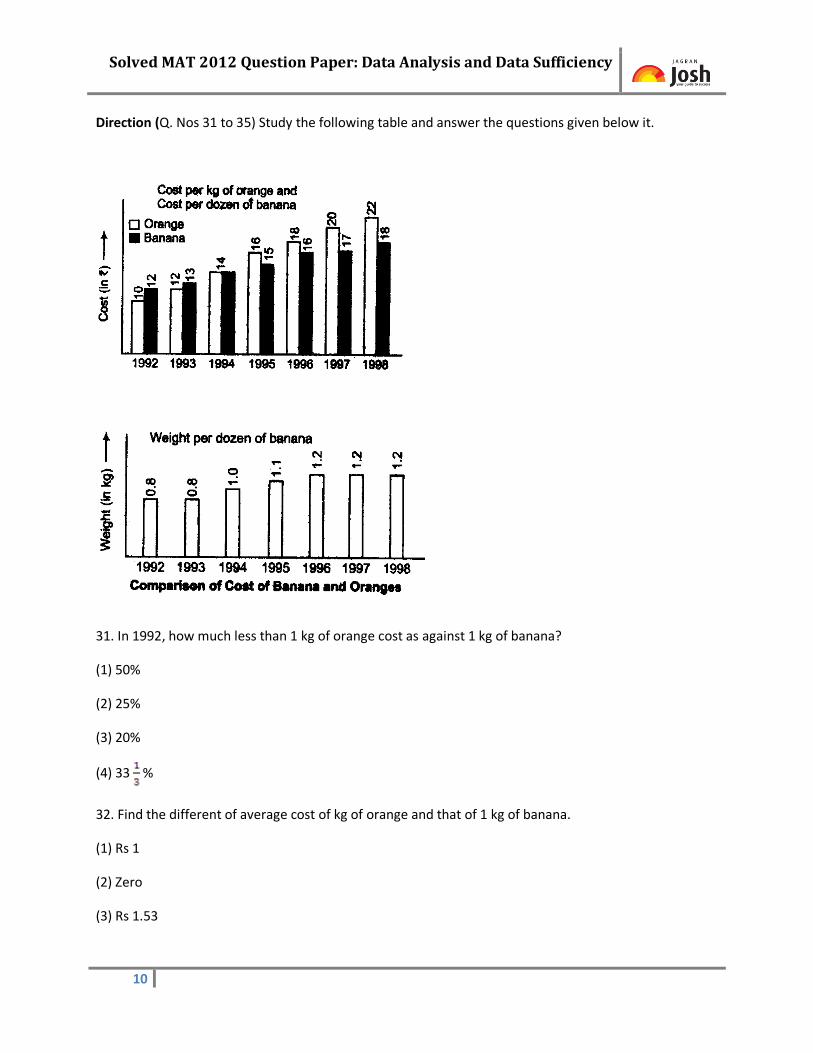
Direction (Q. Nos 31 to 35) Study the following table and answer the questions given below it.
31. In 1992, how much less than 1 kg of orange cost as against 1 kg of banana?
(1) 50%
(2) 25%
(3) 20%
(4) 33 %
32. Find the different of average cost of kg of orange and that of 1 kg of banana.
(1) Rs 1
(2) Zero
(3) Rs 1.53
Solved MAT 2012 Question Paper: Data Analysis and Data Sufficiency
11
(4) Rs 2
33. If a person pays equal amounts for 1 kg of orange and 1 kg of banana, then the bought these fruits
in
(1) 1994
(2) 1997
(3) Never in the given period
(4) 1998
34. If the costs were to rise at the same rate, how much would 1 kg of banana cost in the year 2004?
(1) Rs 24
(2) Rs 38
(3) Rs 23
(4) Data insufficient
35. Find the percentage increase in the cost of 1 kg of banana between 1992 and 1998.
(1) 50
(2) 33
(3) 66
(4) None of these
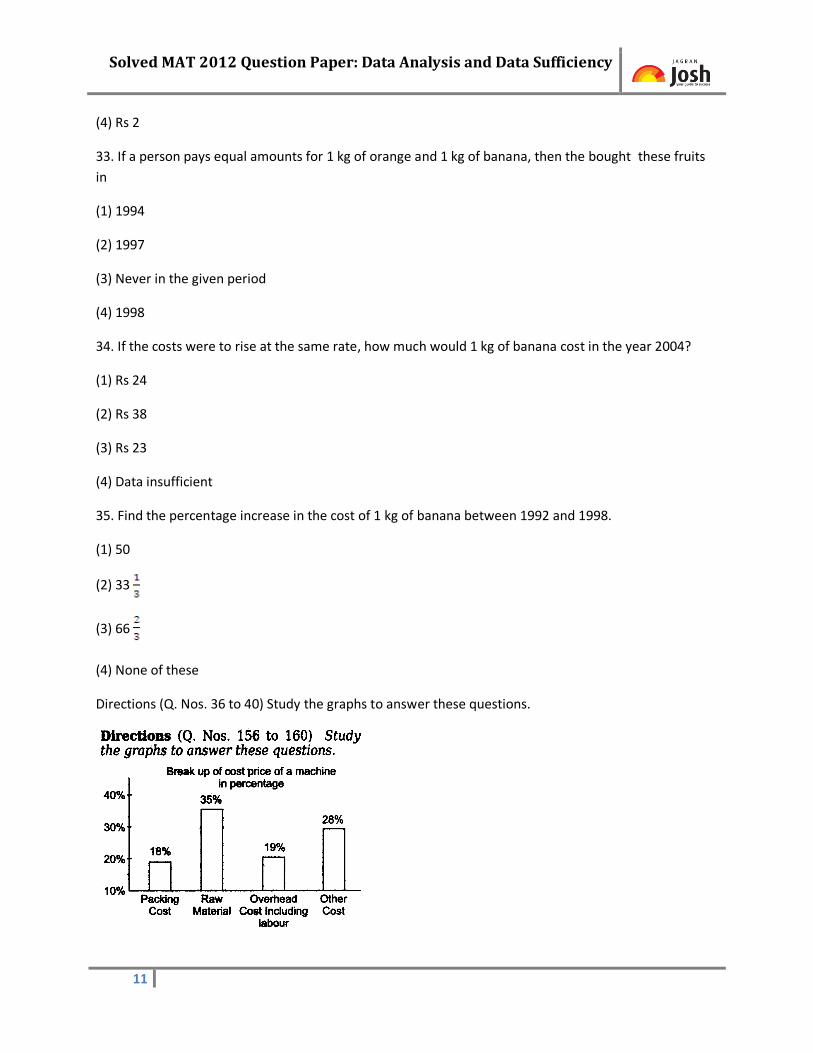
Directions (Q. Nos. 36 to 40) Study the graphs to answer these questions.
Solved MAT 2012 Question Paper: Data Analysis and Data Sufficiency
12
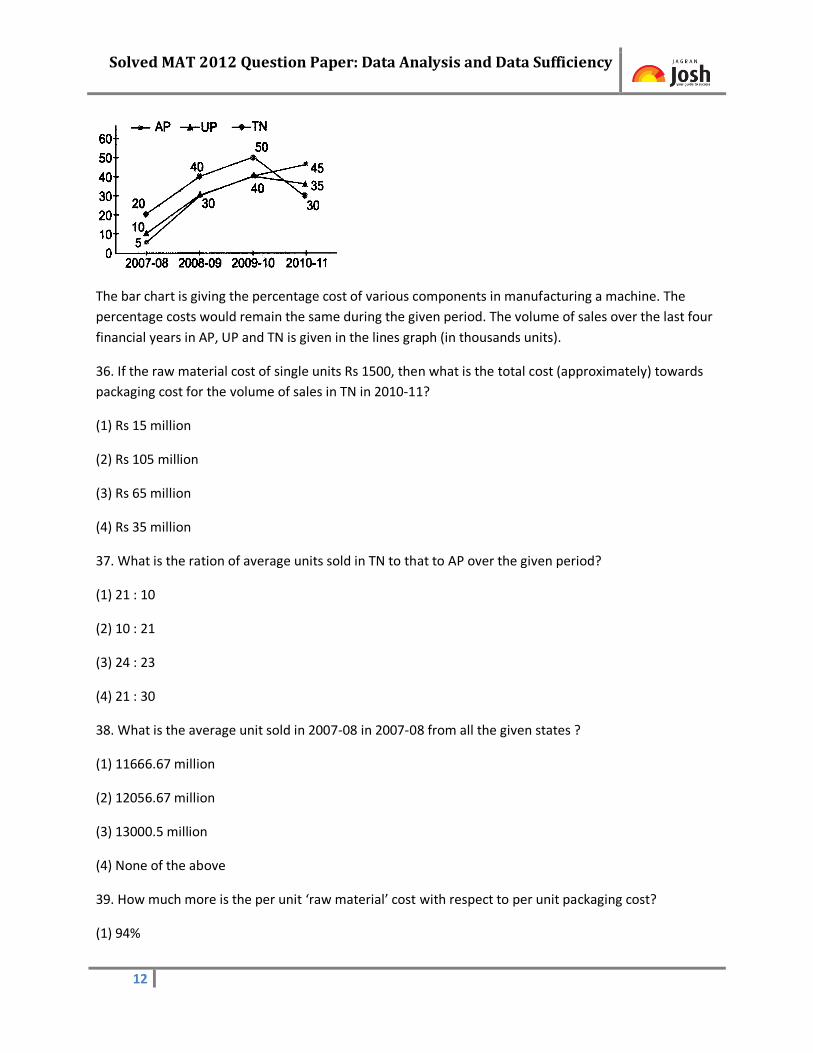
The bar chart is giving the percentage cost of various components in manufacturing a machine. The
percentage costs would remain the same during the given period. The volume of sales over the last four
financial years in AP, UP and TN is given in the lines graph (in thousands units).
36. If the raw material cost of single units Rs 1500, then what is the total cost (approximately) towards
packaging cost for the volume of sales in TN in 2010-11?
(1) Rs 15 million
(2) Rs 105 million
(3) Rs 65 million
(4) Rs 35 million
37. What is the ration of average units sold in TN to that to AP over the given period?
(1) 21 : 10
(2) 10 : 21
(3) 24 : 23
(4) 21 : 30
38. What is the average unit sold in 2007-08 in 2007-08 from all the given states ?
(1) 11666.67 million
(2) 12056.67 million
(3) 13000.5 million
(4) None of the above
39. How much more is the per unit ‘raw material’ cost with respect to per unit packaging cost?
(1) 94%
Solved MAT 2012 Question Paper: Data Analysis and Data Sufficiency
13
(2) 90%
(3) 85%
(4) 194%
40. If the selling price of each unit of machine is Rs 20000 and profit is Rs 2000 per unit, what is the total
cost towards raw material for the volume of sales in AP in Year 2010-11?
(1) Rs 230.45 million
(2) Rs22.05 million
(3)Rs 1.22 billion
(4) Rs 0.22 billion
Answers
1 (4)
21 (4)
2 (3)
22 (2)
3 (2)
23 (3)
4 (1)
24 (2)
5 (4)
25 (3)
6 (1)
26 (1)
7 (1)
27 (3)
8 (1)
28 (3)
9 (1)
29 (1)
10 (2)
30 (1)
11 (4)
31 (4)
12 (2)
32 (3)
13 (1)
33 (1)
14 (1)
34 (4)
15 (4)
35 (1)
16 (2)
36 (4)
17 (3)
37 (3)
18 (3)
38 (1)
19 (3)
39 (1)
20 (4)
40 (4)


![Sample paper - Careers360 2012 Solved... · Solved MAT 2012 Question Paper: Indian and Global EnSolved maT 2012 Question papervironment 2 Indian & Global Environment í X Z ] ] v](https://img.pdfslide.net/doc/110x75/5b77f4a87f8b9a47518e31bd/sample-paper-careers360-2012-solved-solved-mat-2012-question-paper-indian.jpg)


![Anyons in an exactly solved model and beyond …arXiv:cond-mat/0506438v3 [cond-mat.mes-hall] 1 Jan 2008 Anyons in an exactly solved model and beyond Alexei Kitaev California Institute](https://img.pdfslide.net/doc/110x75/5e385f7af119de5653077d70/anyons-in-an-exactly-solved-model-and-beyond-arxivcond-mat0506438v3-cond-matmes-hall.jpg)