Embed Size (px)
Citation preview
2016Solvency and Financial
Condition Report

a.s.r.Archimedeslaan 10P.O. Box 20723500 HB Utrecht
www.asrnl.com
1
System o
f Go
vernanceR
isk pro
fileV
aluation fo
r Solvency p
urpo
sesC
apital m
anagem
entB
usiness and p
erform
ance
2016 Solvency and Financial Condition Report
Introduction 5
A
Business and performance 6A.1 Business 6 A.1.1 Profile 7 A.1.2 General information 10 A.1.3 Structure 11 A.1.4 Important events during the reporting period 16A.2 Underwriting performance 18 A.2.1 Financial Performance a.s.r. 20 A.2.2 Financial Performance Non-life segment 21 A.2.3 Financial Performance Life segment 22A.3 Investment performance 23 A.3.1 Revenues and costs of all assets 23 A.3.2 Information about profit and losses in equity 25 A.3.3 Information about investments in securities 26A.4 Performance of other activities 26A.5 Any other information 26
B
System of governance 27B.1 General information on the system of governance 27 B.1.1 Corporate governance 27 B.1.2 Remuneration report 37 B.1.3 Related-party transactions 41 B.1.4 Remuneration of current and former Executive Board Members 42 B.1.5 Consolidation method and aggregation of data 43B.2 Fit and proper requirements 44B.3 Risk management system including the own risk and solvency assessment Risk Management System 44 B.3.1 Enterprise Risk Management Framework 44 B.3.2 a.s.r.’s risk categories 53B.4 Internal control system 55 B.4.1 Strategic and operational risk management 55 B.4.2 Compliance function 57
a.s.r.Archimedeslaan 10P.O. Box 20723500 HB Utrecht
www.asrnl.com
2
System o
f Go
vernanceR
isk pro
fileV
aluation fo
r Solvency p
urpo
sesC
apital m
anagem
entB
usiness and p
erform
ance
B.5 Internal audit function 58B.6 Actuarial function 59B.7 Outsourcing 60 B.7.1 General 60B.8 Any other information 60
C
Risk profile 62C.1 Insurance risk 67 C.1.1 Life Insurance risk 68 C.1.2 Health Insurance risk and non-life insurance risk 71C.2 Market risk 75 C.2.1 Interest rate risk 76 C.2.2 Equity risk 77 C.2.3 Property risk 78 C.2.4 Currency risk 79 C.2.5 Spread risk 80 C.2.6 Market risk concentrations 83C.3 Counterparty default risk 84 C.3.1 Mortgages 84 C.3.2 Savings-linked mortgage loans 85 C.3.3 Derivatives 85 C.3.4 Reinsurance 85 C.3.5 Receivables 86 C.3.6 Cash and deposits 86C.4 Liquidity risk 86C.5 Operational risk 87C.6 Other material risks 88C.7 Any other information 88 C.7.1 Description of off-balance sheet positions 88 C.7.2 Reinsurance policy and risk budgeting 88 C.7.3 Monitoring of new and existing products 88
D
Valuation for Solvency purposes 90D.1 Assets 91 D.1.1 Fair value measurement 91 D.1.2 Per asset category 92D.2 Technical provisions 94 D.2.1 Introduction 94 D.2.2 Technical provisions methods 95 D.2.3 Level of uncertainty 95 D.2.4 Reinsurance and special purpose vehicles (SPVs) 96 D.2.5 Technical provisions 97 D.2.6 Reconciliation between IFRS and Solvency II 97D.3 Other liabilities 98 D.3.1 Valuation of other liabilities 98 D.3.2 Reconciliation from Solvency II equity to EOF 100D.4 Alternative methods for valuation 101D.5 Any other information 101
3
System o
f Go
vernance
System o
f Go
vernance
Risk p
rofile
Risk p
rofile
Valuatio
n for So
lvency purp
oses
Valuatio
n for So
lvency purp
oses
Cap
ital manag
ement
Cap
ital manag
ement
Business and
perfo
rmance
Business and
perfo
rmance
E
Valuation for Solvency purposes 101E.1 Own funds 102 E.1.1 Capital management objectives 102 E.1.2 Tiering own funds 103 E.1.3 Own funds versus MCR 103 E.1.4 Description of grandfathering 103E.2 Solvency Capital Requirement 104 E.2.1 Method for determining the Group solvency capital 104 E.2.2 Solvency ratio and a.s.r. ratings 105E.3 Use of standard equity risk sub-module in calculation of Solvency Capital Requirement 106E.4 Differences between Standard Formula and internal models 106E.5 Non-compliance with the Minimum Capital Requirement and non-compliance with the Solvency Capital Requirement 106E.6 Any other information 106 E.6.1 Dividend policy and capital actions 106

4
System o
f Go
vernanceR
isk pro
fileV
aluation fo
r Solvency p
urpo
sesC
apital m
anagem
entB
usiness and p
erform
ance
This page has intentionally left blank.
5
System o
f Go
vernance
System o
f Go
vernance
Risk p
rofile
Risk p
rofile
Valuatio
n for So
lvency purp
oses
Valuatio
n for So
lvency purp
oses
Cap
ital manag
ement
Cap
ital manag
ement
Business and
perfo
rmance
Business and
perfo
rmance
Introduction
The structure of the Solvency and Financial Condition Report (SFCR) has been prepared as described in annex XX of the delegated acts. The subjects addressed are based on article 51 to 56 of the Solvency II directive and article 292 up to 298 of de Delegated Acts. Furthermore, the figures presented in this report are in line with the supervisor’s reported Quantitative Reporting Templates.
All amounts in this report are presented in millions of euros (€ million), being the functional currency of a.s.r. and all its Group entities. All amounts quoted in the tables contained in this report are in millions of euros (€), unless otherwise stated.
Referring to Solvency, 2015 figures are not presented here, as Solvency II replaced Solvency I as at 1 January 2016, which makes a comparison of these two years not useful.
a.s.r. 2016 solvency and financial condition report | A Business and performance 6
System o
f Go
vernanceR
isk pro
fileV
aluation fo
r Solvency p
urpo
sesC
apital m
anagem
entB
usiness and p
erform
ance
A Business and performance
A.1 Business
Eligible Own Funds 2016
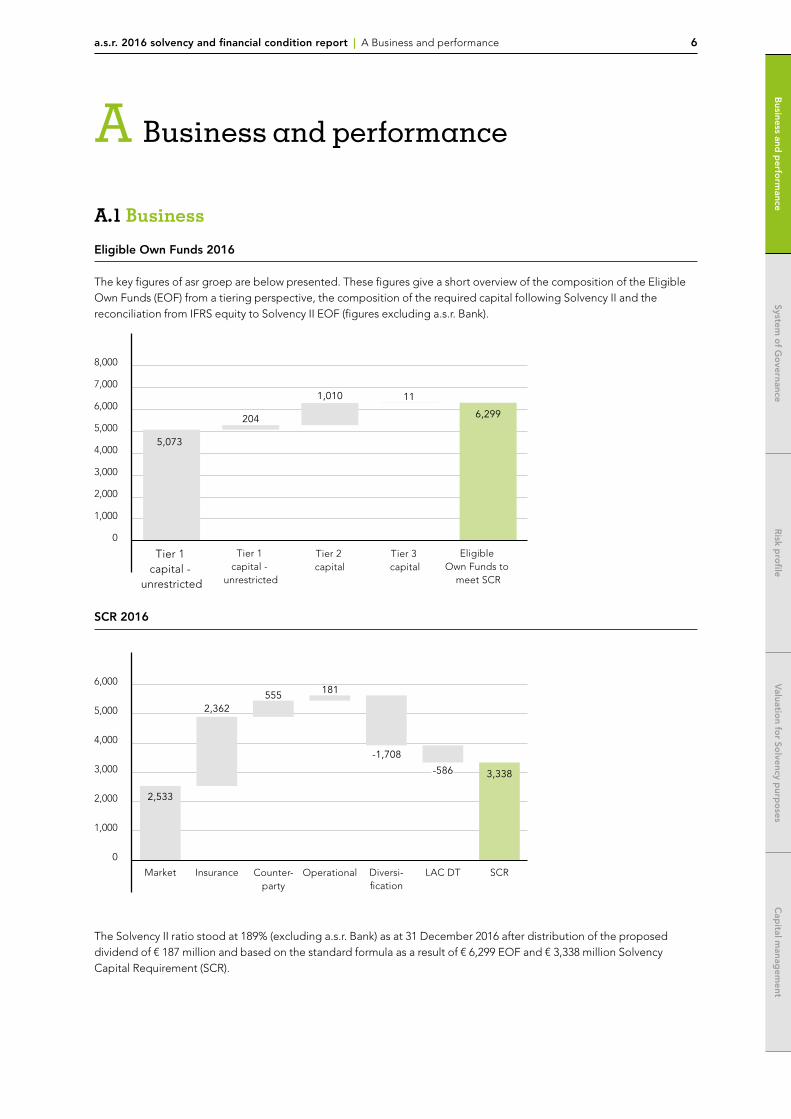
The key figures of asr groep are below presented. These figures give a short overview of the composition of the Eligible Own Funds (EOF) from a tiering perspective, the composition of the required capital following Solvency II and the reconciliation from IFRS equity to Solvency II EOF (figures excluding a.s.r. Bank).
8,000
7,000
6,000
5,000
4,000
3,000
2,000
1,000
0
Tier 1 capital -
unrestricted
5,073
204
1,010 11
6,299
Tier 1 capital -
unrestricted
Tier 2 capital
Tier 3 capital
Eligible Own Funds to
meet SCR
SCR 2016
6,000
5,000
4,000
3,000
2,000
1,000
0
Market
2,533
1815552,362
-1,708
3,338
Insurance Counter-party
Operational SCRLAC DTDiversi-fication
-586
The Solvency II ratio stood at 189% (excluding a.s.r. Bank) as at 31 December 2016 after distribution of the proposed dividend of € 187 million and based on the standard formula as a result of € 6,299 EOF and € 3,338 million Solvency Capital Requirement (SCR).

a.s.r. 2016 solvency and financial condition report | A Business and performance 7
System o
f Go
vernance
System o
f Go
vernance
Risk p
rofile
Risk p
rofile
Valuatio
n for So
lvency purp
oses
Valuatio
n for So
lvency purp
oses
Cap
ital manag
ement
Cap
ital manag
ement
Business and
perfo
rmance
Business and
perfo
rmance
Reconciliation total equity IFRS vs EOF Solvency II
7,000
6,000
5,000
4,000
3,000
2,000
1,000
0Total
equityIFRS
3,769
2,164954
6,299
Totalrevaluation
Subordinatedliabilities,
foreseeabledividends
and Basel IIIimpact
financialinstitutions
Delta deferred
tax
Eligible own funds Solvency II
-588
An extensive explanation of the reconciliation from IFRS equity to Solvency II EOF is presented in section D.
A.1.1 Profilea.s.r.a.s.r. is the Dutch insurance company for all types of insurance1. Via the brands a.s.r., De Amersfoortse and Ditzo and specialist brands such as Europeesche Verzekeringen and Ardanta, a.s.r. continues to provide P&C, occupational disability and health insurance (non-life) and pensions, individual life and funeral expenses insurance (life), as well as on distribution. a.s.r. also offers specific banking, mortgage and investment products and asset management services. a.s.r. operates exclusively in the Dutch market, except for its servicing of a small Belgian funeral insurance portfolio, which is recognized as a business line of ASR Levensverzekering N.V.
Having generated € 4,328 million in Gross Written Premiums (GWP) in 2016. a.s.r. is one of the larger insurance companies in the Netherlands.
a.s.r. is confident that it can live up to its position as ‘insurer of choice’ for its customers by placing their interests at the centre of its business. This is something that our employees work towards on a daily basis. Our employees are the face of a.s.r. services and determine the quality of the services we provide.
a.s.r. has its registered office in the Netherlands. Its main office is located at Archimedeslaan 10 in Utrecht. a.s.r. also has an office in Enschede and a small number of distribution entities in various locations in the Netherlands.
Structurea.s.r.’s operations have been divided into six operating segments. These segments are the Non-life segment and Life segment for all insurance activities. The non-insurance activities are presented as four separate segments: Banking and Asset Management, Distribution and Services, Holding and Other and Real Estate Development. See page 14 for a.s.r.'s structure.
1 a.s.r. de nederlandse verzekerings maatschappij voor al uw verzekeringen.
a.s.r. 2016 solvency and financial condition report | A Business and performance 8
System o
f Go
vernanceR
isk pro
fileV
aluation fo
r Solvency p
urpo
sesC
apital m
anagem
entB
usiness and p
erform
ance
Missiona.s.r.’s overall mission is to offer transparent insurance solutions as a trusted and reliable partner for its customers while creating sustainable value for its stakeholders. As part of its mission, a.s.r. has identified the following key roles that it intends to play:• An insurer for customers
a.s.r. is deeply rooted in Dutch society and is committed to understanding its customers’ needs. It aims to offer its customers peace of mind by offering insurance and wealth accumulation products designed to secure its customers’ financial stability and to protect customers from risks they are unwilling or unable to bear themselves.a.s.r. considers its customers’ trust essential to its business and values the strength of independent advice, which is reflected in the strong position of a.s.r. in the intermediary channel.
• A financial institutiona.s.r. aims to be a financially reliable and stable institution with a solvency position strong enough to fulfil its long term obligations and commitments to all its stakeholders. a.s.r. believes that a solid financial position will enable it to meet both its short- and longterm obligations to customers and shareholders. a.s.r. believes that its ‘value over volume’ philosophy will help secure long-term value creation.
• A people-focused employera.s.r. aims to employ highly skilled employees, and to attract and retain talented individuals. a.s.r. strives to offer its employees a stimulating and inspiring work environment and enable them to develop, broaden and expand their skills. As a people-focused employer, a.s.r. aims to offer a highly adaptable and flexible structure.
• A member of societya.s.r. feels responsible to society at large, and also to vulnerable groups. a.s.r. applies its views on social responsibility in its HR policy (e.g. by employing (partly) disabled young people), its investment policy, its working environment (The New World of Work) and its environmental policy.
Vision & ambitionIn the coming years, a.s.r. aims to continue to develop into a company that is increasingly recognized by customers as one that meet the terms of its licence to operate through ‘helping by taking action’. Customers will recognize this in the positive experience they have with a.s.r., in all its aspects. a.s.r. is able to empathize with the needs of its customers and deliver its products and services in a clear and transparent manner. a.s.r. helps people to share risks and accumulate capital for later in life. Our customer experience score will increase over the next three years. This customer experience will convince existing customers that they want to remain a.s.r. customers for the long term and expand their product package. At the same time new customers will come to a.s.r. on the basis of the warm recommendations from customers and financial advisers. a.s.r. considers providing top-quality service as a major factor in its current and future success.
Core valuesI am helpfula.s.r. employees empathize with the needs of their customers, plus they listen and they show interest. They truly represent a.s.r., both internally and externally.
Customers feel the help we provide in the risks they have covered. We help them to avoid risks and resolve issues if these risks arise. They can rely on our ability to accumulate sound capital for the future, which we strive to do in a way that will benefit generations to come.
I think aheadWe are committed to looking for new solutions and making sure that our customers can carry on, that our employees continue to develop, that our shareholders continue to be satisfied and that a.s.r. continues to play its role in society. For instance, we combine our professional skills with new developments in technology and healthcare, on this front. We dare to think differently and to go against the flow if necessary.
I act decisivelyWe are committed and know how to act. We take a practical approach. We do this in a personal way and always based on our professional expertise.
a.s.r. 2016 solvency and financial condition report | A Business and performance 9
System o
f Go
vernance
System o
f Go
vernance
Risk p
rofile
Risk p
rofile
Valuatio
n for So
lvency purp
oses
Valuatio
n for So
lvency purp
oses
Cap
ital manag
ement
Cap
ital manag
ement
Business and
perfo
rmance
Business and
perfo
rmance
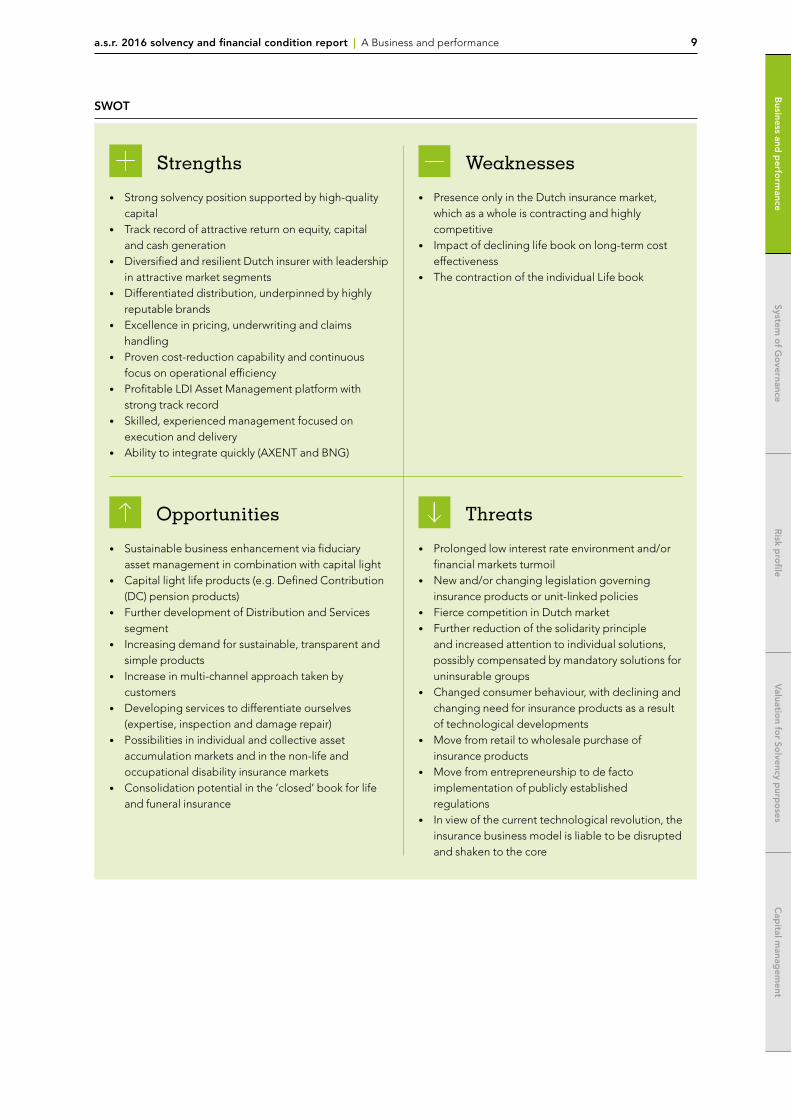
SWOT
Strengths
• Strong solvency position supported by high-quality capital
• Track record of attractive return on equity, capital and cash generation
• Diversified and resilient Dutch insurer with leadership in attractive market segments
• Differentiated distribution, underpinned by highly reputable brands
• Excellence in pricing, underwriting and claims handling
• Proven cost-reduction capability and continuous focus on operational efficiency
• Profitable LDI Asset Management platform with strong track record
• Skilled, experienced management focused on execution and delivery
• Ability to integrate quickly (AXENT and BNG)
Opportunities
• Sustainable business enhancement via fiduciary asset management in combination with capital light
• Capital light life products (e.g. Defined Contribution (DC) pension products)
• Further development of Distribution and Services segment
• Increasing demand for sustainable, transparent and simple products
• Increase in multi-channel approach taken by customers
• Developing services to differentiate ourselves (expertise, inspection and damage repair)
• Possibilities in individual and collective asset accumulation markets and in the non-life and occupational disability insurance markets
• Consolidation potential in the ‘closed’ book for life and funeral insurance
Weaknesses
• Presence only in the Dutch insurance market, which as a whole is contracting and highly competitive
• Impact of declining life book on long-term cost effectiveness
• The contraction of the individual Life book
Threats
• Prolonged low interest rate environment and/or financial markets turmoil
• New and/or changing legislation governing insurance products or unit-linked policies
• Fierce competition in Dutch market• Further reduction of the solidarity principle
and increased attention to individual solutions, possibly compensated by mandatory solutions for uninsurable groups
• Changed consumer behaviour, with declining and changing need for insurance products as a result of technological developments
• Move from retail to wholesale purchase of insurance products
• Move from entrepreneurship to de facto implementation of publicly established regulations
• In view of the current technological revolution, the insurance business model is liable to be disrupted and shaken to the core
a.s.r. 2016 solvency and financial condition report | A Business and performance 10
System o
f Go
vernanceR
isk pro
fileV
aluation fo
r Solvency p
urpo
sesC
apital m
anagem
entB
usiness and p
erform
ance
A.1.2 General informationASR Nederland N.V. (a.s.r.) is a leading insurance company in the Netherlands. a.s.r sells insurance products under the following labels: a.s.r., De Amersfoortse, Ditzo, Europeesche Verzekeringen and Ardanta. a.s.r. has a total of 3,461 internal FTE’s (31 December 2015: 3,650).
a.s.r. is a public limited company under Dutch law having its registered office located at Archimedeslaan 10, 3584 BA in Utrecht, the Netherlands. a.s.r. has chosen the Netherlands as ‘country of origin’ (land van herkomst) for the issued share capital and corporate bonds which are listed on Euronext Amsterdam. As of 10 June 2016 a.s.r. is listed on Euronext Amsterdam (Ticker: ASR NL).
The SFCR is presented in euros (€), being the functional currency of a.s.r. and all its group entities. All amounts quoted in the tables contained in these SFCR are in millions of euros, unless otherwise indicated.
The SFCR has been prepared by and are the sole responsibility of the Company’s management.Selected Own Funds and SCR information are also reported in asr financial statements.EY has examined the 2016 financial statements and issued an report thereon.
The Executive Board released the SFCR for publication for publication on 29 March 2017.
Name and contact details of the supervisory authorityName: De Nederlandsche BankVisiting address: Westeinde 1, 1017 ZN AmsterdamPhone number (general): +31 800 020 1068Phone number (business purposes): +31 20 524 9111Email: [email protected]
Name and contact details of the external auditorName: EYVisiting address: Cross Towers, Antonio Vivaldistraat 150, 1083 HP AmsterdamPhone number: +31 88 407 1000
a.s.r. 2016 solvency and financial condition report | A Business and performance 11
System o
f Go
vernance
System o
f Go
vernance
Risk p
rofile
Risk p
rofile
Valuatio
n for So
lvency purp
oses
Valuatio
n for So
lvency purp
oses
Cap
ital manag
ement
Cap
ital manag
ement
Business and
perfo
rmance
Business and
perfo
rmance
A.1.3 Structure
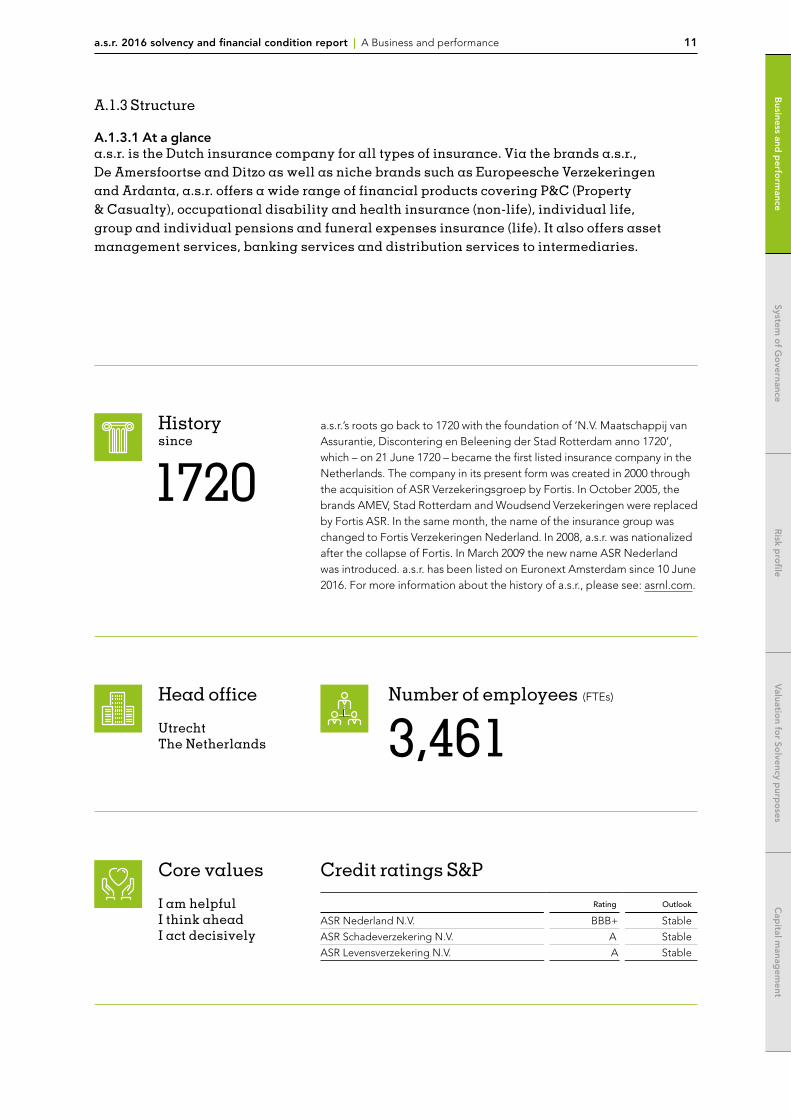
A.1.3.1 At a glance a.s.r. is the Dutch insurance company for all types of insurance. Via the brands a.s.r., De Amersfoortse and Ditzo as well as niche brands such as Europeesche Verzekeringen and Ardanta, a.s.r. offers a wide range of financial products covering P&C (Property & Casualty), occupational disability and health insurance (non-life), individual life, group and individual pensions and funeral expenses insurance (life). It also offers asset management services, banking services and distribution services to intermediaries.
History since
Number of employees (FTEs)
3,461Head office
UtrechtThe Netherlands
a.s.r.’s roots go back to 1720 with the foundation of ‘N.V. Maatschappij van Assurantie, Discontering en Beleening der Stad Rotterdam anno 1720’, which – on 21 June 1720 – became the first listed insurance company in the Netherlands. The company in its present form was created in 2000 through the acquisition of ASR Verzekeringsgroep by Fortis. In October 2005, the brands AMEV, Stad Rotterdam and Woudsend Verzekeringen were replaced by Fortis ASR. In the same month, the name of the insurance group was changed to Fortis Verzekeringen Nederland. In 2008, a.s.r. was nationalized after the collapse of Fortis. In March 2009 the new name ASR Nederland was introduced. a.s.r. has been listed on Euronext Amsterdam since 10 June 2016. For more information about the history of a.s.r., please see: asrnl.com.
Credit ratings S&P
Rating Outlook
ASR Nederland N.V. BBB+ Stable
ASR Schadeverzekering N.V. A Stable
ASR Levensverzekering N.V. A Stable
Core values
I am helpful I think ahead I act decisively
1720
a.s.r. 2016 solvency and financial condition report | A Business and performance 12
System o
f Go
vernanceR
isk pro
fileV
aluation fo
r Solvency p
urpo
sesC
apital m
anagem
entB
usiness and p
erform
ance
Meeting customers’ needs
Excellence in pricing, underwriting and claims handling
Strategic principles
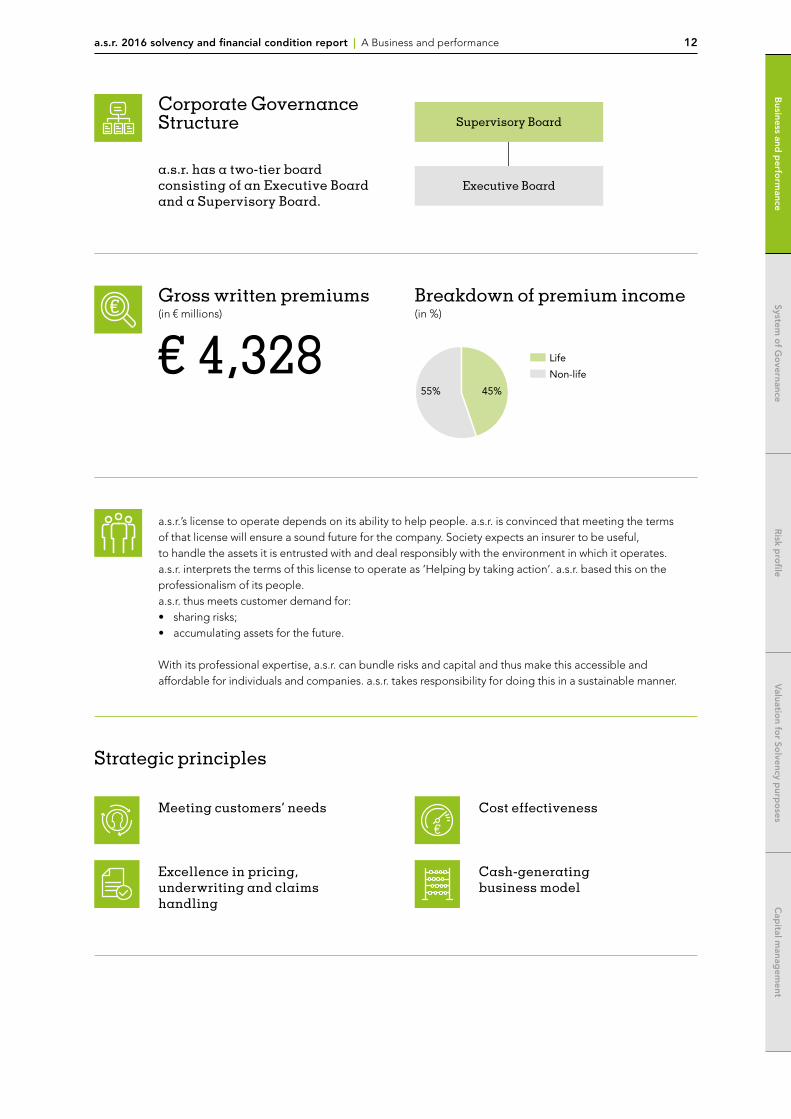
Corporate Governance Structure
a.s.r. has a two-tier board consisting of an Executive Board and a Supervisory Board.
Gross written premiums (in € millions)
€ 4,328Breakdown of premium income (in %)
45%55%
Life
Non-life
39,9
Supervisory Board
Executive Board
a.s.r.’s license to operate depends on its ability to help people. a.s.r. is convinced that meeting the terms of that license will ensure a sound future for the company. Society expects an insurer to be useful, to handle the assets it is entrusted with and deal responsibly with the environment in which it operates. a.s.r. interprets the terms of this license to operate as ‘Helping by taking action’. a.s.r. based this on the professionalism of its people. a.s.r. thus meets customer demand for:• sharing risks; • accumulating assets for the future. With its professional expertise, a.s.r. can bundle risks and capital and thus make this accessible and affordable for individuals and companies. a.s.r. takes responsibility for doing this in a sustainable manner.
Cost effectiveness
Cash-generating business model

a.s.r. 2016 solvency and financial condition report | A Business and performance 13
System o
f Go
vernance
System o
f Go
vernance
Risk p
rofile
Risk p
rofile
Valuatio
n for So
lvency purp
oses
Valuatio
n for So
lvency purp
oses
Cap
ital manag
ement
Cap
ital manag
ement
Business and
perfo
rmance
Business and
perfo
rmance
14.114.4
2015restated
2016
65.053.5
2015 2016
180 189
2016Day-one2016
95.0 95.6
2015 2016
Operating return on equity1 (in %)
Employee engagement (in %)
Gender diversity at the top (in %)
Combined ratio1
(in %)Solvency II (in %)
2016 2015
Executive Board 25% 25%
Supervisory Board 25% 25%
Higher and senior management 23% 24.5%
Carbon emissions2
(in tonnes of CO2)
7,4017,000
2015 20163
0
1
2
3
4
5
4.2
3.4
20162015
Customer Centricity Dashboard (AFM)
Transparency benchmark (ranking)
2015 136
2016 60
1 The figures for 2015 have been restated due to retroactive adjustments to the provisions related to acquisitions (one year window) and
immaterial adjustments related to the accounting for a.s.r.’s employee benefits.
2 The emission is only at our own operations (excluding Scope 3 GHG protocol).
3 In 2016, the absolute carbon footprint was up as a result of the relocation of Europeesche Verzekeringen, which resulted in an increase in
headcount of 528 FTEs in Utrecht.
4 Concerns average over Q4 2015 and 2016.
Net Promoter Score4
-5.0
4.6
2015
2016
a.s.r. 2016 solvency and financial condition report | A Business and performance 14
System o
f Go
vernanceR
isk pro
fileV
aluation fo
r Solvency p
urpo
sesC
apital m
anagem
entB
usiness and p
erform
ance
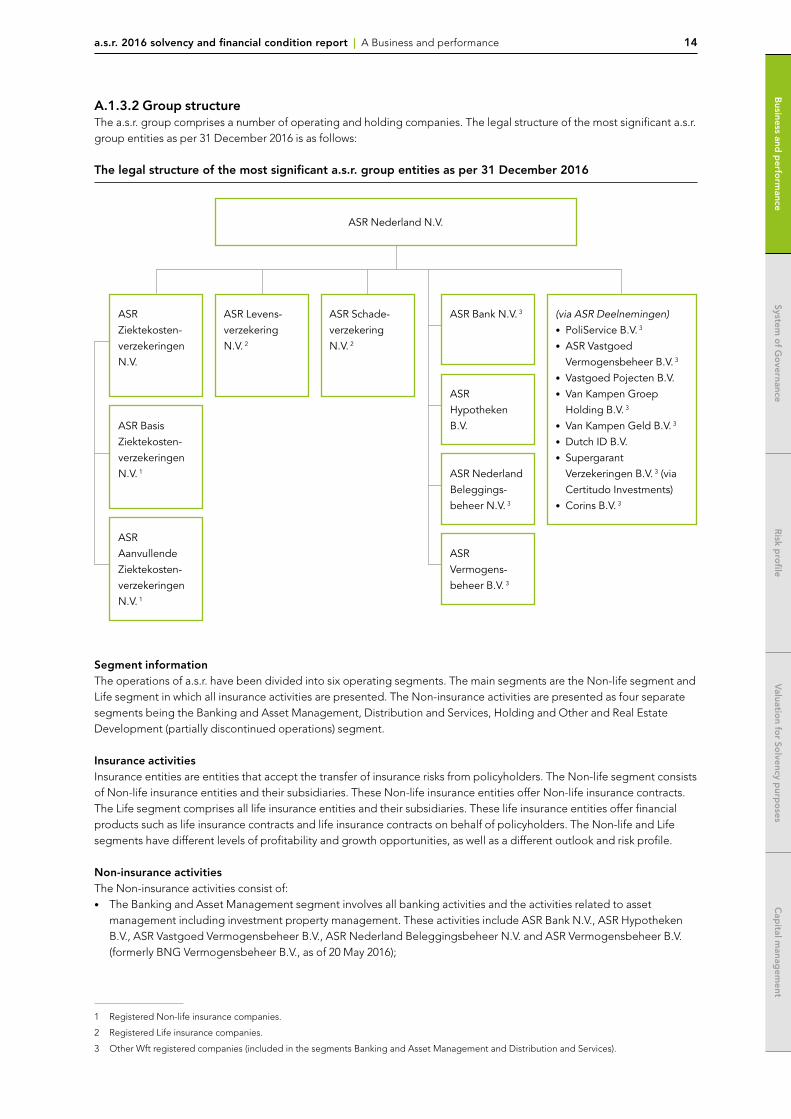
A.1.3.2 Group structureThe a.s.r. group comprises a number of operating and holding companies. The legal structure of the most significant a.s.r. group entities as per 31 December 2016 is as follows:
The legal structure of the most significant a.s.r. group entities as per 31 December 2016
ASR Nederland N.V.
ASR Levensverzekering N.V. 2
ASR Schadeverzekering N.V. 2
(via ASR Deelnemingen)• PoliService B.V. 3
• ASR Vastgoed Vermogensbeheer B.V. 3
• Vastgoed Pojecten B.V.• Van Kampen Groep
Holding B.V. 3
• Van Kampen Geld B.V. 3
• Dutch ID B.V.• Supergarant
Verzekeringen B.V. 3 (via Certitudo Investments)
• Corins B.V. 3
ASR Vermogensbeheer B.V. 3
ASR Ziektekostenverzekeringen N.V.
ASR Basis Ziekte kostenverzekeringen N.V. 1
ASR Aanvullende Ziektekostenverzekeringen N.V. 1
ASR Bank N.V. 3
ASR Hypotheken B.V.
ASR Nederland Beleggingsbeheer N.V. 3
Segment informationThe operations of a.s.r. have been divided into six operating segments. The main segments are the Non-life segment and Life segment in which all insurance activities are presented. The Non-insurance activities are presented as four separate segments being the Banking and Asset Management, Distribution and Services, Holding and Other and Real Estate Development (partially discontinued operations) segment.
Insurance activitiesInsurance entities are entities that accept the transfer of insurance risks from policyholders. The Non-life segment consists of Non-life insurance entities and their subsidiaries. These Non-life insurance entities offer Non-life insurance contracts. The Life segment comprises all life insurance entities and their subsidiaries. These life insurance entities offer financial products such as life insurance contracts and life insurance contracts on behalf of policyholders. The Non-life and Life segments have different levels of profitability and growth opportunities, as well as a different outlook and risk profile. Non-insurance activitiesThe Non-insurance activities consist of:• The Banking and Asset Management segment involves all banking activities and the activities related to asset
management including investment property management. These activities include ASR Bank N.V., ASR Hypotheken B.V., ASR Vastgoed Vermogensbeheer B.V., ASR Nederland Beleggingsbeheer N.V. and ASR Vermogensbeheer B.V. (formerly BNG Vermogensbeheer B.V., as of 20 May 2016);
1 Registered Non-life insurance companies.
2 Registered Life insurance companies.
3 Other Wft registered companies (included in the segments Banking and Asset Management and Distribution and Services).
a.s.r. 2016 solvency and financial condition report | A Business and performance 15
System o
f Go
vernance
System o
f Go
vernance
Risk p
rofile
Risk p
rofile
Valuatio
n for So
lvency purp
oses
Valuatio
n for So
lvency purp
oses
Cap
ital manag
ement
Cap
ital manag
ement
Business and
perfo
rmance
Business and
perfo
rmance
• The Distribution and Services segment includes the activities related to distribution of insurance contracts and includes the financial intermediary business of PoliService B.V., Van Kampen Groep Holding B.V. (as of 22 January 2015), Dutch ID B.V. (as of 19 November 2015),B.V. Nederlandse Hulpverleningsorganisatie SOS International (classified as discontinued operations and as per 25 January 2016 these activities have been sold), SuperGarant Verzekeringen B.V. en SuperGarant Assuradeuren B.V. (as of 1 September 2016) and Corins B.V. (as of 3 October 2016);
• The Holding and Other segment consists primarily of the holding activities of ASR Nederland N.V. (including the group related activities), other holding and intermediate holding companies and the activities of ASR Deelnemingen N.V.;
• The Real Estate Development segment (continuing and discontinued operations) consists of the activities where property development occurs. These activities are performed in ASR Vastgoed Ontwikkeling N.V. (as per end of April 2016 these activities are sold) and ASR Vastgoed Projecten B.V
The a.s.r. segment reporting shows the financial performance of each segment. The purpose of the segment reporting is to allocate all items in the balance sheet and income statement to the segments, for which respective segment management has full responsibility.Segment information has been prepared in accordance with the accounting principles used for the preparation of a.s.r.’s consolidated financial statements Intersegment transactions are conducted at arm’s length conditions. In general, cost related to centralized services are allocated to the segments based on the utilization of these services.
With effect from 2016, the segments are assessed on their operating result, which is based on the profit before tax adjusted for:• Investment related income: income for own account of an incidental nature (for example realized capital gains and
losses, impairment losses or reversals and (un)realized changes of investments held at fair value), and• Incidentals: incidental items not relating to ordinary activities as a result of accounting changes, consulting fees for
acquisitions, restructuring expenses, start-up costs, privatization expenses and shareholder-related expenses.
For comparative purposes the 2015 operating result has also been adjusted accordingly.
a.s.r. 2016 solvency and financial condition report | A Business and performance 16
System o
f Go
vernanceR
isk pro
fileV
aluation fo
r Solvency p
urpo
sesC
apital m
anagem
entB
usiness and p
erform
ance
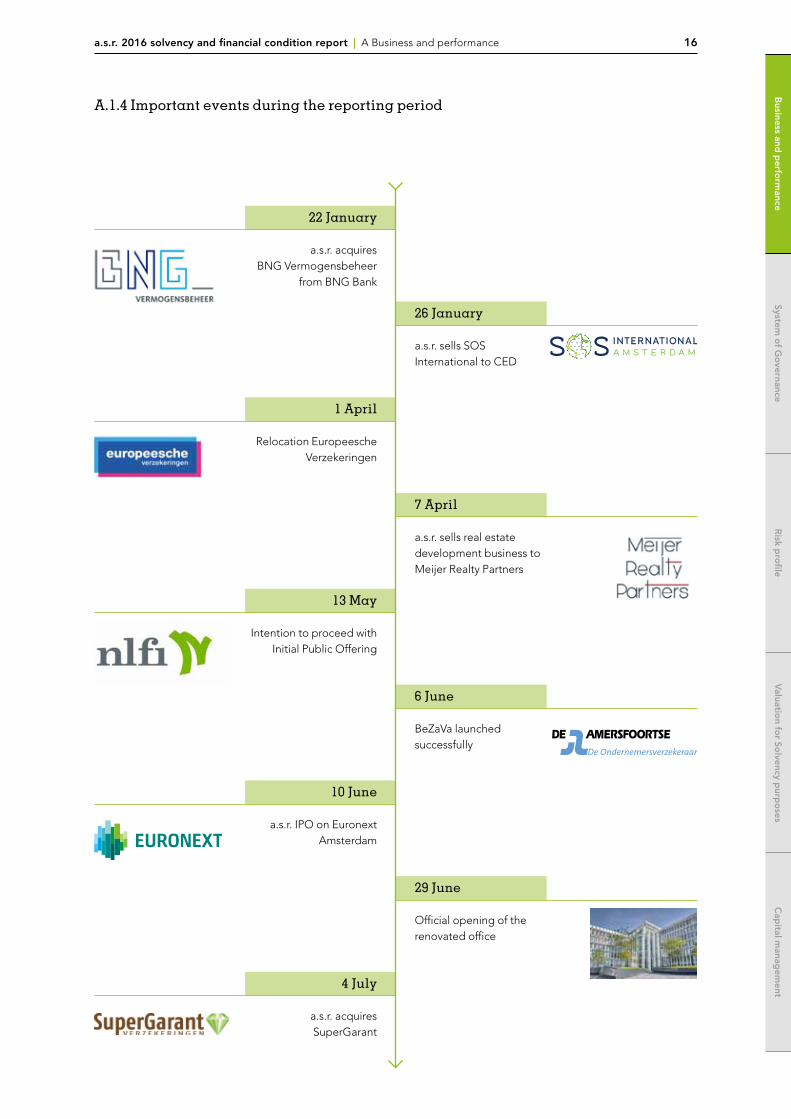
A.1.4 Important events during the reporting period
22 January
a.s.r. acquires BNG Vermogensbeheer
from BNG Bank
1 April
Relocation Europeesche Verzekeringen
26 January
a.s.r. sells SOS International to CED
7 April
a.s.r. sells real estate development business to Meijer Realty Partners
13 May
Intention to proceed with Initial Public Offering
6 June
BeZaVa launched successfully
10 June
a.s.r. IPO on Euronext Amsterdam
29 June
Official opening of the renovated office
4 July
a.s.r. acquires SuperGarant

a.s.r. 2016 solvency and financial condition report | A Business and performance 17
System o
f Go
vernance
System o
f Go
vernance
Risk p
rofile
Risk p
rofile
Valuatio
n for So
lvency purp
oses
Valuatio
n for So
lvency purp
oses
Cap
ital manag
ement
Cap
ital manag
ement
Business and
perfo
rmance
Business and
perfo
rmance
17 November
The Fair Insurance Guide awards a.s.r. the highest score for its sustainable investment policy
8 December
Province of Noord-Brabant awards a.s.r. Asset Management mandate worth € 1.7 billion
29 July
AstraZeneca transfers pension plan to a.s.r
28 September
The final of the first edition of the a.s.r. scholen challenge
30 September
a.s.r. successfully launches Het nederlandse pensioenfonds and announces the first customer4 October
2.4 million AXENT funeral policies successfully
transferred to Ardanta
6 December
a.s.r. Real Estate Management acquires
offices portfolio of Railway NS Basisfonds
Stationslocaties C.V. and aims to start an Office
fund in 2017
24 October
a.s.r. signs Ethical Manifest to help customers with late payments to find a solution
3 November
a.s.r. Asset Management kicks off as third party
asset manager
18 July
a.s.r. acquires Corins
a.s.r. 2016 solvency and financial condition report | A Business and performance 18
System o
f Go
vernanceR
isk pro
fileV
aluation fo
r Solvency p
urpo
sesC
apital m
anagem
entB
usiness and p
erform
ance
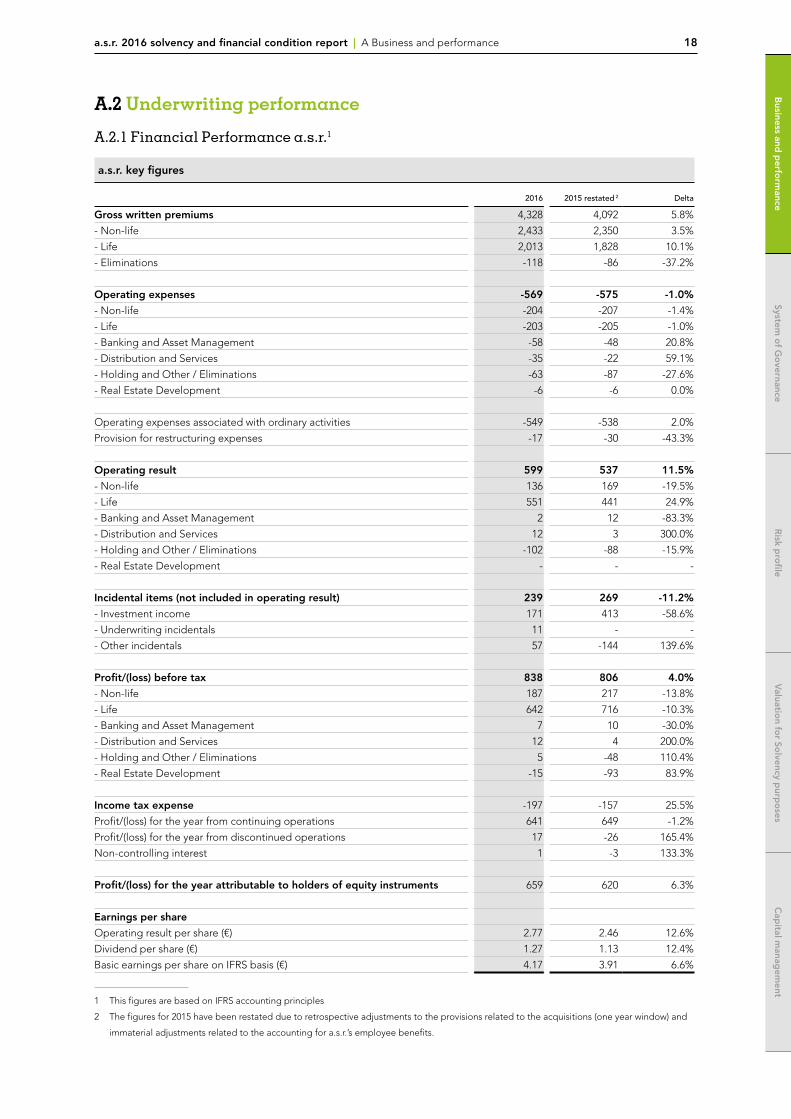
A.2 Underwriting performance
A.2.1 Financial Performance a.s.r.1
a.s.r. key figures
2016 2015 restated 2 Delta
Gross written premiums 4,328 4,092 5.8%
- Non-life 2,433 2,350 3.5%
- Life 2,013 1,828 10.1%
- Eliminations -118 -86 -37.2%
Operating expenses -569 -575 -1.0%
- Non-life -204 -207 -1.4%
- Life -203 -205 -1.0%
- Banking and Asset Management -58 -48 20.8%
- Distribution and Services -35 -22 59.1%
- Holding and Other / Eliminations -63 -87 -27.6%
- Real Estate Development -6 -6 0.0%
Operating expenses associated with ordinary activities -549 -538 2.0%
Provision for restructuring expenses -17 -30 -43.3%
Operating result 599 537 11.5%
- Non-life 136 169 -19.5%
- Life 551 441 24.9%
- Banking and Asset Management 2 12 -83.3%
- Distribution and Services 12 3 300.0%
- Holding and Other / Eliminations -102 -88 -15.9%
- Real Estate Development - - -
Incidental items (not included in operating result) 239 269 -11.2%
- Investment income 171 413 -58.6%
- Underwriting incidentals 11 - -
- Other incidentals 57 -144 139.6%
Profit/(loss) before tax 838 806 4.0%
- Non-life 187 217 -13.8%
- Life 642 716 -10.3%
- Banking and Asset Management 7 10 -30.0%
- Distribution and Services 12 4 200.0%
- Holding and Other / Eliminations 5 -48 110.4%
- Real Estate Development -15 -93 83.9%
Income tax expense -197 -157 25.5%
Profit/(loss) for the year from continuing operations 641 649 -1.2%
Profit/(loss) for the year from discontinued operations 17 -26 165.4%
Non-controlling interest 1 -3 133.3%
Profit/(loss) for the year attributable to holders of equity instruments 659 620 6.3%
Earnings per share
Operating result per share (€) 2.77 2.46 12.6%
Dividend per share (€) 1.27 1.13 12.4%
Basic earnings per share on IFRS basis (€) 4.17 3.91 6.6%
1 This figures are based on IFRS accounting principles
2 The figures for 2015 have been restated due to retrospective adjustments to the provisions related to the acquisitions (one year window) and
immaterial adjustments related to the accounting for a.s.r.’s employee benefits.
a.s.r. 2016 solvency and financial condition report | A Business and performance 19
System o
f Go
vernance
System o
f Go
vernance
Risk p
rofile
Risk p
rofile
Valuatio
n for So
lvency purp
oses
Valuatio
n for So
lvency purp
oses
Cap
ital manag
ement
Cap
ital manag
ement
Business and
perfo
rmance
Business and
perfo
rmance
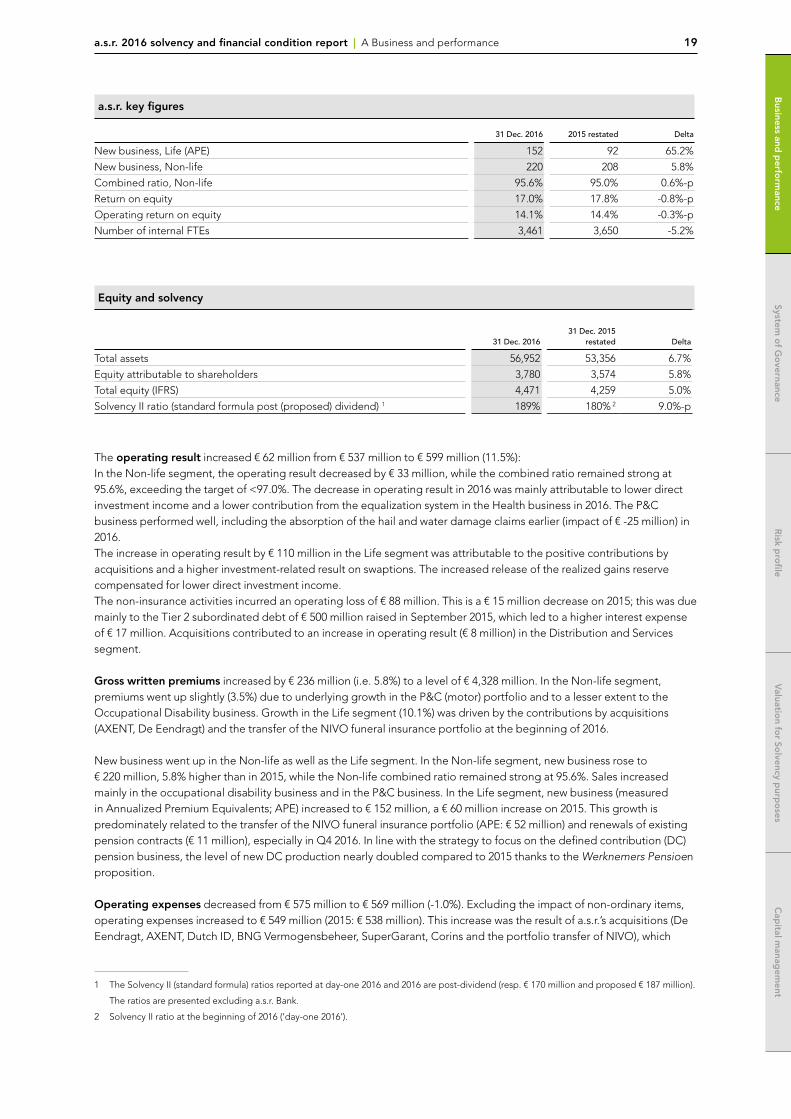
a.s.r. key figures
31 Dec. 2016 2015 restated Delta
New business, Life (APE) 152 92 65.2%
New business, Non-life 220 208 5.8%
Combined ratio, Non-life 95.6% 95.0% 0.6%-p
Return on equity 17.0% 17.8% -0.8%-p
Operating return on equity 14.1% 14.4% -0.3%-p
Number of internal FTEs 3,461 3,650 -5.2%
Equity and solvency
31 Dec. 201631 Dec. 2015
restated Delta
Total assets 56,952 53,356 6.7%
Equity attributable to shareholders 3,780 3,574 5.8%
Total equity (IFRS) 4,471 4,259 5.0%
Solvency II ratio (standard formula post (proposed) dividend) 1 189% 180% 2 9.0%-p
The operating result increased € 62 million from € 537 million to € 599 million (11.5%):In the Non-life segment, the operating result decreased by € 33 million, while the combined ratio remained strong at 95.6%, exceeding the target of <97.0%. The decrease in operating result in 2016 was mainly attributable to lower direct investment income and a lower contribution from the equalization system in the Health business in 2016. The P&C business performed well, including the absorption of the hail and water damage claims earlier (impact of € -25 million) in 2016.The increase in operating result by € 110 million in the Life segment was attributable to the positive contributions by acquisitions and a higher investment-related result on swaptions. The increased release of the realized gains reserve compensated for lower direct investment income.The non-insurance activities incurred an operating loss of € 88 million. This is a € 15 million decrease on 2015; this was due mainly to the Tier 2 subordinated debt of € 500 million raised in September 2015, which led to a higher interest expense of € 17 million. Acquisitions contributed to an increase in operating result (€ 8 million) in the Distribution and Services segment.
Gross written premiums increased by € 236 million (i.e. 5.8%) to a level of € 4,328 million. In the Non-life segment, premiums went up slightly (3.5%) due to underlying growth in the P&C (motor) portfolio and to a lesser extent to the Occupational Disability business. Growth in the Life segment (10.1%) was driven by the contributions by acquisitions (AXENT, De Eendragt) and the transfer of the NIVO funeral insurance portfolio at the beginning of 2016.
New business went up in the Non-life as well as the Life segment. In the Non-life segment, new business rose to € 220 million, 5.8% higher than in 2015, while the Non-life combined ratio remained strong at 95.6%. Sales increased mainly in the occupational disability business and in the P&C business. In the Life segment, new business (measured in Annualized Premium Equivalents; APE) increased to € 152 million, a € 60 million increase on 2015. This growth is predominately related to the transfer of the NIVO funeral insurance portfolio (APE: € 52 million) and renewals of existing pension contracts (€ 11 million), especially in Q4 2016. In line with the strategy to focus on the defined contribution (DC) pension business, the level of new DC production nearly doubled compared to 2015 thanks to the Werknemers Pensioen proposition.
Operating expenses decreased from € 575 million to € 569 million (-1.0%). Excluding the impact of non-ordinary items, operating expenses increased to € 549 million (2015: € 538 million). This increase was the result of a.s.r.’s acquisitions (De Eendragt, AXENT, Dutch ID, BNG Vermogensbeheer, SuperGarant, Corins and the portfolio transfer of NIVO), which
1 The Solvency II (standard formula) ratios reported at day-one 2016 and 2016 are post-dividend (resp. € 170 million and proposed € 187 million).
The ratios are presented excluding a.s.r. Bank.
2 Solvency II ratio at the beginning of 2016 (‘day-one 2016’).
a.s.r. 2016 solvency and financial condition report | A Business and performance 20
System o
f Go
vernanceR
isk pro
fileV
aluation fo
r Solvency p
urpo
sesC
apital m
anagem
entB
usiness and p
erform
ance
increased the regular cost basis by € 13 million. Disregarding this impact, operating expenses decreased by € 2 million. The measures taken to reduce regular costs and to create a more flexible cost base are on target.
The number of internal FTEs decreased by 189 (i.e. 5.2%) to 3,461 FTEs as at 31 December in 2016 (2015: 3,650 FTEs). Acquisitions in 2016 (SuperGarant, Corins and BNG asset management) added 50 FTEs. Adjusted for the number of internal FTEs of sold businesses in 2016 (a.s.r. Vastgoed Ontwikkeling and SOS International, i.e. 161 FTEs in total), the decrease would have been 28 FTEs.
Profit for the year was up 6.3%, rising to € 659 million (2015: € 620 million) due to a higher operating result (pre-tax: € 62 million) and other incidentals, including an IAS19 release of a.s.r.’s own pension scheme (pre-tax: € 100 million) in the first half of 2016. Profit for the year at a.s.r. Vastgoed Ontwikkeling increased by € 121 million mainly as a result of additional loss provisions for the development portfolio in 2015. The sale of a.s.r.’s equity exposure in 2015 led to a high level of realized capital gains on equity compared to 2015 (pre-tax: € 242 million negative).
Operating return on equity remained strong at 14.1% (2015: 14.4%), exceeding the target of ‘up to 12%’. IFRS-based return on equity stood at 17.0% (2015: 17.8%). The addition of profit for the year, partly offset by the dividend, discretionary interest payments and a negative impacted from IAS 19-related actuarial gains and losses due to a decrease in the discount rate, led to an overall positive effect on equity. Earnings per share were up, with operating result per share increasing from € 2.46 to € 2.77 (12.6%).
The Solvency II ratio increased by 9 percentage points to 189% (day-one 2016: 180%). The Solvency II ratio increased from day-one 2016 mainly due to accretion driven by organic growth, cost savings and LACDT guidance.
Medium-term targetsDuring the IPO process and a.s.r.’s subsequent listing on Euronext, the a.s.r. management communicated targets. These targets relate to the medium term. In 2016, a.s.r. delivered on its promises by exceeding its medium-term financial targets.
2016Medium-term
target
Solvency II (standard formula) 189% > 160%
Operating return on equity 14.1% up to 12%
Operating expenses on target € 50 million
Combined ratio, Non-life 95.6% < 97%
Financial leverage 25.2% < 30%
S&P rating (insurance business) Single A Single A
Dividend for 2016Management proposes to distribute a cash dividend of € 187 million for the full year 2016; this is a € 17 million increase compared to last year. The proposed dividend also exceeds the guidance given at IPO, which involved a discretionary dividend for 2016 of € 175 million. The increase in dividend is driven by strong operating results and reflects management’s confidence in the performance of the business.
The proposed dividend per share amounts to € 1.27 per share payable in cash, up 12.4% from 2015 (pro-forma € 1.13). Following the approval of the Annual General Meeting on 31 May 2017, the dividend will become payable with effect from 7 June 2017. The a.s.r. stock will trade ex-dividend on 2 June 2017.
Dividend policy for 2017In 2016, a.s.r. announced a dividend policy for 2017. Going forward, the annual dividend will be based on a pay-out ratio of 45% to 55% of net operating result attributable to shareholders (i.e. net of hybrid costs). a.s.r. applies a boundary condition based on its Solvency II position. a.s.r. does not plan to pay a cash dividend if the Solvency II ratio were to fall below 140%.
To enable future dividend distributions, a.s.r. seeks to attain a cash position at holding level of at least € 350 million. At year end, the cash position at holding level was € 354 million.

a.s.r. 2016 solvency and financial condition report | A Business and performance 21
System o
f Go
vernance
System o
f Go
vernance
Risk p
rofile
Risk p
rofile
Valuatio
n for So
lvency purp
oses
Valuatio
n for So
lvency purp
oses
Cap
ital manag
ement
Cap
ital manag
ement
Business and
perfo
rmance
Business and
perfo
rmance
A.2.2 Financial Performance Non-life segment• The operating result stood at € 136 million. Better conditions in the occupational disability business were more than
offset by Health due to a lower contribution from the equalization system and higher claims.• At 95.6%, the combined ratio remained at a good level (2015: 95.0%) despite a rising ratio at Health. This demonstrates
a.s.r.’s excellence in underwriting capabilities.• Gross written premiums rose to € 2,433 million (3.5%), mainly related to growth in the P&C business and Occupational
Disability.• Operating expenses, including the provision for restructuring expenses, were down 5% as a result of continuing
operational efficiency improvements combined with lower restructuring expenses.
Key figures, Non-life (in € million, unless stated otherwise)
2016 2015 Delta
Gross written premiums 2,433 2,350 3.5%
Operating expenses -204 -207 -1.4%
Provision for restructuring expenses -6 -15 -60.0%
Operating result 136 169 -19.5%
Incidental items (not included in operating result) 51 48 6.3%
- Investment income 30 63 -52.4%
- Underwriting incidentals 27 - -
- Other incidentals -6 -15 -60.0%
Profit/(loss) before tax 187 217 -13.8%
Profit/(loss) for the year attributable to holders of equity instruments 143 169 -15.4%
New business, Non-life 220 208 5.8%
Combined ratio, Non-life
2016 2015 Delta
Combined ratio, Non-life segment 95.6% 95.0% 0.6%-p
- Commission ratio 15.3% 15.0% 0.3%-p
- Cost ratio 8.3% 8.9% -0.6%-p
- Claims ratio 72.0% 71.1% 0.9%-p
Combined ratio
- P&C (a.s.r. Schade, Ditzo and Europeesche Verzekeringen) 98.5% 98.5% 0.0%-p
- Occupational Disability 88.2% 89.6% -1.4%-p
- Health 99.1% 95.5% 3.6%-p
The operating result in the Non-life segment continued to be strong. The underwriting results of the Occupational Disability business increased and were driven by growing business volumes, reflecting the recovery of the Dutch economy in combination with expertise in claims handling, prevention and reintegration. In the Health insurance business, the operating result showed a decrease of € 25 million due to lower benefits in 2016 from the Dutch National Health Care Institute (‘Zorginstituut Nederland’) via the equalization system and higher dentist claims for supplementary health insurance. Higher claims from exceptional hail and water damage in June 2016 led to a specific claims burden of € 25 million after reinsurance in the P&C business. Furthermore, an increase was seen in the number of large claims (€ 7 million), which was partly covered by reinsurance.
The combined ratio stood at 95.6% (2015: 95.0%) and remained strong, absorbing hail and water damage claims. The cost ratio further improved by 0.6 percentage points to 8.3%, the commission ratio increased slightly and the claims ratio increased. Disregarding the impact of hail and water damage claims in June 2016, the combined ratio would have been 94.5% (-1.1 percentage points) for the Non-life segment and 96.1% (-2.4 percentage points) for the P&C business (a.s.r. Schade, Ditzo and Europeesche Verzekeringen).
a.s.r. 2016 solvency and financial condition report | A Business and performance 22
System o
f Go
vernanceR
isk pro
fileV
aluation fo
r Solvency p
urpo
sesC
apital m
anagem
entB
usiness and p
erform
ance
Gross written premiums in the Non-life segment increased from € 2,350 million to € 2,433 million (3.5%). The increase was mainly related to the P&C motor business and attributable to an increase in premiums in the mandated brokers distribution channel. The occupational disability business also contributed to the growth as a result of the slight economic recovery and fewer bankruptcies, which led to higher employment levels and higher wages. Despite growth of new policies at Ditzo, Health insurance business premiums decreased by 4% due to equalization system.
New business in the Non-life segment increased by 5.8% to € 220 million and was driven by further growth in sales of Vernieuwd Voordeelpakket (P&C), mainly in the intermediary channel (up 9% from 2015). Growth of new business included the higher contribution from Doorgaanverzekering (occupational disability and Health). This product allows business owners to combine health insurance with occupational disability, and was launched successfully at the end of 2015.
Operating expenses improved by 1.4% to € 204 million thanks to continuing focus on cost efficiency. The provision for restructuring expenses decreased by € 9 million to € -6 million, primarily in the P&C business. In the first half of 2016, the business of Europeesche Verzekeringen was further integrated with the transfer from Amsterdam to the a.s.r. office in Utrecht.
The decline in profit for the year was mainly attributable to developments in operating result. A lower contribution of incidental investment income, including realized capital gains on equity, was offset by an incidental release of premium reserves (€ 27 million).
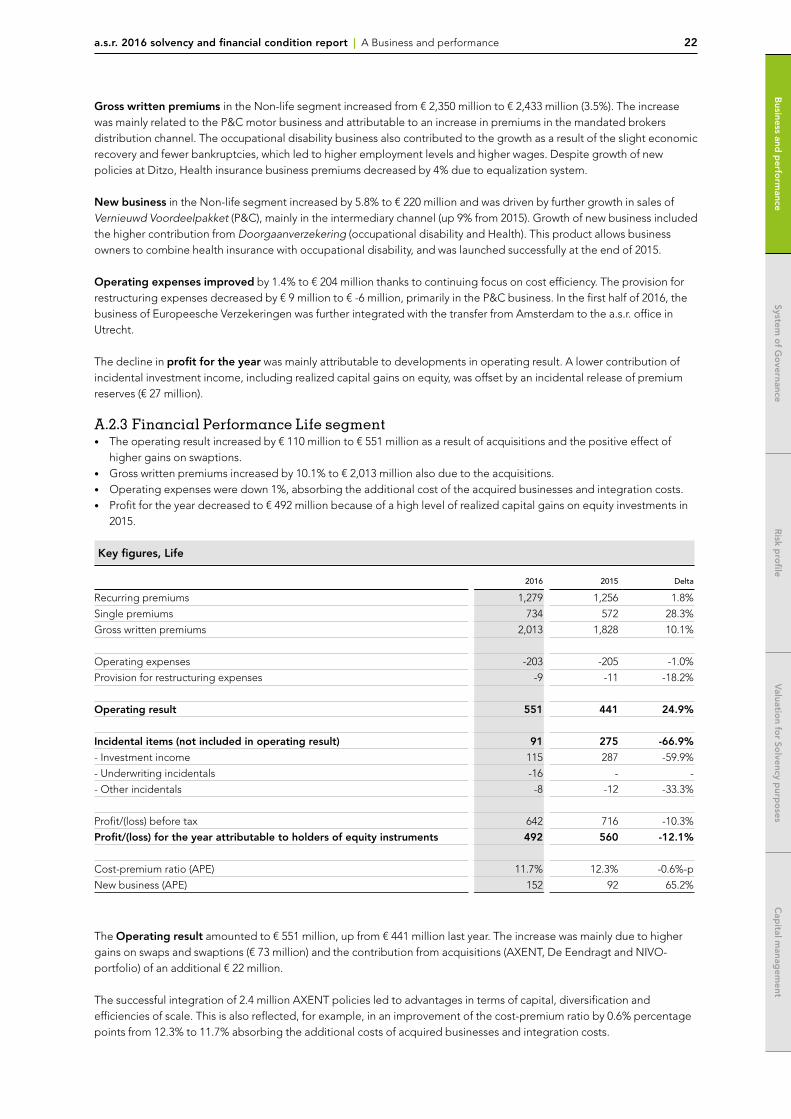
A.2.3 Financial Performance Life segment• The operating result increased by € 110 million to € 551 million as a result of acquisitions and the positive effect of
higher gains on swaptions.• Gross written premiums increased by 10.1% to € 2,013 million also due to the acquisitions.• Operating expenses were down 1%, absorbing the additional cost of the acquired businesses and integration costs.• Profit for the year decreased to € 492 million because of a high level of realized capital gains on equity investments in
2015.
Key figures, Life
2016 2015 Delta
Recurring premiums 1,279 1,256 1.8%
Single premiums 734 572 28.3%
Gross written premiums 2,013 1,828 10.1%
Operating expenses -203 -205 -1.0%
Provision for restructuring expenses -9 -11 -18.2%
Operating result 551 441 24.9%
Incidental items (not included in operating result) 91 275 -66.9%
- Investment income 115 287 -59.9%
- Underwriting incidentals -16 - -
- Other incidentals -8 -12 -33.3%
Profit/(loss) before tax 642 716 -10.3%
Profit/(loss) for the year attributable to holders of equity instruments 492 560 -12.1%
Cost-premium ratio (APE) 11.7% 12.3% -0.6%-p
New business (APE) 152 92 65.2%
The Operating result amounted to € 551 million, up from € 441 million last year. The increase was mainly due to higher gains on swaps and swaptions (€ 73 million) and the contribution from acquisitions (AXENT, De Eendragt and NIVO-portfolio) of an additional € 22 million.
The successful integration of 2.4 million AXENT policies led to advantages in terms of capital, diversification and efficiencies of scale. This is also reflected, for example, in an improvement of the cost-premium ratio by 0.6% percentage points from 12.3% to 11.7% absorbing the additional costs of acquired businesses and integration costs.

a.s.r. 2016 solvency and financial condition report | A Business and performance 23
System o
f Go
vernance
System o
f Go
vernance
Risk p
rofile
Risk p
rofile
Valuatio
n for So
lvency purp
oses
Valuatio
n for So
lvency purp
oses
Cap
ital manag
ement
Cap
ital manag
ement
Business and
perfo
rmance
Business and
perfo
rmance
Gross written premiums increased by 10.1% to € 2,013 million. Recurring premiums increased by € 23 million to € 1,279 million (1.8%). The decrease in the individual life portfolio was more than offset by growth in the funeral business (AXENT and NIVO) and pension business (De Eendragt). The DC pension product Werknemers Pensioen also contributed to the growth as did customers switching as a result of the commercial integration of De Eendragt. Single premiums in the Life segment increased by € 162 million to € 734 million (28.3%). The increase was mainly attributable to the transfer of the NIVO funeral portfolio (€ 323 million) and a pension contract for AstraZeneca (€ 195 million). In 2015, the Chevron pension contract added € 370 million in single premiums. As lapses are structurally higher than new production in the individual life market, gross written premiums have decreased over time. The level of lapses of unit-linked policies in the individual life business is shrinking and showed a slight decrease in 2016, dropping from 1.7% in 2015 to 1.5% in 2016.
New business, measured in APE, increased from € 92 million last year to € 152 million in 2016 (€ 60 million). Excluding the inflow on new business from the single and regular premiums associated with the NIVO funeral insurance portfolio (impact: € 52 million), the underlying growth of the Life segment was € 8 million (Pension business: € 11 million; Individual Life: € -2 million; Funeral: more or less stable). In the Pension business, the shift from capital-intensive defined benefit (DB) products to capital-light DC products was reflected in a doubling of new business from the Werknemers Pensioen product proposition.
In Funeral business, the share of the online channel continued to grow. This year, 48% of total new business was written through the online distribution channel (2015: 45%).
Operating expenses, including the additional cost base of acquisitions (€ 8 million), decreased by € 2 million to € 203 million (-1.0%). Due to the successful migration of acquired portfolios to a.s.r.’s ICT platform, efficiencies of scale were achieved. As a result, the cost premium ratio improved by 0.6% percentage point to 11.7%. During 2016, further steps were taken to achieve the cost-savings ambitions. This includes the migration of several product and system combinations to a new single platform and the use of business process outsourcing to make costs more flexible.Profit for the year decreased by € 68 million from € 560 million to € 492 million. The decline was mainly attributable to a fall in equity investments in 2015, which resulted in a relatively high level of capital gains in 2015.
A.3 Investment performance
a.s.r.’s investment policy is aimed at striking a balance between generating returns and preventing risks. Protecting the solvency position is an important factor in this context.
A.3.1 Revenues and costs of all assets
Financial assets and derivatives can be broken down as follows:
31 December 2016 31 December 2015
Investments
Available for sale 25,340 24,930At fair value through profit and loss 131 133
25,471 25,063
Loans and receivables 11,468 10,480
Derivatives assets 3,060 2,196
Derivatives liabilities -577 -377
Cash and cash equivalents 3,581 2,629
17,532 14,928
Investments on behalf of policyholders
At fair value through profit and loss 7,745 7,924
Total 50,748 47,915
a.s.r. 2016 solvency and financial condition report | A Business and performance 24
System o
f Go
vernanceR
isk pro
fileV
aluation fo
r Solvency p
urpo
sesC
apital m
anagem
entB
usiness and p
erform
ance
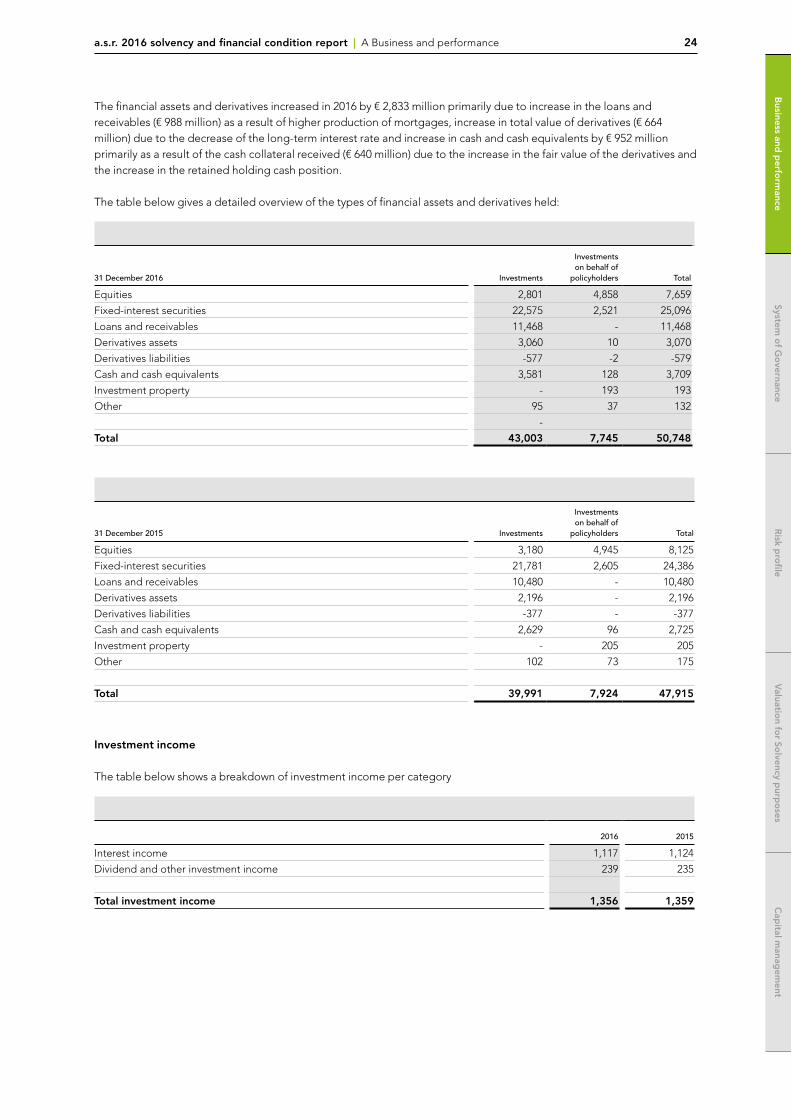
The financial assets and derivatives increased in 2016 by € 2,833 million primarily due to increase in the loans and receivables (€ 988 million) as a result of higher production of mortgages, increase in total value of derivatives (€ 664 million) due to the decrease of the long-term interest rate and increase in cash and cash equivalents by € 952 million primarily as a result of the cash collateral received (€ 640 million) due to the increase in the fair value of the derivatives and the increase in the retained holding cash position.
The table below gives a detailed overview of the types of financial assets and derivatives held:
31 December 2016 Investments
Investments on behalf of
policyholders Total
Equities 2,801 4,858 7,659
Fixed-interest securities 22,575 2,521 25,096
Loans and receivables 11,468 - 11,468
Derivatives assets 3,060 10 3,070
Derivatives liabilities -577 -2 -579
Cash and cash equivalents 3,581 128 3,709
Investment property - 193 193
Other 95 37 132
-
Total 43,003 7,745 50,748
31 December 2015 Investments
Investments on behalf of
policyholders Total
Equities 3,180 4,945 8,125
Fixed-interest securities 21,781 2,605 24,386
Loans and receivables 10,480 - 10,480
Derivatives assets 2,196 - 2,196
Derivatives liabilities -377 - -377
Cash and cash equivalents 2,629 96 2,725
Investment property - 205 205
Other 102 73 175
Total 39,991 7,924 47,915
Investment income
The table below shows a breakdown of investment income per category
2016 2015
Interest income 1,117 1,124
Dividend and other investment income 239 235
Total investment income 1,356 1,359
a.s.r. 2016 solvency and financial condition report | A Business and performance 25
System o
f Go
vernance
System o
f Go
vernance
Risk p
rofile
Risk p
rofile
Valuatio
n for So
lvency purp
oses
Valuatio
n for So
lvency purp
oses
Cap
ital manag
ement
Cap
ital manag
ement
Business and
perfo
rmance
Business and
perfo
rmance
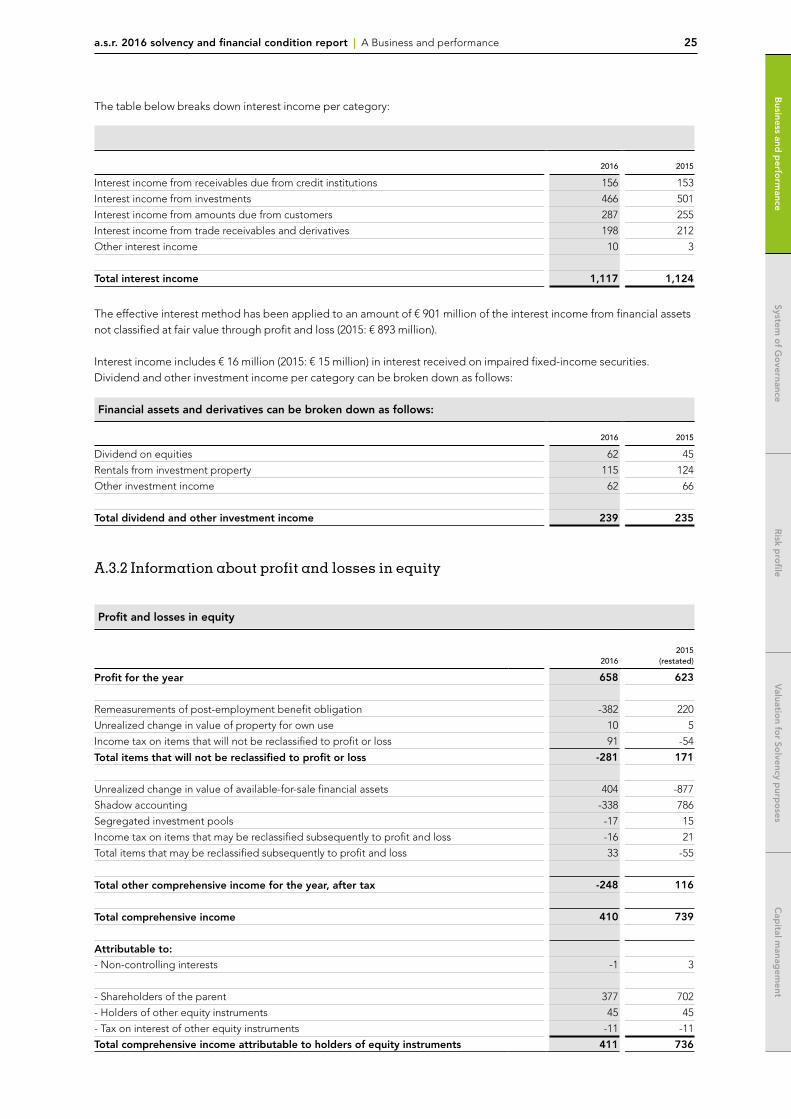
The table below breaks down interest income per category:
2016 2015
Interest income from receivables due from credit institutions 156 153
Interest income from investments 466 501
Interest income from amounts due from customers 287 255
Interest income from trade receivables and derivatives 198 212
Other interest income 10 3
Total interest income 1,117 1,124
The effective interest method has been applied to an amount of € 901 million of the interest income from financial assets not classified at fair value through profit and loss (2015: € 893 million).
Interest income includes € 16 million (2015: € 15 million) in interest received on impaired fixed-income securities. Dividend and other investment income per category can be broken down as follows:
Financial assets and derivatives can be broken down as follows:
2016 2015
Dividend on equities 62 45
Rentals from investment property 115 124
Other investment income 62 66
Total dividend and other investment income 239 235
A.3.2 Information about profit and losses in equity
Profit and losses in equity
20162015
(restated)
Profit for the year 658 623
Remeasurements of post-employment benefit obligation -382 220
Unrealized change in value of property for own use 10 5
Income tax on items that will not be reclassified to profit or loss 91 -54
Total items that will not be reclassified to profit or loss -281 171
Unrealized change in value of available-for-sale financial assets 404 -877
Shadow accounting -338 786
Segregated investment pools -17 15
Income tax on items that may be reclassified subsequently to profit and loss -16 21
Total items that may be reclassified subsequently to profit and loss 33 -55
Total other comprehensive income for the year, after tax -248 116
Total comprehensive income 410 739
Attributable to:- Non-controlling interests -1 3
- Shareholders of the parent 377 702
- Holders of other equity instruments 45 45
- Tax on interest of other equity instruments -11 -11
Total comprehensive income attributable to holders of equity instruments 411 736
System o
f Go
vernanceR
isk pro
fileV
aluation fo
r Solvency p
urpo
sesC
apital m
anagem
entB
usiness and p
erform
ance
a.s.r. 2016 solvency and financial condition report | A Business and performance 26
System o
f Go
vernanceR
isk pro
fileV
aluation fo
r Solvency p
urpo
sesC
apital m
anagem
entB
usiness and p
erform
ance
Shadow accounting allows a recognized but unrealized gain or loss on an asset to be transferred to liabilities arising from insurance contracts.
A.3.3 Information about investments in securitiesAs a.s.r. has no investments in securitization, no further information is included here.
A.4 Performance of other activities
No other activities are material.
A.5 Any other information
No other information is applicable.
a.s.r. 2016 solvency and financial condition report | B System of governance 27
System o
f Go
vernance
System o
f Go
vernance
Risk p
rofile
Risk p
rofile
Valuatio
n for So
lvency purp
oses
Valuatio
n for So
lvency purp
oses
Cap
ital manag
ement
Cap
ital manag
ement
Business and
perfo
rmance
Business and
perfo
rmance
System o
f Go
vernanceR
isk pro
fileV
aluation fo
r Solvency p
urpo
sesC
apital m
anagem
entB
usiness and p
erform
ance
B System of governance
B.1 General information on the system of governance
B.1.1 Corporate governance
B.1.1.1 Supervisory Board CommitteesAudit & Risk CommitteeThe Audit & Risk Committee has three members, Cor van den Bos (Chair), Annet Aris and Herman Hintzen. In 2016, the Committee held eight meetings that were also attended by the CFO, the Director of Group Risk Management, the Director of Group Accounting, Reporting & Control, the Director of Finance & Risk, the Director of Compliance, the Director of Audit and the independent external auditor. The standing agenda items included the financial (quarterly) results and the audit, compliance and quarterly risk reports. In addition, the Committee addressed issues specific to the supervised entities, including the impact of changing market conditions and the report related to Solvency II matters (including the Agreed Upon Procedures Solvency II).
After each quarter end, the Committee met to discuss the financial results based on detailed audit, compliance and risk reports and analyses. The full reporting year 2016 was discussed on the basis of the press release, the Annual Report, the financial statements, the board report and the actuarial report. The meeting to discuss the actuarial report was also attended by the actuarial function. The Committee issued positive opinions on the Annual Report and the financial statements to the Supervisory Board.
The Audit & Risk Committee specifically focused on the effectiveness of the audit, compliance and risk management functions within a.s.r. The Committee discussed and approved the annual plan for 2017 of the Compliance department and the Risk Management and Actuarial Functions. The Internal Audit Charter, the Compliance Charter and the charters for the Risk Management Function and the Actuarial Function were also adopted in 2016. The Committee also approved the audit plans for 2016 of both internal audit and the independent external auditor.
During the year, the Committee met on two occasions outside meetings with the Audit, Compliance and Risk Management Functions in their role of countervailing powers. The Chair of the Committee had a one-on-one meeting with each of the directors of Audit, Compliance and Group Risk Management and had three meetings with the External Auditor Ernst & Young.
The Solvency II regime came into effect on 1 January 2016. The outcomes of the SCR calculations and the ORSA were accordingly discussed by the Committee. The UFR effect within the Solvency II framework was highlighted in particular. At the end of the year, the Audit & Risk Committee also discussed the risk appetite for 2017, which is based on a detailed risk assessment. This year as well, the assessment started from the Solvency II regime for both a.s.r. and the supervised entities. The Committee periodically tested the status of the risk appetite during the year, using such tools as the Integrated Risk Dashboard and the status report on the management of risk priorities. The a.s.r. risk appetite is based on a prudent approach to risk management and translated into requirements for solvency, liquidity and returns; solvency takes priority over profit and profit takes priority over premium income. The risk appetite for 2017 was approved by the Supervisory Board. As part of the risk appetite, the Committee discussed the solvency targets for 2016.
The Committee was informed of the outlines of the reinsurance programme. The internal control structure (Management in Control 2.0) was also a regular item of discussion by the Committee. This structure allows the management of a.s.r. to verifiably manage the principal risks that pose a threat to achieving the company’s strategic targets.The multi-year budget 2017-2019, the investment plan and the risk priorities for 2017 were discussed at length at the end of the reporting year, after which the multi-year budget was adopted by the Supervisory Board.
Selection, Appointment & Remuneration CommitteeAs of the IPO, the Selection, Appointment & Remuneration Committee was split in the Selection & Appointment Committee and the Remuneration Committee. The members of both committees are Annet Aris (chair) and Kick van der Pol. The meetings are attended by the CEO (except when issues relating to the Executive Board are being discussed) and the Human Resources Director, who doubles as secretary for both committees.
a.s.r. 2016 solvency and financial condition report | B System of governance 28
System o
f Go
vernanceR
isk pro
fileV
aluation fo
r Solvency p
urpo
sesC
apital m
anagem
entB
usiness and p
erform
ance
Both committees solicit support and advice from departments such as Group Risk Management, Compliance, Audit and Human Resources. Where needed, it calls on the expertise of independent legal and pay and benefit experts.
The Committee met on five occasions in 2016.The first three meetings were still held in the former constellation. In accordance with policy, the Committee advised the Supervisory Board on target setting, performance appraisals and the ex-post assessments of the variable pay awarded to identified staff. The remuneration policy was updated in line with new rules and regulations. And the results of the audit plan on the application of our remuneration policy were discussed.
The Committee was informed about the outline of the new social plan in relation to the sustainable mobility of employees, and the results of the preference scan conducted among employees on labour and employment conditions were explained and discussed.
Two meetings were held in the new constellation. The Selection & Appointment Committee discussed the annual assessments of senior management. The nine-box grid was used to evaluate senior managers and to discuss their individual development and potential successors. The Selection & Appointment Committee was also informed about the use of the Denison scan, a new tool to measure the success of the organization.
The Remuneration Committee discussed the implementation of the remuneration policy for our subsidiaries. The Remuneration Committee instructed Korn Ferry on the outlines and reference groups for a benchmark of the remuneration for the Executive Board.
The Chair of the Committee gave an account of the issues discussed to the Supervisory Board and submitted written reports to the Supervisory Board in a timely manner. B.1.1.2 Corporate Governancea.s.r. is a public company with limited liability under Dutch Law. The company has a two-tier board system; with a Supervisory Board and an Executive Board. a.s.r. has been listed on Euronext Amsterdam since 10 June 2016. Prior to its listing, a.s.r. applied the ‘mitigated two-tier regime (gemitigeerd structuurregime). The full two-tier regime (volledige structuurregime) has applied to a.s.r. since the listing. The main consequence of application of the mandatory full two-tier regime lies in the authority to appoint and dismiss members of the Executive Board, which has now shifted from the General Meeting of Shareholders to the Supervisory Board.
In 2016, a.s.r. strengthened its corporate governance ahead of the initial public offering (IPO). The a.s.r. Articles of Association have been amended and the Supervisory Board Rules and Executive Board Rules have been updated. a.s.r. has also entered into a Relationship Agreement with NLFI, and has adopted the Policy on fair disclosure and bilateral dialogue with shareholders. Furthermore, a.s.r. has implemented a defence mechanism in the form of a preference shares foundation.
IPOIn the autumn of 2008, the Dutch State acquired the Dutch entities of the Fortis Group and spun off Fortis Verzekeringen Nederland N.V., which now operates as a.s.r. Although a.s.r. was acquired by the Dutch State as a result of the nationalization of the Fortis Group, a.s.r. never received state aid.
On September 2011, the Dutch State transferred all of the shares to NLFI in exchange for depositary receipts for those shares. NLFI is responsible for managing the shares and exercising all rights associated with these shares under Dutch Law, including voting rights. Since the date of nationalization, the Dutch Minister of Finance has indicated that the investment was intended to be temporary and that the Group was to be returned to the market as soon as reasonably possible. In November 2015, NLFI and the Dutch Minister of Finance concluded that all conditions for the privatization of the Group had been met. In the following parliamentary debate in January 2016, the Dutch Parliament agreed to the exit strategy proposed by the Dutch Minister of Finance based on the advice of NLFI, after which the Dutch Minister of Finance formally asked NLFI and a.s.r. to start the sale process through an IPO. On 13 May 2016, NLFI, acting on behalf of the Dutch State and a.s.r., confirmed its intention to proceed with the next step towards an IPO and the listing of the ordinary shares of the Group on Euronext Amsterdam. NLFI also announced that the offering could be launched during Q2 2016.On 30 May 2016 NLFI announced that the indicative price range for the offering was set at € 18 to € 22 per offer share and that the offering consisted of the sale by NLFI of up to 54.5 million offer shares, or 36.3% of the total number of shares. Eventually, the price was set at € 19.50 per offered share. a.s.r. became a listed company on Friday 10 June 2016.
a.s.r. 2016 solvency and financial condition report | B System of governance 29
System o
f Go
vernance
System o
f Go
vernance
Risk p
rofile
Risk p
rofile
Valuatio
n for So
lvency purp
oses
Valuatio
n for So
lvency purp
oses
Cap
ital manag
ement
Cap
ital manag
ement
Business and
perfo
rmance
Business and
perfo
rmance
NLFIThe Dutch State holds an interest in a.s.r. through NLFI. NLFI is responsible for managing these shares and exercising all rights associated with these shares, including voting rights. In view of NLFI’s position as the owner of a majority or a substantial part of the shares for a period of time after the IPO, certain arrangements have been agreed in a Relationship Agreement, which replaced an earlier memorandum of understanding between NLFI and a.s.r. The Relationship Agreement, except for a few specific clauses, will terminate if and when NLFI directly or indirectly holds less than 10% of the shares. The Relationship Agreement contains arrangements with respect to:• a.s.r.’s corporate governance;• Defence measures;• Dividend;• The orderly disposition of shares by NLFI after the IPO; and• The exchange of information.
The Relationship Agreement is published on asrnl.com.
Contact with shareholdersAs a general principle, the Group endorses the importance of fair disclosure and transparency towards analysts, investors, shareholders, the press and other parties. At the time of the IPO, in order to facilitate bilateral communications with shareholders, the Executive Board adopted, with the approval of the Supervisory Board, the Policy on fair disclosure and bilateral contact with shareholders. This policy sets out the conditions under which a.s.r. may disclose information and documents to individual analysts, investors, shareholders, or other parties, provided that a non-disclosure agreement has been signed. The policy does not apply to the contacts between a.s.r. and NLFI as that relationship is governed by the Relationship Agreement. The Policy on fair disclosure of information and bilateral dialogue with shareholders is published on asrnl.com.
Anti-takeover measuresa.s.r. and ASR Continuity Foundation (Stichting Continuïteit ASR Nederland) (the ‘Foundation’) have concluded an agreement under which the Foundation can acquire preference shares. This call option on preference shares is currently a measure that could be considered a potential protection of a.s.r. against acts that are, in the opinion of the Foundation, actually contrary to the interests of a.s.r., its business and its stakeholders. The Foundation is entitled to exercise the option on preference shares in such a way that the number of preference shares acquired under the call option will never exceed the total number of shares that form the issued capital of a.s.r. at the time of exercise of the call option, less the number of preference shares already held by the Foundation at that time (if any) and minus one. Among other things, in the event of exercise of the option on the preference shares by the Foundation, the Executive Board and the Supervisory Board will be given the opportunity to determine their position with respect to, for example, the announcement of a public offer for shares in the capital of a.s.r. or the legitimate expectation that such a public offer will be announced without agreement on the offer having been reached with a.s.r. or the offer being supported by a.s.r., or an activist a.s.r. shareholder (or group of activist a.s.r. shareholders acting in concert) directly or indirectly representing at least 25% of the ordinary shares forming part of the issued share capital of a.s.r. (in each case to the extent this is actually contrary to the aforementioned interests of a.s.r., its business and its stakeholders). The Boards will then be able to examine and implement alternatives. The Foundation has an independent board.
B.1.1.3 Supervisory BoardThe Supervisory Board supervises the policy pursued by the Executive Board and the general course of affairs at a.s.r. and its group entities, and advises the Executive Board. Specific powers are vested in the Supervisory Board, including the approval of certain decisions taken by the Executive Board.
CompositionAccording to a.s.r.’s articles of association, the Supervisory Board should consist of at least three members. The Supervisory Board currently consists of four members. The Supervisory Board has drawn up a profile for its size and composition, taking into account the nature of a.s.r.’s business, its activities and the desired expertise and background of its members. The full profile of the Supervisory Board is available on asrnl.com, as Annex A of the Rules of procedure: Supervisory Board of ASR Nederland N.V.
The composition of the Supervisory Board is such that each supervisory director has the skills to assess the main aspects of the overall policy and that the Supervisory Board as a whole meets the profile thanks to a combination of the experience, expertise and independence of the individual supervisory directors. The Supervisory Board is diverse in terms of gender and professional background of its members. The diversity of its members ensures the complementary profile of the Supervisory Board.
a.s.r. 2016 solvency and financial condition report | B System of governance 30
System o
f Go
vernanceR
isk pro
fileV
aluation fo
r Solvency p
urpo
sesC
apital m
anagem
entB
usiness and p
erform
ance
After the departure of Margot Scheltema in September 2015, Herman Hintzen was appointed as a supervisory director on 1 January 2016. Herman Hintzen has a background in the financial services sector. There were no further changes to the composition of the Supervisory Board in 2016.
The composition of the Supervisory Board of ASR Levensverzekering N.V. and ASR Schadeverzekering N.V. is the same as that of ASR Nederland N.V., Europeesche Verzekering Maatschappij N.V. and N.V. Amersfoortse Algemene Verzekering Maatschappij were merged into ASR Schadeverzekering N.V. in 2016. De Eendragt Pensioenen N.V. and AXENT NabestaandenZorg N.V. were merged into ASR Levensverzekering N.V. in 2016.
Education and evaluation The Supervisory Board performs a self-assessment annually. A self-assessment with external guidance is carried out every three years. The self-assessment for 2016 was internal. The assessment was based on written input from the Supervisory Board and the Executive Board and an oral elaboration by all members of the Supervisory Board and the Chief Executive Officer (CEO). The following aspects were assessed:• Composition of the Supervisory Board:
strengths and weaknesses;• Effectiveness of the Supervisory Board processes:
information-gathering, decision-making and focus on core themes;• Advisory role to the Executive Board on important subjects;• Role of employer: strengths and weaknesses.
The overall impression that emerged from this self-assessment was positive. In 2017 the self-assessment will be performed with external guidance.
Two Continuing Education (CE) sessions were organized for the members of the Supervisory Board in 2016. The first session for the Supervisory Board and Executive Board was about the risks and changes of global warming for the Insurance Industry. During the other session the Supervisory Board, Executive Board and senior managers were educated and updated with respect to the impact of exponential technology on the business management and strategy of a.s.r.
Independence and conflicts of interestIn 2009, Cor van den Bos announced that his role as Chairman of the Supervisory Board of CED might cause a conflict of interest if CED-related issues were to be discussed by the Supervisory Board. For this reason, no information relating to the intended sale of SOS International was shared with him and the matter was discussed in his absence. On 26 January 2016 a.s.r. announced that it had sold SOS International to CED.
There were no reports of potential conflicts of interest by the other supervisory directors. The Supervisory Board has been able to exercise its tasks completely independently.
a.s.r. 2016 solvency and financial condition report | B System of governance 31
System o
f Go
vernance
System o
f Go
vernance
Risk p
rofile
Risk p
rofile
Valuatio
n for So
lvency purp
oses
Valuatio
n for So
lvency purp
oses
Cap
ital manag
ement
Cap
ital manag
ement
Business and
perfo
rmance
Business and
perfo
rmance
CV's of the Supervisory Board
a.s.r.’s registered address, Archimedeslaan 10, 3584 BA Utrecht, the Netherlands, serves as the business address for all the members of the Supervisory Board.
C. (Kick) van der PolChair of the Supervisory BoardMember of the Selection & Appointment Committee and the Remuneration Committee Kick van der Pol (1949) is a Dutch national and serves as Chairman of the Board of Directors of Ortec Finance and Chairman of the Board of the Federation of Dutch Pension Funds. He is also a member of the DNB’s Bank Council and a member of the Supervisory Board of the Holding Nationale Goede Doelen Loterijen N.V. In the past, Kick van der Pol served as Vice-Chairman of the Executive Board of Eureko/Achmea and as Chairman of the Executive Board of Interpolis.
First appointed on: 15 December 2008Current term of office: 2014 – 2018
A.P. (Annet) ArisChair of the Selection & Appointment Committee and the Remuneration CommitteeMember of the Audit & Risk Committee
Annet Aris (1958) is a Dutch national and had a 17-year career at McKinsey as a management consultant, including nine years as a partner in the firm. She holds supervisory directorships at several Dutch and foreign enterprises and institutions, including ASML N.V. in the Netherlands, ProSiebenSat1 AG and Jungheinrich AG in Germany and Thomas Cook PLC in London. Annet Aris is adjunct professor of digital strategy at INSEAD international business school (Fontainebleau, France). Annet Aris is a Supervisory Board member appointed by the Works Council.
First appointed on: 7 December 2010Current term of office: 2014 – 2018
a.s.r. 2016 solvency and financial condition report | B System of governance 32
System o
f Go
vernanceR
isk pro
fileV
aluation fo
r Solvency p
urpo
sesC
apital m
anagem
entB
usiness and p
erform
ance
C. (Kick) van der Pol
C.H. (Cor) van den BosVice-Chair of the Supervisory BoardChair of the Audit & Risk Committee
Cor van den Bos (1952) is a Dutch national and served on the Executive Board of SNS REAAL N.V. until August 2008, where he was responsible for all insurance operations. Cor van den Bos is the Chair of the Supervisory Board of CED, a claims-processing manager, and of Noordwijkse Woningstichting, a housing corporation. He is also Vice-Chairman and a Non-Executive Member of the Board at the investment firm Kardan N.V.
First appointed on: 15 December 2008Current term of office: 2015 – 2019
H.C. (Herman) HintzenMember of the Audit & Risk Committee
Herman Hintzen (1955) is a Dutch national. Until January 2016, he was Chairman Insurance EMEA at UBS Investment Bank. He currently serves as Chairman of the Board of Amlin International SE and as a member of the Investment Committee of Concertgebouw Fonds. In the past, Herman Hintzen also acted as an adviser to the Executive Board at APG Asset Management and served as Managing Director in the Financial Institutions investment banking groups of Morgan Stanley, Credit Suisse and JP Morgan.
First appointed on: 1 January 2016Current term of office: 2016 – 2020
a.s.r. 2016 solvency and financial condition report | B System of governance 33
System o
f Go
vernance
System o
f Go
vernance
Risk p
rofile
Risk p
rofile
Valuatio
n for So
lvency purp
oses
Valuatio
n for So
lvency purp
oses
Cap
ital manag
ement
Cap
ital manag
ement
Business and
perfo
rmance
Business and
perfo
rmance
B.1.1.4 Executive BoardThe Executive Board is responsible for the day-to-day conduct of business a.s.r. as a whole and for strategy, structure and performance. In performing its duties, the Executive Board is guided by a.s.r.’s interests, which include the interests of the businesses connected with a.s.r., which, in turn, includes the interests of customers, insurers, shareholders, employees and society in general. The Executive Board is accountable for the performance of its duties to the Supervisory Board and to the General Meeting.
CompositionThe Executive Board consists of a minimum of two members, including at least a CEO and CFO. The Supervisory Board appoints the Executive Board members and may suspend or dismiss any member of the Executive Board at any time. The Supervisory Board notifies the General Meeting of a proposed appointment. In accordance with the Relationship Agreement, the Supervisory Board shall give NLFI an opportunity to advise on the decision to appoint or reappoint any member of the Executive Board, as long as NLFI directly or indirectly holds 10% or more of a.s.r.’s issued share capital. Only candidates found to meet the fit and proper test under the Dutch Financial Supervision Act are eligible for appointment. There were no changes in the composition of the Executive Board in 2016.
Education and evaluationThe members of the Executive Board took individual courses in 2016 as part of their continuing education (CE). In addition, much attention was devoted to knowledge-building in the areas of investment and asset management, and to potentially interesting developments, including the impact of the low level of interest rates and hedging policy.
There was also a session together with the Supervisory Board about the risks and challenges of global warming for the insurance industry.
The Executive Board evaluated its own performance regularly in 2016 by holding what are known as Executive Board team conduct evaluation sessions. Furthermore, a two-day off-site event was held in August under the guidance of an external agency which served to discuss different roles and forces for the purpose of harnessing the diversity in the team and making the most of the collaboration between the members.
In addition to the self-evaluation, the performance of the members of the Executive Board was also assessed by the Supervisory Board within the scope of the annual assessment round.
Structure The managing and supervisory bodies of the supervised entities of a.s.r. met at least four times in 2016. The supervised entities are ASR Levensverzekering N.V., ASR Schadeverzekering N.V., N.V. Amersfoortse Algemene Verzekering Maatschappij, Europeesche Verzekering Maatschappij N.V., ASR Basis Ziektekostenverzekeringen N.V., ASR Aanvullende Ziektekostenverzekeringen N.V., De Eendragt Pensioen N.V., AXENT NabestaandenZorg N.V. and ASR Bank N.V. The standing agenda items included the financial (quarterly) results and the compliance, risk and audit reports. Other topics of discussion were entity-specific issues, including the impact of the changing markets for various entities.
The managing and supervisory directors of ASR Levensverzekering N.V., ASR Schadeverzekering N.V., N.V. Amersfoortse Algemene Verzekering Maatschappij, Europeesche Verzekering Maatschappij N.V., De Eendragt Pensioen N.V. and AXENT NabestaandenZorg N.V. are the same as those of ASR Nederland N.V. This is not the case where the other three entities are concerned (ASR Basis Ziektekostenverzekeringen N.V, ASR Aanvullende Ziektekostenverzekeringen N.V. and ASR Bank N.V.).
In October 2016, Europeesche Verzekering Maatschappij N.V. and N.V. Amersfoortse Algemene Verzekering Maatschappij were merged into ASR Schadeverzekering N.V. De Eendragt Pensioenen N.V. was merged into ASR Levensverzekering N.V. in July 2016 and AXENT NabestaandenZorg N.V. were merged into ASR Levensverzekering N.V. in October 2016. As a result of these mergers and integrations, the number of legal entities (OTSOs) has decreased.
a.s.r. 2016 solvency and financial condition report | B System of governance 34
System o
f Go
vernanceR
isk pro
fileV
aluation fo
r Solvency p
urpo
sesC
apital m
anagem
entB
usiness and p
erform
ance
CV’s of the Executive Boarda.s.r.’s registered address, Archimedeslaan 10, 3584 BA Utrecht, the Netherlands, serves as the business address for all the members of the Executive Board.
J.P.M. (Jos) Baeten (CEO)Jos Baeten (1958) is a Dutch national and is the Chair of the Executive Board and Chief Executive Officer (CEO). His areas of responsibility are Human Resources, Corporate Communications, Strategy, Corporate Social Responsibility, Audit, Integrity and Legal.
Jos Baeten studied law at Erasmus University Rotterdam and started his career in 1980 when he joined Stad Rotterdam Verzekeringen N.V., one of a.s.r.’s main predecessors. He joined the Executive Board of Stad Rotterdam Verzekeringen N.V. in 1997 and was appointed CEO of this company in 1999. He then joined the Management Board of Fortis ASR Verzekeringsgroep N.V., becoming Chairman of the Board of De Amersfoortse Verzekeringen N.V. in June 2003. In 2005, Jos Baeten was appointed Chairman of the Board of Directors of Fortis ASR Verzekeringsgroep N.V.
Jos Baeten was appointed as CEO of a.s.r. on 26 January 2009.Current term of office: 2017 – 2021
Additional positionsCurrently, Jos Baeten is a member of the Executive Board of the Dutch Association of Insurers (Verbond van Verzekeraars) and Chairman of the Supervisory Board of Stichting Theater Rotterdam. In addition, he is also member of the General Administrative Board of VNO-NCW.
H.C. (Chris) Figee (CFO)Chris Figee (1972) is a Dutch national and serves as CFO. His areas of responsibility are Group Accounting, Reporting & Control, Business Finance & Risk, Group Asset Management/Financial Markets, Real Estate Investment Management, a.s.r. Real Estate Projects (as of 1 March 2017), Group Balance Sheet Management and Group Risk Management.
Chris Figee earned a degree (with honours) in Financial Economics from the University of Groningen and is an EFFAS Certified Investment Analyst. He also studied Risk Management at Stanford University. Chris Figee started his career at Aegon, where he held various positions, including that of Senior Portfolio Manager. In 1999 he moved to McKinsey, where he rose to the role of partner in 2006. After ten years at McKinsey, he joined Achmea as Director of Group Strategy & Performance Management in 2009. He also served as a member of the Achmea Group Committee. Chris Figee’s last position at Achmea was Director of Group Finance.
Chris Figee was appointed as a member of the Executive Board on 1 May 2014.Current term of office: 2014 – 2018
Additional positionsChris Figee does not hold any additional positions at this time.
a.s.r. 2016 solvency and financial condition report | B System of governance 35
System o
f Go
vernance
System o
f Go
vernance
Risk p
rofile
Risk p
rofile
Valuatio
n for So
lvency purp
oses
Valuatio
n for So
lvency purp
oses
Cap
ital manag
ement
Cap
ital manag
ement
Business and
perfo
rmance
Business and
perfo
rmance
K.T.V. (Karin) BergsteinKarin Bergstein (1967) is a Dutch national. Her areas of responsibility as of 1 March 2017 are Innovation and Digitalization, Information Technology and Change, and the product lines Pensions, Individual life, Banking and Funeral.
Karin Bergstein studied medical biology at Utrecht University (Masters in 1991) and in 1998 earned an MBA from Nyenrode University and the University of Rochester in the United States. She started her career in 1991 at ING Bank, where she held various positions until 2010. Her last position was that of Director of Products & Processes, which gained her a seat on the Executive Board of ING Bank Nederland. Prior to that she served as CEO of ING Car Lease International from 2003 until 2009.
Karin Bergstein was appointed as a member of the Executive Board of a.s.r. on 1 September 2011.Current term of office: 2015 – 2019
Additional positionsKarin Bergstein is a member of the Supervisory Board of Stichting Sanquin Bloedvoorziening and of the Supervisory Board of Utrecht University. She also serves as a member of the Supervisory Board of Human Total Care.
M.H. (Michel) VerwoestMichel Verwoest (1968) is a Dutch national. His areas of responsibility as of 1 March 2017 are the product lines P&C, Occupational Disability Insurance, Health Insurance, Services and the a.s.r.’s distribution companies.
Michel Verwoest studied marketing at TiasNimbas Business School in Tilburg and business administration at IBO Business School, and held several executive positions at ING Group between 1997 and 2012. At ING, he served as CEO of RVS Insurance and was in charge of the Individual Life business. His last position in the insurance business of ING Group was a managing board member of Nationale Nederlanden Services.
Michel Verwoest was appointed to the Executive Board of a.s.r. on 1 December 2012.Current term of office: 2016 – 2020
Additional positionsMichel Verwoest does not hold any additional positions at this time.

a.s.r. 2016 solvency and financial condition report | B System of governance 36
System o
f Go
vernanceR
isk pro
fileV
aluation fo
r Solvency p
urpo
sesC
apital m
anagem
entB
usiness and p
erform
ance
B.1.1.5 Corporate Governance Codes and regulations
Articles of Association and rules of procedureThe current Articles of Association (dated 9 June 2016) have been posted on a.s.r.’s corporate website: asrnl.com. The Supervisory Board Rules and the Executive Board Rules are also posted on a.s.r.’s corporate website.
Dutch Corporate Governance CodeAs of the listing on Euronext Amsterdam, a.s.r. is required to adhere to the Dutch Corporate Governance Code. a.s.r. complies with all relevant principles and best practices of the Dutch Corporate Governance Code, apart from the deviations and nuances described below. Additionally, in the Corporate Governance section of its website a.s.r. publishes a detailed comply or explain list that also specifies which principles or best practices are not applicable to a.s.r.
a.s.r. applies principle II.3, best practice provisions II.3.2 – II.3.4, principle III.6 and best practice provisions III.6.1 – III.6.3, which deal with actual and apparent conflicts of interest. However, a.s.r. makes an exception with respect to conflicts of interest that are exclusively the result of the identical composition of the Executive Boards and Supervisory Boards of a.s.r. and some of its subsidiaries. In this case, the Group’s policy on conflicts of interest applies. Principle III.8 and best practice provisions III.8.1 – III.8.4 do not apply because a.s.r. has a two-tier board. Due to his previous work for UBS, principle III.2.2 applies to Herman Hintzen, therefore he is not an independent Supervisory Board member in 2016.
Since a.s.r. has not issued any depositary receipts, principle IV.2 and best practice provisions IV.2.1 – IV2.8 do not apply. However, in order to create a defence against a hostile takeover, a.s.r. has established the Stichting Continuïteit ASR Nederland. This Foundation may prevent, discourage or delay a change of control by acquiring and holding preferred shares. For as long as NLFI holds more than one-third of the shares in a.s.r., the Foundation requires the prior consent of NLFI to do so.
a.s.r. applies principle IV.3, which deals with equal and simultaneous provision of information to shareholders, on the understanding however that a.s.r. will observe the Relationship Agreement with NLFI. In this respect, reference is made to the policy on fair disclosure and bilateral dialogue and the Relationship Agreement which can be found on asrnl.com.
Dutch Banking CodeBanks authorized to operate in the Netherlands are been subject to the Dutch Banking Code (latest version 1 January 2015). This Code, which was drafted by the Dutch Banking Association, contains principles for governance and governance oversight, risk management, audit and remuneration policy. ASR Bank N.V. is governed by this Code. Details on how ASR Bank N.V. meets the Dutch Banking Code can be found in its Annual Report that is available online at asrnl.com.
Professional oathOn 1 January 2013, the Dutch financial sector introduced a mandatory oath for Executive and Supervisory Board members of financial institutions licensed in the Netherlands. The Executive Board and Supervisory Board members of all financial undertakings that are licensed in the Netherlands must take this mandatory oath. In this oath, board members declare that they will: (a) perform their duties with integrity and care, (b) carefully consider all the interests involved in the financial institution, i.e. those of the customers, the shareholders, the employees and the society in which it operates, (c) in doing so, give paramount importance to customers’ interests and inform customers’ to the best of their ability, (d) comply with the laws, regulations and codes of conduct applicable to them, (e) observe confidentiality in respect of matters entrusted to them, (f) not abuse their knowledge, (g) act in an open and assessable manner and be aware of their responsibility towards society, and (h) endeavour to maintain and promote confidence in the financial sector. If the oath is broken, the supervisory authority (DNB/AFM) can decide to reassess their suitability.
With respect to insurance companies, apart from the Executive and Supervisory Board members, persons with a management position directly below the Executive Board who are responsible for persons that may have a significant influence on the risk profile of the insurance company, are also required to take the oath, as are certain other employees. This includes persons that may (independently) significantly influence the risk profile of the undertaking as well as those persons that are or may be involved in the provision of financial services.
For based banks in the Netherlands, such as ASR Bank N.V., all persons working under the responsibility of the bank need to take a similar bankers’ oath with effect from 2015. In addition, persons having taken the bankers’ oath are thereby subject to disciplinary rules.
a.s.r. 2016 solvency and financial condition report | B System of governance 37
System o
f Go
vernance
System o
f Go
vernance
Risk p
rofile
Risk p
rofile
Valuatio
n for So
lvency purp
oses
Valuatio
n for So
lvency purp
oses
Cap
ital manag
ement
Cap
ital manag
ement
Business and
perfo
rmance
Business and
perfo
rmance
Regardless of the above, a.s.r. has decided that employees and other persons performing activities under its responsibility must take the oath.All employees had taken the oath before 1 April 2016. New employees take the oath within three months of joining the company.
B.1.2 Remuneration reportImproving and maintaining the integrity and robustness of a.s.r. is key to the remuneration policy, and the focus is squarely on the long-term interests of all our stakeholders. The aim of the remuneration policy is to motivate employees to work for the interests of customers and other stakeholders within the parameters of the duty of care. The remuneration policy is based on the following principles.
The principles followed for drafting, adopting, applying and enforcing the Group Remuneration Policy are described below.1. HR policy:a. The remuneration policy strikes a balance between trust in intrinsic motivation on the one hand and agreement on
clear targets and assessment of performance on those targets on the other;b. The total pay-and-benefits package enables the company to compete in the labour market and to attract and retain
competent people.
2. Sound remuneration policy:a. The remuneration policy, including the pension policy, ties in with the corporate strategy and with the company’s
objectives, values and long-term interests. Any changes in strategy, objectives, values and long-term interests are taken into account when updating the remuneration policy;
b. The remuneration policy is ethical, sound and sustainable, in line with the company’s risk appetite, risk management strategy and risk profile, contributes to robust and effective risk management, and does not encourage a greater risk appetite than is acceptable to the business;
c. The remuneration policy has been designed in such a way that allowance is made for the internal workings of the company, its subsidiaries and group companies, and for the nature, scale and complexity of the risks attached to the business;
d. The remuneration policy does not restrict the company’s scope to maintain and strengthen its robust regulatory capital, solvency margin or own funds.
3. Protection of customers and safeguarding integrity and long-term enterprise value:a. The remuneration policy encourages employees to act in accordance with the company’s long-term interests;b. The remuneration policy has been designed in such a way that consumers, clients or members are treated with due
care;c. Performances delivered by employees and by the company itself are measured on the basis of both financial and non-
financial indicators;d. The remuneration policy does not encourage employees to take excessive risks;e. The remuneration policy seeks to prevent conflicts of interest;f. The company does not apply constructions or methods that facilitate the evasion of the remuneration policy or the
relevant legislation and regulations;g. Employees are expected not to make use of personal hedging strategies or of any insurance policies linked to
remuneration and liability to undermine the risk management effects embedded in their remuneration schemes.
4. Transparency:a. The design, governance and methodology of the remuneration policy are clear, transparent and applicable to all
employees.
5. Compliance: a. The remuneration policy complies with prevailing national and international legislation and regulations (see also
Section 1.4). It is evaluated periodically and modified, if necessary, to ensure compliance with new legislation and regulations or market standards;
b. The compliance of the remuneration policy and the related procedures with the relevant rules and regulations is checked at least once a year by a centralized and independent internal body.
Governance• The Annual General Meeting (AGM) has decision-making powers relating to the remuneration policy of the Executive
Board and the individual remuneration of the supervisory directors. In addition, the Supervisory Board informs the AGM of the individual remuneration of the executive directors;
a.s.r. 2016 solvency and financial condition report | B System of governance 38
System o
f Go
vernanceR
isk pro
fileV
aluation fo
r Solvency p
urpo
sesC
apital m
anagem
entB
usiness and p
erform
ance
• The Supervisory Board has decision-making powers relating to setting the individual remuneration of the members of the Executive Board. In addition, the Supervisory Board has responsibilities regarding, the remuneration policy for all groups of employees and monitors same. The Supervisory Board also approves the remuneration policy and its underlying principles before they are adopted and the selection of identified staff;
• The Supervisory Board has an Audit & Risk Committee (ARC Committee) and as of the moment of the IPO the Selection, Appointment & Remuneration Committee was split in the Selection & Appointment Committee and the Remuneration Committee. These committees are composed of members of the Supervisory Board. The full Supervisory Board remains responsible for any decisions taken, even if they have been prepared by a committee. The duties, composition, expertise, independence and organization of the committees of the Supervisory Board are described in further detail in their rules of procedure, which are included in two appendices to the Rules of Procedure of the Supervisory Board;
• The Remuneration Committee provides the Supervisory Board with support and advice in relation to its duties and responsibilities regarding remuneration policy and remuneration practices. Decisions taken by the Supervisory Board in this area are prepared by the Remuneration Committee;
• Without prejudice to the duties of the Remuneration Committee, the ARC Committee examines whether the incentives created by the remuneration system take account of risk, capital, liquidity and the probability and staggering of profit forecasts, for the purpose of supporting the introduction of sound remuneration policy and practices. The ARC Committee also provides input for the selection of identified staff;
• The Executive Board has decision-making powers and responsibilities relating to the remuneration policy in respect of all employees, with the exception of the Executive Board itself and the Supervisory Board. The Executive Board also decides on the individual remuneration of senior managers (SMs, job levels 22-23);
• Control functions (also known as key functions) are departments that are responsible for the control and supervision of operations as well as the risks arising from those operations, and in doing so operate independently from the rest of the organization. They advise and support the Executive Board and Supervisory Board, and report directly to the Executive Board and Supervisory Board on compliance with applicable legislation and regulations and internal codes. Employees in control functions are defined as senior and/or managerial employees working in the compliance, audit, risk management and actuarial functions. The compliance, audit and risk management functions also play an active role in the context of the remuneration policies and practices relating to other groups of employees;
• The human resources function is very closely involved with the implementation of the remuneration policy. It also coordinates the preparation and evaluation of the remuneration policy and suggests what the policy should look like. In keeping with the control functions, the human resources function provides input for the ex-ante and ex-post risk adjustments of variable remuneration;
• The control functions and the human resources function collaborate actively on a regular basis. They share information and provide input for each other’s activities in the area of the remuneration policy.
Remuneration groupsExcept where stated otherwise, the regulations contained in the remuneration policy apply to all employees who work under the responsibility of the Group.The specific groups mentioned are:• Identified staff;• Employees in control functions (key functions);• Policymakers;• Senior managers subject to the Dutch Financial Undertakings (Remuneration) Act (Wbfo);• Executive directors and supervisory directors;• Senior and higher management.
Key features of the remuneration systemUntil 1 July 2014, the income of senior management, higher management and the CBA population (back-office and front-office) consisted of a fixed and a variable component. The Executive Board has received no variable remuneration since financial year 2011 based on Sections 1:128 and 1:129 of the Dutch Financial Supervision Act (Wft) and the corresponding transitional provisions. Following the collective bargaining negotiations with the trade unions, the variable remuneration for the CBA population was converted as of 1 July 2014 into a salary increase and a fixed supplement. The conversion was also implemented pro rata for a.s.r. as a whole, including higher and senior management. From 1 July 2014 onwards, the income of all salary groups including identified staff has consisted only of a fixed salary, with the exception of 115 front-office staff. This group has a fixed pay component and a target-related pay award of up to 20%.
Executive BoardThe pay awarded to the members of the Executive Board comprises a fixed amount per month, including holiday allowance. The pay is indexed in accordance with the CBA for the insurance industry.

a.s.r. 2016 solvency and financial condition report | B System of governance 39
System o
f Go
vernance
System o
f Go
vernance
Risk p
rofile
Risk p
rofile
Valuatio
n for So
lvency purp
oses
Valuatio
n for So
lvency purp
oses
Cap
ital manag
ement
Cap
ital manag
ement
Business and
perfo
rmance
Business and
perfo
rmance
Other employeesThe fixed pay awarded to employees consists of a fixed gross monthly salary, a fixed allowance (as a result of the conversion of variable pay for those employed at a.s.r. on 1 July 2014), 8% holiday allowance and a year-end bonus. The level of fixed pay depends on the weight attributed to an employee’s role, the related salary group and the employee’s general performance rating (assessment of deliverables and agreements on appropriate conduct). Fixed pay is adjusted for structural wage developments in accordance with the CBA for back-office positions in the insurance industry. The objectives pursued as part of how employees perform their duties are extrapolated from a.s.r.’s strategic targets. a.s.r.’s strategy is based on helping by taking action. This is reflected in KPIs relating to such issues as a customer dashboard, the Customer-Oriented Insurance Quality Mark and the Net Promoter Score. These KPIs form the basis of inspiring individual targets.
Identified staffVariable remuneration awarded to identified staff before 1 July 2014 will be paid in instalments over the next few years. Identified staff are conditionally awarded a material share (i.e. 50%) of their variable pay in the form of cash and non-cash instruments. The conditional variable pay is deferred for three years; a reappraisal is performed at the end of the three-year period, after which the cash component is paid out. The non-cash component is subject to an additional retention period of two years. Some of the unconditional variable pay is paid out in cash immediately. The non-cash component of the unconditional variable pay is also retained for two years.This group is also subject to a claw-back mechanism, a fairness clause and a penalty scheme, meaning that the Supervisory Board can claw back any variable pay already awarded if it was determined and awarded based on incorrect information.
In addition, the Supervisory Board has the right to adjust the level of the conditional variable pay if leaving the payment unchanged would go against the principles of reasonableness and fairness.
At a.s.r., the following specific variable remuneration schemes may apply to groups of employees:• Target-related remuneration for front-office positions: employees may be entitled to variable remuneration under the
CBA job classification and pay structure for front-office positions at a.s.r.;• Variable remuneration at ASR Vastgoed Vermogensbeheer B.V. and ASR Vastgoed Ontwikkeling N.V.: As a transitional
measure, a variable remuneration scheme applies to a small group of employees working at ASR Vastgoed Vermogensbeheer B.V. and ASR Vastgoed Ontwikkeling N.V. who are not identified staff;
• Incidental bonuses: A variable remuneration scheme in which a small amount of remuneration is linked to specific performance that goes beyond their job description applies to employees who come within the scope of the ASR Remuneration Policy but are not identified staff.
Retention bonusesPrior written permission from DNB for retention bonuses exceeding the bonus cap of 20% may only be requested by a.s.r.’s HR department after it has obtained the prior consent of the Remuneration Committee.
Guaranteed variable remuneration, welcome bonuses and buy-outsa.s.r. does not award guaranteed variable remuneration except within the legal bounds and only if prior permission has been obtained from the HR Director.
In accordance with the Group Remuneration Policy, a.s.r. applies the ex-ante and ex-post risk adjustment to variable remuneration.• Ex-ante risk adjustment
The human resources function (HR Director) applies the ex-ante risk adjustment, based on input received from the control functions;
• PenaltyFollowing a proposal from the Remuneration Committee and based on input from the human resources function and the control functions, the Supervisory Board decides whether the penalty is to be applied;
• Claw-backFollowing a proposal from the Remuneration Committee and based on input from the human resources function and the control functions, the Supervisory Board decides whether the claw-back clause is to be applied.
Severance payNo severance pay, either fixed or variable, may be awarded to an employee in the following cases:• In the event that the employment relationship is terminated early at the employee’s own initiative, except where this is
due to serious culpable conduct or neglect on the part of the company;• In the event of serious culpable conduct or neglect in the performance of his or her role by the employee.

a.s.r. 2016 solvency and financial condition report | B System of governance 40
System o
f Go
vernanceR
isk pro
fileV
aluation fo
r Solvency p
urpo
sesC
apital m
anagem
entB
usiness and p
erform
ance
Additionally, the following conditions apply with respect to severance pay for policymakers.• The maximum severance pay is 100% of the fixed annual remuneration;• No severance pay is awarded in the event of the company’s failure;• No severance pay that can be classified as variable is awarded to policymakers of a.s.r. or banks and insurers that are
part of the Group; • No fixed severance pay may be awarded to this group of employees unless this severance pay was agreed before 7
February 2015 (or before 20 June 2012 in the case of members of the a.s.r. Executive Board) or is agreed when the employee in question commenced his or her activities as a policy-maker after 7 February 2015.
No employee may receive total variable remuneration that exceeds 20% of his or her total fixed annual remuneration. This ratio is also referred to as the ‘20% bonus cap’.
PensionThe principal features of the pension scheme were as follows in 2016:• Average-pay pension plan;• Retirement age: 67 years;• Accrual rate for old-age pension: 1.875% for all salary groups;• Pensionable salary: fixed annual salary on 1 January of any year (capped at € 101,519 gross, this is offset by a
contribution for the accrual of a net pay pension);• Partner’s pension: 70% of projected old-age pension;• Orphan’s pension: 14% of projected old-age pension;• Employee contribution: 6% of pensionable earnings;• Flexible elements: early retirement, deferred retirement, exchange, high/low, part-time;• a.s.r. does not allow for the award of discretionary pensions.
Pre-pension allowanceAs a result of statutory pre-pension regulations, a.s.r. removed all pre-pension elements from its pension plans in 2006. Employees who joined a.s.r. before 1 January 2006 were initially compensated for this removal through optimization of their accrual rate and the state pension offset. Where such compensation was inadequate, the employees were awarded a pre-pension allowance, the amount of which varied based on their age and the original pension commitment. The pre-pension allowance for employees who joined a.s.r. after 1 January 2006 was 1% of their pensionable salary.As a result of the change to the pension plan agreed with the Works Council, an additional pre-pension allowance was introduced with effect from 1 January 2015 for employees who had a pension accrual rate of 2.25% at year-end 2013. The supplementary pre-pension allowance has been set at 2.25%.
The allowance is paid until the end date of the (regular) pre-pension allowance, subject to a maximum of five years.
Once every three years, an independent consultancy is hired to perform a market comparison (remuneration benchmark).
For the complete a.s.r. remuneration policy please see: asrnl.com.
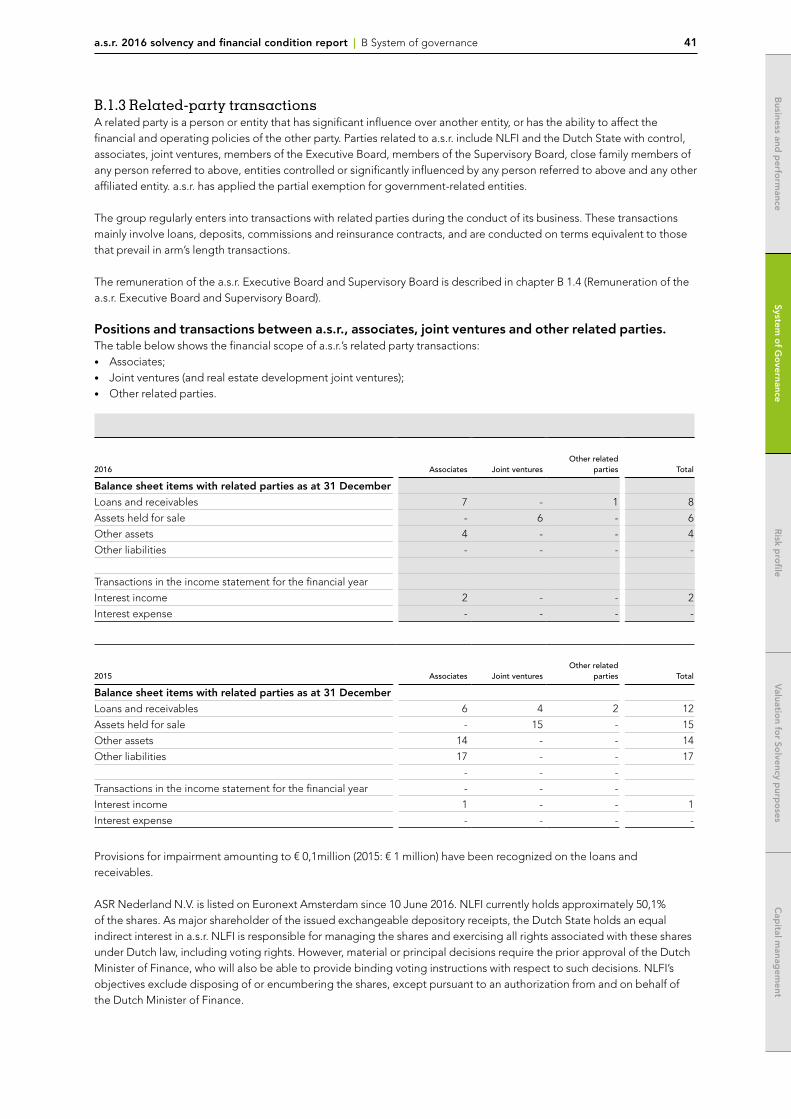
a.s.r. 2016 solvency and financial condition report | B System of governance 41
System o
f Go
vernance
System o
f Go
vernance
Risk p
rofile
Risk p
rofile
Valuatio
n for So
lvency purp
oses
Valuatio
n for So
lvency purp
oses
Cap
ital manag
ement
Cap
ital manag
ement
Business and
perfo
rmance
Business and
perfo
rmance
B.1.3 Related-party transactionsA related party is a person or entity that has significant influence over another entity, or has the ability to affect the financial and operating policies of the other party. Parties related to a.s.r. include NLFI and the Dutch State with control, associates, joint ventures, members of the Executive Board, members of the Supervisory Board, close family members of any person referred to above, entities controlled or significantly influenced by any person referred to above and any other affiliated entity. a.s.r. has applied the partial exemption for government-related entities.
The group regularly enters into transactions with related parties during the conduct of its business. These transactions mainly involve loans, deposits, commissions and reinsurance contracts, and are conducted on terms equivalent to those that prevail in arm’s length transactions.
The remuneration of the a.s.r. Executive Board and Supervisory Board is described in chapter B 1.4 (Remuneration of the a.s.r. Executive Board and Supervisory Board).
Positions and transactions between a.s.r., associates, joint ventures and other related parties.The table below shows the financial scope of a.s.r.’s related party transactions:• Associates;• Joint ventures (and real estate development joint ventures);• Other related parties.
2016 Associates Joint venturesOther related
parties Total
Balance sheet items with related parties as at 31 December
Loans and receivables 7 - 1 8
Assets held for sale - 6 - 6
Other assets 4 - - 4
Other liabilities - - - -
Transactions in the income statement for the financial year
Interest income 2 - - 2
Interest expense - - - -
2015 Associates Joint venturesOther related
parties Total
Balance sheet items with related parties as at 31 December
Loans and receivables 6 4 2 12
Assets held for sale - 15 - 15
Other assets 14 - - 14
Other liabilities 17 - - 17
- - -
Transactions in the income statement for the financial year - - -
Interest income 1 - - 1
Interest expense - - - -
Provisions for impairment amounting to € 0,1million (2015: € 1 million) have been recognized on the loans and receivables.
ASR Nederland N.V. is listed on Euronext Amsterdam since 10 June 2016. NLFI currently holds approximately 50,1% of the shares. As major shareholder of the issued exchangeable depository receipts, the Dutch State holds an equal indirect interest in a.s.r. NLFI is responsible for managing the shares and exercising all rights associated with these shares under Dutch law, including voting rights. However, material or principal decisions require the prior approval of the Dutch Minister of Finance, who will also be able to provide binding voting instructions with respect to such decisions. NLFI’s objectives exclude disposing of or encumbering the shares, except pursuant to an authorization from and on behalf of the Dutch Minister of Finance.
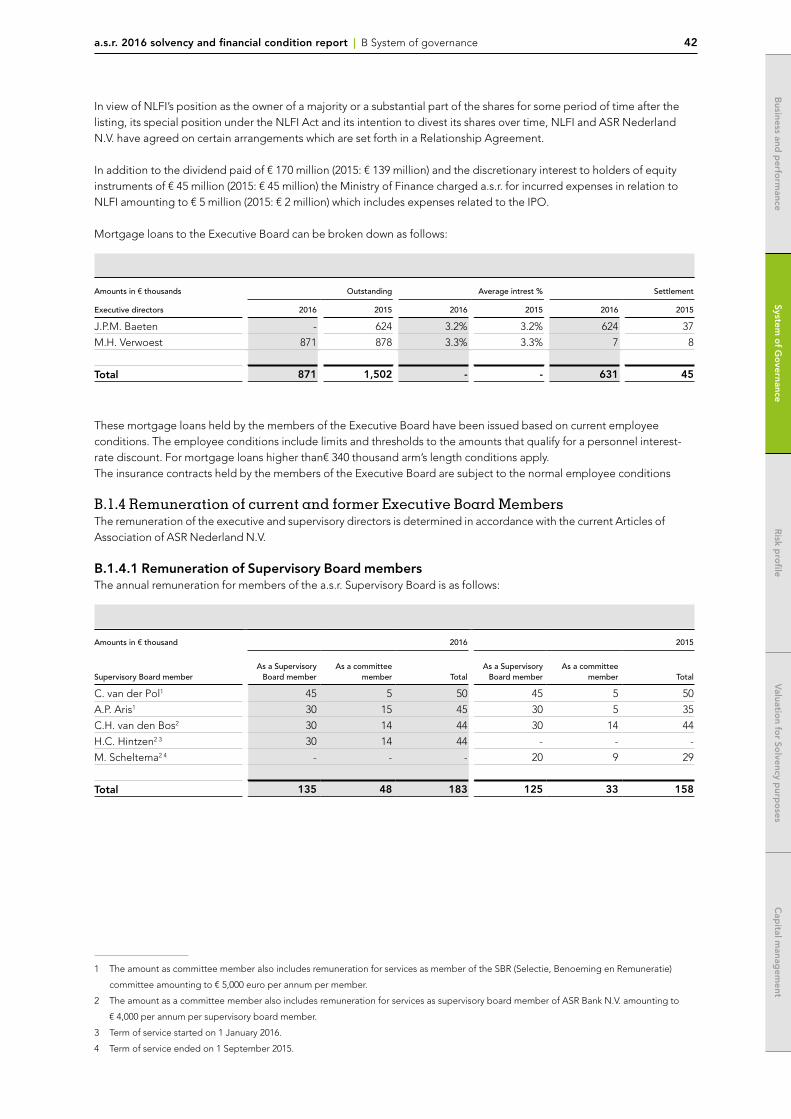
a.s.r. 2016 solvency and financial condition report | B System of governance 42
System o
f Go
vernanceR
isk pro
fileV
aluation fo
r Solvency p
urpo
sesC
apital m
anagem
entB
usiness and p
erform
ance
In view of NLFI’s position as the owner of a majority or a substantial part of the shares for some period of time after the listing, its special position under the NLFI Act and its intention to divest its shares over time, NLFI and ASR Nederland N.V. have agreed on certain arrangements which are set forth in a Relationship Agreement.
In addition to the dividend paid of € 170 million (2015: € 139 million) and the discretionary interest to holders of equity instruments of € 45 million (2015: € 45 million) the Ministry of Finance charged a.s.r. for incurred expenses in relation to NLFI amounting to € 5 million (2015: € 2 million) which includes expenses related to the IPO.
Mortgage loans to the Executive Board can be broken down as follows:
Amounts in € thousands Outstanding Average intrest % Settlement
Executive directors 2016 2015 2016 2015 2016 2015
J.P.M. Baeten - 624 3.2% 3.2% 624 37
M.H. Verwoest 871 878 3.3% 3.3% 7 8
Total 871 1,502 - - 631 45
These mortgage loans held by the members of the Executive Board have been issued based on current employee conditions. The employee conditions include limits and thresholds to the amounts that qualify for a personnel interest-rate discount. For mortgage loans higher than€ 340 thousand arm’s length conditions apply.The insurance contracts held by the members of the Executive Board are subject to the normal employee conditions B.1.4 Remuneration of current and former Executive Board MembersThe remuneration of the executive and supervisory directors is determined in accordance with the current Articles of Association of ASR Nederland N.V.
B.1.4.1 Remuneration of Supervisory Board membersThe annual remuneration for members of the a.s.r. Supervisory Board is as follows:
Amounts in € thousand 2016 2015
Supervisory Board memberAs a Supervisory
Board memberAs a committee
member TotalAs a Supervisory
Board memberAs a committee
member Total
C. van der Pol1 45 5 50 45 5 50
A.P. Aris1 30 15 45 30 5 35
C.H. van den Bos2 30 14 44 30 14 44
H.C. Hintzen2 3 30 14 44 - - -
M. Scheltema2 4 - - - 20 9 29
Total 135 48 183 125 33 158
1 The amount as committee member also includes remuneration for services as member of the SBR (Selectie, Benoeming en Remuneratie)
committee amounting to € 5,000 euro per annum per member.
2 The amount as a committee member also includes remuneration for services as supervisory board member of ASR Bank N.V. amounting to
€ 4,000 per annum per supervisory board member.
3 Term of service started on 1 January 2016.
4 Term of service ended on 1 September 2015.
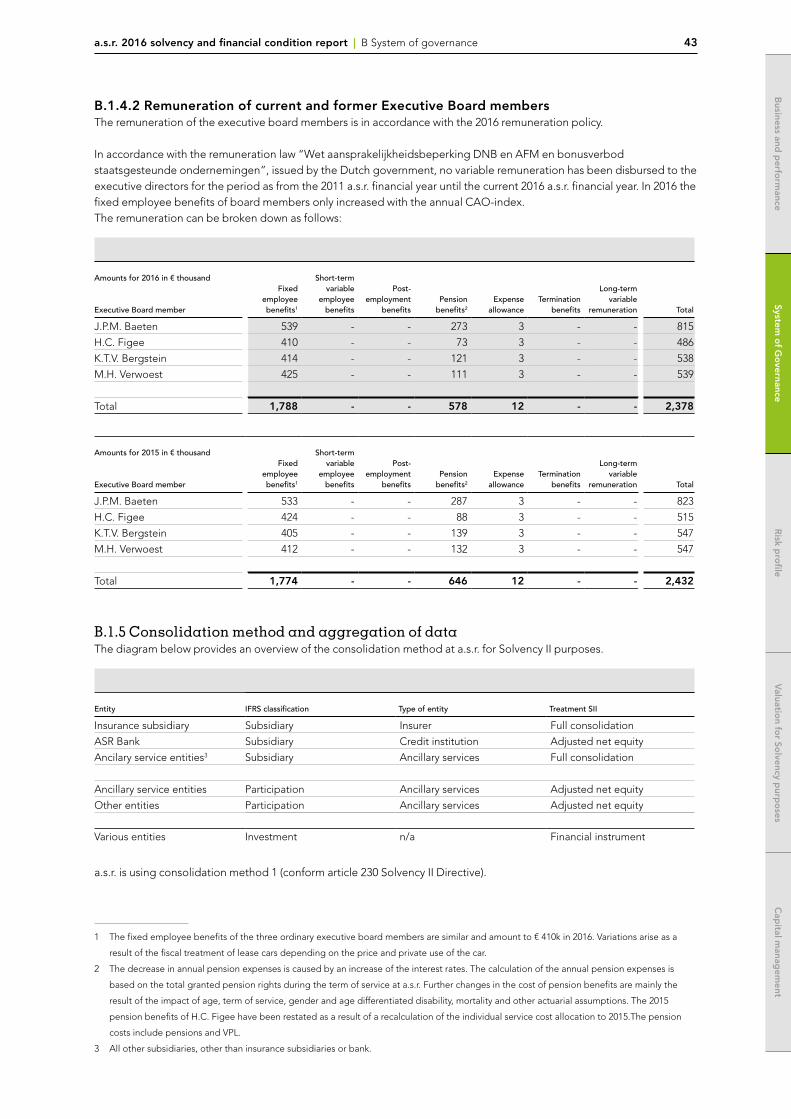
a.s.r. 2016 solvency and financial condition report | B System of governance 43
System o
f Go
vernance
System o
f Go
vernance
Risk p
rofile
Risk p
rofile
Valuatio
n for So
lvency purp
oses
Valuatio
n for So
lvency purp
oses
Cap
ital manag
ement
Cap
ital manag
ement
Business and
perfo
rmance
Business and
perfo
rmance
B.1.4.2 Remuneration of current and former Executive Board membersThe remuneration of the executive board members is in accordance with the 2016 remuneration policy.
In accordance with the remuneration law “Wet aansprakelijkheidsbeperking DNB en AFM en bonusverbod staatsgesteunde ondernemingen”, issued by the Dutch government, no variable remuneration has been disbursed to the executive directors for the period as from the 2011 a.s.r. financial year until the current 2016 a.s.r. financial year. In 2016 the fixed employee benefits of board members only increased with the annual CAO-index.The remuneration can be broken down as follows:
Amounts for 2016 in € thousand
Executive Board member
Fixed employee benefits1
Short-term variable
employee benefits
Post-employment
benefitsPension
benefits2
Expense allowance
Termination benefits
Long-term variable
remuneration Total
J.P.M. Baeten 539 - - 273 3 - - 815
H.C. Figee 410 - - 73 3 - - 486
K.T.V. Bergstein 414 - - 121 3 - - 538
M.H. Verwoest 425 - - 111 3 - - 539
Total 1,788 - - 578 12 - - 2,378
Amounts for 2015 in € thousand
Executive Board member
Fixed employee benefits1
Short-term variable
employee benefits
Post-employment
benefitsPension
benefits2
Expense allowance
Termination benefits
Long-term variable
remuneration Total
J.P.M. Baeten 533 - - 287 3 - - 823
H.C. Figee 424 - - 88 3 - - 515
K.T.V. Bergstein 405 - - 139 3 - - 547
M.H. Verwoest 412 - - 132 3 - - 547
Total 1,774 - - 646 12 - - 2,432
B.1.5 Consolidation method and aggregation of dataThe diagram below provides an overview of the consolidation method at a.s.r. for Solvency II purposes.
Entity IFRS classification Type of entity Treatment SII
Insurance subsidiary Subsidiary Insurer Full consolidation
ASR Bank Subsidiary Credit institution Adjusted net equity
Ancilary service entities3 Subsidiary Ancillary services Full consolidation
Ancillary service entities Participation Ancillary services Adjusted net equity
Other entities Participation Ancillary services Adjusted net equity
Various entities Investment n/a Financial instrument
a.s.r. is using consolidation method 1 (conform article 230 Solvency II Directive).
1 The fixed employee benefits of the three ordinary executive board members are similar and amount to € 410k in 2016. Variations arise as a
result of the fiscal treatment of lease cars depending on the price and private use of the car.
2 The decrease in annual pension expenses is caused by an increase of the interest rates. The calculation of the annual pension expenses is
based on the total granted pension rights during the term of service at a.s.r. Further changes in the cost of pension benefits are mainly the
result of the impact of age, term of service, gender and age differentiated disability, mortality and other actuarial assumptions. The 2015
pension benefits of H.C. Figee have been restated as a result of a recalculation of the individual service cost allocation to 2015.The pension
costs include pensions and VPL.
3 All other subsidiaries, other than insurance subsidiaries or bank.
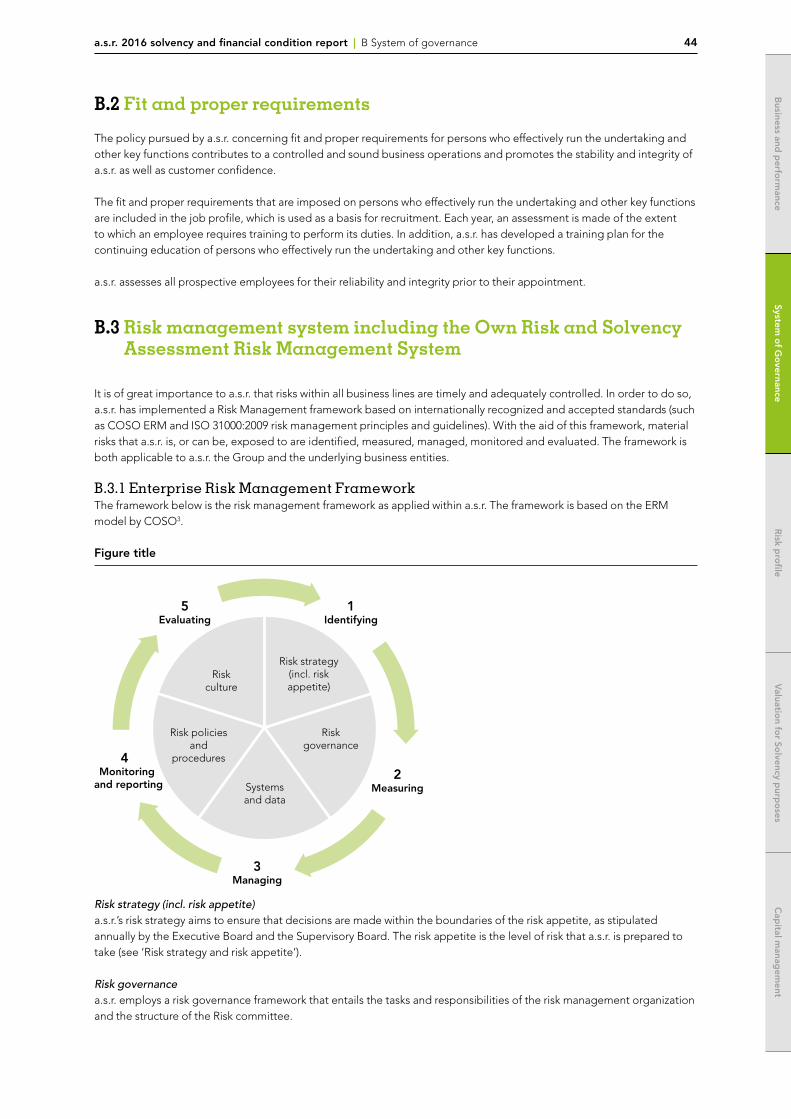
a.s.r. 2016 solvency and financial condition report | B System of governance 44
System o
f Go
vernanceR
isk pro
fileV
aluation fo
r Solvency p
urpo
sesC
apital m
anagem
entB
usiness and p
erform
ance
B.2 Fit and proper requirements
The policy pursued by a.s.r. concerning fit and proper requirements for persons who effectively run the undertaking and other key functions contributes to a controlled and sound business operations and promotes the stability and integrity of a.s.r. as well as customer confidence.
The fit and proper requirements that are imposed on persons who effectively run the undertaking and other key functions are included in the job profile, which is used as a basis for recruitment. Each year, an assessment is made of the extent to which an employee requires training to perform its duties. In addition, a.s.r. has developed a training plan for the continuing education of persons who effectively run the undertaking and other key functions.
a.s.r. assesses all prospective employees for their reliability and integrity prior to their appointment.
B.3 Risk management system including the Own Risk and Solvency Assessment Risk Management System
It is of great importance to a.s.r. that risks within all business lines are timely and adequately controlled. In order to do so, a.s.r. has implemented a Risk Management framework based on internationally recognized and accepted standards (such as COSO ERM and ISO 31000:2009 risk management principles and guidelines). With the aid of this framework, material risks that a.s.r. is, or can be, exposed to are identified, measured, managed, monitored and evaluated. The framework is both applicable to a.s.r. the Group and the underlying business entities.
B.3.1 Enterprise Risk Management FrameworkThe framework below is the risk management framework as applied within a.s.r. The framework is based on the ERM model by COSO3.
Figure title
Risk strategy (incl. risk appetite) a.s.r.’s risk strategy aims to ensure that decisions are made within the boundaries of the risk appetite, as stipulated annually by the Executive Board and the Supervisory Board. The risk appetite is the level of risk that a.s.r. is prepared to take (see ‘Risk strategy and risk appetite’).
Risk governance a.s.r. employs a risk governance framework that entails the tasks and responsibilities of the risk management organization and the structure of the Risk committee.
Risk strategy(incl. risk appetite)
Risk governance
Systems and data
Risk policies and
procedures
Riskculture
1Identifying
2Measuring
3Managing
4Monitoring
and reporting
5Evaluating

a.s.r. 2016 solvency and financial condition report | B System of governance 45
System o
f Go
vernance
System o
f Go
vernance
Risk p
rofile
Risk p
rofile
Valuatio
n for So
lvency purp
oses
Valuatio
n for So
lvency purp
oses
Cap
ital manag
ement
Cap
ital manag
ement
Business and
perfo
rmance
Business and
perfo
rmance
Systems and data In order to report the correct figures and to apply risk-mitigating measures timely, it is of vital importance to have qualitatively adequate data and systems. To ensure this, a.s.r. had developed policies for data quality in line with Solvency II. Tools, models and systems are implemented to support the risk management process by giving guidance and insight in the key risk indicators, risk tolerance levels, boundaries and actions and remediation plans to mitigate risks.
Risk policies and procedures The classification of risks within a.s.r. is performed in line with the Solvency II risks. Each risk category consists of a policy that explains how risks are identified, measured and controlled within a.s.r.
Risk culture Risk culture is an important subject that emphasizes the human side of risk management. The Executive Board has a distinguished role in expressing the appropriate norms and values (tone at the top). a.s.r. employs several measures to increase the risk awareness and, in doing so, the risk culture.
Risk management process The risk management process explains the central steps for the implementation of the risk strategy. Through five steps the risks within the company can be effectively managed. These steps include: 1) identify risks; 2) measure risks; 3) manage risks; 4) monitor and report on risks; and 5) evaluate the risk profile and risk management framework.
Risk strategy and risk appetiteThe risk strategy of a.s.r. aims to ensure that management decisions lead to a risk profile that remains in line with the mission of the organization. The risk strategy entails all processes to manage identified risks and to take advantage of opportunities that come around. In order to achieve this, a risk appetite is established so that the risk profile can be managed within the boundaries as determined by the Executive Board and approved by the Supervisory Board. These risk boundaries are set with the goal of remaining a solid insurance company with the right balance between risk and return. The risk appetite describes the level of risk a.s.r. is prepared to take to realize the strategic goals. Risk exposures are actively managed to ensure that the risks will stay within the defined limits.
The risk appetite represents the level of risk a.s.r. is willing to take for the realization of its strategic goals, with a sound balance between risk and return. Risk appetite is defined at both group level and at legal entity level for financial and non-financial risks. Risk tolerances, limits and targets are set for all risk appetite statements. Objectives of the risk appetite are:• To serve as an important steering instrument on a daily basis: a pragmatic approach at both group-, legal entity- and
business unit level. This helps to develop a vision with respect to risk, which is used in the day-to-day decision-making process;
• To link the risk appetite to the strategic pillars, in order to indicate a.s.r.’s willingness to take risks.
The risk appetite is based on a.s.r.’s mission, vision and strategy, determined by the Executive Board. The overall mission is to offer transparent insurance solutions as a trusted partner to customers, while creating sustainable and stable value for a.s.r’s stakeholders. This mission is translated into the prioritization of simple and transparent products, clear communication and fair treatment of customers. The strategy is derived from the mission and is based on four pillars: meeting customers’ needs, excellence in pricing, underwriting and claims handling, cost effectiveness and maintaining a cash generating business model. The Group strives to execute these four strategic pillars within all of the Group’s segments.
Meeting customers' needsThe Group aims to offer customers simple, transparent products that fulfil their needs.
Excellence in pricing, underwriting and claims handlingThe Group intends to maintain a disciplined pricing strategy focusing on further deepening its knowledge of customer behavior and continuing to enhance and further develop its experience and skills in respect of pricing, underwriting and claims handling.
Cost effectivenessThe Group aims to continuously focus on effectively managing its costs.
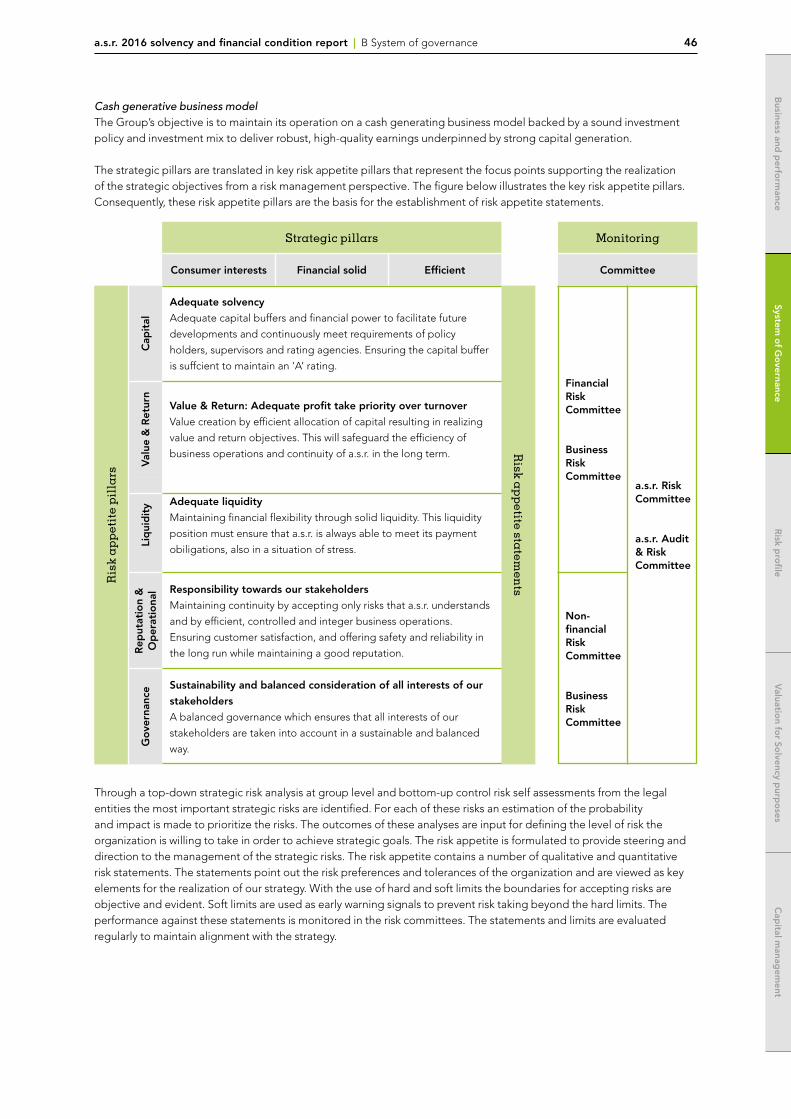
a.s.r. 2016 solvency and financial condition report | B System of governance 46
System o
f Go
vernanceR
isk pro
fileV
aluation fo
r Solvency p
urpo
sesC
apital m
anagem
entB
usiness and p
erform
ance
Cash generative business modelThe Group’s objective is to maintain its operation on a cash generating business model backed by a sound investment policy and investment mix to deliver robust, high-quality earnings underpinned by strong capital generation.
The strategic pillars are translated in key risk appetite pillars that represent the focus points supporting the realization of the strategic objectives from a risk management perspective. The figure below illustrates the key risk appetite pillars. Consequently, these risk appetite pillars are the basis for the establishment of risk appetite statements.
Strategic pillars Monitoring
Consumer interests Financial solid Efficient Committee
Adequate solvency
Adequate capital buffers and financial power to facilitate future
developments and continuously meet requirements of policy
holders, supervisors and rating agencies. Ensuring the capital buffer
is suffcient to maintain an ‘A’ rating.
Value & Return: Adequate profit take priority over turnover
Value creation by efficient allocation of capital resulting in realizing
value and return objectives. This will safeguard the efficiency of
business operations and continuity of a.s.r. in the long term.
Adequate liquidity
Maintaining financial flexibility through solid liquidity. This liquidity
position must ensure that a.s.r. is always able to meet its payment
obiligations, also in a situation of stress.
Responsibility towards our stakeholders
Maintaining continuity by accepting only risks that a.s.r. understands
and by efficient, controlled and integer business operations.
Ensuring customer satisfaction, and offering safety and reliability in
the long run while maintaining a good reputation.
Sustainability and balanced consideration of all interests of our
stakeholders
A balanced governance which ensures that all interests of our
stakeholders are taken into account in a sustainable and balanced
way.
Cap
ital
Val
ue &
Ret
urn
Ris
k a
pp
etit
e p
illa
rs
Risk a
pp
etite statem
ents
Liq
uid
ity
Rep
utat
ion
&
Op
erat
iona
lG
ove
rnan
ce
FinancialRiskCommittee
Business Risk Committee
Non-financial Risk Committee
Business Risk Committee
a.s.r. RiskCommittee
a.s.r. Audit & RiskCommittee
Through a top-down strategic risk analysis at group level and bottom-up control risk self assessments from the legal entities the most important strategic risks are identified. For each of these risks an estimation of the probability and impact is made to prioritize the risks. The outcomes of these analyses are input for defining the level of risk the organization is willing to take in order to achieve strategic goals. The risk appetite is formulated to provide steering and direction to the management of the strategic risks. The risk appetite contains a number of qualitative and quantitative risk statements. The statements point out the risk preferences and tolerances of the organization and are viewed as key elements for the realization of our strategy. With the use of hard and soft limits the boundaries for accepting risks are objective and evident. Soft limits are used as early warning signals to prevent risk taking beyond the hard limits. The performance against these statements is monitored in the risk committees. The statements and limits are evaluated regularly to maintain alignment with the strategy.
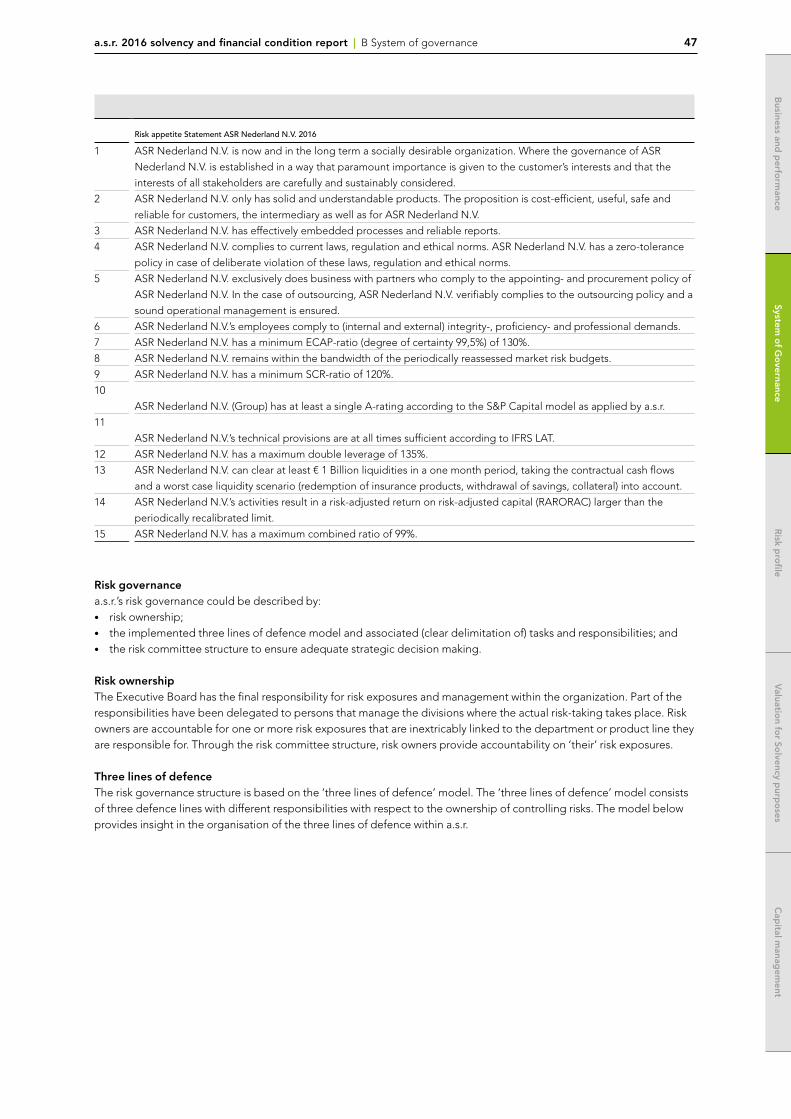
a.s.r. 2016 solvency and financial condition report | B System of governance 47
System o
f Go
vernance
System o
f Go
vernance
Risk p
rofile
Risk p
rofile
Valuatio
n for So
lvency purp
oses
Valuatio
n for So
lvency purp
oses
Cap
ital manag
ement
Cap
ital manag
ement
Business and
perfo
rmance
Business and
perfo
rmance
Risk appetite Statement ASR Nederland N.V. 2016
1 ASR Nederland N.V. is now and in the long term a socially desirable organization. Where the governance of ASR
Nederland N.V. is established in a way that paramount importance is given to the customer’s interests and that the
interests of all stakeholders are carefully and sustainably considered.
2 ASR Nederland N.V. only has solid and understandable products. The proposition is cost-efficient, useful, safe and
reliable for customers, the intermediary as well as for ASR Nederland N.V.
3 ASR Nederland N.V. has effectively embedded processes and reliable reports.
4 ASR Nederland N.V. complies to current laws, regulation and ethical norms. ASR Nederland N.V. has a zero-tolerance
policy in case of deliberate violation of these laws, regulation and ethical norms.
5 ASR Nederland N.V. exclusively does business with partners who comply to the appointing- and procurement policy of
ASR Nederland N.V. In the case of outsourcing, ASR Nederland N.V. verifiably complies to the outsourcing policy and a
sound operational management is ensured.
6 ASR Nederland N.V.’s employees comply to (internal and external) integrity-, proficiency- and professional demands.
7 ASR Nederland N.V. has a minimum ECAP-ratio (degree of certainty 99,5%) of 130%.
8 ASR Nederland N.V. remains within the bandwidth of the periodically reassessed market risk budgets.
9 ASR Nederland N.V. has a minimum SCR-ratio of 120%.
10
ASR Nederland N.V. (Group) has at least a single A-rating according to the S&P Capital model as applied by a.s.r.
11
ASR Nederland N.V.’s technical provisions are at all times sufficient according to IFRS LAT.
12 ASR Nederland N.V. has a maximum double leverage of 135%.
13 ASR Nederland N.V. can clear at least € 1 Billion liquidities in a one month period, taking the contractual cash flows
and a worst case liquidity scenario (redemption of insurance products, withdrawal of savings, collateral) into account.
14 ASR Nederland N.V.’s activities result in a risk-adjusted return on risk-adjusted capital (RARORAC) larger than the
periodically recalibrated limit.
15 ASR Nederland N.V. has a maximum combined ratio of 99%.
Risk governancea.s.r.’s risk governance could be described by:• risk ownership;• the implemented three lines of defence model and associated (clear delimitation of) tasks and responsibilities; and• the risk committee structure to ensure adequate strategic decision making.
Risk ownershipThe Executive Board has the final responsibility for risk exposures and management within the organization. Part of the responsibilities have been delegated to persons that manage the divisions where the actual risk-taking takes place. Risk owners are accountable for one or more risk exposures that are inextricably linked to the department or product line they are responsible for. Through the risk committee structure, risk owners provide accountability on ‘their’ risk exposures.
Three lines of defenceThe risk governance structure is based on the ‘three lines of defence’ model. The ‘three lines of defence’ model consists of three defence lines with different responsibilities with respect to the ownership of controlling risks. The model below provides insight in the organisation of the three lines of defence within a.s.r.

a.s.r. 2016 solvency and financial condition report | B System of governance 48
System o
f Go
vernanceR
isk pro
fileV
aluation fo
r Solvency p
urpo
sesC
apital m
anagem
entB
usiness and p
erform
ance
Three lines of defence
First line of defence
• Executive Board
• Management teams of the
business lines and their
employees
• Finance & risk decentral
• Responsible for the identification
and the risks in the daily business
• Has the day-to-day responsibility
for operations (sales, pricing,
underwritig, claims handling,
etc.) and is responsible for
implementing risk frameworks
and policies.
Ownership and implementation
• Group Risk Management
department
- Risk management function
- Actuarial function
• Group Risk Management
- Compliance function
• Challenges the 1st line and
supports the 1st line to acheive
their business objectives in
accordance with the risk appetite
• Has sufficient countervailing
power to prevent risk
concentrations and other forms
of excessive risk taking
• Responsible for developing risk
policies and monitoring the
compliance with these policies
Policies and monitoring
implementation by 1st line
• Internal Audit department
- Audit function
• Responsible for providing
dedicated assurance services
and oversees and assesses the
functionng and the effectiveness
of the first two lines of defence
Independent assessment of 1st and
2nd lines
Positioning of key functionsWithin the risk governance, the key functions (compliance, risk, actuarial and audit) are organised in accordance with Solvency II regulation and play an important role as countervailing power of management in the decision making process. The four key functions are independently positioned within a.s.r. The risk and actuarial function are positioned under responsibility of the CFO; the compliance and audit function under the responsibility of the CEO. All functions take place in the central risk committees. None of the functions has voting rights in the committees, in order to remain fully independent as countervailing power. All functions have direct communication lines with the Executive Board and can escalate to the chairman of the Audit & Risk Committee of the Supervisory Board.
Group Risk Management is responsible for the execution of the risk management function and the actuarial function. The department is led by the CRO. Group Risk Management consists of the following sub-departments:• Enterprise Risk Management;• Financial Risk Management.
Enterprise Risk ManagementEnterprise Risk Management is responsible for the second line strategic risk and operational (including IT) risk management and the enhancement of the risk awareness within the organisation. The responsibilities with regard to strategic risk management include the development of risk policies, the annual update of the risk strategy (risk appetite), the coordination of the Control Risk Self Assessment (CRSA) process, the monitoring of the non-financial risk profile and risk priorities of a.s.r. For the management of operational risks, a.s.r has a solid Risk-Control framework in place that contributes to its long-term solidity. The quality of our framework is continuously enhanced by the analysis of operational incidents and periodic assessments. Enterprise Risk Management actively promotes risk awareness at all levels to contribute to the vision of staying a socially relevant insurer.
Financial Risk ManagementFinancial Risk Management (FRM) is responsible for the second line market risk, counterparty risk, underwriting risk and liquidity risk management at a.s.r. and its legal entities. Other responsibilities are model validation and policies on valuation and risk. FRM is also responsible for the actuarial function. As part of the actuarial function, FRM reviews the technical provisions, monitors methodologies, assumptions and models used in these calculations, and assesses the adequacy and quality of data used in the calculations. Furthermore, the actuarial function monitors the profitability of new business and determines if risks related to the profitability of new products are sufficiently addressed in the product development process.
Second line of defence Third line of defence
a.s.r. 2016 solvency and financial condition report | B System of governance 49
System o
f Go
vernance
System o
f Go
vernance
Risk p
rofile
Risk p
rofile
Valuatio
n for So
lvency purp
oses
Valuatio
n for So
lvency purp
oses
Cap
ital manag
ement
Cap
ital manag
ement
Business and
perfo
rmance
Business and
perfo
rmance
ComplianceCompliance is responsible for the execution of the compliance function. An important task of Compliance is to be the countervailing power to the Executive Board and management in managing compliance risks for a.s.r. and its subsidiaries. The mission of the compliance function is to enhance and ensure a controlled and sound business operations and to safeguard a.s.r.’s reputation.
As second line of defence, Compliance encourages the organization to comply with relevant rules and regulations, ethical standards and the internal standards derived from them (‘rules’) by providing advice and devising policy. Compliance supports the first line in the identification of compliance risks and assess the effectiveness of riskmanagement on which Compliance reports to the relevant risk committees. In doing so, Compliance uses a compliance risk and monitoring framework. In line with risk management, Compliance also creates further awareness in order to promote a culture of integrity. Compliance coordinates contactswith regulators in order to maintain an effective relationship and keeps oversight of the current topics.
AuditThe Audit department, the third line of defence, provides an independent opinion on governance, risk and management processes, with the goal of supporting the Executive Board and the other management of a.s.r. in achieving the corporate objectives. To that end, Audit evaluates the effectiveness of governance, risk and management processes, and provides pragmatic advice that can be implemented to further optimize these processes. In addition, senior management can engage Audit for specific advisory projects.
Risk committee structurea.s.r. has established a structure of risk committees with the objective to monitor the risk profile for a.s.r., its legal entities and its business lines in order to ensure that it remains within the risk appetite and the underlying risk tolerances and risk limits. When triggers are hit or likely to be hit, risk committees can decide to take measures and to increase the frequency of their meetings. For each of the risk committees a statute is drawn up in which the tasks, composition and responsibilities of the committee are defined.
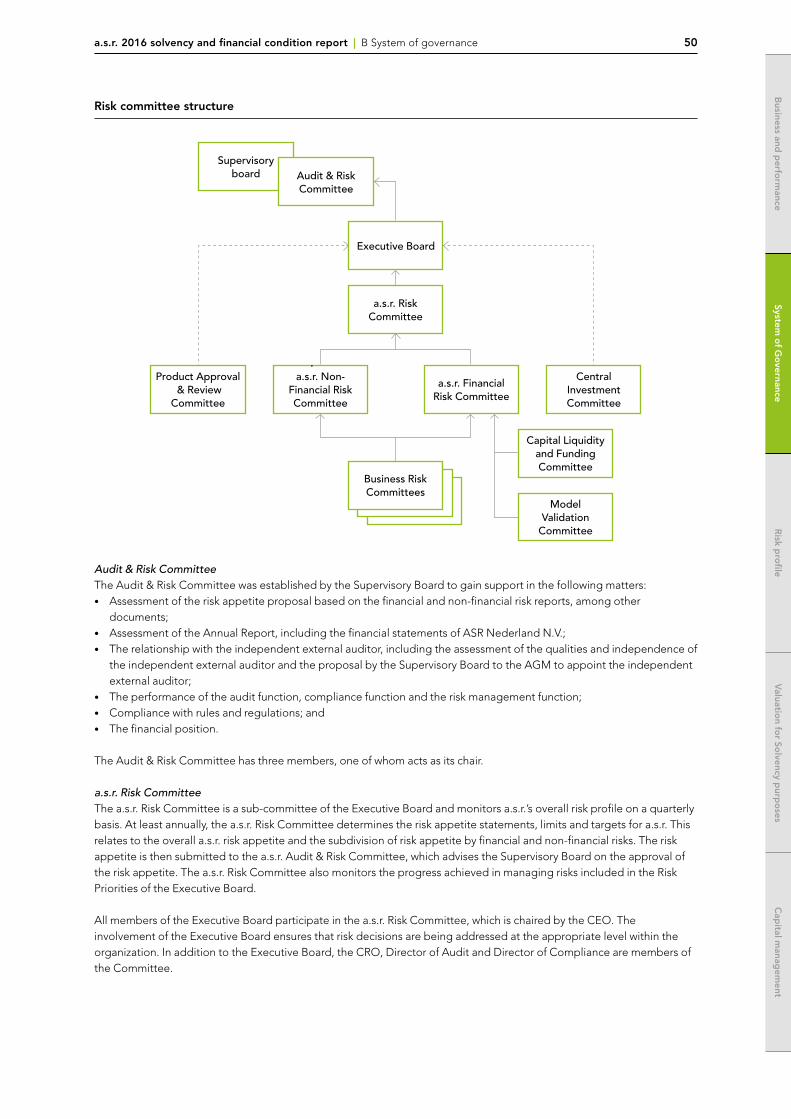
a.s.r. 2016 solvency and financial condition report | B System of governance 50
System o
f Go
vernanceR
isk pro
fileV
aluation fo
r Solvency p
urpo
sesC
apital m
anagem
entB
usiness and p
erform
ance
Risk committee structure
Product Approval & Review
Committee
a.s.r. Financial Risk Committee
a.s.r. Risk Committee
Central InvestmentCommittee
Business Risk Committees
Executive Board
a.s.r. Non-Financial Risk Committee
Capital Liquidityand Funding Committee
Model Validation
Committee
Supervisoryboard Audit & Risk
Committee
Audit & Risk CommitteeThe Audit & Risk Committee was established by the Supervisory Board to gain support in the following matters:• Assessment of the risk appetite proposal based on the financial and non-financial risk reports, among other
documents;• Assessment of the Annual Report, including the financial statements of ASR Nederland N.V.;• The relationship with the independent external auditor, including the assessment of the qualities and independence of
the independent external auditor and the proposal by the Supervisory Board to the AGM to appoint the independent external auditor;
• The performance of the audit function, compliance function and the risk management function;• Compliance with rules and regulations; and • The financial position.
The Audit & Risk Committee has three members, one of whom acts as its chair.
a.s.r. Risk CommitteeThe a.s.r. Risk Committee is a sub-committee of the Executive Board and monitors a.s.r.’s overall risk profile on a quarterly basis. At least annually, the a.s.r. Risk Committee determines the risk appetite statements, limits and targets for a.s.r. This relates to the overall a.s.r. risk appetite and the subdivision of risk appetite by financial and non-financial risks. The risk appetite is then submitted to the a.s.r. Audit & Risk Committee, which advises the Supervisory Board on the approval of the risk appetite. The a.s.r. Risk Committee also monitors the progress achieved in managing risks included in the Risk Priorities of the Executive Board.
All members of the Executive Board participate in the a.s.r. Risk Committee, which is chaired by the CEO. The involvement of the Executive Board ensures that risk decisions are being addressed at the appropriate level within the organization. In addition to the Executive Board, the CRO, Director of Audit and Director of Compliance are members of the Committee.

a.s.r. 2016 solvency and financial condition report | B System of governance 51
System o
f Go
vernance
System o
f Go
vernance
Risk p
rofile
Risk p
rofile
Valuatio
n for So
lvency purp
oses
Valuatio
n for So
lvency purp
oses
Cap
ital manag
ement
Cap
ital manag
ement
Business and
perfo
rmance
Business and
perfo
rmance
Non-Financial Risk Committeehe Non-Financial Risk Committee (NRFC) discusses, advises and decides upon non-financial risk policies. The most relevant risk policies are approved by the a.s.r. Risk Committee. The NFRC monitors that non-financial risks are adequately managed and monitors that the risk profile stays within the agreed risk limits. If the risk profile exceeds the limits, the Non-Financial Risk Committee takes mitigating actions. The NFRC reports to the a.s.r. Risk Committee. The Chairman of the NFRC is the COO (who is also a member of the Executive Board).
Financial Risk CommitteeThe Financial Risk Committee discusses and decides upon financial risk policies. The most relevant risk policies are approved by the a.s.r. Risk Committee. The Financial Risk Committee monitors and controls financial risks (market, underwriting (life and non-life) and counterparty default risk). The Financial Risk Committee also monitors whether the risk profile stays within the risk limits. If the risk profile exceeds these limits, the Financial Risk Committee takes mitigating actions. The Financial Risk Committee reports to the a.s.r. Risk Committee. The Chairman of the Financial Risk Committee is the CFO.
Capital, Liquidity & Funding CommitteeThe Capital, Liquidity and Funding Committee is a subcommittee of the Financial Risk Committee. As such, the Capital, Liquidity and Funding Committee prepares and assesses the technical analysis of capital, liquidity and funding positions, rating policy, rating model reporting, and treasury activities. The Chairman of the Capital, Liquidity and Funding Committee is the Director of Group Asset Management.
Model Validation CommitteeThe model validation committee is a subcommittee of the Financial Risk Committee and is responsible for the execution and update of the model validation policy and for the approval of existing or newly developed validated models before taken into use. The Model Validation Committee receives all required information for the validation of models (for instance model documentation and validation reports), which information is prepared by the validation board that assures the quality of the validation process. The chairman of the Model Validation Committee is the CRO.
Business Risk CommitteesThe business lines manage and control their risk profile through the Business Risk Committees. The Business Risk Committees monitor that the risk profile of the business line stays within the risk appetite, limits and targets, as formulated by the Executive Board. The Business Risk Committee reports to the Financial Risk Committee and the Non-Financial Risk Committee. The Chairman of the Business Risk Committee is the Managing Director of the business line.
Central Investment CommitteeIn addition to the risk committee structure, the Central Investment Committee monitors tactical decisions and the execution of the investment policy. It takes investment decisions within the boundaries of the strategic asset allocation as agreed upon in the Financial Risk Committee. The Central Investment Committee bears particular responsibility for investment decisions exceeding the mandate of the investment department. The Central Investment Committee is chaired by the COO (member of the Executive Board).
Product Approval & Review CommitteeThe Product Approval & Review Committee is responsible for the final decision-making process around the introduction of new products and adjustments in existing products. The Director Marketing is the chairman. The committee evaluates if risks in newly developed products are sufficiently addressed. New products need to be developed in such a way that they are cost efficient, reliable, useful and secure. New products also need to have a strategic fit with a.s.r.’s mission to be a solid and trustful insurer. In addition, the risks of existing products are evaluated, as requested by the product approval and review process as a result of product reviews. Systems and dataTools, models and systems are implemented to support the risk management process by giving guidance and insight in the key risk indicators, risk tolerance levels, boundaries and actions and remediation plans to mitigate risks. The availability, adequacy and quality of data and IT systems is important in order to ensure that correct figures are reported and risk mitigating measures can be taken in time. It is important to establish under which conditions the management information that is submitted to the risk committees has been prepared and which quality safeguards were applied in the process of creating this information. This allows the risk committees to ascertain whether the information is sufficient to base further decisions on. a.s.r. has a Data Governance and Quality policy in place to support the availability of sound management information. This policy is evaluated on an annual basis and revised at least every three years to keep the standards in line with the latest developments on information management. The quality of the information is reviewed on
a.s.r. 2016 solvency and financial condition report | B System of governance 52
System o
f Go
vernanceR
isk pro
fileV
aluation fo
r Solvency p
urpo
sesC
apital m
anagem
entB
usiness and p
erform
ance
the basis of the following aspects, based on Solvency II legislation:• Completeness (including documentation of accuracy of results)• Adequacy • Reliability • Timeliness
The integrity, i.e. reliability, of information is the degree to which it is up-to-date, complete and error-free. The preparatory body or department also checks the assumptions made and the plausibility of the results, and ensures coordination with relevant parties. When a preparatory body has established that the information is reliable and complete, it approves and formally submits the document(s) to a risk committee.
The information involved tends to be sensitive. To prevent unauthorized persons from accessing it, it is disseminated using a secure channel or protected files. a.s.r.’s information security policy contains guidelines in this respect.
The aim of the information security policy is to take measures to ensure that the requirements for the availability, reliability and confidential use of systems and data are met. • Information availability refers to the degree to which the information is at hand as soon as the organization needs it,
meaning, for instance, that the information should be retrievable on demand and that it can be consulted and used at the right time.
• Information reliability refers to the degree of the accuracy and completeness of computer-processed data, given the uses they are intended for.
• ‘Confidential use’ refers to the degree to which the information is available to authorized persons only and the degree to which it is not available to unauthorized persons.
There are technical solutions for accomplishing this, by enforcing a layered approach (defence-in-depth) of technical measures to avoid unauthorized persons (i.e. hackers) to compromise a.s.r. corporate data and systems. In this perspective, one may think of methods of logical access management, intrusion detection techniques, in combination with firewalls that are aimed at preventing hackers and other unauthorized persons from accessing information stored on a.s.r. systems. Nevertheless, confidential information can also have been committed to paper. In addition to technical measures the physical measures, such as the lock-down of a certain room, can also form part of the information security environment. a.s.r.’s information security policy is based on ISO 27002 ‘Code of practice for information security management’. This Code describes best practices for the implementation of information security.
Risk procedures & policiesa.s.r. has established policies for each of the main risk categories (market, counterparty default, underwriting, strategic and operational). These policies address the accountabilities and responsibilities for the management of the different risk types. Also the methodology for risk measurement is included in the policies. The content of the policies is aligned to create a consistent and complete set. The risk policy landscape is maintained by Group Risk Management and Compliance. These departments also monitor the correct implementation of the policies in the business. New risk policies or updates of existing risk policies, are approved by the risk committees as mentioned in the previous section.
Risk cultureRisk awareness is a vital component of building a sound risk culture within a.s.r. that emphasizes the human aspect in the management of risks. In addition to gaining sufficient knowledge, skills, capabilities and experience in risk management, it is of importance that an organization enables objective and transparent risk reporting in order to manage them more effectively.
The Executive Board clearly recognizes the importance of risk management and is therefore represented in all of the major group level risk committees. Risk Management is involved in the strategic decision-making process, where the company’s risk appetite is always considered. The awareness of risks during decision-making is continually addressed when making business decisions, for example by discussing and reviewing risk scenarios and the positive and/or negative impact of risks before finalizing decisions.
It is very important that this risk awareness trickles down to all parts of the organization, and therefore management actively encourages personnel to be aware of risks during their tasks and projects, in order to avoid risks or mitigate them when required. The execution of risk analyses is embedded in daily business in, for example,projects, product design and outsourcing.
In doing so, a.s.r. aims to create a solid risk culture in which ethical values, desired behaviors and understanding of risk in the entity are fully embedded. Integrity is of the utmost importance at a.s.r.: this is translated into a code of conduct and

a.s.r. 2016 solvency and financial condition report | B System of governance 53
System o
f Go
vernance
System o
f Go
vernance
Risk p
rofile
Risk p
rofile
Valuatio
n for So
lvency purp
oses
Valuatio
n for So
lvency purp
oses
Cap
ital manag
ement
Cap
ital manag
ement
Business and
perfo
rmance
Business and
perfo
rmance
strict application policies for new and existing personnel, such as taking an oath or promise when entering the company, and the ‘fit and proper’ aspect of the Solvency II regulation, ensuring that a.s.r. is overseen and managed in a professional manner.
Furthermore, a.s.r. believes it is important that a culture is created in which risks can be discussed openly and where risks are not merely perceived to be negative: risks can also present a.s.r. with opportunities. Risk Management (both centralized and decentralized) is positioned as such, that it can communicate and report on risks independently and transparently, which also contributes to creating a proper risk culture.
Risk management processThe risk management process typically comprises of five important steps: 1) identifying; 2) measuring; 3) managing; 4) monitoring and reporting; and 5) evaluating6. a.s.r. has defined a procedure for performing risk analyses and standards for specific assessments.
Identifying Management should endeavor to identify all possible risks that may impact the strategic objectives of a.s.r., ranging from the larger and/or more significant risks posed on the overall business, down to the smaller risks associated with individual projects or smaller business lines. Risk identification comprises of the process of identifying and describing risk sources, events, and the causes and effects of those events.
Measuring After risks have been identified, quantitative and/or qualitative assessments of these risks take place to estimate the likelihood and impact associated with them. Methods applicable to the assessment of risks are: • Sensitivity analysis; • Stress testing;• Scenario analysis; • Expert judgments (regarding likelihood and impact); and • Portfolio analysis.
Managing Typically, there are five strategies to manage risk: • Accept: risk acceptance means accepting that a risk might have consequences, without taking any further mitigating
measures;• Avoid: risk avoidance is the elimination of activities that cause the risk; • Transfer: risk transference is transferring the impact of the risk to a third party; • Mitigate: risk mitigation involves the mitigation of the risk likelihood and/or impact.• Exploit: risk exploitation revolves around the maximization of the risk likelihood and/or increasing the impact if the risk
does happen.
Risk management strategies are chosen in a way that ensures that a.s.r. remains within the risk appetite tolerance levels and limits.
Monitoring and reportingThe risk identification process is not a continuous exercise. Therefore, risk monitoring and reporting are required to capture changes in environments and conditions. This also means that risk management strategies could, or perhaps should, be adapted in accordance with risk appetite tolerance levels and limits.
Evaluating The evaluation step is twofold. On the one hand, evaluation means risk exposures are evaluated against risk appetite tolerance levels and limits, taking (the effectiveness of) existing mitigation measures into account. The outcome of the evaluation could lead to a decision regarding further mitigating measures or changes in risk management strategies. On the other hand, the risk management framework (including the risk management processes) is evaluated by the risk management function, in order to continuously improve the effectiveness of the risk management framework as a whole. B.3.2 a.s.r.’s risk categoriesThere are six main risk categories at a.s.r., these are: insurance risk, market risk, counterparty default risk, liquidity risk, operational risk and strategic risk.:
6 Based on COSO ERM and ISO 31000:2009.
a.s.r. 2016 solvency and financial condition report | B System of governance 54
System o
f Go
vernanceR
isk pro
fileV
aluation fo
r Solvency p
urpo
sesC
apital m
anagem
entB
usiness and p
erform
ance
Insurance riskInsurance risk is the risk that premium and/or investment income will not be sufficient to cover current or future payment obligations, owing to the application of inaccurate technical or other assumptions and principles when developing and pricing products. a.s.r. recognizes the following Insurance risks:• Non-life insurance risk• Life insurance risk• Health
Market riskMarket risk is the risk of a change in value due to movements in market variables. The following market risks have been identified:• Interest rate risk• Equity risk• Property risk• Spread risk• Currency risk• Concentration risk/market concentration risk
Counterparty default riskCounterparty default risk is the risk of losses due to the unexpected failure to pay or credit rating downgrade of counterparties and debtors. Counterparty default risk exists in respect of the following counterparties:• Reinsurers• Consumers• Intermediaries • Counterparties that offer cash facilities• Counterparties with which derivatives contracts have been concluded
Liquidity riskLiquidity risk is the risk that a.s.r. is not able to meet its financial obligations to policyholders and other creditors when they become due and payable, at a reasonable cost and in a timely manner.
Operational riskOperational risk is the risk of losses caused by weak or failing internal procedures, weaknesses in the action taken by personnel, weaknesses in systems or because of external events. The following subcategories of operational risk are used:• Compliance• Business process• Information technology• Outsourcing• Financial reporting
Strategic risk Strategic risk is the risk that a.s.r. or its business lines fail to achieve the objectives owing to incorrect decision-making, incorrect implementation and/or an inadequate response to changes in the environment.
Such changes may arise in the following areas:• Demographics• Competitive conditions• Technology• Macroeconomic conditions• Laws and regulations and ethical standards• Stakeholders• Group structure (for product lines only)
Strategic risk may arise due to a mismatch between two or more of the following components: the objectives (resulting from the strategy), the resources used to achieve the objectives, the quality of implementation, the economic climate and/or the market in which a.s.r. and/or its business lines operate.

a.s.r. 2016 solvency and financial condition report | B System of governance 55
System o
f Go
vernance
System o
f Go
vernance
Risk p
rofile
Risk p
rofile
Valuatio
n for So
lvency purp
oses
Valuatio
n for So
lvency purp
oses
Cap
ital manag
ement
Cap
ital manag
ement
Business and
perfo
rmance
Business and
perfo
rmance
B.4 Internal control system
Within a.s.r., internal control is defined as the processes, affected by the board of directors, senior management, and other personnel within the organization, implemented to obtain a reasonable level of certainty with regard to achieving the following objectives:• High-level goals, aligned with and supporting the organization’s mission• Effective and efficient use of resources• Reliability of operational and financial reporting• Compliance with applicable laws regulations and ethical standards• Safeguarding of company assets
B.4.1 Strategic and operational risk managementThe system of internal control includes the management of risks at different levels in the organization, both operational and strategic. Internal control at an operational level centers around identifying and managing risks within the critical processes that pose a threat to the achievement of the business line’s objectives. The use of controls helps to mitigate or even completely eliminate identified risks. This increases the business line’s chances of achieving its objectives and demonstrates that it is in control. Business lines report on the effectiveness of their controls on a quarterly basis. The effectivity of controls is important input for the sign off that each business line provides on the financial figures.
At a strategic level, the major risks are identified and assessed periodically with a strategic risk analysis from the group and control risk self-assessments at business lines. After the analysis a list of risk priorities is established and risk management actions are assigned. The progress of these actions are monitored in the a.s.r. Risk Committee.
B.4.1.1 Strategic Risk ManagementStrategic risk is defined as the risk that a.s.r. will not reach its strategic objectives, because risk considerations are not or incorrectly addressed in decision-making processes, incorrect implementation of decisions and/or failure to respond adequately to market developments. Strategic risk management aims to identify and manage the most significant risks that may impact a.s.r.’s strategic objectives. Subsequently, the aim is to identify and analyze the risk profile as a whole, including risk interdependencies. The ORSA process is designed to identify, measure, manage and evaluate those risks that are of strategic importance to a.s.r.:
IdentifyingThrough the ORSA process a Control Risk Self-Assessment (CRSA) is conducted annually for all a.s.r. business entities to identify risks that have an impact on the achievement of the organization’s strategic objectives. At group level a Strategic Risk Analysis is performed based on all available internal and external information and developments. This approach combines a bottom up (CRSA’s) and top Down (SRA) method to identify risks. The outcomes of the CRSA’s and SRA are jointly translated into risk scenarios and ‘risk priorities’, in which the most significant risks for a.s.r. are represented. The Executive Board of a.s.r. decides annually on the most important risk priorities.
Measuringa.s.r. conducts an own risk and solvency assessment (ORSA) at both group and legal entity level each year or more frequently if required by significant changes in a.s.r.’s risk profile. The ORSA is a tool for risk and capital management. Through the ORSA process, the likelihood and impact of the identified risks are assessed, by transposing the risks into scenarios, taking into account (the effectiveness of) risk mitigating measures and planned improvement actions. Information from other processes is used to gain additional insights into the likelihood and impact. One single risk scenario takes multiple risks into account. In this manner, the risk scenarios provide (further) insights into risk interdependencies. In these scenario’s the impact on the balance sheet, the solvency position and the income statement is simulated.
ManagingAs part of the CRSA processes, the effectiveness of risk mitigating measures and planned improvement actions is assessed. This means risk management strategies are discussed, resulting in refined risk management strategies.
Monitoring and reportingThe output of the ORSA process is translated into day-to-day risk management and monitoring and reporting, both at group level and product line levels. At group level, the risk priorities are discussed on a quarterly basis in the a.s.r. Risk Committee. At the level of the product lines, risks are discussed in the Business Risk Committees.
a.s.r. 2016 solvency and financial condition report | B System of governance 56
System o
f Go
vernanceR
isk pro
fileV
aluation fo
r Solvency p
urpo
sesC
apital m
anagem
entB
usiness and p
erform
ance
Evaluating Insights regarding likelihood and impact are evaluated against solvency targets. Based on this evaluation, conclusions are formulated regarding the adequacy of solvency objectives at group and individual legal entity level.
B.4.1.2 Operational risk managementOperational Risk Management involves the management of all possible risks that may influence the achievement of the company targets and that can cause financial or reputational damage. Operational risk management includes the identification, analysis, prioritization and management of these risks in line with the risk appetite. The policy on operational risk management is drafted and periodically evaluated under the coordination of Enterprise Risk Management. The policy is implemented in the decentralized business entities under the responsibility of the management boards. A great number of risks is encountered with the operational risk management policy: IT risk, outsourcing, data quality, claim handling etc.
IdentifyingWith the operational targets as a starting point, each business entity performs risk assessments to identify events that could influence these targets. In each business entity the business risk manager facilitates the periodic identification of the key operational risks. All business processes are taken into account to identify the risks. All identified risks are prioritized and recorded in a risk-control framework.
In some areas, the risk policies prescribe specific risk analyses to be performed to identify and analyze the risks. For important IT systems, SPRINT analyses have to be performed and also for large outsourcing projects a specific risk analysis is required.
MeasuringAll risks in the risk-control frameworks are assessed on probability of defaults and impact. Where possible, the variables are quantified, but often judgments of subject matter experts are required. Based on the estimation of the variables, each risk is labeled with a specific level of concern. Risks with a high level of concern are considered ‘key’.
ManagingFor each risk, identified controls are implemented into the processes to keep the level of risk within the agreed risk appetite. In general, risks can be accepted, mitigated, avoided or transferred. A large range of options is available to mitigate operational risks, depending on the type. For each control an estimation is made of the net risk, after implementing the control.
Monitoring and reportingThe effectiveness of operational risk management is periodically monitored by the business risk manager at each business entity. For each control in the risk-control framework a testing calendar is established, based on accounting standards. Each control is tested regular and the outcomes on the effectiveness to manage the key risks are reported to the management board. Outcomes are also reported to the NFRC and a.s.r. Risk Committee.
EvaluatingPeriodically, at least every year, the risk-control frameworks and operational risk management policies are evaluated to see if adjustments are desirable. The risk management function also challenges the business entities on their risk-control frameworks.
Operational incidents Operational incidents with operational losses in excess of €5,000 are reported to Group Risk Management, in accordance with the operational risk policy. The causes of losses are evaluated in order to learn from these experiences. An overview of main losses is reported to the NFRC. Actions are defined and implemented to avoid repetition of operational losses.
ICTThrough IT risk management, a.s.r. devotes attention to the efficiency, effectiveness and integrity of ICT. The logical access control for key applications used in the financial reporting process remains a high priority in order to enhance the integrity of applications of data. The logical access control procedures also prevent fraud by improving segregation of duties and by conducting regular checks of actual access levels within the applications. Proper understanding of information, security and cyber risks is essential, and this is why actions are carried out to create awareness among employees and business lines.
a.s.r. 2016 solvency and financial condition report | B System of governance 57
System o
f Go
vernance
System o
f Go
vernance
Risk p
rofile
Risk p
rofile
Valuatio
n for So
lvency purp
oses
Valuatio
n for So
lvency purp
oses
Cap
ital manag
ement
Cap
ital manag
ement
Business and
perfo
rmance
Business and
perfo
rmance
Business Continuity ManagementOperational management can be disrupted significantly by unforeseen circumstances or calamities which could ultimately disrupt the execution of critical and operational processes. Business Continuity Management enables a.s.r. to continue its daily business uninterruptedly and to react quickly and effectively during such situations.
Critical processes and activities and the tools necessary to use for these processes, are identified during the Business Impact Analysis. This includes the resources required to establish similar activities at a remote location. The factors that can threaten the availability of those tools necessary for the critical processes are identified in the Threat Analysis.
a.s.r. considers something a crisis when one or more business lines are (in danger of being) disrupted in the operational management, due to a calamity, or when there is a reputational threat. In order to reduce the impact of the crisis, to stabilize the crisis, and to be able to react timely, efficiently and effectively, a.s.r. has assigned a crisis organization.
Each business line has their own crisis team led by the director of the management team. The continuity of activities and the recovery systems supporting critical activities are regularly tested and crisis teams are trained annually. The objective of the training is to give the teams insights into how they function during emergencies and to help them perform their duties more effectively during those situations. The training also sets out to clarify the roles, duties and responsibilities of the crisis teams.
Recovery Planninga.s.r.’s Recovery Plan helps to be prepared and have the capacity to act in various forms of extreme financial stress. To this end, the Recovery plan describes and quantifies the measures that can be used to get through a crisis situation. These measures are tested in the scenario analysis, in which the effects of each recovery measure on a.s.r.’s financial position (solvency and liquidity) are quantified. The required preparations for implementing the measures, their implementation time and effectiveness, potential obstacles and operational effects are also assessed. The main purpose of the Recovery Plan is to increase the likelihood of successful early intervention during a financial crisis situation and to further guarantee that the interest of policyholders and other stakeholders are protected.
Reasonable assurance and model validation a.s.r aims to obtain reasonable assurance regarding the adequacy and accuracy of the outcomes of models that are used to provide best estimate values and solvency capital requirements. To this end, multiple instruments are applied, including model validation. Materiality is determined by means of an assessment of impact and complexity. Impact and complexity is expressed in terms of High (H), Medium (M), or Low (L).
In the pursuit of reasonable assurance, model risk is mitigated and unpleasant surprises are avoided, against acceptable costs.
B.4.2 Compliance function
B.4.2.1 Positioning and structure of compliance functionThe compliance function is a centralized function and, together with Investigation, is part of the Integrity department. The Integrity department is headed by a director who is appointed as the a.s.r. Compliance Officer for both a.s.r. and the supervised entities. The compliance function is considered a key function. The CEO has the ultimate responsibility for the compliance function. The a.s.r. Compliance Officer is appointed, at the CEO’s suggestion, by the Audit and Risk Committee, which is part of the Supervisory Board.
The a.s.r. Compliance Officer reports directly to the CEO. In addition, the a.s.r. Compliance Officer is formally required to report to the chairman of the Audit and Risk Committee to safeguard the independent position of the compliance function and enables it to operate autonomously. The a.s.r. Compliance Officer is entitled to escalate critical compliance matters to the highest organizational level or the Supervisory Board.
The governance of the supervised entities is similar to the governance of a.s.r.
B.4.2.2 Responsibilities and dutiesThe mission of the compliance function is to enhance and ensure a controlled and sound business operations and to safeguard a.s.r.’s reputation.
a.s.r. 2016 solvency and financial condition report | B System of governance 58
System o
f Go
vernanceR
isk pro
fileV
aluation fo
r Solvency p
urpo
sesC
apital m
anagem
entB
usiness and p
erform
ance
The compliance function, as part of the second line of defence, is responsible for:• Encouraging compliance with relevant rules and regulations, ethical standards and the internal standards derived from
them (‘rules’) by providing advice and devising policy.• Monitoring compliance with rules. The compliance function prepares a detailed list and performs an assessment of the
compliance risks and how they are managed, taking a.s.r.’s objectives and the rules as a basis. As part of this, it makes use of a compliance risk and monitoring framework.
• Managing compliance risks by developing adequate compliance risk management, including auditing and, if necessary, arrangements concerning management and actions to be taken.
• Raising a greater sense of awareness in order to promote a culture of integrity.• Coordinating contacts with regulators in order to maintain effective relationships with them.
B.4.2.3 Compliance charterThe compliance charter sets out the responsibilities, duties and governance of the compliance function at ASR Nederland N.V. The a.s.r. Compliance Officer ensures that the charter is approved by the a.s.r. Risk Committee and the Audit and Risk Committee. The compliance charter was updated and approved in 2016.
B.4.2.4 Annual Compliance plan Developments in rules, the management of high compliance risks and action plans provide the basis for the annual compliance plan and compliance’s monitoring activities. The annual compliance plan is discussed with management and submitted to the Executive Board and the Audit & Risk Committee for approval.
B.4.2.5 ReportingThe compliance function reports quarterly on compliance matters and progress made on the relevant actions at Group level, supervised entity level and at division level. The quarterly report at division level is discussed with the responsible management and scheduled in the Business Risk Committee.
The quarterly report at Group level and supervised entity level is presented to the a.s.r. Risk Committee, discussed with them and submitted to the Audit & Risk Committee. The report is also shared and discussed with Dutch Central Bank, AFM and external auditor.
B.5 Internal audit function
The Audit Department provides a professional and independent assessment of the governance, risk management and internal control processes with the aim of aiding management in achieving the company’s objectives. The Audit Department evaluates the effectiveness of governance, risk management and internal control processes, and gives practical advice on process optimization. This statement of duties has been set down in the Audit Charter for ASR Nederland N.V. and the legal entities. The Audit Department reports its findings to the Executive Board of ASR Nederland N.V., to the managing boards of the legal entities and, by means of the quarterly management report, to the Audit & Risk Committee. For ASR Bank N.V., a separate Audit Charter is applicable.
The Audit Department has an independent position within a.s.r., as set down in the Audit Charter. The supervisory board guarantees Audit and its employees an independent, impartial and autonomous position in order to execute the mission of Audit. The head of the Audit Department reports to the chairman of the Executive Board and has a reporting line to the chairman of the Audit & Risk Committee. The Chief Audit Executive is appointed by the Audit & Risk Committee. In order to maintain the independence and impartiality of the internal audit function, the audit function is not influenced by the Executive Board and managing boards of the legal entities in the execution of an audit and the evaluation of and reporting on audit outcomes. The audit function is not subjected to any inappropriate influence from any other function, including the key functions.
The persons carrying out the internal audit function do not assume any responsibility for any other (key) function. The Audit Department has periodic consultations with Dutch Central Bank to discuss the risk assessment, findings and audit plan. The Audit Department’s risk assessment is performed in close consultation with the independent external auditor. The department also takes the initiative to organize a ‘tripartite consultation’ with Dutch Central Bank and the independent external auditor at least once a year. In 2016, two tripartite consultations were held.
The Audit Department sets up a yearly audit plan based upon an extensive risk assessment. The audit plan is approved by the Audit & Risk Committee. At least once a year, the audit plan is evaluated and any changes to the plan must be approved by the Audit & Risk Committee.
a.s.r. 2016 solvency and financial condition report | B System of governance 59
System o
f Go
vernance
System o
f Go
vernance
Risk p
rofile
Risk p
rofile
Valuatio
n for So
lvency purp
oses
Valuatio
n for So
lvency purp
oses
Cap
ital manag
ement
Cap
ital manag
ement
Business and
perfo
rmance
Business and
perfo
rmance
All Audit officers took the oath for the financial sector and are subject to disciplinary proceedings. All Audit officers have committed themselves to the applicable code of conduct of a.s.r., follow the Code of Ethics of the Institute of Internal Auditors (IIA) and comply with the specific professional rules of the Netherlands Institute of Chartered Accountants (NBA) and the professional association for IT-auditors in the Netherlands (NOREA).
Audit applies the standards of the IIA, NBA and NOREA for the profession of internal auditing. Each year, Audit performs a self-assessment and an internal quality review and reports the results to the chairman of the board and to the members of the Audit and Risk Committee. In accordance with the standards of the IIA, an external quality review is performed every four years. During the last review in 2016, Audit was approved by the IIA and received the Institute’s quality certificate.
B.6 Actuarial function
The Actuarial Function (AF) is one of four key functions in a.s.r.’s system of governance.
The main tasks and responsibilities of the AF are to:• coordinate the calculation of technical provisions;• ensure the appropriateness of the methodologies, underlying models and the assumptions made in the calculation of
technical provisions;• assess the sufficiency and quality of the data used in the calculation of technical provisions;• compare best estimates against experience;• inform the administrative, management or supervisory body of the reliability and adequacy of the calculation of
technical provisions;• express an opinion on the overall underwriting policy;• express an opinion on the adequacy of reinsurance arrangements; and• contribute to the effective implementation of the risk management system
The AF is part of the second line of defence and operates independently of both the first line (responsible for determining the technical provisions, reinsurance and underwriting), as well as the other three key functions (internal audit, risk management and compliance).
The AF for both ASR Nederland N.V. and the insurance legal entities is operationally part of a.s.r. Group Risk Management. The AF is performed by persons who have profound knowledge of actuarial and financial mathematics, proportionate to the nature, scale and complexity of the risks present in a.s.r.’s businesses.
There are two function holders. One is responsible for the legal entities in the Life segment (Individual Life, Funeral and Pensions business lines) and the other for the entities in the Non-life segment (Property & Casualty, Disability and Health business lines). Both act as function holder for ASR Nederland N.V.
The AF function is represented in several risk committees. Each year, the AF drafts a formal report, which it discusses with the a.s.r. Risk Committee (or Executive Board) and the a.s.r. Audit & Risk Committee.
Independence of the AF is secured through several measures:• The Actuarial function holders are nominated by the Chairman of the Board and appointed by the a.s.r. Audit & Risk
Committee;• The Actuarial function holders have unrestricted access to all relevant information necessary for the exercise of their
function;• The Actuarial function holders have a direct reporting line to the a.s.r. Risk Committee or Executive Board and the
Audit and Risk Committee of a.s.r. The AF is free to report to one of the management or risk committees when considered necessary;
• The AF is free to report all relevant issues;• In case of a conflict of interest with the CFO and/or CRO, the function holders may escalate directly to the CEO and to
the Chairperson of the Audit & Risk Committee of a.s.r.; • If the AF is asked to perform tasks that are outside the formal scope described in a charter, the function holder(s)
assess if there is a conflict of interest. If so, the AF will not execute the task unless there are sufficient additional measures to mitigate conflicts of interest;
• The Internal Audit Department conducts an annual assessment of the functioning of the governance of a.s.r. and the (independent) operation of the Actuarial function;
• Target Setting and assessment of the function holders is done by the CFO and must be approved by the Chairman of the Audit & Risk Committee.
System o
f Go
vernanceR
isk pro
fileV
aluation fo
r Solvency p
urpo
sesC
apital m
anagem
entB
usiness and p
erform
ance
a.s.r. 2016 solvency and financial condition report | B System of governance 60
System o
f Go
vernanceR
isk pro
fileV
aluation fo
r Solvency p
urpo
sesC
apital m
anagem
entB
usiness and p
erform
ance
B.7 Outsourcing
a.s.r. has outsourced some of its operational activities. Despite this, a.s.r. remains fully responsible and accountable for these activities and the power of influence remains with a.s.r. To manage the risks related to outsourcing, a.s.r. has drafted a policy to safeguard a controlled and sound business operations.
Solid risk management, governance and monitoring are essential to manage outsourced activities. The outsourcing policy outlines the relevant procedures and is applicable to a.s.r. and its subsidiaries. A risk assessment must be performed for critical and/or important outsourced activities. This assessment focuses on e.g. concentration risk, competition risk, vendor lock-in and conflicts of interests.
To define the respective rights and obligations, a.s.r. drafts a written outsourcing contract with the service provider.
Confidentiality, quality of service and continuity are key for a.s.r. in carrying out its activities. In addition, customer centricity and compliance with law and regulations are essential, regardless of who performs the activities. To safeguard the quality of outsourced activities, service providers are closely scrutinized prior to selection and compliance with agreed obligations is monitored. The findings of the monitoring activities serve as input for the periodic consultation on operational, tactical and strategic level with the service provider.
a.s.r. has outsourced certain critical and/or important activities that are part of material operational processes. Outsourced activities are related to front-, mid- or back office activities related to the supervised entities ASR Levensverzekering N.V., ASR Schadeverzekering N.V., ASR Basis Ziektekostenverzekeringen N.V. and ASR Aanvullende Ziektekostenverzekeringen N.V. In addition, the management and service of some supporting systems are also outsourced.
B.8 Any other information
Other material information about the system of governance does not apply.

a.s.r. 2016 solvency and financial condition report | C Risk profile 61
System o
f Go
vernance
System o
f Go
vernance
Risk p
rofile
Risk p
rofile
Valuatio
n for So
lvency purp
oses
Valuatio
n for So
lvency purp
oses
Cap
ital manag
ement
Cap
ital manag
ement
Business and
perfo
rmance
Business and
perfo
rmance
System o
f Go
vernanceR
isk pro
fileV
aluation fo
r Solvency p
urpo
sesC
apital m
anagem
entB
usiness and p
erform
ance
C Risk profile
Risk management is an integral part of our daily business activities. a.s.r applies an integrated approach in managing risks, ensuring that our strategic goals (customer interests, financial solidity and efficiency of processes) are maintained. This integrated approach ensures that value will be created by identifying the right balance between risk and return, while ensuring that obligations towards our stakeholders are met. Risk management supports a.s.r. in the identification, measurement and management of risks and monitors to ensure adequate and immediate actions are taken in the event of changes in a.s.r.’s risk profile.
a.s.r. is exposed to the following types of risks: market risk, counterparty default risk, insurance risk, strategic risk and operational risk. The risk appetite is formulated at both Group and legal entity level and establishes a framework that supports an effective selection of risks.
a.s.r. strives to find an optimal tradeoff between risk and return, also known as value steering. Value steering is applied in decision-making throughout the entire product cycle: from PARP (Product Approval Review Process) to the payment of benefits and claims. At the more strategic level, decision-making takes place through balance sheet management. A robust solvency position takes precedence over profit, premium income and direct investment income. Risk tolerance levels and limits are captured in the financial risk appetite statements (financial RAS) and monitored by the Financial Risk Comitee (FRC). The FRC evaluates financial risk positions against the RAS on a monthly basis. Where appropriate, further mitigating measures are taken. Decisions that may have significant impact are made by the a.s.r. Risk Committee.
As of 1 January 2016 the Solvency II regime is in place. a.s.r. measures its risks based on the standard model as prescribed by the Solvency II regime and therefore the risk management framework and this chapter are fully in aligned with Solvency II. The Solvency Capital Requirement (SCR) is determined as the change in own funds caused by a predetermined shock which is calibrated to a 1-in-200 year event. The basis for these calculations are the Solvency II technical provisions which are calculated as the sum of a best estimate and a risk margin.
Key risk developments in 2016a.s.r. strives to find an optimal tradeoff between risk and return, also known as value steering. Value steering is applied in decision-making throughout the entire product cycle: from PARP (Product Approval Review Process) to the payment of benefits and claims. At the more strategic level, decision-making takes place through balance sheet management. A robust solvency position takes precedence over profit, premium income and direct investment income. Risk tolerance levels and limits are captured in the financial risk appetite statements (financial RAS) and monitored by the Financial Risk Comite (FRC). The FRC evaluates financial risk positions against the RAS on a monthly basis. Where appropriate, further mitigating measures are taken. Decisions that may have significant impact are made by the a.s.r. Risk Committee.
A dominant theme in 2016 was the ongoing low and volatile interest rate environment as well as ongoing volatile circumstances on the financial markets.
As a consequence of the ongoing decline of interest rates a.s.r.’s contingency plan was partly executed to protect solvency ratios. Market risk budgets were reduced, resulting in a reduction of equity risk exposure. Moreover, market risk budgets in general were extensively discussed in order to address the unique nature of the low interest rate environment, resulting in revision of economic reality.
Management of non-financial risks in 2016Non-financial risk appetite statements are in place to manage the risk profile within the limits as determined by the Executive Board and approved by the Supervisory Board. The NFRC monitors whether non-financial risks are adequately managed. If the risk profile exceeds the appetite, the Non Financial Risk Comite agrees on actions to be taken. Decisions that may have significant impact are made by the a.s.r. Risk Committee. In 2016, the non-financial risk appetite statements were refined to relate more closely to the business objectives of a.s.r. There are separate statements for strategic, operational and compliance risk. Risk exposures are actively managed to ensure that the risks will stay within the defined appetite. The risk profile and internal control performance of each business line are discussed on a quarterly basis with senior management in the business risk committees and the NFRC.
In 2016, efforts were made to further improve the effectiveness of the operational risk-control framework by taking more a risk-based approach. The operational risk policies were updated to support this approach, by putting focus on the
System o
f Go
vernanceR
isk pro
fileV
aluation fo
r Solvency p
urpo
sesC
apital m
anagem
entB
usiness and p
erform
ance
Introduction | C Risk profile 62
System o
f Go
vernanceR
isk pro
fileV
aluation fo
r Solvency p
urpo
sesC
apital m
anagem
entB
usiness and p
erform
ance
identification, analysis and management of key risks. The management of the business lines evaluated their key risks and controls according to these policies. Also, to improve financial reporting risk, initiatives were started to enhance efficiency in order to create integrated, automated and actual insights in the effectiveness of risk management. In 2017, focus will remain on continuously looking for opportunities improve the management of operational risks.
a.s.r. recognizes the importance of sound data quality and information management systems. During 2016 actions were taken to enhance the measurement and reporting on data quality for the purpose of financial reporting. Comprehensive assessments were performed by the central risk function at all entities within the organization to measure the effectiveness of the IT controls to guarantee controlled and secure information management systems.
Risk prioritiesThe risk priorities of a.s.r. are defined annually by the Executive Board based on the strategic risk analysis and bottom up control risk self-assessments of the legal entities. The actual status of the risk priorities and progress on the defined actions is reported to the a.s.r. Risk Committee on a quarterly basis. The most important risk priorities are described below.
Pressure on margins and sales in a changing marketThe insurance market is changing. Shrinking customer demand, changes in customer behaviors, change indistribution channels, lack of public trust in insurers, the current economic climate (low interest rates), regulatory changes and technological developments. There is a fierce competition and growing cost awareness faced in the current market, which can result in an increase in non-life policy cancellations, loss of retention in the life business, a drop in new insurance contracts sales, and limited scalability of departments.
a.s.r. will adjust the product portfolio and distribution channels as quickly and efficiently as possible, in order to meet the changing needs of customers and to achieve the planned cost reductions as premiums fall.
Juridification of societyIn the matter of unit-linked policies, firm policyholder compensation agreements have been made with the relevant customer associations. Meanwhile, the risk of new claims still looms. This risk is intensified by the increased juridification of our society and by the insecurity about the handling of legal proceedings at other insurance companies. Court rulings and decisions by arbitration boards may have an industry-wide impact and could trigger widespread media attention, evoking negative sentiments among policyholders, which in turn could increase the reputation risk for a.s.r.
Insecurities financial markets and interest developmentsDue to unforeseen political developments and/or macroeconomic developments combined with decreased liquidity in the market due to the limited space banks have to supply money, pose the threat that financial markets become volatile and could, in turn, lead to deteriorated solvability position for a.s.r.
a.s.r will continually stay alert to the risk that a scenario with major impact on capital and solvability would develop in Europe.
Impact of supervision, laws and regulations implemented on a continuous basis.As a result of this increasing political and regulatory pressure, there is a risk that: • a.s.r.’s reputation will be put under pressure, in case new requirements are not met in time;• available resources will mostly be utilized in the cause of aligning the organization to new legislation, meaning there
are fewer resources to spend on the core customer processes; • processes will become less efficient and pressure on the workforce will increase; • a.s.r. will receive administrative fines or sanctions for being unable to comply with the requirements (in a timely
fashion). Solvency II regulation may be intensified (e.g. with regards to mortgages, government bonds, UFR), or that a difference in interpretation may exist between a.s.r. and the supervisors, which could have a negative effect on, or create volatility in, a.s.r.’s solvency position. This is due to the fact that the Solvency II regulation has not been crystallized entirely and a few issues remain up for discussion.
Information security riskThe information security risks have increased, due to new technological developments – such as cloud computing, bring-your-own device, social networks and online transactions with customers. In order to prevent cyber-attacks and information security breaches, a.s.r. needs to be sufficiently aware of the potential threats posed to it as an organization. a.s.r. runs the risk that new technological developments require different and increased expertise and alternative mitigating measures. The chance that confidential information becomes available to third parties, either intentionally or unintentionally, is a risk for a.s.r. and its customers, which could ultimately lead to significant reputational harm. All our
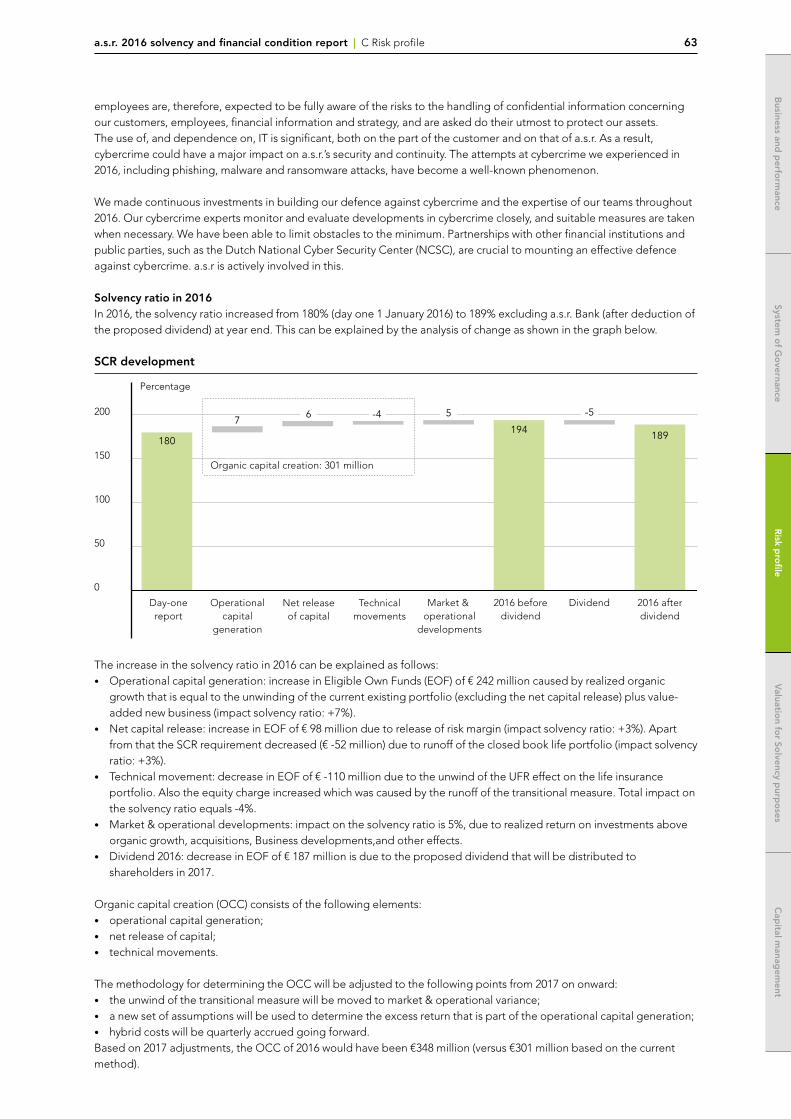
a.s.r. 2016 solvency and financial condition report | C Risk profile 63
System o
f Go
vernance
System o
f Go
vernance
Risk p
rofile
Risk p
rofile
Valuatio
n for So
lvency purp
oses
Valuatio
n for So
lvency purp
oses
Cap
ital manag
ement
Cap
ital manag
ement
Business and
perfo
rmance
Business and
perfo
rmance
System o
f Go
vernanceR
isk pro
fileV
aluation fo
r Solvency p
urpo
sesC
apital m
anagem
entB
usiness and p
erform
ance
employees are, therefore, expected to be fully aware of the risks to the handling of confidential information concerning our customers, employees, financial information and strategy, and are asked do their utmost to protect our assets. The use of, and dependence on, IT is significant, both on the part of the customer and on that of a.s.r. As a result, cybercrime could have a major impact on a.s.r.’s security and continuity. The attempts at cybercrime we experienced in 2016, including phishing, malware and ransomware attacks, have become a well-known phenomenon.
We made continuous investments in building our defence against cybercrime and the expertise of our teams throughout 2016. Our cybercrime experts monitor and evaluate developments in cybercrime closely, and suitable measures are taken when necessary. We have been able to limit obstacles to the minimum. Partnerships with other financial institutions and public parties, such as the Dutch National Cyber Security Center (NCSC), are crucial to mounting an effective defence against cybercrime. a.s.r is actively involved in this.
Solvency ratio in 2016In 2016, the solvency ratio increased from 180% (day one 1 January 2016) to 189% excluding a.s.r. Bank (after deduction of the proposed dividend) at year end. This can be explained by the analysis of change as shown in the graph below.
SCR development
The increase in the solvency ratio in 2016 can be explained as follows: • Operational capital generation: increase in Eligible Own Funds (EOF) of € 242 million caused by realized organic
growth that is equal to the unwinding of the current existing portfolio (excluding the net capital release) plus value-added new business (impact solvency ratio: +7%).
• Net capital release: increase in EOF of € 98 million due to release of risk margin (impact solvency ratio: +3%). Apart from that the SCR requirement decreased (€ -52 million) due to runoff of the closed book life portfolio (impact solvency ratio: +3%).
• Technical movement: decrease in EOF of € -110 million due to the unwind of the UFR effect on the life insurance portfolio. Also the equity charge increased which was caused by the runoff of the transitional measure. Total impact on the solvency ratio equals -4%.
• Market & operational developments: impact on the solvency ratio is 5%, due to realized return on investments above organic growth, acquisitions, Business developments,and other effects.
• Dividend 2016: decrease in EOF of € 187 million is due to the proposed dividend that will be distributed to shareholders in 2017.
Organic capital creation (OCC) consists of the following elements:• operational capital generation;• net release of capital;• technical movements.
The methodology for determining the OCC will be adjusted to the following points from 2017 on onward:• the unwind of the transitional measure will be moved to market & operational variance; • a new set of assumptions will be used to determine the excess return that is part of the operational capital generation;• hybrid costs will be quarterly accrued going forward.Based on 2017 adjustments, the OCC of 2016 would have been €348 million (versus €301 million based on the current method).
Percentage
200
150
100
50
0
Day-onereport
180
7
189194
Operationalcapital
generation
Technicalmovements
Net releaseof capital
Market & operational
developments
Dividend
Organic capital creation: 301 million
2016 afterdividend
2016 beforedividend
46 5 5
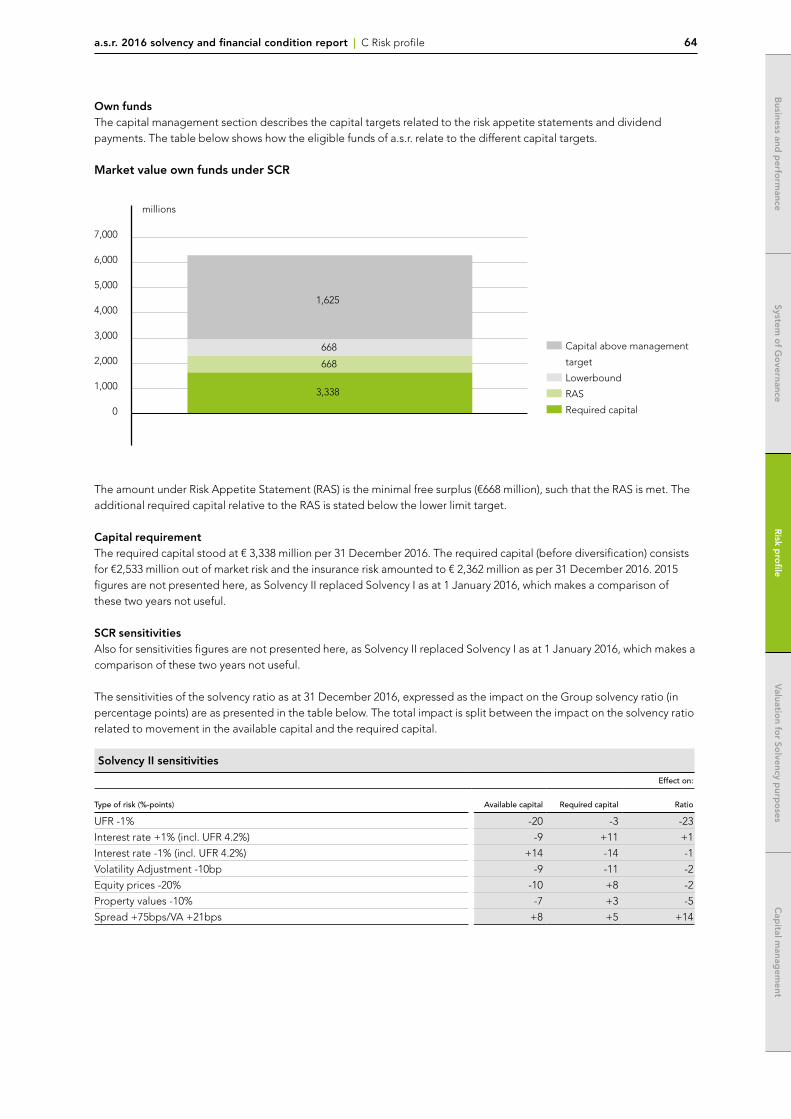
a.s.r. 2016 solvency and financial condition report | C Risk profile 64
System o
f Go
vernanceR
isk pro
fileV
aluation fo
r Solvency p
urpo
sesC
apital m
anagem
entB
usiness and p
erform
ance
Own fundsThe capital management section describes the capital targets related to the risk appetite statements and dividend payments. The table below shows how the eligible funds of a.s.r. relate to the different capital targets.
Market value own funds under SCR
millions
7,000
6,000
5,000
4,000
3,000
2,000
1,000
0
Capital above management
target
Lowerbound
RAS
Required capital
1,625
668
668
3,338
The amount under Risk Appetite Statement (RAS) is the minimal free surplus (€668 million), such that the RAS is met. The additional required capital relative to the RAS is stated below the lower limit target.
Capital requirementThe required capital stood at € 3,338 million per 31 December 2016. The required capital (before diversification) consists for €2,533 million out of market risk and the insurance risk amounted to € 2,362 million as per 31 December 2016. 2015 figures are not presented here, as Solvency II replaced Solvency I as at 1 January 2016, which makes a comparison of these two years not useful.
SCR sensitivitiesAlso for sensitivities figures are not presented here, as Solvency II replaced Solvency I as at 1 January 2016, which makes a comparison of these two years not useful.
The sensitivities of the solvency ratio as at 31 December 2016, expressed as the impact on the Group solvency ratio (in percentage points) are as presented in the table below. The total impact is split between the impact on the solvency ratiorelated to movement in the available capital and the required capital.
Solvency II sensitivities
Effect on:
Type of risk (%-points) Available capital Required capital Ratio
UFR -1% -20 -3 -23
Interest rate +1% (incl. UFR 4.2%) -9 +11 +1
Interest rate -1% (incl. UFR 4.2%) +14 -14 -1
Volatility Adjustment -10bp -9 -11 -2
Equity prices -20% -10 +8 -2
Property values -10% -7 +3 -5
Spread +75bps/VA +21bps +8 +5 +14
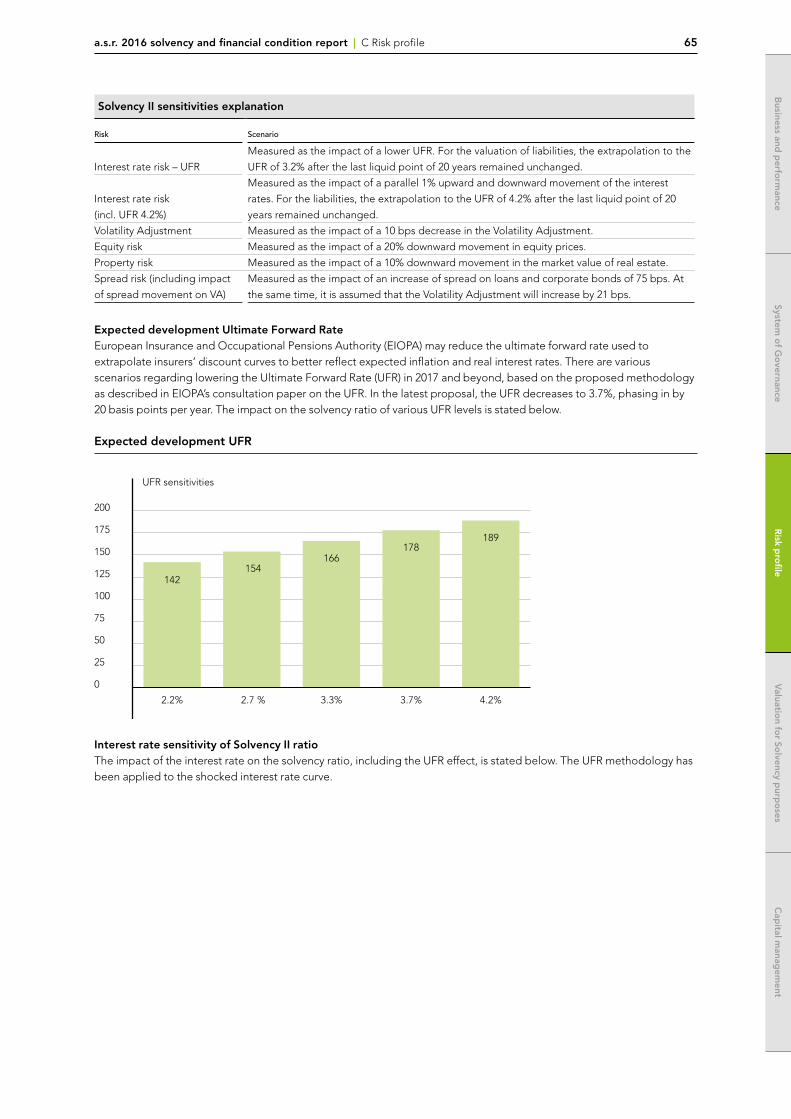
a.s.r. 2016 solvency and financial condition report | C Risk profile 65
System o
f Go
vernance
System o
f Go
vernance
Risk p
rofile
Risk p
rofile
Valuatio
n for So
lvency purp
oses
Valuatio
n for So
lvency purp
oses
Cap
ital manag
ement
Cap
ital manag
ement
Business and
perfo
rmance
Business and
perfo
rmance
Solvency II sensitivities explanation
Risk Scenario
Interest rate risk – UFR
Measured as the impact of a lower UFR. For the valuation of liabilities, the extrapolation to the
UFR of 3.2% after the last liquid point of 20 years remained unchanged.
Interest rate risk
(incl. UFR 4.2%)
Measured as the impact of a parallel 1% upward and downward movement of the interest
rates. For the liabilities, the extrapolation to the UFR of 4.2% after the last liquid point of 20
years remained unchanged.
Volatility Adjustment Measured as the impact of a 10 bps decrease in the Volatility Adjustment.
Equity risk Measured as the impact of a 20% downward movement in equity prices.
Property risk Measured as the impact of a 10% downward movement in the market value of real estate.
Spread risk (including impact
of spread movement on VA)
Measured as the impact of an increase of spread on loans and corporate bonds of 75 bps. At
the same time, it is assumed that the Volatility Adjustment will increase by 21 bps.
Expected development Ultimate Forward RateEuropean Insurance and Occupational Pensions Authority (EIOPA) may reduce the ultimate forward rate used to extrapolate insurers’ discount curves to better reflect expected inflation and real interest rates. There are various scenarios regarding lowering the Ultimate Forward Rate (UFR) in 2017 and beyond, based on the proposed methodology as described in EIOPA’s consultation paper on the UFR. In the latest proposal, the UFR decreases to 3.7%, phasing in by 20 basis points per year. The impact on the solvency ratio of various UFR levels is stated below.
Expected development UFR
UFR sensitivities
200
175
150
125
100
75
50
25
0
2.2% 2.7 % 3.3% 3.7% 4.2%
142154
166178
189
Interest rate sensitivity of Solvency II ratio The impact of the interest rate on the solvency ratio, including the UFR effect, is stated below. The UFR methodology has been applied to the shocked interest rate curve.
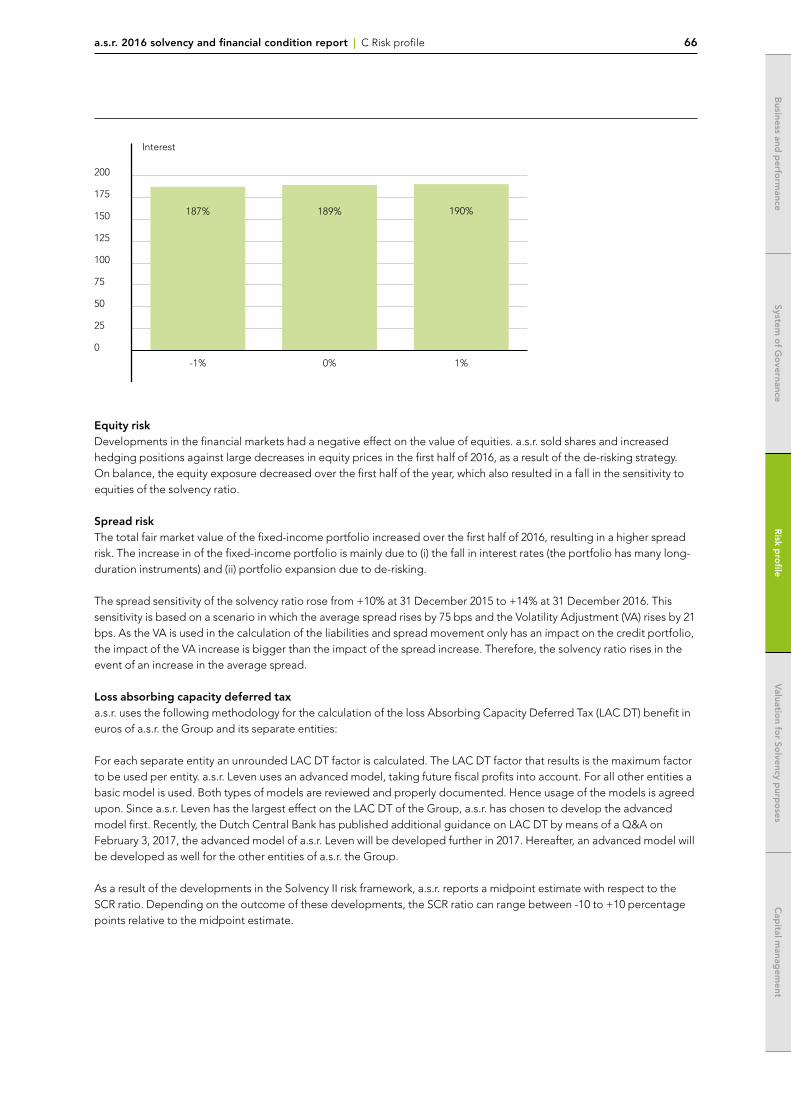
a.s.r. 2016 solvency and financial condition report | C Risk profile 66
System o
f Go
vernanceR
isk pro
fileV
aluation fo
r Solvency p
urpo
sesC
apital m
anagem
entB
usiness and p
erform
ance
Interest
200
175
150
125
100
75
50
25
0
-1% 0% 1%
187% 189% 190%
Equity riskDevelopments in the financial markets had a negative effect on the value of equities. a.s.r. sold shares and increased hedging positions against large decreases in equity prices in the first half of 2016, as a result of the de-risking strategy. On balance, the equity exposure decreased over the first half of the year, which also resulted in a fall in the sensitivity to equities of the solvency ratio.
Spread riskThe total fair market value of the fixed-income portfolio increased over the first half of 2016, resulting in a higher spread risk. The increase in of the fixed-income portfolio is mainly due to (i) the fall in interest rates (the portfolio has many long-duration instruments) and (ii) portfolio expansion due to de-risking.
The spread sensitivity of the solvency ratio rose from +10% at 31 December 2015 to +14% at 31 December 2016. This sensitivity is based on a scenario in which the average spread rises by 75 bps and the Volatility Adjustment (VA) rises by 21 bps. As the VA is used in the calculation of the liabilities and spread movement only has an impact on the credit portfolio, the impact of the VA increase is bigger than the impact of the spread increase. Therefore, the solvency ratio rises in the event of an increase in the average spread.
Loss absorbing capacity deferred taxa.s.r. uses the following methodology for the calculation of the loss Absorbing Capacity Deferred Tax (LAC DT) benefit in euros of a.s.r. the Group and its separate entities:
For each separate entity an unrounded LAC DT factor is calculated. The LAC DT factor that results is the maximum factor to be used per entity. a.s.r. Leven uses an advanced model, taking future fiscal profits into account. For all other entities a basic model is used. Both types of models are reviewed and properly documented. Hence usage of the models is agreed upon. Since a.s.r. Leven has the largest effect on the LAC DT of the Group, a.s.r. has chosen to develop the advanced model first. Recently, the Dutch Central Bank has published additional guidance on LAC DT by means of a Q&A on February 3, 2017, the advanced model of a.s.r. Leven will be developed further in 2017. Hereafter, an advanced model will be developed as well for the other entities of a.s.r. the Group.
As a result of the developments in the Solvency II risk framework, a.s.r. reports a midpoint estimate with respect to the SCR ratio. Depending on the outcome of these developments, the SCR ratio can range between -10 to +10 percentage points relative to the midpoint estimate.
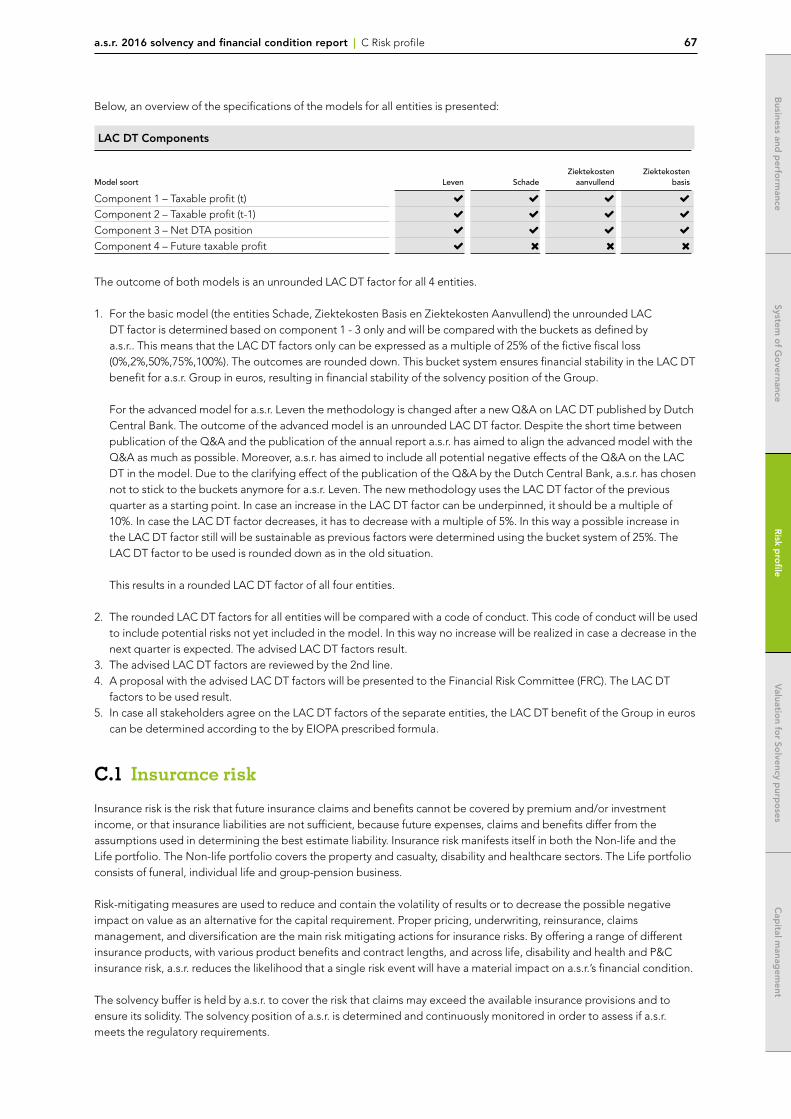
a.s.r. 2016 solvency and financial condition report | C Risk profile 67
System o
f Go
vernance
System o
f Go
vernance
Risk p
rofile
Risk p
rofile
Valuatio
n for So
lvency purp
oses
Valuatio
n for So
lvency purp
oses
Cap
ital manag
ement
Cap
ital manag
ement
Business and
perfo
rmance
Business and
perfo
rmance
Below, an overview of the specifications of the models for all entities is presented:
LAC DT Components
Model soort Leven SchadeZiektekosten
aanvullendZiektekosten
basis
Component 1 – Taxable profit (t)
Component 2 – Taxable profit (t-1)
Component 3 – Net DTA position
Component 4 – Future taxable profit
The outcome of both models is an unrounded LAC DT factor for all 4 entities.
1. For the basic model (the entities Schade, Ziektekosten Basis en Ziektekosten Aanvullend) the unrounded LAC DT factor is determined based on component 1 - 3 only and will be compared with the buckets as defined by a.s.r.. This means that the LAC DT factors only can be expressed as a multiple of 25% of the fictive fiscal loss (0%,2%,50%,75%,100%). The outcomes are rounded down. This bucket system ensures financial stability in the LAC DT benefit for a.s.r. Group in euros, resulting in financial stability of the solvency position of the Group.
For the advanced model for a.s.r. Leven the methodology is changed after a new Q&A on LAC DT published by Dutch Central Bank. The outcome of the advanced model is an unrounded LAC DT factor. Despite the short time between publication of the Q&A and the publication of the annual report a.s.r. has aimed to align the advanced model with the Q&A as much as possible. Moreover, a.s.r. has aimed to include all potential negative effects of the Q&A on the LAC DT in the model. Due to the clarifying effect of the publication of the Q&A by the Dutch Central Bank, a.s.r. has chosen not to stick to the buckets anymore for a.s.r. Leven. The new methodology uses the LAC DT factor of the previous quarter as a starting point. In case an increase in the LAC DT factor can be underpinned, it should be a multiple of 10%. In case the LAC DT factor decreases, it has to decrease with a multiple of 5%. In this way a possible increase in the LAC DT factor still will be sustainable as previous factors were determined using the bucket system of 25%. The LAC DT factor to be used is rounded down as in the old situation.
This results in a rounded LAC DT factor of all four entities.
2. The rounded LAC DT factors for all entities will be compared with a code of conduct. This code of conduct will be used to include potential risks not yet included in the model. In this way no increase will be realized in case a decrease in the next quarter is expected. The advised LAC DT factors result.
3. The advised LAC DT factors are reviewed by the 2nd line. 4. A proposal with the advised LAC DT factors will be presented to the Financial Risk Committee (FRC). The LAC DT
factors to be used result.5. In case all stakeholders agree on the LAC DT factors of the separate entities, the LAC DT benefit of the Group in euros
can be determined according to the by EIOPA prescribed formula.
C.1 Insurance risk
Insurance risk is the risk that future insurance claims and benefits cannot be covered by premium and/or investment income, or that insurance liabilities are not sufficient, because future expenses, claims and benefits differ from the assumptions used in determining the best estimate liability. Insurance risk manifests itself in both the Non-life and the Life portfolio. The Non-life portfolio covers the property and casualty, disability and healthcare sectors. The Life portfolio consists of funeral, individual life and group-pension business.
Risk-mitigating measures are used to reduce and contain the volatility of results or to decrease the possible negative impact on value as an alternative for the capital requirement. Proper pricing, underwriting, reinsurance, claims management, and diversification are the main risk mitigating actions for insurance risks. By offering a range of different insurance products, with various product benefits and contract lengths, and across life, disability and health and P&C insurance risk, a.s.r. reduces the likelihood that a single risk event will have a material impact on a.s.r.’s financial condition.
The solvency buffer is held by a.s.r. to cover the risk that claims may exceed the available insurance provisions and to ensure its solidity. The solvency position of a.s.r. is determined and continuously monitored in order to assess if a.s.r. meets the regulatory requirements.
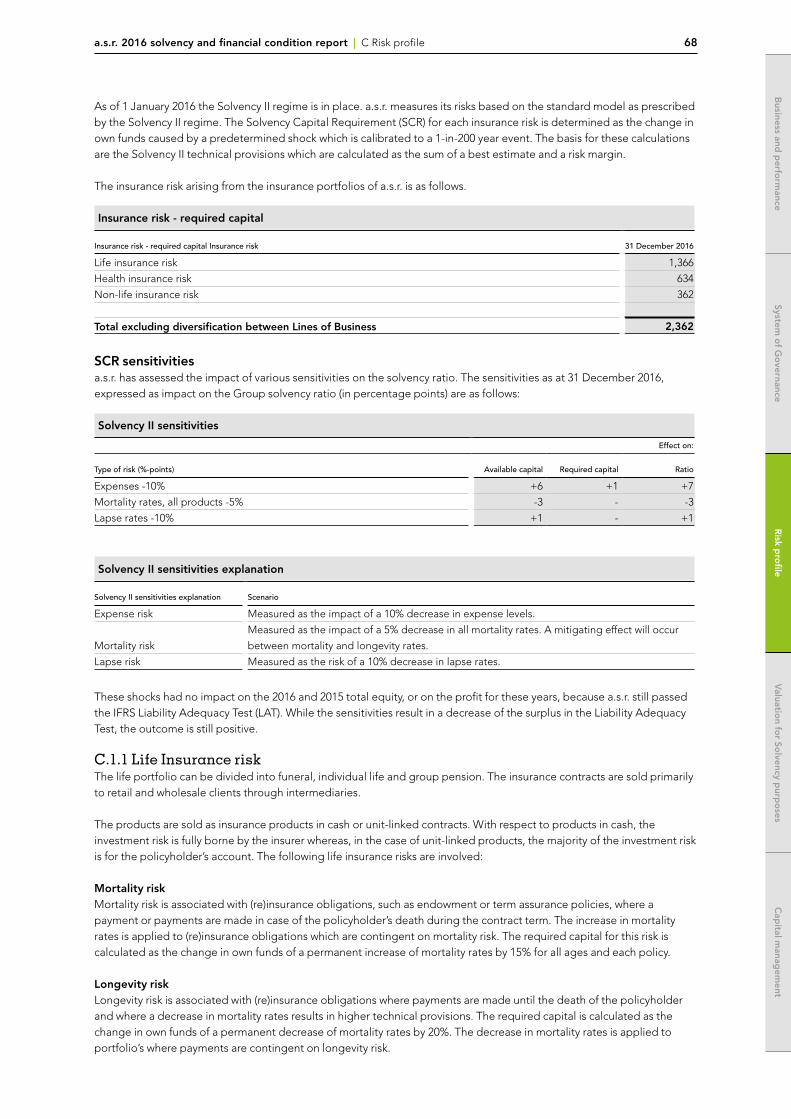
a.s.r. 2016 solvency and financial condition report | C Risk profile 68
System o
f Go
vernanceR
isk pro
fileV
aluation fo
r Solvency p
urpo
sesC
apital m
anagem
entB
usiness and p
erform
ance
As of 1 January 2016 the Solvency II regime is in place. a.s.r. measures its risks based on the standard model as prescribed by the Solvency II regime. The Solvency Capital Requirement (SCR) for each insurance risk is determined as the change in own funds caused by a predetermined shock which is calibrated to a 1-in-200 year event. The basis for these calculations are the Solvency II technical provisions which are calculated as the sum of a best estimate and a risk margin.
The insurance risk arising from the insurance portfolios of a.s.r. is as follows.
Insurance risk - required capital
Insurance risk - required capital Insurance risk 31 December 2016
Life insurance risk 1,366
Health insurance risk 634
Non-life insurance risk 362
Total excluding diversification between Lines of Business 2,362
SCR sensitivitiesa.s.r. has assessed the impact of various sensitivities on the solvency ratio. The sensitivities as at 31 December 2016, expressed as impact on the Group solvency ratio (in percentage points) are as follows:
Solvency II sensitivities
Effect on:
Type of risk (%-points) Available capital Required capital Ratio
Expenses -10% +6 +1 +7
Mortality rates, all products -5% -3 - -3
Lapse rates -10% +1 - +1
Solvency II sensitivities explanation
Solvency II sensitivities explanation Scenario
Expense risk Measured as the impact of a 10% decrease in expense levels.
Mortality risk
Measured as the impact of a 5% decrease in all mortality rates. A mitigating effect will occur
between mortality and longevity rates.
Lapse risk Measured as the risk of a 10% decrease in lapse rates.
These shocks had no impact on the 2016 and 2015 total equity, or on the profit for these years, because a.s.r. still passed the IFRS Liability Adequacy Test (LAT). While the sensitivities result in a decrease of the surplus in the Liability Adequacy Test, the outcome is still positive.
C.1.1 Life Insurance riskThe life portfolio can be divided into funeral, individual life and group pension. The insurance contracts are sold primarily to retail and wholesale clients through intermediaries.
The products are sold as insurance products in cash or unit-linked contracts. With respect to products in cash, the investment risk is fully borne by the insurer whereas, in the case of unit-linked products, the majority of the investment risk is for the policyholder’s account. The following life insurance risks are involved:
Mortality riskMortality risk is associated with (re)insurance obligations, such as endowment or term assurance policies, where a payment or payments are made in case of the policyholder’s death during the contract term. The increase in mortality rates is applied to (re)insurance obligations which are contingent on mortality risk. The required capital for this risk is calculated as the change in own funds of a permanent increase of mortality rates by 15% for all ages and each policy.
Longevity riskLongevity risk is associated with (re)insurance obligations where payments are made until the death of the policyholder and where a decrease in mortality rates results in higher technical provisions. The required capital is calculated as the change in own funds of a permanent decrease of mortality rates by 20%. The decrease in mortality rates is applied to portfolio’s where payments are contingent on longevity risk.
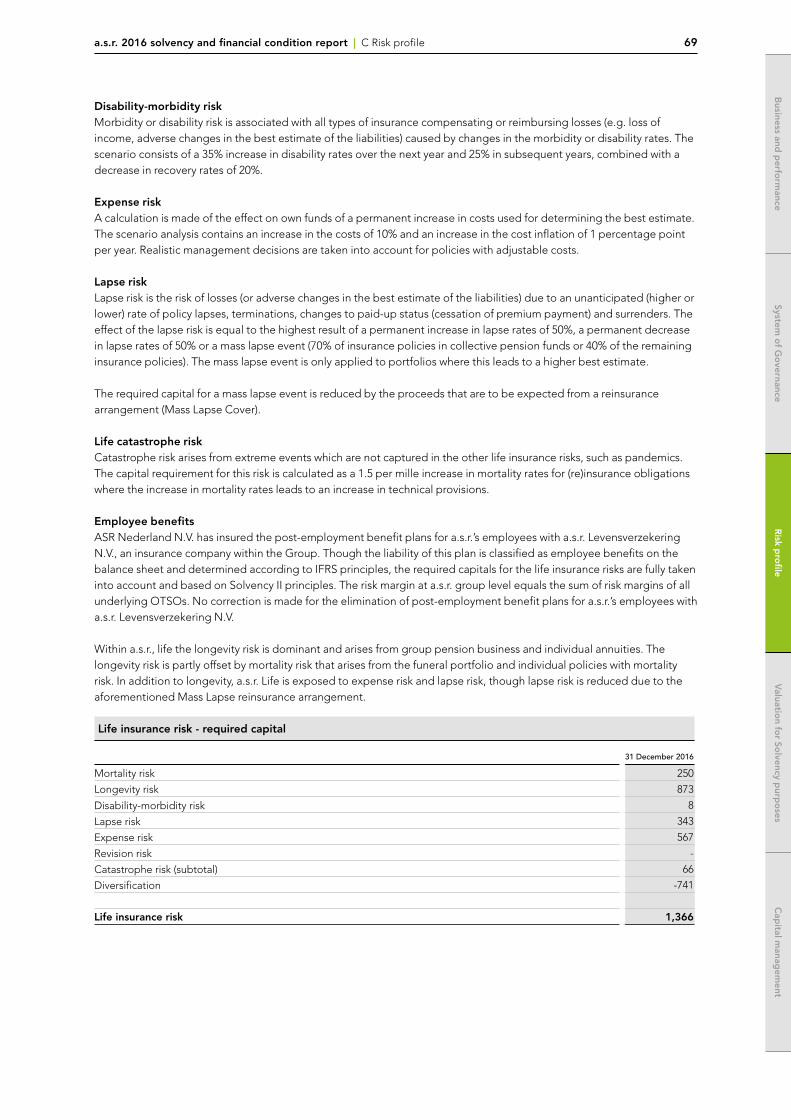
a.s.r. 2016 solvency and financial condition report | C Risk profile 69
System o
f Go
vernance
System o
f Go
vernance
Risk p
rofile
Risk p
rofile
Valuatio
n for So
lvency purp
oses
Valuatio
n for So
lvency purp
oses
Cap
ital manag
ement
Cap
ital manag
ement
Business and
perfo
rmance
Business and
perfo
rmance
Disability-morbidity riskMorbidity or disability risk is associated with all types of insurance compensating or reimbursing losses (e.g. loss of income, adverse changes in the best estimate of the liabilities) caused by changes in the morbidity or disability rates. The scenario consists of a 35% increase in disability rates over the next year and 25% in subsequent years, combined with a decrease in recovery rates of 20%.
Expense riskA calculation is made of the effect on own funds of a permanent increase in costs used for determining the best estimate. The scenario analysis contains an increase in the costs of 10% and an increase in the cost inflation of 1 percentage point per year. Realistic management decisions are taken into account for policies with adjustable costs.
Lapse risk Lapse risk is the risk of losses (or adverse changes in the best estimate of the liabilities) due to an unanticipated (higher or lower) rate of policy lapses, terminations, changes to paid-up status (cessation of premium payment) and surrenders. The effect of the lapse risk is equal to the highest result of a permanent increase in lapse rates of 50%, a permanent decrease in lapse rates of 50% or a mass lapse event (70% of insurance policies in collective pension funds or 40% of the remaining insurance policies). The mass lapse event is only applied to portfolios where this leads to a higher best estimate.
The required capital for a mass lapse event is reduced by the proceeds that are to be expected from a reinsurance arrangement (Mass Lapse Cover).
Life catastrophe risk Catastrophe risk arises from extreme events which are not captured in the other life insurance risks, such as pandemics. The capital requirement for this risk is calculated as a 1.5 per mille increase in mortality rates for (re)insurance obligations where the increase in mortality rates leads to an increase in technical provisions.
Employee benefitsASR Nederland N.V. has insured the post-employment benefit plans for a.s.r.’s employees with a.s.r. Levensverzekering N.V., an insurance company within the Group. Though the liability of this plan is classified as employee benefits on the balance sheet and determined according to IFRS principles, the required capitals for the life insurance risks are fully taken into account and based on Solvency II principles. The risk margin at a.s.r. group level equals the sum of risk margins of all underlying OTSOs. No correction is made for the elimination of post-employment benefit plans for a.s.r.’s employees with a.s.r. Levensverzekering N.V.
Within a.s.r., life the longevity risk is dominant and arises from group pension business and individual annuities. The longevity risk is partly offset by mortality risk that arises from the funeral portfolio and individual policies with mortality risk. In addition to longevity, a.s.r. Life is exposed to expense risk and lapse risk, though lapse risk is reduced due to the aforementioned Mass Lapse reinsurance arrangement.
Life insurance risk - required capital
31 December 2016
Mortality risk 250
Longevity risk 873
Disability-morbidity risk 8
Lapse risk 343
Expense risk 567
Revision risk -
Catastrophe risk (subtotal) 66
Diversification -741
Life insurance risk 1,366
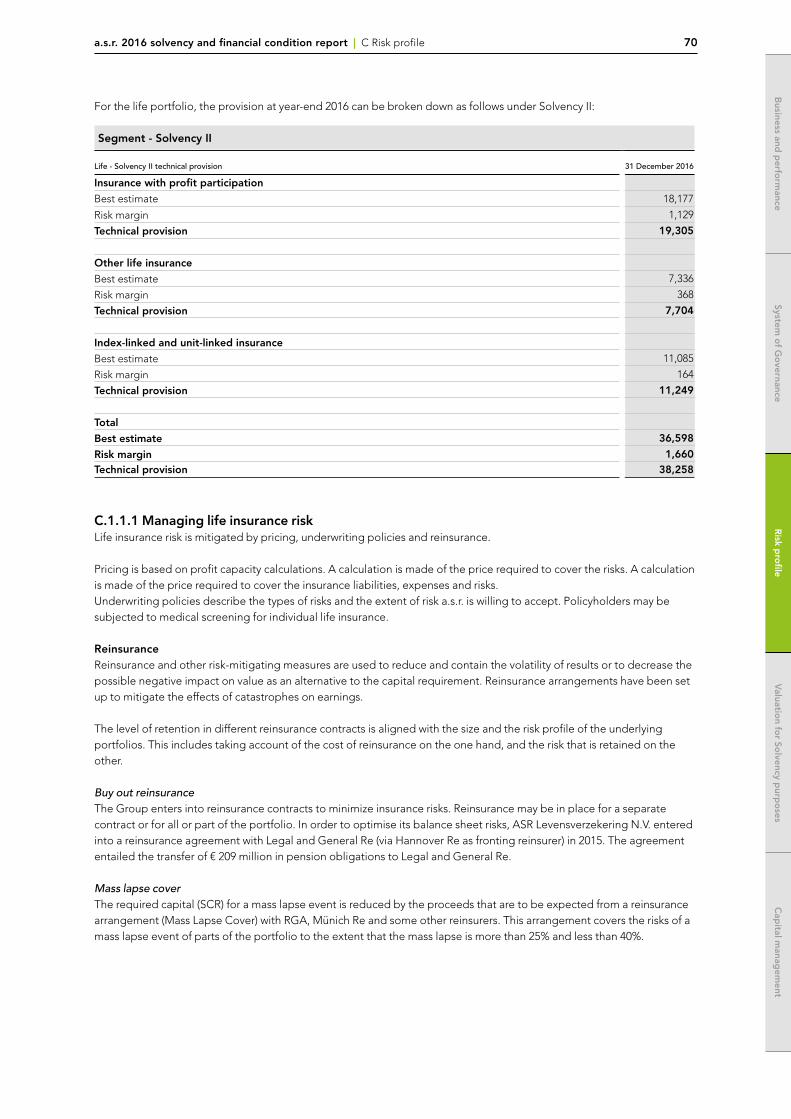
a.s.r. 2016 solvency and financial condition report | C Risk profile 70
System o
f Go
vernanceR
isk pro
fileV
aluation fo
r Solvency p
urpo
sesC
apital m
anagem
entB
usiness and p
erform
ance
For the life portfolio, the provision at year-end 2016 can be broken down as follows under Solvency II:
Segment - Solvency II
Life - Solvency II technical provision 31 December 2016
Insurance with profit participation
Best estimate 18,177
Risk margin 1,129
Technical provision 19,305
Other life insurance
Best estimate 7,336
Risk margin 368
Technical provision 7,704
Index-linked and unit-linked insurance
Best estimate 11,085
Risk margin 164
Technical provision 11,249
Total
Best estimate 36,598
Risk margin 1,660Technical provision 38,258
C.1.1.1 Managing life insurance riskLife insurance risk is mitigated by pricing, underwriting policies and reinsurance.
Pricing is based on profit capacity calculations. A calculation is made of the price required to cover the risks. A calculation is made of the price required to cover the insurance liabilities, expenses and risks.Underwriting policies describe the types of risks and the extent of risk a.s.r. is willing to accept. Policyholders may be subjected to medical screening for individual life insurance.
ReinsuranceReinsurance and other risk-mitigating measures are used to reduce and contain the volatility of results or to decrease the possible negative impact on value as an alternative to the capital requirement. Reinsurance arrangements have been set up to mitigate the effects of catastrophes on earnings.
The level of retention in different reinsurance contracts is aligned with the size and the risk profile of the underlying portfolios. This includes taking account of the cost of reinsurance on the one hand, and the risk that is retained on the other.
Buy out reinsuranceThe Group enters into reinsurance contracts to minimize insurance risks. Reinsurance may be in place for a separate contract or for all or part of the portfolio. In order to optimise its balance sheet risks, ASR Levensverzekering N.V. entered into a reinsurance agreement with Legal and General Re (via Hannover Re as fronting reinsurer) in 2015. The agreement entailed the transfer of € 209 million in pension obligations to Legal and General Re.
Mass lapse coverThe required capital (SCR) for a mass lapse event is reduced by the proceeds that are to be expected from a reinsurance arrangement (Mass Lapse Cover) with RGA, Münich Re and some other reinsurers. This arrangement covers the risks of a mass lapse event of parts of the portfolio to the extent that the mass lapse is more than 25% and less than 40%.
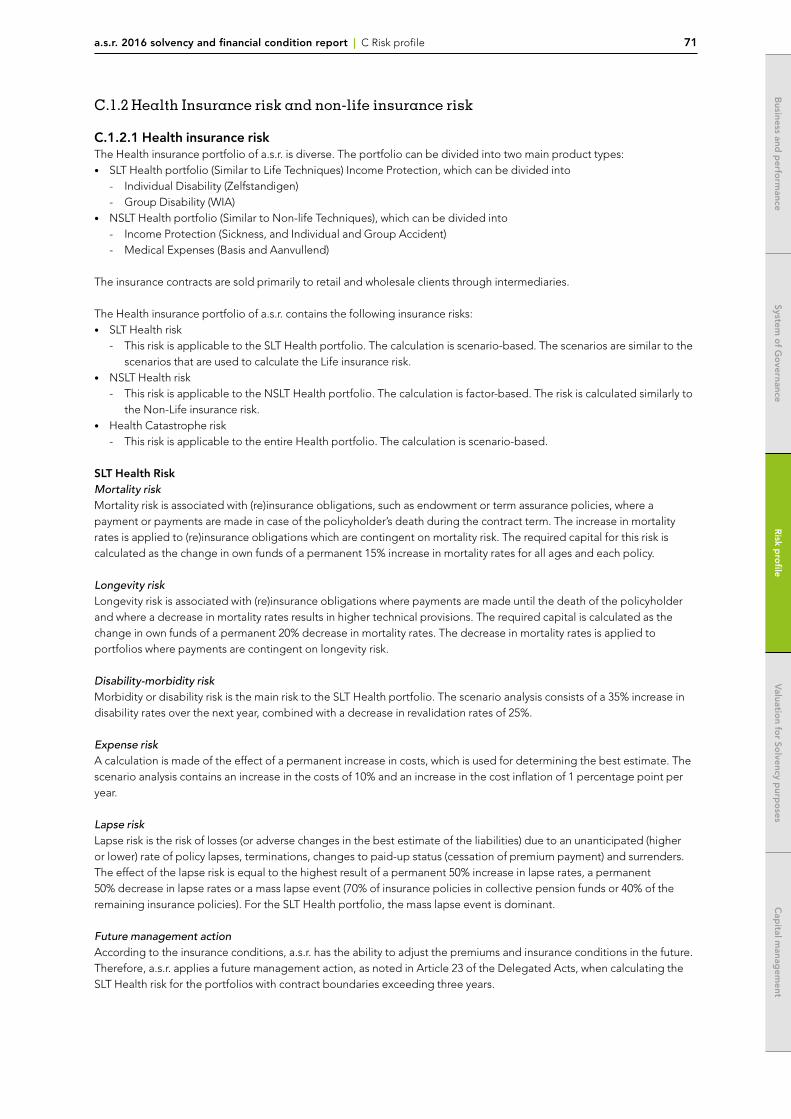
a.s.r. 2016 solvency and financial condition report | C Risk profile 71
System o
f Go
vernance
System o
f Go
vernance
Risk p
rofile
Risk p
rofile
Valuatio
n for So
lvency purp
oses
Valuatio
n for So
lvency purp
oses
Cap
ital manag
ement
Cap
ital manag
ement
Business and
perfo
rmance
Business and
perfo
rmance
C.1.2 Health Insurance risk and non-life insurance risk
C.1.2.1 Health insurance riskThe Health insurance portfolio of a.s.r. is diverse. The portfolio can be divided into two main product types: • SLT Health portfolio (Similar to Life Techniques) Income Protection, which can be divided into
- Individual Disability (Zelfstandigen) - Group Disability (WIA)
• NSLT Health portfolio (Similar to Non-life Techniques), which can be divided into - Income Protection (Sickness, and Individual and Group Accident) - Medical Expenses (Basis and Aanvullend)
The insurance contracts are sold primarily to retail and wholesale clients through intermediaries.
The Health insurance portfolio of a.s.r. contains the following insurance risks:• SLT Health risk
- This risk is applicable to the SLT Health portfolio. The calculation is scenario-based. The scenarios are similar to the scenarios that are used to calculate the Life insurance risk.
• NSLT Health risk - This risk is applicable to the NSLT Health portfolio. The calculation is factor-based. The risk is calculated similarly to
the Non-Life insurance risk.• Health Catastrophe risk
- This risk is applicable to the entire Health portfolio. The calculation is scenario-based.
SLT Health RiskMortality riskMortality risk is associated with (re)insurance obligations, such as endowment or term assurance policies, where a payment or payments are made in case of the policyholder’s death during the contract term. The increase in mortality rates is applied to (re)insurance obligations which are contingent on mortality risk. The required capital for this risk is calculated as the change in own funds of a permanent 15% increase in mortality rates for all ages and each policy.
Longevity riskLongevity risk is associated with (re)insurance obligations where payments are made until the death of the policyholder and where a decrease in mortality rates results in higher technical provisions. The required capital is calculated as the change in own funds of a permanent 20% decrease in mortality rates. The decrease in mortality rates is applied to portfolios where payments are contingent on longevity risk.
Disability-morbidity riskMorbidity or disability risk is the main risk to the SLT Health portfolio. The scenario analysis consists of a 35% increase in disability rates over the next year, combined with a decrease in revalidation rates of 25%.
Expense riskA calculation is made of the effect of a permanent increase in costs, which is used for determining the best estimate. The scenario analysis contains an increase in the costs of 10% and an increase in the cost inflation of 1 percentage point per year.
Lapse risk Lapse risk is the risk of losses (or adverse changes in the best estimate of the liabilities) due to an unanticipated (higher or lower) rate of policy lapses, terminations, changes to paid-up status (cessation of premium payment) and surrenders. The effect of the lapse risk is equal to the highest result of a permanent 50% increase in lapse rates, a permanent 50% decrease in lapse rates or a mass lapse event (70% of insurance policies in collective pension funds or 40% of the remaining insurance policies). For the SLT Health portfolio, the mass lapse event is dominant.
Future management actionAccording to the insurance conditions, a.s.r. has the ability to adjust the premiums and insurance conditions in the future. Therefore, a.s.r. applies a future management action, as noted in Article 23 of the Delegated Acts, when calculating the SLT Health risk for the portfolios with contract boundaries exceeding three years.
a.s.r. 2016 solvency and financial condition report | C Risk profile 72
System o
f Go
vernanceR
isk pro
fileV
aluation fo
r Solvency p
urpo
sesC
apital m
anagem
entB
usiness and p
erform
ance
NSLT Health RiskPremium and reserve riskThe premium risk is the risk that the premium is not adequate for the underwritten risk. The premium risk is calculated over the maximum of the expected written premium of the next year, and the written premium of the current year.
NSLT lapse riskThe basic and additional health insurance are compulsory insurance contracts for one year without intermediate possibility of termination and therefore lapse risk is negligible for the basic health insurance.
Health catastrophe riskMedical ExpenseA health catastrophe for NSLT Health portfolio is an unexpected future event with a duration of one year. The risk is determined ultimo year. The amount of catastrophe risk is apparent from the number of insured and parameters for mass accident scenario and pandemic scenario that have been approved by Dutch Central Bank in consultation with Health Insurers Netherlands. Accident concentration is not applicable for NSLT Health. The catastrophe risk has a projection of one year (T) following from the contract boundary of one year in accordance with the Dutch Health Insurance Act. After year T the risk is ‘zero’. Catastrophe risk for AV equals zero.
Income ProtectionThis component is calculated for policies for which an increase in mortality rates or morbidity rates or disability rates leads to an increase in the best estimate. There are three scenarios, which are calculated for all SLT Health and portfolios.
• Mass accident scenario In this scenario, an accident takes place during a major public event. The risk is that 10% of the attendees are killed, 1.5% are permanently disabled, 5% are disabled for 10 years, 13.5% are disabled for 12 months and 30% need medical attention.
• Accident concentration scenario In this scenario, an accident takes place on site, with the most of our insured at the same location. The risk is that 10% of those present are killed, 1.5% are permanently disabled, 5% are disabled for ten years, 13.5% are disabled for 12 months and 30% need medical attention.
• Pandemic scenario In this scenario, there is a pandemic, which causes 1% of those affected to be hospitalized and 20% to see a local practitioner.
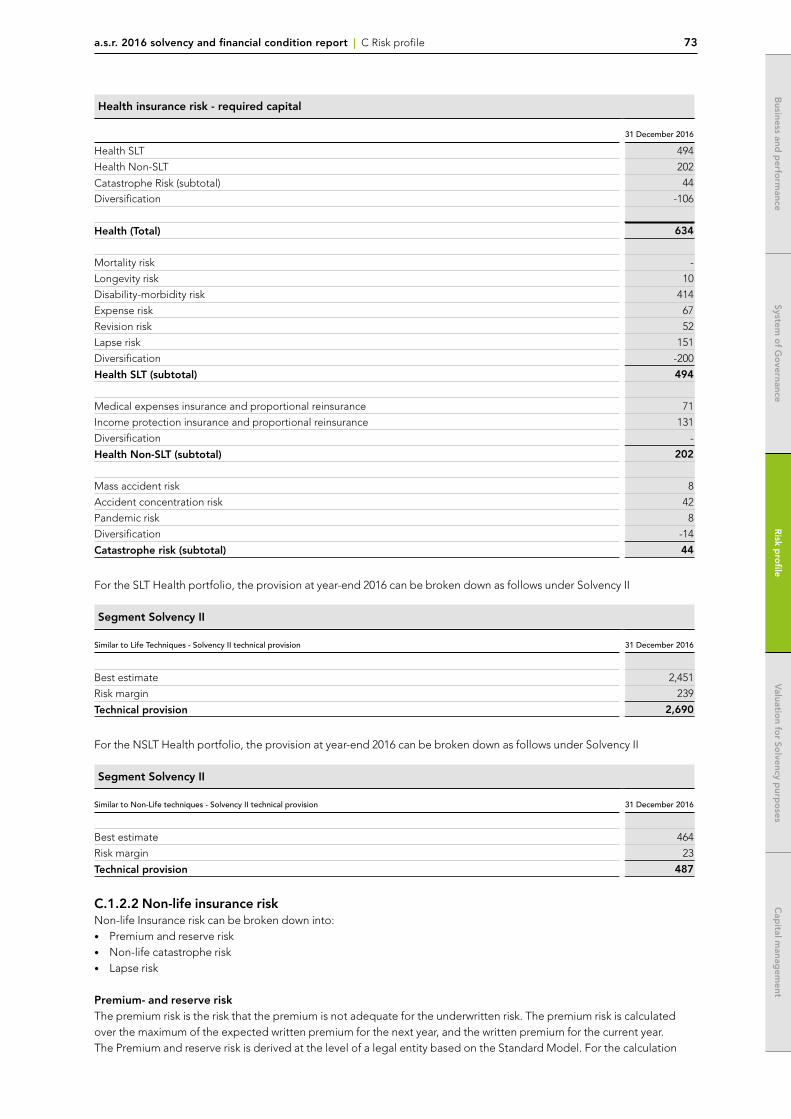
a.s.r. 2016 solvency and financial condition report | C Risk profile 73
System o
f Go
vernance
System o
f Go
vernance
Risk p
rofile
Risk p
rofile
Valuatio
n for So
lvency purp
oses
Valuatio
n for So
lvency purp
oses
Cap
ital manag
ement
Cap
ital manag
ement
Business and
perfo
rmance
Business and
perfo
rmance
Health insurance risk - required capital
31 December 2016
Health SLT 494
Health Non-SLT 202
Catastrophe Risk (subtotal) 44
Diversification -106
Health (Total) 634
Mortality risk -
Longevity risk 10
Disability-morbidity risk 414
Expense risk 67
Revision risk 52
Lapse risk 151
Diversification -200
Health SLT (subtotal) 494
Medical expenses insurance and proportional reinsurance 71
Income protection insurance and proportional reinsurance 131
Diversification -
Health Non-SLT (subtotal) 202
Mass accident risk 8
Accident concentration risk 42
Pandemic risk 8
Diversification -14
Catastrophe risk (subtotal) 44
For the SLT Health portfolio, the provision at year-end 2016 can be broken down as follows under Solvency II
Segment Solvency II
Similar to Life Techniques - Solvency II technical provision 31 December 2016
Best estimate 2,451
Risk margin 239
Technical provision 2,690
For the NSLT Health portfolio, the provision at year-end 2016 can be broken down as follows under Solvency II
Segment Solvency II
Similar to Non-Life techniques - Solvency II technical provision 31 December 2016
Best estimate 464
Risk margin 23
Technical provision 487
C.1.2.2 Non-life insurance riskNon-life Insurance risk can be broken down into:• Premium and reserve risk• Non-life catastrophe risk• Lapse risk
Premium- and reserve riskThe premium risk is the risk that the premium is not adequate for the underwritten risk. The premium risk is calculated over the maximum of the expected written premium for the next year, and the written premium for the current year. The Premium and reserve risk is derived at the level of a legal entity based on the Standard Model. For the calculation
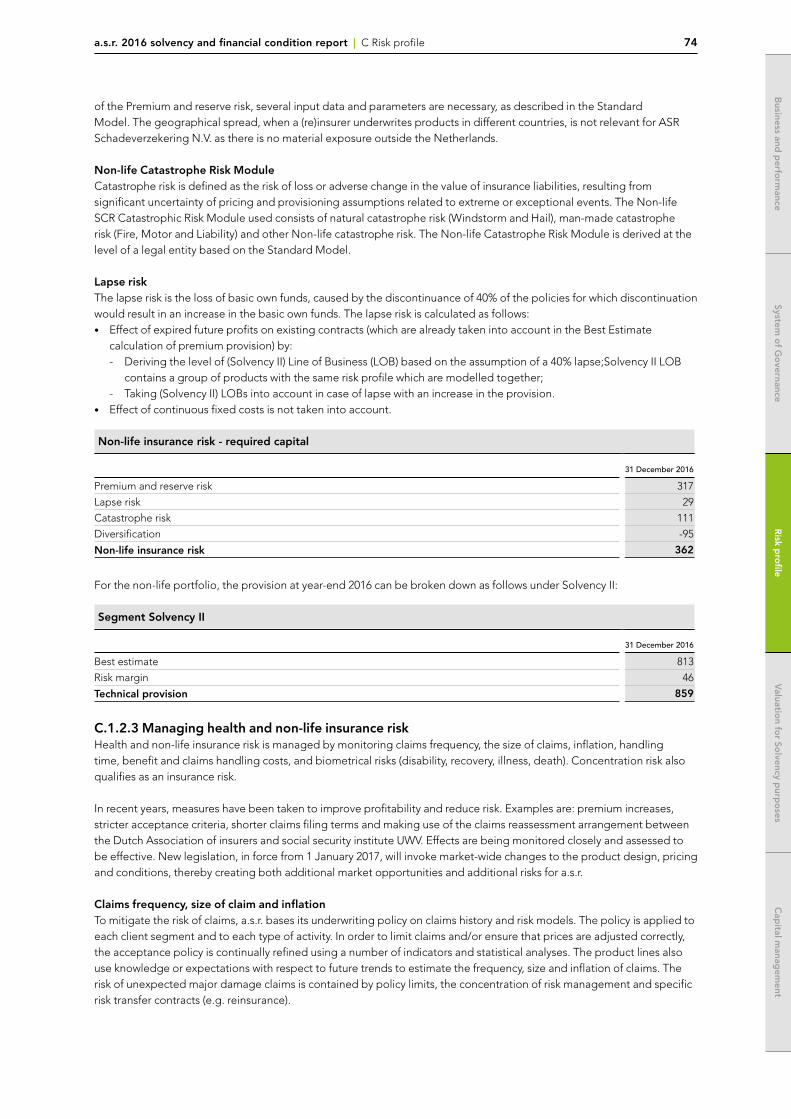
a.s.r. 2016 solvency and financial condition report | C Risk profile 74
System o
f Go
vernanceR
isk pro
fileV
aluation fo
r Solvency p
urpo
sesC
apital m
anagem
entB
usiness and p
erform
ance
of the Premium and reserve risk, several input data and parameters are necessary, as described in the Standard Model. The geographical spread, when a (re)insurer underwrites products in different countries, is not relevant for ASR Schadeverzekering N.V. as there is no material exposure outside the Netherlands.
Non-life Catastrophe Risk ModuleCatastrophe risk is defined as the risk of loss or adverse change in the value of insurance liabilities, resulting from significant uncertainty of pricing and provisioning assumptions related to extreme or exceptional events. The Non-life SCR Catastrophic Risk Module used consists of natural catastrophe risk (Windstorm and Hail), man-made catastrophe risk (Fire, Motor and Liability) and other Non-life catastrophe risk. The Non-life Catastrophe Risk Module is derived at the level of a legal entity based on the Standard Model.
Lapse riskThe lapse risk is the loss of basic own funds, caused by the discontinuance of 40% of the policies for which discontinuation would result in an increase in the basic own funds. The lapse risk is calculated as follows:• Effect of expired future profits on existing contracts (which are already taken into account in the Best Estimate
calculation of premium provision) by: - Deriving the level of (Solvency II) Line of Business (LOB) based on the assumption of a 40% lapse;Solvency II LOB
contains a group of products with the same risk profile which are modelled together; - Taking (Solvency II) LOBs into account in case of lapse with an increase in the provision.
• Effect of continuous fixed costs is not taken into account.
Non-life insurance risk - required capital
31 December 2016
Premium and reserve risk 317
Lapse risk 29
Catastrophe risk 111
Diversification -95
Non-life insurance risk 362
For the non-life portfolio, the provision at year-end 2016 can be broken down as follows under Solvency II:
Segment Solvency II
31 December 2016
Best estimate 813
Risk margin 46
Technical provision 859
C.1.2.3 Managing health and non-life insurance riskHealth and non-life insurance risk is managed by monitoring claims frequency, the size of claims, inflation, handling time, benefit and claims handling costs, and biometrical risks (disability, recovery, illness, death). Concentration risk also qualifies as an insurance risk.
In recent years, measures have been taken to improve profitability and reduce risk. Examples are: premium increases, stricter acceptance criteria, shorter claims filing terms and making use of the claims reassessment arrangement between the Dutch Association of insurers and social security institute UWV. Effects are being monitored closely and assessed to be effective. New legislation, in force from 1 January 2017, will invoke market-wide changes to the product design, pricing and conditions, thereby creating both additional market opportunities and additional risks for a.s.r.
Claims frequency, size of claim and inflationTo mitigate the risk of claims, a.s.r. bases its underwriting policy on claims history and risk models. The policy is applied to each client segment and to each type of activity. In order to limit claims and/or ensure that prices are adjusted correctly, the acceptance policy is continually refined using a number of indicators and statistical analyses. The product lines also use knowledge or expectations with respect to future trends to estimate the frequency, size and inflation of claims. The risk of unexpected major damage claims is contained by policy limits, the concentration of risk management and specific risk transfer contracts (e.g. reinsurance).
a.s.r. 2016 solvency and financial condition report | C Risk profile 75
System o
f Go
vernance
System o
f Go
vernance
Risk p
rofile
Risk p
rofile
Valuatio
n for So
lvency purp
oses
Valuatio
n for So
lvency purp
oses
Cap
ital manag
ement
Cap
ital manag
ement
Business and
perfo
rmance
Business and
perfo
rmance
Handling timeThe time required for handling and settling claims is an important factor. The settlement of claims that have a long handling time, such as liability claims, can take many years. Analyses are performed regularly and based on a.s.r.’s experience in similar cases, historical trends – such as the pattern of liabilities – increases in risk exposure, payment of damages, the scale of current and not yet settled damage claims, court rulings and economic conditions.
Benefit and claims handling costsTaking estimated future inflation into account, benefit and claims handling costs are managed on the basis of regular reviews and related actions.
Disability riskDisability risk is controlled by means of regular evaluation of historical claims patterns, expected future developments and price adjustments. Disability risk is mitigated by a.s.r. through underwriting criteria and a proactive reintegration policy. a.s.r. also mitigates its disability risk through suitable reinsurance.
Concentration riskGeographically, the risk exposure of a.s.r. on its health and non-life portfolio is almost entirely concentrated in the Netherlands. Concentration of insurance risks is particularly prevalent in the fire risk portfolio (i.e. home and content, with storm risk forming the most important factor). Storm risk is managed by means of suitable reinsurance (see also ‘Reinsurance’).
There is also a concentration of risk in group disability schemes. Group disability contracts are underwritten within the scope of disability cover for employees in the Netherlands (WIA).
ReinsuranceWhen deemed effective in terms of capital relief versus costs incurred, a.s.r. enters into reinsurance agreements to mitigate non-life insurance risks. Reinsurance can be taken out for each separate claim (per risk), for the accumulation of claims due to natural disasters or to human actions (per event), or for both these risks.
The level of retention in the various reinsurance contracts is aligned with the size and the risk profile of the underlying portfolios, taking account of the cost of reinsurance on the one hand, and the risk that is retained on the other. By determining the retention, the impact on the statement of financial position is taken into account as well. The difference in the retention of disability depends on the structure of the contract (basic coverage or indexed).
To limit risk concentration, reinsurance contracts are placed with various reinsurance companies. a.s.r. requires the counterparties to be rated at least single A. The reinsurance programme has remained largely the same as in previous years in terms of cover and limits. The most significant reinsured risks are windstorm and individual disability. In 2015, a.s.r. purchased excess of loss reinsurance for accident year 2016 for windstorm in excess of € 30 million with a limit of € 344 million. For individual disability for self-employed policyholders, approximately 30% of the inception risk is reinsured.
C.2 Market risk
Market risk is the risk of potential losses due to adverse movements in financial market variables. Exposure to market risk is measured by the impact of movements in financial variables such as equity prices, interest rates and property prices. The various types of market risk which are discussed in this section, are:• interest rate risk• equity risk• property risk• currency risk• spread risk• concentration risk
Market risk reports are submitted to the FRC at least once a month. Key reports on market risk include the Solvency II and economic capital report, the interest rate risk report and the report on risk budgets related to the strategic asset mix.
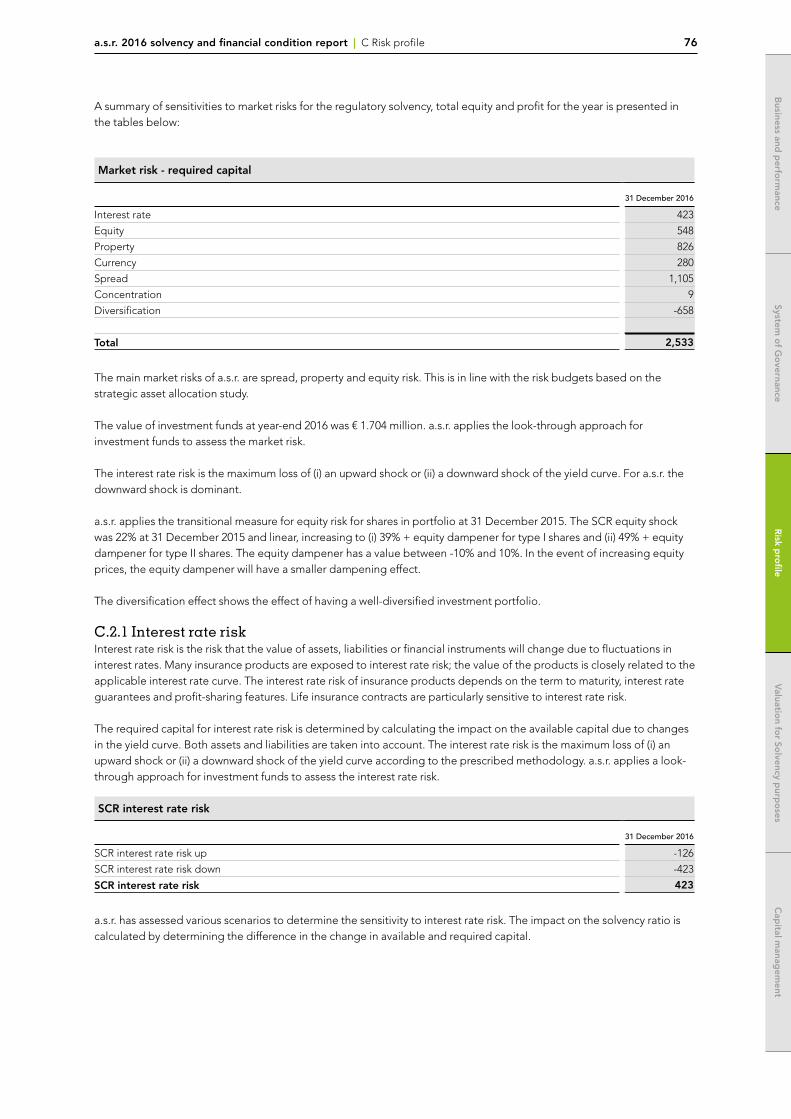
a.s.r. 2016 solvency and financial condition report | C Risk profile 76
System o
f Go
vernanceR
isk pro
fileV
aluation fo
r Solvency p
urpo
sesC
apital m
anagem
entB
usiness and p
erform
ance
A summary of sensitivities to market risks for the regulatory solvency, total equity and profit for the year is presented in the tables below:
Market risk - required capital
31 December 2016
Interest rate 423
Equity 548
Property 826
Currency 280
Spread 1,105
Concentration 9
Diversification -658
Total 2,533
The main market risks of a.s.r. are spread, property and equity risk. This is in line with the risk budgets based on the strategic asset allocation study.
The value of investment funds at year-end 2016 was € 1.704 million. a.s.r. applies the look-through approach for investment funds to assess the market risk.
The interest rate risk is the maximum loss of (i) an upward shock or (ii) a downward shock of the yield curve. For a.s.r. the downward shock is dominant.
a.s.r. applies the transitional measure for equity risk for shares in portfolio at 31 December 2015. The SCR equity shock was 22% at 31 December 2015 and linear, increasing to (i) 39% + equity dampener for type I shares and (ii) 49% + equity dampener for type II shares. The equity dampener has a value between -10% and 10%. In the event of increasing equity prices, the equity dampener will have a smaller dampening effect.
The diversification effect shows the effect of having a well-diversified investment portfolio.
C.2.1 Interest rate riskInterest rate risk is the risk that the value of assets, liabilities or financial instruments will change due to fluctuations in interest rates. Many insurance products are exposed to interest rate risk; the value of the products is closely related to the applicable interest rate curve. The interest rate risk of insurance products depends on the term to maturity, interest rate guarantees and profit-sharing features. Life insurance contracts are particularly sensitive to interest rate risk.
The required capital for interest rate risk is determined by calculating the impact on the available capital due to changes in the yield curve. Both assets and liabilities are taken into account. The interest rate risk is the maximum loss of (i) an upward shock or (ii) a downward shock of the yield curve according to the prescribed methodology. a.s.r. applies a look-through approach for investment funds to assess the interest rate risk.
SCR interest rate risk
31 December 2016
SCR interest rate risk up -126
SCR interest rate risk down -423
SCR interest rate risk 423
a.s.r. has assessed various scenarios to determine the sensitivity to interest rate risk. The impact on the solvency ratio is calculated by determining the difference in the change in available and required capital.
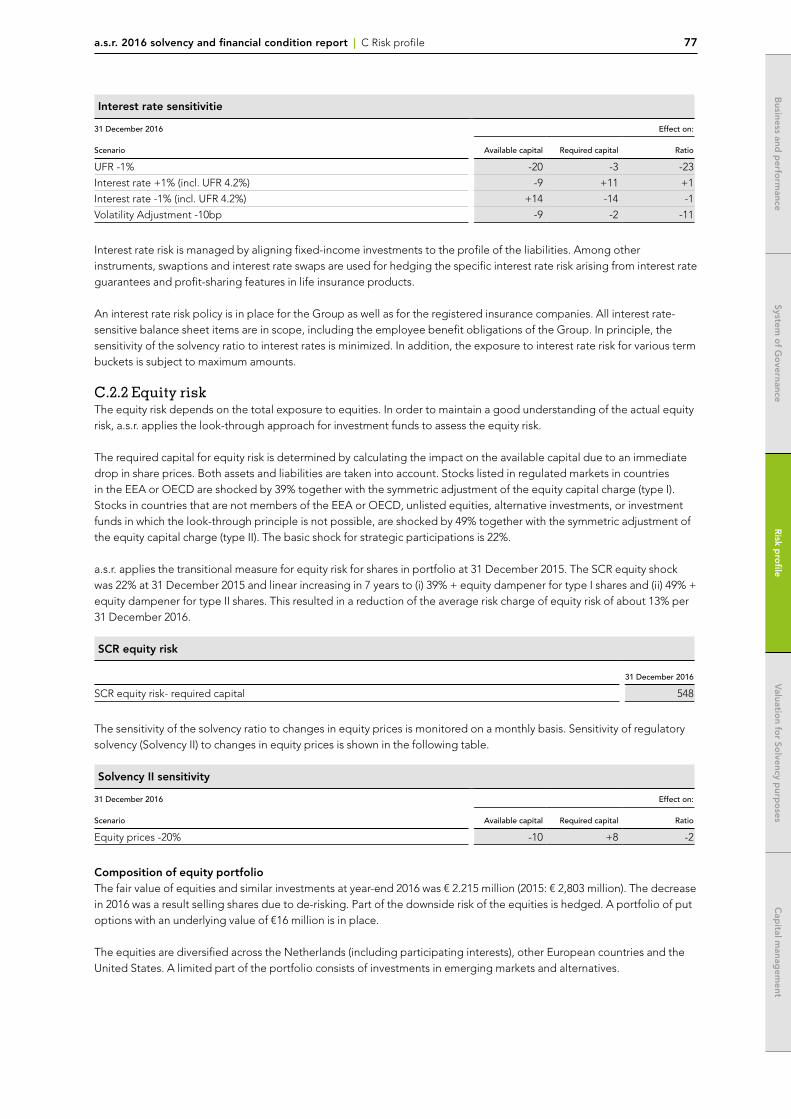
a.s.r. 2016 solvency and financial condition report | C Risk profile 77
System o
f Go
vernance
System o
f Go
vernance
Risk p
rofile
Risk p
rofile
Valuatio
n for So
lvency purp
oses
Valuatio
n for So
lvency purp
oses
Cap
ital manag
ement
Cap
ital manag
ement
Business and
perfo
rmance
Business and
perfo
rmance
Interest rate sensitivitie
31 December 2016
Scenario
Effect on:
Available capital Required capital Ratio
UFR -1% -20 -3 -23
Interest rate +1% (incl. UFR 4.2%) -9 +11 +1
Interest rate -1% (incl. UFR 4.2%) +14 -14 -1
Volatility Adjustment -10bp -9 -2 -11
Interest rate risk is managed by aligning fixed-income investments to the profile of the liabilities. Among other instruments, swaptions and interest rate swaps are used for hedging the specific interest rate risk arising from interest rate guarantees and profit-sharing features in life insurance products.
An interest rate risk policy is in place for the Group as well as for the registered insurance companies. All interest rate-sensitive balance sheet items are in scope, including the employee benefit obligations of the Group. In principle, the sensitivity of the solvency ratio to interest rates is minimized. In addition, the exposure to interest rate risk for various term buckets is subject to maximum amounts.
C.2.2 Equity riskThe equity risk depends on the total exposure to equities. In order to maintain a good understanding of the actual equity risk, a.s.r. applies the look-through approach for investment funds to assess the equity risk.
The required capital for equity risk is determined by calculating the impact on the available capital due to an immediate drop in share prices. Both assets and liabilities are taken into account. Stocks listed in regulated markets in countries in the EEA or OECD are shocked by 39% together with the symmetric adjustment of the equity capital charge (type I). Stocks in countries that are not members of the EEA or OECD, unlisted equities, alternative investments, or investment funds in which the look-through principle is not possible, are shocked by 49% together with the symmetric adjustment of the equity capital charge (type II). The basic shock for strategic participations is 22%.
a.s.r. applies the transitional measure for equity risk for shares in portfolio at 31 December 2015. The SCR equity shock was 22% at 31 December 2015 and linear increasing in 7 years to (i) 39% + equity dampener for type I shares and (ii) 49% + equity dampener for type II shares. This resulted in a reduction of the average risk charge of equity risk of about 13% per 31 December 2016.
SCR equity risk
31 December 2016
SCR equity risk- required capital 548
The sensitivity of the solvency ratio to changes in equity prices is monitored on a monthly basis. Sensitivity of regulatory solvency (Solvency II) to changes in equity prices is shown in the following table.
Solvency II sensitivity
31 December 2016
Scenario
Effect on:
Available capital Required capital Ratio
Equity prices -20% -10 +8 -2
Composition of equity portfolioThe fair value of equities and similar investments at year-end 2016 was € 2.215 million (2015: € 2,803 million). The decrease in 2016 was a result selling shares due to de-risking. Part of the downside risk of the equities is hedged. A portfolio of put options with an underlying value of €16 million is in place.
The equities are diversified across the Netherlands (including participating interests), other European countries and the United States. A limited part of the portfolio consists of investments in emerging markets and alternatives.
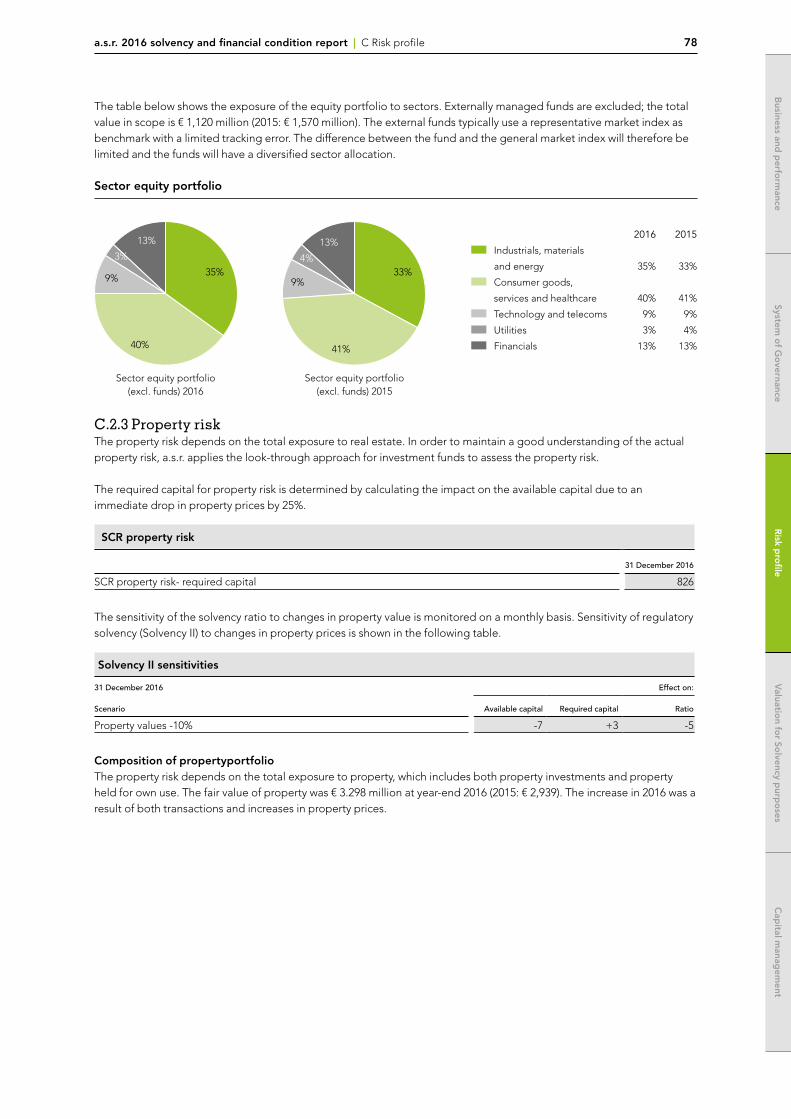
a.s.r. 2016 solvency and financial condition report | C Risk profile 78
System o
f Go
vernanceR
isk pro
fileV
aluation fo
r Solvency p
urpo
sesC
apital m
anagem
entB
usiness and p
erform
ance
The table below shows the exposure of the equity portfolio to sectors. Externally managed funds are excluded; the total value in scope is € 1,120 million (2015: € 1,570 million). The external funds typically use a representative market index as benchmark with a limited tracking error. The difference between the fund and the general market index will therefore be limited and the funds will have a diversified sector allocation.
Sector equity portfolio
2016 2015
Industrials, materials
and energy 35% 33%
Consumer goods,
services and healthcare 40% 41%
Technology and telecoms 9% 9%
Utilities 3% 4%
Financials 13% 13%40%
9%35%
3%
13%
Sector equity portfolio(excl. funds) 2016
41%
9%33%
4%
13%
Sector equity portfolio(excl. funds) 2015
C.2.3 Property riskThe property risk depends on the total exposure to real estate. In order to maintain a good understanding of the actual property risk, a.s.r. applies the look-through approach for investment funds to assess the property risk.
The required capital for property risk is determined by calculating the impact on the available capital due to an immediate drop in property prices by 25%.
SCR property risk
31 December 2016
SCR property risk- required capital 826
The sensitivity of the solvency ratio to changes in property value is monitored on a monthly basis. Sensitivity of regulatory solvency (Solvency II) to changes in property prices is shown in the following table.
Solvency II sensitivities
31 December 2016
Scenario
Effect on:
Available capital Required capital Ratio
Property values -10% -7 +3 -5
Composition of propertyportfolioThe property risk depends on the total exposure to property, which includes both property investments and property held for own use. The fair value of property was € 3.298 million at year-end 2016 (2015: € 2,939). The increase in 2016 was a result of both transactions and increases in property prices.
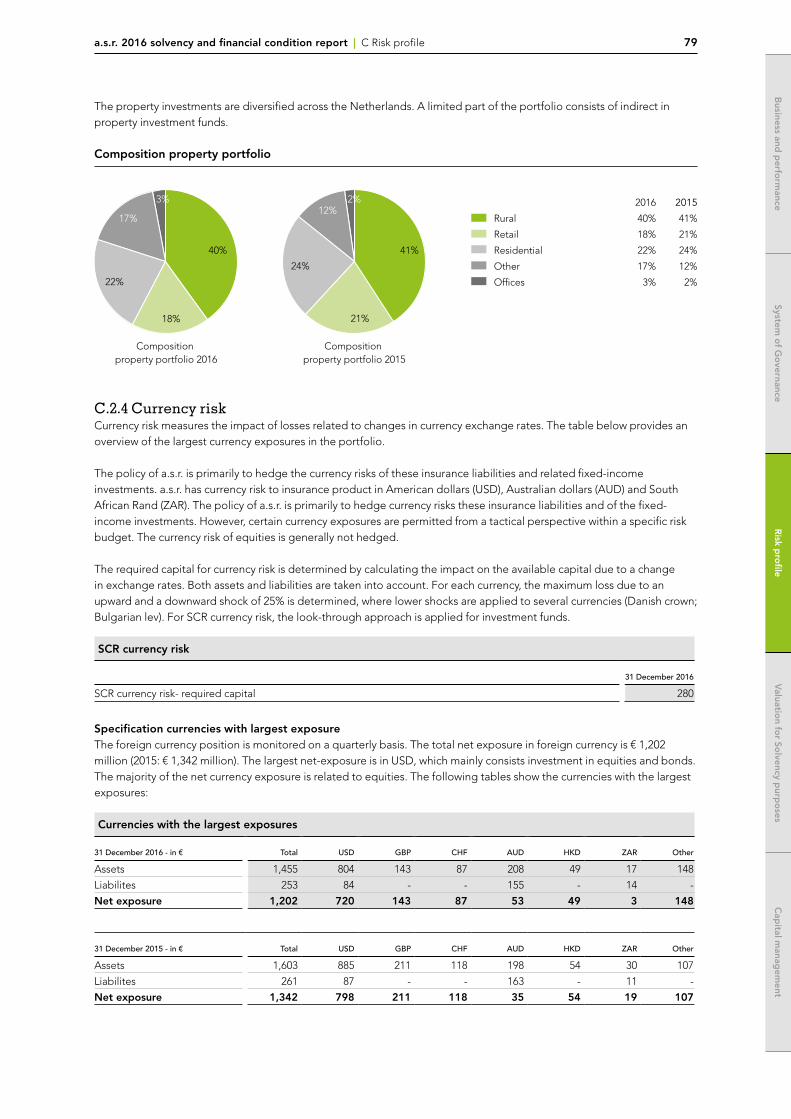
a.s.r. 2016 solvency and financial condition report | C Risk profile 79
System o
f Go
vernance
System o
f Go
vernance
Risk p
rofile
Risk p
rofile
Valuatio
n for So
lvency purp
oses
Valuatio
n for So
lvency purp
oses
Cap
ital manag
ement
Cap
ital manag
ement
Business and
perfo
rmance
Business and
perfo
rmance
The property investments are diversified across the Netherlands. A limited part of the portfolio consists of indirect in property investment funds.
Composition property portfolio
2016 2015
Rural 40% 41%
Retail 18% 21%
Residential 22% 24%
Other 17% 12%
Offices 3% 2%
18%
22%
17%
40%
3%
Composition property portfolio 2016
21%
24%
2%
41%
12%
Composition property portfolio 2015
C.2.4 Currency riskCurrency risk measures the impact of losses related to changes in currency exchange rates. The table below provides an overview of the largest currency exposures in the portfolio.
The policy of a.s.r. is primarily to hedge the currency risks of these insurance liabilities and related fixed-income investments. a.s.r. has currency risk to insurance product in American dollars (USD), Australian dollars (AUD) and South African Rand (ZAR). The policy of a.s.r. is primarily to hedge currency risks these insurance liabilities and of the fixed-income investments. However, certain currency exposures are permitted from a tactical perspective within a specific risk budget. The currency risk of equities is generally not hedged.
The required capital for currency risk is determined by calculating the impact on the available capital due to a change in exchange rates. Both assets and liabilities are taken into account. For each currency, the maximum loss due to an upward and a downward shock of 25% is determined, where lower shocks are applied to several currencies (Danish crown; Bulgarian lev). For SCR currency risk, the look-through approach is applied for investment funds.
SCR currency risk
31 December 2016
SCR currency risk- required capital 280
Specification currencies with largest exposureThe foreign currency position is monitored on a quarterly basis. The total net exposure in foreign currency is € 1,202 million (2015: € 1,342 million). The largest net-exposure is in USD, which mainly consists investment in equities and bonds. The majority of the net currency exposure is related to equities. The following tables show the currencies with the largest exposures:
Currencies with the largest exposures
31 December 2016 - in € Total USD GBP CHF AUD HKD ZAR Other
Assets 1,455 804 143 87 208 49 17 148
Liabilites 253 84 - - 155 - 14 -
Net exposure 1,202 720 143 87 53 49 3 148
31 December 2015 - in € Total USD GBP CHF AUD HKD ZAR Other
Assets 1,603 885 211 118 198 54 30 107
Liabilites 261 87 - - 163 - 11 -
Net exposure 1,342 798 211 118 35 54 19 107
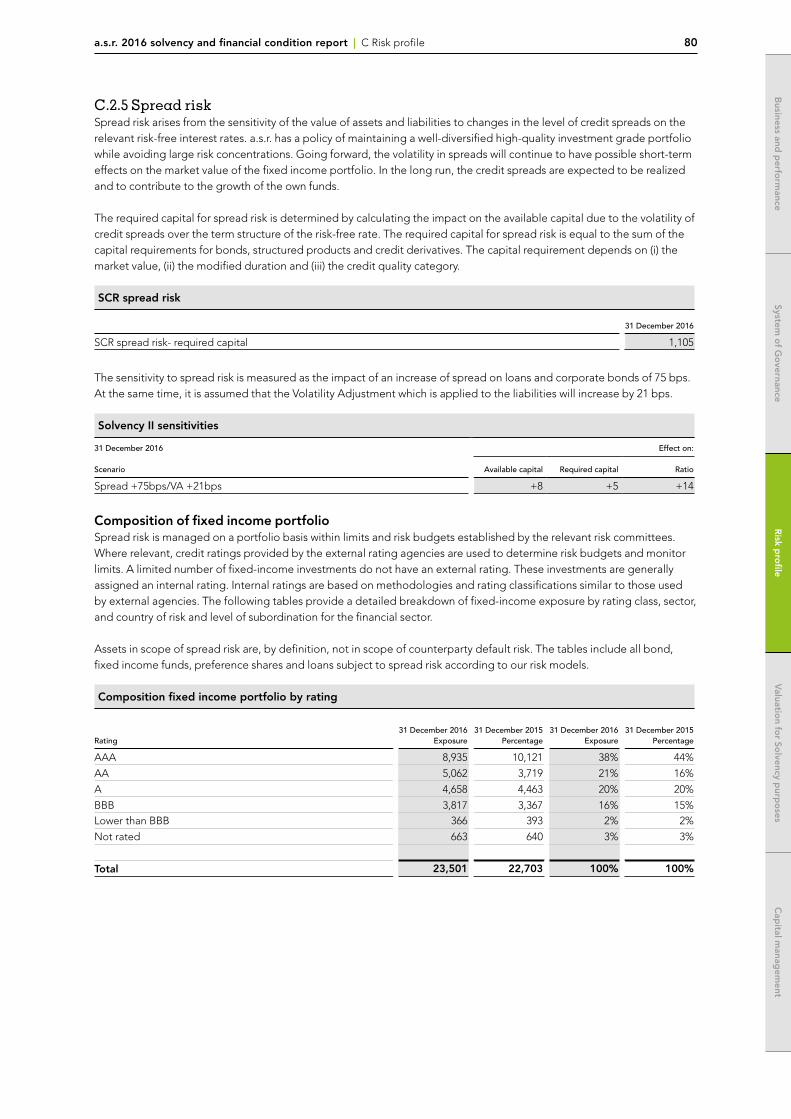
a.s.r. 2016 solvency and financial condition report | C Risk profile 80
System o
f Go
vernanceR
isk pro
fileV
aluation fo
r Solvency p
urpo
sesC
apital m
anagem
entB
usiness and p
erform
ance
C.2.5 Spread riskSpread risk arises from the sensitivity of the value of assets and liabilities to changes in the level of credit spreads on the relevant risk-free interest rates. a.s.r. has a policy of maintaining a well-diversified high-quality investment grade portfolio while avoiding large risk concentrations. Going forward, the volatility in spreads will continue to have possible short-term effects on the market value of the fixed income portfolio. In the long run, the credit spreads are expected to be realized and to contribute to the growth of the own funds.
The required capital for spread risk is determined by calculating the impact on the available capital due to the volatility of credit spreads over the term structure of the risk-free rate. The required capital for spread risk is equal to the sum of the capital requirements for bonds, structured products and credit derivatives. The capital requirement depends on (i) the market value, (ii) the modified duration and (iii) the credit quality category.
SCR spread risk
31 December 2016
SCR spread risk- required capital 1,105
The sensitivity to spread risk is measured as the impact of an increase of spread on loans and corporate bonds of 75 bps. At the same time, it is assumed that the Volatility Adjustment which is applied to the liabilities will increase by 21 bps.
Solvency II sensitivities
31 December 2016
Scenario
Effect on:
Available capital Required capital Ratio
Spread +75bps/VA +21bps +8 +5 +14
Composition of fixed income portfolioSpread risk is managed on a portfolio basis within limits and risk budgets established by the relevant risk committees. Where relevant, credit ratings provided by the external rating agencies are used to determine risk budgets and monitor limits. A limited number of fixed-income investments do not have an external rating. These investments are generally assigned an internal rating. Internal ratings are based on methodologies and rating classifications similar to those used by external agencies. The following tables provide a detailed breakdown of fixed-income exposure by rating class, sector, and country of risk and level of subordination for the financial sector.
Assets in scope of spread risk are, by definition, not in scope of counterparty default risk. The tables include all bond, fixed income funds, preference shares and loans subject to spread risk according to our risk models.
Composition fixed income portfolio by rating
Rating31 December 2016
Exposure31 December 2015
Percentage31 December 2016
Exposure31 December 2015
Percentage
AAA 8,935 10,121 38% 44%
AA 5,062 3,719 21% 16%
A 4,658 4,463 20% 20%
BBB 3,817 3,367 16% 15%Lower than BBB 366 393 2% 2%
Not rated 663 640 3% 3%
Total 23,501 22,703 100% 100%
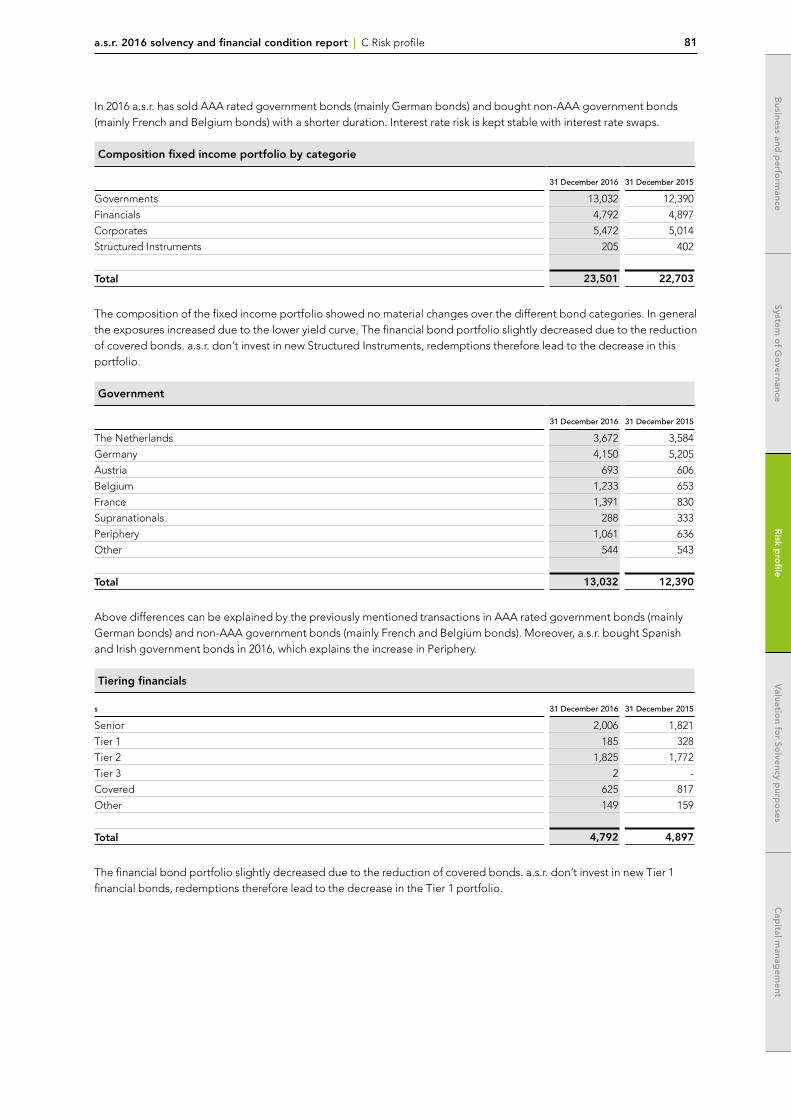
a.s.r. 2016 solvency and financial condition report | C Risk profile 81
System o
f Go
vernance
System o
f Go
vernance
Risk p
rofile
Risk p
rofile
Valuatio
n for So
lvency purp
oses
Valuatio
n for So
lvency purp
oses
Cap
ital manag
ement
Cap
ital manag
ement
Business and
perfo
rmance
Business and
perfo
rmance
In 2016 a.s.r. has sold AAA rated government bonds (mainly German bonds) and bought non-AAA government bonds (mainly French and Belgium bonds) with a shorter duration. Interest rate risk is kept stable with interest rate swaps.
Composition fixed income portfolio by categorie
31 December 2016 31 December 2015
Governments 13,032 12,390
Financials 4,792 4,897
Corporates 5,472 5,014
Structured Instruments 205 402
Total 23,501 22,703
The composition of the fixed income portfolio showed no material changes over the different bond categories. In general the exposures increased due to the lower yield curve. The financial bond portfolio slightly decreased due to the reduction of covered bonds. a.s.r. don’t invest in new Structured Instruments, redemptions therefore lead to the decrease in this portfolio.
Government
31 December 2016 31 December 2015
The Netherlands 3,672 3,584
Germany 4,150 5,205
Austria 693 606
Belgium 1,233 653
France 1,391 830
Supranationals 288 333
Periphery 1,061 636
Other 544 543
Total 13,032 12,390
Above differences can be explained by the previously mentioned transactions in AAA rated government bonds (mainly German bonds) and non-AAA government bonds (mainly French and Belgium bonds). Moreover, a.s.r. bought Spanish and Irish government bonds in 2016, which explains the increase in Periphery.
Tiering financials
s 31 December 2016 31 December 2015
Senior 2,006 1,821
Tier 1 185 328
Tier 2 1,825 1,772
Tier 3 2 -
Covered 625 817
Other 149 159
Total 4,792 4,897
The financial bond portfolio slightly decreased due to the reduction of covered bonds. a.s.r. don’t invest in new Tier 1 financial bonds, redemptions therefore lead to the decrease in the Tier 1 portfolio.
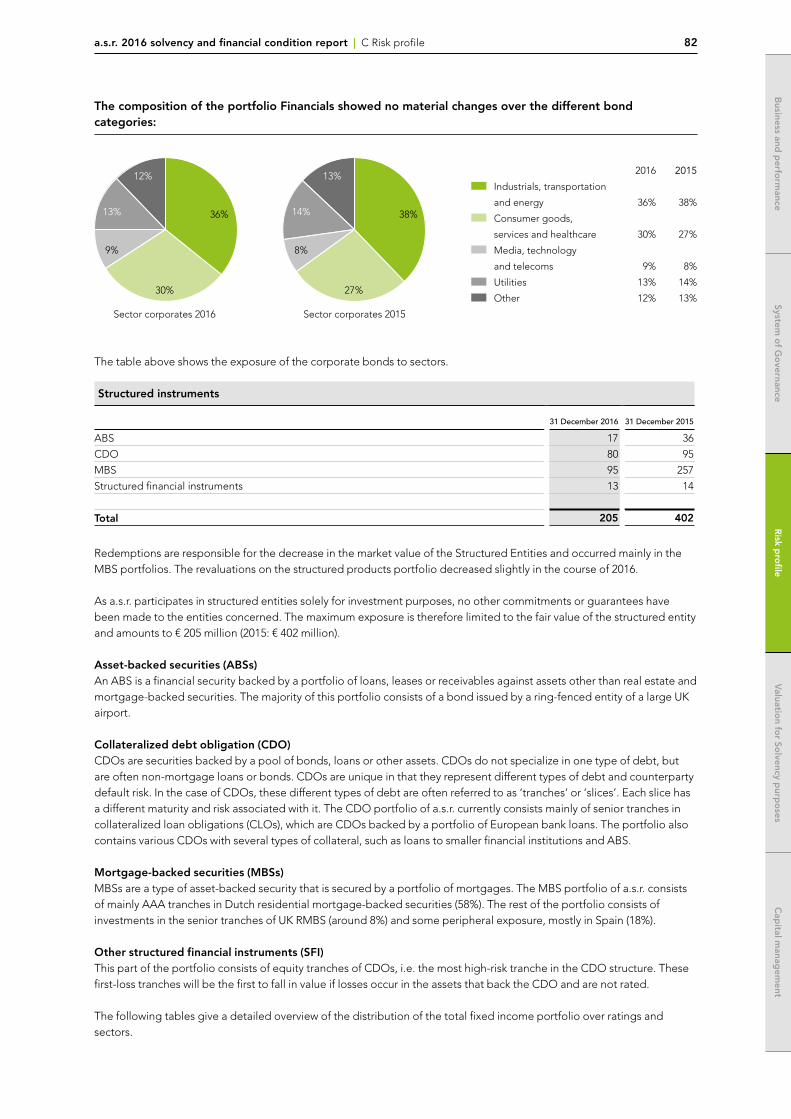
a.s.r. 2016 solvency and financial condition report | C Risk profile 82
System o
f Go
vernanceR
isk pro
fileV
aluation fo
r Solvency p
urpo
sesC
apital m
anagem
entB
usiness and p
erform
ance
The composition of the portfolio Financials showed no material changes over the different bond categories:
2016 2015
Industrials, transportation
and energy 36% 38%
Consumer goods,
services and healthcare 30% 27%
Media, technology
and telecoms 9% 8%
Utilities 13% 14%
Other 12% 13%30%
9%
36%13%
12%
27%
8%
38%14%
13%
Sector corporates 2016 Sector corporates 2015
The table above shows the exposure of the corporate bonds to sectors.
Structured instruments
31 December 2016 31 December 2015
ABS 17 36
CDO 80 95
MBS 95 257
Structured financial instruments 13 14
Total 205 402
Redemptions are responsible for the decrease in the market value of the Structured Entities and occurred mainly in the MBS portfolios. The revaluations on the structured products portfolio decreased slightly in the course of 2016.
As a.s.r. participates in structured entities solely for investment purposes, no other commitments or guarantees have been made to the entities concerned. The maximum exposure is therefore limited to the fair value of the structured entity and amounts to € 205 million (2015: € 402 million).
Asset-backed securities (ABSs)An ABS is a financial security backed by a portfolio of loans, leases or receivables against assets other than real estate and mortgage-backed securities. The majority of this portfolio consists of a bond issued by a ring-fenced entity of a large UK airport.
Collateralized debt obligation (CDO)CDOs are securities backed by a pool of bonds, loans or other assets. CDOs do not specialize in one type of debt, but are often non-mortgage loans or bonds. CDOs are unique in that they represent different types of debt and counterparty default risk. In the case of CDOs, these different types of debt are often referred to as ‘tranches’ or ‘slices’. Each slice has a different maturity and risk associated with it. The CDO portfolio of a.s.r. currently consists mainly of senior tranches in collateralized loan obligations (CLOs), which are CDOs backed by a portfolio of European bank loans. The portfolio also contains various CDOs with several types of collateral, such as loans to smaller financial institutions and ABS.
Mortgage-backed securities (MBSs) MBSs are a type of asset-backed security that is secured by a portfolio of mortgages. The MBS portfolio of a.s.r. consists of mainly AAA tranches in Dutch residential mortgage-backed securities (58%). The rest of the portfolio consists of investments in the senior tranches of UK RMBS (around 8%) and some peripheral exposure, mostly in Spain (18%).
Other structured financial instruments (SFI)This part of the portfolio consists of equity tranches of CDOs, i.e. the most high-risk tranche in the CDO structure. These first-loss tranches will be the first to fall in value if losses occur in the assets that back the CDO and are not rated.
The following tables give a detailed overview of the distribution of the total fixed income portfolio over ratings and sectors.
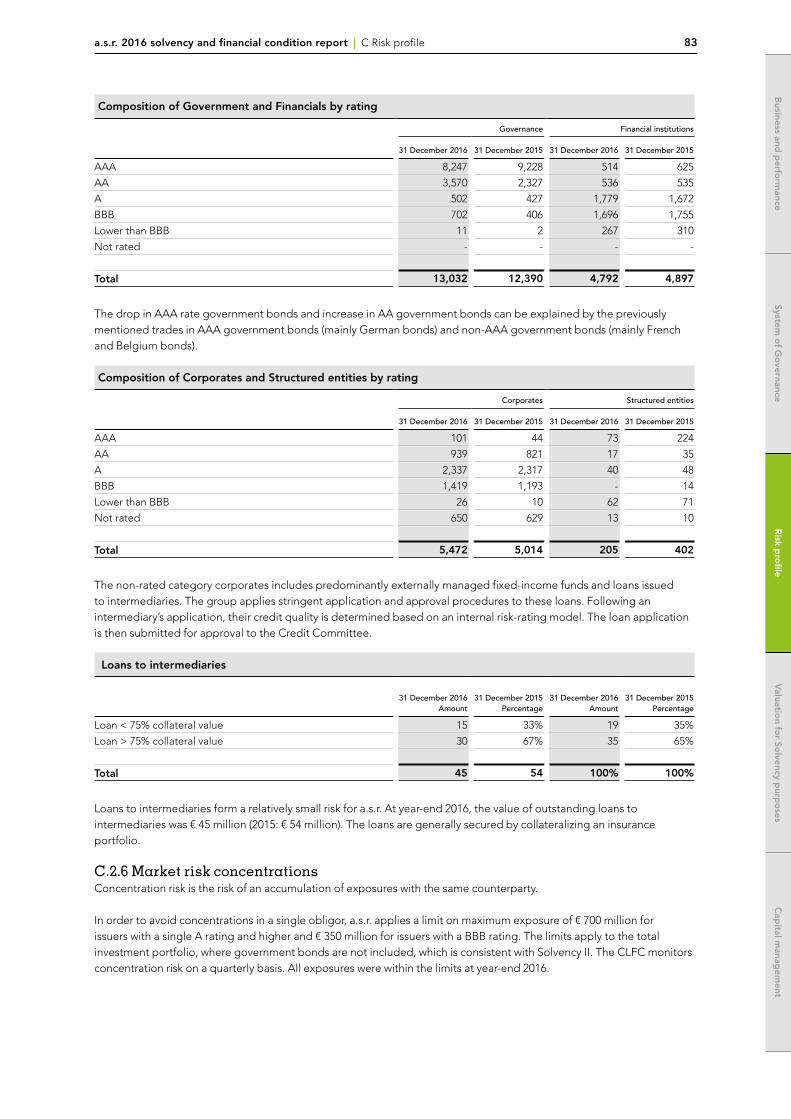
a.s.r. 2016 solvency and financial condition report | C Risk profile 83
System o
f Go
vernance
System o
f Go
vernance
Risk p
rofile
Risk p
rofile
Valuatio
n for So
lvency purp
oses
Valuatio
n for So
lvency purp
oses
Cap
ital manag
ement
Cap
ital manag
ement
Business and
perfo
rmance
Business and
perfo
rmance
Composition of Government and Financials by rating
Governance Financial institutions
31 December 2016 31 December 2015 31 December 2016 31 December 2015
AAA 8,247 9,228 514 625
AA 3,570 2,327 536 535
A 502 427 1,779 1,672
BBB 702 406 1,696 1,755
Lower than BBB 11 2 267 310
Not rated - - - -
Total 13,032 12,390 4,792 4,897
The drop in AAA rate government bonds and increase in AA government bonds can be explained by the previously mentioned trades in AAA government bonds (mainly German bonds) and non-AAA government bonds (mainly French and Belgium bonds).
Composition of Corporates and Structured entities by rating
Corporates Structured entities
31 December 2016 31 December 2015 31 December 2016 31 December 2015
AAA 101 44 73 224
AA 939 821 17 35
A 2,337 2,317 40 48
BBB 1,419 1,193 - 14
Lower than BBB 26 10 62 71
Not rated 650 629 13 10
Total 5,472 5,014 205 402
The non-rated category corporates includes predominantly externally managed fixed-income funds and loans issued to intermediaries. The group applies stringent application and approval procedures to these loans. Following an intermediary’s application, their credit quality is determined based on an internal risk-rating model. The loan application is then submitted for approval to the Credit Committee.
Loans to intermediaries
31 December 2016Amount
31 December 2015Percentage
31 December 2016Amount
31 December 2015 Percentage
Loan < 75% collateral value 15 33% 19 35%
Loan > 75% collateral value 30 67% 35 65%
Total 45 54 100% 100%
Loans to intermediaries form a relatively small risk for a.s.r. At year-end 2016, the value of outstanding loans to intermediaries was € 45 million (2015: € 54 million). The loans are generally secured by collateralizing an insurance portfolio. C.2.6 Market risk concentrationsConcentration risk is the risk of an accumulation of exposures with the same counterparty.
In order to avoid concentrations in a single obligor, a.s.r. applies a limit on maximum exposure of € 700 million for issuers with a single A rating and higher and € 350 million for issuers with a BBB rating. The limits apply to the total investment portfolio, where government bonds are not included, which is consistent with Solvency II. The CLFC monitors concentration risk on a quarterly basis. All exposures were within the limits at year-end 2016.

a.s.r. 2016 solvency and financial condition report | C Risk profile 84
System o
f Go
vernanceR
isk pro
fileV
aluation fo
r Solvency p
urpo
sesC
apital m
anagem
entB
usiness and p
erform
ance
C.3 Counterparty default risk
Counterparty default risk reflects possible losses due to unexpected default or deterioration in the credit standing of counterparties and debtors. Counterparty default risk affects several types of assets:• mortgages• savings-linked mortgage loans• derivatives• reinsurance• receivables• cash and deposits
Assets that are in scope of spread risk are, by definition, not in scope of counterparty default risk and vice versa.
The Solvency II regime makes a distinction between two types of exposures:• Type 1: These counterparties generally have a rating (reinsurance, derivatives, current account balances, deposits with
ceding companies and issued guarantee (letter of credit). The exposures are not diversified.• Type 2: These counterparties are normally unrated (receivables from intermediaries and policyholders, mortgages with
private individuals or SMEs). The exposures are generally diversified.
The total capital requirement for counterparty risk is an aggregation of the capital requirement for type 1 exposure and the capital requirement for type 2 exposure by taking 75% correlation.
Counterparty default risk - required capital
31 December 2016
Type 1 171
Type 2 415
Diversification -31
Total 555
C.3.1 MortgagesMortgages are granted for the account and risk of third parties and for a.s.r.’s own account. The a.s.r. portfolio consists only of Dutch mortgages with a limited counterparty default risk. In line with the strategic investment plan, the mortgage portfolio increased by € 680 million in 2016.
Mortgage: loan to collateral value
2016Amount
2015Amount
2016Amount
2015 Percentage
NHG 3,869 4,041 54% 62%
Loan to Foreclosure Value < 75% 1,561 1,160 22% 18%
Loan to Foreclosure Value < 100% 753 574 10% 9%
Loan to Foreclosure Value < 125% 925 675 13% 10%
Loan to Foreclosure Value > 125% 94 72 1% 1%
Total 7,202 6,522 100% 100%
The Loan-to-Value ratio is based on the outstanding principal with respect to the a.s.r. calculated collateral. As a rule, a.s.r.’s mortgage portfolio is secured by collateralizing the linked life insurance contracts. At year-end 2016 0.34% (2015: 0.57%) of mortgages were more than three months in arrears.
The default percentage (i.e. the percentage of mortgages which isin arrears for over three months) has decreased from 0,57% in December 2015 to 0,34% in December 2016. This drop is a consequence of the improved economic circumstances and of the organization of preventive management, whereby the flow of short-term arrears to longer delays could be reduced.

a.s.r. 2016 solvency and financial condition report | C Risk profile 85
System o
f Go
vernance
System o
f Go
vernance
Risk p
rofile
Risk p
rofile
Valuatio
n for So
lvency purp
oses
Valuatio
n for So
lvency purp
oses
Cap
ital manag
ement
Cap
ital manag
ement
Business and
perfo
rmance
Business and
perfo
rmance
C.3.2 Savings-linked mortgage loansThe counterparty default risk of the savings-linked mortgage loans depends on the counterparty. For 56% of the portfolio, the counterparties are Special Purpose Vehicles. The risk is limited due to the robust quality of the mortgages in the Special Purpose Vehicles in combination with the tranching. a.s.r. has a cession-retrocession agreement with the counterparty for 42% of the portfolio, for which the risk is limited. Effectively, a.s.r. receives the underlying mortgage loans as collateral, mitigating the counterparty default risk of the savings-linked mortgage loans.
Savings-linked mortgage loans
31 December 2016 31 December 2015
Counterparty SPV 1,595 1,763
Agreement cession-retrocession 1,201 697
Other 49 340
Total 2,845 2,800
Due to a new cession-retrocession agreement in 2016, the remaining savings-linked mortgage loans is reduced to only 2% of the portfolio. The credit rating of the counterparty is shown below.
Savings-linked mortgage loans: other
31 December 2016 31 December 2015
AAA 14 14
AA - -
A 35 326
Total 49 340
C.3.3 DerivativesOver the Counter (OTC) derivatives are primarily used by a.s.r. to manage the interest-rate risks incorporated into the insurance liabilities.Interest-rate derivatives are traded with a well-diversified and qualitative dealer panel with whom there is an establishedInternational Swaps and Derivatives Association (ISDA) contract and a Credit Support Annex (CSA) in place. These CSAs include specific agreements on the exchange of collateral limiting market and counterparty risk. The outstanding value of the interest rate derivative positions is matched by collateral received from eligible counterparties, minimizing the net counterparty default risk.
C.3.4 ReinsuranceWhen entering into reinsurance contracts for fire and catastrophe, a.s.r. requires the counterparty to be rated at least single A. With respect to long-tail business and other sectors, the minimum permitted rating is single A.
Reinsurance
31 December 2016 31 December 2015
AA 95% 80%
A 5% 20%
NR 0% 0%
The table above shows the exposure to reinsurers per rating. The total exposure to reinsurers at year-end 2016 was € 656 million (2015: € 611million).
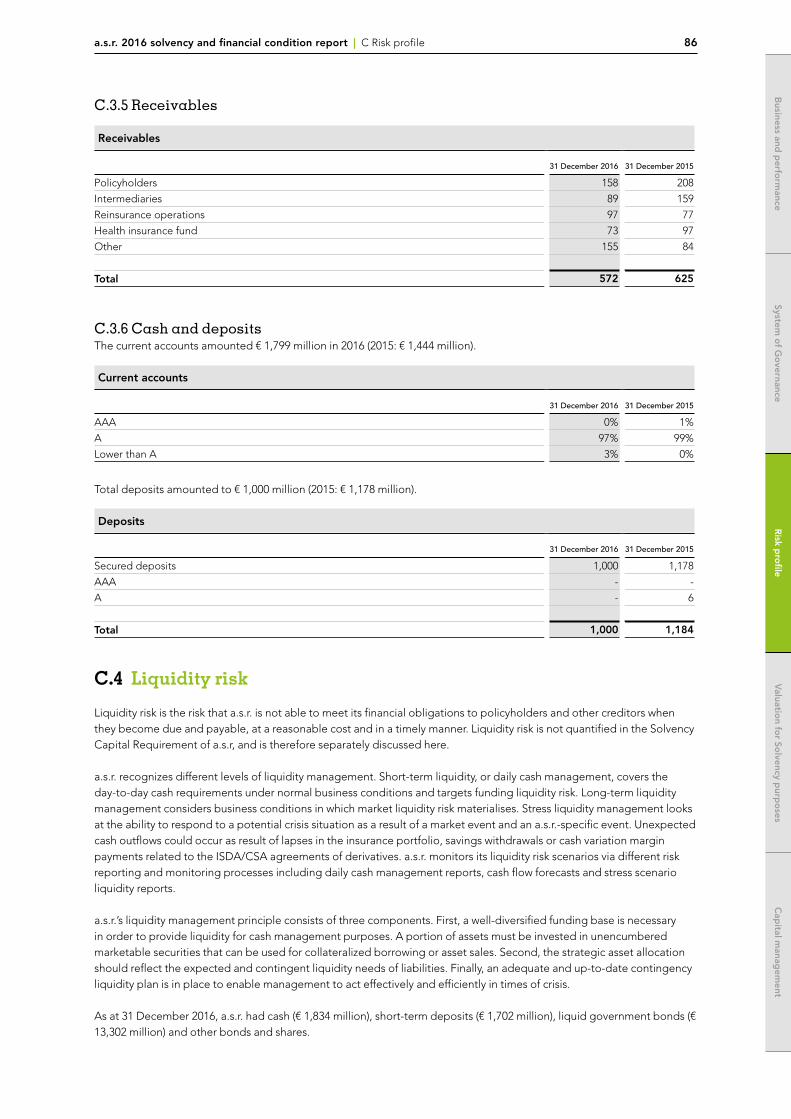
a.s.r. 2016 solvency and financial condition report | C Risk profile 86
System o
f Go
vernanceR
isk pro
fileV
aluation fo
r Solvency p
urpo
sesC
apital m
anagem
entB
usiness and p
erform
ance
C.3.5 Receivables
Receivables
31 December 2016 31 December 2015
Policyholders 158 208
Intermediaries 89 159
Reinsurance operations 97 77
Health insurance fund 73 97
Other 155 84
Total 572 625
C.3.6 Cash and depositsThe current accounts amounted € 1,799 million in 2016 (2015: € 1,444 million).
Current accounts
31 December 2016 31 December 2015
AAA 0% 1%
A 97% 99%
Lower than A 3% 0%
Total deposits amounted to € 1,000 million (2015: € 1,178 million).
Deposits
31 December 2016 31 December 2015
Secured deposits 1,000 1,178
AAA - -
A - 6
Total 1,000 1,184
C.4 Liquidity risk
Liquidity risk is the risk that a.s.r. is not able to meet its financial obligations to policyholders and other creditors when they become due and payable, at a reasonable cost and in a timely manner. Liquidity risk is not quantified in the Solvency Capital Requirement of a.s.r, and is therefore separately discussed here.
a.s.r. recognizes different levels of liquidity management. Short-term liquidity, or daily cash management, covers the day-to-day cash requirements under normal business conditions and targets funding liquidity risk. Long-term liquidity management considers business conditions in which market liquidity risk materialises. Stress liquidity management looks at the ability to respond to a potential crisis situation as a result of a market event and an a.s.r.-specific event. Unexpected cash outflows could occur as result of lapses in the insurance portfolio, savings withdrawals or cash variation margin payments related to the ISDA/CSA agreements of derivatives. a.s.r. monitors its liquidity risk scenarios via different risk reporting and monitoring processes including daily cash management reports, cash flow forecasts and stress scenario liquidity reports.
a.s.r.’s liquidity management principle consists of three components. First, a well-diversified funding base is necessary in order to provide liquidity for cash management purposes. A portion of assets must be invested in unencumbered marketable securities that can be used for collateralized borrowing or asset sales. Second, the strategic asset allocation should reflect the expected and contingent liquidity needs of liabilities. Finally, an adequate and up-to-date contingency liquidity plan is in place to enable management to act effectively and efficiently in times of crisis.
As at 31 December 2016, a.s.r. had cash (€ 1,834 million), short-term deposits (€ 1,702 million), liquid government bonds (€ 13,302 million) and other bonds and shares.

a.s.r. 2016 solvency and financial condition report | C Risk profile 87
System o
f Go
vernance
System o
f Go
vernance
Risk p
rofile
Risk p
rofile
Valuatio
n for So
lvency purp
oses
Valuatio
n for So
lvency purp
oses
Cap
ital manag
ement
Cap
ital manag
ement
Business and
perfo
rmance
Business and
perfo
rmance
The following table shows the contractual cash flows of assets and liabilities (excluding investments on behalf of policyholders and insurance contracts on behalf of policyholders). For liabilities arising from insurance contracts, expected lapses and mortality risk are taken into account. Profit-sharing cash flow of insurance contracts is not taken into account, nor are equities, property and swaptions.
Table: Liquidity - drill down 2016
Liquidity risk - required capital
31 December 2016 < 1 year 1-5 year 5-10 year 10-20 year > 20 year
Fixed-income assets 6,981 7,260 9,460 12,242 14,499
Liabilities -5,635 -7,646 -7,538 -12,694 -21,883
Total 1,346 -386 1,922 -452 -7,384
Liquidity risk - required capital
31 December 2015 < 1 year 1-5 year 5-10 year 10-20 year > 20 year
Fixed-income assets 6,083 7,121 7,892 9,873 15,664
Liabilities -3,985 -7,539 -7,663 -13,290 -24,965
Total 2,098 -418 229 -3,417 -9,301
With regard to liquidity risk, ‘the expected profit included in future premiums’ (“EPIFP”) means the expected present value of future cash flows which result from the inclusion in technical provisions of premiums relating to existing insurance and reinsurance contracts that are expected to be received in the future, but that may not be received for any reason, other than because the insured event has occurred, regardless of the legal or contractual rights of the policyholder to discontinue the policy.
EPIFP
31 December 2016
EPIFP 743
C.5 Operational risk
Operational risk is the risk of losses caused by weak or failing internal procedures, weaknesses in the action taken by personnel, weaknesses in systems or because of external events. The following subcategories of operational risk are used: compliance, business process, information technology, outsourcing, and financial reporting.
The required capital for operational risk, based on standard model, presented below.
SCR operational risk
31 December 2016
SCR operational risk- required capital 184

System o
f Go
vernanceR
isk pro
fileV
aluation fo
r Solvency p
urpo
sesC
apital m
anagem
entB
usiness and p
erform
ance
a.s.r. 2016 solvency and financial condition report | C Risk profile 88
System o
f Go
vernanceR
isk pro
fileV
aluation fo
r Solvency p
urpo
sesC
apital m
anagem
entB
usiness and p
erform
ance
C.6 Other material risks
As part of the regular ORSA process, the overall risk profile and associated solvency capital needs are assessed against a.s.r.’s actual solvency capital position, taking into account identified risks that are not incorporated into the standard formula. The following risks are recognized by a.s.r. as being potentially material:• Inflation risk• Reputation risk• Liquidity risk• Contagion risk• Legal environment risk• Model risk• Strategic risk• Non-insurance related risk• New and upcoming risk
The most important risks to which a.s.r. is exposed, including risks that are not incorporated into the standard formula, are identified through a combined top-down (strategic risk assessment) and bottom-up (control risk self-assessments) approach. After assessment of the effectiveness off the mitigating measures, the risks with the highest ‘Level of Concern’ or LoC are translated to the a.s.r. risk priorities and relevant risk scenarios for the ORSA.
C.7 Any other information
C.7.1 Description of off-balance sheet positionsOff balance sheet positions different from the financial statements do not exist.
C.7.2 Reinsurance policy and risk budgeting
C.7.2.1 Reinsurance policyWhen deemed effective in terms of capital relief versus costs incurred, a.s.r. enters into reinsurance agreements to mitigate non-life insurance risks. Reinsurance can be taken out for each separate claim (per risk), for the accumulation of claims due to natural disasters or to human actions (per event), or for both these risks.
The level of retention in the various reinsurance contracts is aligned with the size and the risk profile of the underlying portfolios, taking account of the cost of reinsurance on the one hand, and of the risk that is retained on the other. By determining the retention, the impact on the statement of financial position is taken into account as well. The difference in the retention of disability depends on the structure of the contract (basic coverage or indexed).
To limit risk concentration, reinsurance contracts are placed with various reinsurance companies. a.s.r. requires the counterparties to be rated at least single A. The reinsurance programme has remained largely the same as in previous years in terms of cover and limits. The most significant reinsured risks are windstorm and individual disability. a.s.r. purchased excess of loss reinsurance for accident year 2016 for windstorm in excess of € 30 million with a limit of € 344 million. For individual disability for self-employed policyholders, approximately 30% of the inception risk is reinsured.
C.7.2.2 Risk budgetingThe FRC assesses the solvency position and the financial risk profile on a monthly basis. Action is taken where appropriate to ensure the predefined levels in the risk appetite statement will not be violated.
C.7.3 Monitoring of new and existing productsGroup Risk Management, Integrity and Legal Affairs participate in the product approval committee (PARP). All these departments evaluate whether risks in newly developed products are sufficiently addressed. New products need to be developed in a way that they are cost efficient, reliable, useful and secure. New products must also be strategically aligned with a.s.r.’s mission to be a solid and trustworthy insurer. In addition, the risks of existing products are evaluated, as requested by the PARP, as a result of product reviews.

a.s.r. 2016 solvency and financial condition report | D Valuation for Solvency purposes 89
System o
f Go
vernance
System o
f Go
vernance
Risk p
rofile
Risk p
rofile
Valuatio
n for So
lvency purp
oses
Valuatio
n for So
lvency purp
oses
Cap
ital manag
ement
Cap
ital manag
ement
Business and
perfo
rmance
Business and
perfo
rmance
System o
f Go
vernanceR
isk pro
fileV
aluation fo
r Solvency p
urpo
sesC
apital m
anagem
entB
usiness and p
erform
ance
D Valuation for Solvency purposes
This chapter contains information regarding the valuation of the balance sheet items. For each material asset class the bases, methods and main assumptions used for valuation for solvency purposes are described. Separately for each material class of assets a quantitative and qualitative explanation of any material difference between the valuation for solvency purposes and valuation in the financial statements. When accounting principles are equal or when line items are not material, some line items are clustered together.
Valuation of assets is based on fair value measurement as described below. Each material asset class is described in paragraph D.1. Valuation of technical provisions is calculated as the sum of the best estimate and the risk margin. This is described in paragraph D.2. Other liabilities are described in paragraph D.3.
Information for each material line item is based on the balance sheet below. For each line item is described:• Methods and assumptions for valuation• Difference between solvency valuation and valuation in the financial statements
The numbering of the line items refer to the comments below.
Based on the differences in this template a reconciliation is made between IFRS equity and Solvency equity.
Reconciliation IFRS balance sheet and SCR balance sheet
Balance sheet
IFRS 31 December 2016
Solvency II31 December 2016
IFRS Revaluation Solvency II
1. Goodwill, DAC, and intangible assets 326 -326 -
2. Deferred tax assets 594 -584 11
3. Property, plant, and equipment held for own use 171 - 171
4. Investments - Property (other than for own use) 3,122 - 3,122
5. Investments - Holdings in related undertakings, including participations 35 74 109
6. Investments - Equity 1,751 - 1,751
7. Investments - Bonds 22,315 -256 22,059
8. Investments - Collective Investments Undertakings 1,704 - 1,704
9. Investments - Derivatives 3,170 -1 3,169
10. Investments - Deposits other than cash equivalents and other investments 1,805 1 1,806
11. Unit-linked investments 7,736 - 7,736
12. Loans and mortgages 10,617 1,300 11,916
13. Reinsurance recoverables 635 35 670
14. Receivables 572 -37 535
15. Cash and cash equivalents 2,078 -88 1,991
16. Any other assets, not elsewhere shown 320 -51 269
Total assets 56,952 66 57,018
17. Technical provisions (best estimates) 32,484 -3,243 29,241
18. Technical provisions (risk margin) - 1,804 1,804
19. Unit-linked best estimate 9,928 1,157 11,085
20. Unit-linked risk margin - 164 164
21. Pension benefit obligations 3,220 - 3,220
22. Deferred tax liabilities - - -
23. Subordinated liabilities 1,198 16 1,214
24. Other liabilities 6,353 -1,408 4,945
Total liabilities 53,183 -1,509 51,674
Excess of assets over liabilities 3,769 1,576 5,345
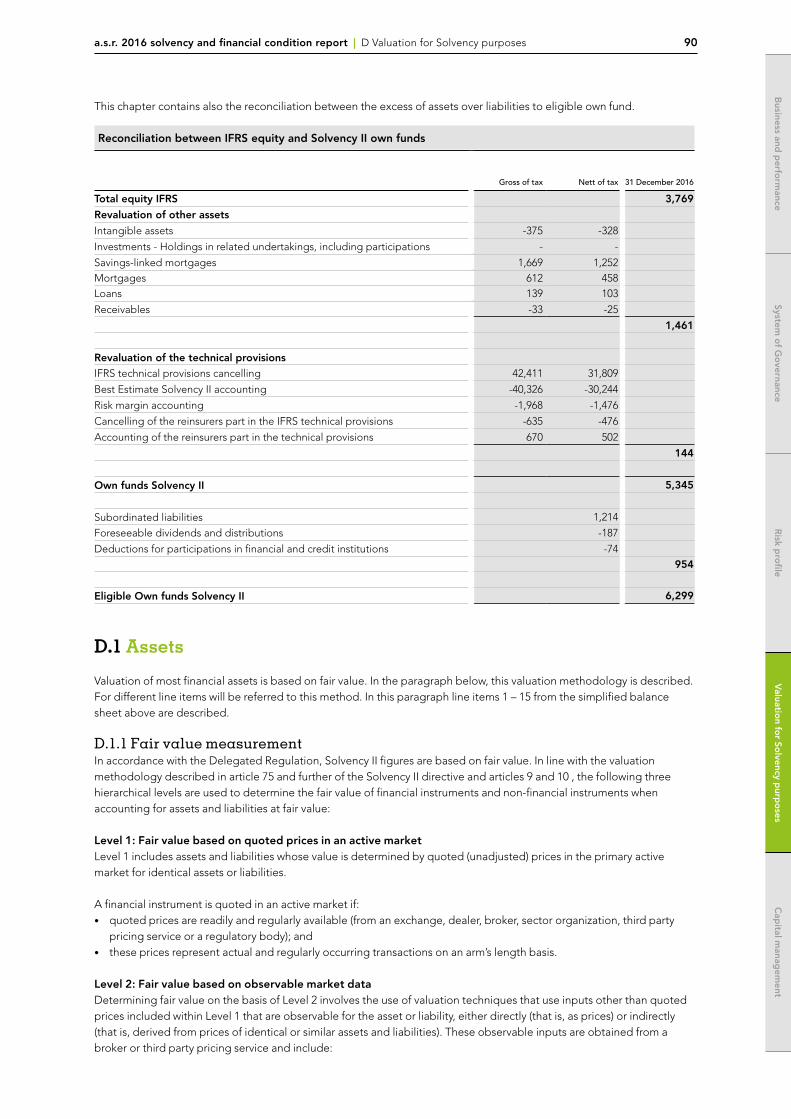
a.s.r. 2016 solvency and financial condition report | D Valuation for Solvency purposes 90
System o
f Go
vernanceR
isk pro
fileV
aluation fo
r Solvency p
urpo
sesC
apital m
anagem
entB
usiness and p
erform
ance
This chapter contains also the reconciliation between the excess of assets over liabilities to eligible own fund.
Reconciliation between IFRS equity and Solvency II own funds
Gross of tax Nett of tax 31 December 2016
Total equity IFRS 3,769
Revaluation of other assets
Intangible assets -375 -328
Investments - Holdings in related undertakings, including participations - -
Savings-linked mortgages 1,669 1,252Mortgages 612 458Loans 139 103
Receivables -33 -25
1,461
Revaluation of the technical provisionsIFRS technical provisions cancelling 42,411 31,809
Best Estimate Solvency II accounting -40,326 -30,244
Risk margin accounting -1,968 -1,476
Cancelling of the reinsurers part in the IFRS technical provisions -635 -476
Accounting of the reinsurers part in the technical provisions 670 502
144
Own funds Solvency II 5,345
Subordinated liabilities 1,214
Foreseeable dividends and distributions -187
Deductions for participations in financial and credit institutions -74954
Eligible Own funds Solvency II 6,299
D.1 Assets
Valuation of most financial assets is based on fair value. In the paragraph below, this valuation methodology is described. For different line items will be referred to this method. In this paragraph line items 1 – 15 from the simplified balance sheet above are described.
D.1.1 Fair value measurementIn accordance with the Delegated Regulation, Solvency II figures are based on fair value. In line with the valuation methodology described in article 75 and further of the Solvency II directive and articles 9 and 10 , the following three hierarchical levels are used to determine the fair value of financial instruments and non-financial instruments when accounting for assets and liabilities at fair value:
Level 1: Fair value based on quoted prices in an active marketLevel 1 includes assets and liabilities whose value is determined by quoted (unadjusted) prices in the primary active market for identical assets or liabilities.
A financial instrument is quoted in an active market if:• quoted prices are readily and regularly available (from an exchange, dealer, broker, sector organization, third party
pricing service or a regulatory body); and• these prices represent actual and regularly occurring transactions on an arm’s length basis.
Level 2: Fair value based on observable market dataDetermining fair value on the basis of Level 2 involves the use of valuation techniques that use inputs other than quoted prices included within Level 1 that are observable for the asset or liability, either directly (that is, as prices) or indirectly (that is, derived from prices of identical or similar assets and liabilities). These observable inputs are obtained from a broker or third party pricing service and include:

a.s.r. 2016 solvency and financial condition report | D Valuation for Solvency purposes 91
System o
f Go
vernance
System o
f Go
vernance
Risk p
rofile
Risk p
rofile
Valuatio
n for So
lvency purp
oses
Valuatio
n for So
lvency purp
oses
Cap
ital manag
ement
Cap
ital manag
ement
Business and
perfo
rmance
Business and
perfo
rmance
• quoted prices in active markets for similar (not identical) assets or liabilities;• quoted prices for identical or similar assets or liabilities in inactive markets;• input variables other than quoted prices observable for the asset or liability. These include interest rates and yield
curves observable at commonly quoted intervals, volatility, early redemptions spreads, loss ratio, counterparty default risks and default percentages.
Level 3: Fair value not based on observable market dataAt Level 3, the fair value of the assets and liabilities is determined using valuation techniques for which significant inputs are not based on observable market data. In these situations, there can also be marginally active or inactive markets for the assets or the liabilities. The financial assets and liabilities in this category are assessed individually.
Valuation techniques are used to the extent that observable inputs are not available. The basic principle of fair value measurement is still to determine a fair, arm’s length price. Unobservable inputs therefore reflect management’s own assumptions about the assumptions that market participants would use in pricing the asset or liability (including assumptions about risk). These inputs are generally based on the available observable data (adjusted for factors that contribute towards the value of the asset) and own source information. In the unlikely event that the fair value of a financial instrument cannot be measured, it is carried at cost.
D.1.2 Per asset categoryThe balance sheet reports specify different asset categories. In this section, we describe the valuation of each material asset category. The figures correspond to the extended balance sheet which has been reported as QRT S 2.01.
1. Goodwill and Intangible assetsThe intangible assets relate to goodwill, pre-paid commissions and other intangible assets are not recognized in the Solvency II framework and are set to nil. 2. Deferred tax assetsThe basis for the DTA / DTL position in the IFRS balance sheet is temporary differences between fiscal and commercial valuation. This DTA / DTL position is the base for this line item on the Solvency II balance sheet, adjusted for Solvency II revaluations:• The largest DTL mutation is caused by the higher (valuation) mortgages and savings linked mortgages.• The largest DTA mutations are mainly caused by the (lower) valuation of technical provisions
In accordance with the Delegated Regulation the DTA / DTL position is netted in the balance sheet. The balance sheet of a.s.r. contains a DTA.The deferred tax effects involve a correction related to the fact that (most of) the revaluations as described in this chapter are gross of tax. The tax effect is calculated as 25%.
The calculation takes into account that some differences are exempted of tax.
3. Property plant, and equipment held for own usea.s.r. recognises property at market value, equal to Solvency II measurement.
4. Investments - Property (other than for own use)a.s.r owns the following categories of investment property; the method for calculating their fair value has been added:• Residential –based on reference transaction and discounted cash flow method (DCF method);• Retail – based on reference transaction and income capitalization method;• Rural – based on reference transaction and DCF method;• Offices – based on reference transaction and DCF method;• Other – based on reference transaction and DCF method;• Under construction - based on both DCF and income capitalization method.
5. Investments - Holdings in related undertakings, including participationsValuation of holdings in related undertakings is based on fair value or, if not applicable, based on the net equity method. Related undertakings are reviewed and rated based on these principles. The revaluation from IFRS to Solvency II can be explained by the deconsolidation of a.s.r. Bank. The deconsolidation accounts for € 74 million of the revaluation.

a.s.r. 2016 solvency and financial condition report | D Valuation for Solvency purposes 92
System o
f Go
vernanceR
isk pro
fileV
aluation fo
r Solvency p
urpo
sesC
apital m
anagem
entB
usiness and p
erform
ance
6. Investments – EquityValuation of listed equities is based on the level 1 method of the fair value hierarchy. Unlisted fixed-interest preference shares are valued based on the level 2 method of the fair value hierarchy. The valuation techniques for financial instruments start from present value calculations; derivatives are valued based on forward-pricing and swap models. The observable market data contains yield curves based on company ratings and characteristics of unlisted fixed-interest preference shares. The main non-observable market input for private equity investments is the net asset value of the investment as published by the private equity company (or partner).
Valuation of private equity investments is based on the level 3 method of the fair value hierarchy. The main non-observable market input for private equity investments is the net asset value of the investment as published by the private equity company (or partner).
7. Investments – BondsThe valuation of these assets is consistent with the IFRS fair value hierarchy as described in paragraph D.1.1.
The revaluation from IFRS to Solvency II can be explained by the deconsolidation of a.s.r. Bank. The deconsolidation accounts for € -256 million of the revaluation.
8. Investments - Collective investment undertakingsThe valuation of these assets is consistent with the IFRS fair value hierarchy as described in paragraph D.1.1. The valuation of investment funds is based on the level 1 method of the fair value hierarchy.
9. Investments - DerivativesThe valuation of these assets is consistent with the fair value hierarchy as described in paragraph D.1.1. The valuation of listed derivatives is based on the level 1 method of the fair value hierarchy. The valuation of unlisted interest rate contracts is based on the level 2 method of the fair value hierarchy. The valuation techniques for financial instruments start from present value calculations; derivatives are valued based on forward-pricing and swap models. The observable market data contains yield curves based on company ratings and characteristics of unlisted fixed-interest preference shares.
10. Investments - Deposits other than cash equivalents and other investmentsThe fair value of the loans and receivables is based on the discounted cash flow method. It is obtained by calculating the present value based on expected future cash flows and assuming an interest rate curve used in the market that includes an additional spread based on the risk profile of the counterparty.
According to IFRS, loans and receivables are measured at amortized cost rather than at fair value.
11. Unit linked investments The valuation of these assets is consistent with the IFRS fair value hierarchy described in paragraph D.1.1.
12. Loans and mortgagesThe valuation of loans is based on the level 2 and level 3 (mortgages) method of the fair value hierarchy. The fair value of the loans is based on the discounted cash flow method. It is obtained by calculating the present value based on expected future cash flows and assuming an interest rate curve used in the market that includes an additional spread based on the risk profile of the counterparty. This asset category includes savings linked mortgages.
Many of the savings-linked mortgages that a.s.r. has sold in the past were combined with a mortgage loan from an external bank. This bank has undertaken to pay mortgage interest on the savings accrued in the insurance policy. To this end, the insurer transfers the premiums to a special deposit account with the bank. According to IFRS, both the insurance policy and the loan are measured at amortized cost. For the purpose of Solvency II, they are both measured at fair value, allowing for any securities the insurer receives on the funds deposited with the bank. The liability is measured separately (in accordance with the Delegated Acts and the guidance provided by Dutch Central Bank).
The valuation method used to determine the fair value of a.s.r.’s mortgage portfolio bases the spread on the interest rate curve for discounting the mortgage portfolio cash flows on consumer rates. The valuation according to IFRS is based on amortized cost.
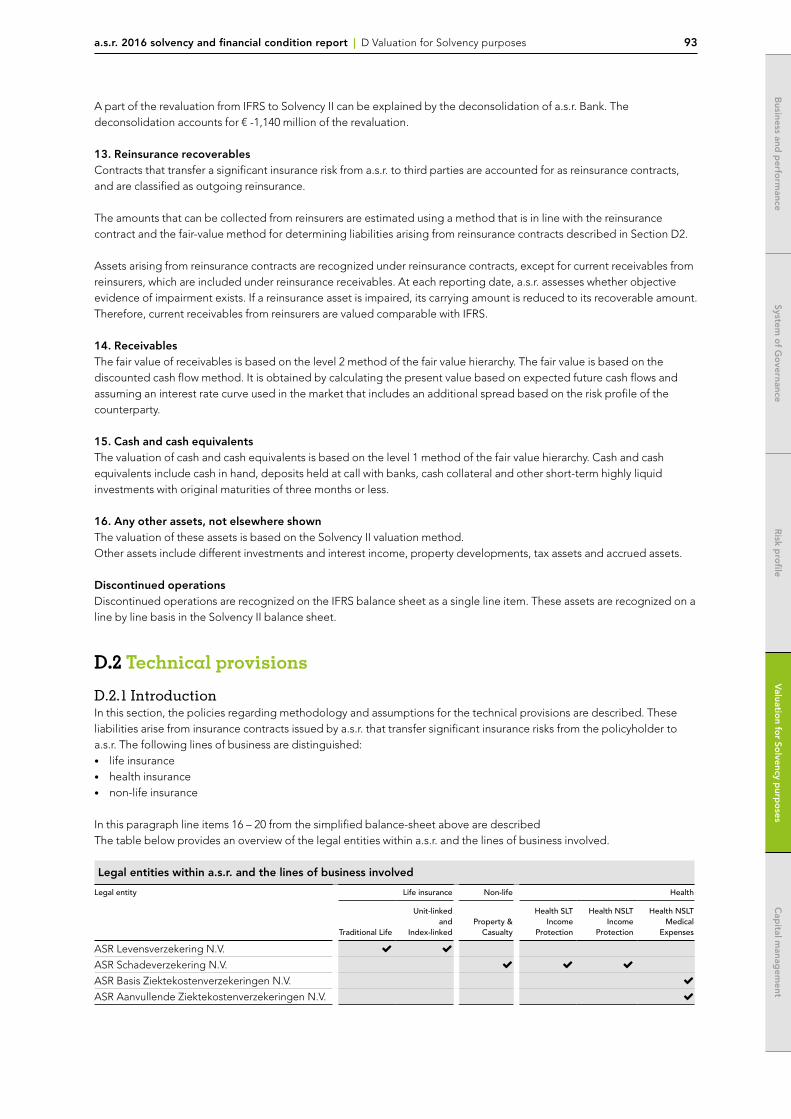
a.s.r. 2016 solvency and financial condition report | D Valuation for Solvency purposes 93
System o
f Go
vernance
System o
f Go
vernance
Risk p
rofile
Risk p
rofile
Valuatio
n for So
lvency purp
oses
Valuatio
n for So
lvency purp
oses
Cap
ital manag
ement
Cap
ital manag
ement
Business and
perfo
rmance
Business and
perfo
rmance
A part of the revaluation from IFRS to Solvency II can be explained by the deconsolidation of a.s.r. Bank. The deconsolidation accounts for € -1,140 million of the revaluation.
13. Reinsurance recoverablesContracts that transfer a significant insurance risk from a.s.r. to third parties are accounted for as reinsurance contracts, and are classified as outgoing reinsurance.
The amounts that can be collected from reinsurers are estimated using a method that is in line with the reinsurance contract and the fair-value method for determining liabilities arising from reinsurance contracts described in Section D2.
Assets arising from reinsurance contracts are recognized under reinsurance contracts, except for current receivables from reinsurers, which are included under reinsurance receivables. At each reporting date, a.s.r. assesses whether objective evidence of impairment exists. If a reinsurance asset is impaired, its carrying amount is reduced to its recoverable amount. Therefore, current receivables from reinsurers are valued comparable with IFRS.
14. ReceivablesThe fair value of receivables is based on the level 2 method of the fair value hierarchy. The fair value is based on the discounted cash flow method. It is obtained by calculating the present value based on expected future cash flows and assuming an interest rate curve used in the market that includes an additional spread based on the risk profile of the counterparty.
15. Cash and cash equivalentsThe valuation of cash and cash equivalents is based on the level 1 method of the fair value hierarchy. Cash and cash equivalents include cash in hand, deposits held at call with banks, cash collateral and other short-term highly liquid investments with original maturities of three months or less.
16. Any other assets, not elsewhere shownThe valuation of these assets is based on the Solvency II valuation method.Other assets include different investments and interest income, property developments, tax assets and accrued assets.
Discontinued operationsDiscontinued operations are recognized on the IFRS balance sheet as a single line item. These assets are recognized on a line by line basis in the Solvency II balance sheet.
D.2 Technical provisions
D.2.1 Introduction In this section, the policies regarding methodology and assumptions for the technical provisions are described. These liabilities arise from insurance contracts issued by a.s.r. that transfer significant insurance risks from the policyholder to a.s.r. The following lines of business are distinguished:• life insurance• health insurance• non-life insurance
In this paragraph line items 16 – 20 from the simplified balance-sheet above are describedThe table below provides an overview of the legal entities within a.s.r. and the lines of business involved.
Legal entities within a.s.r. and the lines of business involved
Legal entity Life insurance Non-life Health
Traditional Life
Unit-linked and
Index-linkedProperty &
Casualty
Health SLTIncome
Protection
Health NSLTIncome
Protection
Health NSLT Medical
Expenses
ASR Levensverzekering N.V.
ASR Schadeverzekering N.V.
ASR Basis Ziektekostenverzekeringen N.V.
ASR Aanvullende Ziektekostenverzekeringen N.V.
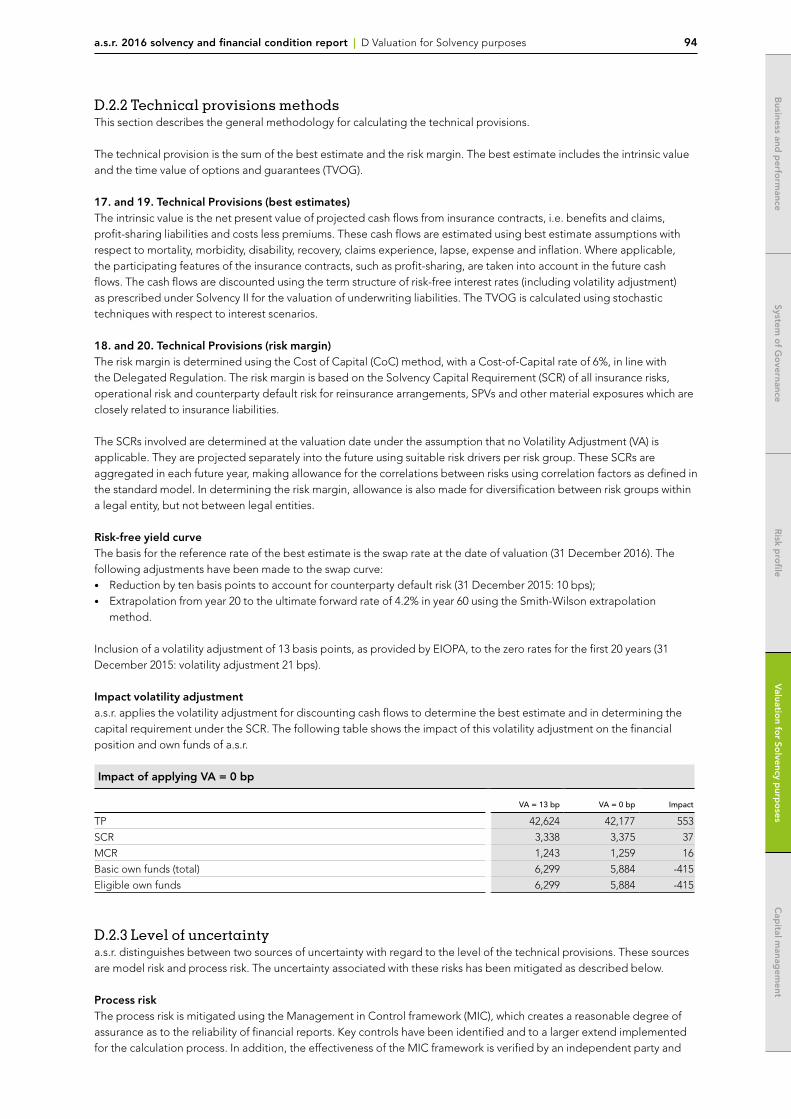
a.s.r. 2016 solvency and financial condition report | D Valuation for Solvency purposes 94
System o
f Go
vernanceR
isk pro
fileV
aluation fo
r Solvency p
urpo
sesC
apital m
anagem
entB
usiness and p
erform
ance
D.2.2 Technical provisions methodsThis section describes the general methodology for calculating the technical provisions.
The technical provision is the sum of the best estimate and the risk margin. The best estimate includes the intrinsic value and the time value of options and guarantees (TVOG).
17. and 19. Technical Provisions (best estimates)The intrinsic value is the net present value of projected cash flows from insurance contracts, i.e. benefits and claims, profit-sharing liabilities and costs less premiums. These cash flows are estimated using best estimate assumptions with respect to mortality, morbidity, disability, recovery, claims experience, lapse, expense and inflation. Where applicable, the participating features of the insurance contracts, such as profit-sharing, are taken into account in the future cash flows. The cash flows are discounted using the term structure of risk-free interest rates (including volatility adjustment) as prescribed under Solvency II for the valuation of underwriting liabilities. The TVOG is calculated using stochastic techniques with respect to interest scenarios.
18. and 20. Technical Provisions (risk margin)The risk margin is determined using the Cost of Capital (CoC) method, with a Cost-of-Capital rate of 6%, in line with the Delegated Regulation. The risk margin is based on the Solvency Capital Requirement (SCR) of all insurance risks, operational risk and counterparty default risk for reinsurance arrangements, SPVs and other material exposures which are closely related to insurance liabilities.
The SCRs involved are determined at the valuation date under the assumption that no Volatility Adjustment (VA) is applicable. They are projected separately into the future using suitable risk drivers per risk group. These SCRs are aggregated in each future year, making allowance for the correlations between risks using correlation factors as defined in the standard model. In determining the risk margin, allowance is also made for diversification between risk groups within a legal entity, but not between legal entities.
Risk-free yield curveThe basis for the reference rate of the best estimate is the swap rate at the date of valuation (31 December 2016). The following adjustments have been made to the swap curve:• Reduction by ten basis points to account for counterparty default risk (31 December 2015: 10 bps);• Extrapolation from year 20 to the ultimate forward rate of 4.2% in year 60 using the Smith-Wilson extrapolation
method.
Inclusion of a volatility adjustment of 13 basis points, as provided by EIOPA, to the zero rates for the first 20 years (31 December 2015: volatility adjustment 21 bps).
Impact volatility adjustmenta.s.r. applies the volatility adjustment for discounting cash flows to determine the best estimate and in determining the capital requirement under the SCR. The following table shows the impact of this volatility adjustment on the financial position and own funds of a.s.r.
Impact of applying VA = 0 bp
VA = 13 bp VA = 0 bp Impact
TP 42,624 42,177 553
SCR 3,338 3,375 37
MCR 1,243 1,259 16
Basic own funds (total) 6,299 5,884 -415
Eligible own funds 6,299 5,884 -415
D.2.3 Level of uncertainty a.s.r. distinguishes between two sources of uncertainty with regard to the level of the technical provisions. These sources are model risk and process risk. The uncertainty associated with these risks has been mitigated as described below.
Process risk The process risk is mitigated using the Management in Control framework (MIC), which creates a reasonable degree of assurance as to the reliability of financial reports. Key controls have been identified and to a larger extend implemented for the calculation process. In addition, the effectiveness of the MIC framework is verified by an independent party and
a.s.r. 2016 solvency and financial condition report | D Valuation for Solvency purposes 95
System o
f Go
vernance
System o
f Go
vernance
Risk p
rofile
Risk p
rofile
Valuatio
n for So
lvency purp
oses
Valuatio
n for So
lvency purp
oses
Cap
ital manag
ement
Cap
ital manag
ement
Business and
perfo
rmance
Business and
perfo
rmance
supplementary checks are performed where needed. As part of MIC or the additional checks, the four-eye principle has demonstrably been applied to the calculation of the technical provision.
Model risk The second risk that a.s.r. has identified in relation to the technical provisions is model risk. Regular procedures have provided adequate certainty with regard to this risk. To illustrate, the CFRO in charge signs off documents to demonstrate that the reported figures do not contain any material misstatements or that no key facts have been omitted. In addition, FRM, in its role as the second line of defence, performs an independent internal review of the technical provisions as described in the previous phase.
In 2014, a.s.r. initiated a project, in preparation for Solvency II, to further raise the level of certainty of the models underlying the Solvency II calculations. By the end of 2016 the larger part of the models has been validated. For models that have not been validated yet, measures are taken to mitigate the uncertainty.
D.2.4 Reinsurance and special purpose vehicles (SPVs)Contracts that transfer a significant insurance risk from a.s.r. to third parties are accounted for as reinsurance contracts, and are classified as outgoing reinsurance.
Assets arising from reinsurance contracts are recognized under reinsurance contracts, except for current receivables from reinsurers, which are included under reinsurance receivables. At each reporting date a.s.r. assesses whether objective evidence of impairment exists. If a reinsurance asset is impaired, its carrying amount is reduced to its recoverable amount. Therefore, current receivables from reinsurers are valued comparable with IFRS.ASR Levensverzekering N.V. has reinsured a substantial part of all underwriting risk of a certain group pension contract on a proportional basis. In addition, a reinsurance on a stop-loss basis is applicable to the risk of a mass lapse event for a selected part of the portfolio with considerable lapse risk. A claim is paid out by the reinsurer if the one-year mass lapse exceeds 15%.
ASR Schadeverzekering N.V. has reinsured a substantial part of the Individual Health SLT portfolio on a proportional basis.More details on reinsurance can be found in the appendix.
a.s.r. does not make use of special purpose vehicles (SPVs).
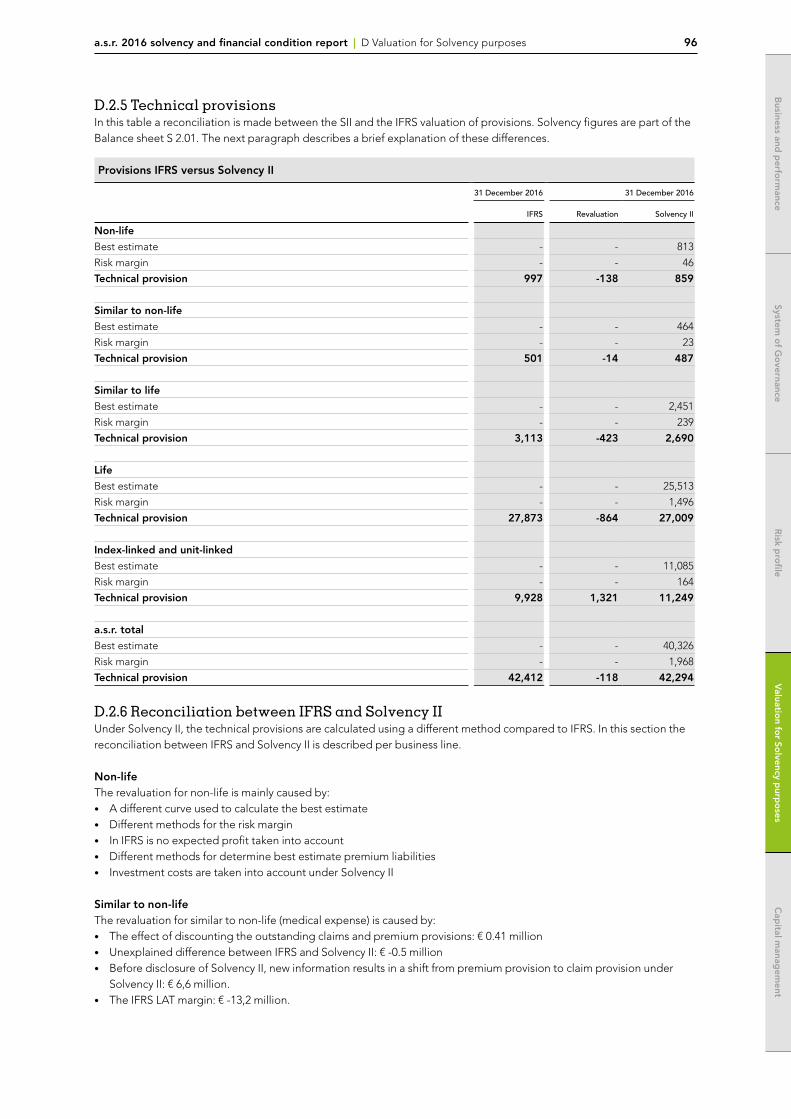
a.s.r. 2016 solvency and financial condition report | D Valuation for Solvency purposes 96
System o
f Go
vernanceR
isk pro
fileV
aluation fo
r Solvency p
urpo
sesC
apital m
anagem
entB
usiness and p
erform
ance
D.2.5 Technical provisions In this table a reconciliation is made between the SII and the IFRS valuation of provisions. Solvency figures are part of the Balance sheet S 2.01. The next paragraph describes a brief explanation of these differences.
Provisions IFRS versus Solvency II
31 December 2016 31 December 2016
IFRS Revaluation Solvency II
Non-life
Best estimate - - 813
Risk margin - - 46
Technical provision 997 -138 859
Similar to non-life
Best estimate - - 464
Risk margin - - 23
Technical provision 501 -14 487
Similar to life
Best estimate - - 2,451
Risk margin - - 239
Technical provision 3,113 -423 2,690
Life
Best estimate - - 25,513
Risk margin - - 1,496
Technical provision 27,873 -864 27,009
Index-linked and unit-linked
Best estimate - - 11,085
Risk margin - - 164
Technical provision 9,928 1,321 11,249
a.s.r. total
Best estimate - - 40,326
Risk margin - - 1,968
Technical provision 42,412 -118 42,294
D.2.6 Reconciliation between IFRS and Solvency IIUnder Solvency II, the technical provisions are calculated using a different method compared to IFRS. In this section the reconciliation between IFRS and Solvency II is described per business line.
Non-lifeThe revaluation for non-life is mainly caused by:• A different curve used to calculate the best estimate• Different methods for the risk margin• In IFRS is no expected profit taken into account• Different methods for determine best estimate premium liabilities• Investment costs are taken into account under Solvency II
Similar to non-lifeThe revaluation for similar to non-life (medical expense) is caused by:• The effect of discounting the outstanding claims and premium provisions: € 0.41 million• Unexplained difference between IFRS and Solvency II: € -0.5 million• Before disclosure of Solvency II, new information results in a shift from premium provision to claim provision under
Solvency II: € 6,6 million.• The IFRS LAT margin: € -13,2 million.
a.s.r. 2016 solvency and financial condition report | D Valuation for Solvency purposes 97
System o
f Go
vernance
System o
f Go
vernance
Risk p
rofile
Risk p
rofile
Valuatio
n for So
lvency purp
oses
Valuatio
n for So
lvency purp
oses
Cap
ital manag
ement
Cap
ital manag
ement
Business and
perfo
rmance
Business and
perfo
rmance
The revaluation for similar to non-life (income protection) is caused by:• The main difference between IFRS and Solvency II best estimate and risk margin is different assumptions with respect
to disability and recovery.
Similar to lifeFor similar to life the main difference between the IFRS technical provisions and Best estimate and risk margin (Solvency II) is different assumptions with respect to disability and recovery.
LifeThe IFRS technical provisions are determined with assumptions that are equal to the assumptions underlying the premium. For longevity risk additional provisions are set up. Also under IFRS provisions are setup for realized capital gains, interest rate swaptions andshadow accounting (unrealized gains on bonds). In case that the policy-duration exceeds the length of the premium-paying period, a provision for administrative expenses is set up for the period where no premiums are due.
The Solvency II provision consists of a best estimate and a risk margin. The best estimate includes a time value of option and guarantees with respect to profit sharing. The best estimate is determined on best estimate assumptions and covers future benefits and future expenses to the extent that they are not covered by future premiums.
Index-linked and unit-linkedThe technical provision for unit-linked policies under IFRS equals the fund value of the underlying assets of the units. Extra provisions are set up in case of minimum guarantees on the maturity-value provided by a.s.r. Leven and for the transparency issue.
The Solvency II technical provision consist of the fund value less the net present value of the best estimate value of the future profits. For policies where a guarantee with respect to the maturity-value is given, the value of the guarantee is determined on a market consistent basis, using stochastic techniques. Also for the transparency issue some provision is set up.
Technical provisions Pension scheme a.s.r.For a.s.r. Leven the pension scheme of a.s.r.-employees is involved on the balance sheet under technical provision life. On group level this scheme is mentioned as an employee benefit obligation.
D.3 Other liabilities
D.3.1 Valuation of other liabilities In line with the valuation of assets, the accounting principles for other liabilities used in the Pillar III reports are generally also based on the IFRS as adopted by the EU. Any differences between the methods for IFRS and Solvency II purposes are addressed in detail per liability category. In this paragraph line items 21-24 from the simplified balance-sheet aboveare described
21. Pension benefit obligationsa.s.r. has in place a number of defined benefit plans for own staff. These are schemes under which staff are awarded pension benefits upon retirement, usually dependent on one or more factors such as years of service and salary. The defined benefit obligation is calculated by independent actuaries at each reporting date.
Pension obligations are calculated using the projected unit credit method. Inherent to this method is the application of actuarial assumptions to discount rates, future salary increases and bonuses, mortality rates and consumer price indices. The assumptions are reviewed and updated at each reporting date based on available market data.
Actuarial assumptions may differ considerably from actual results due to changes in market conditions, economic developments, mortality trends and other assumptions. Any change in these assumptions can have a significant impact on the defined benefit obligation and future pension costs. Changes in the expected actuarial assumptions and differences with the actual actuarial outcomes are recognized in actuarial gains and losses included in other comprehensive income (component of total equity).
When employee benefit plans are modified and no further obligations exist, any gains or losses resulting from changes are recognized directly through profit of loss.
a.s.r. 2016 solvency and financial condition report | D Valuation for Solvency purposes 98
System o
f Go
vernanceR
isk pro
fileV
aluation fo
r Solvency p
urpo
sesC
apital m
anagem
entB
usiness and p
erform
ance
The financing cost related to employee benefits is recognized in interest expense. Current service costs are included in operating expenses.
The IFRS value of the own pension contract is based on IAS19R (using a discount rate derived from AA Corporate bonds 31 December 2016: 1.73%). For SCR purposes, the IFRS value of the own pension contractis based on the IAS19R valuation methodology. The explanatory guidelines explain that the IAS19 valuation is consistent with Solvency II.
A risk margin with respect to the employee benefits is recognized based on the risk margin of the internal insurance contract.
22. Deferred tax liabilitiesThe basis for the DTA / DTL position in the IFRS balance sheet is temporary differences between fiscal and commercial valuation. This DTA / DTL position is the base for this line item on the Solvency II balance sheet, adjusted for Solvency II revaluations:• The largest DTL mutation is caused by the higher (valuation) mortgages and savings unloading• The largest DTA mutations are mainly caused by the (lower) valuation of technical provisions
In accordance with the Delegated Regulation the DTA / DTL position is netted in the balance sheet. The balance sheet of asr NL contains a DTA.
23. Subordinated liabilitiesIn IFRS the perpetual hybrid loans are classified as equity as there is no requirement to settle the obligation in cash or another financial asset or to exchange financial assets or financial liabilities under conditions that are potentially unfavourable for a.s.r.
Directed by the regulator in Solvency reporting the perpetual hybrid loans are classified as subordinated liabilities.
24. Other liabilitiesOther Liabilities contains different small line items:
Other long-term employee benefitsPlans that offer benefits for long-service leave but do not qualify as post-employment benefit plans, such as jubilee benefits, are measured at present value using the projected unit credit method and changes are recognized directly through profit or loss.
Other post-retirement obligationsa.s.r. offers post-retirement benefit plans, such an arrangement for mortgage loans at favorable interest rates. The entitlement to these benefits is usually conditional on the employee remaining in service up to their retirement age and the completion of a minimum service period. The expected costs of these benefits are accrued over the period of employment using an accounting methodology that is similar to that for defined benefit plans.
Vacation entitlementsA liability is formed for leave days not taken at year-end.
The regulatory curve is used to determine the discount rate under Pillar 3. For IFRS purposes, the discount rate is determined based on the return (zero coupon rate) on high-quality corporate bonds (AA rating) and the duration of the pension obligation. The discount rate methodology is based on the IBoxx € Corporates AA 10+ curve. All other assumptions and the projected unit credit calculation method are consistent with those applied in the accounting policies used in the IFRS financial statements.
Debts owed to credit institutionsThe valuation of these liabilities follows the Solvency II fair value hierarchy as described in paragraph D.1.1.
Financial liabilities other than debts owed to credit institutionsThe valuation of these liabilities follows the IFRS fair value hierarchy as described in paragraph D.1.1.
Subsequent valuation has to be consistent with the requirements of Article 75 of the Solvency II directive. Therefore, no subsequent adjustments to take account of the change in own credit standing shall take place. However, adjustments for changes in the risk-free rate must be accounted for subsequently. This means that the subordinated loans are discounted using the risk-free rate plus a credit spread at inception of the liability.

a.s.r. 2016 solvency and financial condition report | D Valuation for Solvency purposes 99
System o
f Go
vernance
System o
f Go
vernance
Risk p
rofile
Risk p
rofile
Valuatio
n for So
lvency purp
oses
Valuatio
n for So
lvency purp
oses
Cap
ital manag
ement
Cap
ital manag
ement
Business and
perfo
rmance
Business and
perfo
rmance
Insurance and Intermediaries payablesThe valuation of these liabilities follows the Solvency II fair value hierarchy as described in paragraph D.1.1 This category is subject to the same valuation as the asset category Cash and Cash equivalents.
Trade payables (non-insurance)The valuation of these liabilities follows the Solvency II fair value hierarchy as described in paragraph D.1.1 This category is subject to the same valuation as the asset category receivables.
Any other liabilities not disclosed elsewhereThe valuation of these liabilities follows the Solvency II fair value hierarchy as described in paragraph D.1.1. This item consists primarily of tax payables.
Contingent liabilitiesContingent liabilities are defined as:• a possible obligation depending on whether some uncertain future event occurs, or • a present obligation but payment is not probable or the amount cannot be measured reliably.
Contingent liabilities are recognized on the IFRS balance sheet if there is a probability of >50% that the contingent liability leads to an “outflow of resources”. These liabilities are also recognized on the Solvency II balance sheet.
Solvency II prescribes that all contingent liabilities be recognized on the Solvency II balance sheet. This covers cases where the amount cannot be measured reliably or when the probability is <50%. For these cases, a regular process is in place to determine whether contingent liabilities should be recognized on the Solvency II balance sheet.
The a.s.r. Solvency II capital ratio does not include contingent liabilities.
Discontinued OperationsLiabilities for discontinued operations are recognized on the IFRS Balance sheet as a single line item. These liabilities are recognized on a line by line basis in the Solvency II balance sheet.
D.3.2 Reconciliation from Solvency II equity to EOFThe differences described in the above sections are the basis for the reconciliation of IFRS equity to Solvency II equity. To reconciliate from Solvency II equity to EOF, the following movements are taken into consideration:
Subordinated liabilitiesIn accordance with the Delegated Regulation the subordinated liabilities are part of the EOF. Further information of this liabilities is described in section E 1.4.
Foreseeable dividends and distributionsDividends for 2017 that are approved after the reporting date are deducted from the available capital position as foreseeable dividends and distributions.
Deductions for participations in financial and credit institutionsParticipations in financial and credit institutions exceeding 10% are not supervised by the Solvency II framework and are therefore excluded from the eligible own fund items.
Tier 3 limitationsIn accordance with the Delegated Regulation EOF is divided in tiering components. There are boundary conditions related to the size of these components. Excess of this limits results in capping of EOF. For a.s.r. Nederland capping does not apply per Q4 2016.

System o
f Go
vernanceR
isk pro
fileV
aluation fo
r Solvency p
urpo
sesC
apital m
anagem
entB
usiness and p
erform
ance
a.s.r. 2016 solvency and financial condition report | D Valuation for Solvency purposes 100
System o
f Go
vernanceR
isk pro
fileV
aluation fo
r Solvency p
urpo
sesC
apital m
anagem
entB
usiness and p
erform
ance
D.4 Alternative methods for valuation
a.s.r. does not apply alternative methods for valuation.
D.5 Any other information
Other material information about valuation does not apply.
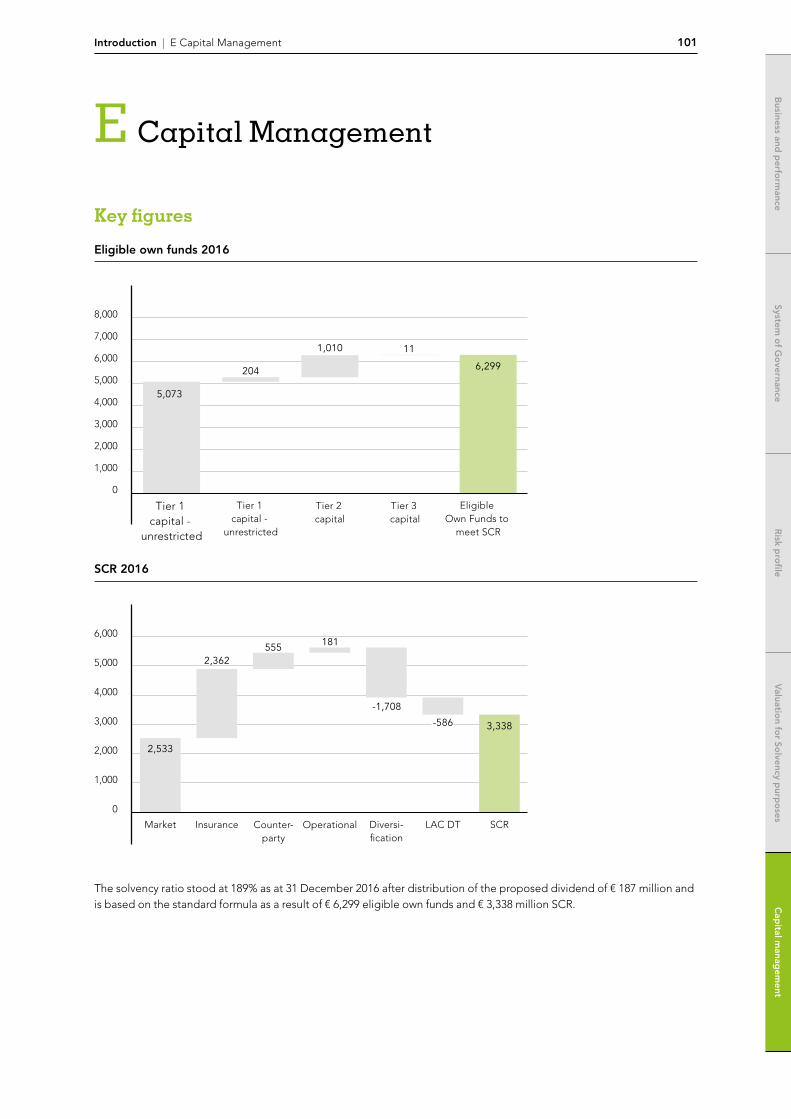
Introduction | E Capital Management 101
System o
f Go
vernance
System o
f Go
vernance
Risk p
rofile
Risk p
rofile
Valuatio
n for So
lvency purp
oses
Valuatio
n for So
lvency purp
oses
Cap
ital manag
ement
Cap
ital manag
ement
Business and
perfo
rmance
Business and
perfo
rmance
System o
f Go
vernanceR
isk pro
fileV
aluation fo
r Solvency p
urpo
sesC
apital m
anagem
entB
usiness and p
erform
ance
E Capital Management
Key figures
Eligible own funds 2016
8,000
7,000
6,000
5,000
4,000
3,000
2,000
1,000
0
Tier 1 capital -
unrestricted
5,073
204
1,010 11
6,299
Tier 1 capital -
unrestricted
Tier 2 capital
Tier 3 capital
Eligible Own Funds to
meet SCR
SCR 2016
6,000
5,000
4,000
3,000
2,000
1,000
0
Market
2,533
1815552,362
-1,708
3,338
Insurance Counter-party
Operational SCRLAC DTDiversi-fication
-586
The solvency ratio stood at 189% as at 31 December 2016 after distribution of the proposed dividend of € 187 million and is based on the standard formula as a result of € 6,299 eligible own funds and € 3,338 million SCR.
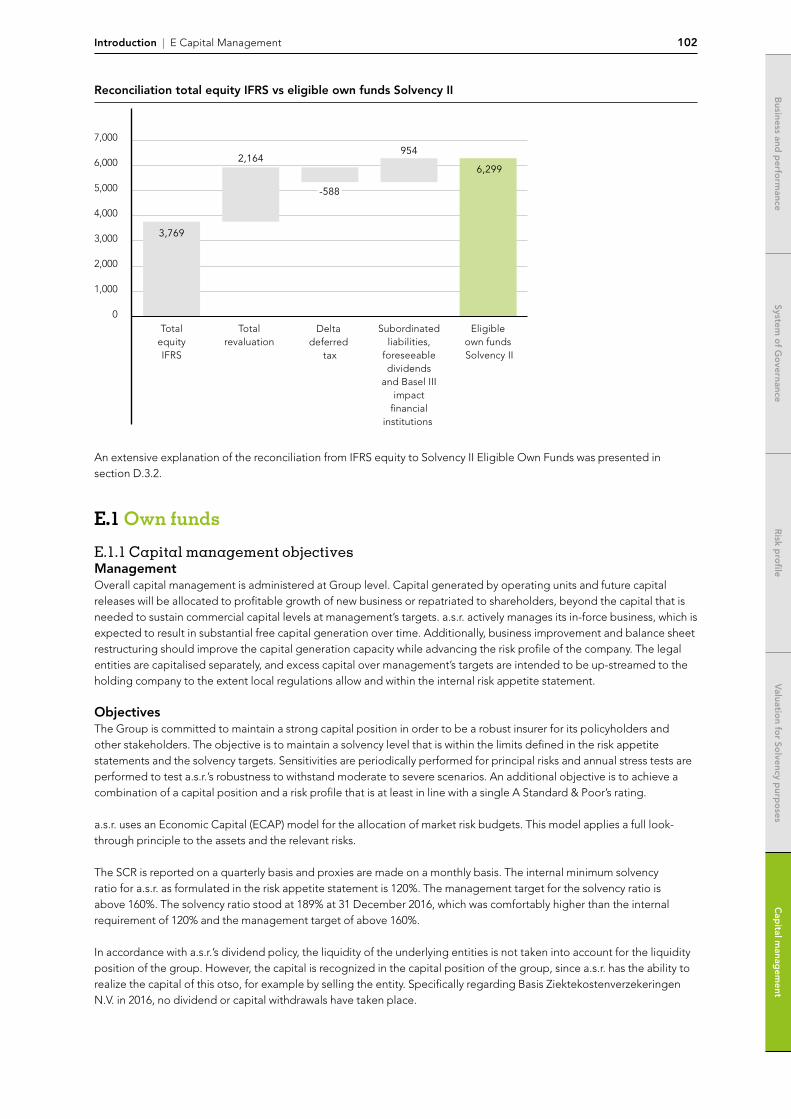
Introduction | E Capital Management 102
System o
f Go
vernanceR
isk pro
fileV
aluation fo
r Solvency p
urpo
sesC
apital m
anagem
entB
usiness and p
erform
ance
Reconciliation total equity IFRS vs eligible own funds Solvency II
7,000
6,000
5,000
4,000
3,000
2,000
1,000
0Total
equityIFRS
3,769
2,164954
6,299
Totalrevaluation
Subordinatedliabilities,
foreseeabledividends
and Basel IIIimpact
financialinstitutions
Delta deferred
tax
Eligible own funds Solvency II
-588
An extensive explanation of the reconciliation from IFRS equity to Solvency II Eligible Own Funds was presented in section D.3.2.
E.1 Own funds
E.1.1 Capital management objectivesManagementOverall capital management is administered at Group level. Capital generated by operating units and future capital releases will be allocated to profitable growth of new business or repatriated to shareholders, beyond the capital that is needed to sustain commercial capital levels at management’s targets. a.s.r. actively manages its in-force business, which is expected to result in substantial free capital generation over time. Additionally, business improvement and balance sheet restructuring should improve the capital generation capacity while advancing the risk profile of the company. The legal entities are capitalised separately, and excess capital over management’s targets are intended to be up-streamed to the holding company to the extent local regulations allow and within the internal risk appetite statement.
ObjectivesThe Group is committed to maintain a strong capital position in order to be a robust insurer for its policyholders and other stakeholders. The objective is to maintain a solvency level that is within the limits defined in the risk appetite statements and the solvency targets. Sensitivities are periodically performed for principal risks and annual stress tests are performed to test a.s.r.’s robustness to withstand moderate to severe scenarios. An additional objective is to achieve a combination of a capital position and a risk profile that is at least in line with a single A Standard & Poor’s rating.
a.s.r. uses an Economic Capital (ECAP) model for the allocation of market risk budgets. This model applies a full look-through principle to the assets and the relevant risks.
The SCR is reported on a quarterly basis and proxies are made on a monthly basis. The internal minimum solvency ratio for a.s.r. as formulated in the risk appetite statement is 120%. The management target for the solvency ratio is above 160%. The solvency ratio stood at 189% at 31 December 2016, which was comfortably higher than the internal requirement of 120% and the management target of above 160%.
In accordance with a.s.r.’s dividend policy, the liquidity of the underlying entities is not taken into account for the liquidity position of the group. However, the capital is recognized in the capital position of the group, since a.s.r. has the ability to realize the capital of this otso, for example by selling the entity. Specifically regarding Basis Ziektekostenverzekeringen N.V. in 2016, no dividend or capital withdrawals have taken place.
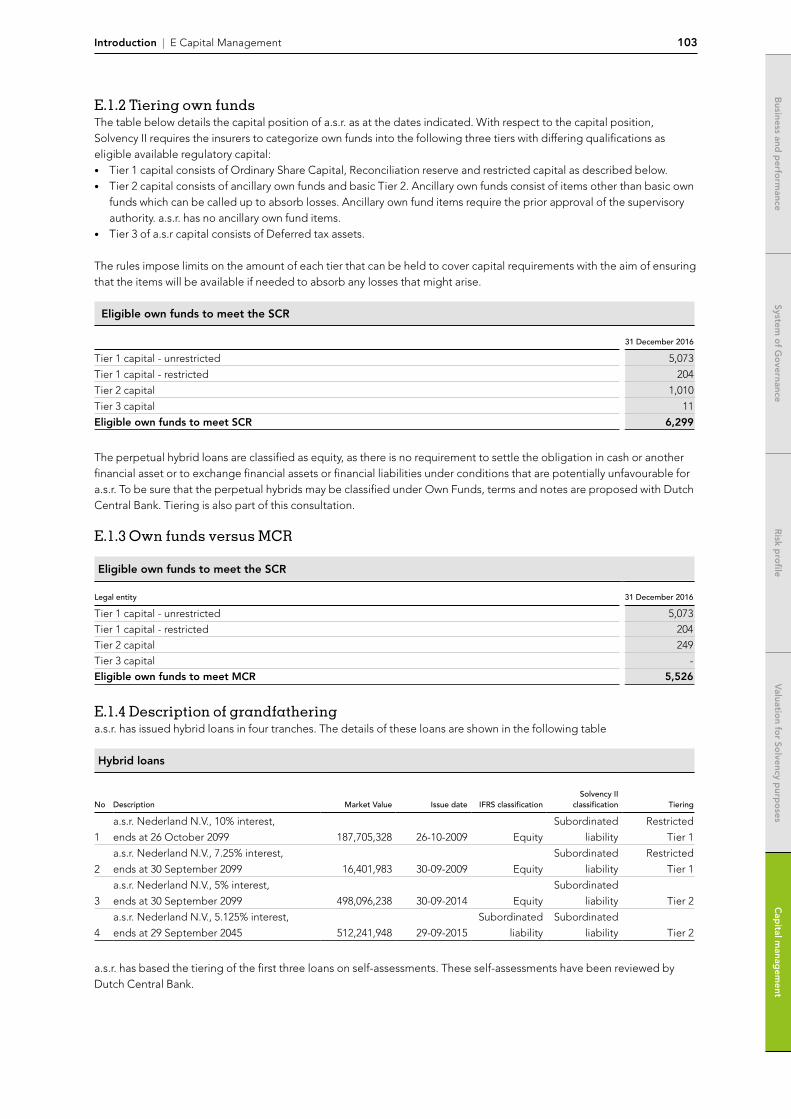
Introduction | E Capital Management 103
System o
f Go
vernance
System o
f Go
vernance
Risk p
rofile
Risk p
rofile
Valuatio
n for So
lvency purp
oses
Valuatio
n for So
lvency purp
oses
Cap
ital manag
ement
Cap
ital manag
ement
Business and
perfo
rmance
Business and
perfo
rmance
E.1.2 Tiering own fundsThe table below details the capital position of a.s.r. as at the dates indicated. With respect to the capital position, Solvency II requires the insurers to categorize own funds into the following three tiers with differing qualifications as eligible available regulatory capital: • Tier 1 capital consists of Ordinary Share Capital, Reconciliation reserve and restricted capital as described below. • Tier 2 capital consists of ancillary own funds and basic Tier 2. Ancillary own funds consist of items other than basic own
funds which can be called up to absorb losses. Ancillary own fund items require the prior approval of the supervisory authority. a.s.r. has no ancillary own fund items.
• Tier 3 of a.s.r capital consists of Deferred tax assets.
The rules impose limits on the amount of each tier that can be held to cover capital requirements with the aim of ensuring that the items will be available if needed to absorb any losses that might arise.
Eligible own funds to meet the SCR
31 December 2016
Tier 1 capital - unrestricted 5,073
Tier 1 capital - restricted 204
Tier 2 capital 1,010
Tier 3 capital 11
Eligible own funds to meet SCR 6,299
The perpetual hybrid loans are classified as equity, as there is no requirement to settle the obligation in cash or another financial asset or to exchange financial assets or financial liabilities under conditions that are potentially unfavourable for a.s.r. To be sure that the perpetual hybrids may be classified under Own Funds, terms and notes are proposed with Dutch Central Bank. Tiering is also part of this consultation.
E.1.3 Own funds versus MCR
Eligible own funds to meet the SCR
Legal entity 31 December 2016
Tier 1 capital - unrestricted 5,073
Tier 1 capital - restricted 204
Tier 2 capital 249
Tier 3 capital -
Eligible own funds to meet MCR 5,526
E.1.4 Description of grandfatheringa.s.r. has issued hybrid loans in four tranches. The details of these loans are shown in the following table
Hybrid loans
No Description Market Value Issue date IFRS classificationSolvency II
classification Tiering
1
a.s.r. Nederland N.V., 10% interest,
ends at 26 October 2099 187,705,328 26-10-2009 Equity
Subordinated
liability
Restricted
Tier 1
2
a.s.r. Nederland N.V., 7.25% interest,
ends at 30 September 2099 16,401,983 30-09-2009 Equity
Subordinated
liability
Restricted
Tier 1
3
a.s.r. Nederland N.V., 5% interest,
ends at 30 September 2099 498,096,238 30-09-2014 Equity
Subordinated
liability Tier 2
4
a.s.r. Nederland N.V., 5.125% interest,
ends at 29 September 2045 512,241,948 29-09-2015
Subordinated
liability
Subordinated
liability Tier 2
a.s.r. has based the tiering of the first three loans on self-assessments. These self-assessments have been reviewed by Dutch Central Bank.
Introduction | E Capital Management 104
System o
f Go
vernanceR
isk pro
fileV
aluation fo
r Solvency p
urpo
sesC
apital m
anagem
entB
usiness and p
erform
ance
Loans 1 and 2 are step-up fixed floating perpetuals. Dutch Central Bank has ascertained that:• the loans were issued before 17 January 2015;• the loans currently qualify as higher additional capital under Solvency I; and• the loans do not qualify directly as Tier 1 or Tier 2 under Solvency II.
Dutch Central Bank concludes that loans 1 and 2 qualify for grandfathering to Tier 1 under Solvency II for a maximum period of ten years, but a.s.r. shall redeem both loans at the first call date in 2019, following permission from Dutch Central Bank, in line with earlier agreements with Dutch Central Bank.
E.2 Solvency Capital Requirement
E.2.1. Method for determining the Group solvency capitalGroup supervisiona.s.r. is subject to group supervision in accordance with Article 212 of the Directive. No entities have been excluded from group supervision in accordance with Article 214 of the Solvency II Directive.
Group solvencyThe Directive prescribes two methods for the calculation of the group solvency:• method 1 - Standard method based on consolidation of financial statements (Directive Article 230, Regulation Articles
336-340);• method 2 - Alternative method based on deduction and aggregation (Directive Article 233 Regulation Article 342).
a.s.r. applies Method 1 (Default method) for the determination of the group solvency. The basis for this is the consolidation structure used for the IFRS financial statements, with exemption of a.s.r. Bank.
The consolidated data are calculated based on the consolidated financial statements, which is valued in accordance with the Solvency II regulations concerning the determination and valuation of the balance sheet, as well as the inclusion and treatment of the associated companies.
Group solvency is calculated as the difference between:a. the own funds eligible to cover the Solvency Capital Requirement, calculated on the basis of consolidated data;b. the Solvency Capital Requirement at group level calculated on the basis of consolidated data.
The determination of the group Solvency II requirement and Eligible Own Funds is discussed below.
Calculation of the group consolidated Solvency Capital Requirement The starting point in determining the consolidated Solvency Capital Requirement of the group is the consolidated Solvency II balance sheet as described above. The risk calculations are performed on the following basis:• market risks are based on the consolidated balance sheet;• insurance risks are based on the sum of the underlying insurance risks for each insurance undertaking;• counterparty default risk is based on the consolidated balance sheet;• operational risk is based on the consolidated balance sheet.
Differences may arise between the results of the risk calculations of the group and the sum of the underlying entities:• diversification benefits within the market risk as a result of using condolidated data. a.s.r. calculates the market risk for
the insurance entities and for the group. At group level all subsidiaries are consolidated, which results in additional market risk (equity risk) for these entities;
• intercompany relationships between entities, and between entities and the holding company are eliminated at group level.
For the calculation of the required capital that should be held for the participations, it is of interest if the look-through approach is applicable or not. The underlying investments should be shocked by the relevant SCR modules (interest rates, real estate, counterparty concentration) if the look-through approach is applicable.
a.s.r. applies Method 1 for consolidation; this means that, inter alia, the ancillary service entities are to be consolidated on line-by-line basis. The individual SCRs are calculated on this basis. The look-through approach has to be applied.
Finally at group level the Solvency Capital Requirement of a.s.r. Bank is added. a.s.r. Bank is not consolidated. All other entities within the group are consolidated.
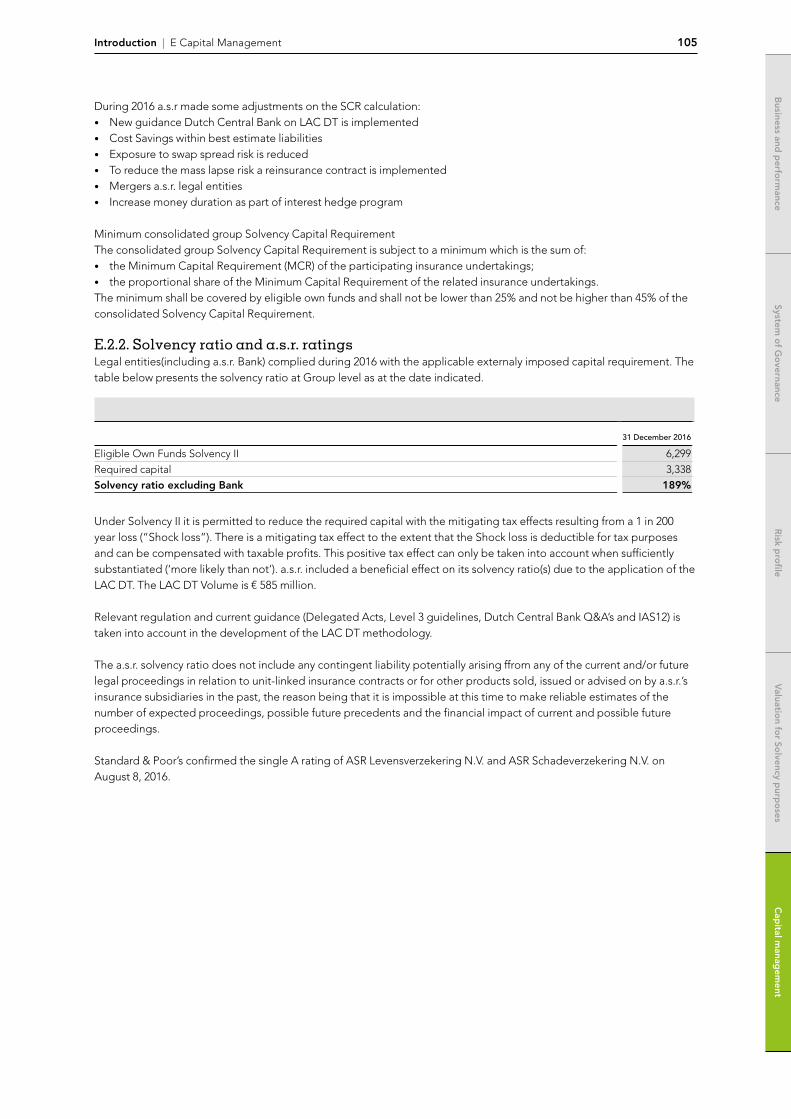
Introduction | E Capital Management 105
System o
f Go
vernance
System o
f Go
vernance
Risk p
rofile
Risk p
rofile
Valuatio
n for So
lvency purp
oses
Valuatio
n for So
lvency purp
oses
Cap
ital manag
ement
Cap
ital manag
ement
Business and
perfo
rmance
Business and
perfo
rmance
During 2016 a.s.r made some adjustments on the SCR calculation:• New guidance Dutch Central Bank on LAC DT is implemented• Cost Savings within best estimate liabilities• Exposure to swap spread risk is reduced• To reduce the mass lapse risk a reinsurance contract is implemented• Mergers a.s.r. legal entities• Increase money duration as part of interest hedge program
Minimum consolidated group Solvency Capital Requirement The consolidated group Solvency Capital Requirement is subject to a minimum which is the sum of:• the Minimum Capital Requirement (MCR) of the participating insurance undertakings;• the proportional share of the Minimum Capital Requirement of the related insurance undertakings.The minimum shall be covered by eligible own funds and shall not be lower than 25% and not be higher than 45% of the consolidated Solvency Capital Requirement.
E.2.2. Solvency ratio and a.s.r. ratingsLegal entities(including a.s.r. Bank) complied during 2016 with the applicable externaly imposed capital requirement. The table below presents the solvency ratio at Group level as at the date indicated.
31 December 2016
Eligible Own Funds Solvency II 6,299
Required capital 3,338
Solvency ratio excluding Bank 189%
Under Solvency II it is permitted to reduce the required capital with the mitigating tax effects resulting from a 1 in 200 year loss (“Shock loss”). There is a mitigating tax effect to the extent that the Shock loss is deductible for tax purposes and can be compensated with taxable profits. This positive tax effect can only be taken into account when sufficiently substantiated (‘more likely than not’). a.s.r. included a beneficial effect on its solvency ratio(s) due to the application of the LAC DT. The LAC DT Volume is € 585 million.
Relevant regulation and current guidance (Delegated Acts, Level 3 guidelines, Dutch Central Bank Q&A’s and IAS12) is taken into account in the development of the LAC DT methodology.
The a.s.r. solvency ratio does not include any contingent liability potentially arising ffrom any of the current and/or future legal proceedings in relation to unit-linked insurance contracts or for other products sold, issued or advised on by a.s.r.’s insurance subsidiaries in the past, the reason being that it is impossible at this time to make reliable estimates of the number of expected proceedings, possible future precedents and the financial impact of current and possible future proceedings.
Standard & Poor’s confirmed the single A rating of ASR Levensverzekering N.V. and ASR Schadeverzekering N.V. on August 8, 2016.
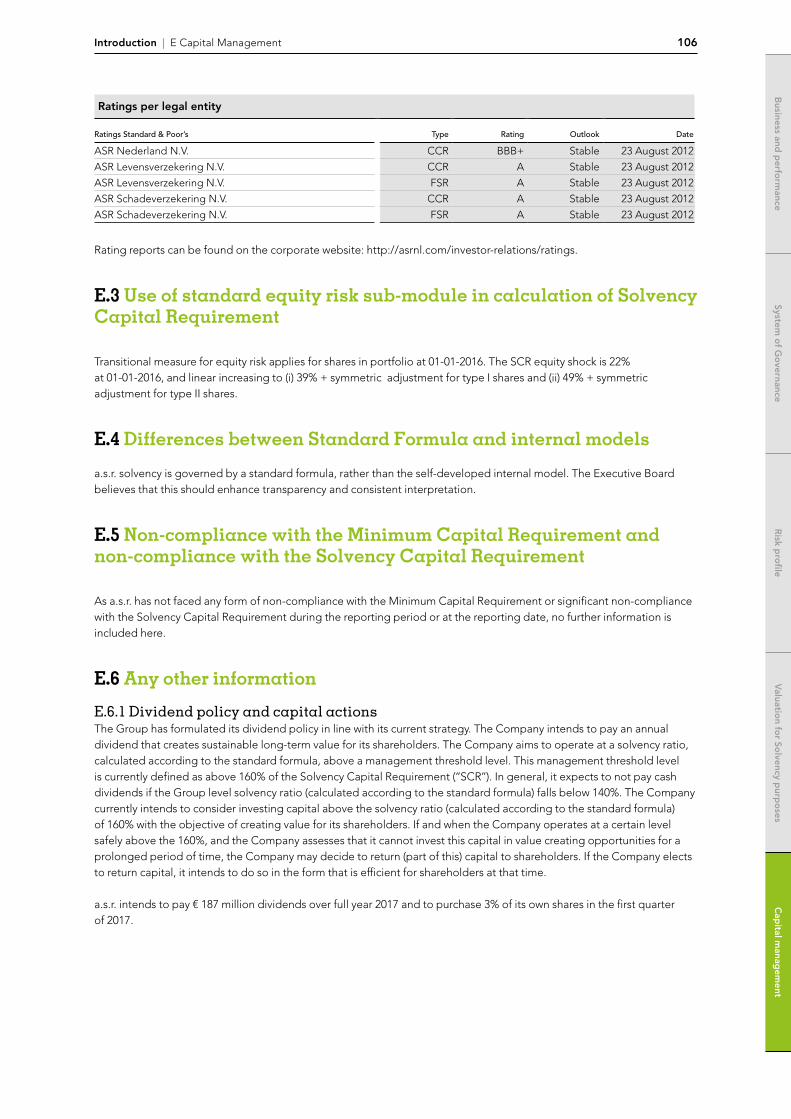
Introduction | E Capital Management 106
System o
f Go
vernanceR
isk pro
fileV
aluation fo
r Solvency p
urpo
sesC
apital m
anagem
entB
usiness and p
erform
ance
Ratings per legal entity
Ratings Standard & Poor’s Type Rating Outlook Date
ASR Nederland N.V. CCR BBB+ Stable 23 August 2012
ASR Levensverzekering N.V. CCR A Stable 23 August 2012
ASR Levensverzekering N.V. FSR A Stable 23 August 2012
ASR Schadeverzekering N.V. CCR A Stable 23 August 2012
ASR Schadeverzekering N.V. FSR A Stable 23 August 2012
Rating reports can be found on the corporate website: http://asrnl.com/investor-relations/ratings.
E.3 Use of standard equity risk sub-module in calculation of Solvency Capital Requirement
Transitional measure for equity risk applies for shares in portfolio at 01-01-2016. The SCR equity shock is 22% at 01-01-2016, and linear increasing to (i) 39% + symmetric adjustment for type I shares and (ii) 49% + symmetric adjustment for type II shares.
E.4 Differences between Standard Formula and internal models
a.s.r. solvency is governed by a standard formula, rather than the self-developed internal model. The Executive Board believes that this should enhance transparency and consistent interpretation.
E.5 Non-compliance with the Minimum Capital Requirement and non-compliance with the Solvency Capital Requirement
As a.s.r. has not faced any form of non-compliance with the Minimum Capital Requirement or significant non-compliance with the Solvency Capital Requirement during the reporting period or at the reporting date, no further information is included here.
E.6 Any other information
E.6.1 Dividend policy and capital actionsThe Group has formulated its dividend policy in line with its current strategy. The Company intends to pay an annual dividend that creates sustainable long-term value for its shareholders. The Company aims to operate at a solvency ratio, calculated according to the standard formula, above a management threshold level. This management threshold level is currently defined as above 160% of the Solvency Capital Requirement (‘‘SCR’’). In general, it expects to not pay cash dividends if the Group level solvency ratio (calculated according to the standard formula) falls below 140%. The Company currently intends to consider investing capital above the solvency ratio (calculated according to the standard formula) of 160% with the objective of creating value for its shareholders. If and when the Company operates at a certain level safely above the 160%, and the Company assesses that it cannot invest this capital in value creating opportunities for a prolonged period of time, the Company may decide to return (part of this) capital to shareholders. If the Company elects to return capital, it intends to do so in the form that is efficient for shareholders at that time.
a.s.r. intends to pay € 187 million dividends over full year 2017 and to purchase 3% of its own shares in the first quarter of 2017.

System o
f Go
vernanceR
isk pro
fileV
aluation fo
r Solvency p
urpo
sesC
apital m
anagem
entB
usiness and p
erform
ance

www.asrnl.com