Embed Size (px)
Citation preview
Solvency II versus IFRS: Cost of Capital Implications for Insurance Firms*
Paul J M Klumpes1 and Kathryn Morgan2
Abstract Solvency II is being developed by the European Union in response to a desire harmonise insurance supervision and to effect greater consistency across the measurement of assets and liabililities of insurance companies across the European Union. Also it will improve the link between minimum solvency and the risks borne by EU insurance firms. Solvency II will require all insurers to formally assess their risks to assess what capital they need, which will be subject to regular monitoring and reporting to regulators. The resulting increased public disclosures are still in development, and may conflict with existing and proposed international financial reporting IFRS requirements for insurance firms, although the current QIS4 exercise is heavily reliant on IFRS, as far as that has developed for insurers. This paper identifies the key differences in measurement, risk margin, entity and reporting for insurance firms and considers their implications for incorporating these risks into cost of capital estimates. This paper discusses international diversity in accounting for insurance contracts as reported under various Generally Accepted Accounting Principles in the UK. Relative to statutory-based accounting principles, UK GAAPs currently allow insurance firms to match income to expenses over the term of an insurance contract in order to provide a more ‘realistic’ basis for reporting to shareholders. However UK GAAP does not employ a coherent and consistent view of how to measure the fair value of a insurance firm’s business. The International Accounting Standards Board (IASB) has tentatively concluded that fair value should be used in accounting for insurance contracts. This paper discusses how existing UK GAAPs differ from statutory accounting principles (SAP), IFRS (proposed fair value) and Solvency II. We use the analysis from this discussion to present new evidence on the cost of equity capital by line of business for for a sample of UK general insurance firms. To do so we obtain beta estimates and then use the full-information industry beta (FIB) methodology to decompose the cost of capital by line. We obtain full information beta estimates using the standard one-factor CAPM model, accounting-based estimates and extend the FIB methodology to incorporate the Fama-French three factor cost of capital model. Contrary to the results of prior research, the analysis suggests that the cost of capital for firms using the Fama-French model are significantly higher than estimates based on the CAPM. In addition, we find evidence of significant differences in the cost of capital across business lines, indicating that the use of a single company-wide cost of capital is generally not appropriate. Finally, we find that cost of capital estimates are significantly understated when applied using GAAP or SAP relative to either IFRS or Solvency II definitions of profit and book value.
* We appreciate comments provided on an earlier draft by participants at an accounting workshop at the University of Warwick. 1 Tanaka Business School, South Kensington Campus, London SW7 2AZ, United Kingdom, Tel: +44 2078237685 Fax: +44 207 8237685 Email: [email protected] 2 UK Actuarial Profession.
2
INTRODUCTION
The determination of profits attributable to insurance business is complex, due
to (i) uncertainty as to future cash flows emanating from an insurance contract at the
point of sale and subsequently; and (ii) different approaches as to how those cash
flows should be incorporated into the entity’s financial statements (Adams and Scott,
1994). Thus a major problem in accounting for insurance contracts is how to
determine an appropriate way of reflecting the riskiness of a insurance firm’s activities
in its published financial statements. Since the economics of insurance transactions
differ substantively in this respect from other enterprises, another major issue facing
accounting standard setters is to ensure that these treatments are broadly consistent
with both their conceptual frameworks and similar non-insurance transactions that are
entered into by these same enterprises (e.g. pensions, financial instruments, banking).
A particular issue is how profit emerges over the lifetime of insurance
contracts, which may last many years. Current accounting practices for insurance
contracts that are incorporated into national Generally Accepted Accounting
Principles (hereinafter ‘GAAP’) in the US and UK, Australia and Canada) are largely
based on income measured in terms of accrual-based deferral and matching principles,
where the driver is the desire to match income and outgo in the revenue account.
However, countries differ as to how they apply this.
IFRS
In a number of jurisdictions (including the UK Union and Australia) some
insurers were required, from 2005, to have financial statements that comply with
International Financial Reporting Standards (hereinafter ‘IFRS’). There was therefore
pressure on the International Accounting Standards Board (hereinafter ‘IASB’) to
issue a standard applicable to insurance contracts at an early date. However, resolving
the many issues was taking a long time, since there was no consensus over the
measurement of assets and liabilities (Economist, 2004, 23 October). Consequently,
the project was divided into two phases.1 Phase I concentrated on removing those
insurance accounting practices regarded as most clearly inconsistent with IASB
principles, and the outcome was a standard, IFRS4 (IASB, 2004), effective for annual
periods beginning on or after 1 January 2005. This introduced some new requirements
3
on disclosures by insurers, namely the disclosure of assumptions, sensitivity analysis
and information about the management of these risks.
Phase II, which is still a work in progress, aims to conclude on the more
significant conceptual issue of the recognition and measurement for insurance
contracts; however, the IASB indicated its tentative conclusion that the assets and
liabilities of insurers should be measured consistently at fair, or market, value (IASB,
2004). Insurance firms therefore provide an important test case for the potential
breadth of the applicability of fair value accounting. Fair value is “the amount for
which an asset could be exchanged, or a liability settled, between knowledgeable,
willing parties in an arm’s length transaction ” (IFRS 4, para 23). It has been a central
concept in all the last three Standards issued by the old IASC, i.e. IASs 39, 40 and 41.
The IASB thus treats insurance firms’ assets and liabilities as primarily financial
instruments, and goes on to regard them as amenable to fair valuation, i.e., assuming
the existence of a deep and liquid market from which to derive market values.
However the IASB’s views on fair value for insurance do not accord either
with existing national GAAP practices, nor with the lack of observable market prices
for insurance liabilities. This therefore presents a considerable challenge, especially as
fair value does not feature among the diverse GAAPs of G4 countries. The solution
that has evolved, particularly for life assurance, is simulation techniques, which are
used to generate possible future outcomes and to study their sensitivity to various
actuarial assumptions. The appropriateness of simulation methodology has been
developed by the actuarial profession and is still evolving.
Solvency II
For a comparison with IFRS, the relevant aspects of Solvency II are:
• The Pillar 1 calculation of the Solvency Capital Requirement (SCR)
using a standard formula
• The Pillar 3 disclosure requirements
Pillar 3 is currently expected to be based on published accounts.
The SCR standard formula is an attempt to calculate the capital a firm needs to
fulfil the Solvency II criteria of a confidence level of 99.5% VaR over a one year
period. Firms need to assess various inputs to the standard formula, including items
4
that are subject to IFRS. In most cases, what is currently proposed or being tested for
Solvency II ties in with IFRS, where available, but some items differ where it is
considered that a different definition is more suitable for assessing the risks in a firm.
The previously disparate discussions of pensions, life insurance and general
insurance contracts endemic to GAAP differs from the broader treatment proposed by
Solvency II, which provides greater consistency in treatment for insurance (pension
schemes are outside the scope of the Proposed Directive). However, Solvency II is
targetted at assessing insurer solvency, and so focusses on a firm’s balance sheet,
where IFRS is also interested in reported profits.
Key issue and conclusion
Previous research did not (or could not) control for differences in insurance
contract accounting methods available to examine apparent variations in reported
insurance firm obligations and expenses. It is, therefore, not possible to determine
which measure of the insurance contract under national GAAP is most highly
correlated with fair-values. Selling and Stickney (1986) claim that allowing simulated
data is an adequate surrogate for what empirical researchers are unable to observe,
since one can examine the relative association of various accounting measures with an
underlying economic criterion. This in turn allows the research to make stronger
statements about which accounting measure is most highly correlated with the present
value of future cash flows, information that is potentially useful for accounting
standard setters (Selling and Stickney, 1986). However, this is effectively marking to
model, rather than to market, which brings issues of judgement and reliability of
models into play.
This paper also discusses a general conceptual framework which recognises
three elements of insurance contract valuation and their various purposes. First, it is
recognised that the fair value of insurance liabilities can be difficult to determine as
such liabilities are not commonly traded, and entity-specific values may be acceptable
to determine the franchise value of the business.2 Second, we provide a critique of the
proposed fair value measurement basis for insurance contracts. The estimated fair
value of an insurance contract should be not less than the insurer would charge a new
policyholder for a new contract with identical terms over the remaining duration of the
contract. Third, the framework explicitly identifies the regulatory risk of insolvency

5
associated with various complex options underlying insurance business.
Cost of capital estimation is becoming increasingly important for insurers. First
introduced during the 1970s in regulatory proceedings, the application of financial
methods in pricing, reserving and other types of financial decision making has grown
rapidly over the past two decades. Recent developments include asset-liability
management (ALM) techniques (Panjer, 1998), methodologies to allocate equitry
capital by line of business (e.g. Myers and Read 2001), market-based project
evaluation techniques such as risk-adjusted return on capital (RAROC) and the
projected introduction of fair value accounting for insurer liabilities (Girard, 2002;
Dickinson, 2003). These and other changes have intensified the need to find reliable
methods to estimate the cost of capital for insurance firms. Insurers have been learning
from the banking world about the importance of cost of capital, as the lines between
capital markets and insurance become more blurred and shareholders become more
demanding.
The use of an incorrect cost of capital in capital budgeting, pricing, and other
applications can have serious consequences, with the firm losing market share to
competitors if the cost of capital is overestimated and losing market value if the cost
of capital is under-estimated. Essentially, using incorrect cost of capital estimates can
lead to the firm’s investing in negative net present value projects that destroy firm
value. Choosing the appropriate cost of capital for specific projects is often a
challenging task. The cost of capital varies significantly across industries, and the cost
of capital research has shown that there is a significant industry factor for insurance
and financial services (Fama and French, 1997), possibly due to the complexity of
insurance accounting and the effort investors have to make to understand firms before
investing. Although insurance is a diverse industry, encompassing numerous lines of
business with very different risk characteristics, little progress has been made in
estimating costs of capital by line of business in the insurance and financial services
industry, and we are some way from a consistent, transparent and meaningful
measure. The objective of the present paper is to remedy this deficiency in the
existing literature by developing cost of capital models that reflect the line of business
chanracteristics of fimr in the financial and nonfinancial industries to assist firms in
making decisions that maximise firm value. In addition to providing valuable
information for financial decision making, estimating the cost of capital by line also
6
contributes to the literature on explaining the cross-sectional price differences in the
insurance industry (e.g. Sommer, 1996, Phillips et al., 1998, Froot, 2004).
The issue addressed in this paper has been studied in the financial literature as the
problem of estimating the cost of capital for divisions of conglomerate firms. Because
the conglomerate firm itself rather than the division is traded in the capital market,
market value data can be used to estimate the overall cost of capital for the
conglomerate but not for the individual divisions comprising the firm. The classic
approach for estimating the divisional cost of capital is the pure play approach (Fuller
and Kerr, 1981), which approximates the divisional cost of capital as the average cost
of capital for publicly traded ‘pure play’ firms that specialise in the same product as
the division under consideration.
The pure play technique performs well when a relatively large number of pure play
firms of various sizes can be found. However, in many industries, there are only a few
true specialist firms in some product lines and they often tend to be relatively small
(Ibbotson Associates, 2002). Because small firms tend to have higher costs of capital
than large firms, using pure play cost of capital estimates from small specialist firms
to determine the cost of capital of a much large division of a conglomerate firm can
lead to biased estimates of the divisional cost of capital. Insurance is an industry
where the pure play approach does not work very well because the vast majority of
insurance premiums are written by multiple-line firms. In addition, relatively few
insurers are publicly traded, with the majority of firms in the industry owned by
insurance groups. Thus, development of an alternative to the pure play method is
particularly important in this industry.
This paper utilizes a relatively new methodology, the full-information industry
beta (FIB) approach, which overcomes the principal limitations of the pure play
methodology (Ehrhardt and Bhagwat, 1991; Kaplan and Peterson 1998). Instead of
discarding the cost of capital estimates for conglomerates, as is done in pure play
analysis, the FIB approach utilizes a sample of conglomerates and specialist firms to
identify the impact of various lines of business on the cost of capital. The underlying
insight is that the observable market-value beta for the conglomerate is a weighted
average of the unobservable betas of the firm’s underlying business segments. The
approach is to conduct a cross-sectional regression for a sample of firms, where the
dependent variable is the observable beta and the independent variables measure the
7
firms’ participation in various lines of business. The coefficients of the line of
pbusiness participation variables are then interpreted as the full-information beta
coefficients for the business lines. The resulting regression equation can be used to
estimate costs of capital for individual lines of business, divisions of conglomerate
firms, non-traded stock firms, and mutuals.
The betas used as the dependent variables in our FIB regressions come from the
capital asset pricing model (CAPM) and the three-factor model developed by Fama
and French (1992, 1993, 1997). The CAPM and the Fama-French methods were
chosen because they are used frequently in determining the cost of capital in practical
applications (Graham and Harvey 2001) and have been extensively tested in the
academic literature. The Fama-French three-factor model (hereinafter the FF3F
model) was developed in response to the criticism that the CAPM systematic market
risk factor alone does not provide an adequate exsplanation of the cross-sectional
variation of average stock returns. The FF3F model achieves significantly better
explanatory power by adding risk factors to capture effects of firm size (total market
capitalization) and the ratio of the book value of equity (BE) to the market value of
equity (ME). The former factor controls for the well-known inverse relationship
between the cost of capital and firm size. The BE/ME ratio reflects the firm’s growth
prospects (relative financial distress) with firms with low growth prospects having
higher values of theis ratio than healthier firms.
This paper implements the FIB approach to cost of capital estimation using a
sample consisting of all firms (insurance and non-insurance) listed in the Compustat
data base for the period 2001-2004. We utilize the FIB technique to estimate the cost
of capital for personal and commercial lines of insurance and for regulated financial
services and utilities lines. The FIB approach can easily be adapted to estimate costs
of capital for other lines of business. We also estimate the overall CAPM, OJ and
FF3F costs of capital for insurance and other types of financial services firms.
There have been several prior papers on cost of capital estimation for insurers.
Cummins and Harrington (1985) utilize quarterly profit data to estimate the cost of
capital for fourteen insurers from 1970-1981. Cox and Gripentrog (1988) implement
the pure play technique for a sample of 26 to 31 insurers (depending on the year)
using data from the mid-1970s. Cummins and Lamm-Tennant (1994) estimate models
showing that insurer costs of capital are related to leverage and find that commercial
8
long-tail coverages have higher costs of capital than short-tail lines. Lee and Cummins
(1998) estimate the cost of equity capital for insurers using the CAPM, the arbitrage
pricing theory (APT) model and a unified CAPM-APT model developed by Wei
(1988). They find that the APT and the Wei model perform gbetter than the CAPM in
forecasting the cost of capital for insurers. Except for Lee-Cummins, none of the
period research uses data after the 1980s, and none except Cummins and Lamm-
Tennant estimates the costs o f capital by line.
Our research contributes to the insurance cost of capital literature by providing the
first comprehensive analysis of the cost of capital by line of business and by using a
much larger sample of insurers. This paper is the first to apply the Fama-French three
factor model and the full-information beta technique to the insurance industry. We
also innovate by conducting the first application in any industry of the FIB beta
technique to explain the factors of the Fama-French three-factor model.
The remainder of the paper is organized as follows. First, the principles of
insurance firm valuation are outlined. Then major differences between insurance
GAAP, and their differences from the ‘fair value’ approach favoured by IASB and by
Solvency II are outlined. Cost of capital models, estimation are described in section 3.
Section 4 presents the predictions and sample selection. The results are presented in
section 5 and section 6 concludes.
INSURANCE VALUATION PRINCIPLES
In order to put these developments in context it is important to review the
principles of insurance valuation. This is an area where actuaries (e.g. Skerman, 1966)
have made important contributions in developing insurance accounting.
Insurance firms manage assets in order to meet present and future policy
obligations which possess three particular features. First, it is generally the case that
most assets of life insurers are cash or financial instruments that are readily realisable,
and the fair value can be determined without undue difficulty (assuming that
definitional issues such as use of entry or exit price have been decided). Second, many
of the assets held by life insurers are equities, where amortized value is impracticable.
Third, some authors highlight the importance of prudence (Welzel, 1996): confidence
in the sector may be enhanced if insurers are seen to be solvent with a deliberately
prudent value placed on their assets, for example by using the lower of purchase price
9
and market value. However, this reduces comparibility between insurers.
It is important to have consistency in the method of valuing assets and
liabilities. A key reason for this is that many insurance policies have the value of the
claim determined with reference to asset values. For example, the investment risk on
unit-linked policies is borne by policyholders: the payout is reduced if the value of the
assets backing the policy falls.
Valuing liabilities raises some other difficult issues. There is no liquid, active
secondary market in insurance policies, at least in most cases, so it is not surprising
that insurers have, to date, shied away from trying to estimate what a market value
would be.
The IASB’s Issues Paper (1999) on insurance accounting raised a number of
questions about the liability valuation. This process requires assumptions about, for
example, future rates of mortality, expenses, taxes, investment returns. A number of
questions were identified, such as whether the future cashflows used were based on
assumptions about mortality that were decided at the outset when the policy was sold;
or are the assumptions updated as estimates of future conditions change? If there is a
change in, say, assumed mortality rates, is the effect capitalised into the year’s result
or is the effect spread over time?
Harrington (1990, 675) provides a conceptual overview of general insurance
accounting. In this section we follow the framework set out in Harrington (1990, 675-
699) to provide an overview of basic general insurance accounting rules and identify
some alternative income measures to help interpret financial results and to understand
how cost of capital estimates can change depending upon these assumptions. We first
define the concept of profitability under both statutory and accounting (IFRS 4
acceptable – GAAP). If a few simplifying assumptions are made and arcane factors
such as deferred income taxes are ignored, the major measures of profitability can be
made fairly clear. We begin with the standard definition of SAP and UK GAAP. We
then derive an economic proift measure which is equivalent to IFRS. Finally we
discuss the issue of how solvency affects the calculation with Solvency II.
SAP and UK GAAP
Insurance company annual returns that must be filed with the UK Financial
10
Services Authority are prepared using statutory principles as set out in the UK SORP.
The princples tend to be more conservative than GAAP in that income and suplus tend
to be less than income calculatd using GAAP. A major difference between SAP and
GAP is tht treatment of acquisition expenses, those incurred in selling and issuing
insurance contracts. SAP requires that acquisition expenses be charged against cine
and surplus when incurred. GAAP requires that revenues and expense be matched,
whih means expenses are deferred compared with SAP.
Two important concepts in both SAP and GAAP accounting are earned
premiums, EP, and incurred losses, IL. Premiums are writtend whn the policy is
issued and the premium becomes payable. Premiums are earned evenly over the
duration of the plicy period. A principle liability of general insurers is their unearned
premium reserve, UPR, which reflects the amount of written premiums, WP, that have
yet to be earned as of the statement dae. The relatinonship between these items isn a
given year is given by EP = WP – DUPR. If earned and written premiums are equal
during a year, UPR does not change.
Incurred lossesare defined as losses paid, LP, plus the change in the insurer’s
second major liability, the loss reserve, LR: IL = LP + DLR. The loss reserve is the
estimated liability for all unpaid claims that have occurred as of the statement date.
Since future claim payments traditionally have not been discounted, the book value of
the liability, if accurately estimated, overstates its market value. Moreover, incurred
losses for a given calendar year will be affected by revisions in reserves for previous
years ‘ claims to reflect new information about expected total claims. That is,
increases in the loss reserve in year t for claims that occurred in year t – n will affect
reported incurred losses in year t.
SAP surplus, S, is given by the basic accounting identity
S = A – LR – UPR (1)
Where A is the SAP value of assets, which reflects bonds at amortized (book) value
and common stocks at market value. The change in surplus during a given period can
be written
DS = DA – DLR – DUPR (2)
The change in SAP assets equals premiums written less losses paid, underwriting
expenses, E, policyholder dividends, D and icnome taxes, T, plus total investment
gains, IG. Substituting for DA in quation 2 and using DUPR = WP – ER and DLR =
11
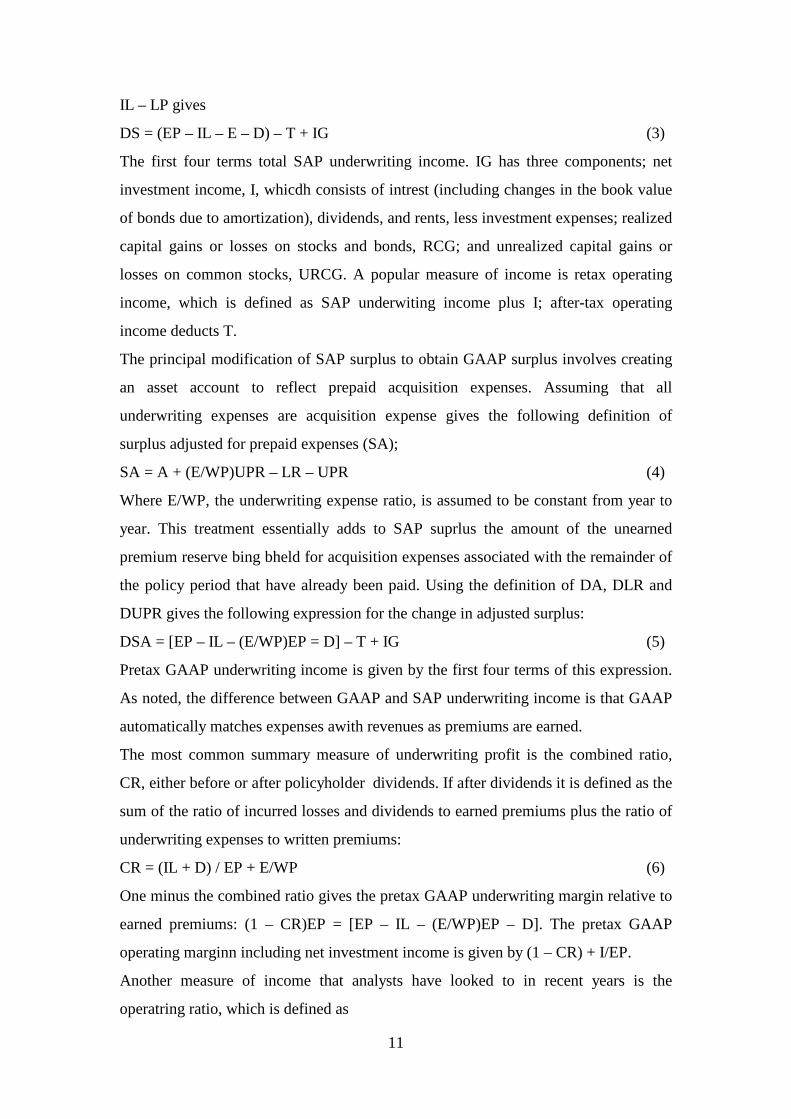
IL – LP gives
DS = (EP – IL – E – D) – T + IG (3)
The first four terms total SAP underwriting income. IG has three components; net
investment income, I, whicdh consists of intrest (including changes in the book value
of bonds due to amortization), dividends, and rents, less investment expenses; realized
capital gains or losses on stocks and bonds, RCG; and unrealized capital gains or
losses on common stocks, URCG. A popular measure of income is retax operating
income, which is defined as SAP underwiting income plus I; after-tax operating
income deducts T.
The principal modification of SAP surplus to obtain GAAP surplus involves creating
an asset account to reflect prepaid acquisition expenses. Assuming that all
underwriting expenses are acquisition expense gives the following definition of
surplus adjusted for prepaid expenses (SA);
SA = A + (E/WP)UPR – LR – UPR (4)
Where E/WP, the underwriting expense ratio, is assumed to be constant from year to
year. This treatment essentially adds to SAP suprlus the amount of the unearned
premium reserve bing bheld for acquisition expenses associated with the remainder of
the policy period that have already been paid. Using the definition of DA, DLR and
DUPR gives the following expression for the change in adjusted surplus:
DSA = [EP – IL – (E/WP)EP = D] – T + IG (5)
Pretax GAAP underwriting income is given by the first four terms of this expression.
As noted, the difference between GAAP and SAP underwriting income is that GAAP
automatically matches expenses awith revenues as premiums are earned.
The most common summary measure of underwriting profit is the combined ratio,
CR, either before or after policyholder dividends. If after dividends it is defined as the
sum of the ratio of incurred losses and dividends to earned premiums plus the ratio of
underwriting expenses to written premiums:
CR = (IL + D) / EP + E/WP (6)
One minus the combined ratio gives the pretax GAAP underwriting margin relative to
earned premiums: (1 – CR)EP = [EP – IL – (E/WP)EP – D]. The pretax GAAP
operating marginn including net investment income is given by (1 – CR) + I/EP.
Another measure of income that analysts have looked to in recent years is the
operatring ratio, which is defined as
12
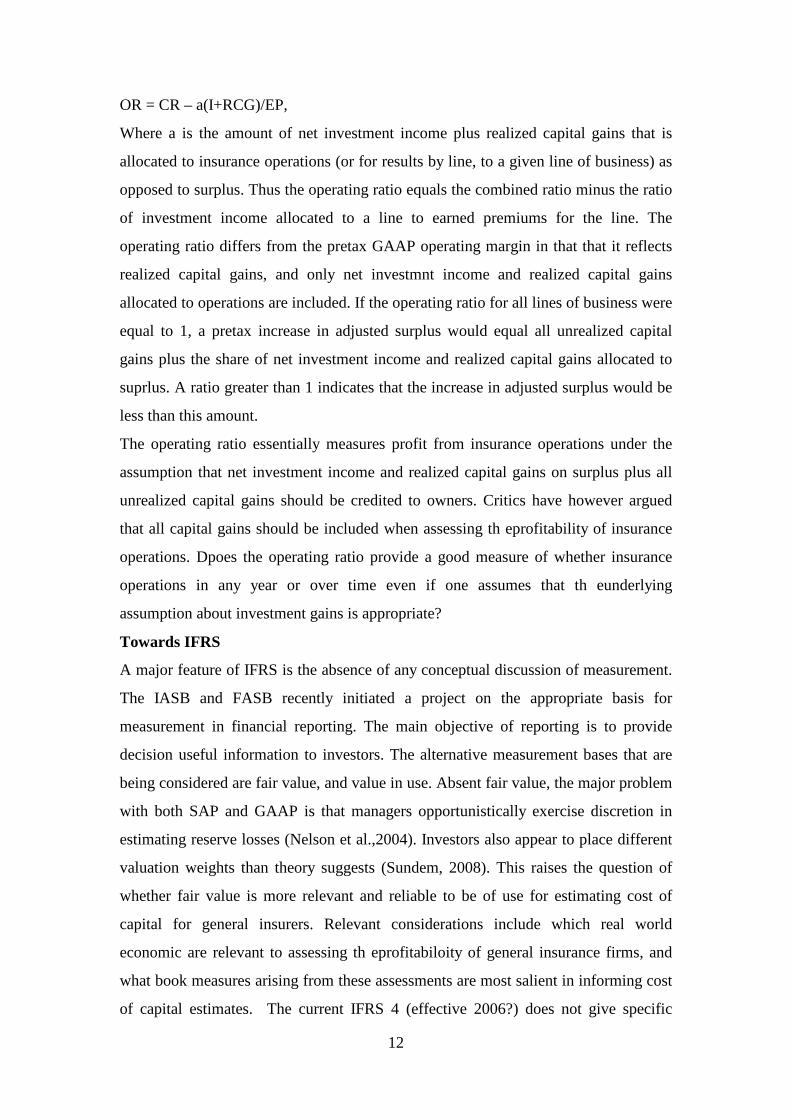
OR = CR – a(I+RCG)/EP,
Where a is the amount of net investment income plus realized capital gains that is
allocated to insurance operations (or for results by line, to a given line of business) as
opposed to surplus. Thus the operating ratio equals the combined ratio minus the ratio
of investment income allocated to a line to earned premiums for the line. The
operating ratio differs from the pretax GAAP operating margin in that that it reflects
realized capital gains, and only net investmnt income and realized capital gains
allocated to operations are included. If the operating ratio for all lines of business were
equal to 1, a pretax increase in adjusted surplus would equal all unrealized capital
gains plus the share of net investment income and realized capital gains allocated to
suprlus. A ratio greater than 1 indicates that the increase in adjusted surplus would be
less than this amount.
The operating ratio essentially measures profit from insurance operations under the
assumption that net investment income and realized capital gains on surplus plus all
unrealized capital gains should be credited to owners. Critics have however argued
that all capital gains should be included when assessing th eprofitability of insurance
operations. Dpoes the operating ratio provide a good measure of whether insurance
operations in any year or over time even if one assumes that th eunderlying
assumption about investment gains is appropriate?
Towards IFRS
A major feature of IFRS is the absence of any conceptual discussion of measurement.
The IASB and FASB recently initiated a project on the appropriate basis for
measurement in financial reporting. The main objective of reporting is to provide
decision useful information to investors. The alternative measurement bases that are
being considered are fair value, and value in use. Absent fair value, the major problem
with both SAP and GAAP is that managers opportunistically exercise discretion in
estimating reserve losses (Nelson et al.,2004). Investors also appear to place different
valuation weights than theory suggests (Sundem, 2008). This raises the question of
whether fair value is more relevant and reliable to be of use for estimating cost of
capital for general insurers. Relevant considerations include which real world
economic are relevant to assessing th eprofitabiloity of general insurance firms, and
what book measures arising from these assessments are most salient in informing cost
of capital estimates. The current IFRS 4 (effective 2006?) does not give specific
13
guidenace and a further Phase II project (incomplete) is intended to provide more
clarofication on the fair value basis for reporting.
Theory suggests that break-even premiums would eqal the risk-adjusted present value
of expected future claim payments plus the present value of all other cost of writing
the business, including income taxes or foregone investment returns reducing from
cost-reduceing tax availdance. Even if all policies were priced to break even, loss
forecasts were perfectly accurate, and investment returns including capital gains were
equalto the rate used to discount future costs, the fair value IFRS operating ratio
generally would not equal 1. The principal reason is the failure to discount losses in
standard insurance accounting (including both SAP and GAAP). Lack of discounting
is one major reason that stnadard accounting profits may differ greatly from economic
profits. Another factor is the use of bok values rather than market values for bonds.
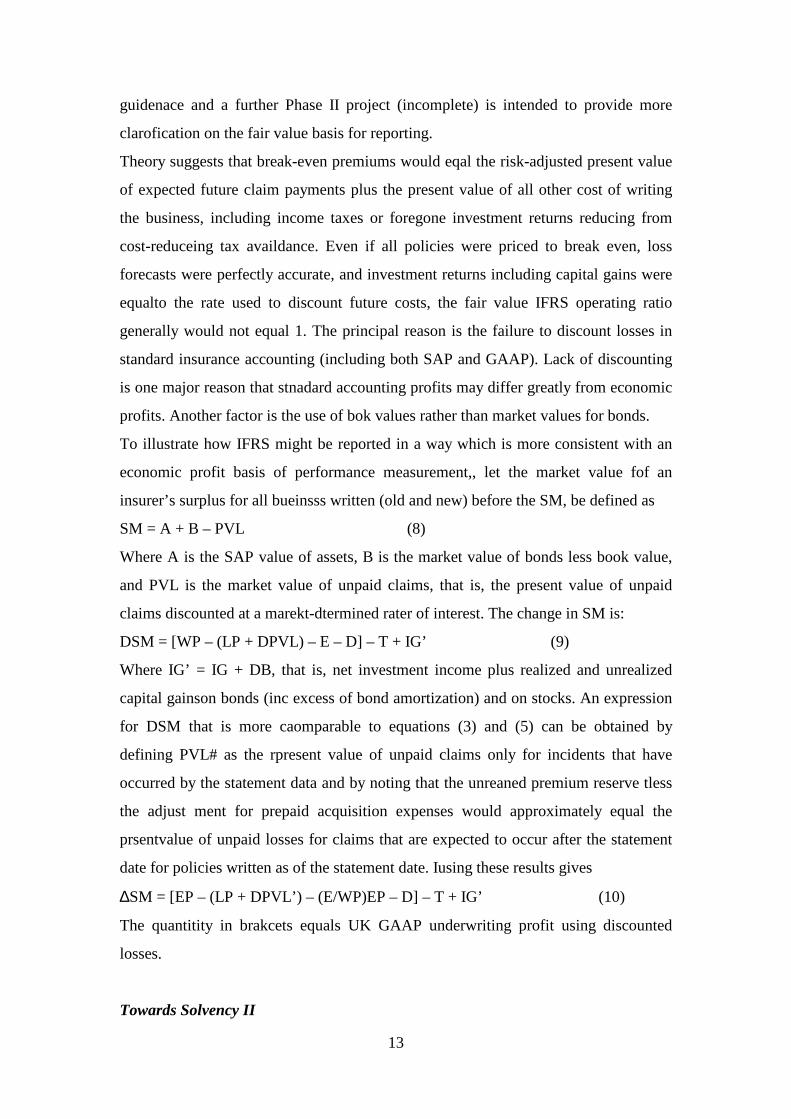
To illustrate how IFRS might be reported in a way which is more consistent with an
economic profit basis of performance measurement,, let the market value fof an
insurer’s surplus for all bueinsss written (old and new) before the SM, be defined as
SM = A + B – PVL (8)
Where A is the SAP value of assets, B is the market value of bonds less book value,
and PVL is the market value of unpaid claims, that is, the present value of unpaid
claims discounted at a marekt-dtermined rater of interest. The change in SM is:
DSM = [WP – (LP + DPVL) – E – D] – T + IG’ (9)
Where IG’ = IG + DB, that is, net investment income plus realized and unrealized
capital gainson bonds (inc excess of bond amortization) and on stocks. An expression
for DSM that is more caomparable to equations (3) and (5) can be obtained by
defining PVL# as the rpresent value of unpaid claims only for incidents that have
occurred by the statement data and by noting that the unreaned premium reserve tless
the adjust ment for prepaid acquisition expenses would approximately equal the
prsentvalue of unpaid losses for claims that are expected to occur after the statement
date for policies written as of the statement date. Iusing these results gives
∆SM = [EP – (LP + DPVL’) – (E/WP)EP – D] – T + IG’ (10)
The quantitity in brakcets equals UK GAAP underwriting profit using discounted
losses.
Towards Solvency II
14
The above estimates of profits are based on fair value accounting, consistent with
IFRS proposed. However unders Solvency II, the profits are likely to be affected also
by the projected future losses in both a market consistent way and also by the use of a
standard discount rate for liabilities.
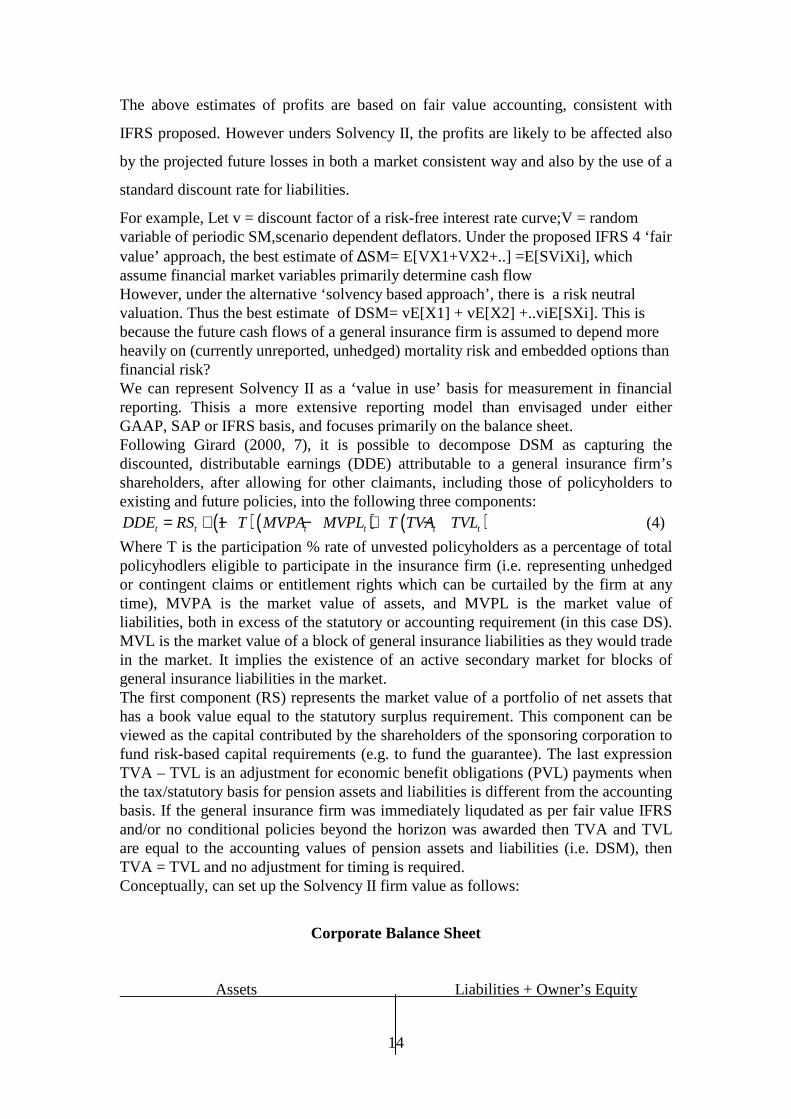
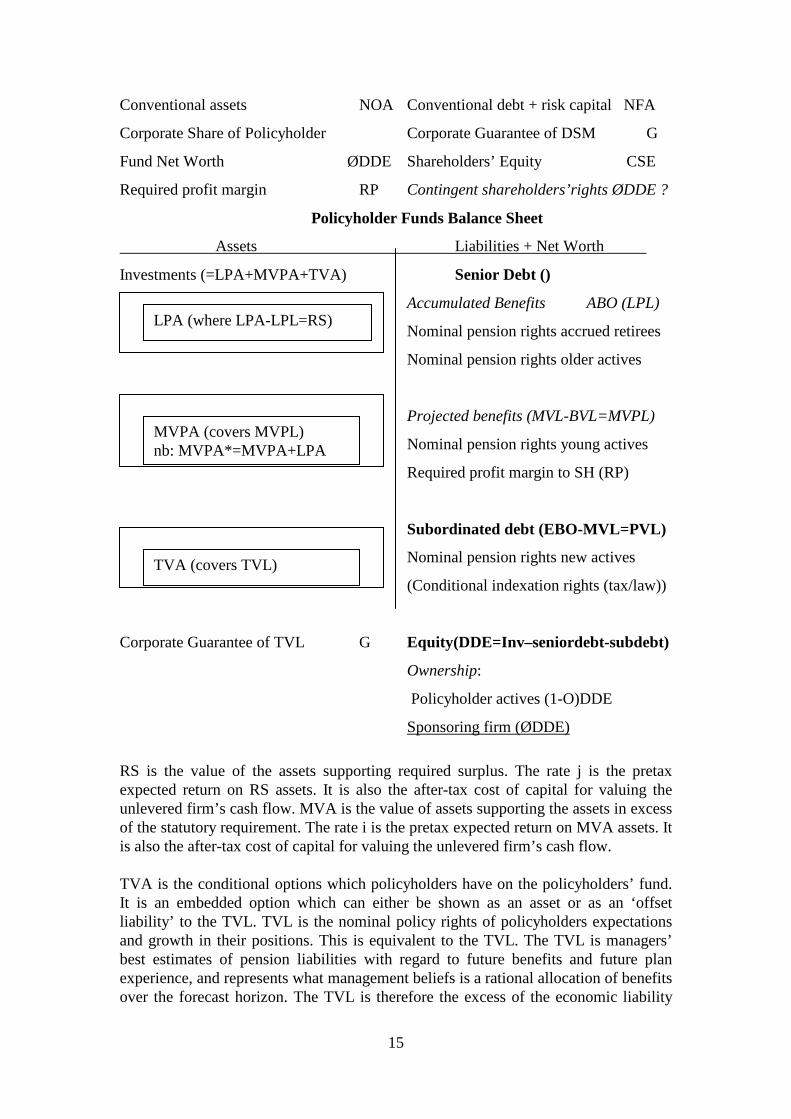
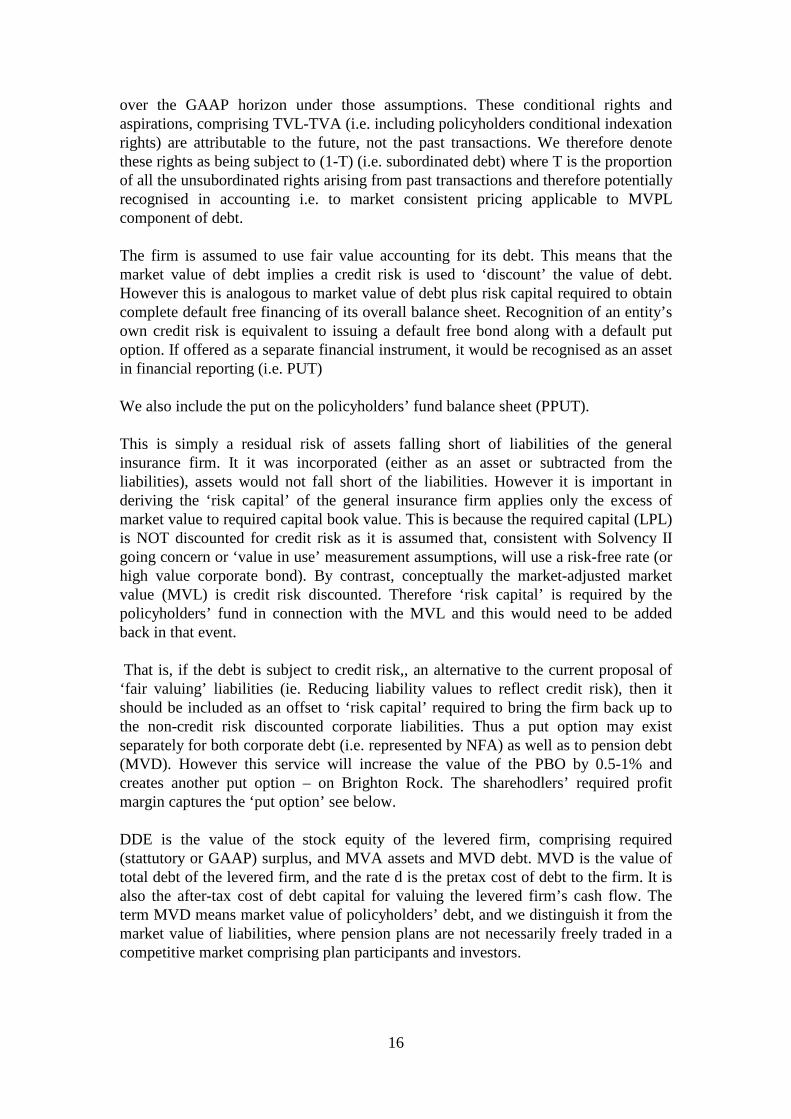
For example, Let v = discount factor of a risk-free interest rate curve;V = random variable of periodic SM,scenario dependent deflators. Under the proposed IFRS 4 ‘fair value’ approach, the best estimate of ∆SM= E[VX1+VX2+..] =E[SViXi], which assume financial market variables primarily determine cash flow However, under the alternative ‘solvency based approach’, there is a risk neutral valuation. Thus the best estimate of DSM= vE[X1] + vE[X2] +..viE[SXi]. This is because the future cash flows of a general insurance firm is assumed to depend more heavily on (currently unreported, unhedged) mortality risk and embedded options than financial risk? We can represent Solvency II as a ‘value in use’ basis for measurement in financial reporting. Thisis a more extensive reporting model than envisaged under either GAAP, SAP or IFRS basis, and focuses primarily on the balance sheet. Following Girard (2000, 7), it is possible to decompose DSM as capturing the discounted, distributable earnings (DDE) attributable to a general insurance firm’s shareholders, after allowing for other claimants, including those of policyholders to existing and future policies, into the following three components:
( ) ( ) ( )1t t t t t tDDE RS T MVPA MVPL T TVA TVL= + − − + − (4)
Where T is the participation % rate of unvested policyholders as a percentage of total policyhodlers eligible to participate in the insurance firm (i.e. representing unhedged or contingent claims or entitlement rights which can be curtailed by the firm at any time), MVPA is the market value of assets, and MVPL is the market value of liabilities, both in excess of the statutory or accounting requirement (in this case DS). MVL is the market value of a block of general insurance liabilities as they would trade in the market. It implies the existence of an active secondary market for blocks of general insurance liabilities in the market. The first component (RS) represents the market value of a portfolio of net assets that has a book value equal to the statutory surplus requirement. This component can be viewed as the capital contributed by the shareholders of the sponsoring corporation to fund risk-based capital requirements (e.g. to fund the guarantee). The last expression TVA – TVL is an adjustment for economic benefit obligations (PVL) payments when the tax/statutory basis for pension assets and liabilities is different from the accounting basis. If the general insurance firm was immediately liqudated as per fair value IFRS and/or no conditional policies beyond the horizon was awarded then TVA and TVL are equal to the accounting values of pension assets and liabilities (i.e. DSM), then TVA = TVL and no adjustment for timing is required. Conceptually, can set up the Solvency II firm value as follows:
Corporate Balance Sheet
Assets Liabilities + Owner’s Equity
15
Conventional assets NOA Conventional debt + risk capital NFA
Corporate Share of Policyholder Corporate Guarantee of DSM G
Fund Net Worth ØDDE Shareholders’ Equity CSE
Required profit margin RP Contingent shareholders’rights ØDDE ?
Policyholder Funds Balance Sheet
Assets Liabilities + Net Worth
Investments (=LPA+MVPA+TVA) Senior Debt ()
Accumulated Benefits ABO (LPL)
Nominal pension rights accrued retirees
Nominal pension rights older actives
Projected benefits (MVL-BVL=MVPL)
Nominal pension rights young actives
Required profit margin to SH (RP)
Subordinated debt (EBO-MVL=PVL)
Nominal pension rights new actives
(Conditional indexation rights (tax/law))
Corporate Guarantee of TVL G Equity(DDE=Inv–seniordebt-subdebt)
Ownership:
Policyholder actives (1-O)DDE
Sponsoring firm (ØDDE)
RS is the value of the assets supporting required surplus. The rate j is the pretax expected return on RS assets. It is also the after-tax cost of capital for valuing the unlevered firm’s cash flow. MVA is the value of assets supporting the assets in excess of the statutory requirement. The rate i is the pretax expected return on MVA assets. It is also the after-tax cost of capital for valuing the unlevered firm’s cash flow. TVA is the conditional options which policyholders have on the policyholders’ fund. It is an embedded option which can either be shown as an asset or as an ‘offset liability’ to the TVL. TVL is the nominal policy rights of policyholders expectations and growth in their positions. This is equivalent to the TVL. The TVL is managers’ best estimates of pension liabilities with regard to future benefits and future plan experience, and represents what management beliefs is a rational allocation of benefits over the forecast horizon. The TVL is therefore the excess of the economic liability
LPA (where LPA-LPL=RS)
MVPA (covers MVPL) nb: MVPA*=MVPA+LPA
TVA (covers TVL)
16
over the GAAP horizon under those assumptions. These conditional rights and aspirations, comprising TVL-TVA (i.e. including policyholders conditional indexation rights) are attributable to the future, not the past transactions. We therefore denote these rights as being subject to (1-T) (i.e. subordinated debt) where T is the proportion of all the unsubordinated rights arising from past transactions and therefore potentially recognised in accounting i.e. to market consistent pricing applicable to MVPL component of debt. The firm is assumed to use fair value accounting for its debt. This means that the market value of debt implies a credit risk is used to ‘discount’ the value of debt. However this is analogous to market value of debt plus risk capital required to obtain complete default free financing of its overall balance sheet. Recognition of an entity’s own credit risk is equivalent to issuing a default free bond along with a default put option. If offered as a separate financial instrument, it would be recognised as an asset in financial reporting (i.e. PUT) We also include the put on the policyholders’ fund balance sheet (PPUT). This is simply a residual risk of assets falling short of liabilities of the general insurance firm. It it was incorporated (either as an asset or subtracted from the liabilities), assets would not fall short of the liabilities. However it is important in deriving the ‘risk capital’ of the general insurance firm applies only the excess of market value to required capital book value. This is because the required capital (LPL) is NOT discounted for credit risk as it is assumed that, consistent with Solvency II going concern or ‘value in use’ measurement assumptions, will use a risk-free rate (or high value corporate bond). By contrast, conceptually the market-adjusted market value (MVL) is credit risk discounted. Therefore ‘risk capital’ is required by the policyholders’ fund in connection with the MVL and this would need to be added back in that event. That is, if the debt is subject to credit risk,, an alternative to the current proposal of ‘fair valuing’ liabilities (ie. Reducing liability values to reflect credit risk), then it should be included as an offset to ‘risk capital’ required to bring the firm back up to the non-credit risk discounted corporate liabilities. Thus a put option may exist separately for both corporate debt (i.e. represented by NFA) as well as to pension debt (MVD). However this service will increase the value of the PBO by 0.5-1% and creates another put option – on Brighton Rock. The sharehodlers’ required profit margin captures the ‘put option’ see below. DDE is the value of the stock equity of the levered firm, comprising required (stattutory or GAAP) surplus, and MVA assets and MVD debt. MVD is the value of total debt of the levered firm, and the rate d is the pretax cost of debt to the firm. It is also the after-tax cost of debt capital for valuing the levered firm’s cash flow. The term MVD means market value of policyholders’ debt, and we distinguish it from the market value of liabilities, where pension plans are not necessarily freely traded in a competitive market comprising plan participants and investors.
17
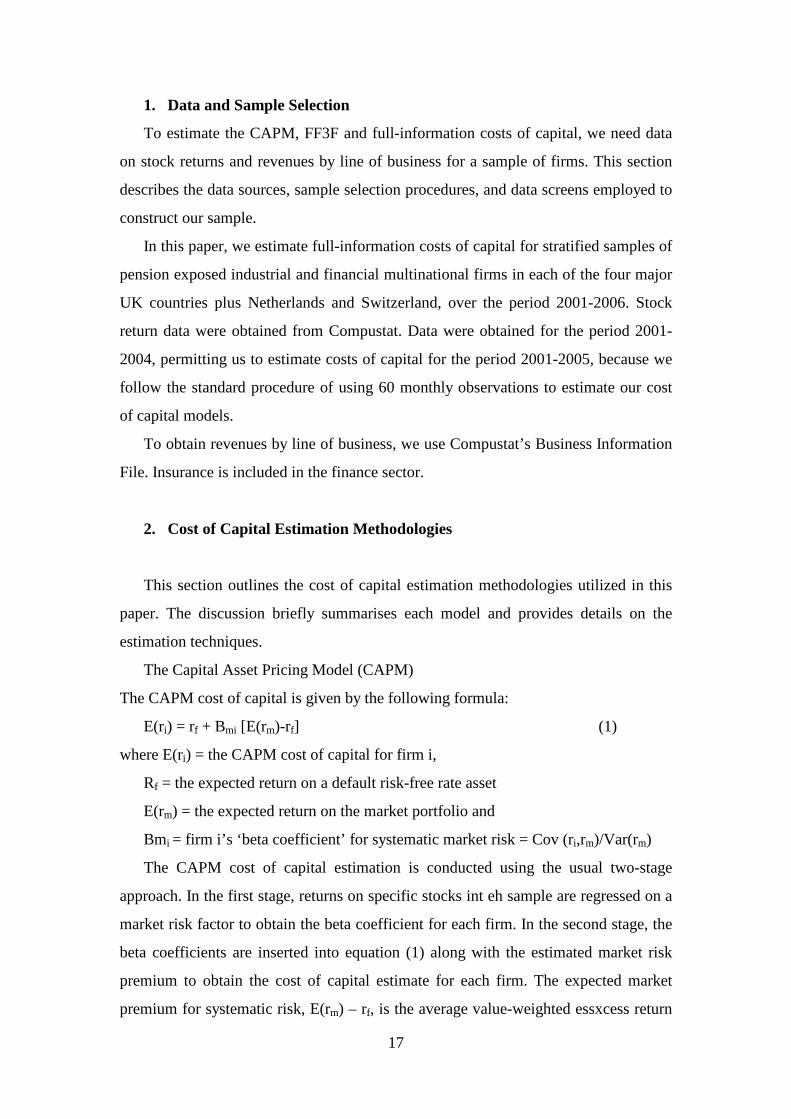
1. Data and Sample Selection
To estimate the CAPM, FF3F and full-information costs of capital, we need data
on stock returns and revenues by line of business for a sample of firms. This section
describes the data sources, sample selection procedures, and data screens employed to
construct our sample.
In this paper, we estimate full-information costs of capital for stratified samples of
pension exposed industrial and financial multinational firms in each of the four major
UK countries plus Netherlands and Switzerland, over the period 2001-2006. Stock
return data were obtained from Compustat. Data were obtained for the period 2001-
2004, permitting us to estimate costs of capital for the period 2001-2005, because we
follow the standard procedure of using 60 monthly observations to estimate our cost
of capital models.
To obtain revenues by line of business, we use Compustat’s Business Information
File. Insurance is included in the finance sector.
2. Cost of Capital Estimation Methodologies
This section outlines the cost of capital estimation methodologies utilized in this
paper. The discussion briefly summarises each model and provides details on the
estimation techniques.
The Capital Asset Pricing Model (CAPM)
The CAPM cost of capital is given by the following formula:
E(ri) = rf + Bmi [E(rm)-rf] (1)
where E(ri) = the CAPM cost of capital for firm i,
Rf = the expected return on a default risk-free rate asset
E(rm) = the expected return on the market portfolio and
Bmi = firm i’s ‘beta coefficient’ for systematic market risk = Cov (ri,rm)/Var(rm)
The CAPM cost of capital estimation is conducted using the usual two-stage
approach. In the first stage, returns on specific stocks int eh sample are regressed on a
market risk factor to obtain the beta coefficient for each firm. In the second stage, the
beta coefficients are inserted into equation (1) along with the estimated market risk
premium to obtain the cost of capital estimate for each firm. The expected market
premium for systematic risk, E(rm) – rf, is the average value-weighted essxcess return
18
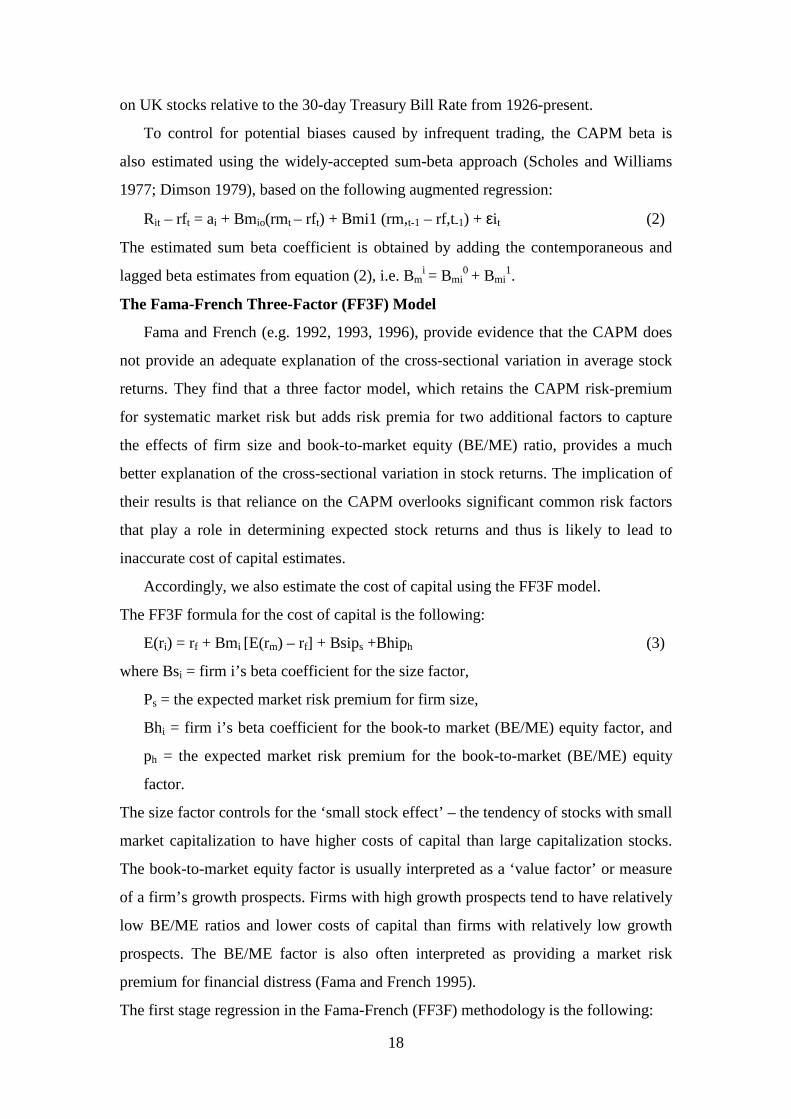
on UK stocks relative to the 30-day Treasury Bill Rate from 1926-present.
To control for potential biases caused by infrequent trading, the CAPM beta is
also estimated using the widely-accepted sum-beta approach (Scholes and Williams
1977; Dimson 1979), based on the following augmented regression:
Rit – rft = ai + Bmio(rmt – rft) + Bmi1 (rm,t-1 – rf,t-1) + εi t (2)
The estimated sum beta coefficient is obtained by adding the contemporaneous and
lagged beta estimates from equation (2), i.e. Bmi = Bmi
0 + Bmi1.
The Fama-French Three-Factor (FF3F) Model
Fama and French (e.g. 1992, 1993, 1996), provide evidence that the CAPM does
not provide an adequate explanation of the cross-sectional variation in average stock
returns. They find that a three factor model, which retains the CAPM risk-premium
for systematic market risk but adds risk premia for two additional factors to capture
the effects of firm size and book-to-market equity (BE/ME) ratio, provides a much
better explanation of the cross-sectional variation in stock returns. The implication of
their results is that reliance on the CAPM overlooks significant common risk factors
that play a role in determining expected stock returns and thus is likely to lead to
inaccurate cost of capital estimates.
Accordingly, we also estimate the cost of capital using the FF3F model.
The FF3F formula for the cost of capital is the following:
E(ri) = rf + Bmi [E(rm) – rf] + Bsips +Bhiph (3)
where Bsi = firm i’s beta coefficient for the size factor,
Ps = the expected market risk premium for firm size,
Bhi = firm i’s beta coefficient for the book-to market (BE/ME) equity factor, and
ph = the expected market risk premium for the book-to-market (BE/ME) equity
factor.
The size factor controls for the ‘small stock effect’ – the tendency of stocks with small
market capitalization to have higher costs of capital than large capitalization stocks.
The book-to-market equity factor is usually interpreted as a ‘value factor’ or measure
of a firm’s growth prospects. Firms with high growth prospects tend to have relatively
low BE/ME ratios and lower costs of capital than firms with relatively low growth
prospects. The BE/ME factor is also often interpreted as providing a market risk
premium for financial distress (Fama and French 1995).
The first stage regression in the Fama-French (FF3F) methodology is the following:
19
Rit – rft = ai +Bmi(rmt – rft) + Bsipst + Bhipht + eit (4)
where pst = return differential between small and large stocks in period t, and
Pht = return differential between high BE/ME stocks and low BE/ME stocks in
period t.
The model augments the CAPM regression to include variables representing
market excess returns for size and financial distress, based on the differential returns
between ‘small’ and ‘large’ stocks and ‘high’ and ‘low’ BE/ME stocks, respectively.
These return series are derived using the procedures described in Fama and French
(e.g., 1993, 1997).
As in the case of the CAPM, it is also important to correct for infrequent trading
bias when estimating the FF3F model. Accordingly, we also calculate FF3F beta
estimates using a sum beta regression which includes contemporaneous and lagged
values of each of the Fama-French return series. Analogously to equation (2), sum
beta estimates are then obtained by summing the betas of the contemporaneous and
lagged returns for each of the three factors.
In the second stage of the FF3F methodology, we insert either the betas from
equation (4) or the corresponding sum beta estimates into equation (3). The risk-
premium for systematic market risk, E(rm) – rt, in the FF3F model is the same estimate
used for the CAPM. Also used in this stage are estimates of the long-term average
market risk premia, and p, for size and financial distress. The averaging period for the
size and financial distress premia is 1926-2000.
The Full-Information Industry Beta (FIB) method
The FIB methodology produces cost of capital estimates that reflect the line of
business composition of the firm. Such estimates can be used to estimate costs of
capital by line of business, for divisions or subsidiaries of conglomerate firms, and for
non-traded stock insurers and mutuals. The underlying premise is that the firm can be
envisioned as a portfolio of assets, where the assets represent divisions or individual
lines of business. The rationale for the FIB decomposition is the value-additivity
property of arbitrage-free capital markets, which holds that the arbitrage free market
value of the firm is the sum of the values of its individual projects (e.g. Brealey and
Myers 2002). This conceptualization implies that the firm’s overall market beta
coefficient is a weighted average of the beta coefficients of the separate divisions or
20
business lines. In theory, the weight on each divisional or line of business beta is the
market value of the division divided by the market value of the firm as a whole.
However, because individual business units are not publicly traded, market value
weights cannot be used. Instead, we follow Kaplan and Peterson (1998) in using sales
data to represent business participation.
We seek to decompose the overall market beta coefficient (for the CAPM) or
coefficients (for the FF3F model) into separate beta coefficients for each industry in
which firms participate. There are two steps in the decomposition: (1) Estimate the
overall market beta coefficients for a sample of firms using the CAPM or FF3F
methods, as discussed above. (2) Obtain full information betas for each industry by
performing cross-sectional regressions with the overall market betas as dependent
variables and a series of weights proxying for the firm’s participation in various lines
of business as explanatory variables. The regression equation for the CAPM beta,
estimated with the constant term suppressed, is:
Bmi = Σ Bfmjwij +vmi (5)
Where Bmi = firm i’s overall market systematic risk beta coefficient,
Bfmj = the full-information market systematic risk beta for industry, line or division j,
Wij = firm i’s industry participation weight for industry, line or division j, and
Vmi = random error term for firm i,
The wij, j = 1,2,…,j for firm i, which sum to 1.0, measure the firm’s participation in
each line of business. Revenues by industry are used to calculate wij, i.e. wij =
revenues of firm i in industry j divided by total revenues of firm i. The Bfmj, which
vary by industry but not by firm, capture the impact that any particular line of business
is expected to have on the overall riskiness and hence the beta coefficient of the firm.
Equation (5) then is used ‘out of sample’ to estimate the overall beta coefficients Bmi
for individual divisions or lines of business by inserting the wj weights for the
division or business line.
Using equation (5) would not be appropriate to decompose the FF3F size and
book-to-market betas because these betas tend to vary systematically with firm size
and book-to-market ratio, respectively. Specifically, the size betas are inversely
related to firm size, and the BE/ME betas are directly related to firm BE/ME ratios.
Accordingly, regressions analogous to (5) for the size and book-to-market betas would
be likely to suffer from omitted variables bias. To address this problem, we conduct
21
the following regressions for the size and BE/ME betas:
Bsi = Σ Bf1sj wij + Bf2i ln(MEi) + vsi (6)
Bhi = Σ Bf1hj wij + Bf2h ln(BEi/MEi) +vhi (7)
Where Bsi, Bhi = overall size and BE/ME beta estimates firm i, s = size, h = BE/ME,
Bf1sj, Bf1hj = full-information size and BE/ME beta intercept coefficients for industry
j,
Bf2s, Bf2h = full-information size and BE/ME beta slope coefficients,
BEm, MEi = book value of equity and market value of equity for firm i,
V ji = random error term for firm i, equation j, j = s,h.
Equations (6) and (7) allow for different intercept coefficients for each
industry and also allow the slope coefficients to vary by the log of market equity and
the log of the BE/ME ratio, respectively. The full-information beta estimates for the
size factor are obtained using the estimated coefficients Bf1sj and Bf2s by inserting the
industry participation weights (wij) and ln(MEi) for a given firm into equation (6), and
the full information beta for the BE/ME factor is obtained similarly using equation
(7).
Equations (5) – (7) are estimated using two techniques – unweighted least
squares (UWLS) and weighted least squares (WLS). In the WLS estimations, the
weight for each firm in a specified cross-sectional regression is the ratio of its market
capitalization to the total market capitalization of the firms in the sample. For both the
UWLS and WLS cases, we estimate the three FF3F regressions using the seemingly
unrelated regressions (SUR) procedure to improve estimation efficiency. The
weighted and unweighted FIB regressions for the CAPM are conducted using ordinary
least squares.
When UWLS is used to estimate equations (5)-(7), the Bfjk represent market
value weighted industry betas (Kaplan and Peterson 1998). The equally-weighted
results are useful in obtaining an indication of the betas for the average firm in an
industry, whereas the market value weighted (WLS) results are a more useful indicator
of the overall cost of capital for an industry.
3. Empirical Results
This section begins by discussing summary statistics on the industry participation
ratios of the firms. The overall beta and cost of capital estimation results are then
22
presented, followed by cost of capital estimates by line.
Summary Statistics
All data is taken from the DataStream international database. The sample
contains monthly stock prices, market values and dividend yields of 50 multinational
insurance companies that both appear on the EuroThesys and are listed on stock
exchanges in the four major UK countries (France Netherlands and Switzerland.
These ten stock markets represent more than 80% of the total global stock market
capitalisation. The industrial companies serve as a control group. They are randomly
selected with some attempt to smooth the sampling by industry breakdown. Table 1a
shows the structure of the sample.
------------------------------------------ INSERT TABLE 1a ABOUT HERE ------------------------------------------
IV.2 Method used to calculate returns The Price data is adjusted for capital actions. By incorporating the shares’ dividend
yields, we calculate continuously compounded total returns in local currency, on a
monthly basis and over the period from January 2001 to June 2006.1
Overall Costs of Capital
In all of the cost of capital estimates presented in this paper, we use as the risk-
free rate the average of the 30 day Treasury-bill over the years used in this study,
2001-2005. Likewise, as the expected risk-premia for systematic market risk, size and
financial distress, we use the long-run historical (1926-2000) market risk premia on
UK stocks from French’s website. We use the same risk-free rate and risk premia for
all cost of capital estimates to focus on the impact of the models and the beta
coefficients on the cost of capital, holding constant the risk-free rate and market risk
premia.
The capital asset pricing model (CAPM) beta and sum-beta estimates for
property-liability insurers are summarised in Table 2 along with the corresponding
cost of capital estimates. The table gives the average beta and sum-beta by market
23
capitalization size quartile for each year of the estimation period. As expected, the
sum-beta estimates are consistently larger than the ordinary beta coefficients. For the
sample as a whole, the average beta is 0.677 and the average sum-beta is 0.836. Thus,
property-liability insurers on average tend to be characterized by infrequent trading,
such that it is important to use sum betas to obtain accurate costs of capital.
Interestingly, the quartile results do not show that large insurers consistently have
smaller betas than smaller insurers, contrary to the usual finding large and small
stocks in general. In part, this is because the size difference between the average large
and small insurers is not as high as for large and small stocks in general, e.g. in 2000,
the average insurer in the largest size quartile is approximately half as large as the
average firm in that quartile. Even with the sum-beta adjustment, the betas for insurers
tend to be somewhat less than the average CAPM beta coefficient of 1.0. The cost of
capital estimate for the period as a whole is 10.6% without the sum-beta adjustment
and 12.0 percent with the sum-beta adjustment.
Table 3 provides the overall beta and sum-beta estimates based on the FF3F
method. The beta coefficients for systematic market risk, firm size, and the BE/ME
factor are shown by quartile and year of the sample period. On average, the market
systematic risk factor has a higher beta coefficient than the BE/ME factor, and the
firm size factor has the lowest beta coefficient. For the sample as a whole, the market
beta is 0.98, the size beta is 0.386, and the financial distress beta is 0.813. The sum-
beta estimates are larger than the estimates without the sum-beta adjustment,
indicating that it is important to adjust for infrequent trading in the FF3F model as
well as in the CAPM.
Comparing our results to the results in Fama and French (1997), we find that
our market beta and size beta estimates for insurers are about the same as the all-
industry averages for these two parameters in Fama and French (1997), suggesting
that insurance stocks are about average in terms of their sensitivity to systematic
market risk and firm size. However, our financial distress betas, which average 0.813,
are substantially larger than the Fama-French all industry average of 0.02 for this
parameter. This result suggests that the stock returns of financial firms are much more
sensitive to financial distress than stocks in general and that financial distress leads to
significantly higher costs of capital for insurers.
The FF3F costs of capital shown in Table 3 range from 16.3% in 2003 to
24
18.5% in 2003, without the sum-beta adjustment, and from 17.3% in 2003 to 19.9% in
2003, with the sum-beta adjustment. For the period as a whole, the average cost of
capital is 17.2% without the sum-beta adjustment and 18.5% with the adjustment,
considerably higher than the comparable CAPM costs of capital of 10.6% and 12%
(Table 2). The higher FF3F estimates reflect the risk-premia for firm size and the
BE/ME factor. Hence, it is likely to be important for financial firms to utilize a
multiple-factor model when estimating the cost of capital.
The FF3F cost of capital estimates for financial firms are consistent with the
FF3F estimates reported by Ibbotson Associates (2005) for all industries in 2005,
which average about 15.5% (after adjusting for the risk-free rate which was about 2%
lower in Ibbotson’s analysis than in ours). The FF3F cost of capital estimates for
insurers should be somewhat higher than average because insurers tend to be smaller
than average firms in other industries and because they tend to have more sensitivity
to the BE/ME factor.
To provide further perspective on the FF3F cost of capital estimates we also
calculate the annualized return on an equally weighted index consisting of all UK
stocks in SIC classification 63. The returns on SEC 63 stocks are in general higher
than for the S&P 500 Stock Index and also are generally consistent in magnitude with
the FF3F cost of capital estimates shown in Table 3. For example, the annualized
return on SIC 63 stocks for 2001-2005 was 23.7% compared to 21.4% for the S&P
500, and the returns for 2001-2005 are 16.7% for SIC 63 and 9.8% for the S&P 500.
This provides further evidence that financial firm stocks tend to have higher costs of
capital than stocks in general, at least during recent periods.
Full-Information Costs of Capital
The full-information CAPM beta coefficients for insurance, banking, finance
and all other industries are shown in Table 4. The beta estimates shown in the table
are the industry-participation intercept coefficients (Bfmj) from the CAPM FIB
regression (Equation (5)) on all two digit NAICS industries using all Compustat firms
that met our sample selection criteria. The dependent variable in the regression is the
vector of sum-beta estimates obtained from Equation (2). We conducted the FIB
estimation separately by year and also conducted a panel data regression including the
data from all four years of the sample period in a single regression. Both equally
weighted and market value weighted averages are shown in the Table. The equally
25
weighted averages provide an indication of the beta for the average financial firm,
whereas the market value weighted averages provide an indication of the systematic
risk sensitivity for the industry as a whole. We focus most of the discussion on the
panel data results, but the annual averages are generally quite similar.
Based on the panel regression results, the equally weighted CAPM beta
coefficient for the financial industry is 0.856 and the value-weighted beta is 0.843, i.e.
the industry is slightly less risky than stocks in general, which have an average CAPM
beta coefficient of 1.0. The equally weighted insurance beta based on the panel
estimation model is significantly less than the betas of the health insurance and all
other non-financial industries categories but not significantly different from life
insurance or finance. Based on the value-weighted estimates, insurance betas are
significantly smaller than those of all other industry segments shown in the table.
Hence there is strong evidence that insurance has lower CAPM systematic risk on
average than many other industries.
The CAPM costs of capital based on the beta estimates are shown in the last
two panels of Table 4. Both the equally weighted and value-weighted estimates
suggest that the FIB CAPM cost of equity capital for insurers is approximately 12%.
Based on value-weighted estimates, the CAPM cost of capital for insurers is less than
that for banks (13.5), financial firms (16%) and all other industries (13.2%).
The FF3F full-information beta estimates and costs of capital for insurers are
shown in table 5. The estimates are based on regressions (5)-(7) with the sum-beta
estimates as dependent variables. The models are estimated over all NAICS two-digit
industries using Compustat firms. Equally weighted estimates are shown in section A
of the table and value-weighted estimates are shown in section B. Both sections of the
table show the industry-participation betas for insurance from Equations (5)-(7), i.e.
Bfmj, Bf1sj, and Bf1hj, as well as the average industry-participation betas for all other
industries. Also shown in the table are the slope coefficients for the log of market
capitalization and the log of the BE/ME ratio from Equations (6) and (7), respectively,
i.e. Bf2s and Bf2h. Standard errors are shown for the insurance industry-participation
betas and the slope coefficients. All coefficients are highly statistically significant.
Although standard errors for other industries are not shown, nearly all of the industry-
participation coefficients are also statistically significant.
26
Panel estimates in Table 5 show that insurers have a higher market systematic
risk beta, lower firm size beta and a higher BE/ME beta than all other industries,
based on both the equally-weighted and value-weighted results. This provides further
evidence that financial firm stock returns are much more sensitive to financial distress
than stocks in general and that financial distress significantly increases the cost of
capital for financial firms. As expected, the log of market capitalization has a negative
coefficient in the equation for the size beta (equation (8)), indicating an inverse
relationship between firm size and the cost of capital. Likewise, the coefficient of the
log of the BE/ME ratio has the expected positive sign in the equation for the BE/ME
beta (equation (9)), indicating a positive relationship between the cost of capital and
the book-to-market equity ratio. These results apply to both the equally-weighted and
value-weighted regressions.
The full-information costs of capital based on the equally weighted and the value-
weighted regressions are show in sections C and D of Table 5, respectively. In
estimating the full-information costs of capital, it is necessary to specify values for
market capitalization and the BE/ME ratio in equations (8) and (9) to obtain the full-
information betas for size and financial distress. In order to focus attention on the
difference between beta coefficients rather than differences in market capitalization
and book-to-market ratios, we used the average values of market capitalization (ME)
and the book-to-market ratio (BE/ME) for insurers for all cost of capital estimates
shown in Table 5. Thus, the results for the other industries should be interpreted as the
costs of capital for firms in those industries that have the same market capitalization
and book-to-market ratios as the average insurer rather than the average cost of capital
for those industries.
Based on both the equally-weighted and value-weighted estimates, the cost of equity
capital for insurers is 19.1%. Because FIB estimates focus only on the insurance
industry components of insurer betas, the numbers differ from those in Table 3, which
presents betas for the entire firm rather than specific business lines. However, the full-
information costs of capital for insurance in Table 5 are consistent with the results
shown in Table 5.
Based on the equally-weighted results shown in Table 5, the average insurer has a
significantly higher cost of capital than would a firm with the same market
27
capitalization and BE/ME ratio specializing in insurance, finance excluding insurance,
and all other non-financial industries but is not significantly different from life
insurance. Based on the value-weighted results, the average insurer has a significantly
lower cost of capital than would a firm with the same market capitalization and
BE/ME ratio specializing in life insurance and finance excluding insurance but
significantly higher than for all other non-financial industries.
The most important implication of Tables 4 and 5 is that the FF3F costs of capital
appear to be substantially larger than the CAPM costs of capital for insurers. The FIB
FF3F cost o f capital for insurance firms is approximately 19.1%, whereas the CAPM
cost of capital is about 12%. The FF3F model leads to higher cost of capital estimates
for insurers than the CAPM for two primary reasons; (1) the FF3F systematic market
risk betas in Table 5 are larger than the comparable CAPM betas in Table 4, and (2)
the FF3F model imposes positive cost of capital premia for small size and financial
distress which are not present under the CAPM. The risk-premium component of the
CAPM cost of capital for insurers for the equally weighted case in Table 4 is 7.27%.
For the equally weighted case in Table 5, the risk premium from the CAPM beta
factor is 9.23%, the risk premium for the size factor is 0.51%, and the risk-premium
for the BE/ME factor is 4.37%, for a total risk premium of 14.16%, approximately
twice as large as for the CAPM. Clearly, controlling for factors other than systematic
market risk makes a significant difference, with the financial distress premium playing
a pivotal role.
Conclusion
This paper investigates the estimation of the cost of capital for insurers using a
relatively new methodology, the full-information beta (FIB) approach. The method is
designed to obtain the cost of capital for a division or line of business of a firm, where
the divisions of the firm are not publicly traded. Estimating the cost of capital by line
is important because costs of capital are known to vary significantly for different type
sof economic activities. Using an incorrect cost of capital can lead to the destruction
of firm value through incorrect project decision making and pricing decisions.
The FIB procedure estimates the divisional cost of capital by obtaining the beta
coefficients for a sample of firms and then regressing the betas cross-sectionally
28
against variables measuring each firm’s business composition across industries. The
business composition variables used in this study are the ratios of the revenues coming
from each industry divided by total revenues from all industries. The estimated
regression coefficients are interpreted as full-information betas.
Beta coefficients are estimated using two principal cost of capital models in order to
implement the full-information beta approach – the capital asset pricing model
(CAPM) and the Fama-French three-factor model (FF3F). The CAPM includes a
single risk factor representing the firm’s esxposure to systematic market risk. The
FF3F model adds risk factors for firm size (total market capitalization) and the
firnancial distress of the firm, proxied by the ratio of the book value (BE) of equity to
the market value (ME) of equity. Based on prior empirical research, firm size is
expected to be inversely related to the cost of capital, and the BE/ME ratio is expected
to be positively related to the cost of capital. In estimating the beta coefficients for the
CAPM and the FF3F method, we utilize the sum-beta procedure to adjust for
infrequent trading – this is expecially important in the insurane industry, where many
stocks are characterized by infrequent trading.
To estimate the full-information betas for the insurance industry, we utilize a sample
consisting of all Compustat firms for the estimation period 1997-2000. The sample
includes 172 prublicly traded firms writing insurance. Industry participation variables
are included for all two=-digit industries defined by the NAICS. The coefficient of the
industry-participation ratio for a particular industry is then interpreted as the full-
0information beta coefficient for that industry. For the CAPM, only one FIB
regression is conducted, with the market systematic risk factor (beta) as the dependent
variable. For the FF3F method, three FIB regressions are estimated, one for each of
the three factors in the Fama-French model. The beta regressions for the Fama-French
size and BE/ME risk factors also include the log of each firm’s market dcapitalization
and the log of the BE,ME ratios, respectively, as regressors to control for the negative
(positive) relationship between firm size (BE/M<E) beta and market capitalization
(BE/ME ratio).
In the first set of full-information beta regressions considered in the paper, we
estimate the full-information betas for the entire insurance industry using only
Compustat data to obtain the industry-participation ratios. In the second set of
regressions, we utilize data from the NAIC to break down the revenues of insurers by

29
line of insurance. We estimate full information betas for two insurance-line roupings –
personal and general insurance.

30
CONCLUSION
This paper evaluates the conflict between the G4 GAAP and the IASB’s
current unresolved deliberations on insurance accounting rules. Using simulation
analysis, we investigate the statistical relationship between existing G4 GAAP
accounting-based measures of a firm’s insurance contracts and an ‘economic’ or
expected cash flow measure, using alternative assumptions about the appropriate rate
used to discount insurance firm profits emerging from endowment policies.
Simulation analysis is used to generate time series of each of the two accounting
measures and the economic measure of the insurance contract. Each datum point in
the time series reflects the stream of earnings to stockholders in excess of the present
value of future cash payments to plan participants (i.e., policyholder obligation), net of
the present value of insurance firm assets at that time. A different time series is
generated for each of the four G4 GAAP measures of the insurance contract. The
sensitivity of these time series to various fair value-based actuarial assumptions is
then examined by varying several parameters of the simulation.
A major problem in producing a single set of internationally harmonised set of
accounts for insurance enterprises is the lack of consensus about how best to
meaningfully describe the financial position today in respect of an insurance contract
sold in the past that will involve payments in the future. In response to both economic
and legal pressures in recent years, accounting standard setting bodies in G4 countries
have developed GAAP which incorporate various methods for dealing with this issue,
in order to serve both stewardship and valuation purposes. In contrast to the legalistic
SAP method, existing matching-based G4 GAAP attempt to convey value-relevant
information to capital market participants about the firm’s future earnings that are
expected to emerge from its existing business lines. However G4 GAAP also attempt,
31
to some extent, to incorporate managements’ subjective expectations as to the value of
future profits based on existing business which have not been ‘earned’.
The lack of any consistent method of objective risk-adjustment in G4 GAAP
also leads to conceptual difficulties which may limit their reliability and comparability
to investors. However this in turn raises significant unresolved issues in determining
the ‘fair value’ of insurance contracts. Since fair value liabilities change constantly
because of changes in the discount rate and other assumption changes, traditional
concepts of loss recognition, income smoothing and accounting practices that vary
with product design are no longer applicable.
The existence of major, unresolved IASB accounting issues between existing
matching-based G4 GAAP on the one hand, and the IASB asset-liability approach on
the other, highlights the continuing difficulties underlying insurance accounting. The
ongoing convergence, consolidation and globalisation of the financial services
industry also raise unresolved issues concerning the consistency in measuring
insurance contracts and financial instruments.
By contrast, the alternative fair value ‘constructive’ method as proposed by the
IASB is an evolving system, which focuses on assets and liabilities being measured
consistently. Consistent with this proposal, we develop a comprehensive fair valuation
framework, which implies that there are various contingent assets and liabilities which
should be additionally recognised on the balance sheet. Such an accounting valuation
system is at odds with the traditional residual income valuation framework, since it is
asset-liability based, and thus does not provide for deferral and amortisation practices
that enter into earnings multiple calculations, nor does it permit variation between
book value and market value of various assets and liabilities. However we argue that
this framework is both consistent with that proposed by the Steering Committee, and
is likely to be appropriate to insurance firms, especially given advances in financial
risk management, the globalization of capital markets, and the complexity of financial
instruments in use today.
The extended conceptual framework can facilitate the analysis of unresolved
problems in fair valuation to financial reporting by identifying separate components of
a consolidated balance sheet which incorporate various sources of credit, market and
business risk associated with fair valuation principles. We also propose a series of risk
disclosures to overcome exposures that can otherwise potentially lead to a mismatch
32
between economic and accounting performance measurement of these various
components of fair valuation. Some but not all of these disclosures are already
included in IFRS4, which are generally limited to disclosures about amounts in
financial statements and the amount, timing and uncertainty of future cash flows. By
contrast, our recommendations for risk disclosure go further by identifying areas of
risk allocation, e.g. operational risk and information about internal risk models, that
are not generally covered by a fair value reporting system.
The primary conclusions of the paper concerning cost of capital are the following:
(1) it is important to use the sum beta technique to control for infrequent trading
when estimating betas for the indussrance industry under both the CAPM and
FF3F methods. Failure to adjust for this prob lem is likely to lead to under-
estimation of the cost of capital
(2) The cost of capital estimates from the FF3F method are significantly higher
than estimates based on the CAPM. Hence, failure to adjust for firm size and
financial distress could lead to significant under-estimation of the cost of
capital.
(3) The cost of capital varies significantly by line of insurance and also varies
between large and small insuerer. Thus it is important to use firm and line
specific costs of capital in applications such as project selection and pricing.
(4) Value-weighted estimates of the cost of capital often differ significantly from
equally weighted estimates. Thus, basing price regulation on industry-wide
results rather than costs of capital by firm may lead to significant pricing errors
for many firms in the industry.
(5) Use of book value estimates to inform FF3F and FIB cost of capital estimates
are sensitive to the accounting method used. Conservative SAP and GAAP
lead to lower cost of capital estimates than under fair value or Solvency II.
This is because implicit guarantees and unrealised gains or losses on
investments, and the policy provision for future losses are incorporated into
IFRS /Solvency II and thereby cause the cost of capital estimates to become
more volatile.
In general, the full-information beta approach provides a reliable method for
estimating costs of capital by line for insurers. The method is likely to obtain the
most reliable results if it is used with the sum-beta adjustment and the FF3F
33
method. The CAPM cost of capital with sum beta adjustment may also be useful
at least as a reasonability check on the FF3F method.
Full-information betas can be used by insueres in a variety of contexts, including
the estimation of risk-adjusted returns on capital (RAROC), insurance pricing, and
decision-making about entering or exiting lines of business. Full-information costs
of capital also could be used to evaluate potential merger, acquisition, and
divestitutre transactions. Another important advantage is that the full-information
model can be used to estimate the cost of capital for insurers that do not have
traded equity, including mutuals, reciprocals, and untraded stock insurers. The
findings will also be useful to researchers seeking to identify the determinants of
cross-sectional pricing differences across insurers.
Finally, it is alos important to note that cost of capital estimates vary over time for
a variety of reasons. For example, changes in interest rates as well as changes in
economic conditions may affect estimated beta coefficients. Variability also arises
because insurers are impacted by a variety of economic and regulatory factors
affecting both investment and underwriting results that can change the relationship
between their stock returns and the market return factors in the CAPM and FF3F
models. Estimates which are unusually high or low by historical standards can also
occur due to renadom variation inherent in the estimation of any regression model.
Accordingly, some judgment will be needed in practical application of the
methodology proposed in this paper. For example, it is recommend ded that th
eocst of capital be estimated for several years prior to the period in which the
estimates will be used and that averages of the cost of capital over some
reasonable period be employed in order to smooth somewhat the fluctuations in
beta estimates over time. Thus, capital budgeting decisions based on a sound
theoretical framework coupled with the expert discretion should lead to better
pricing and project selection decisions.
Further research is needed to address more comprehensively the performance
aspects of fair valuation reporting model, given the growing interest and concern
about the international competitiveness and efficiency of life insurers. We have not,
for instance compared our cost of capital estimates with the ‘market consistent’
methods proposed by either Swiss Re (2005) and Exley and Smith (2007). We
therefore urge researchers and practitioners to continue a debate on resolving these

34
outstanding issues in order to successfully develop a single harmonised set of
international accounting standards.
35
Endnotes
1. The project was initiated by the IASB’s predecessor, the International Accounting
Standards Committee. The Steering Committee has subsequently been issuing
sections of a Draft Statement of Principles (IASB, 2002).
2. In the UK there are a number of firms who buy and sell with profit endowment
insurance contracts. The trading values exceed the surrender values offered by life
insurers (McGurk, 1998). The market does not cover all policies, e.g. short-term
policies and it may not be regarded as especially liquid. Nevertheless, it is a useful
point of comparison for the tests being carried out on what fair value calculations
might be.
3. SAP typically uses assets at market value or below and liabilities which are
inflated by conservative assumptions regarding future investment returns and
mortality, which are typically set aside in the form of provisions or reserves.
Reserves are retained to meet future policy liabilities, expenses and contingencies
and to fund a smooth distribution of surplus (Horton and Macve, 1995, p. 270).
4. However while SFAS 115 required U.S. insurance firms to adopt partial fair value
for their investment securities, their insurance liabilities were still subject to
conservative book value amortization rules in accord with SFAS 60 or SFAS 97,
thus potentially understating the net worth, and created a higher probability of
negative amortization of DAC. In December 1993 the SEC realized the potential
impact in financial reporting for financial institutions due to SFAS 115. As a
result, the SEC issued instructions that insurance companies compute a contract
premium margin valuation for each of its lines where SFAS 60 or SFAS 97
applied (Becker, 1998, 222).
5. The U.K. Accounting Standards Board has not given its approval to UK GAAP as
described here (the ‘achieved profits’ method), many companies therefore prepare
their accounts using a modified version of SAP and report their ‘achieved profits’
as supplementary information. Instead, in July 2004 the ASB issued FRS 27 for
insurance, which excludes from the definition of embedded value any valuable
attributable to future investment margins and management fees in excess of their
fair value (para. 22). Nevertheless the term ‘UK GAAP’ is used to provide
consistency with other national GAAP.
6. This assertion is controversial. Prior research has demonstrated the importance of
36
measuring both financial assets and liabilities consistently at fair value (Linsmeier
et al., 1998). However it has not conclusively demonstrated whether fair-value
disclosures are value relevant for market-to-historical-cost book ratios in the
property casualty industry (Petroni and Wahlen, 1995); the US insurance industry
(Michel, 1999) or the UK insurance industry (Horton and Macve, 1999).
7. The IASB’s tentative conclusion for Phase II is that unless there is market
evidence to the contrary, fair value would have to be assessed on the basis of
current prices of insurance products,. The latter approach may lead to some odd
results; e.g. if an insurer raises its prices with a view to increasing its profits, it
may mean it has to increase its provisions, with profits perhaps decreasing. Hence,
insurers have an incentive to find the relevant market evidence. Our calculations,
therefore, assume that liabilities are not based on current insurance prices.
8. Doll et al. (1998) discuss a number of methodologies which can be used to
implement a constructive approach to the fair valuation of insurance firm
liabilities.
9. We restrict the scope of our discussion in this section to measurement principles
that are already codified by standards already issued by the IASB in the related
topics of financial instruments (IAS 39) and provisions (IAS 37). There are
however a number of other open issues that can bear on fair value measurement,
such as assumptions about management performance, credit standing and
treatment of deferred acquisition costs.
10. Whether the option has any value at expiration depends on the asset’s future value
by actuarial profit measures. Pindyck (1988) illustrates the potential importance of
valuable investment options for the value of the firm. This analysis presumes
imperfections exist in insurance which are understated by the book value of assets
(Penman, 1996; Klumpes and Shackleton, 2000).
37
REFERENCES
Albrecht, P. 1994. Financial approach to actuarial risks?, Proceedings of the 2nd AFIR
International Colloquium, 4:227-247. American Institute of Certified Practising Accountants. 1995. Statement of Position
(SOP) 95-1. Accounting for Certain Insurance Activities of mutual Insurance Enterprises.
Association of British Insurers 1998. Exposure draft: guidance on reporting
shareholders profits from long-term business in group accounts: the achieved profits method.
Association of British Insurers 2003. Statement of Recommended practice on
Accounting for Insurance Business. Australian Accounting Standards Board. 1998. Statement No. 38. Financial reporting
of insurance Business. Babbel, D.F. 1997. Comment on Doll et al., in I.T. Vanderhoof and E.I. Altman eds.,
The Fair Value of Insurance Liabilities. Kluwer, -----. and C.B. Merrill. 1999. Toward a unified valuation model for life insurers, in
J.D. Cummins and A.M. Santomero eds., Changes in the Insurance Indstry: Efficiency, Technology and Risk Management, Kluwer: Boston.
Babbel, D.F., J. Gold and C.B. Merrill. 2002. Fair value of liabilities; the financial economics perspective. North American Actuarial Journal, Vol. 6(1): 12-27.
-----. and A.M. Santomero. 1999. An analysis of the financial risk management
process used by life insurers, in J.D. Cummins and A.M. Santomero eds., Changes in the Insurance Indstry: Efficiency, Technology and Risk Management, Kluwer: Boston.
Barber, B.M. and J. D. Lyon, 1997. ‘Firm Size, Book-toMarket and Security Returns: A Holdout Sample of Financial Firms’, Journal of Finance 52(2): 875-883.
Brealey, R.A. and S.C. Myers, 2002. Principles of Corporate Finance, 7th Edition, Boston: McGraw-Hill/Irwin.
Becker, D.N. 1998. The value of the firm: the option adjusted value of distributable
earnings.’ in I.T. Vanderhoof and E.I. Altman Eds, The Fair Value of Insurance Liabilities, Kluwer: New York.
Black, F. 1993. ‘Choosing accounting rules’, Accounting Horizons, Vol. 7(4): 1-17. Booth, P.M., R. Chadburn, D. Cooper, S. Haberman & D. James 2005. Modern
Actuarial Theory and Practice. CRC Press: Boca Raton. Canadian Institute of Chartered Accountants. 2001. CICA Handbook. Cant, M.A. and D.A. French 1993. Margin on Services Reporting: the Financial
Implications. Presented to Institute of Actuaries of Australia Sessional
38
Meeting. Campbell, J.Y., A.W.Lo and A.C. MacKinlay, 1997. The Econometrics of Financial
Markets. Princeton, N.J.:Princeton University PRerss. Cochrane, J.H. 1999. ‘New Fact in Finance’, Economic Perspectives 23(3): 36-58. Cox, L. and G.L. Griepentrog, 1988, ‘The Pure-Play Cost of Equity for Insurance
Divisions’, Journal of Risk and Insurance 55: 442-452. Cummins, J.D. 1990. ‘Multi-Period Discounted Cash Flow Ratemaking Models in
Property-Liability Insurance’, Journal of Risk and Insurance 57: 79-109. Cummins, J.D. and S.E. Harrington. 1985. ‘Property-Liability Insurance Rate
Regulation: Estimation of Underwriting Betas Using Quarterly Profit Data’, Journal of Risk and Insurance 52: 16-43.
Cummins, J.D. and S.E. Harrington, eds, 1987. Fair Rate of Return in Property-Liability Insurance. Hingham, MA: Kluwer Academic Publishers.
Cummins, J.D. and C.M. Lewis, 2003. ‘Catastrophic Events, Parameter Uncertainty, and the Breakdown of Implicit Long-Term Contracting: The Case of Terrorism Insurance’, Journal of Risk and Uncertainty, 26: 153-178.
Cummins, J.D. and R.D. Phillips, 2001. ‘Financial Pricing of Property-Liability Insurance’, in G.Dionne, ed., Handbook of Insurance Economics (Boston, MA: Kluwer Academic Publishers).
Cummins, J.D. and R.D. Phillips, 2005. Estimating cost of capital for property-liability insurers. Journal of Risk and Insurance.
Dickinson, G. 2003. The Search for an International Accounting Standard for
Insurance. Geneva Papers on Risk and Insurance, 28(2): 151-175. Dickinson, G. and P. Liedtke. 2004. “Impact of a fair value financial reporting system
on insurance companies: a survey”. The Geneva Papers on Risk and Practice, special issue.
Doll, D.C., C.P. Elam, J.E. Hohmann, J.M. Keating, D.S. Kolsrud, K.O. MacDonald, S.M. McLauglin, T.J. Merfeld, S.D. Reddy, R.R. Reitano, R.S. Robertson, E.L. Robbins, D.Y.Rogers and H.W. Siegel. 1998. Fair valuation of insurance company liabilities. in I.T. Vanderhoof and E.I. Altman Eds, The Fair Value of Insurance Liabilities, Kluwer: New York.
Dullaway, D. and A. Bice. 2002. How fair is fair value? Insight, 2: 18-22.
Derrig, R.A. and E. Orr 2003. ‘Equity Risk Premium: Expectations Great and
Small’, presented at the 2003 Bowles Symposium, Georgia State University,
Atlanta GA.
Dickinson, G. 2003. ‘The Search for an International Accounting Standard for
Insurance: Report to The Accountancy Task Force of the Geneva Association’,
Geneva Papers on Risk & Insurance: Issues and Practices, 28(2): 151-175.
Dimson, E. 1979. ‘Risk Measurement When Shares Are Subject to Infrequent
Trading’, Journal of Financial Economics 7: 197-226.
Ehrhardt, M.C. and Y.N. Bhagwat 1991. ‘A Full-Information Approach for Estimating
39
Divisional Betas’, Financial Management 20: 60-69.
Financial Accounting Standards Board. 1982. Statement of Financial Accounting
Standards No. 60, Accounting and Reporting by Insurance Enterprises. FASB, Norwalk.
-----. 1987. Statement of Financial Accounting Standards No. 97, Accounting and
Reporting by Insurance Enterprises for Certain Long-Duration contracts and for realized Gains and Losses from the Saleof Investments. FASB, Norwalk.
-----. 1992. Statement of Financial Accounting Standards No. 115, Accounting for
Certain Investments in Debt and Equity Securities. FASB, Norwalk. -----. 1995. Statement No. 120. Accounting and Reporting by Mutual Insurance
Enterprises and by Insurance Enterprises for Certain Long-Duration Participating Contracts. FASB, Norwalk.
-----. 2000. Statement No. 133. Accounting for Financial Instruments. FASB, Norwalk. Fama, E.F. and K.R. French 1992. ‘The Cross-Section of Expected Stock Returns’,
Journal of Finance’, 47: 427-465. Fama, E.F. and K.R. French, 1993. ‘Common Risk Factors In the Returns on Stocks
and Bonds’, Journal of Financial Economics 39: 3-56. Fama, E.F. and K.R. French, 1995. ‘Size and Book-to-Market Factors in Earnings and
Returns’, Journal of Finance 51: 55-84. Fama, E.F. and K.R. French. 1997. ‘Industry Costs of Equity’, Journal of Financial
Economics 43: 153-193. Froot, K.A. 2004. ‘Risk Management, Capital Budgeting and Capital Structure Policy
for Insurers and Reinsurers’, Harvard Working Paper, Boston MA. Froot, K.A. and J.C. Stein. 1998. ‘Risk Management, Capital Budgeting and Capital
Structure Policy for Financial Institutions: An Integrated Approach’, Journal of Financial Economics 47: 55-82. Froot, K. A. and Stein, 1996. Risk Management, Capital Budgeting and Capital Structure Policy for Financial institutions: An Integrated Approach. NBER Worlking PAPer 5403.
Fuller, R.J. and H.S. Kerr. 1981. ‘Estimating the Divisional Cost of Capital: An Analysis of the Pure-Play Technique’, Journal of Finance 36: 997-1009.
Girard, L.N. 2002. ‘An Approach to Fair Valuation of Insurance Liabilities Using theFirm’s Cost of Capital’, North American Actuarial Journal 6: 18-41.
Graham, J.R. and C.R. Harvey, 2001. ‘The Theory and Practice of Corporate Finance: Evidence from the Field’, Journal of Financial Economics 60: 187-243.
Gutterman, S. 2000. The valuation of future cash flows: an actuarial issues paper, in I.T. Vanderhoof and E.I. Altman eds. The Fair Value of Insurance Business. Kluwer Academic Publishers, New York.
Hairs, C.J., D.J.Belsham, N.M. Bryson, C.M. George, D.J.P.Hare, D.A.Smith & S.
Thompson, 2002. “Fair valuation of liabilities”. British Actuarial Journal, 8(II): 203-299.
Harrington. S. 1990. Prices and profitability in the Property-Casualty Industry. In S.
40
Harrington and G. Dionne eds., Economics of Insurance Economics. orton, J and R. Macve. 1994. Accounting principles for insurance: a true and fair view? Institute of Chartered Accountants in England and Wales, London.
-----. 1999. Planned changes in accounting principles for UK insurance companies: a
preliminary investigation of stock market impact. Journal of Business Finance and Accounting 25(7): 137-158.
Ibbotson Associates. 2006. Stocks, Bonds, Bills and Inflation: Valuation Edition (2002 Yearbook) Chicago.
International Accounting Standards Board. 2001. Insight, London. -----., (Insurance Steering Committee). 2002. Insurance: Draft Statement of
Principles. IASC: London. -----. 2004. IFRS 4: Insurance Contracts, IASC: London. International Accounting Standards Committee (Insurance Steering Committee).
1999. Issues Paper - Insurance. ----. 1993. IAS 18. Revenue, IASC: London. ----. 1998. IAS 32. Financial Instruments: Disclosure and Presentation, IASC:
London. ----. 1998. IAS 36: Impairment of Assets, IASC: London. -----. 1998. IAS 37: Provisions, Contingent Liabilities and Contingent Assets. IASC:
London. International Accounting Standards Board. 2000. IAS 19: Employee Benefits. IASB:
London. ----. 2000. IAS 39: Financial Instruments: Recognition and Measurement. IASB:
London. ----. 2001. IAS 40: Investment Property. IASB: London. ----. 2001. IAS 41. Agriculture. IASB: London. Jorion, P. 1997. Value at Risk McGraw-Hill: New York. Joint Working Group of the FASB, AASB, ASB and CICA. 2001. Proposals for A
Fair Value Standard for Financial Instruments. Kaplan, P.D. and J.D. Peterson 1998. ‘Full-Information Industry Betas’, Financial
Management 27: 85-93. Klumpes, P.J.M. 1999. "Measuring the profitability of proprietary UK insurance
companies", British Accounting Review 31(2), 185-204. Klumpes, P.J.M. and M.B. Shackleton. 2000. “Valuing the strategic option to sell
insurance business: theory and evidence”, Journal of Banking and Finance 24: 1681-1702.
Linsmeier, T.J., J. R. Boatsman, R.H.Herz, R.G. Jennings, G.J.Jonas, M.H. Lang,
K.R. Petroni, D. Shores, J.M. Wahlen. 1998. Response to a discussion paper
41
issued by the IASC/CICA steering committee on Financial Instruments “Accounting for Financial Assets and Financial Liabilities”. Accounting Horizons 12(1): 90-98.
Lee, A.C. and J.D. Cummins, 1998. ‘Alternative Models for Estimating the Cost of Equity Capital for Property/Casualty Insurers’, Review of Quantitative Finance and Accounting 10: 235-267.
Myers, S.C. and J.A. Read, 2001. ‘Capital Allocation for Insurance Companies’, Journal of Risk and Insurance 68: 545-580.
McCrossan, P.W. 2002. A new international standard for insurance accounting?, The Actuary, January: 1-5.
McGurk, P. 1998. “Traded endowments”, British Actuarial Journal 4(III): 485-524. Merton, R.C. and A.F. Perold. 1997. Management of Risk Capital in Financial Firms.
In C. Powell, ed., Financial Services: issues and Challenges, Irwin. Michel, M.L. 1999. Earnings, historical cost book values, and fair-value disclosures in
the valuation of stock insurance companies. In I.T. Vanderhoof and E.I. Altman, eds., The Fair value of Insurance Business. Kluwer: New York.
Multidisciplinary Working Group on Enhanced Disclosure. 2001. Final Report to
Basel Committee. O’Brien, C. 1994. Profit, capital and value in a proprietary life assurance company,
Journal of the Institute of Actuaries, 121: 285-339. Ohlson, J. 1995. Earnings, Book Values and Dividends in Equity Valuation,
Contemporary Accounting Research. Panjer, H.H. 1998. Financial Economics With Applications to Investments, Insurance
and Pensions. Schaumburg, IL: The Actuarial Foundation. Phillips, R.D., J.D. Cummins and F. Allen. 1998. ‘Financial Pricing of Insurance in
the Multiple Line Insurance Company’, Journal of Risk and Insurance 65: 597-636.
Penman, S.H. 1996. The articulation of price-earnings ratios and market-to-book ratios and the evaluaton of growth. Journal of Accounting Research, 34: 235-259. Penrose, Lord 2004. Report of the Equitable Life Inquiry: HM Treasury, London. Petroni, K. and J. Wahlen. 1995. Fair values of equity and debt securities and share
prices of property-liability insurance companies. Journal of Risk and Insurance 62(4): 719-737.
Pindyck, R.S. 1988. Irreversible investment, capacity choice and the value of the firm, American Economic Review 78: 969-985. Ross, S.A. 1976. ‘The Arbitrage Theory of Capital Asset Pricing’, Journal of
Economic Theory 13(2): 383-402. Reitano, R.R. 1995. Two paradigms for the market value of liabilities, North
American Actuarial Journal 1(4): 104-122.
42
Royal & Sun Alliance. 2004. Annual report and accounts 2003.
Scholes, M and J. Williams, 1977. ‘Estimating Beta from Nonsychronous Data’,
Journal of Financial Economics 5(3): 309-327.
Sommer, D. 1996. ‘The Impact of Firm Risk on Property-Liability Insurance Prices’,
Journal of Risk and Insurance 63: 501-514.
Taylor, G. 1994. ‘Fair Premium Rating Methods and the Relations Between Them’,
Journal of Risk and Insurance 61: 592-615.
Selling, T.I and C.P. Stickney. 1986. Accounting measures of unfunded pension liabilities and the expected present value of future pension cash flows. Journal of Accounting and Public Policy, 5, 267-285.
Sheldon, T.J. & Smith, A.D., 2004. Market-consistent valuation of insurance business
of Liabilities. Paper presented to the Institute of Actuaries. Skerman, R. 1966. A solvency standard for life assurance business, Journal of the
Institute of Actuaries, 92: 75-84. Tillinghast, Towers Perrin. 2002. Fair value accounting – slow progress puts original
timetable in jeopardy. Financial Services Update. May. Upton, W. 1997. A Primer on Accounting Models for Long-Duration Insurance
Contracts under U.S. GAAP. Financial Accounting Series No. 167-A. FASB: Norwalk.
Wallace, M. 2002. Performance reporting under fair value accounting. North
American Actuarial Journal 6(1): 28-61.
Wang, K.Q. 2003. ‘Asset Pricing with Conditioning Information: A New Test’,
Journal of Finance 58: 161-196.
Wei, K.C.J. 1988. ‘An Asset-Pricing Theory Unifying the CAPM and APT’, Journal of Finance 43: 881-892.Adams, M. and Scott, W.A. 1994. Realistic reporting of insurance company
policy liabilities and profits’, Journal of the Institute of Actuaries,121: 441-58. Welzel, H.-J. 1996. The concept of prudence in EC Insurance Accounts law. Geneva
Papers on Risk and Insurance, 21: 36-49.
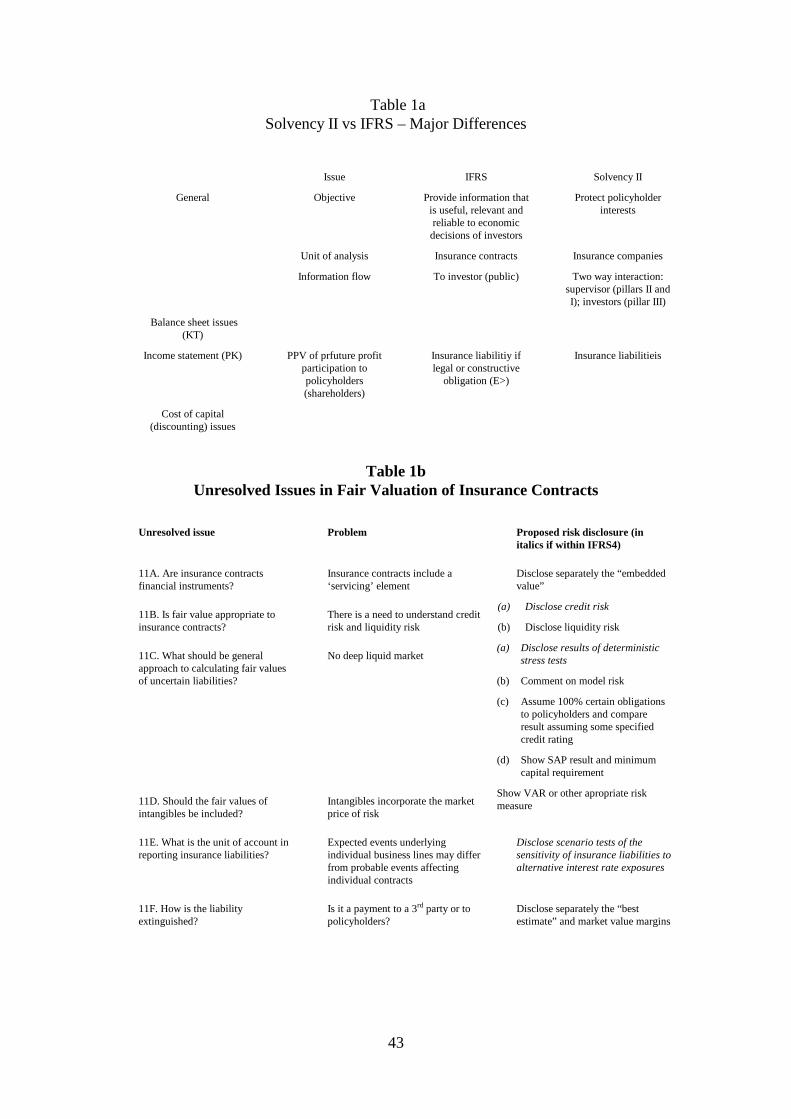
43
Table 1a Solvency II vs IFRS – Major Differences
Issue IFRS Solvency II
General Objective Provide information that is useful, relevant and reliable to economic decisions of investors
Protect policyholder interests
Unit of analysis Insurance contracts Insurance companies
Information flow To investor (public) Two way interaction: supervisor (pillars II and I); investors (pillar III)
Balance sheet issues (KT)
Income statement (PK) PPV of prfuture profit participation to policyholders (shareholders)
Insurance liabilitiy if legal or constructive
obligation (E>)
Insurance liabilitieis
Cost of capital (discounting) issues
Table 1b Unresolved Issues in Fair Valuation of Insurance Contracts
Unresolved issue Problem Proposed risk disclosure (in
italics if within IFRS4)
11A. Are insurance contracts financial instruments?
Insurance contracts include a ‘servicing’ element
Disclose separately the “embedded value”
11B. Is fair value appropriate to insurance contracts?
There is a need to understand credit risk and liquidity risk
(a) Disclose credit risk
(b) Disclose liquidity risk
11C. What should be general approach to calculating fair values of uncertain liabilities?
No deep liquid market (a) Disclose results of deterministic
stress tests
(b) Comment on model risk
(c) Assume 100% certain obligations to policyholders and compare result assuming some specified credit rating
(d) Show SAP result and minimum capital requirement
11D. Should the fair values of intangibles be included?
Intangibles incorporate the market price of risk
Show VAR or other apropriate risk measure
11E. What is the unit of account in reporting insurance liabilities?
Expected events underlying individual business lines may differ from probable events affecting individual contracts
Disclose scenario tests of the sensitivity of insurance liabilities to alternative interest rate exposures
11F. How is the liability extinguished?
Is it a payment to a 3rd party or to policyholders?
Disclose separately the “best estimate” and market value margins

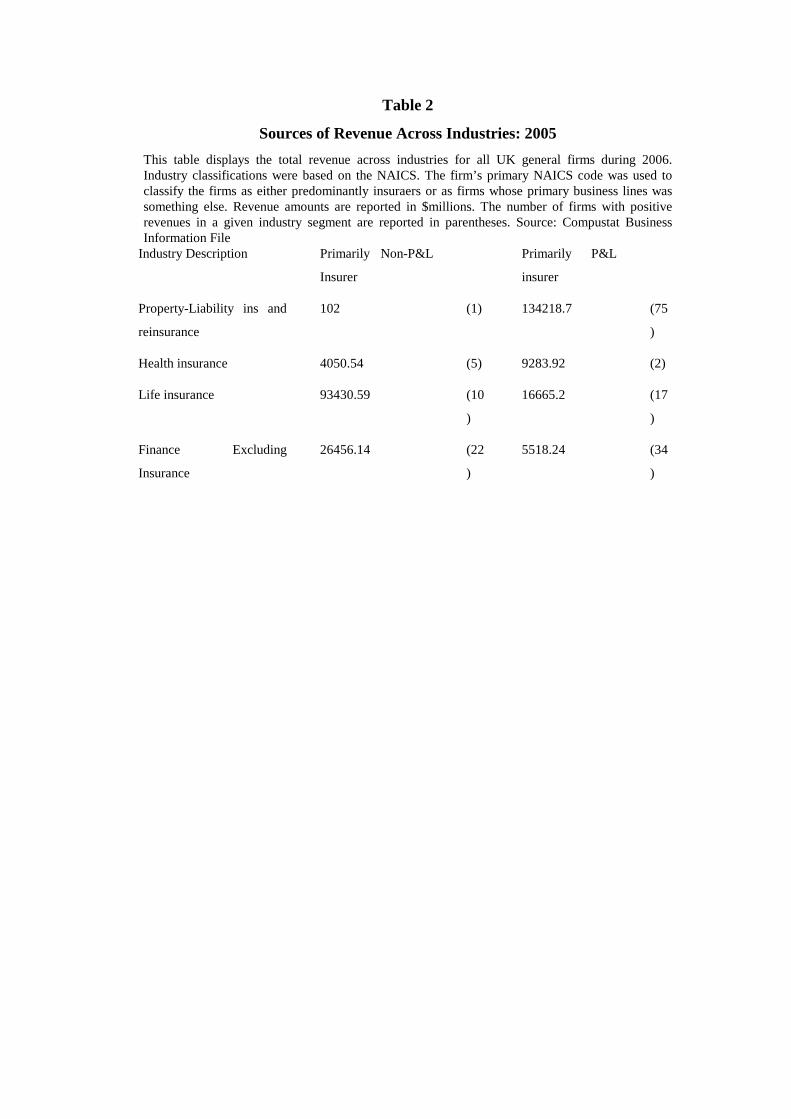
Table 2
Sources of Revenue Across Industries: 2005
This table displays the total revenue across industries for all UK general firms during 2006. Industry classifications were based on the NAICS. The firm’s primary NAICS code was used to classify the firms as either predominantly insuraers or as firms whose primary business lines was something else. Revenue amounts are reported in $millions. The number of firms with positive revenues in a given industry segment are reported in parentheses. Source: Compustat Business Information File
Industry Description Primarily Non-P&L
Insurer
Primarily P&L
insurer
Property-Liability ins and
reinsurance
102 (1) 134218.7 (75
)
Health insurance 4050.54 (5) 9283.92 (2)
Life insurance 93430.59 (10
)
16665.2 (17
)
Finance Excluding
Insurance
26456.14 (22
)
5518.24 (34
)

36
Table 3
CAPM Betas and Costs of Capital for General Insurance firms
This table show the average CAPM beta for forms which are identified as insurers based on having overall NAICS codes 524. Both beta and sum beta regressions are conducted for each firm (equations (2) and (3)). The beta regression is: (rit-rft) = ai + Bmi(rmt – rft) + eit, where rit is the return on firm i, rft is the 30 day Treasury bill rate observed at the beginning of the month, and rmt is the value-weighted market return on all UK stocks. The ‘sum B’ model adjusts for non-synchronous trading by adding to the regression the excess market return variable lagged one time period. The reported sum betas equal the sum of the contemporaneous and lagged beta estimates. The data period for each year ends on June 30. Estimates are calculated using the previous 60-months of returns. The risk-free rate of interest used to estimate the cost of equity capital was the average 30 day T-bill rate over the time period for this study 2000-2003, 4.93%. The long-run historical market risk premium as of December 2003 was 8.44% (Ibottson, 2005).
Year Market
cap
Quartile
No
insurers
Average
B
Cost of
capital
Average
Sum B
Cost of
Capital
2001 Small 21 0.646 0.104 0.893 0.125
2 21 0.861 0.122 1.144 0.146
3 21 0.709 0.109 0.809 0.118
Big 22 0.820 0.119 0.932 0.128
Total 85 0.760 0.113 0.944 0.129
2002 Small 18 0.632 0.103 0.926 0.127
2 19 0.687 0.107 0.908 0.126
3 19 0.652 0.104 0.811 0.118
Big 19 0.917 0.127 0.999 0.134
Total 75 0.723 0.110 0.911 0.126
2003 Small 19 0.570 0.097 0.812 0.118
2 19 0.616 0.101 0.677 0.106
3 19 0.652 0.103 0.736 0.111
Big 19 0.690 0.107 0.745 0.112
2004 Small 18 0.316 0.076 0.631 0.103
2 18 0.654 0.104 0.763 0.114
3 18 0.642 0.104 0.696 0.108
ye Big 19 0.712 0.109 0.817 0.118
Total 73 0.583 0.098 0.728 0.111
Grand
total
309 0.677 0.106 0.836 0.120
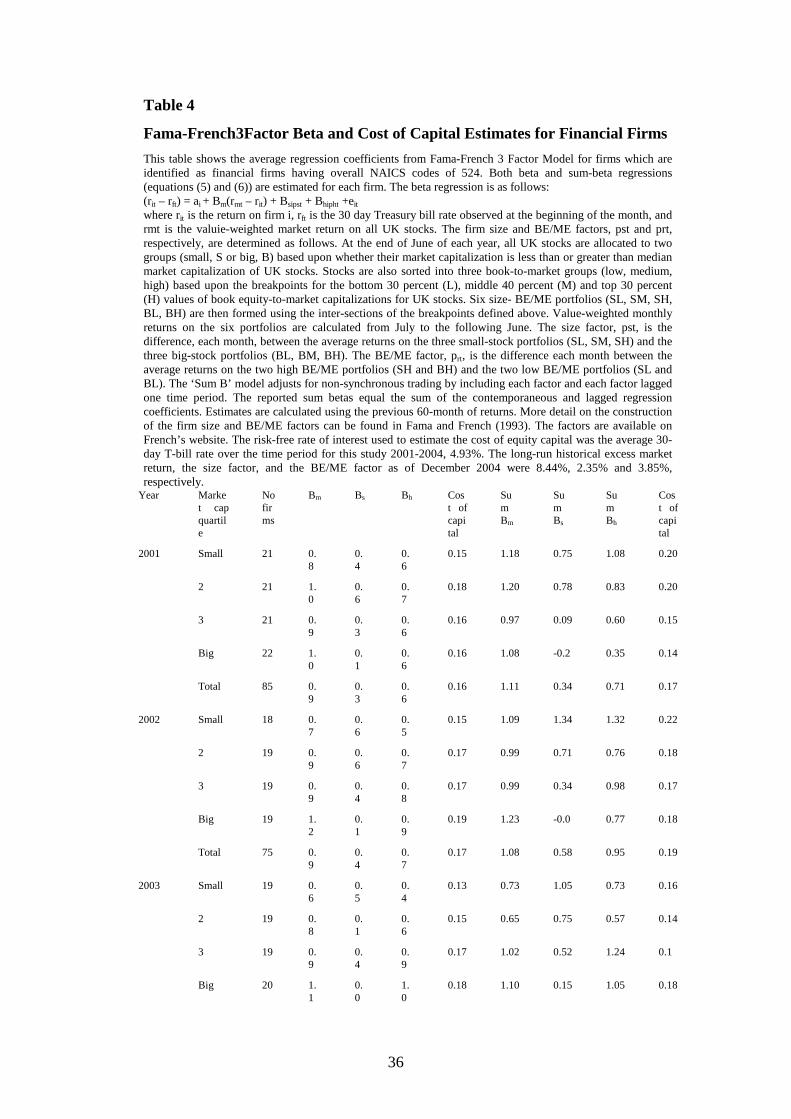
36
Table 4
Fama-French3Factor Beta and Cost of Capital Estimates for Financial Firms
This table shows the average regression coefficients from Fama-French 3 Factor Model for firms which are identified as financial firms having overall NAICS codes of 524. Both beta and sum-beta regressions (equations (5) and (6)) are estimated for each firm. The beta regression is as follows: (rit – rft) = ai + Bm(rmt – rit) + Bsipst + Bhipht +eit where rit is the return on firm i, rft is the 30 day Treasury bill rate observed at the beginning of the month, and rmt is the valuie-weighted market return on all UK stocks. The firm size and BE/ME factors, pst and prt, respectively, are determined as follows. At the end of June of each year, all UK stocks are allocated to two groups (small, S or big, B) based upon whether their market capitalization is less than or greater than median market capitalization of UK stocks. Stocks are also sorted into three book-to-market groups (low, medium, high) based upon the breakpoints for the bottom 30 percent (L), middle 40 percent (M) and top 30 percent (H) values of book equity-to-market capitalizations for UK stocks. Six size- BE/ME portfolios (SL, SM, SH, BL, BH) are then formed using the inter-sections of the breakpoints defined above. Value-weighted monthly returns on the six portfolios are calculated from July to the following June. The size factor, pst, is the difference, each month, between the average returns on the three small-stock portfolios (SL, SM, SH) and the three big-stock portfolios (BL, BM, BH). The BE/ME factor, prt, is the difference each month between the average returns on the two high BE/ME portfolios (SH and BH) and the two low BE/ME portfolios (SL and BL). The ‘Sum B’ model adjusts for non-synchronous trading by including each factor and each factor lagged one time period. The reported sum betas equal the sum of the contemporaneous and lagged regression coefficients. Estimates are calculated using the previous 60-month of returns. More detail on the construction of the firm size and BE/ME factors can be found in Fama and French (1993). The factors are available on French’s website. The risk-free rate of interest used to estimate the cost of equity capital was the average 30-day T-bill rate over the time period for this study 2001-2004, 4.93%. The long-run historical excess market return, the size factor, and the BE/ME factor as of December 2004 were 8.44%, 2.35% and 3.85%, respectively.
Year Market cap quartile
No firms
Bm Bs Bh Cost of capital
Sum Bm
Sum Bs
Sum Bh
Cost of capital
2001 Small 21 0.8
0.4
0.6
0.15 1.18 0.75 1.08 0.20
2 21 1.0
0.6
0.7
0.18 1.20 0.78 0.83 0.20
3 21 0.9
0.3
0.6
0.16 0.97 0.09 0.60 0.15
Big 22 1.0
0.1
0.6
0.16 1.08 -0.2 0.35 0.14
Total 85 0.9
0.3
0.6
0.16 1.11 0.34 0.71 0.17
2002 Small 18 0.7
0.6
0.5
0.15 1.09 1.34 1.32 0.22
2 19 0.9
0.6
0.7
0.17 0.99 0.71 0.76 0.18
3 19 0.9
0.4
0.8
0.17 0.99 0.34 0.98 0.17
Big 19 1.2
0.1
0.9
0.19 1.23 -0.0 0.77 0.18
Total 75 0.9
0.4
0.7
0.17 1.08 0.58 0.95 0.19
2003 Small 19 0.6
0.5
0.4
0.13 0.73 1.05 0.73 0.16
2 19 0.8
0.1
0.6
0.15 0.65 0.75 0.57 0.14
3 19 0.9
0.4
0.9
0.17 1.02 0.52 1.24 0.1
Big 20 1.1
0.0
1.0
0.18 1.10 0.15 1.05 0.18

36
2004 Small 18 0.6
0.6
0.9
0.15 1.06 0.74 1.38 0.21
2 19 1.0
0.5
0.9
0.19 1.03 0.63 1.05 0.19
3 19 1.1
0.1
1.0
0.18 1.05 0.44 1.27 0.19
Big 19 1.3
-0. 1.1
0.20 1.16 0.10 1.18 0.19
Total 75 1.0
0.2
1.0
0.18 1.08 0.47 1.22 0.19
Grand Total
31 0.9
0.3
0.8
0.17 1.04 0.50 0.94 0.18
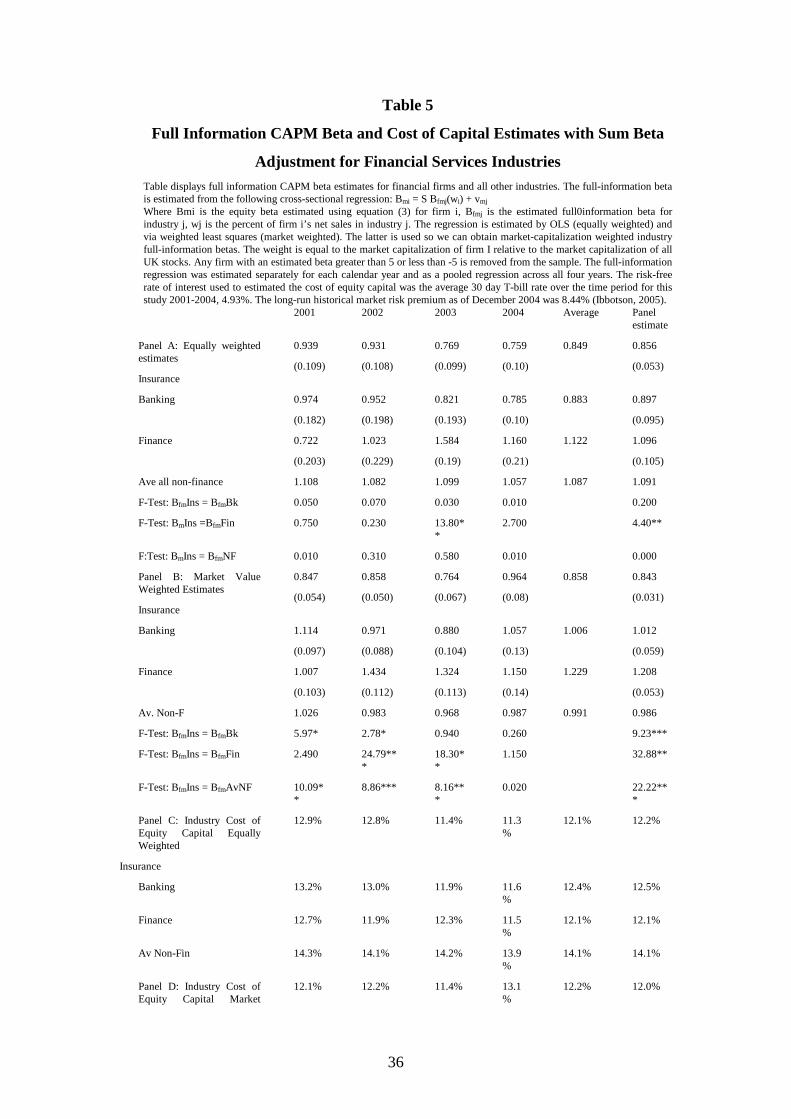
36
Table 5
Full Information CAPM Beta and Cost of Capital Estimates with Sum Beta
Adjustment for Financial Services Industries Table displays full information CAPM beta estimates for financial firms and all other industries. The full-information beta is estimated from the following cross-sectional regression: Bmi = S Bfmj(wi) + vmj Where Bmi is the equity beta estimated using equation (3) for firm i, Bfmj is the estimated full0information beta for industry j, wj is the percent of firm i’s net sales in industry j. The regression is estimated by OLS (equally weighted) and via weighted least squares (market weighted). The latter is used so we can obtain market-capitalization weighted industry full-information betas. The weight is equal to the market capitalization of firm I relative to the market capitalization of all UK stocks. Any firm with an estimated beta greater than 5 or less than -5 is removed from the sample. The full-information regression was estimated separately for each calendar year and as a pooled regression across all four years. The risk-free rate of interest used to estimated the cost of equity capital was the average 30 day T-bill rate over the time period for this study 2001-2004, 4.93%. The long-run historical market risk premium as of December 2004 was 8.44% (Ibbotson, 2005).
2001 2002 2003 2004 Average Panel estimate
Panel A: Equally weighted estimates
Insurance
0.939
(0.109)
0.931
(0.108)
0.769
(0.099)
0.759
(0.10)
0.849 0.856
(0.053)
Banking 0.974
(0.182)
0.952
(0.198)
0.821
(0.193)
0.785
(0.10)
0.883 0.897
(0.095)
Finance 0.722
(0.203)
1.023
(0.229)
1.584
(0.19)
1.160
(0.21)
1.122 1.096
(0.105)
Ave all non-finance 1.108 1.082 1.099 1.057 1.087 1.091
F-Test: BfmIns = BfmBk 0.050 0.070 0.030 0.010 0.200
F-Test: BmIns =BfmFin 0.750 0.230 13.80**
2.700 4.40**
F:Test: BmIns = BfmNF 0.010 0.310 0.580 0.010 0.000
Panel B: Market Value Weighted Estimates
Insurance
0.847
(0.054)
0.858
(0.050)
0.764
(0.067)
0.964
(0.08)
0.858 0.843
(0.031)
Banking 1.114
(0.097)
0.971
(0.088)
0.880
(0.104)
1.057
(0.13)
1.006 1.012
(0.059)
Finance 1.007
(0.103)
1.434
(0.112)
1.324
(0.113)
1.150
(0.14)
1.229 1.208
(0.053)
Av. Non-F 1.026 0.983 0.968 0.987 0.991 0.986
F-Test: BfmIns = BfmBk 5.97* 2.78* 0.940 0.260 9.23***
F-Test: BfmIns = BfmFin 2.490 24.79***
18.30**
1.150 32.88**
F-Test: BfmIns = BfmAvNF 10.09**
8.86*** 8.16***
0.020 22.22***
Panel C: Industry Cost of Equity Capital Equally Weighted
Insurance
12.9% 12.8% 11.4% 11.3%
12.1% 12.2%
Banking 13.2% 13.0% 11.9% 11.6%
12.4% 12.5%
Finance 12.7% 11.9% 12.3% 11.5%
12.1% 12.1%
Av Non-Fin 14.3% 14.1% 14.2% 13.9%
14.1% 14.1%
Panel D: Industry Cost of Equity Capital Market
12.1% 12.2% 11.4% 13.1%
12.2% 12.0%
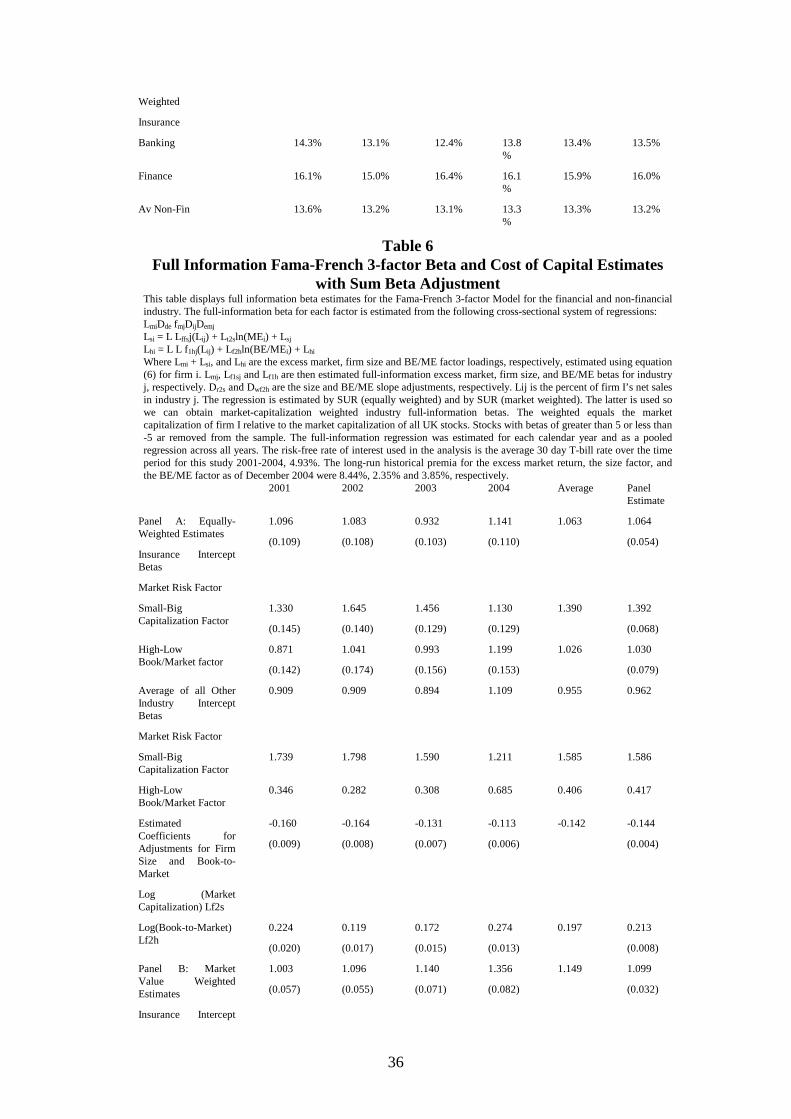
36
Weighted
Insurance
Banking 14.3% 13.1% 12.4% 13.8%
13.4% 13.5%
Finance 16.1% 15.0% 16.4% 16.1%
15.9% 16.0%
Av Non-Fin 13.6% 13.2% 13.1% 13.3%
13.3% 13.2%
Table 6 Full Information Fama-French 3-factor Beta and Cost of Capital Estimates
with Sum Beta Adjustment This table displays full information beta estimates for the Fama-French 3-factor Model for the financial and non-financial industry. The full-information beta for each factor is estimated from the following cross-sectional system of regressions: LmiDde fmjDijDemj Lsi = L Lffsj(L ij) + Lt2sln(MEi) + Lsj Lhi = L L f1hj(Lij) + Lf2hln(BE/MEi) + Lhi Where Lmi + Lsi, and Lhi are the excess market, firm size and BE/ME factor loadings, respectively, estimated using equation (6) for firm i. Lmj, Lf1sj and Lf1h are then estimated full-information excess market, firm size, and BE/ME betas for industry j, respectively. Dr2s and Dwf2h are the size and BE/ME slope adjustments, respectively. Lij is the percent of firm I’s net sales in industry j. The regression is estimated by SUR (equally weighted) and by SUR (market weighted). The latter is used so we can obtain market-capitalization weighted industry full-information betas. The weighted equals the market capitalization of firm I relative to the market capitalization of all UK stocks. Stocks with betas of greater than 5 or less than -5 ar removed from the sample. The full-information regression was estimated for each calendar year and as a pooled regression across all years. The risk-free rate of interest used in the analysis is the average 30 day T-bill rate over the time period for this study 2001-2004, 4.93%. The long-run historical premia for the excess market return, the size factor, and the BE/ME factor as of December 2004 were 8.44%, 2.35% and 3.85%, respectively.
2001 2002 2003 2004 Average Panel Estimate
Panel A: Equally-Weighted Estimates
Insurance Intercept Betas
Market Risk Factor
1.096
(0.109)
1.083
(0.108)
0.932
(0.103)
1.141
(0.110)
1.063 1.064
(0.054)
Small-Big Capitalization Factor
1.330
(0.145)
1.645
(0.140)
1.456
(0.129)
1.130
(0.129)
1.390 1.392
(0.068)
High-Low Book/Market factor
0.871
(0.142)
1.041
(0.174)
0.993
(0.156)
1.199
(0.153)
1.026 1.030
(0.079)
Average of all Other Industry Intercept Betas
Market Risk Factor
0.909 0.909 0.894 1.109 0.955 0.962
Small-Big Capitalization Factor
1.739 1.798 1.590 1.211 1.585 1.586
High-Low Book/Market Factor
0.346 0.282 0.308 0.685 0.406 0.417
Estimated Coefficients for Adjustments for Firm Size and Book-to-Market
Log (Market Capitalization) Lf2s
-0.160
(0.009)
-0.164
(0.008)
-0.131
(0.007)
-0.113
(0.006)
-0.142 -0.144
(0.004)
Log(Book-to-Market) Lf2h
0.224
(0.020)
0.119
(0.017)
0.172
(0.015)
0.274
(0.013)
0.197 0.213
(0.008)
Panel B: Market Value Weighted Estimates
Insurance Intercept
1.003
(0.057)
1.096
(0.055)
1.140
(0.071)
1.356
(0.082)
1.149 1.099
(0.032)
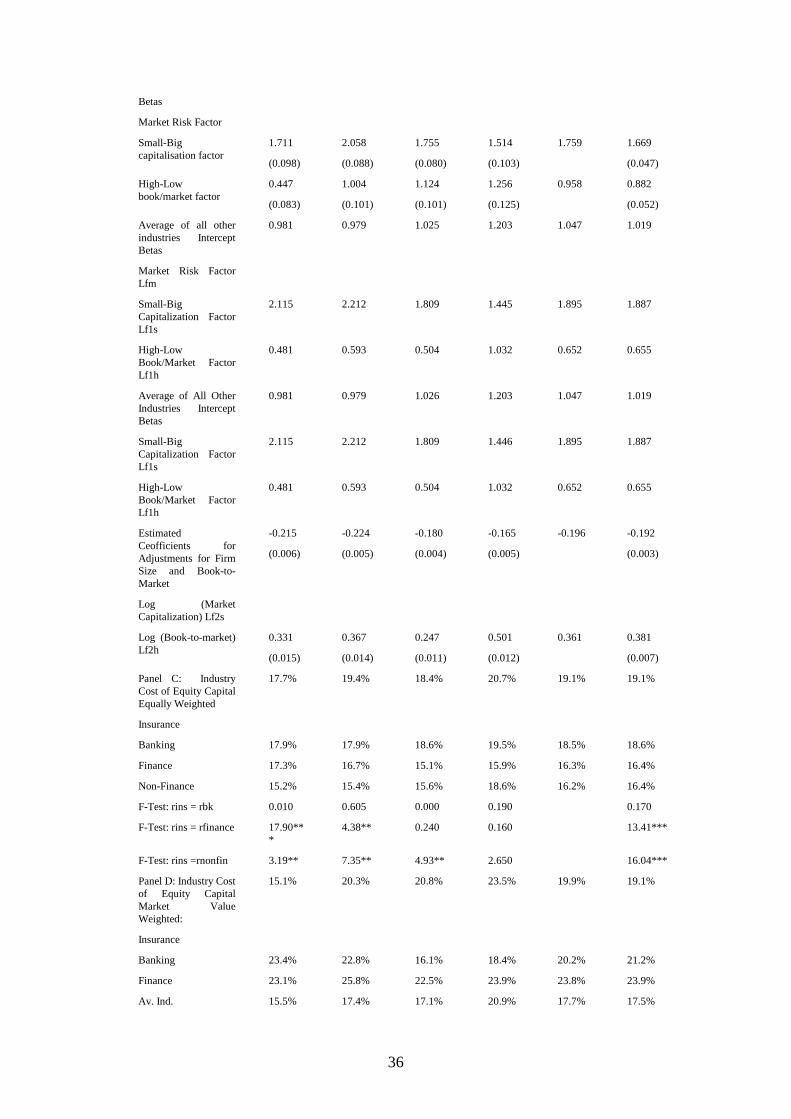
36
Betas
Market Risk Factor
Small-Big capitalisation factor
1.711
(0.098)
2.058
(0.088)
1.755
(0.080)
1.514
(0.103)
1.759 1.669
(0.047)
High-Low book/market factor
0.447
(0.083)
1.004
(0.101)
1.124
(0.101)
1.256
(0.125)
0.958 0.882
(0.052)
Average of all other industries Intercept Betas
Market Risk Factor Lfm
0.981 0.979 1.025 1.203 1.047 1.019
Small-Big Capitalization Factor Lf1s
2.115 2.212 1.809 1.445 1.895 1.887
High-Low Book/Market Factor Lf1h
0.481 0.593 0.504 1.032 0.652 0.655
Average of All Other Industries Intercept Betas
0.981 0.979 1.026 1.203 1.047 1.019
Small-Big Capitalization Factor Lf1s
2.115 2.212 1.809 1.446 1.895 1.887
High-Low Book/Market Factor Lf1h
0.481 0.593 0.504 1.032 0.652 0.655
Estimated Ceofficients for Adjustments for Firm Size and Book-to-Market
Log (Market Capitalization) Lf2s
-0.215
(0.006)
-0.224
(0.005)
-0.180
(0.004)
-0.165
(0.005)
-0.196 -0.192
(0.003)
Log (Book-to-market) Lf2h
0.331
(0.015)
0.367
(0.014)
0.247
(0.011)
0.501
(0.012)
0.361 0.381
(0.007)
Panel C: Industry Cost of Equity Capital Equally Weighted
Insurance
17.7% 19.4% 18.4% 20.7% 19.1% 19.1%
Banking 17.9% 17.9% 18.6% 19.5% 18.5% 18.6%
Finance 17.3% 16.7% 15.1% 15.9% 16.3% 16.4%
Non-Finance 15.2% 15.4% 15.6% 18.6% 16.2% 16.4%
F-Test: rins = rbk 0.010 0.605 0.000 0.190 0.170
F-Test: rins = rfinance 17.90***
4.38** 0.240 0.160 13.41***
F-Test: rins =rnonfin 3.19** 7.35** 4.93** 2.650 16.04***
Panel D: Industry Cost of Equity Capital Market Value Weighted:
Insurance
15.1% 20.3% 20.8% 23.5% 19.9% 19.1%
Banking 23.4% 22.8% 16.1% 18.4% 20.2% 21.2%
Finance 23.1% 25.8% 22.5% 23.9% 23.8% 23.9%
Av. Ind. 15.5% 17.4% 17.1% 20.9% 17.7% 17.5%

36
F-Test: rins = rbank 28.03***
1.610 7.52*** 5.95%%
5.40**
F-Test: rins = rfinance 85.80***
32.17***
3.66* 0.200 103.40***
F-Test rins = rave. All-Ind
0.020 10.89** 16.52***
5.26** 12.04**
***,**,* significant at the 1,5 or 10 percent level. Respectively. Standard errors in parentheses.
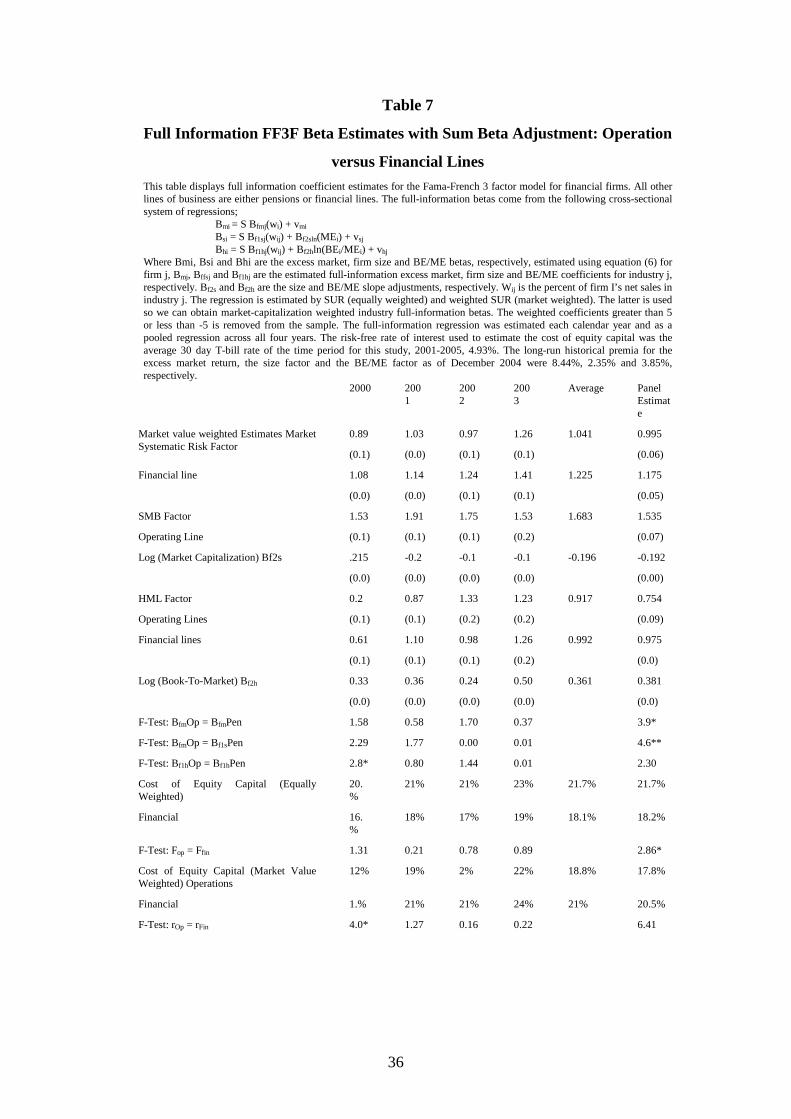
36
Table 7
Full Information FF3F Beta Estimates with Sum Beta Adjustment: Operation
versus Financial Lines This table displays full information coefficient estimates for the Fama-French 3 factor model for financial firms. All other lines of business are either pensions or financial lines. The full-information betas come from the following cross-sectional system of regressions; Bmi = S Bfmj(wi) + vmi Bsi = S Bf1sj(wij) + Bf2sln(MEi) + vsj Bhi = S Bf1hj(wij) + Bf2hln(BEi/MEi) + vhj Where Bmi, Bsi and Bhi are the excess market, firm size and BE/ME betas, respectively, estimated using equation (6) for firm j, Bmj, Bffsj and Bf1hj are the estimated full-information excess market, firm size and BE/ME coefficients for industry j, respectively. Bf2s and Bf2h are the size and BE/ME slope adjustments, respectively. Wij is the percent of firm I’s net sales in industry j. The regression is estimated by SUR (equally weighted) and weighted SUR (market weighted). The latter is used so we can obtain market-capitalization weighted industry full-information betas. The weighted coefficients greater than 5 or less than -5 is removed from the sample. The full-information regression was estimated each calendar year and as a pooled regression across all four years. The risk-free rate of interest used to estimate the cost of equity capital was the average 30 day T-bill rate of the time period for this study, 2001-2005, 4.93%. The long-run historical premia for the excess market return, the size factor and the BE/ME factor as of December 2004 were 8.44%, 2.35% and 3.85%, respectively.
2000 2001
2002
2003
Average Panel Estimate
Market value weighted Estimates Market Systematic Risk Factor
0.89
(0.1)
1.03
(0.0)
0.97
(0.1)
1.26
(0.1)
1.041 0.995
(0.06)
Financial line 1.08
(0.0)
1.14
(0.0)
1.24
(0.1)
1.41
(0.1)
1.225 1.175
(0.05)
SMB Factor
Operating Line
1.53
(0.1)
1.91
(0.1)
1.75
(0.1)
1.53
(0.2)
1.683 1.535
(0.07)
Log (Market Capitalization) Bf2s .215
(0.0)
-0.2
(0.0)
-0.1
(0.0)
-0.1
(0.0)
-0.196 -0.192
(0.00)
HML Factor
Operating Lines
0.2
(0.1)
0.87
(0.1)
1.33
(0.2)
1.23
(0.2)
0.917 0.754
(0.09)
Financial lines 0.61
(0.1)
1.10
(0.1)
0.98
(0.1)
1.26
(0.2)
0.992 0.975
(0.0)
Log (Book-To-Market) Bf2h 0.33
(0.0)
0.36
(0.0)
0.24
(0.0)
0.50
(0.0)
0.361 0.381
(0.0)
F-Test: BfmOp = BfmPen 1.58 0.58 1.70 0.37 3.9*
F-Test: BfmOp = Bf1sPen 2.29 1.77 0.00 0.01 4.6**
F-Test: Bf1hOp = Bf1hPen 2.8* 0.80 1.44 0.01 2.30
Cost of Equity Capital (Equally Weighted)
20.%
21% 21% 23% 21.7% 21.7%
Financial 16.%
18% 17% 19% 18.1% 18.2%
F-Test: Fop = Ffin 1.31 0.21 0.78 0.89 2.86*
Cost of Equity Capital (Market Value Weighted) Operations
12% 19% 2% 22% 18.8% 17.8%
Financial 1.% 21% 21% 24% 21% 20.5%
F-Test: rOp = rFin 4.0* 1.27 0.16 0.22 6.41
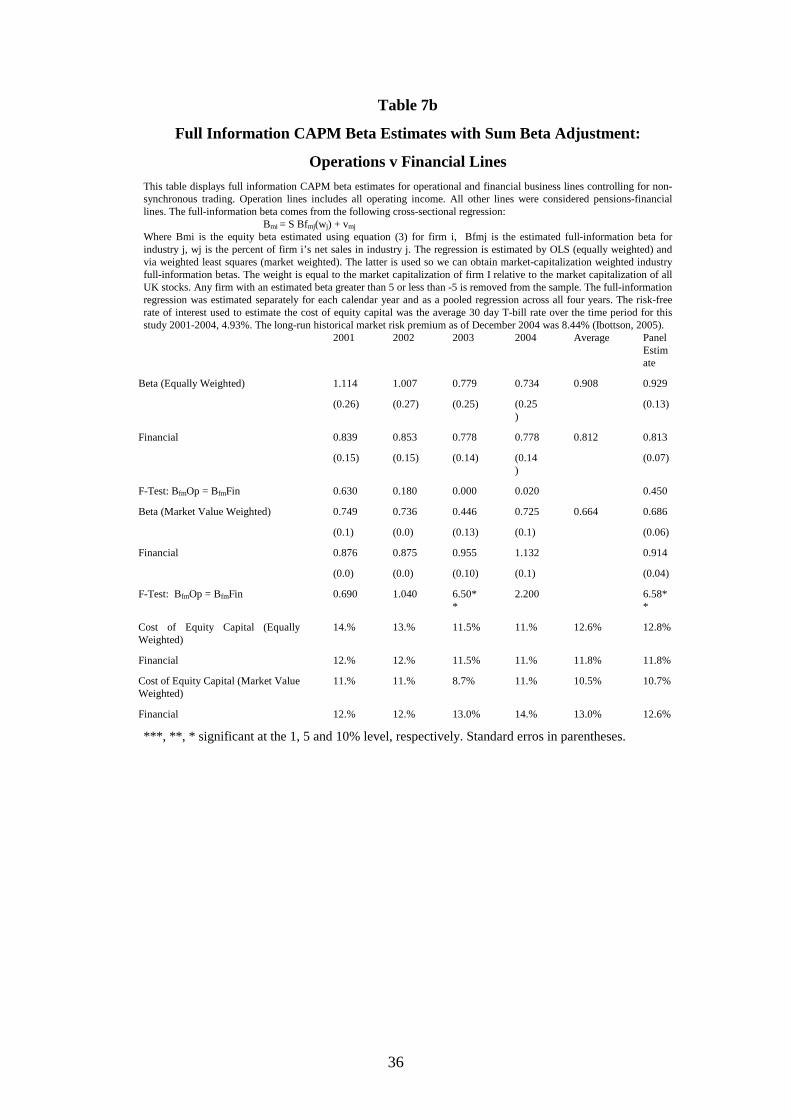
36
Table 7b
Full Information CAPM Beta Estimates with Sum Beta Adjustment:
Operations v Financial Lines This table displays full information CAPM beta estimates for operational and financial business lines controlling for non-synchronous trading. Operation lines includes all operating income. All other lines were considered pensions-financial lines. The full-information beta comes from the following cross-sectional regression: Bmi = S Bfmj(wj) + vmj Where Bmi is the equity beta estimated using equation (3) for firm i, Bfmj is the estimated full-information beta for industry j, wj is the percent of firm i’s net sales in industry j. The regression is estimated by OLS (equally weighted) and via weighted least squares (market weighted). The latter is used so we can obtain market-capitalization weighted industry full-information betas. The weight is equal to the market capitalization of firm I relative to the market capitalization of all UK stocks. Any firm with an estimated beta greater than 5 or less than -5 is removed from the sample. The full-information regression was estimated separately for each calendar year and as a pooled regression across all four years. The risk-free rate of interest used to estimate the cost of equity capital was the average 30 day T-bill rate over the time period for this study 2001-2004, 4.93%. The long-run historical market risk premium as of December 2004 was 8.44% (Ibottson, 2005).
2001 2002 2003 2004 Average Panel Estimate
Beta (Equally Weighted) 1.114
(0.26)
1.007
(0.27)
0.779
(0.25)
0.734
(0.25)
0.908 0.929
(0.13)
Financial 0.839
(0.15)
0.853
(0.15)
0.778
(0.14)
0.778
(0.14)
0.812 0.813
(0.07)
F-Test: BfmOp = BfmFin 0.630 0.180 0.000 0.020 0.450
Beta (Market Value Weighted) 0.749
(0.1)
0.736
(0.0)
0.446
(0.13)
0.725
(0.1)
0.664 0.686
(0.06)
Financial 0.876
(0.0)
0.875
(0.0)
0.955
(0.10)
1.132
(0.1)
0.914
(0.04)
F-Test: BfmOp = BfmFin 0.690 1.040 6.50**
2.200 6.58**
Cost of Equity Capital (Equally Weighted)
14.% 13.% 11.5% 11.% 12.6% 12.8%
Financial 12.% 12.% 11.5% 11.% 11.8% 11.8%
Cost of Equity Capital (Market Value Weighted)
11.% 11.% 8.7% 11.% 10.5% 10.7%
Financial 12.% 12.% 13.0% 14.% 13.0% 12.6%
***, **, * significant at the 1, 5 and 10% level, respectively. Standard erros in parentheses.
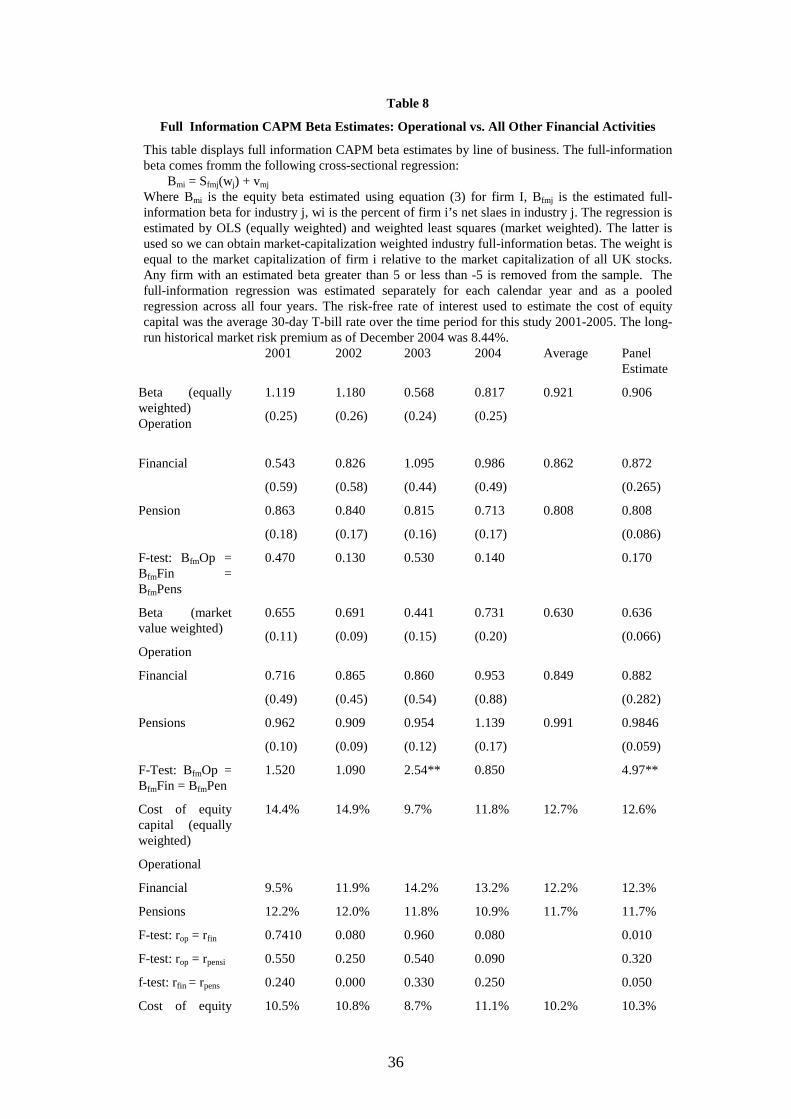
36
Table 8
Full Information CAPM Beta Estimates: Operational vs. All Other Financial Activities
This table displays full information CAPM beta estimates by line of business. The full-information beta comes fromm the following cross-sectional regression: Bmi = Sfmj(wj) + vmj Where Bmi is the equity beta estimated using equation (3) for firm I, Bfmj is the estimated full-information beta for industry j, wi is the percent of firm i’s net slaes in industry j. The regression is estimated by OLS (equally weighted) and weighted least squares (market weighted). The latter is used so we can obtain market-capitalization weighted industry full-information betas. The weight is equal to the market capitalization of firm i relative to the market capitalization of all UK stocks. Any firm with an estimated beta greater than 5 or less than -5 is removed from the sample. The full-information regression was estimated separately for each calendar year and as a pooled regression across all four years. The risk-free rate of interest used to estimate the cost of equity capital was the average 30-day T-bill rate over the time period for this study 2001-2005. The long-run historical market risk premium as of December 2004 was 8.44%.
2001 2002 2003 2004 Average Panel Estimate
Beta (equally weighted) Operation
1.119
(0.25)
1.180
(0.26)
0.568
(0.24)
0.817
(0.25)
0.921 0.906
Financial 0.543
(0.59)
0.826
(0.58)
1.095
(0.44)
0.986
(0.49)
0.862 0.872
(0.265)
Pension 0.863
(0.18)
0.840
(0.17)
0.815
(0.16)
0.713
(0.17)
0.808 0.808
(0.086)
F-test: BfmOp = BfmFin = BfmPens
0.470 0.130 0.530 0.140 0.170
Beta (market value weighted)
Operation
0.655
(0.11)
0.691
(0.09)
0.441
(0.15)
0.731
(0.20)
0.630 0.636
(0.066)
Financial 0.716
(0.49)
0.865
(0.45)
0.860
(0.54)
0.953
(0.88)
0.849 0.882
(0.282)
Pensions 0.962
(0.10)
0.909
(0.09)
0.954
(0.12)
1.139
(0.17)
0.991 0.9846
(0.059)
F-Test: BfmOp = BfmFin = BfmPen
1.520 1.090 2.54** 0.850 4.97**
Cost of equity capital (equally weighted)
Operational
14.4% 14.9% 9.7% 11.8% 12.7% 12.6%
Financial 9.5% 11.9% 14.2% 13.2% 12.2% 12.3%
Pensions 12.2% 12.0% 11.8% 10.9% 11.7% 11.7%
F-test: rop = rfin 0.7410 0.080 0.960 0.080 0.010
F-test: rop = rpensi 0.550 0.250 0.540 0.090 0.320
f-test: rfin = rpens 0.240 0.000 0.330 0.250 0.050
Cost of equity 10.5% 10.8% 8.7% 11.1% 10.2% 10.3%
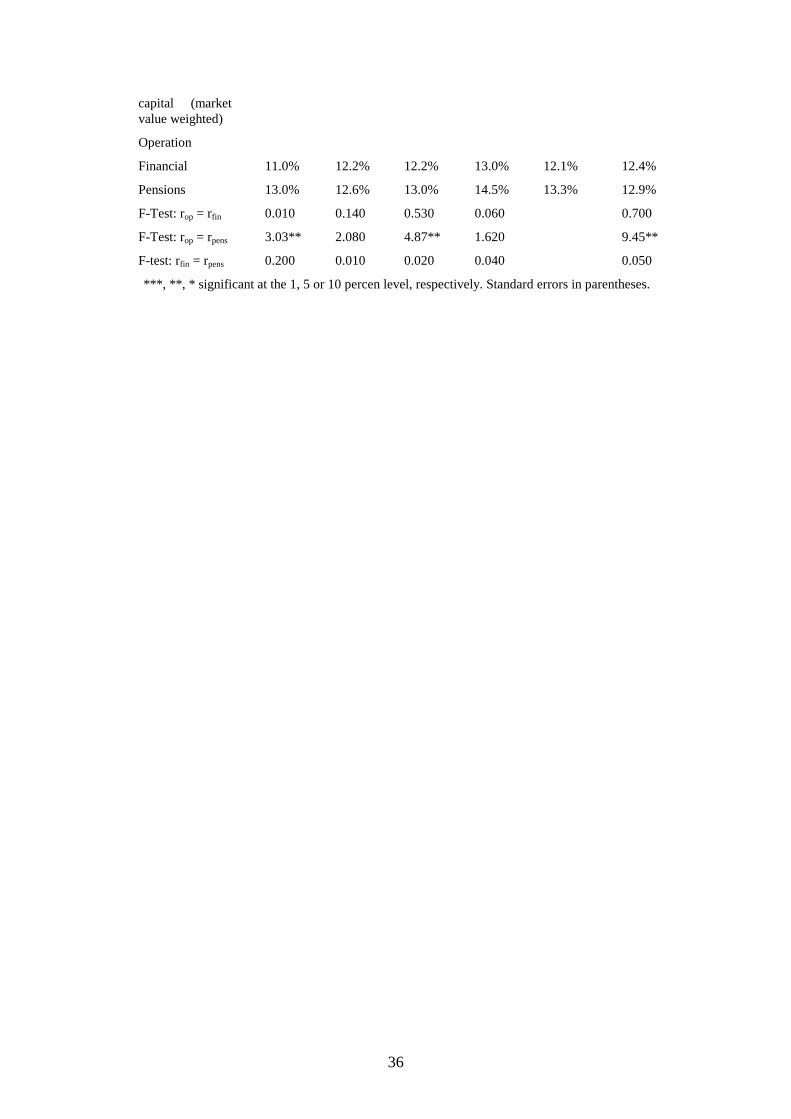
36
capital (market value weighted)
Operation
Financial 11.0% 12.2% 12.2% 13.0% 12.1% 12.4%
Pensions 13.0% 12.6% 13.0% 14.5% 13.3% 12.9%
F-Test: rop = rfin 0.010 0.140 0.530 0.060 0.700
F-Test: rop = rpens 3.03** 2.080 4.87** 1.620 9.45**
F-test: rfin = rpens 0.200 0.010 0.020 0.040 0.050
***, **, * significant at the 1, 5 or 10 percen level, respectively. Standard errors in parentheses.
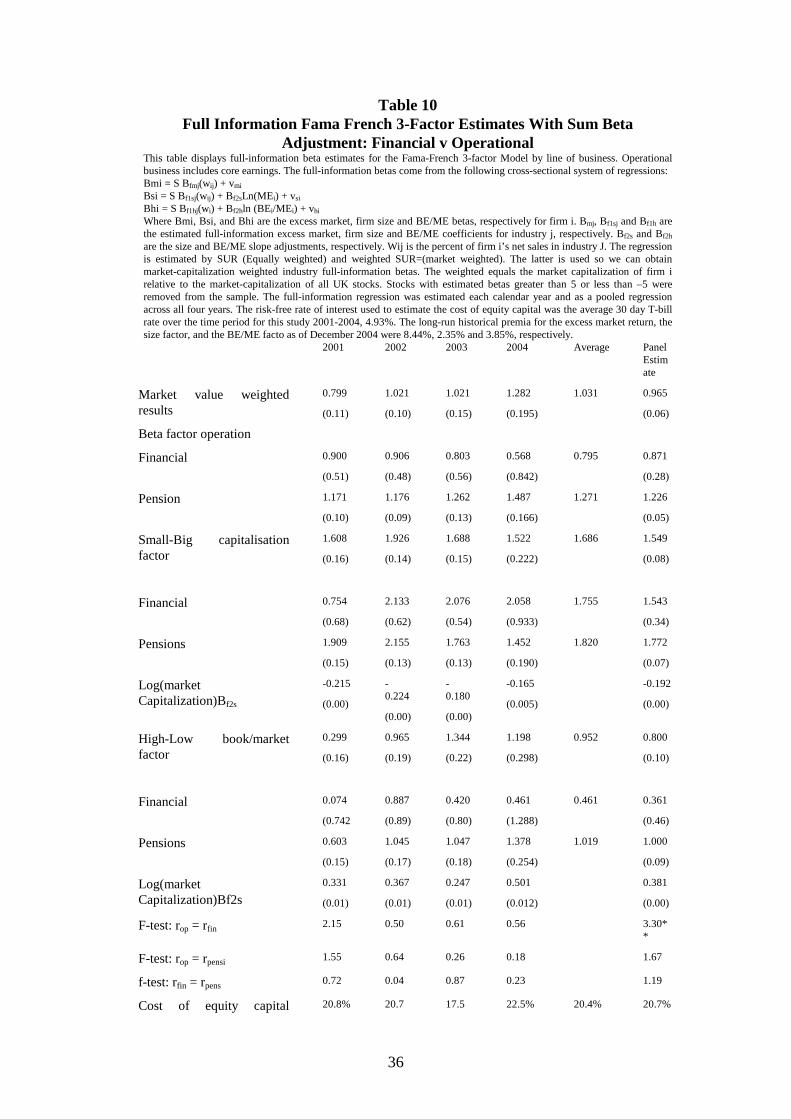
36
Table 10 Full Information Fama French 3-Factor Estimates With Sum Beta
Adjustment: Financial v Operational This table displays full-information beta estimates for the Fama-French 3-factor Model by line of business. Operational business includes core earnings. The full-information betas come from the following cross-sectional system of regressions: Bmi = S Bfmj(wij) + vmi Bsi = S Bf1sj(wij) + Bf2sLn(MEi) + vsi Bhi = S Bf1hj(wi) + Bf2hln (BEi/MEi) + vhi Where Bmi, Bsi, and Bhi are the excess market, firm size and BE/ME betas, respectively for firm i. Bmj, Bf1sj and Bf1h are the estimated full-information excess market, firm size and BE/ME coefficients for industry j, respectively. Bf2s and Bf2h are the size and BE/ME slope adjustments, respectively. Wij is the percent of firm i’s net sales in industry J. The regression is estimated by SUR (Equally weighted) and weighted SUR=(market weighted). The latter is used so we can obtain market-capitalization weighted industry full-information betas. The weighted equals the market capitalization of firm i relative to the market-capitalization of all UK stocks. Stocks with estimated betas greater than 5 or less than –5 were removed from the sample. The full-information regression was estimated each calendar year and as a pooled regression across all four years. The risk-free rate of interest used to estimate the cost of equity capital was the average 30 day T-bill rate over the time period for this study 2001-2004, 4.93%. The long-run historical premia for the excess market return, the size factor, and the BE/ME facto as of December 2004 were 8.44%, 2.35% and 3.85%, respectively.
2001 2002 2003 2004 Average Panel Estimate
Market value weighted results
Beta factor operation
0.799
(0.11)
1.021
(0.10)
1.021
(0.15)
1.282
(0.195)
1.031 0.965
(0.06)
Financial 0.900
(0.51)
0.906
(0.48)
0.803
(0.56)
0.568
(0.842)
0.795 0.871
(0.28)
Pension 1.171
(0.10)
1.176
(0.09)
1.262
(0.13)
1.487
(0.166)
1.271 1.226
(0.05)
Small-Big capitalisation factor
1.608
(0.16)
1.926
(0.14)
1.688
(0.15)
1.522
(0.222)
1.686 1.549
(0.08)
Financial 0.754
(0.68)
2.133
(0.62)
2.076
(0.54)
2.058
(0.933)
1.755 1.543
(0.34)
Pensions 1.909
(0.15)
2.155
(0.13)
1.763
(0.13)
1.452
(0.190)
1.820 1.772
(0.07)
Log(market Capitalization)Bf2s
-0.215
(0.00)
-0.224
(0.00)
-0.180
(0.00)
-0.165
(0.005)
-0.192
(0.00)
High-Low book/market factor
0.299
(0.16)
0.965
(0.19)
1.344
(0.22)
1.198
(0.298)
0.952 0.800
(0.10)
Financial 0.074
(0.742
0.887
(0.89)
0.420
(0.80)
0.461
(1.288)
0.461 0.361
(0.46)
Pensions 0.603
(0.15)
1.045
(0.17)
1.047
(0.18)
1.378
(0.254)
1.019 1.000
(0.09)
Log(market Capitalization)Bf2s
0.331
(0.01)
0.367
(0.01)
0.247
(0.01)
0.501
(0.012)
0.381
(0.00)
F-test: rop = rfin 2.15 0.50 0.61 0.56 3.30**
F-test: rop = rpensi 1.55 0.64 0.26 0.18 1.67
f-test: rfin = rpens 0.72 0.04 0.87 0.23 1.19
Cost of equity capital 20.8% 20.7 17.5 22.5% 20.4% 20.7%
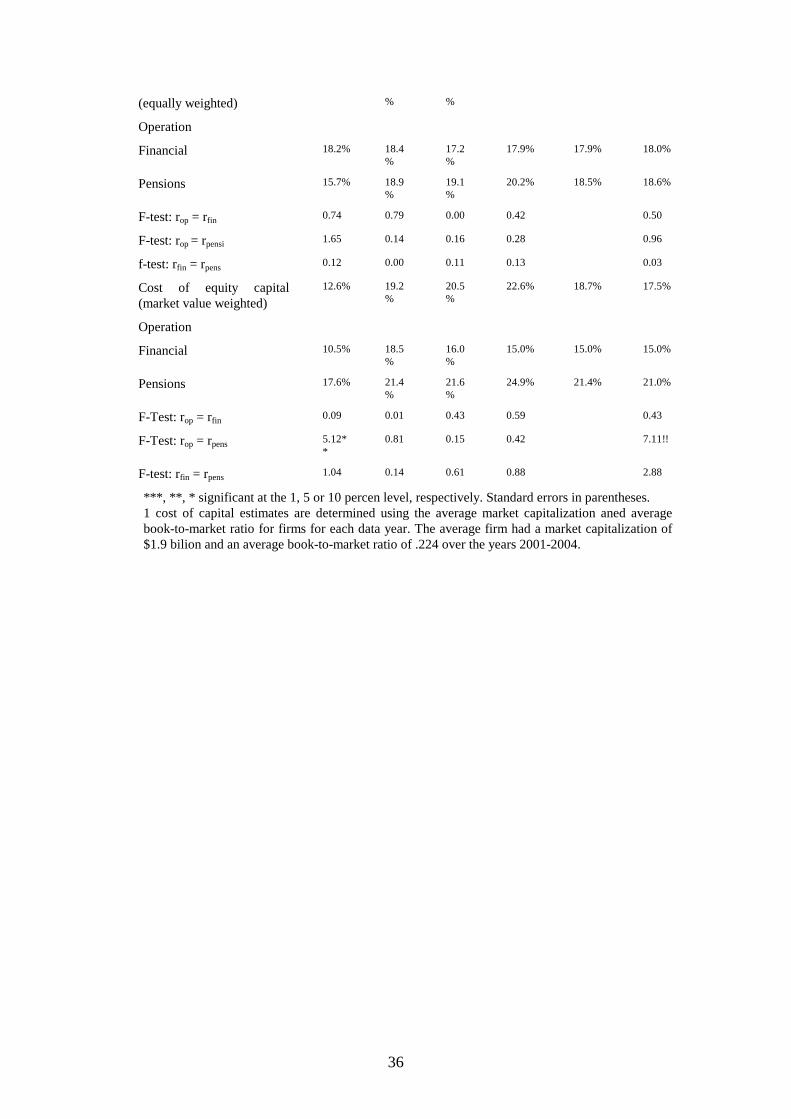
36
(equally weighted)
Operation
% %
Financial 18.2% 18.4%
17.2%
17.9% 17.9% 18.0%
Pensions 15.7% 18.9%
19.1%
20.2% 18.5% 18.6%
F-test: rop = rfin 0.74 0.79 0.00 0.42 0.50
F-test: rop = rpensi 1.65 0.14 0.16 0.28 0.96
f-test: rfin = rpens 0.12 0.00 0.11 0.13 0.03
Cost of equity capital (market value weighted)
Operation
12.6% 19.2%
20.5%
22.6% 18.7% 17.5%
Financial 10.5% 18.5%
16.0%
15.0% 15.0% 15.0%
Pensions 17.6% 21.4%
21.6%
24.9% 21.4% 21.0%
F-Test: rop = rfin 0.09 0.01 0.43 0.59 0.43
F-Test: rop = rpens 5.12**
0.81 0.15 0.42 7.11!!
F-test: rfin = rpens 1.04 0.14 0.61 0.88 2.88
***, **, * significant at the 1, 5 or 10 percen level, respectively. Standard errors in parentheses. 1 cost of capital estimates are determined using the average market capitalization aned average book-to-market ratio for firms for each data year. The average firm had a market capitalization of $1.9 bilion and an average book-to-market ratio of .224 over the years 2001-2004.