Embed Size (px)
Citation preview

Some Combustion Characteristics of Biomass and Coal Cofiringunder Oxy-Fuel Conditions in a Pilot-Scale Circulating FluidizedCombustorYewen Tan,* Lufei Jia, and Yinghai Wu
Natural Resources Canada, CanmetENERGY Technology Centre, 1 Haanel Drive, Ottawa, Ontario, Canada K1A 1M1
ABSTRACT: A series of tests were conducted using CanmetENERGY’s pilot-scale, oxy-fuel firing capable circulating fluidizedbed (CFB) combustor. These tests were done with a variety of coals, ranging from lignite to bituminous, that were cofired withbiomass, specifically wood pellets. The amount of cofired wood pellets varied from 20 to 50% by weight. The objectives of thesetests were to measure the combustion characteristics of oxy-fuel cofiring with coal and biomass, including flue gas composition,emissions of volatile organic compounds, and emissions of trace metals. Test results showed that stable combustion conditionscould be obtained with a CO2 concentration in the flue gas of >90% and that the addition of wood pellets did not appreciablyaffect combustion conditions. These results provided support for the claim that cofiring solid fossil fuels such as coal and cokewith carbon-neutral biomass under oxy-fuel conditions with CO2 capture is a sound approach for achieving negative CO2emissions.
1. INTRODUCTION
Oxy-fuel combustion technology is widely considered as a viableoption for the control of CO2 emissions from fossil fuels,especially coals. While most of the research activities have beenfocused on applying oxy-fuel technology to pulverized coal(PC) combustion, it has recently been recognized thatcirculating fluidized bed combustion (CFBC) is an alternatetechnology that could be easily adapted for oxy-fuelcombustion.1,2 In fact, CFBC has some advantages comparedto PC for oxy-fuel combustion that may make it a better choicefor CO2 capture in some cases. For example, the large heatcapacity of return leg solids and the degree of cooling of thereturn solids from the hot cyclone can result in a great deal ofbed temperature control, allowing fluidization with oxygenconcentrations higher than those that can be used safely in PCoxy-fuel combustion. This high allowable oxygen concentrationcould allow oxy-fuel CFBC units to operate with recycle fluegas ratios lower than those of PC oxy-fuel combustors, whichleads to noticeable lower operating costs. To conduct researchon oxy-CFBC technology, CanmetENERGY has convertedand operated a pilot-scale 0.8 MWth oxy-fuel CFB for severalyears, and some of the work conducted with this unit con-tributed to Foster Wheeler’s Ciuden, Spain oxy-CFB demon-stration unit.3−5
Compared to PC combustion, CFBCs also have the sig-nificant benefit of being able to combust a wide variety of fuels.They are able to efficiently and easily combust biomass andwaste materials such as wood and municipal solid waste. Becauseof their CO2 neutral characteristics, combustion and cocombus-tion with biomass have received a considerable amount ofinterest. In some cases, cocombustion of coal with biomass hasbeen shown to be economically viable.6,7 For PC coalcombustion, there is usually a limit to the amount and typeof biomass that can be burned along with coal, while CFBCshave much greater flexibility, both in terms of the amount ofbiomass that be combusted and in terms of the type of biomass
that can be used. When burning these materials and seques-tering the CO2 that is produced, oxy-fuel CFB combustors caneffectively remove CO2 from the atmosphere. Because of thefavorable emission profiles of certain biomass materials, CFBCscan also cofire coal and biomass to achieve improved com-bustion performance as well as economics. As a result of theseadvantages, there have been a few studies that have investigatedthis approach.8,9
It is under this background that a series of combustion testswere performed using CanmetENERGY’s 0.8 MWth oxy-fuelcirculating fluidized bed combustor. Although emissions ofmetals during biomass combustion have been investigatedpreviously,10 to the best of our knowledge, the work presentedhere is the first that investigated in detail the emissions of majorpollutants, volatile organic compounds (VOCs), and metalsusing a pilot-scale oxy-fuel CFB combustor. The test fuels con-sisted of a variety of coals (lignite, sub-bituminous, andbituminous) and biomass in the form of wood pellets. Theamount of wood pellets in the fuel mixtures varied from 20 to50% by weight.
2. TEST FACILITY AND PROCEDUREA 0.8 MWth pilot CFBC was used in this work.5 The CFBC has beendesigned to allow fluidization with either air or O2 mixed with recycledflue gas. It contains a 0.406 m inside diameter refractory lined riser andrefractory lined cyclone and return leg. The CFBC is equipped with anatural gas burner for preheating. Independent feed augers can supplymultiple fuel types and a sorbent. Oxygen, CO2, and recycle flue gasflow rates are controlled by mass flow controllers. The recycle flue gassystem includes a flue gas cooler, a bag filter, a condenser, a con-densate knockout, and a recycle gas blower. Gas analysis includes O2,CO, CO2, SO2, and NOx. Four water-cooled tubes can be inserted intothe riser for temperature control. The CFBC also has the ability to
Received: June 13, 2013Revised: October 23, 2013Published: October 25, 2013
Article
pubs.acs.org/EF
Published 2013 by the American ChemicalSociety 7000 dx.doi.org/10.1021/ef4011109 | Energy Fuels 2013, 27, 7000−7007

allow extensive in situ flue gas samplings such as trace metals andVOCs. The entire system was modified to minimize air ingress. Thisincluded sealing the bag filter, replacing all purging gas with recycledflue gas, and the ability to operate the CFBC at slightly positive pres-sure, although positive pressure was kept to a minimum during normaloperations to prevent flue gas egress. The schematic of the oxy-CFBCunit is shown in Figure 1.Coals used in the tests included Boundary Dam lignite coal from
Saskatchewan, Canada, Genesee sub-bituminous coal from Alberta,Canada, and bituminous coal from Spain. Coals were crushed to a sizeof <6 mm. Wood pellets were purchased from Valfei Products. Theproximate and ultimate analyses for the coals and wood pellets arepresented in Table 1.The fuel ash and limestone analyses are presented in Table 2.The coal size distribution is presented in Table 3.Coal and wood pellets were mixed together and then fed to a fuel
hopper. The fuel feed rate ranged from 60 to 80 kg/h. The target bedtemperature was ∼900 °C. Limestone was used for sulfur removal witha constant Ca/S molar ratio of 3. The analysis of the limestone isshown in Table 2.A typical test started with the CFBC being preheated with natural
gas with sand as the bed material. When the lower bed temperatureincreased to ∼800 °C, natural gas was gradually replaced with the testsolid fuel. When the stable air-fired combustion condition had beenestablished, operation was transitioned to oxy-fuel mode. This transi-tion was accomplished by means of control valves that gradually
replaced air with O2 and recycled flue gas and generally took <20 min.While the transition process was usually smooth, it was observed thatflue gas concentrations of O2 and, especially, CO could fluctuate for aperiod before stabilizing. With increasing CO2 concentrations,combustor and cyclone temperatures could also decrease before theygradually recovered.
Figure 1. Schematics of CanmetENERGY’s 0.8 MWth pilot-scale oxy-fuel CFB test facility.
Table 1. Fuel Properties (as analyzed, weight percent)
wood pellet Boundary Dam bituminous Genesee
Proximate Analysis, As Receivedmoisture 9.52 25.56 6.7 6.08ash 0.38 9.72 14.18 24.72volatile 76.46 29.05 25.10 26.87fixed carbon 13.64 35.67 54.02 42.33
Ultimate Analysis, Dry Basiscarbon 44.7 46.8 66.34 52.2hydrogen 5.36 3.00 3.64 3.05nitrogen 0.12 0.69 1.59 0.79sulfur <0.05 0.54 0.56 0.30oxygen (difference) 39.91 13.66 7.00 12.85LHV (MJ/kg) 17.49 17.79 25.28 19.98
Table 2. Fuel Ash and Limestone Analyses
BoundaryDam bituminous Genesee limestone
SiO2 (wt %) 40.72 53.03 57.07 1.2Al2O3 (wt %) 18.96 27.68 19.42 <0.38Fe2O3 (wt %) 4.28 5.01 4.59 <0.55TiO2 (wt %) 0.68 1.51 0.72 <0.04P2O5 (wt %) 0.51 0.12 0.06 <0.02CaO (wt %) 12.30 1.26 6.22 54MgO (wt %) 2.72 0.87 1.44 0.6SO3 (wt %) 9.38 1.28 5.06 0.2Na2O (wt %) 6.32 0.32 2.34 <0.17K2O (wt %) 0.97 2.25 1.70 <0.08barium (ppm) 8598 1500 2642strontium (ppm) 3599 1300 977vanadium (ppm) 102 not available 140nickel (ppm) <50 not available 71manganese (ppm) 197 200 324chromium (ppm) 50 not available 101copper (ppm) 84 not available 65zinc (ppm) 75 not available 94loss on fusion (wt %) 1.90 3.26 0.93 43sum 99.99 96.89 100.0 99.4
Table 3. Coal Size Distribution
size (mm) wt %
−0.3 10.00.3 26.50.85 46.52.36 13.94.75−6.00 3.1
Energy & Fuels Article
dx.doi.org/10.1021/ef4011109 | Energy Fuels 2013, 27, 7000−70077001
Stack samplings included SO3, VOCs, and metals and were per-formed just upstream of the ID fan and downstream of the bag filter.
These samplings were performed using the following methods, EPAMethod 003111 for VOCs, EPA Method 2912 for metal emissions, andconditional test method CTM 1313 for SO3 emissions.
3. RESULTS AND DISCUSSION
This paper will focus on the results obtained by coal and woodpellet cofiring. Results for coal firing using the same facility havebeen reported previously.1,5 Table 4 summarizes the key mea-sured parameters for the tests conducted during with the fuelsmentioned above. Note that all gas concentrations are given ona dry basis.For the purpose of comparison, test results with coals only
are presented in Table 5.3.1. Oxygen and CO2 Concentrations. Table 4 shows
that a minimum of 80% of CO2 in the flue gas was achieved.For tests conducted with Genesee and Boundary Dam coal,CO2 concentrations in the flue gas were consistently >90%.Oxygen concentrations in the combustion gas were tightlycontrolled between 24 and 25%. Superficial velocities showthat the combustor was indeed operating in circulating mode.It is worth noting that the coal/wood pellet mixtures had a
Table 4. Cofiring Test Conditions and Some Key Test Parameters
bituminous Genesee Boundary Dam
coal %/wood % 50/50 65/35 80/20 65/35 80/20 65/35fuel feed rate (kg/h) 79.6 ± 4.3 73.4 ± 3.6 63.2 ± 2.8 87.3 ± 0.3 81.3 ± 1.5 88.1 ± 0.3heat input (MJ/h) 1702 1655 1499 1668 1583 1558O2 in combustion gas (%) 24.4 ± 0.4 24.1 ± 0.6 23.9 ± 0.4 24.9 ± 0.3 24.9 ± 0.5 24.1 ± 0.5O2 flow rate (kg/h) 118.2 ± 4.2 116.9 ± 5.6 100.1 ± 4.8 126.9 ± 4.1 117.1 ± 5.0 115.8 ± 5.3O2 in flue gas (%) 2.1 ± 0.8 2.6 ± 1.1 1.5 ± 0.9 2.8 ± 0.4 4.0 ± 0.8 2.2 ± 0.9CO2 in flue gas (%) 85.2 ± 3.1 85.3 ± 4.2 80.0 ± 6.2 92.2 ± 0.5 92.7 ± 0.9 92.6 ± 3.0flue gas recycle ratio (wt %) 68.3 68.8 65.2 72.6 75.7 70.0freeboard temperature (°C) 920 895 893 905 913 874superficial velocity (m/s) 4.9 4.7 4.3 4.7 4.7 4.4Ca/S molar ratio 3 3 3 3 3 3CaCO3 flow rate (kg/h) 1.9 2.4 2.7 1.6 1.8 3.0sulfur capture ratio (%) 70.2 77.8 74.7 76.1 85.7 88.7SO2 emission (ng/J) 78 72 95 49 35 52NO emission (ng/J) 19 17 14 20 18 16
Table 5. Coal Test Conditions and Some Key TestParameters
bituminous GeneseeBoundaryDam
fuel feed rate (kg/h) 64.3 ± 0.9 85.8 ± 5.5 84.3 ± 0.2heat input (MJ/h) 1625 1714 1500O2 in combustion gas (%) 23.9 ± 0.1 22.4 ± 0.2 24.4 ± 0.3O2 flow rate (kg/h) 98.1 ± 1.7 123.1 ± 3.0 120.1 ± 3.3O2 in flue gas (%) 4.0 ± 0.3 2.8 ± 0.4 4.1 ± 0.5CO2 in flue gas (%) 90.5 ± 2.5 86.5 ± 1.5 86.4 ± 1.3flue gas recycle ratio (wt %) 72.9 70.1 69.9freeboard temperature (°C) 857 910 864superficial velocity (m/s) 3.9 4.8 4.8Ca/S molar ratio 3 3 3CaCO3 flow rate (kg/h) 3.5 2.4 4.0sulfur capture ratio (%) 72.0 87.6 85.3SO2 emission (ng/J) 140 37 100NO emission (ng/J) 20 12 33
Figure 2. Concentrations of O2 and CO2 for 35% wood and 65% Genesee coal.
Energy & Fuels Article
dx.doi.org/10.1021/ef4011109 | Energy Fuels 2013, 27, 7000−70077002

tendency to separate in the fuel hopper because of hoppervibrations. This fuel separation may occasionally lead to fluctua-tions in flue gas compositions due to uneven feed rates of coaland wood pellets.Oxygen and CO2 concentrations in the flue gas for a test
conducted with 65% Genesee sub-bituminous coal and 35%wood pellets are shown in Figures 2 and 3. This graph coversthe start of the test when only air was going through thecombustor at ambient temperature to a period of air firing andthen the transition to oxy-fuel firing. These figures show that,once oxy-fuel mode had been established, it was possible tomaintain stable operating conditions for several hours.Figures 4 and 5 shows similar profiles for a test conducted
with 65% Boundary Dam coal with 35% wood pellets.In the Boundary Dam coal/wood test presented above,
because of a plugged sampling line, the oxygen control valve
was put on manual control mode. This eventually led the re-cycle gas flow to suffer a sudden decrease ∼13.3 h into the test.However, once the sampling line was cleaned and the oxygencontrol valve was again set to automatic control, stable opera-tion quickly resumed. These figures are overall typical of othertests, and they show that our CFBC facility could maintainstable operation over a long period of time and could fullyrecover from minor temporary upsets.
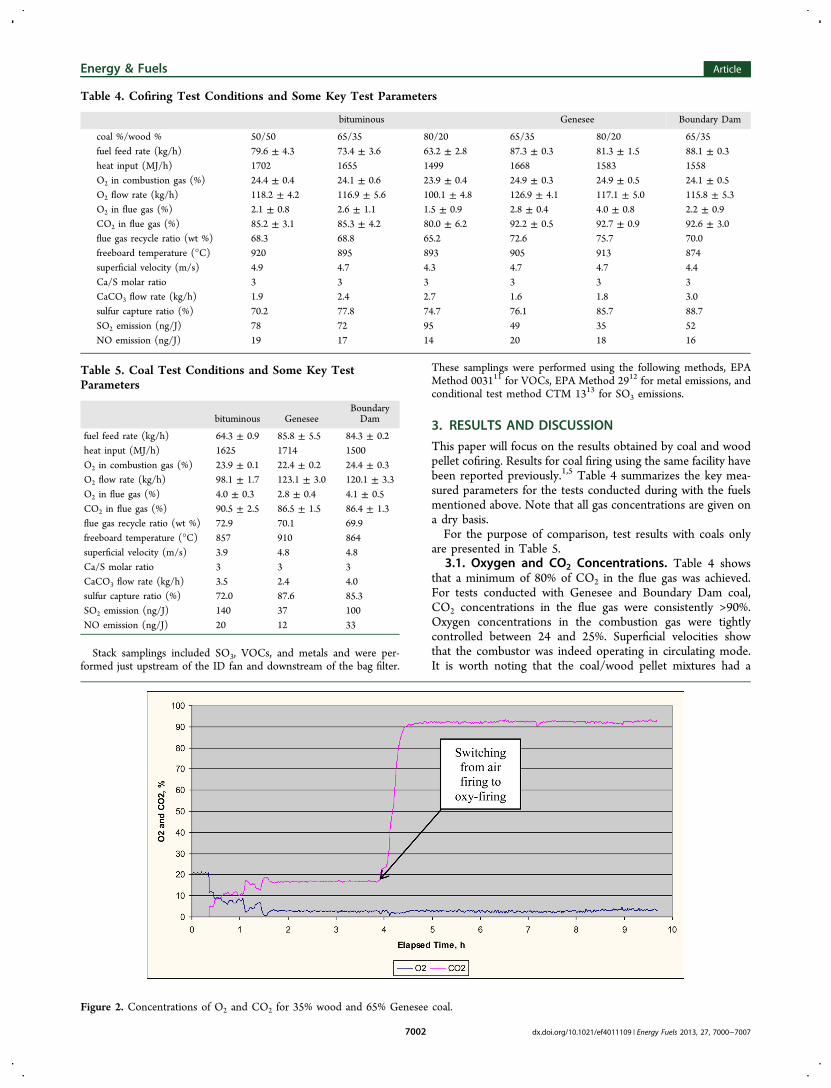
3.2. Emissions of CO, SO2, and NOx. For the Geneseecoal, from Figure 3, we can see that the CO concentration inthe oxy-fuel mode showed some fluctuations when the flue gasO2 concentration was <3%. Once the flue gas O2 concentrationwas >3.5% toward the end of the test, the concentration of COremained consistently below 200 ppm. Figure 3 also shows that,as the combustion mode switched from air firing to oxy firing,there was an increase in CO concentration and the SO2
Figure 3. Concentrations of CO, NO, and SO2 for 35% wood and 65% Genesee coal.
Figure 4. Concentrations of O2 and CO2 for 35% wood and 65% Boundary Dam coal.
Energy & Fuels Article
dx.doi.org/10.1021/ef4011109 | Energy Fuels 2013, 27, 7000−70077003
concentration increased by a factor of approximately 2.5−3,while the NO concentration remained approximately constant.This is because when the combustor was switched from air-firing conditions to oxy-firing conditions and as the CO2 con-centration in the flue gas increased, it was accompanied by adecrease in combustor and cyclone temperatures because of thehigher heat capacity of CO2. This decrease in the temperature,coupled with a higher CO2 partial pressure favoring equilibriumtoward CO formation, led to an increase in the CO concentra-tion. As combustor and cyclone temperatures recovered, theCO concentration gradually decreased. The SO2 concentra-tion’s increase, on the other hand, could be attributed to fluegas recycle, which led to the accumulation of SO2 in the recycle
loop. As the tests progressed, we can notice that the SO2 con-centration decreased from a high of ∼3200 ppm and stabilizedat ∼2200 ppm. This decrease in the SO2 concentration couldlikely be attributed to the accumulation of coal ash in thefluidized bed as the test proceeded. A similar trend was ob-served for the Boundary Dam coal test in Figure 5. Because ofthe likely higher calcium content in the coal ash, the SO2
concentration decreased to a greater extent for the BoundaryDam coal from >3000 to ∼1500 ppm.The emission rates for SO2 and NO are given in Table 4 for
cofiring tests and in Table 5 for tests with coals only. Table 4shows that a respectable SO2 capture ratio was obtained with aCa/S molar ratio of 3, while the sulfation proceeded through
Figure 5. Concentrations of CO, NO, and SO2 for 35% wood and 65% Boundary Dam coal.
Figure 6. Combustor freeboard temperature as a function of the amount of cofired wood pellet in bituminous coal.
Energy & Fuels Article
dx.doi.org/10.1021/ef4011109 | Energy Fuels 2013, 27, 7000−70077004

the indirect sulfation route considering the freeboard temper-ature. The effect of oxy-fuel combustion on sulfation has been
studied and discussed in the literature14−16 and is still beinginvestigated.These emission rates can be compared to the guidelines set
out in the Canadian Environmental Protection Act (CEPA),17
which are close to those set by the U.S. Environmental Protec-tion Agency.According to CEPA, the reference SO2 emission rate
determined for each plant should be equal to or less than (1)400−520 ng/J of heat input and 5−10% of the uncontrolledemission rate (90−95% reduction), (2) 200−260 ng/J of heatinput and 20−30% of the uncontrolled emission rate (70−80%reduction), or (3) 50 ng/J of heat input. For NOx, the newestCEPA emission limit is set to 50−70 ng/J of heat input.
Table 6. Measured SO3 Concentrations
measured SO3 concentration (ppmv)
bituminous coal20% wood/80% coal <0.1635% wood/65% coal 2.2350% wood/50% coal 1.12
Genesee100% coal 2.2720% wood/80% coal 2.7635% wood/65% coal 1.86
Table 7. Emissions of VOCs for bituminous and wood mixture, (μg/m3)
VOC 20% wood/80% bituminous 35% wood/65% bituminous 50% wood/50% bituminous 0% wood/100% bituminous
dichlorodifluoromethane (FREON 12) <0.3 <0.3 <0.3 <0.35chloromethane 6.25 3.29 5.84 22.0vinyl chloride 0.24 <0.2 <0.2 <0.2bromomethane 1.07 4.85 3.45 1.94chloroethane 0.22 <0.15 <0.15 <0.16trichlorofluoromethane (FREON 11) <0.15 <0.16 <0.17 <0.18acetone (2-propanone) <0.67 2.12 0.87 1.231,1-dichloroethylene <0.15 <0.16 <0.17 <0.2iodomethane <0.22 2.58 0.96 0.35carbon disulfide 13.5 4.31 3.48 4.75methylene chloride (dichloromethane) <0.3 <0.32 <0.33 <0.351,1-dichloroethane <0.18 <0.19 <0.2 not availabletrans-1,2-dichloroethylene <0.15 <0.16 <0.17 not availablecis-1,2-dichloroethylene <0.15 <0.16 <0.17 not availablechloroform <0.16 <0.18 <0.18 <0.181,2-dichloroethane <0.1 <0.11 <0.12 <0.1methyl ethyl ketone (2-butanone) <0.54 <0.58 <0.59 <0.71,1,1-trichloroethane <0.21 <0.23 <0.23 <0.2carbon tetrachloride <0.24 <0.26 <0.26 <0.35benzene 1360 55.8 45.6 31.11,1,2-trichloroethane <0.24 <0.26 <0.26 <0.161,2-dichloropropane <0.16 <0.18 <0.18 <0.4trichloroethylene <0.16 <0.18 <0.18 <0.5dibromomethane <0.15 <0.16 <0.17 1.94bromodichloromethane <0.16 <0.18 <0.18 <0.2cis-1,3-dichloropropene <0.15 <0.16 <0.17 <0.35trans-1,3-dichloropropene <0.1 <0.11 <0.12 <0.2dibromochloromethane <0.13 <0.15 <0.15 <0.4methyl isobutyl ketone <0.3 <0.32 <0.33 <0.2methyl butyl ketone (2-hexanone) <0.45 <0.49 <0.5 <0.4toluene 42.6 4.59 2.10 <0.18ethylene dibromide <0.15 <0.16 <0.17 <0.2tetrachloroethylene <0.27 <0.29 <0.3 <0.1chlorobenzene <0.16 1.20 0.40 <0.161,1,1,2-tetrachloroethane <0.15 <0.16 <0.17 <0.4ethylbenzene <0.21 <0.23 0.28 <0.5m/p-xylene <0.22 0.79 0.69 1.94styrene <0.18 <0.19 <0.2 <0.2o-xylene <0.22 <0.24 <0.25 <0.35bromoform <0.21 <0.23 <0.23 <0.21,1,2,2-tetrachloroethane <0.21 <0.23 <0.23 <0.21,2,3-trichloropropane <0.22 <0.24 <0.25 <0.21,3-dichlorobenzene <0.3 <0.32 <0.33 <0.41,4-dichlorobenzene <0.3 <0.3 <0.3 <0.21,2-dichlorobenzene <0.3 <0.3 <0.3 <0.4
Energy & Fuels Article
dx.doi.org/10.1021/ef4011109 | Energy Fuels 2013, 27, 7000−70077005
We can see that the emission rates of SO2 for all tests fellwithin acceptable limits outlined in the previous paragraph inpoints 1 and 2, which are relevant to solid-fuel power plants.Similarly, NO emissions for all the tests, including tests withcoals only, all fell well below the new limit. We also note thatNO emission rates of our CFBC without SCR or SNCR alsofell below the slightly more stringent requirements of mostEuropean countries.15 It is also observed that a comparison ofemission rates between Tables 4 and 5 indicates that addingwood pellets to the coal may help further lower rates of emis-sion of both SO2 and NO.Table 5 also shows that sulfur capture ratios were particularly
good with Genesee and Boundary Dam coals, while it iscomparatively low for the test with bituminous coal only. Coalash analyses in Table 2 show that Boundary Dam coal has arelatively high calcium content, followed by Genesee coal, whilethe bituminous coal has the lowest calcium content. The highercalcium contents of the Boundary Dam and Genesee coals mayhave contributed to their superior sulfur capture ratio. In addi-tion, it is noted from Table 4 that the sulfur capture ratio forthe bituminous coal improved upon addition of wood pellets.3.3. Effects of Wood Pellets on Combustion Temper-
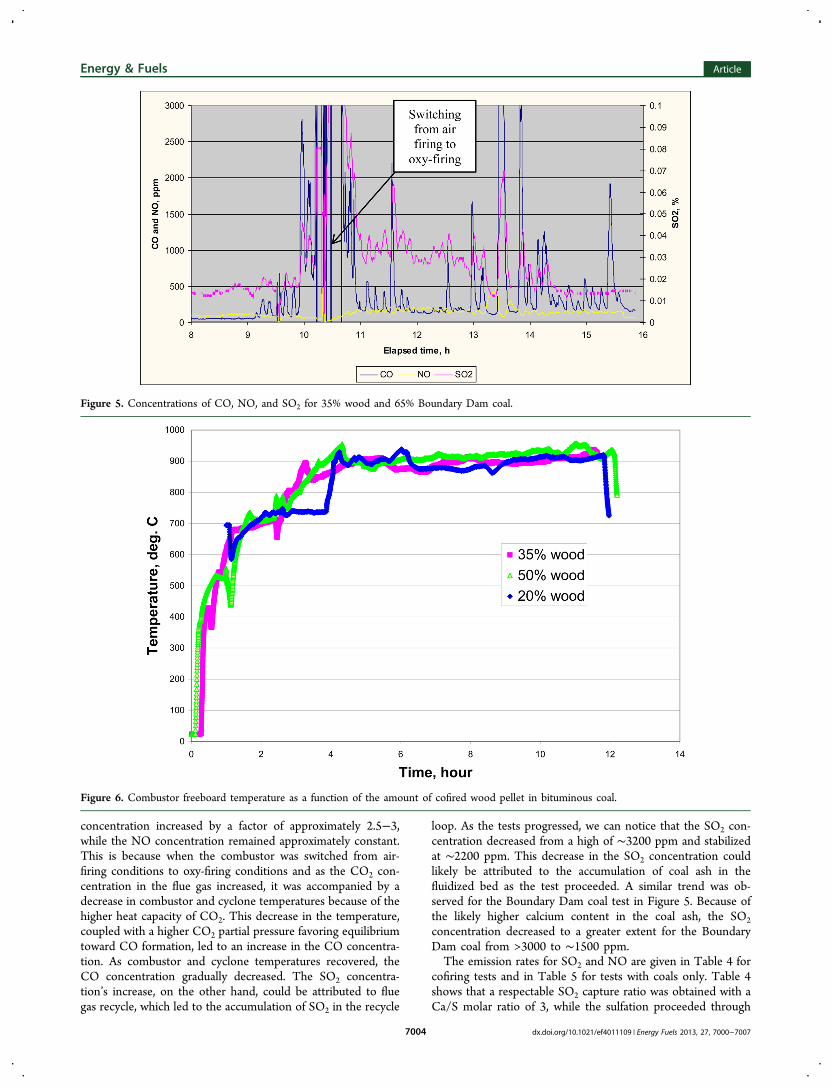
ature. Figure 6 shows the effect of wood pellet cofiring onCFBC freeboard temperature, when bituminous coal was used.It is clear from Figure 6 that the CFB freeboard temperature
could be easily controlled to its target value when coal wascofired with up to 50% wood pellets, so that maintaining a goodcombustion temperature should not be a concern.3.4. Concentrations of SO3. It is well-known that SO3
plays an important role in acid gas formation and in causingcorrosion. The formation of SO3 could be enhanced underoxy-fuel conditions because of the higher SO2 concentrations inthe recycle loop.18−20 To understand how it is affected by theaddition of the wood pellets, its concentrations were measureddownstream of the bag filter and upstream of the ID fan wherethe flue gas temperature was ∼100 °C, and Table 6 shows theresults obtained for cofiring tests of the Spanish bituminouscoal and Genesee sub-bituminous coal with wood pellets.From Table 6, we can see that the SO3 concentrations were
very low in our facility with the test fuels. No meaningfulcorrelation between SO3 concentrations and the percentage ofwood pellets in the blended fuel could be derived because ofthe extremely low SO3 concentrations. It should be emphasizedthat the reported SO3 concentrations were not the averagemeasured for the entire test periods but during a specificsampling period, and fluctuations should thus be expected.3.5. Emissions of VOCs and Metals. When biomass is
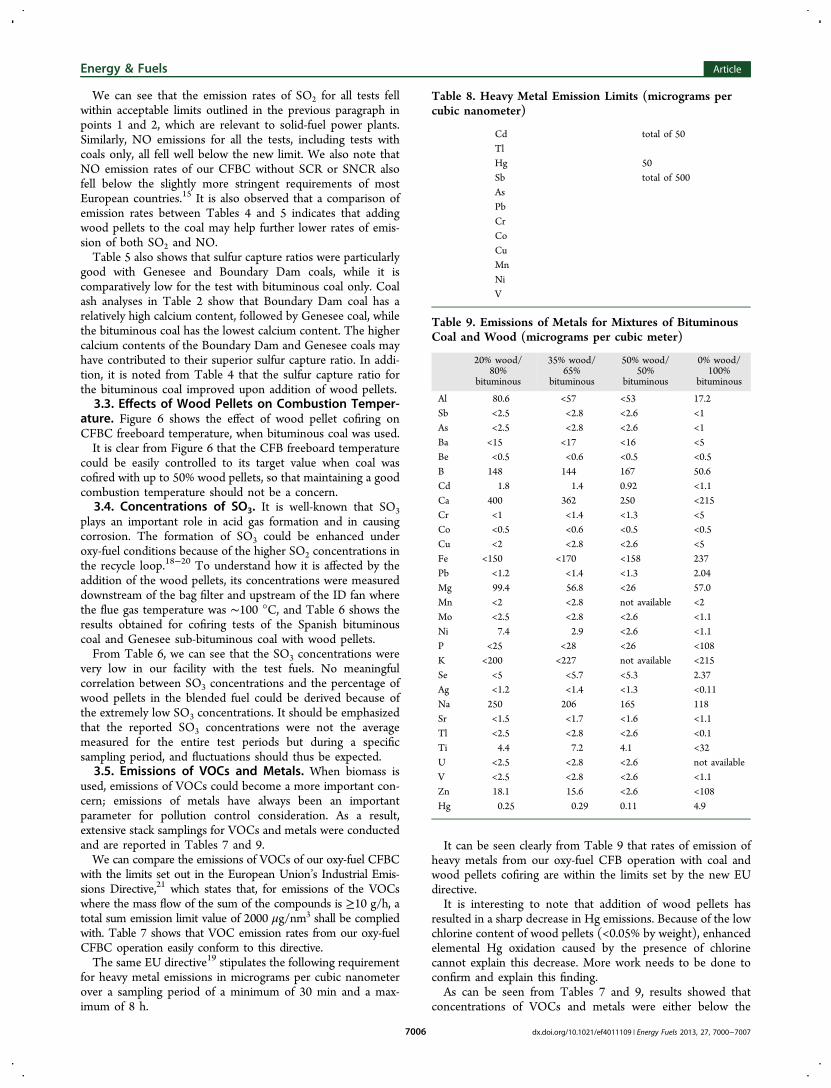
used, emissions of VOCs could become a more important con-cern; emissions of metals have always been an importantparameter for pollution control consideration. As a result,extensive stack samplings for VOCs and metals were conductedand are reported in Tables 7 and 9.We can compare the emissions of VOCs of our oxy-fuel CFBC
with the limits set out in the European Union’s Industrial Emis-sions Directive,21 which states that, for emissions of the VOCswhere the mass flow of the sum of the compounds is ≥10 g/h, atotal sum emission limit value of 2000 μg/nm3 shall be compliedwith. Table 7 shows that VOC emission rates from our oxy-fuelCFBC operation easily conform to this directive.The same EU directive19 stipulates the following requirement
for heavy metal emissions in micrograms per cubic nanometerover a sampling period of a minimum of 30 min and a max-imum of 8 h.
It can be seen clearly from Table 9 that rates of emission ofheavy metals from our oxy-fuel CFB operation with coal andwood pellets cofiring are within the limits set by the new EUdirective.It is interesting to note that addition of wood pellets has
resulted in a sharp decrease in Hg emissions. Because of the lowchlorine content of wood pellets (<0.05% by weight), enhancedelemental Hg oxidation caused by the presence of chlorinecannot explain this decrease. More work needs to be done toconfirm and explain this finding.As can be seen from Tables 7 and 9, results showed that
concentrations of VOCs and metals were either below the
Table 8. Heavy Metal Emission Limits (micrograms percubic nanometer)
Cd total of 50TlHg 50Sb total of 500AsPbCrCoCuMnNiV
Table 9. Emissions of Metals for Mixtures of BituminousCoal and Wood (micrograms per cubic meter)
20% wood/80%
bituminous
35% wood/65%
bituminous
50% wood/50%
bituminous
0% wood/100%
bituminous
Al 80.6 <57 <53 17.2Sb <2.5 <2.8 <2.6 <1As <2.5 <2.8 <2.6 <1Ba <15 <17 <16 <5Be <0.5 <0.6 <0.5 <0.5B 148 144 167 50.6Cd 1.8 1.4 0.92 <1.1Ca 400 362 250 <215Cr <1 <1.4 <1.3 <5Co <0.5 <0.6 <0.5 <0.5Cu <2 <2.8 <2.6 <5Fe <150 <170 <158 237Pb <1.2 <1.4 <1.3 2.04Mg 99.4 56.8 <26 57.0Mn <2 <2.8 not available <2Mo <2.5 <2.8 <2.6 <1.1Ni 7.4 2.9 <2.6 <1.1P <25 <28 <26 <108K <200 <227 not available <215Se <5 <5.7 <5.3 2.37Ag <1.2 <1.4 <1.3 <0.11Na 250 206 165 118Sr <1.5 <1.7 <1.6 <1.1Tl <2.5 <2.8 <2.6 <0.1Ti 4.4 7.2 4.1 <32U <2.5 <2.8 <2.6 not availableV <2.5 <2.8 <2.6 <1.1Zn 18.1 15.6 <2.6 <108Hg 0.25 0.29 0.11 4.9
Energy & Fuels Article
dx.doi.org/10.1021/ef4011109 | Energy Fuels 2013, 27, 7000−70077006

detection threshold or within the normal range. On the basis ofthese results, we can conclude that cofiring coal with up to 50%of wood pellets did not result in concerns over increasedemissions of either VOCs or metals.
4. CONCLUSIONSCombustion tests cofiring three types of coal with up to 50% woodpellets by weight have been conducted using CanmetENERGY’s0.8 MWth pilot-scale circulating fluidized bed combustor. Testresults showed that this type of fuel can be combusted satis-factorily under oxy-fuel conditions using a CFB combustor withstable conditions and with a flue gas CO2 concentration of>90%. The effect of wood pellets on the CFB freeboard tem-perature is minimal. While the flue gas SO2 concentrationshowed an ≤3-fold increase due to flue gas recycle, stacksampling showed that SO3 concentrations were very low at ourfacility. With a Ca/S molar ratio of 3, a good sulfur capture ratiowas obtained upon addition of limestone. Emission rates forSO2 and NO for all tests were below current and future govern-ment guidelines. Stack samplings for volatile organic com-pounds and metals also revealed low emission rates for bothpollutants, well within the new EU directive. These resultsconfirmed one of the main advantages of oxy-fuel CFB, whichis its fuel flexibility, and they also showed that, by cofiring coalwith CO2-neutral biomass while capturing the CO2, it isplausible to achieve a net reduction in the level of CO2 in theatmosphere.
■ AUTHOR INFORMATIONCorresponding Author*E-mail: [email protected]. Telephone: (613) 992-8150.Fax: (613) 992-9335.NotesThe authors declare no competing financial interest.
■ ACKNOWLEDGMENTSFunding for this work was provided by Natural ResourcesCanada through the Program of Energy Research andDevelopment. We also express our gratitude to Mr. RobertSymonds and Mr. David McCalden for their technical andengineering support and Mr. Robert Dureau and Mr. TerryGiddings for conducting stack sampling.
■ REFERENCES(1) Tan, Y.; Jia, L.; Wu, Y.; Anthony, E. J. Experiences and results ona 0.8 MWth oxy-fuel operation pilot-scale circulating fluidized bed.Appl. Energy 2012, 92, 343−347.(2) Liljedahl, G. N.; Turek, D. G.; Nsakala, N. Y.; Mohn, N. C.; Fout,T. E. Alstom’s oxygen-fired CFB technology development status forCO2 mitigation. 31st International technical conference on coalutilization and fuel systems, Clearwater, FL, 2006.(3) Kuivalainen, R.; Eriksson, T.; Hotta, A.; Sacristan, A. S.-B.;Jubitero, J. M.; Ballesteros, J. C. Development and demonstration ofoxy-fuel CFB technology. 35th International technical conference oncoal utilization and fuel systems, Clearwater, FL, 2010.(4) Lupion, M.; Navarrete, B.; Otero, P.; Cortes, V. J. Experimentalprogramme in CIUDEN’s CO2 capture technology development plantfor power generation. Chem. Eng. Res. Des. 2011, 89, 1494−1500.(5) Jia, L.; Tan, Y.; McCalden, D.; Wu, Y.; He, I.; Symonds, R.;Anthony, E. J. Commissioning of a 0.8 MWth CFBC for oxy-fuelcombustion. Int. J. Greenhouse Gas Control 2012, 7, 240−243.(6) Luschen, A.; Madlener, R. Economic viability of biomass cofiringin new hard-coal power plants in Germany. Biomass Bioenergy 2013,57, 33−47.
(7) McIlveen-Wright, D. R.; Huang, Y.; Rezvani, S.; Redpath, D.;Anderson, M.; Dave, A.; Hewitt, N. J. A technical and economicanalysis of three large scale biomass combustion plants in the UK.Appl. Energy 2013, 112, 396−404.(8) Riaza, J.; Gil, M. V.; Alvarez, L.; Pevida, C.; Pis, J. J.; Rubiera, F.Oxy-fuel combustion of coal and biomass blends. Energy 2012, 41,429−435.(9) Gungor, A. Simulation of co-firing coal and biomass in circulatingfluidized beds. Energy Convers. Manage. 2013, 65, 574−579.(10) Wiinikka, H.; Gronberg, C.; Boman, C. Emissions of heavymetals during fixed-bed combustion of six biomass fuels. Energy Fuels2013, 27, 1073−1080.(11) U.S. Environmental Protection Agency. Sampling Method forVolatile Organic Compounds Method 0031 (http://www.epa.gov/osw/hazard/testmethods/sw846/pdfs/0031.pdf).(12) US Environmental Protection Agency. Determination of MetalsEmissions for Stationary Sources Method 29 (http://www.epa.gov/ttnemc01/promgate/m-29.pdf).(13) Apex Instruments, Controlled Condensate·Alternative Method8: Quantifying Sulfuric Acid Emissions from Stationary Sources(http://www.apex inst .com/products/method-equipment-illustrations/controlled-condensate).(14) García-Labiano, F.; Rufas, A.; de Diego, L. F.; de las Obras-Loscertales, M.; Gayan, P.; Abad, A.; Adanez, J. Calcium-basedsorbents behaviour during sulphation at oxy-fuel fluidised bedcombustion conditions. Fuel 2011, 90, 3100−3108.(15) Wang, C.; Jia, L.; Tan, Y.; Anthony, E. J. Influence of watervapor on the direct sulfation of limestone under simulated oxy-fuelfluidized-bed combustion (FBC) conditions. Energy Fuels 2011, 25,617−623.(16) Liu, H.; Katagiri, S.; Kaneko, U.; Okazaki, K. Sulfation behaviorof limestone under high CO2 concentration in O2/CO2 coalcombustion. Fuel 2000, 79, 945−953.(17) Environment Canada, CEPA Environmental Registry. ThermalPower Generation Emissions: National Guidelines for New StationarySources Discussion Document (http://www.ec.gc.ca/lcpe-cepa/default.asp?lang=En&n=B0F8008E-1).(18) Tan, Y.; Croiset, E.; Douglas, M. A.; Thambimuthu, K. V.Combustion characteristics of coal in a mixture of oxygen and recycledflue gas. Fuel 2006, 85, 507−512.(19) Jia, L.; Tan, Y.; Anthony, E. J. Emissions of SO2 and NOx duringOxy-Fuel CFB combustion tests in a mini-circulating fluidized bedcombustion reactor. Energy Fuels 2010, 24, 910−915.(20) Lupianez, C.; Guedea, I.; Bolea, I.; Díez, L. I.; Romeo, L. M.Experimental study of SO2 and NOx emissions in fluidized bed oxy-fuel combustion. Fuel Process. Technol. 2013, 106, 587−594.(21) Directive 2010/75/Eu of The European Parliament and of TheCouncil of 24 November 2010 on industrial emissions (integratedpollution prevention and control). Off icial Journal of the EuropeanUnion, December 17, 2010.
Energy & Fuels Article
dx.doi.org/10.1021/ef4011109 | Energy Fuels 2013, 27, 7000−70077007