Embed Size (px)
Citation preview
SOME EFFECTS OF UREA FERTILIZATIONON SOIL CHARACTERISTICS AND TISSUEMINERAL CONTENT IN OVERSTOCKED
WESTERN HEMLOCK STANDS
by
J. Baker
FOREST RESEARCH LABORATORYCANADIAN FORESTRY SERVICEVICTORIA, BRITISH COLUMBIA
INFORMATION REPORT BC-X-39
DEPARTMENT OF FISHERIES AND FORESTRY
!\lARCH, 1970

•
SOI·IE EFFECTS OF UREA FERTILIZATIOl: ON SOIL CEARACTERISTICS
AND TISSUE HINERAL COIITElIT IN OVERSTOCKED
W~TERN HEl-!LOCK STJ.llDS
by
J. Baker
CANADIAN FORJ,STRY SEllVICE
FOREST RESEARCH LABORATORY
VICTORIA, BRITISH COLUKBIA
INFOFl'.ATIOIl REPORT BC-X-39
DIPARTMENT OF FISHERIES AND FORESTRY
MARCil, 1970

SOME EFFECTS OF UREA FERTILlZATIOIl ON SOIL ChARACTERISTICS
AND TISSUE MINERAL COllTENT IN OVERSTOCKED
WESTERN H»lLOCK STANDS
Introduction
Overstocked stands of western hemlock a.re nlJJDerOU8 on Vancouver
Island. The.t stand dens! ty influences both the Individual tree perfontance
and harvest of merchantable timber is ....e11 know. In the past, operators
have used spacing techniques Buch as hand-thinning and girdling to maintain
an acceptable stand dens! ty throughout the productive growth period. How
ever, these practices are costly and time-eoDsum1ng even under the most
favorable conditione. The careful use of fertilizer on overstocked stands
could probabl,. hasten the natural expression of dOIlli:oance in some trees
and the suppression in others.
To determine the feasibility of controlling stand density at a
desired level by fertilization, several rates of n11;.rogen were used in a
study initiated in three dense hemlock stands on Vancouver Island.
This report diSCU!S8S the effects of the various rates of nitrogen
on the N, P and K levels of twig and needle tissues and on the soil nitrogen
content and soil pH values. In addition, it records the influence of urea
applications on other soil characteristics.
Description of Study Area
The soils of the three study" areas, i.e., Jeune Landing, Woss
CSIf,p and Port Renfrew are brunisols. However, that of Jeune Landing was
altered qy the removal of the vegetative cover qy a severe burn in 1951,
with the result that tte effects of elluviation are more apparent than
- 2 -
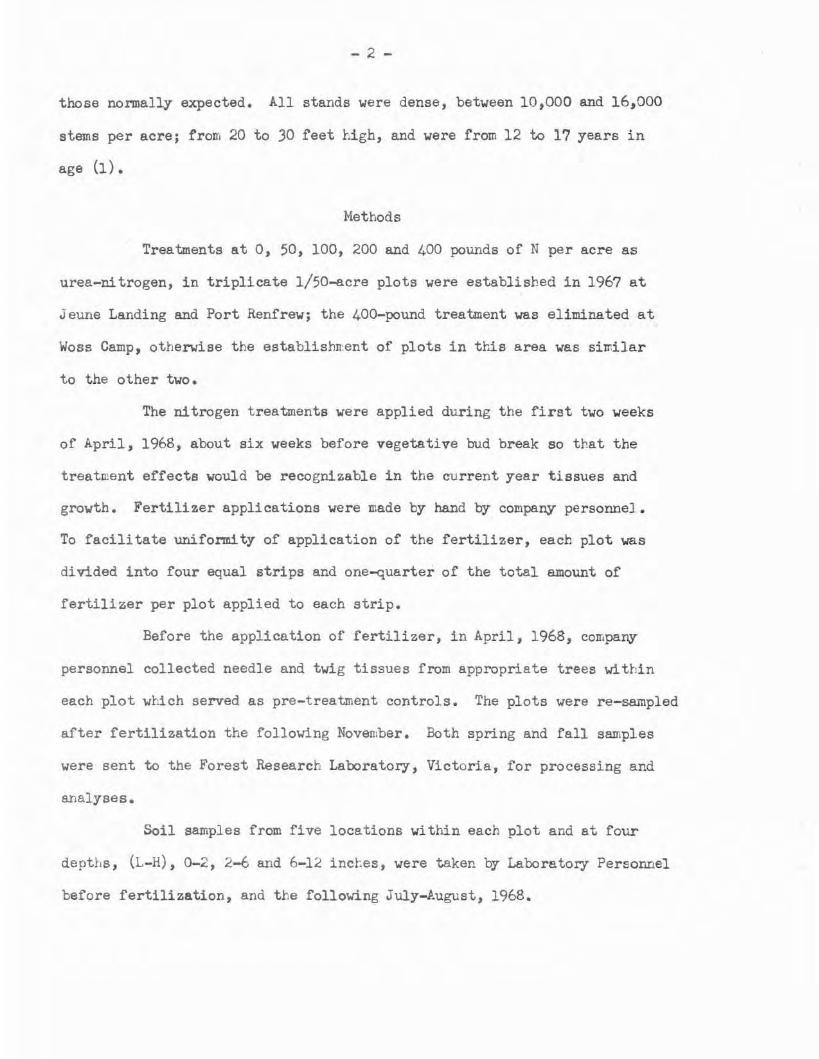
those normally expected. All stands ""ere dense, betlJeen 10,000 and 16,000
stems per acre; from 20 to 30 feet r~gh, and were from 12 to 17 years in
aga (1).
Methods
Treatments at 0, 50, 100, 200 and 400 pounds of N per acre as
urea-nitrogen, in triplicate 1/50-acre plots vere established in 1967 at
Jeune Landing and Port Renfrew; the 40o-pound treatment vas eliminated at
WOBS Camp, otherwise the 8stablishn-ent of plots in tr.is area vas sirr.iIar
to the other two.
The nitrogen treatments were applied during the first two weeks
of April, 1968, about six weeks before vegetative bud break so that the
treat~ent effects would be recognizable in the current year tissues and
growth. Fertilizer applications were made by hand by company personnel.
To facilitate uniformity of application of the fertilizer, each plot was
divided into four equal strips and one..-quarter of the total amount of
fertilizer per plot applied to each strip.
Before the application of fertilizer. in April, 1968, company
personnel collected need1e and t\dg tissues from appropriate trees within
each plot which served as pre-treatment controls. The plata were re-sampled
after fertilization the following November. Both spring and fall samples
were sent to the Forest Research Laboratory, Victoria, for processing and
analyses.
Soil samples from five locations within each plot and at four
deptbs, (L-H), 0-2, 2-6 and 6-12 incr.as, were taken by Laborstory Personnel
before fertilization, and the following July-August, 1968.

- 3 -
Analytical Procedures
Analyses of total N, P and K were performed on sar,ples of twig
axes and need) e tissues composed of current and one-year material from eacr.
treatAent .. Total nitrogen, 1n duplicate, was determined by the Kjeldahl
digestion of the dried ~~ter181f followed by alkaline distillation of the
digeste.te. Total phosphorus and potassiUDJ determinations vere made on
8shed tissues by the molybdate and atomic absorption methods J respectively.
Values have been expressed 8S percentages of tissue dry weight.
Analyses of the solI samples included: pl1 determination, using
a saturation paste and a glass electrode; total nitrogen by the Kjeldahl
procedure; exchangeable calcium, TT.agnesium and potassium by ammomUJ:I chloride
extraction, and cation exchange capacity by the distillation of adsorbed
ammonium from the ammonium chloride extraction. Excbangeable ammonium of
the litter surface was determined by direct distillation of the sample.
Results and Discussion
Foliar and Twig Analyses
In the Jeune Landing samples, there was a consistent increase in
the N-oontant in the fall twig and needle tissues from fertilized plots as
contrasted to those from the controls; larger responses ~ere associated vith
larger fertilizer applications. Port Renfrew samples showed a similar but
son,evhat less pronounced trend (Table 1).
At WOBS Celtp, only the tissues collected fron control plots sho~ed
an increase in nitrogen for the fall, over that for the spring saoplas.
~~g and needle tissues collected in the fall from the fertilized plots,
regardless of rate, exhibited nitrogen levels considerably lower than those
from the controls. The nitrogen levels of both tissues wera D.ors depri!ssed
- 4 -
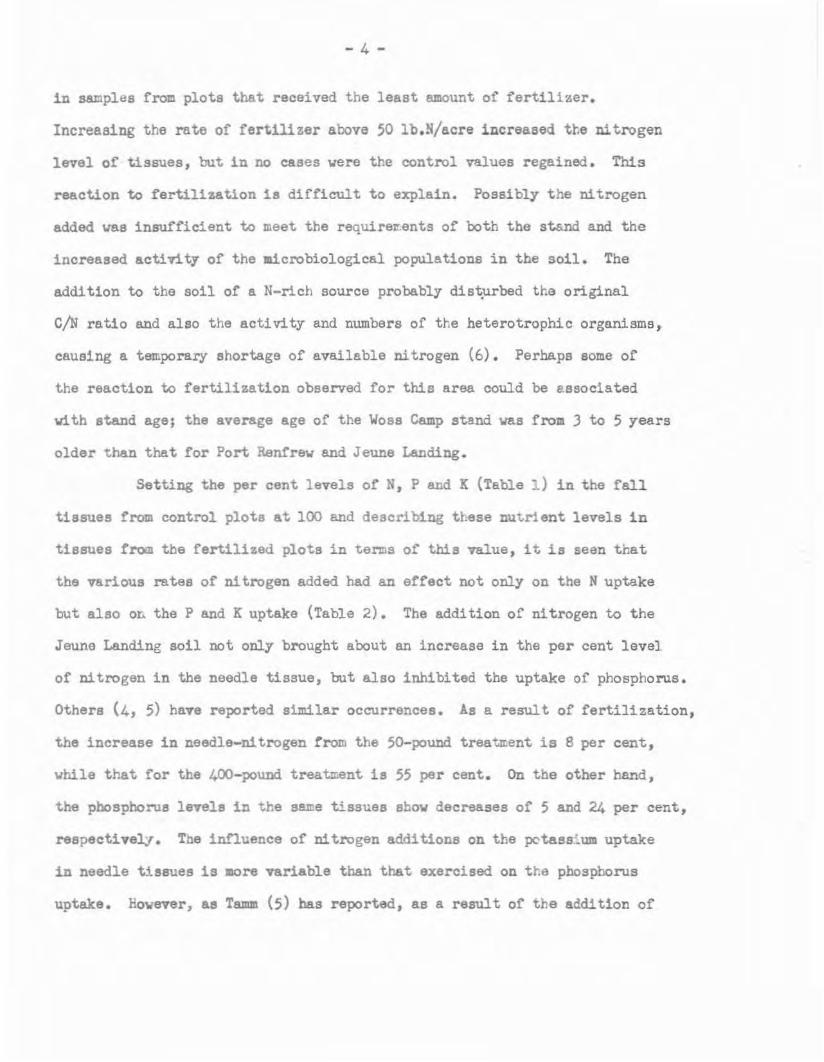
1n samples from plots that received the least amount of fertilizer.
Increasing the rate of fertilizer above 50 Ib.N/acre increased the nitrogen
level of tissues, but in no cases were the control values regained. This
reaction to fertilization 1s dlffieul t to explain. Possibly the n1 trogen
added \18.8 insufficient to lDeet the requiret".ents of both the stand and the
increased activit,.. of the aicrobiological populations in the solI. The
add! tioD to the 8011 of a N-rich source probably dist;urbed the original
c/N ratio and also the activity and numbers of the heterotrophic organisms,
causing a temporary shortage of available nitrogen (6). Perhaps Bome of
the reaction to fertilization observed for this area could be associated
with stand age; the average age of the 'Joss Camp stand ....as from J to 5 years
older than that for Port Ranf'rev and Jeune Landing.
Setting the per cent levels of N, P and K (Table 1) in the fall
tissues from control plots at 100 and describing these nut.rient levels in
tissues from the fertilized plots in terms of this value, it is seen that
the various rates of n1 trogen added had an etrect not only on the N uptake
but also OL the P and Kuptake (Table 2). The addition of nitrogen to the
Jeune Landing soil not only brought about an increase 1n the per cent level
of nitrogen in the needle tissue, but also inhibited the uptake of phosphonls.
Others (4, 5) have reported similar occurrences. As a result of fertilization,
the increase in needle-nitrogen trom the 50-pound treatltent is 8 per cent,
",hile that for the 400-pound treatment 1s 55 per cent. On the other hand,
the phospheNs levels in the san:e tissues show decreases of 5 and 24 per cent,
respectivel,:r. The influence of n1 trogen add! tiona on the potassium uptake
in needle tissues is -.ore variable than that exercised. on the phosphorus
uptake. Hovever, a8 Tamz (5) bas report&d, as a result of the addition of

- 5 -
N there is a strong tendancy for decreased uptakes of K. The overall
trend 1n N, P and K changes vith N fertilization holds also for the t~g
tissues fron Jeune Landing.
The effects of fertilization on tissues from Port Renfrew vere
similar to those for the J Bune Landing samples vi. th t""o exceptions J 1.e.,
the magnitude of nitrogen and phosphorus changes in needle tissues we
smaller; and the potassium uptake was not influenced.
The tissues from Woss Camp presented. quite another picture. The
addi ticD of urea to the soil had a depressing effect upon the n1 trogen
levels. Phosphorus levels in these tissues were generally increased as
a result of nitrogen additions. The lowest rate of fertilizer depressed
to the greatest extent both nitrogen (38 and JJ per cent in needle and
twig tissues) and potassium (1.2 and 11 per cent) uptakes, but enhanced
to the greatest extent the phosphorus uptake. As the rate of fertilizer
increased, the depressing effects on nitrogen and potassium uptake decreased;
at the same tin,B, the enhancement 1n phosphorus uptake also decreased.
So11 Analyses
The effect of urea treatments on 9011 was most pronounced on
Ue litter surface and on the underlying adjacent mineral soil. The efrects
of fertilization were only slight in the deeper soil layers. As others
(8) have reported those soil characteristics Jr.ost influenced by urea
applications \lere total nitrogen (Table J), exchangeable anunonium (Table 4)
and pH (Table 5). Water soluble and exchangeable Ca, Hg and K were influenced
by the treatment and there 1s evidence of a dO\lnward wovement of these
cntions (Table 4). Probably this was due to an increased mineralization
of the litter surfaces. Some modification to the cation exchange capacity,
especially to the surface in the samples from Jeune Landing and Port

- 6 -
Renfrew, also took place.
Total Soil Nitrogen
The effect of Boil applications of urea on total solI n1 trogen
values of the 11tter surfaces of J eune Landing and Port Renfrev was
essentially the same (Table J). Generally, an increase in the amount of
urea applied increased the nitrogen percentage of the litter. In no C8S8
did the addition of urea increase the nitrogen level of the litter surface
of WOBS Camp 8011. The effect of fertilization on the nitrogen contents
of the mineral Bub-soils vas socewhat different. Only the J suns Landing
saH.ples showed a general increase as a result of urea additions; samples
from Port Renfrew and 'WOBS CeJilP were e1 thar decreased or virtually
unaffected. This differential response to n1 trogen fertilization 1n the
8011s under study probably played a part in the differences reported in
nitrogen levels for twig and needle tissues.
Exchangeable Ammonium and Exchange Capac! ty
The litter surfaces of 50ils showed a tendancy to adsorb and
retain n1 trogen in the form of ammonium; the so11 trom Port Renfrev sho\o1ed
the strongest, and that from Woss Camp the least tendancy to retain applied
n1trogen (Table 4). Ammonium ion is produced during the enzymatic conversion
and. hydrolysis of urea in the 5011 (2, 7). Ammonium, being univalent and
positively charged, becomes adsorbed on exchange sites in both organic and
iDorganic colloids and 1s retained in the so11 mediuc. A note'Jorth,y feature
vas the increased exchange capacities of the litter materials of Jauna
Landing and Port Renfre\o1 from the fertilized. plots (Table 4). Only Jeune
Landing shoved an increase in exchange capac! ty in the mineral solIs as a
result of fertilization. These tvo soil characteristics, i.e., exchangeable
- 7 -
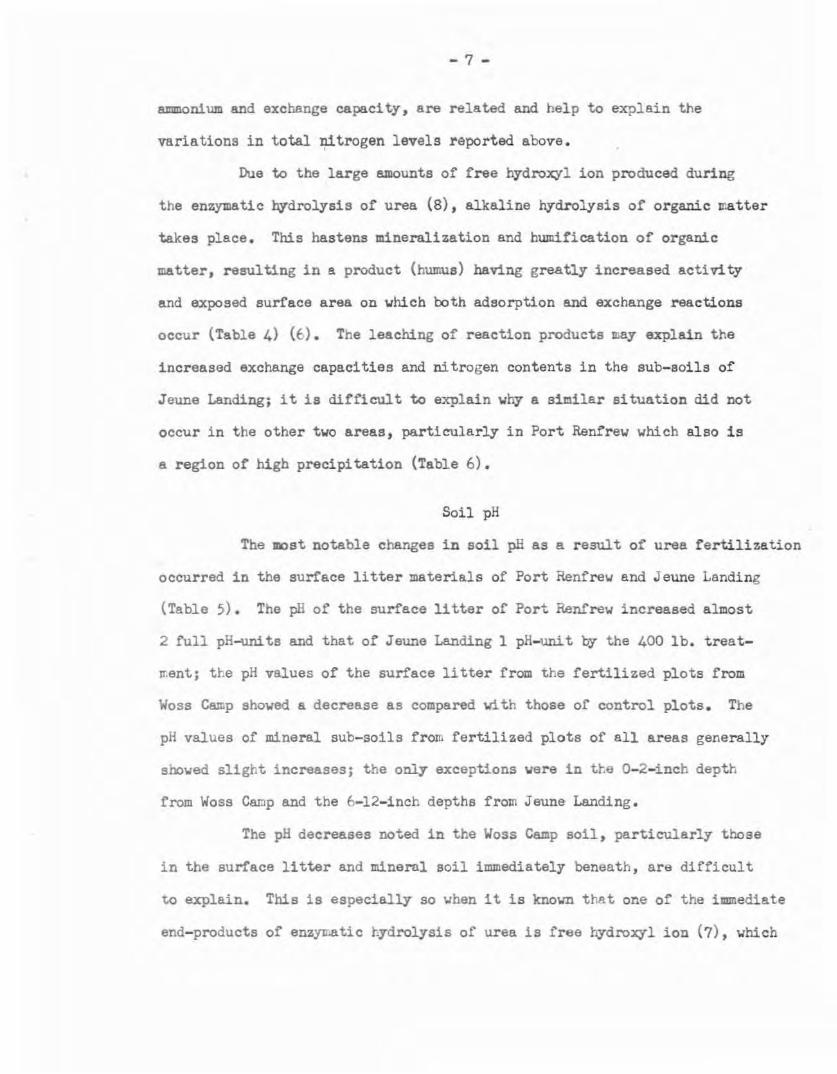
ammon1\lJll and exchange capacity, are related and help to explain the
variations in total nitrogen levels reported above.
Due to the large amounts of free hydroxyl ion produced during
the enzymatic hydrolysis of urea (8), alkaline hy"drolysis of organic Il'.atter
takes place. This hastens mineralization and bumification of orgamc
matter, resulting in a product (humus) having greatly increased activity
and exposed surface area on whicb both adsorption and exchange reactions
occur (Table 4) (6). The leaching of reaction products rr.ay explain the
increased exchange capacities and nitrogen contents in the Bub-soils of
Jeune Landing; it 1s difficult to explain why a slt:dlar situation did not
occur in the other two areas, particularly in Port Renfrew which also is
a region of high precipitation (Table 6).
Sol1 pH
The llOat notable changes in solI pH as a result of urea fertilization
occurred in the surface 11tter materials of Port Renfrew and Jeune Landing
(Table 5). The pH of the surface litter of Port Renfre~ increased almost
2 full pH-units and that of Jeune Landing 1 pH-unit by" the 400 lb. treat-
ffientj the pH values of the surface litter from the fertilized plots from
WOSB Camp showed a decrease as compared vi th those of control plots. The
pH values of mineral Bub-soils from fertilized plots of all areas generally
showed slight increases; the only exceptions were in the 0-2-inch depth
from WOBS Camp and the 6-l2-1nch depths from Jeune Landing.
The pH decreases noted in the Woss Cacp soil, particularly those
in the surface litter and mineral soil immediately beneath, are difficult
to explain. This is especially so ....hen it is known that one of the immediate
end-products of enzytratlc hydrolysis of urea is free hydroxyl iou (7), which
- 8 -
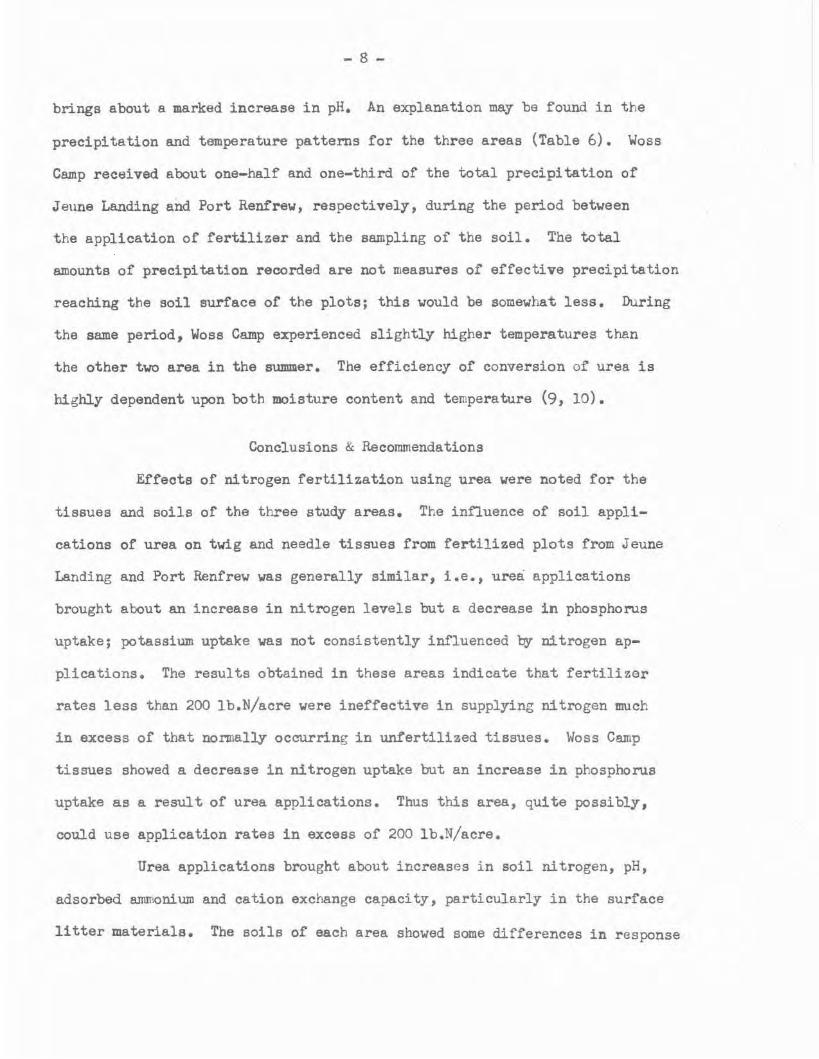
brings about 8. marked increase in pH. An explanation may be found in the
precipitation and temperature patterns for the three areas (Table 6). Woss
Camp received about one-half and one-third of the total precipitat10D of
J eune Landing and Port Renfrew, respect!vely, during the period between
the application of fertilizer and the sampling of the soil. The total
amounts of precipitation recorded are not measures of effective precipitation
reaching the 8011 surface of the plots; this would be somewhat les8. During
the same period, WOBB Camp experienced slightly higher temperatures than
the other two area in the summer. The efficiency of conversion of urea 1s
highly dependent upon both moisture content and temperature (9, 10).
Conclusions & Recommendations
Etfeots of nitrogen fertilization using urea were noted for the
tissues and soils of the three stuQy areas. The influence of soil appli
cations of urea on twig and needle tissues from fertilized plots from Jeune
Landing and Port Renfrew was generally similar, i.e., urea applications
brought about an increase in nitrogen levels but a decrease in phosphorus
uptake; potassium uptake was not consistently influenced ~ nitrogen ap
plications. The results obtained in these areas indicate that fertilizer
rates less than 200 lb.N/acre were ineffective in supplying nitrogen much
in exeess of that normally occurring in unfertilized tissues. WOBS Camp
tissues showed a decrease in nitrogen uptake but an inerease in phosphorus
uptake as a result of urea applications. Thus this area, quite possibly,
could use application rates in exeess of 200 lb.N/acre.
Urea applieations brought about inereases in soil nitrogen, pH,
adsorbed ammonium and cation exchange eapacity, particularly in the surface
litter materials. The soils of each area showed some differences in response

- 9 -
to urea applications; the greatest response took place at Jeune Landing
and Port Renfrev, and the least at Woss Camp. Precipitation and temperature
differences for the three areas probably played an important role in the
differences recorded.
The variability of the results obtained in this study confirm the
urgency for continuing fertilizer studies in forest II18.nagement programs.
Since applications of less than 200 Ib.N/acre \Jere ineffective, future
fertilizer studies could profitably include fever but greater rates of
treatments, in excess of 400 Ib.N/acre, particularly if urea Is to be used..
In addition, as suggested qy others (5), the adverse effects of increased
nitrogen on the uptake of phosphorus, as reI:Qrted in this study, could be
reduced b.Y additions of this nutrient in the added fertilizer. In addition,
treatment replications should be increased to at least five because of the
heterogeneous nature of forest soils and climatic conditions. There is a
continuing need for detailed studies on the effects of reaction-products
of urea and other nitrogen carriers on the various important soil properties
to determine the best source of the nutrient and to evaluate its influence
on the soil environment. Such studies could best be carried out under
controlled conditions. In future fertilizer studies, the importance of the
external climatic and \leather factors should not be overlooked in the
selection of tr::l.al s1 tes. Environmental records such as air and soil
temperatures, total and effective precipitation, air humidity, light
intenslty, elevation and length of gro'Jing season should be kept.
- 10 -
References
1. Baker, J.. 1969. SolI properties and nutritional status of lJestern
hemlock tissue from overstocked stands. Forest Research
Laboratory, Inf'onoation Rapt. B.C.-I-J8, Victoria, B.C.
2. Chin, W.T. and Kroontje, \I. 1963. Urea hydrolysis and subsequent
10B8 of ammonia. SolI Sci. Soc. Amer. Pree. 27, 316-318.
3. Ernst, J.W. and Massey, H.F. 1960. The effects of several factors
on volatilization of ammonia formed from urea in the Boll. Soil
Sc1. Soc. Amer. Proc. 24, 87-90.
4. Gessel, S.P., Stoate, T.N. and Turnball, K.J. 1965. The grovth
behaviour or Douglas-fir vi th n1 trogenouB fertilizer in 'Western
Washington. Res.Bull. 1, ColI. Forest !nat. Forest Prod.,
Univ. Wash.
5. Tamm, C.O. 1968. An attempt to assess the optimum nitrogen level in
No1"\l8Y aproee under field conditions. Studia Forestalls Suecica,
Nr 61 Skogslogskolan, Royal College of Forestry, Stockholm.
6. Lyon, T.L., Buckman, H.O., and Brady, N.C. 1952. The nature and
properties of 8011s. The Macmillan Co., Ney York, N.Y.
7. Overrein, L. 1963. The chemistry of urea nitrogen transfornmtions in
soil. Di68. Abstr. 24, 1311.
8. Simpson, D.M.P.., and Melsad, S.W. 1963. Urea hYdrolysis and trans
formations in sOlDe illinois so11s, Soil Sci. Soc. ber. Proc.
9. Stojanovic, B.J. 1959. ~drolysis of urea 1n soil as affected bf
season and Qy added urease, So11 Sci. 88, 251-255.
10. Wa.hhab, A., Khan, M. and Ishaq, M. 1960. Nutrif1cation of urea and
1ts 1088 through vole.tilizatlon of ar.ur~:mia under different soil
conditions. J. Agrtc. Sci. 55,47-51.
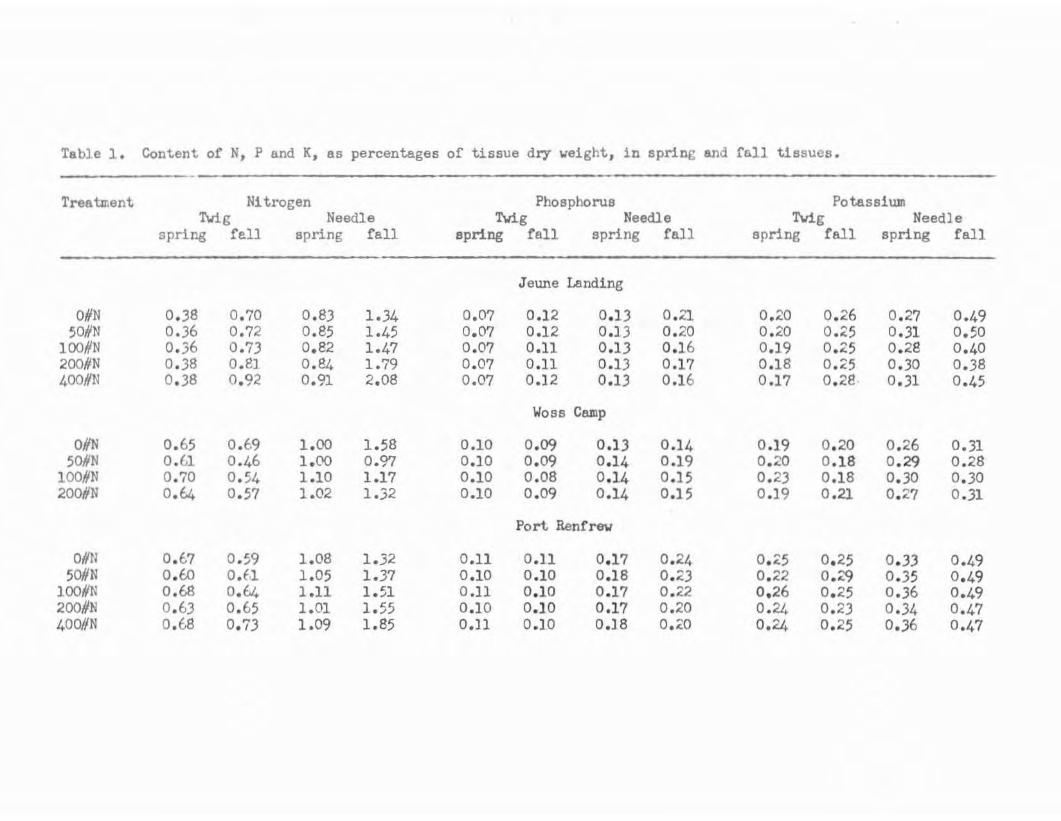
Table 1. Content of N, P and K, 8S percentages of tissue dry weight, 1n spring and fall tissues.
Treatu.ent Nitrogen Phosphorus PotasslwnMg Needle Mg Needle Mg Needle
spring rell spring rall apring roll spring roll spring ral1 spring roll
Jeune Landing
O#N 0.38 0.70 0.83 1.34 0.07 0.12 0.13 0.41 0.20 0.26 0.27 0.4950#N 0.36 0.12 0.85 1.45 0.07 0.12 0.13 0.20 0.20 0.25 0.31 0.50
100#N 0.36 0.73 0.82 1.47 0.07 0.11 0.13 0.16 0.19 0.25 0.28 0.40200#N 0.38 0.81 0.84 1.79 0.07 0.11 0.13 0.17 0.18 0 •.25 0.30 0.38400#N 0.38 0.92 0.91 2.08 0.07 0.12 0.13 0.16 0.17 0.28 0.31 0.45
WOBS Camp
ONN 0.65 0.69 1.00 1.58 0.10 0.09 0.13 0.14 0.19 0.20 0.26 0.3150#N 0.61 0.46 1.00 0.9'7 0.10 0.09 0.14 0.19 O.ZJ 0.18 0.29 0.28
l00#N 0.70 0.54 1.10 1.17 0.10 0.08 0.14 0.15 0.23 0.18 0.30 0.30200#N 0.64 0.57 1.02 1.32 0.10 0.09 0.14 0.15 0.19 0.21 0 •.2? 0.31
Port Renfr8'ol
O#N 0.67 0.59 1.08 1.32 0.11 0.11 0.17 0.24 0.25 0 •.25 0.33 0.4950#N 0.60 o.n 1.05 1.37 0.10 0.10 0.18 0.23 0.22 O.~ 0 ..35 0.49
l00#N 0.68 0.64 1.11 1.51 0.11 0.10 0.17 0.22 0.26 0.25 0.36 0.49200#N 0.63 0.65 1.01 1.55 0.10 0.10 0.17 0.20 0.24 0.23 0.34 0.47400#N 0.68 0.73 1.09 1.85 o.n 0.10 0.18 0.20 0.24 0.25 0.36 0.47

Table 2. Levels of N, P and K in fall needle and twig tissues from fertilized plots and expressedin terms of nutrient values in control tissues.
Treatment Nitrogentwig needle
Phosphorustwig needle
Potassiumtwig needle
Jeune Landing
O#N 100 100 100 100 100 10050#N 103 108 100 95 96 102
100#N 104 110 92 76 94 82200UN 116 134 92 81 96 784001lN 131 155 100 76 108 92
Woss Camp
DUN 100 100 100 100 100 10050#N 67 62 108 131 89 88
100UN 78 75 97 106 91 952001lN 83 84 102 108 105 97
Port Renfrew
DUN 100 100 100 100 100 10050#N 103 104 97 96 116 100
100#N 108 114 97 92 104 102200UN 110 117 90 84 97 964001lN 124 139 94 83 100 95

Table ). Effect of urea applications on total so11 n1 trogen velue. (% of dry weight).
Depth T e t - N Ainches Control 50 Ib acre 100 Ib acre 200 Ib acre 400 Ib acre
Jeune LaDding
4-'J (litter) 1.16 0.89 1.21 1.)5 1.440-2 0.47 0.)9 0.60 0.69 O.e:>2-6 0.29 0.)1 0.40 0.49 O.~2
6-12 0.21 0.2) 0.34 0.38 0.32
WOBS Cemp
5-'J 1.21 1.02 1.10 1.200-2 0.,,5 0.28 0.25 0.352-6 0.28 0.21 0.20 0.226-12 0.21 0.17 0.14 0.17
Port Renfrew
4-'J 0.96 1.00 1.26 1.21 1.410-2 0.31 0.17 0.34 0.27 0.,,82-6 0.31 0.19 0.28 0.14 0.226-12 0.19 0.17 0.24 0.15 0.18

Table 4. The influence of urea on the 'Jater and salt extractable cA.tions andon exchangeable anmoniuro and cation exc~Ange e8paci~.
1Deeth N-applied Jeune Lendinginches lb/acre Co Mg K Ca Mg K NH
4-N C.E.C.
mag/l00 g
H20 - extractable NH4Cl - extractable
4-0 0 0.85 0.39 0.85 26.0 2.5 0.4 0.5 32.7, 50 0.43 0.25 0.54 19.3 2.1 0.3 1.0 30.2" 100 0.07 0.11 0.35 21.4 4.8 1.2 3.6 38.2" 200 0.07 0.06 0.24 21.0 5.9 1.5 8.2 41.8" 400 0.07 0.04 0.18 22.0 5.2 1.5 12.3 46.4
0-2 0 0.20 0.09 0.08 4.4 1.7 0.2 - 13.4" 50 0.38 0.15 0.08 9.6 1.4 0.2 - 14.9" 100 0.46 0.19 0.17 7.2 1.8 0.2 - 14.2" 200 0.25 0.08 0.16 9.3 2.5 0.3 - 19.2, 400 0.05 0.01 0.11 6.4 2.1 0.1 - 21.9
2-6 0 0.11 0.09 0.02 1.9 0.6 0.1 - 9.0" 50 0.11 0.15 0.02 2.5 1.0 0.1 - 11.2, 100 0.16 0.11 0.06 3.9 0.9 0.1 - 10.9" 200 0.17 0.17 0.07 3.7 1.5 0.1 - 1~.1, 400 0.5a 0.69 0.12 4.3 1.8 0.1 - 15.5
6-12 0 0.11 0.05 0.04 1.3 0.3 - - 5.9" 50 1.78 0.05 0.03 2.5 0.3 - - 6.2" 100 0.59 0.12 0.05 3.1 0.2 - - 7.1" 200 0.09 0.06 0.06 1.5 0.5 - - 11.9" 400 0.19 0.13 0.05 2.7 0.7 - - 12.3
1 Cation exchange capacity.

Table 4 - Cont'd.
Depth N-applied WOBB Cllillpinches lb/acre Ca Mg K Ca Mg K NH4-N C.~.C.
meg/l00 g
H20 - extractable NH4Cl - extractable
5-0 0 0.20 0.05 0.55 17.7 4.5 1.2 0.5 47.6,50 0.52 0.14 1.15 22.5 5.0 1.0 1.0 48.4
" 100 0.43 0.10 1.06 17.7 4.9 1.0 3.4 48.4" 200 0.22 0.06 0.68 16.9 5.0 1.3 6.4 48.4
0-2 0 0.36 0.20 0.19 1.4 0.3 0.2 - 5.6" 50 0.09 0.05 0.11 3.6 0.6 0.2 - 7.3" 100 0.05 0.04 0.08 1.0 0.3 0.2 - 4.3, 200 0.05 0.04 0.23 1.7 O.S 0.3 - 8.4
2-6 0 0.21 0.16 0.07 1.4 0.3 0.1 - 4.9,50 0.08 0.05 0.03 1.7 0.3 0.1 - 4.2
" 100 0.04 0.03 0.02 0.5 0.1 - - 2.9" 200 0.04 0.03 0.04 0.7 0.2 0.1 - 3.3
6-12 0 0.05 0.02 0.05 1.7 0.2 - 4.8" 50 0.09 0.04 0.06 1.8 0.3 0.1 3.4" 100 0.04 0.03 0.04 2.8 0.1 0.1 0.9" 200 0.06 0.03 0.08 0.9 0.2 0.1 3.0
-
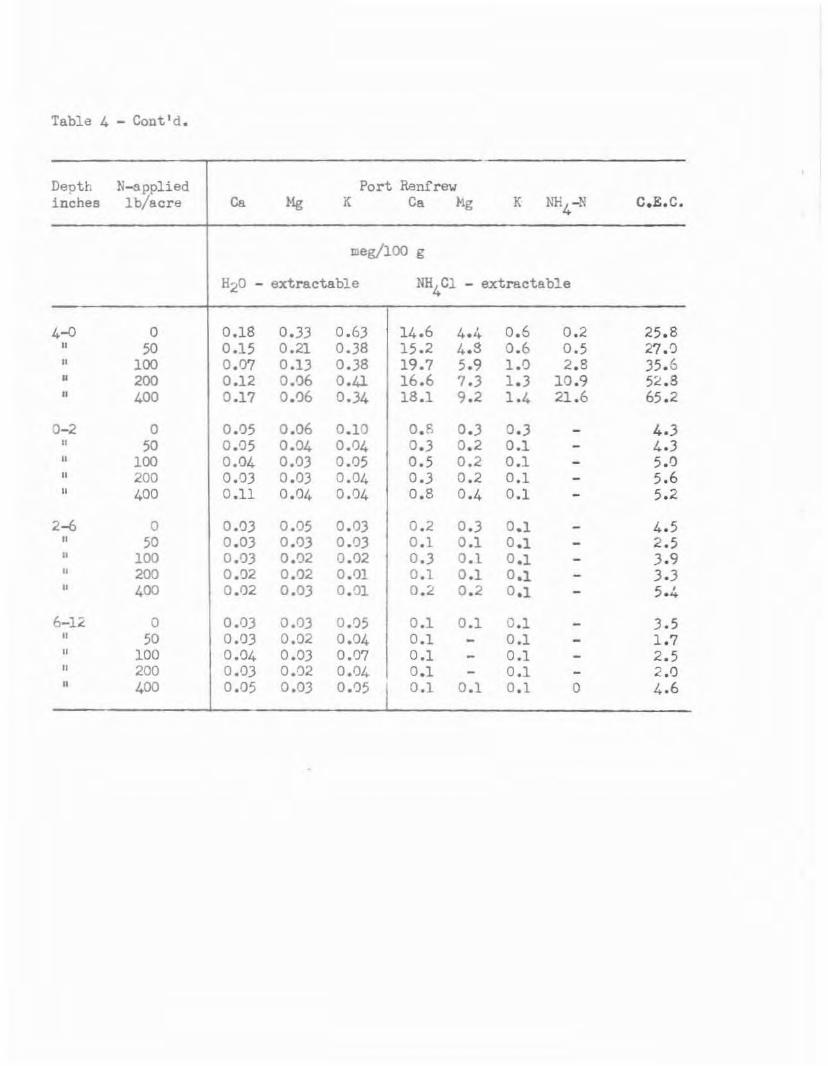
Table 4 - Cont1d.
Depth N....pplied Port Renfre'Jinches lb/acre Ca Mg K Ce Mg K NH-N C.E.C.4
meg/loo g
H20 - extractable NH4Cl - extractable
4-0 0 0.18 0.)) 0.6) 14.6 4.4 0.6 0.2 25.8" 50 0.15 0.21 0.)8 15.2 4.3 0.6 0.5 27.~
" 100 0.07 0.1) 0.)8 19.7 5.9 1.~ 2.8 )5.6, 200 0.12 0.06 0.41 16.6 7.) 1.3 10.9 52.8" 400 0.17 0.06 0.)4 18.1 9.2 1.4 21.6 65.2
0-2 a 0.05 0.06 0.10 0.8 0.) 0.) - 4.)" 50 0.05 0.~4 0.04 0.) 0.2 0.1 - 4.3" 100 0.04 0.0) 0.05 0.5 0.2 0.1 - 5.0" 200 0.0) 0.03 0.04 0.3 0.2 0.1 - 5.6" 400 O.ll 0.04 0.04 0.8 0.4 0.1 - 5.2
2-6 a 0.03 0.05 0.03 0.2 0.) 0.1 - 4.5" 50 0.0) 0.0) 0.0) 0.1 0.1 0.1 - 2.5" 100 0.0) 0.02 0.02 0.3 0.1 0.1 - ).9" 200 0.02 0.02 0.01 0.1 0.1 0.1 - ).)
" 400 0.02 0.0) O.al 0.2 0.2 0.1 - 5.4
6-1< a 0.03 0.03 0.05 0.1 0.1 0.1 - 3.5" 50 0.0) 0.02 0.04 0.1 0.1 1.7- -" 100 0.04 0.03 0.07 0.1 0.1 2.5- -" 200 0.03 0.02 0.04 0.1 - 0.1 2.0-" 400 0.05 0.03 0.05 I 0.1 0.1 0.1 0 4.6

Table 5. Modificatio,Ds in soil pH values as a result or urea applications.
pHDepthinches TreatD":ent Jeune Landing W05B Camp Port Renfrev
(L--H) O#N 4.7 5.3 4.30-2 4.6 5.3 4.32-6 4.6 4.8 4.76-12 4.8 5.0 5.0
(L-H) 5O#N 4.7 4.5 4.30-2 4.8 5.1 4.52-6 5.3 5.1 5.06-12 5.3 5.2 5.1
(L-H) 100#11 5.0 4.3 4.80-2 4.8 4.9 4.52-6 4.6 5.1 4.86-12 4.4 5.4 5.1
(L--I1) 200#N 5.0 4.7 5.70-2 4.8 4.6 5.12-6 4.6 4.9 5.16-12 4.4 5.1 5.5
(L--H) 400#N 5.7 6.20-2 5.1 4.42-6 4.7 4.66-12 4.6 5.0
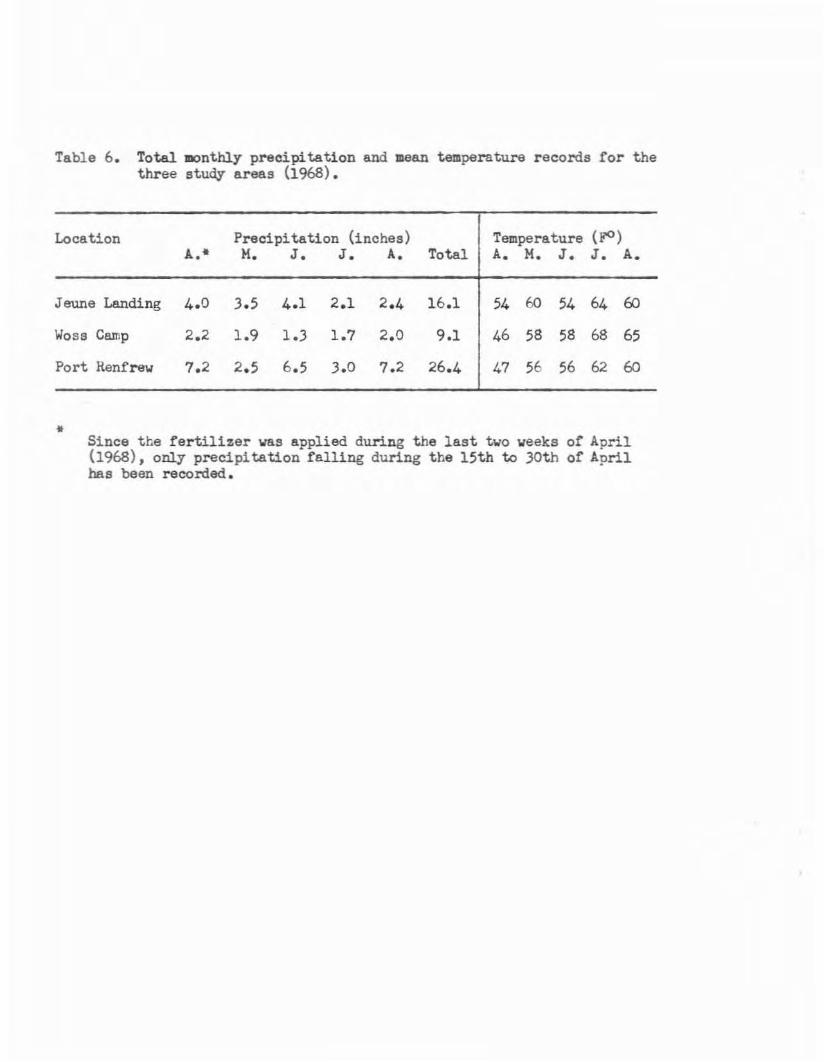
Table 6. Total monthly precipitatiOD and mean temperature records for thethree study areas (1%8).
Location Precipitation (inches) Temperature (FO)A.* K. J. J. A. Total A. K. J. J. A.
Jeune Landing 4.0 3.5 4.1 2.1 2.4 16.1 54 60 54 64 60
WOSB CBlnp 2.2 1.9 1.3 1.7 2.0 9.1 46 58 58 68 65
Port Renfrew 7.2 2.5 6.5 3.0 7.2 26.4 47 56 56 62 60
* Since the fertilizer was applied during the last tvo weeks of April(1968), only precipitation falling during the 15th to 30th of Aprilhas been recorded.