Embed Size (px)
Citation preview
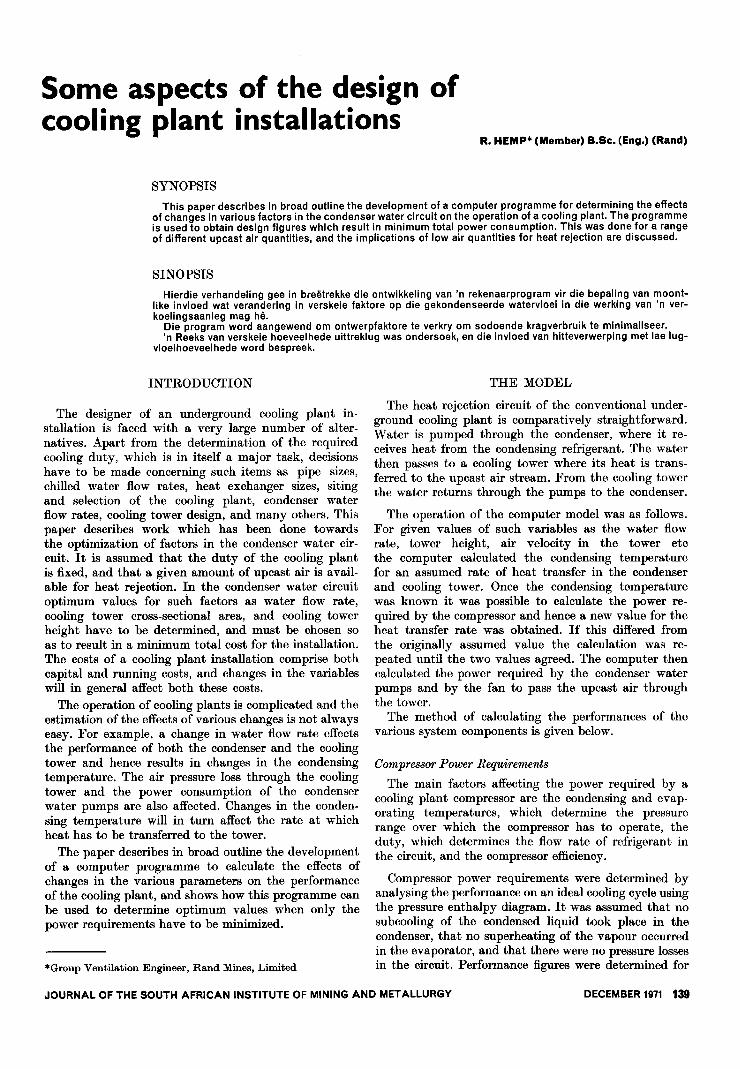
Some aspects of the design ofcooling plant installations
SYNOPSIS
R. HEMP* (Member) B.Se. (Eng.) (Rand)
This paper describes in broad outline the development of a computer programme for determining the effectsof changes in various factors in the condenser water circuit on the operation of a cooling plant. The programmeis used to obtain design figures which result in minimum total power consumption. This was done for a rangeof different upcast air quantities, and the implications of Iow air quantities for heat rejection are discussed.
SINOPSIS
Hierdie verhandeling gee in breetrekke die ontwikkeling van 'n rekenaarprogram vir die bepaling van moont-like invloed wat verandering in verskeie faktore op die gekondenseerde watervloei in die werking van 'n ver-koelingsaanleg mag he.
Die program word aangewend om ontwerpfaktore te verkry om sodoende kragverbruik te minimaliseer.'n Reeks van verskeie hoeveelhede uittreklug was ondersoek, en die invloed van hitteverwerping met lae lug-
vloeihoeveelhede word bespreek.
INTRODUCTION
The designer of an underground cooling plant in-stallation is faced with a very large number of alter-natives. Apart from the determination of the requiredcooling duty, which is in itself a major task, decisionshave to be made concerning such items as pipe sizes,chilled water flow rates, heat exchanger sizes, sitingand selection of the cooling plant, condenser waterflow rates, cooling tower design, and many others. Thispaper describes work which has been done towardsthe optimization of factors in the condenser water cir-cuit. It is assumed that the duty of the cooling plantis fixed, and that a given amount of upcast air is avail-able for heat rejection. In the condenser water circuitoptimum values for such factors as water flow rate,cooling tower cross-sectional area, and cooling towerheight have to be determined, and must be chosen soas to result in a minimum total cost for the installation.The costs of a cooling plant installation comprise bothcapital and running costs, and changes in the variableswill in general affect both these costs.
The operation of cooling plants is complicated and thee!!ltimation of the effects of various changes is not alwayseasy. For example, a change in water flow rate effectsthe performance of both the condenser and the coolingtower and hence results in changes in the condensingtemperature. The air pressure loss through the coolingtower and the power consumption of the condenserwater pumps are also affected. Changes in the conden-sing temperature will in turn affect the rate at whichheat has to be transferred to the tower.
The paper describes in broad outline the developmentof a computer programme to calculate the effects ofchanges in the various parameters on the performanceof the cooling plant, and shows how this programme canbe used to determine optimum values when only thepower requirements have to be minimized.
*Group Ventilation Engineer, Rand Mines, Limited
THE MODEL
The heat rejection circuit of the conventional under-ground cooling plant is comparatively straightforward.Water is pumped through the condenser, where it re-ceives heat from the condensing refrigerant. The waterthen passes to a cooling tower where its heat is trans-ferred to the upcast air stream. From the cooling towerthe water returns through the pumps to the condenser.
The operation of the computer model was as follows.For given values of such variables as the water flowrate, tower height, air velocity in the tower etcthe computer calculated the condensing temperaturefor an assumed rate of heat transfer in the condenserand cooling tower. Once the condensing temperaturewas known it was possible to calculate the power re-quired by the compressor and hence a new value for theheat transfer rate was obtained. If this differed fromthe originally assumed value the calculation was re-peated until the two values agreed. The computer thencalculated the power required by the condenser waterpumps and by the fan to pass the upcast air throughthe tower.
The method of calculating the performances of thevarious system components is given below.
Compressor Power Requirements
The main factors affecting the power required by acooling plant compressor are the condensing and evap-orating temperatures, which determine the pressurerange over which the compressor has to operate, theduty, which determines the flow rate of refrigerant inthe circuit, and the compressor efficiency.
Compressor power requirements were determined byanalysing the performance on an ideal cooling cycle usingthe pressure enthalpy diagram. It was assumed that nosub cooling of the condensed liquid took place in thecondenser, that no superheating of the vapour occurredin the evaporator, and that there were no pressure lossesin the circuit. Performance figures were determined for
JOURNAL OF THE SOUTH AFRICAN INSTITUTE OF MINING AND METALLURGY DECEMBER 1971 139

)..u 0,25~Iij-..U....
~~)(
00,20
-.......
~~\b
~....
""I:) 0,/5I:)vI:).....
~~I:)
0,10q,
....;:)
0,35
REFRIGERANT 11
0,30
0~05
Sin9/e .stoge compression
II
- - Two stoge compress/on with In~ercool/179
040 60 65 705045 55
CONDENSING TEMPERATURE
Fig. 1
'c
a single-stage machine using both refrigerants 11 and12, and for a two-stage machine with intercooler usingrefrigerant 11.
In the analysis of the operation of a single-stagemachine the compressor efficiency only affects the stateof the refrigerant leaving the compressor, and can beallowed for by dividing the input power to cooling ratiofor the ideal compressor by the actual compressor effic-iency. The same does not apply in a two-stage machinewith intercooler, for here the efficiency of the first com-pressor stage affects the state of the refrigerant entering
the second stage. Fig. 1 shows the results obtained forrefrigerant 11. The benefits of intercooling, and thesmall effect which compressor efficiency has upon theproduct of the input power to cooling ratio and thecompressor efficiency can be seen.
Fig. 2 compares the performance of refrigerant 11in both single-and two-stage machines with the perfor-mance of a single-stage machine using refrigerant 12.The power to cooling ratio for the Carnot cycle is alsoshown. It is obvious that from this particular point ofview refrigerant 11 is a more suitable refrigerant than
140 DECEMBER 1971 JOURNAL OF THE SOUTH AFRICAN INSTITUTE OF MINING AND METALLURGY

EVAPORATING TEMP. 5".C0,.15
)..u~~
0,30U
~~)(
Cj::: O,25
~~~~.........0
8 0,20
0....
~~~0Q.
0,15
'::)
~....
0,'040 45 50
CONDENSING
refrigerant 12, particularly at high condensing tem-peratures.
For use in the final computer programme a simplequadratic equation was fitted to the calculated resultsfor a two-stage machine with intercooling using re-frigerant H. A compressor efficiency of 80% was assumedand the evaporating temperature was taken as 5 °C.
Heal, Transfer in the CondensorHeat transfer in the condenser of the cooling plant
can be determined from the following three equations:q = UiAi l:::J1
55 60
TEMPERATURE.: 'c
Fig. 2
65 10
h -5680 (1+0,015 tm) VD,8
i - dD,2
The water velocity in the tubes depends upon the waterflow rate, the total number of tubes, the tube diameterand the number of passes used in the condenser, andcan easily be calculated once these factors are known.
The fouling factor (h~) makes allowance for the build
up of scale and dirt on the inside surface of the tubes.There has been very little published work on the buildof scale in condensers operating underground, but thefollowing figures would seem to be reasonable
Clean 0,0001 m2 °CjWDirty 0,0002 "Very Dirty 0,0005
~ ~ + ~ +x
+ ~ The term dealing with conduction through the tubesUiAi hiAi hfAi kAm hoAo is straightforward and does in fact have very little
Once the overall heat transfer coefficient Ui has been effect upon the overall heat transfer coefficient, but hascalculated from the third equation, the condensing nevertheless been included. The value used for thetemperature te can be obtained in terms of the inlet outside heat transfer coefficient was taken as 1 400and outlet water temperatures ti and to by manipulation Wjm2 °C, and was assumed to be constant.of the first two equations. The one variable for which no value has as yet been
The inside heat transfer coefficient hi depends upon assigned is the number of water passes in the condenser.the water velocity in the tubes, the mean water tem- The effect of increasing the number of passes is to in-perature, and the inside diameter of the tubes. McAdams1 crease the water velocity in the tubes. This results in anhas given the following equation to calculate hi. ...Limprovement in the overall heat transfer coefficient
to - til:::.t1 -
Inte-tt
te-to
JOURNAL OF THE SOUTH AFRICAN INSTITUTE OF MINING AND METALLURGY DECEMBER 1971 t4t
'q,
'q,
'q, x
'q,'q,x
xo.X
V .0, X
000X
0 . 0 Harmony South
~~Xr-v X Harmony North
.. .~ 0 W.st. De.p L..e/, 6 tleele)(4
O' X . W..t.Deep L..e/. 8 rIeel<. M- VLoraine. 3.48. 'q,Lora;". 3.500
0
I I0
(due to an increase in the inside heat transfer coefficient)which leads in turn to a reduction in the condensingtemperature, and consequently a reduction in the com-pressor power required. The pressure loss across thecondenser depends upon both the number of passes andthe water velocity, and has the following formp=CNvaThus increasing the number of passes, while leading to
a reduction in compressor power consumption, causes anincrease in pump power consumption and the optimumnumber of passes occurs when the sum of compressorpower and that portion of the pump power required topass water through the condenser is a minimum. Thecomputer programme was arranged so as to select thenumber of passes which led to the minimum powerconsumption.
The numerical values chosen for the condenser aregiven below and were taken from manufacturer's speci-fications for a particular cooling plant, and manu-facturer's test data was used to obtain values for thepressure loss coefficients C and a, and, the outside heattransfer coefficient ho. With these sizes approximatelyfour hundred condenser tubes are required per 1000kW of cooling.
Tube internal diasurface area per tube:
insidemeanoutside
tube wall thicknesstube conductivity
(90flO cupronickel)outside heat transfer
coefficientpressure loss per pass
d= 13,9 mm
Ai=0,216 m2Am=0,231 m2Ao=0,784 m2x=lmm
k=44 W fm °C
ho=1400 Wfm2 °CP=60 VI,7 mbar
Cooling Tower Performance
Two papers have been published giving details ofmethods of calculating cooling tower performance whensuch variables as air and water flow rates, air velocityand tower height are known.
The first of these papers was by Whillier2, and hereinformation is initially required on the amount of heatto be transferred in the tower, the quantity and tem-perature of the air entering the tower, the air velocityin the tower and the water flow rate. Once these areknown an iterative procedure is used to determine thetemperature of the water leaving the tower. An exactmethod was used to calculate the reference water to airratio. This method assumed that make-up water wasadded to the system at the temperature of the waterleaving the tower and that the air leaving the tower wassaturated. A fixed tower height of 17 m was used and itwas assumed that three screens were installed in thetower.
The second paper describes tests on a cooling towerat City Deep3, and here values of the air quantity andvelocity through the tower, the water flow rate andamount of heat to be transferred in the tower, and theheight of the tower, lead directly to the difference be-tween the enthalpy of saturated air at the temperatureof the water leaving the tower and the enthalpy of the
air entering the tower. Once this enthalpy difference isknown it is possible to calculate the temperature of thewater leaving the tower. Unfortunately the series oftests used to obtain the performance equation did notinclude tests at low air flow rates and high water flowrates, and under these conditions the equation leads tothe entering water temperature being lower than thewet bulb temperature of the air leaving the tower. Thisis obviously impossible, and when it occurred it wasassumed that the water entered the tower at the sametemperature as the air leaves the tower. This assumptionis most probably incorrect and will result in some under-estimation of the water temperatures.
In all cases the water pressure at the spray nozzleswas assumed to be 0,5 bar.
Air Pressure Loss through the Tower
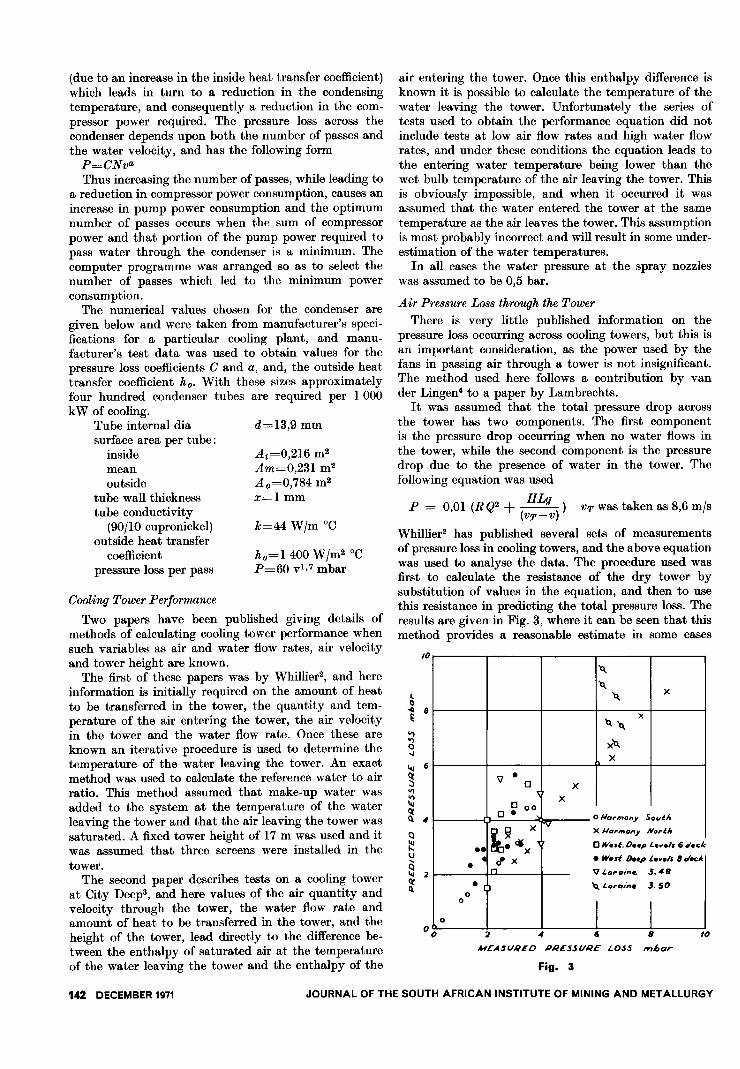
There is very little published information on thepressure loss occurring across cooling towers, but this isan important consideration, as the power used by thefans in passing air through a tower is not insignificant.The method used here follows a contribution by vandel' Lingen4 to a paper by Lambrechts.
It was assumed that the total pressure drop acrossthe tower has two components. The first componentis the pressure drop occurring when no water flows inthe tower, while the second component is the pressuredrop due to the presence of water in the tower. Thefollowing equation was used
P = 0,01 (R Q2 + (HLg
)) VT was taken as 8,6 mfs
VT-V
Whillier2 has published several sets of measurementsof pressure loss in cooling towers, and the above equationwas used to analyse the data. The procedure used wasfirst to calculate the resistance of the dry tower bysubstitution of values in the equation, and then to usethis resistance in predicting the total pressure loss. Theresults are given in Fig. 3, where it can be seen that thismethod provides a reasonable estimate in some cases
10
l-II~ 8
'"")0-.jI<j 6§11\
~ClCl. 4
~~\JQ... 2~It
00 2 4 6 8
MEASVRED PRE.s.sVRE LOSS ",bar'0
142 DECEMBER 1971 JOURNAL OF THE SOUTH AFRICAN INSTITUTE OF MINING AND METALLURGY
Fig. 3
only. This is one aspect of cooling tower operation whichshould receive more attention, particularly as the pres-sure loss across a tower could be expected to yield someinformation on the distribution of air and water withinthe tower.
In the final computer programme the pressure losscomponent for the dry tower (R Q2) was ignored.
GENERAL
The final computer programmes involved puttingtogether the various component parts mentioned above,together with a set of standard psychrometric equations.In these equations the vapour pressure was calculatedfrom the equation given by Goff and Gratch5, which wasmentioned in a recent paper by Salamon6.
Two programmes were prepared, one using the towerperformance equation proposed by Whillier and thesecond using the tower performance equation developedfrom the City Deep tower.
The following input was required
Condenser
Number of tubes, fouling factor and water flow rate
UpCW3tAir
Quantity, wet and dry bulb temperatures, barometricpressure
Cooling Tower
Air velocity, height (constant for the Whillier equa-tions, but variable for the City Deep equations),screen factor (Whillier equations only.)
Efficiencies
Compressor efficiency, overall pump efficiency, over-all fan efficiency, and compressor motor efficiency.In using the two programmes most of the above
factors were taken to be constant, the only variablesbeing air quantity, air velocity, water flow rate andheight (City Deep equations only.)
The factors taken as constant were given the followingvalues:
Condenser
Number of tubes
fouling factor
4000,0003 m2 °C/W
Upcast Air
Wet bulb temperatureDry bulb temperatureBarometric pressure
33°C
38°C1 200 mbar
Cooling Tower (Whillier equations only)
H~M 17mScreen factor 1,02
Efficiencies
CompressorPumpFanCompressor motor
80%70%75%95%
A cooling duty of 1 000 kW was used.
DETERMINATION OF OPTIMUM CONDITIONS
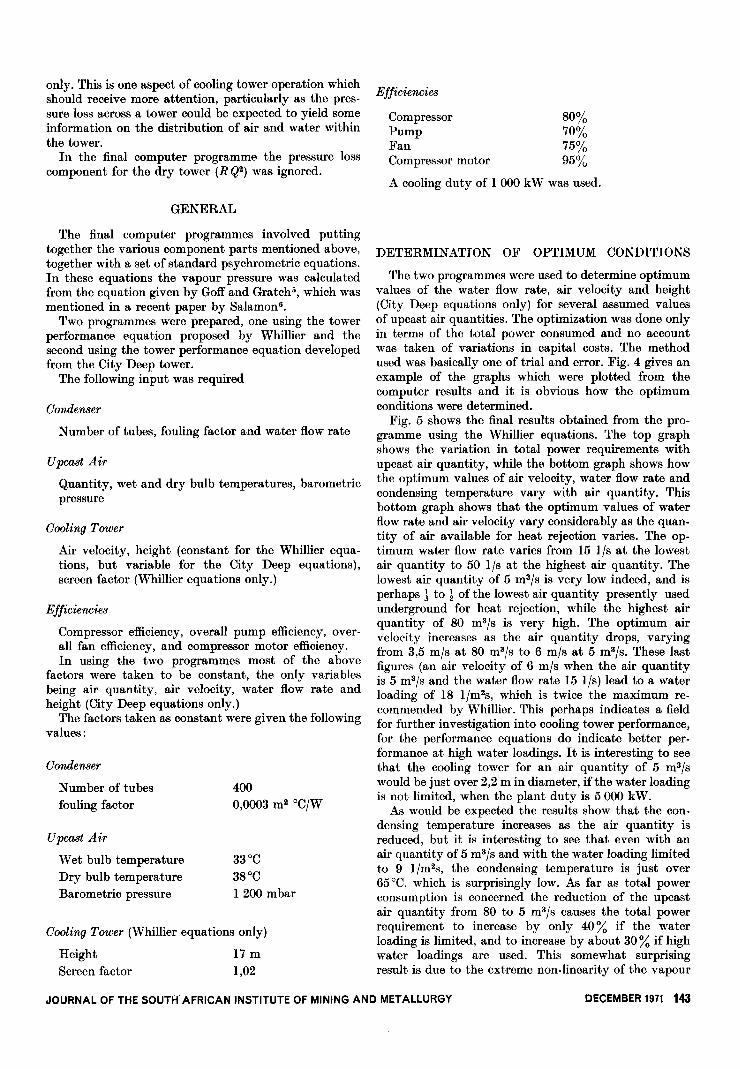
The two programmes were used to determine optimumvalues of the water flow rate, air velocity and height(City Deep equations only) for several assumed valuesof upcast air quantities. The optimization was done onlyin terms of the total power consumed and no accountwas taken of variations in capital costs. The methodused was basically one of trial and error. Fig. 4 gives anexample of thf'. graphs which were plotted from thecomputer results and it is obvious how the optimumconditions were determined.
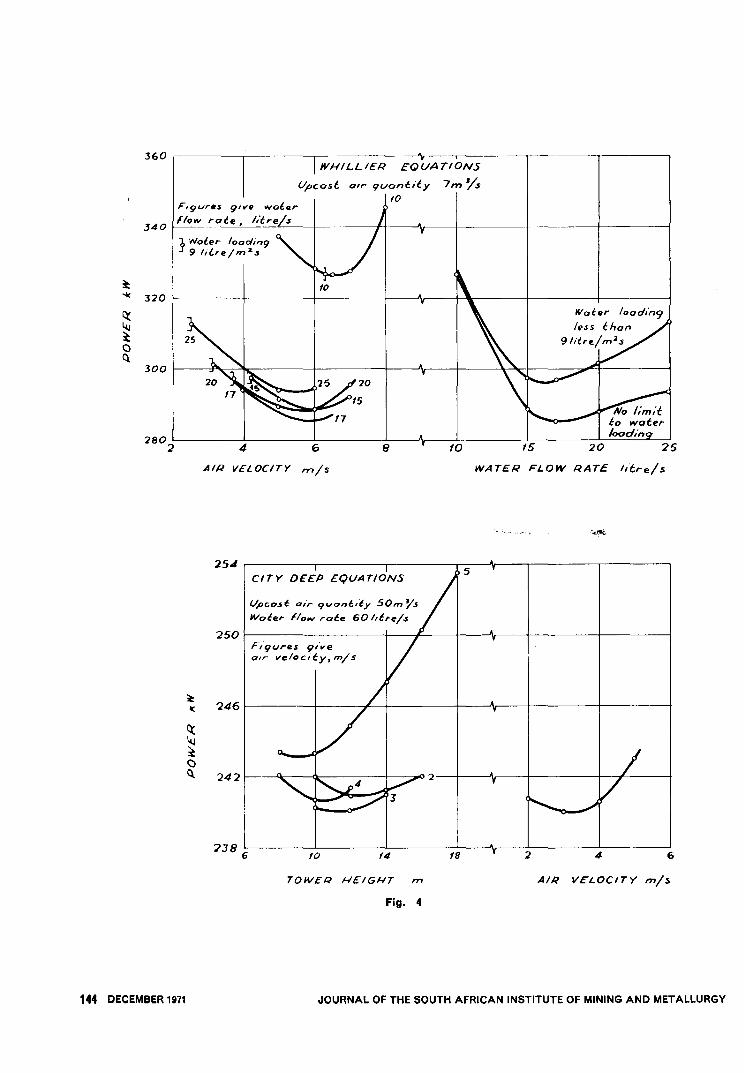
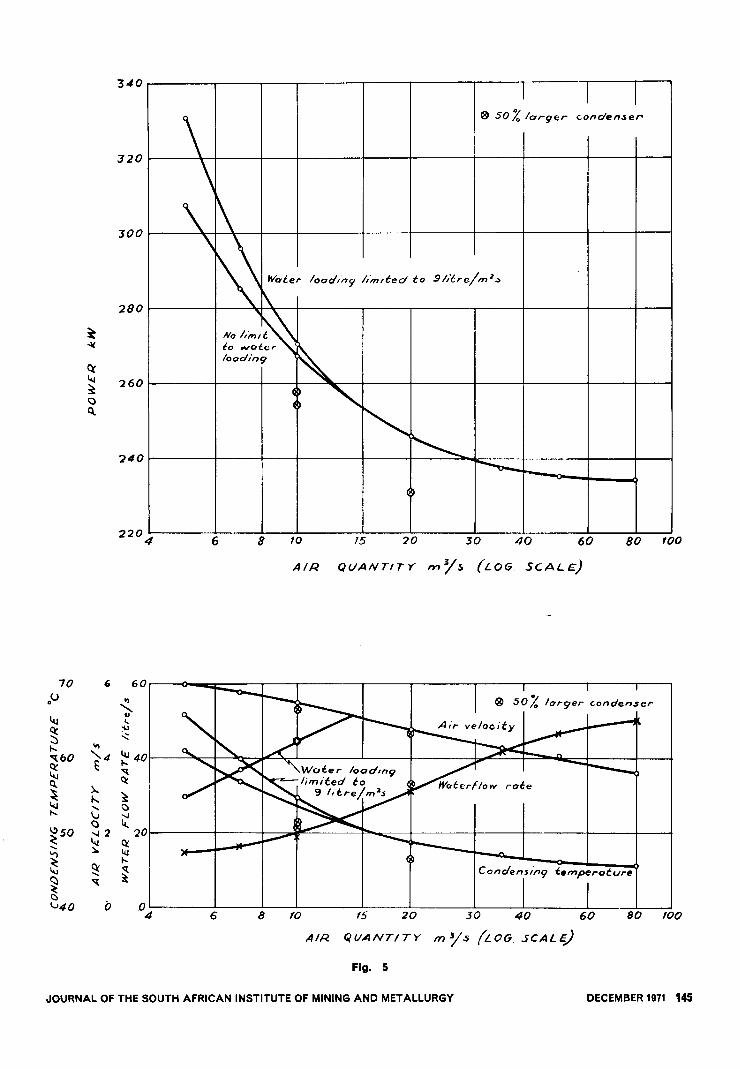
Fig. 5 shows the final results obtained from the pro-gramme using the Whillier equations. The top graphshows the variation in total power requirements withupcast air quantity, while the bottom graph shows howthe optimum values of air velocity, water flow rate andcondensing temperature vary with air quantity. Thisbottom graph shows that the optimum values of waterflow rate and air velocity vary considerably as the quan-tity of air available for heat rejection varies. The op-timum water flow rate varies from 15 lis at the lowestair quantity to 50 lis at the highest air quantity. Thelowest air quantity of 5 m3/s is very low indeed, and isperhaps t to t of the lowest air quantity presently usedunderground for heat rejection, while the highest airquantity of 80 m3/s is very high. The optimum airvelority increases as the air quantity drops, varyingfrom 3,5 mls at 80 m3/s to 6 mls at 5 m3/s. These lastfigures (an air velocity of 6 mls when the air quantityis 5 m3/s and the water flow rate 15 lis) lead to a waterloading of 18 I/m2s, which is twice the maximum re-commended by Whillier. This perhaps indicates a fieldfor further investigation into cooling tower performance,for the performance equations do indicate better per-formance at high water loadings. It is interesting to seethat the cooling tower for an air quantity of 5 m3/swould be just over 2,2 m in diameter, if the water loadingis not limited, when the plant duty is 5000 kW.
As would be expected the results show that the con-densing temperature increases as the air quantity isreduced, but it is interesting to see that even with anair quantity of 5 m3/s and with the water loading limitedto 9 I/m2s, the condensing temperature is just over65°C, which is surprisingly low. As far as total powerconsumption is concerned the reduction of the upcastair quantity from 80 to 5 m3/s causes the total powerrequirement to increase by only 40 % if the waterloading is limited, and to increase by about 30 % if highwater loadings are used. This somewhat surprisingresult is due to the extreme non-linearity of the vapour
JOURNAL OF THE SOUTH AFRICAN INSTITUTE OF MINING AND METALLURGY DECEMBER 1971 143
~~3:20
~~~0
C).
300
144 DECEMBER 1971
360 l WHILLIER EO"UATION5
Upcast air guan/.d.y 7rn ~sfO
FI9vres 9""e wol.erflow role. I,'lre s
340
JWol.er laoc:Jin99 !,forelm"-s
fO
Water laad/n9
tu s (;har>9 litre./ m~.s
7802 fO '5
No limit1:0 wotel'load;n
20 254 6 8
AIR VELOCITY m/s WATER FLOW RATE l/tre/s
.<~
2545
CITY DEEP EQUATIONS
250
UpGas(; 0;1' gvantlly 50"., YsWale,. flaw ra/.e 60 IIt,.e/o$
FIgvres g"",eall' velocity, m/oS
~IIC 246
~~~0C\. 242 2
7386 2 4 6fO 14 f8
TOWER HEIGHT AIR VELOCITY rn/5m
Fig. 4
JOURNAL OF THE SOUTH AFRICAN INSTITUTE OF MINING AND METALLURGY
280
~4C
~I<j
260~0q,
240
70oV
340
:120
JOO
2204
6 60
0 50 % lorger conden~e,..
Water looa'Jn9 I/mlted to 911tre/n?:I.:.
6 8 20 6010 IS 40 80 100
~Q::::>
t--<o:{60
Q:
I.<Jq,
~I.iJ
"
.,
";;-
...
't.I:.:::
30
...,
"4 I.u 40E'"<0:{
Q:
~\)-..j
~20
Q:IjJ
'"
~
)...
""1...1\)
"2~~
~'"
~50~......
"'I
~
~C)(..)40 b
AIR Q(/ANTITY f7')~.s (LOG SCALE)
04 6 8 to
AIR
15 20 30 40 60
QVANTITY m Y.s (LOG. .sCALE)
80 100
Fig. 5
JOURNAL OF THE SOUTH AFRICAN INSTITUTE OF MINING AND METALLURGY DECEMBER 1971 145
u0
Q.
~~...
IDt5
~"-11)
<
~~Q
\.)0
<"-l<J\!)
~~\.)-5
4
1>ressure-temperature relationship for water. The extentof this non-linearity is perhaps not fully appreciated.Table I gives the increase in sigma heat of saturatedair for temperature changes of 1°C at various tem-peratures.
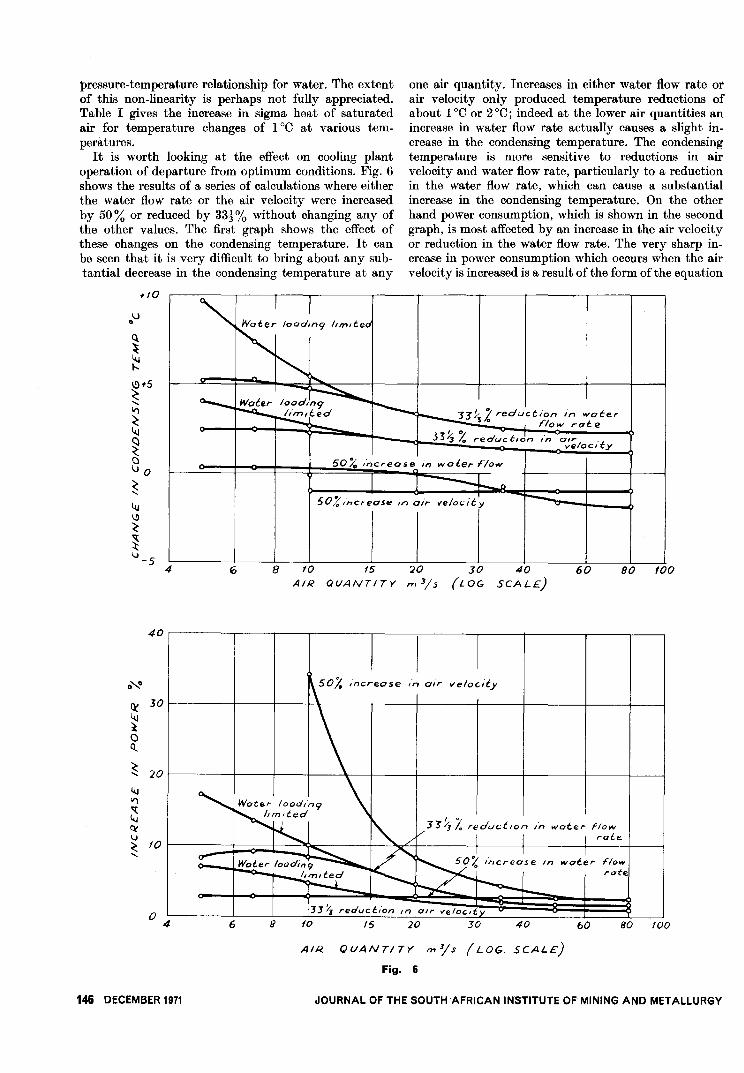
It is worth looking at the effect on cooling plantoperation of departure from optimum conditions. Fig. 6shows the results of a series of calculations where eitherthe water flow rate or the air velocity were increasedby 50% or reduced by 33-1% without changing any ofthe other values. The first graph shows the effect ofthese changes on the condensing temperature. It canbe seen that it is very difficult to bring about any sub-tantial decrease in the condensing temperature at any
.,,0
one air quantity. Increases in either water flow rate otair velocity only produced temperature reductions ofabout 1°C or 2°C; indeed at the lower air quantities anincrease in water flow rate actually causes a slight in-crease in the condensing temperature. The condensingtemperature is more sensitive to reductions in airvelocity and water flow rate, particularly to a reductionin the water flow rate, which can cause a substantialincrease in the condensing temperature. On the otherhand power consumption, which is shown in the secondgraph, is most affected by an increase in the air velocityor reduction in the water flow rate. The very sharp in-crease in power consumption which occurs when the airvelocity is increased is a result of the form ofthe equation
40
0' °
~ 30~~0Q.
~ 20
I<J")
"l..J~\.)
~ fO
"-
04
146 DECEMBER 1971
JJ5: 2'reduction in water
5 flow rat e
3J~ 1..0 reduction ina~:;locity
6 8 80 fOOto 15 '20AIR QUANTITY 171 3/5
30 40(LOG SCALE)
60
In air velocity
6 B 4015 20 30 60 80 100
AIR QUANTI TY
Fig. 6
m'l's (LOG, SCALE)
JOURNAL OF THE SOUTH 'AFRICAN INSTITUTE OF MINING AND METALLURGY
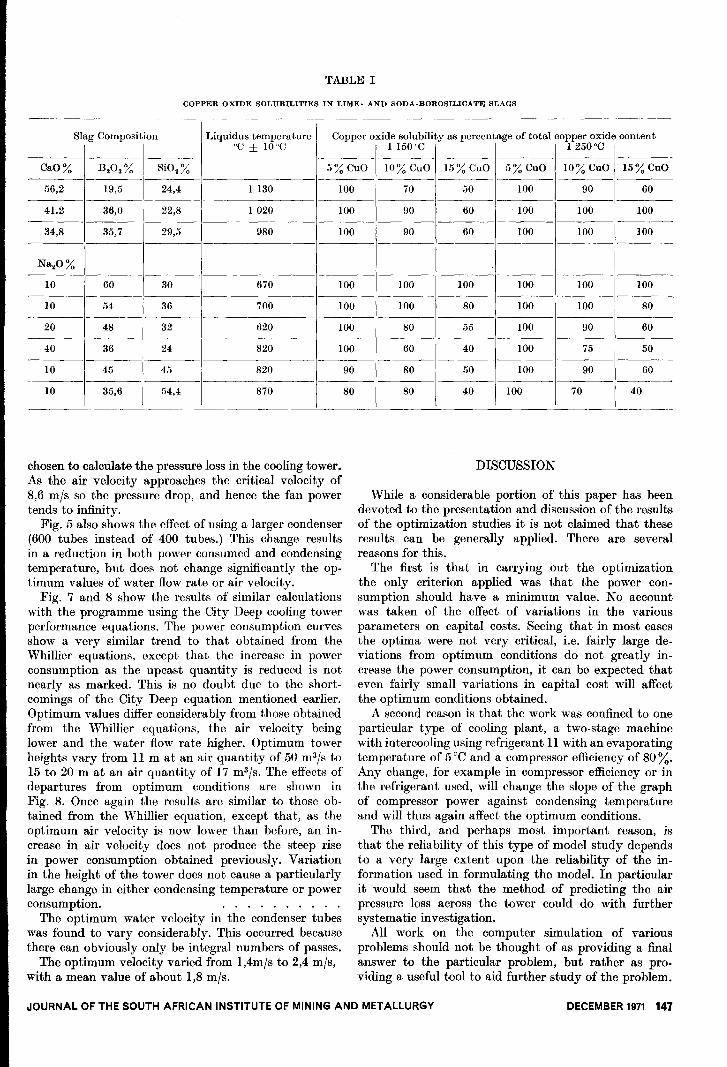
Slag Composition Liquidus temperature Copper oxide solubili°C::!:: 10°C 1 150 °C
CaO% B.O. % SiO.% 5 % QuO 10% QuO
56,2 19,5 24,4 1130 100 70
41.2 36,0 22,8 1020 100 90
34,8 35,7 29,5 980 100 90
Na.O%
10 60 30 670 100 100
10 54 36 700 100 100
20 48-1--
620 100 8032
40 36 24 820 100 60
10 45 45 820 90 80
10 35,6 54,4 870 80 80
I 250 'C
15 %QuO 5 %QuO 10 %QuO 15 %QuO
50 100 90 60
60 - 100 100 100
60 100 100 100
100 100 100 100
80 100 100 80
55 100 90 60
40 100 75 50
50 100 90 60
40 100 70 40
TABLE I
ty as percentage of total copper oxide content- -- -~--
COPPER OXIDE SOLUBILITIES IN LIME- AND SODA-BOROSILICATE SLAGS
---
chosen to calculate the pressure loss in the cooling tower.As the air velocity approaches the critical velocity of8,6 m/s so the pressure drop, and hence the fan powertends to infinity.
Fig. 5 also shows the cffect of using a larger condenser(600 tubes instead of 400 tubes.) This change resultsin a reduction in both power consumed and condensingtemperature, but does not change significantly the op-timum values of water flow rate or air velocity.
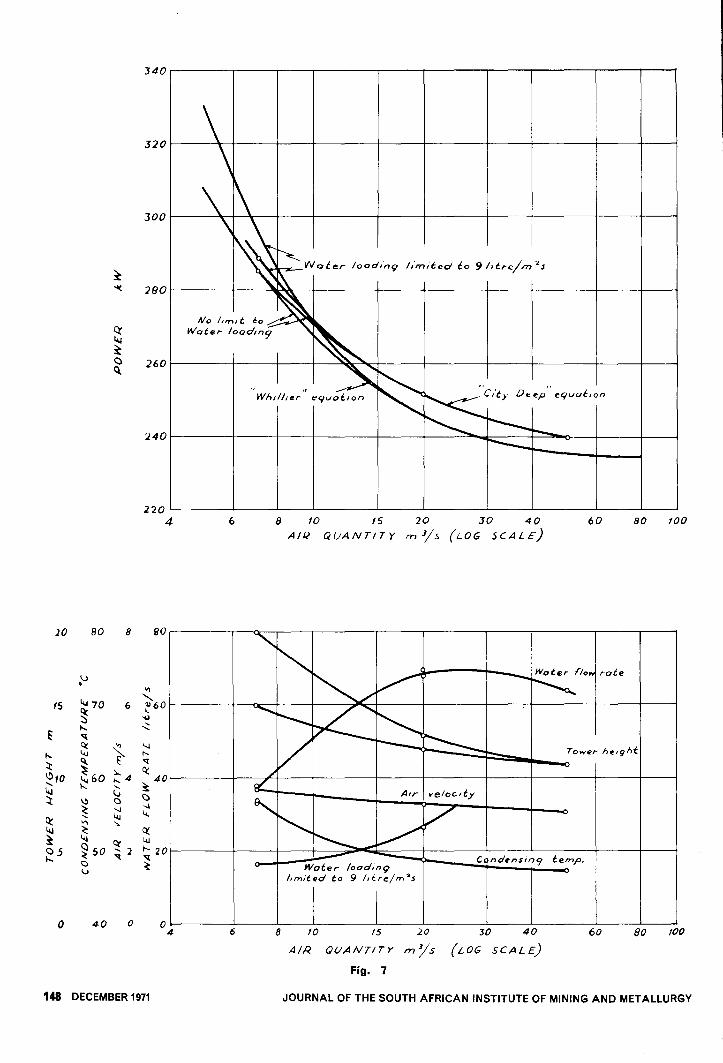
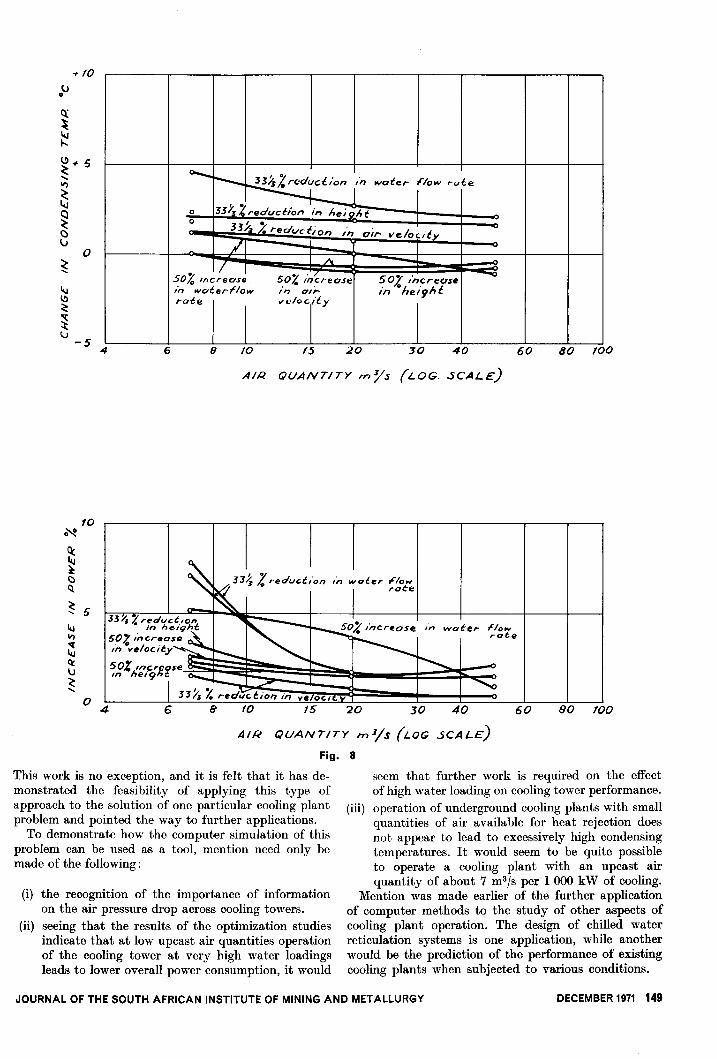
Fig. 7 and 8 show the results of similar calculationswith the programme using the City Deep cooling towerperformance equations. The power consumption curvesshow a very similar trend to that obtained from theWhillier equations, except that the increase in powerconsumption as the upcast quantity is reduced is notnearly as marked. This is no doubt due to the short-comings of the City Deep equation mentioned earlier.Optimum values differ considerably from those obtainedfrom the Whillier equations, the air velocity beinglower and the water flow rate higher. Optimum towerheights vary from 11 m at an air quantity of 50 m3/s to15 to 20 m at an air quantity of 17 m3/s. The effects ofdepartures from optimum conditions are shown inFig. 8. Once again the results are similar to those ob-tained from the Whillier equation, except that, as theoptimum air velocity is now lower than before, an in-crease in air velocity does not produce the steep risein power consumption obtained previously. Variationin the height of the tower does not cause a particularlylarge change in either condensing temperature or powerconsumption. . . . . . . . . . .
The optimum water velocity in the condenser tubeswas found to vary considerably. This occurred becausethere can obviously only be integral numbers of passes.
The optimum velocity varied from 1,4m/s to 2,4 m/s,with a mean value of about 1,8 m/so
-----
DISCUSSION
While a considerable portion of this paper has beendevoted to the presentation and discussion of the resultsof the optimization studies it is not claimed that theseresults can be generally applied. There are severalreasons for this.
The first is that in carrying out the optimizationthe only criterion applied was that the power con-sumption should have a minimum value. No accountwas taken of the effect of variations in the variousparameters on capital costs. Seeing that in most casesthe optima were not very critical, i.e. fairly large de-viations from optimum conditions do not greatly in-crease the power consumption, it can be expected thateven fairly small variations in capital cost will affectthe optimum conditions obtained.
A second reason is that the work was confined to oneparticular type of cooling plant, a two-stage machinewith intercooling using refrigerant 11 with an evaporatingtemperature of 5 DCand a compressor efficiency of 80 %.Any change, for example in compressor efficiency or inthe refrigerant used, will change the slope of the graphof compressor power against condensing temperatureand will thus again affect the optimum conditions.
The third, and perhaps most important reason, isthat the reliability of this type of model study dependsto a very large extent upon the reliability of the in-formation used in formulating the model. In particularit would seem that the method of predicting the airpressure loss across the tower could do with furthersystematic investigation.
All work on the computer simulation of variousproblems should not be thought of as providing a finalanswer to the particular problem, but rather as pro-viding a useful tool to aid further study of the problem.
JOURNAL OF THE SOUTH AFRICAN INSTITUTE OF MINING AND METALLURGY DECEMBER 1971 147
~~280
~t.u
~Cl260
10 BD 8 80
\J. "I'-.J70
.........15 6 ~60
~...."
..:::E
~~~l<J
"l<J "::t et E "'!§60 ~4~~10 40
~\,J \., C):t ~Cl -.j
~'-J 4.~.... l.ij
'":0,.
\,J ~et:~'<I l<J
::5 ~50 ~2 t-- 20~C)~'"
rI
340
320
300
240
2204
0 040
148 DECEMBER 1971
Water loadi"9 limited to 9 Ittl"e/rn '.1
c/ty Deep eqvat/on
6 8 to 15 20 30 40AIR QUANTITY rnJ/5 (LOG SCALE)
60
Towel" height
Water load,n9limited to 9 Idl"e/m~s
C ndensif?9 temp.
04 2010
AIR QUANTITY m.ys
Fig. 7
30 40
(LOG SCALE)
606 8 15
80 100
80 100
JOURNAL OF THE SOUTH AFRICAN INSTITUTE OF MINING AND METALLURGY
--
~--"'~'on (17 ,."ate,. t:'low rate
0 3J~l.reducl:ion in h.it;//,t I
0:n;" /: reduction In air ve/ocdy/ I
~A.
~~o70Increase ~oZ If/crease 502: Increase "In waterFlow In air in °hei9htrate veloc 'ty
+ 10
U0
~~~~
~+5~......
11')
~Cl~ClV
~".I~~
~v -5
4
10N
0
6 8 15
AIR QUANTITY m}ls (LOG, .5CALE)
10
Q:Iy~Cl~
~ 51u11)"{~~\J~......
33;1J Z reductionIn height.
SO! ,"ncreasQIn "velocity
50Z Ir1creoseIn hei9ht
JJ1J ~reductiol1 in ye OCI
6 8 ID 15 20 30
AIR QUANTITY IT) lis (LOG
Fig. 8
This work is no exception, and it is felt that it has de-monstrated the feasibility of applying this type ofapproach to the solution of one particular cooling plantproblem and pointed the way to further applications.
To demonstrate how the computer simulation of thisproblem can be used as a tool, mention need only bemade of the following:
04
(i) the recognition of the importance of informationon the air pressure drop across cooling towers.
(ii) seeing that the results of the optimization studiesindicate that at low up cast air quantities operationof the cooling tower at very high water loadingsleads to lower overall power consumption, it would
20 30 80 10040 60
flowrate
40
.sCA LE)
80 10060
seem that further work is required on the effectof high water loading on cooling tower performance.
(iii) operation of underground cooling plants with smallquantities of air available for heat rejection doesnot appear to lead to excessively high condensingtemperatures. It would seem to be quite possibleto operate a cooling plant with an upcast airquantity of about 7 m3fs per 1 000 kW of cooling.
Mention was made earlier of the further applicationof computer methods to the study of other aspects ofcooling plant operation. The design of chilled waterreticulation systems is one application, while anotherwould be the prediction of the performance of existingcooling plants when subjected to various conditions.
JOURNAL OF THE SOUTH AFRICAN INSTITUTE OF MINING AND METALLURGY DECEMBER 1971 149

AiAmAoacdgHhihihokLNPQqRtcti
SYMBOLS AND UNITS USED
inside tube area (m2)mean tube area (m2)outside tube area (m2)constantconstantinside tube diameter (mm)acceleration due to gravity (9,81 m/s2)tower height (m)reciprocal of the fouling factor (W /m2 DC)inside heat transfer coefficient (W/m2 DC)outside heat transfer coefficient (W /m DC)tube conductivity (W/m DC)water loading (l/m2s)number of condenser passespressure loss (mbar)air quantity (m3/s)heat transfer rate (W)resistance (Ns2/m8)condensing temperature (DC)inlet water temperature (DC)
150 DECEMBER 1971
tm
toUivvTX
L::-J1
mean water temperature (DC)delivery water temperature (OC)overall heat transfer coefficient (W /m2 °C)water, air velocity (m/s)terminal velocity (m/s)tube wall thickness (m)logarithmic mean temperature difference (OC)
REFERENCES
1 McADAMS, W. H.; 'Heat Transmission' McGraw-Hill 19543rd Edition.
2 WRILLIER, A.; 'A design code for cooling towers' J.S. Afr. Inst.Min. Metall. to be published.
3 HEMP, R.; 'The performance of a spray -filled counterflowcooling tower' J. M. V.S. of S.A. Vol 20, No 8, August, 1967.
4 VANDER LINGEN, T. W.; Contributions to 'The value of waterdrainage in upcast mine shafts and fan drifts' by J. de V.Lambrechts, J. Chem. Met. Min. Soc. of S.A. March, 1956.Contribution published August, 1956.
5 GOFF, J. A. and GRATCR, S.; 'Low pressure properties of waterin the range - 160 to 212 F' ASHVE Transactions Vol 52,1946.
6 SALAMON,A.; 'A vapour pressure table in SI units' J. M. V.S.of S.A. Vol 24, No 3, March 1971.
JOURNAL OF THE SOUTH AFRICAN INSTITUTE OF MINING AND METALLURGY