Embed Size (px)
Citation preview
Annual Report & Accounts 2012 1
Somero Enterprises, Inc. Annual Report & Accounts 2012
Table of Contents
2 Who We Are
3 Business and Financial Highlights
4 Chairman’s Statement
6 President and Chief Executive Officer’s Statement
8 Financial Review
12 Board of Directors
14 Directors’ Report
21 Corporate Governance
27 Directors’ Remuneration Report
30 Independent Auditors’ Report
31 Consolidated Balance Sheets
32 Consolidated Statements of Operations
33 Consolidated Statements of Changes in Stockholders’ Equity
34 Consolidated Statements of Cash Flows
35 Notes to the Consolidated Financial Statements
52 Advisers and Corporate Information
53 Notice of Annual General Meeting of Stockholders
Annual Report & Accounts 2012 2
Who We Are Somero® designs, manufactures and sells equipment that automates the process of spreading and levelling large volumes of concrete for commercial flooring and other horizontal surfaces, such as paved parking lots. Somero’s innovative, proprietary products, including the large SXP®-D, CopperHead®, Mini Screed™ C, S-840 Laser Screed®, the new S-15M Laser Screed® and the new STS-11m Spreader machines that employ laser-guided technology to achieve a high level of precision. Somero’s products have been sold primarily to concrete contractors for use in non-residential construction projects in over 79 countries across every time zone around the globe. Laser Screed equipment has been specified for use in constructing warehouses, assembly plants, retail centers and in other commercial construction projects requiring extremely flat concrete floors by a variety of companies, such as Costco, Home Depot, B&Q, Daimler, various Coca-Cola bottling companies, the United States Postal Service, Lowe’s, Toys ‘R’ Us and ProLogis. Somero’s headquarters and manufacturing operations are located in Michigan, USA with executive offices in Florida, USA. It has sales and service offices in Chesterfield, England and Shanghai, China. Somero has approximately 107 employees and markets and sells its products through a direct sales force, external sales representatives and independent dealers in North America, Latin America, Europe, the Middle East, South Africa, Asia and Australia. Somero is listed on the Alternative Investment Market (AIM) of the London Stock Exchange (LSE) and its trading symbol is SOM.L.
Annual Report & Accounts 2012 3
Financial Highlights • Revenue increased by 47% to US$32.2m (2011: US$21.9m)
• Adjusted EBITDA increased by 367% to US$4.2m (2011: US$0.9m)1 2
• Pre-tax income of US$1.2m compared to a Pre-tax loss of (US$2.3m) in 2011
• Adjusted net income/(loss) before amortization of US$3.4m (2011: US$0.0m) 3
• EPS before amortization of US$0.06 (2011: US$0.00)
• Basic EPS US$0.02 (2011: (US$0.04))
• Reduced net debt to US$1.9m from US$4.6m using excess cash flow4
• Returned to dividend list with a proposed 0.8 US cent per share dividend for the period ending December 31.
Business Highlights • S-840 machine introduced in November 2011 had 2012 sales of US$7.7m.
• New S-15M mid-sized screed introduced in November 2012 had Q4 2012 sales of US$0.4m.
• Increased investment in emerging markets resulted in a 26% increase in revenue from that region.
• Escalating sales and service presence in China resulted in a 50% increase in 2012 sales over 2011.
• Russia sales increased by 363% in 2012 over 2011.
• Fully operational Chinese website enabled our Chinese customers to interact with us more effectively.
1. The Company uses non-US GAAP financial measures in order to provide supplemental information regarding the
Company’s operating performance. See further information regarding non-GAAP measures on pages 8 and 9. 2. Adjusted EBITDA as used herein is a calculation of the Company’s net income/(loss) plus tax provision, interest
expense, interest income, foreign exchange gain/(loss), other expense, depreciation, amortization, stock based compensation and the write-down of Goodwill, as applicable.
3. Adjusted net income/(loss) before amortization is a calculation of net income/(loss) plus amortization of intangibles. 4. Net Debt is defined as total borrowings under bank obligations less cash and cash equivalents.
Annual Report & Accounts 2012 4
Chairman’s Statement Overview
In a year where cautious optimism was the mantra, our exceptional 2012 results were welcomed by all who worked so diligently to achieve them. With revenues up 47% over the previous year, we were able to turn our focus towards planning for a full recovery.
This strong growth gave us confidence we had made the right level of investment in China and India to help add to the Group’s future progress. Investments in our people throughout the organization have also improved quality and productivity. We continue to adapt globally to offer superior service to our customers.
People
To achieve our strong results, we had many employees traveling extensively away from home for long periods of time. In this new growth phase of the Company, existing employees will continue to contribute extensively while we add and train new, additional staff. We believe 2013 will be a pivotal year and hope to offer career advancement opportunities. The Board thanks each one of the employees for their hard work, sacrifice, dedication and loyalty.
Markets
Our increased investment in emerging markets resulted in a 26% increase in revenue. The ramp up of sales and service staff in China resulted in a 50% increase in sales over 2011. We also invested heavily in marketing in China by adding a dedicated marketing manager and launching a new, robust website in both English and Chinese to enable our Chinese customers to interact with us more effectively.
With the completion of the legal work to open a Somero India subsidiary in 2012, we are now in a position to ramp up sales, service and marketing there. We will continue to work with our Russian representative in 2013 on sales opportunities and customer service programs.
New Product Development
The new S-840 machine released in late 2011 resulted in sales of US$7.7m. The Product Development team has been working on several upgrades to the S-840 for 2013.
In the fourth quarter, the S-15M mid-sized Laser Screed® model was introduced which resulted in Q4 2012 sales of US$0.4m. This machine was designed with simplified controls and is easy to learn. It is a fully operational screed with high production and quality values. Our target markets are customers in emerging markets who are unfamiliar with the Somero floor placement process and can be easily trained on this model and successfully place high-quality floors. The S-15M has been well received in our mature markets as well. Current customers are attracted to the smaller size and easy portability of the machine and are showing interest in adding it to their fleets.
Annual Report & Accounts 2012 5
A new topping spreader, the STS-11m was introduced in early 2013. The spreader is equipment designed to place toppings over the screeded concrete, a common practice done in Europe and other countries outside of North America. The design is a scaled down version of our STS-132 model with a lower price point. We anticipate wide acceptance of this specialty equipment worldwide.
Product development continues to be a focus of our growth plans for 2013 and we are working on new, innovative ideas to introduce to the industry.
Current Trading & Outlook
Although the US and world economies are still in a fragile recovery, we are taking steps to shape our own future and are confident in our growth projections for 2013. We are pleased that we are in a position to return to the dividend list with a 0.8 US cent per share dividend.
Larry Horsch Non-Executive Chairman
Annual Report & Accounts 2012 6
President and Chief Executive Officer’s Statement
Overview
2012 was a very successful year in a tough economic climate. Continued investment in Asia, a new product and a year-long, strong trading environment in most regions created a strong start to sustainable long-term growth. We saw sales growth in eight of 10 regions, led by North America, China, South America and Russia, with two down slightly from the previous period.
North America sales, up 78%, were driven by a mild winter. Pent up demand from building owners have translated into more work for concrete contractors. This increase in work has given contractors confidence to upgrade or purchase new products.
The new S-840 Laser Screed® model and SMP model grew from US$2.6m in 2011 to US$7.7m in 2012 for a 196% increase. Total Small line sales grew from US$6.2m in 2011 to US$10.1m in 2012 for a 63% increase and Large line sales grew from US$5.4m in 2011 to US$8.1m in 2012 for a 50% increase. Other, which includes 3D Profiler, refurbs and parts, grew from US$10.3m in 2011 to US$14.0m in 2012 for a 36% increase.
Product Development
In 2012, the product development team’s focus was on designing equipment that could be utilized in emerging markets while remaining attractive to mature market customers interested in adding to their fleets. The introduction of the S-15M Laser Screed model targeted the Asian markets but quickly gained positive attention in other regions. The simplified control system allows an operator unfamiliar with high technology screeding equipment to become productive quickly. Our newly re-designed topping spreader, the STS-11m, was introduced at our industry tradeshow, the World of Concrete in early February 2013 and was positively received by the industry.
Emerging Markets/Geographic Growth
In 2012, we made significant investments in China. Mike Niemela, our Vice President of Customer Service and CFO, several members of management and two of our Senior Customer Service Representatives spent a significant portion of the year in China working through legal issues, training our staff and customers and supporting the build-up of the operation. We completed the legal work to transition our representative office into a Somero corporate entity, enabling us to sell and invoice customers directly. This removes layers of distribution giving us more control to sell and service our customers more effectively.
Somero China opened a new warehouse, training and office facility in Shanghai on November 1, 2012. Our staff in China grew from six people to a staff of 12, including three added sales representatives, one marketing and two customer service professionals.
We also continued to make investments in India and expect to see strong growth in 2013. The incorporation of Somero India Ltd. was completed mid-year and we have begun a search for a Managing Director and a sales representative. Our distributor has made a reasonable start
Annual Report & Accounts 2012 7
developing market awareness of our products and we will continue to work with them on a regional basis.
Strong activity at our annual industry tradeshow, the World of Concrete, and increased requests for quotations indicate activity levels are increasing and make us optimistic for continued strong growth. Remaining geo/political uncertainties in some areas of the world could affect sales in some regions; however, as we approach the new year, we are confident in our projections for 2013.
We have launched programs to enhance our customers’ experience with the Company. Customer Service developed a training certification program to ensure each Somero trained customer meets our high standards of safety and operation. Operators are certified and remain in our database of certified operators. We also launched a program to identify and correct customers’ “pain points” with our processes, called the Touch Point Project. A dedicated team of employees is working to survey customers to determine what their biggest source of frustration is with the company and then the team will put together an internal program to correct the issues. This project was launched in January 2013 and we are excited to work closely with our customers to improve our performance.
We developed a new tagline, “We are passionate about your success”. This tagline will be used throughout the organization, on literature and products, to communicate to our customers the dedication our employees have to seeing their business succeed and thrive. As an organization we understand that our customers’ success will bring us success and our employees are truly “passionate” in bringing that about.
Cashflow and balance sheet
With adjusted EBITDA1 up by 367% to US$4.2m, Somero used its excess free cash over the financial year to reduce debt, leaving the Group with net debt2 of just US$1.9m as of December 31, 2012.
Dividend
Our debt reduction efforts and a new banking facility we will be entering into, give us greater borrowing flexibility, and have put us in a position to return to the dividend list in 2013 with a 0.8 US cent per share dividend.
As Somero moves into a new growth phase, we will recruit, hire and train new staff around the globe. We will count on our long-term, talented, hard-working staff to provide this training and inspiration for our new employees to work as a team, adapt to change and take on new responsibilities in order to overcome obstacles. I thank and commend every employee for their dedication and loyalty to the Company.
Jack Cooney President and Chief Executive Officer 1. Adjusted EBITDA as used herein is a calculation of the Company’s net income/(loss) plus tax provision, interest expense, interest income, foreign exchange gain/(loss), other expense, depreciation, amortization, stock based compensation and the write-down of Goodwill, as applicable. 2. Net Debt is defined as total borrowings under bank obligations less cash and cash equivalents.
Annual Report & Accounts 2012 8
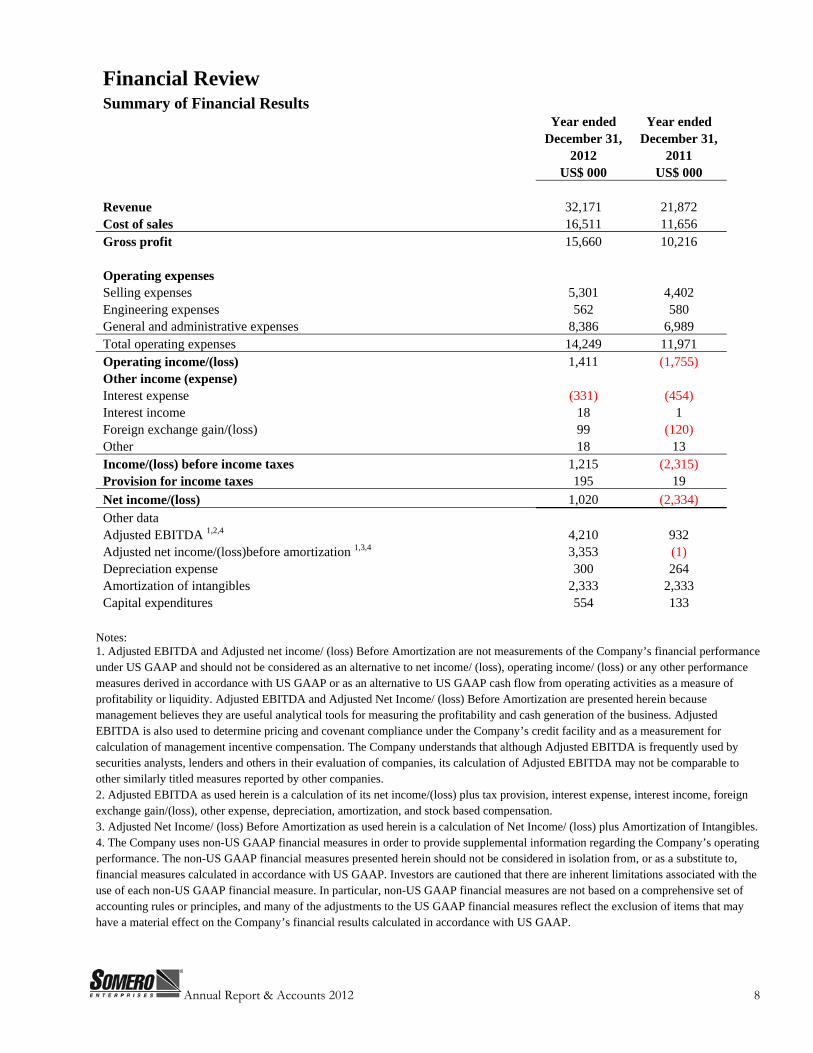
Financial Review Summary of Financial Results
Year ended Year ended December 31, December 31,
2012 2011 US$ 000 US$ 000
Revenue 32,171 21,872 Cost of sales 16,511 11,656 Gross profit 15,660 10,216
Operating expenses Selling expenses 5,301 4,402 Engineering expenses 562 580 General and administrative expenses 8,386 6,989 Total operating expenses 14,249 11,971 Operating income/(loss) 1,411 (1,755) Other income (expense) Interest expense (331) (454) Interest income 18 1 Foreign exchange gain/(loss) 99 (120) Other 18 13 Income/(loss) before income taxes 1,215 (2,315) Provision for income taxes 195 19 Net income/(loss) 1,020 (2,334) Other data Adjusted EBITDA 1,2,4 4,210 932 Adjusted net income/(loss)before amortization 1,3,4 3,353 (1) Depreciation expense 300 264 Amortization of intangibles 2,333 2,333 Capital expenditures 554 133
Notes: 1. Adjusted EBITDA and Adjusted net income/ (loss) Before Amortization are not measurements of the Company’s financial performance under US GAAP and should not be considered as an alternative to net income/ (loss), operating income/ (loss) or any other performance measures derived in accordance with US GAAP or as an alternative to US GAAP cash flow from operating activities as a measure of profitability or liquidity. Adjusted EBITDA and Adjusted Net Income/ (loss) Before Amortization are presented herein because management believes they are useful analytical tools for measuring the profitability and cash generation of the business. Adjusted EBITDA is also used to determine pricing and covenant compliance under the Company’s credit facility and as a measurement for calculation of management incentive compensation. The Company understands that although Adjusted EBITDA is frequently used by securities analysts, lenders and others in their evaluation of companies, its calculation of Adjusted EBITDA may not be comparable to other similarly titled measures reported by other companies. 2. Adjusted EBITDA as used herein is a calculation of its net income/(loss) plus tax provision, interest expense, interest income, foreign exchange gain/(loss), other expense, depreciation, amortization, and stock based compensation. 3. Adjusted Net Income/ (loss) Before Amortization as used herein is a calculation of Net Income/ (loss) plus Amortization of Intangibles.4. The Company uses non-US GAAP financial measures in order to provide supplemental information regarding the Company’s operating performance. The non-US GAAP financial measures presented herein should not be considered in isolation from, or as a substitute to, financial measures calculated in accordance with US GAAP. Investors are cautioned that there are inherent limitations associated with the use of each non-US GAAP financial measure. In particular, non-US GAAP financial measures are not based on a comprehensive set of accounting rules or principles, and many of the adjustments to the US GAAP financial measures reflect the exclusion of items that may have a material effect on the Company’s financial results calculated in accordance with US GAAP.
Annual Report & Accounts 2012 9
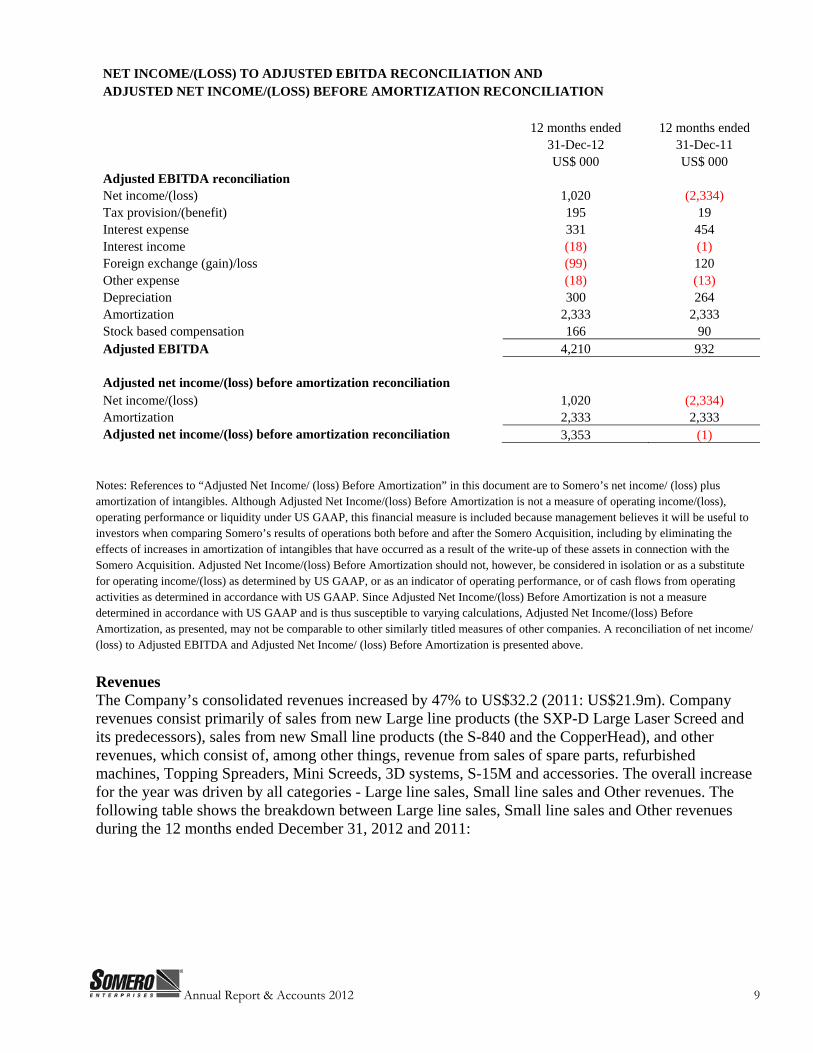
NET INCOME/(LOSS) TO ADJUSTED EBITDA RECONCILIATION AND ADJUSTED NET INCOME/(LOSS) BEFORE AMORTIZATION RECONCILIATION
12 months ended 12 months ended 31-Dec-12 31-Dec-11 US$ 000 US$ 000
Adjusted EBITDA reconciliation Net income/(loss) 1,020 (2,334) Tax provision/(benefit) 195 19 Interest expense 331 454 Interest income (18) (1) Foreign exchange (gain)/loss (99) 120 Other expense (18) (13) Depreciation 300 264 Amortization 2,333 2,333 Stock based compensation 166 90 Adjusted EBITDA 4,210 932
Adjusted net income/(loss) before amortization reconciliation Net income/(loss) 1,020 (2,334) Amortization 2,333 2,333 Adjusted net income/(loss) before amortization reconciliation 3,353 (1)
Notes: References to “Adjusted Net Income/ (loss) Before Amortization” in this document are to Somero’s net income/ (loss) plus amortization of intangibles. Although Adjusted Net Income/(loss) Before Amortization is not a measure of operating income/(loss), operating performance or liquidity under US GAAP, this financial measure is included because management believes it will be useful to investors when comparing Somero’s results of operations both before and after the Somero Acquisition, including by eliminating the effects of increases in amortization of intangibles that have occurred as a result of the write-up of these assets in connection with the Somero Acquisition. Adjusted Net Income/(loss) Before Amortization should not, however, be considered in isolation or as a substitute for operating income/(loss) as determined by US GAAP, or as an indicator of operating performance, or of cash flows from operating activities as determined in accordance with US GAAP. Since Adjusted Net Income/(loss) Before Amortization is not a measure determined in accordance with US GAAP and is thus susceptible to varying calculations, Adjusted Net Income/(loss) Before Amortization, as presented, may not be comparable to other similarly titled measures of other companies. A reconciliation of net income/ (loss) to Adjusted EBITDA and Adjusted Net Income/ (loss) Before Amortization is presented above.
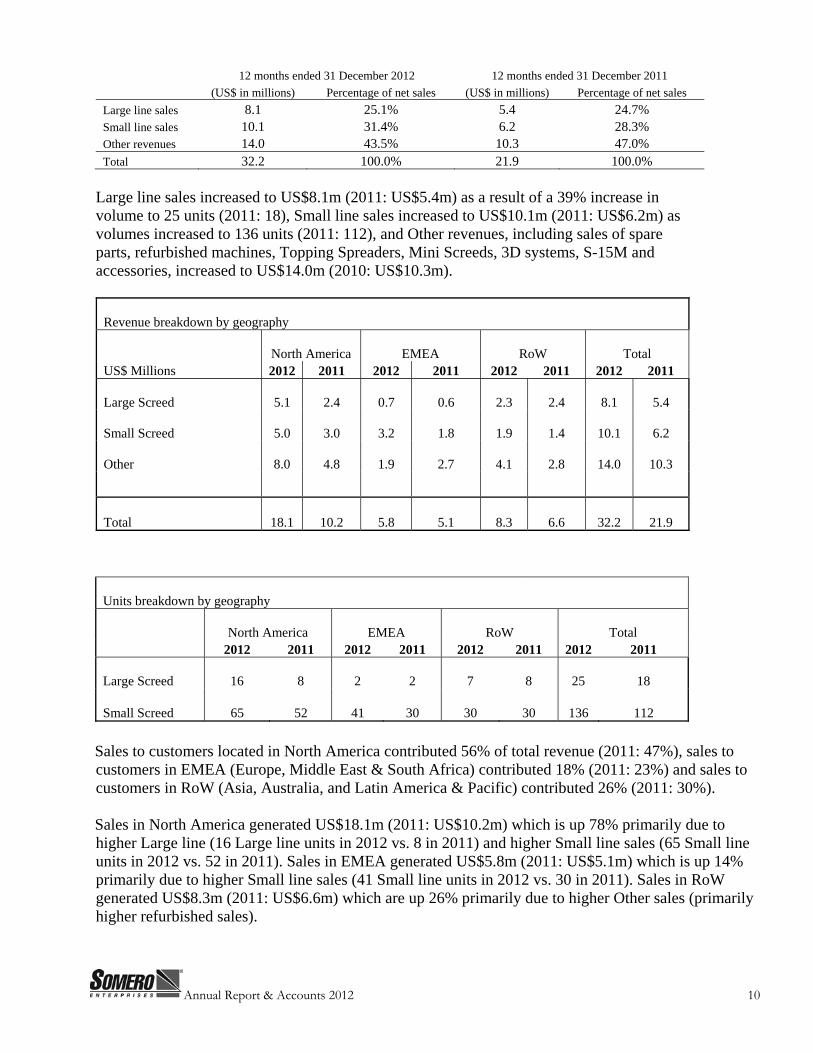
Revenues The Company’s consolidated revenues increased by 47% to US$32.2 (2011: US$21.9m). Company revenues consist primarily of sales from new Large line products (the SXP-D Large Laser Screed and its predecessors), sales from new Small line products (the S-840 and the CopperHead), and other revenues, which consist of, among other things, revenue from sales of spare parts, refurbished machines, Topping Spreaders, Mini Screeds, 3D systems, S-15M and accessories. The overall increase for the year was driven by all categories - Large line sales, Small line sales and Other revenues. The following table shows the breakdown between Large line sales, Small line sales and Other revenues during the 12 months ended December 31, 2012 and 2011:
Annual Report & Accounts 2012 10
12 months ended 31 December 2012 12 months ended 31 December 2011 (US$ in millions) Percentage of net sales (US$ in millions) Percentage of net sales
Large line sales 8.1 25.1% 5.4 24.7% Small line sales 10.1 31.4% 6.2 28.3% Other revenues 14.0 43.5% 10.3 47.0% Total 32.2 100.0% 21.9 100.0%
Large line sales increased to US$8.1m (2011: US$5.4m) as a result of a 39% increase in volume to 25 units (2011: 18), Small line sales increased to US$10.1m (2011: US$6.2m) as volumes increased to 136 units (2011: 112), and Other revenues, including sales of spare parts, refurbished machines, Topping Spreaders, Mini Screeds, 3D systems, S-15M and accessories, increased to US$14.0m (2010: US$10.3m).
Revenue breakdown by geography
North America EMEA RoW Total US$ Millions 2012 2011 2012 2011 2012 2011 2012 2011
Large Screed 5.1 2.4 0.7 0.6 2.3 2.4 8.1 5.4
Small Screed 5.0 3.0 3.2 1.8 1.9 1.4 10.1 6.2
Other 8.0 4.8 1.9 2.7 4.1 2.8 14.0 10.3
Total 18.1 10.2 5.8 5.1 8.3 6.6 32.2 21.9
Units breakdown by geography
North America EMEA RoW Total 2012 2011 2012 2011 2012 2011 2012 2011
Large Screed 16 8 2 2 7 8 25 18
Small Screed 65 52 41 30 30 30 136 112
Sales to customers located in North America contributed 56% of total revenue (2011: 47%), sales to customers in EMEA (Europe, Middle East & South Africa) contributed 18% (2011: 23%) and sales to customers in RoW (Asia, Australia, and Latin America & Pacific) contributed 26% (2011: 30%). Sales in North America generated US$18.1m (2011: US$10.2m) which is up 78% primarily due to higher Large line (16 Large line units in 2012 vs. 8 in 2011) and higher Small line sales (65 Small line units in 2012 vs. 52 in 2011). Sales in EMEA generated US$5.8m (2011: US$5.1m) which is up 14% primarily due to higher Small line sales (41 Small line units in 2012 vs. 30 in 2011). Sales in RoW generated US$8.3m (2011: US$6.6m) which are up 26% primarily due to higher Other sales (primarily higher refurbished sales).
Annual Report & Accounts 2012 11
Gross Profit Gross profit increased to US$15.7m (2011: US$10.2m), with gross margins increasing to 49% (2011: 47%).
Operating Expenses Operating expenses increased by 18% to US$14.2m (2011: US$12.0m). This increase was driven primarily by investments made in Emerging markets, bonus that was based on one half the amount employees had given up during the compensation reduction period and management bonuses and employee profit sharing. Total employment increased to 107 from 71 in 2011.
Other Income (Expense) Other expenses were (US$0.2m) (2011: US$0.6m) consisting of interest income, interest expense, foreign exchange gains and losses and gains and losses on the disposal of assets.
Provision for Income Taxes The provision for income taxes was (US$0.2m) in 2012 as compared to US$0.0m in 2011. Overall, Somero’s effective tax rate changed from (0.9%) in 2011 to 16.1% in 2012 due to a significant increase in earnings before taxes not fully absorbed by its net operating loss carry forwards.
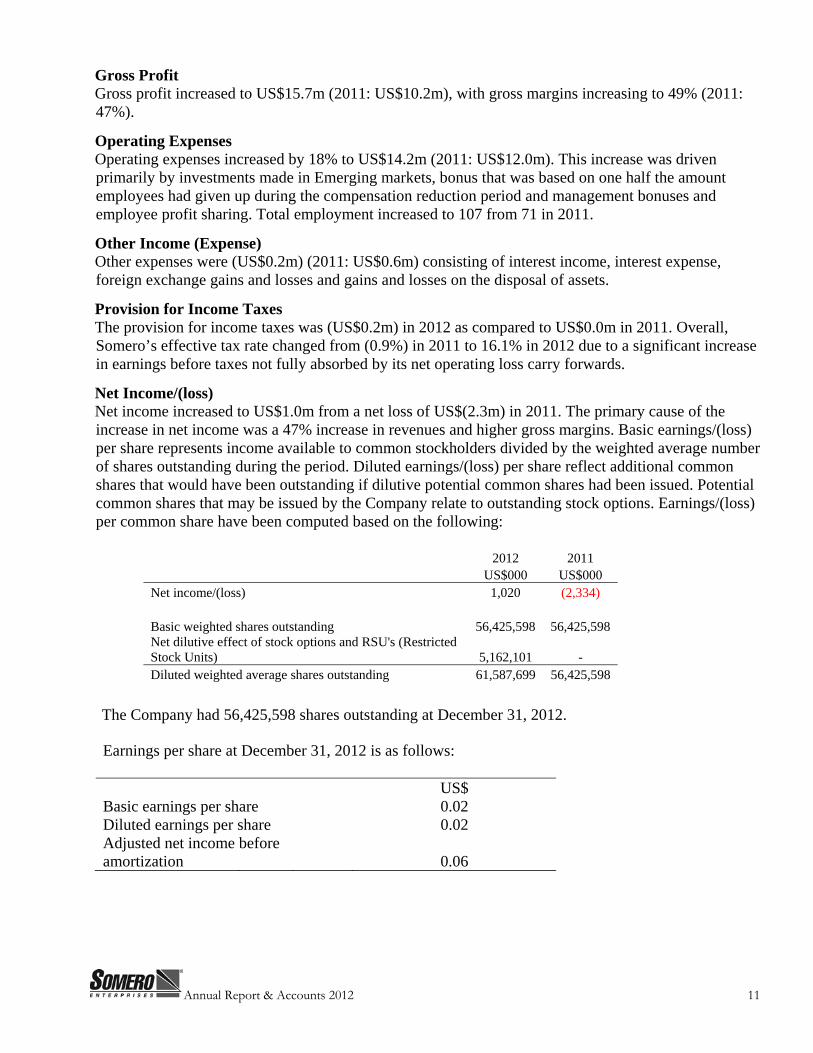
Net Income/(loss) Net income increased to US$1.0m from a net loss of US$(2.3m) in 2011. The primary cause of the increase in net income was a 47% increase in revenues and higher gross margins. Basic earnings/(loss) per share represents income available to common stockholders divided by the weighted average number of shares outstanding during the period. Diluted earnings/(loss) per share reflect additional common shares that would have been outstanding if dilutive potential common shares had been issued. Potential common shares that may be issued by the Company relate to outstanding stock options. Earnings/(loss) per common share have been computed based on the following:
2012 2011 US$000 US$000
Net income/(loss) 1,020 (2,334)
Basic weighted shares outstanding 56,425,598 56,425,598
Net dilutive effect of stock options and RSU's (Restricted Stock Units) 5,162,101 - Diluted weighted average shares outstanding 61,587,699 56,425,598
The Company had 56,425,598 shares outstanding at December 31, 2012.
Earnings per share at December 31, 2012 is as follows:
US$ Basic earnings per share 0.02 Diluted earnings per share 0.02 Adjusted net income before amortization 0.06
Annual Report & Accounts 2012 12
Board of Directors Lawrence L. Horsch Non-Executive Chairman of the Board Mr. Horsch, age 78, came to Somero in October 2009 with extensive experience having served on 26 company boards, invested in 30 venture projects and conducted four corporate turnarounds. He co-founded SciMed Life Systems prior to its merger with Boston Scientific Corporation, after which he served on the Boston Scientific Corporation board. Mr. Horsch currently serves as the Chairman of Leuthold Funds Inc. and Pioneer Sales Group, and in the past five years has also served on the board of Medical CV Inc. and Gillette Children’s Specialty Healthcare. Mr. Horsch has been a business consultant since 1990. He is a graduate of the University of St. Thomas, received an MBA in Finance from Northwestern University, and is a Chartered Financial Analyst. John T. (Jack) Cooney President, Chief Executive Officer and Director Mr. Cooney, age 66, joined Somero in December 1997 and has served as its Chief Executive since that time. He has been a director of the Company since August 2005. Mr. Cooney has 33 years of experience in various senior management and sales and marketing positions. From 1995 to 1997, Mr. Cooney served as the chief executive officer of Advance Machine Company, a US$145m industrial equipment manufacturer located in Minneapolis, Minnesota, USA. From 1990 to 1995, he was the vice president of sales and marketing, as well as the vice president of manufacturing, at Ganton Technologies, an aluminum die caster and precision machine business located in Wisconsin, USA. Mr. Cooney has an Associate's degree in Industrial Engineering from Central New England College and a Master of Business Administration degree from College of St. Thomas. 10 Michael F. Niemela Vice President of Customer Service, Chief Financial Officer, Secretary and Director Mr. Niemela, age 48, was promoted to Vice President of Customer Service in early 2013. Mr. Niemela spent a significant portion of 2012 in China establishing the Chinese subsidiary and developing our Customer Service operations there. He has been with Somero Enterprises since 1997 and has served as Chief Financial Officer and Vice President of Finance since 2006. Mr. Niemela is responsible for the Company’s Finance and Accounting, Human Resources, I.T., Legal and Administration functions. Mr. Niemela earned a Bachelor of Science degree in Business Management from Keene State College. He is the Secretary of the Company and joined the Board shortly prior to admission. Mr. Niemela is also a director of Somero Enterprises Limited, Somero Enterprises SRL, Somero Enterprises GmbH, Somero India Private Limited and is Executive Director of Somero (Shanghai) Machinery Equipment Company Limited.
Annual Report & Accounts 2012 13
Thomas M. Anderson Non-Executive Director Mr. Anderson, age 61, retired after 30 years of service as president and chief executive officer of Schwing America, Inc. to become the president and managing partner of Schwing Bioset, Inc. Since 1989, he has served as the president and managing partner of Concrete Pump Repair. Mr. Anderson participated in compensation decisions for all three companies. He is also a partner in Engineered Chassis Systems, a specialty truck manufacturer. He spent 22 years on the board of directors of the American Concrete Pumping Association and five years as the president of the Concrete Pump Manufacturers Association. Mr. Anderson previously served on the board of directors of Somero Enterprises, Inc. from 1997 to 1999 prior to the sale of the Company to Dover Corporation. Ronald Maskalunas Non-Executive Director Mr. Maskalunas, age 72, is a self-employed corporate consultant, focused on performing due diligence on corporate acquisitions, serving as an expert witness in litigation matters, performing forensic investigations and financial and operating reviews of companies, and assisting in the implementation of Sarbanes-Oxley controls and procedures for a company listed on the New York Stock Exchange. Mr. Maskalunas retired in 2001 after serving as a partner at PricewaterhouseCoopers LLP for 24 years. Mr. Maskalunas earned a Bachelor of Science degree from Purdue University and a Master of Business Administration from the University of Chicago. He is also a Certified Public Accountant. 11
Annual Report & Accounts 2012 14
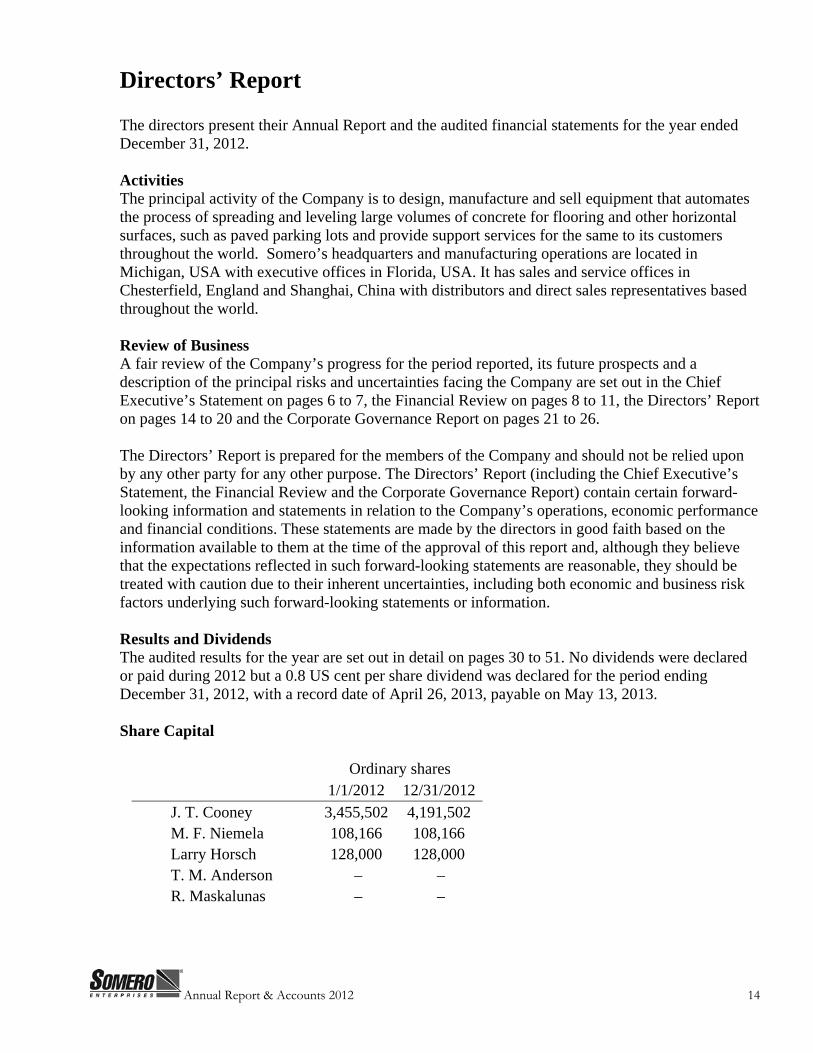
Directors’ Report The directors present their Annual Report and the audited financial statements for the year ended December 31, 2012. Activities The principal activity of the Company is to design, manufacture and sell equipment that automates the process of spreading and leveling large volumes of concrete for flooring and other horizontal surfaces, such as paved parking lots and provide support services for the same to its customers throughout the world. Somero’s headquarters and manufacturing operations are located in Michigan, USA with executive offices in Florida, USA. It has sales and service offices in Chesterfield, England and Shanghai, China with distributors and direct sales representatives based throughout the world. Review of Business A fair review of the Company’s progress for the period reported, its future prospects and a description of the principal risks and uncertainties facing the Company are set out in the Chief Executive’s Statement on pages 6 to 7, the Financial Review on pages 8 to 11, the Directors’ Report on pages 14 to 20 and the Corporate Governance Report on pages 21 to 26. The Directors’ Report is prepared for the members of the Company and should not be relied upon by any other party for any other purpose. The Directors’ Report (including the Chief Executive’s Statement, the Financial Review and the Corporate Governance Report) contain certain forward-looking information and statements in relation to the Company’s operations, economic performance and financial conditions. These statements are made by the directors in good faith based on the information available to them at the time of the approval of this report and, although they believe that the expectations reflected in such forward-looking statements are reasonable, they should be treated with caution due to their inherent uncertainties, including both economic and business risk factors underlying such forward-looking statements or information. Results and Dividends The audited results for the year are set out in detail on pages 30 to 51. No dividends were declared or paid during 2012 but a 0.8 US cent per share dividend was declared for the period ending December 31, 2012, with a record date of April 26, 2013, payable on May 13, 2013. Share Capital
Ordinary shares 1/1/2012 12/31/2012
J. T. Cooney 3,455,502 4,191,502 M. F. Niemela 108,166 108,166 Larry Horsch 128,000 128,000 T. M. Anderson – – R. Maskalunas – –
Annual Report & Accounts 2012 15
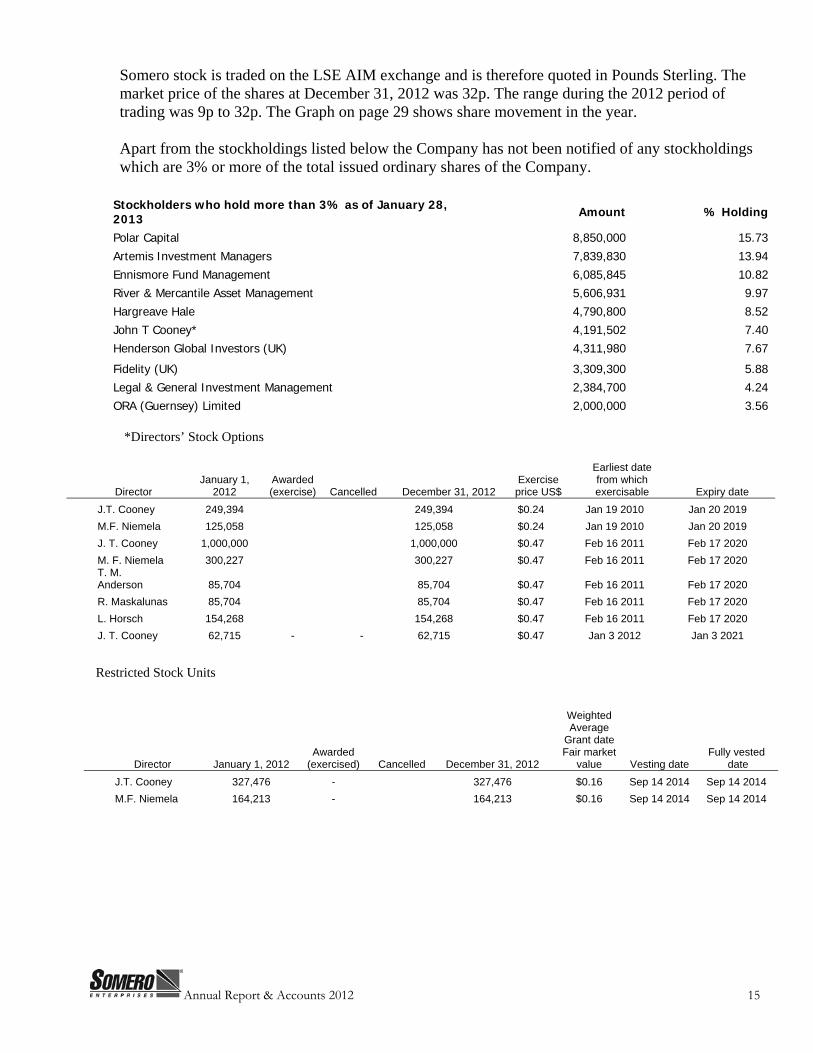
Somero stock is traded on the LSE AIM exchange and is therefore quoted in Pounds Sterling. The market price of the shares at December 31, 2012 was 32p. The range during the 2012 period of trading was 9p to 32p. The Graph on page 29 shows share movement in the year. Apart from the stockholdings listed below the Company has not been notified of any stockholdings which are 3% or more of the total issued ordinary shares of the Company. 12
Stockholders who hold more than 3% as of January 28, 2013 Amount % Holding
Polar Capital 8,850,000 15.73Artemis Investment Managers 7,839,830 13.94Ennismore Fund Management 6,085,845 10.82River & Mercantile Asset Management 5,606,931 9.97Hargreave Hale 4,790,800 8.52John T Cooney* 4,191,502 7.40Henderson Global Investors (UK) 4,311,980 7.67
Fidelity (UK) 3,309,300 5.88Legal & General Investment Management 2,384,700 4.24ORA (Guernsey) Limited 2,000,000 3.56
*Directors’ Stock Options
Director January 1,
2012 Awarded (exercise) Cancelled December 31, 2012
Exercise price US$
Earliest date from which exercisable Expiry date
J.T. Cooney 249,394 249,394 $0.24 Jan 19 2010 Jan 20 2019 M.F. Niemela 125,058 125,058 $0.24 Jan 19 2010 Jan 20 2019 J. T. Cooney 1,000,000 1,000,000 $0.47 Feb 16 2011 Feb 17 2020 M. F. Niemela 300,227 300,227 $0.47 Feb 16 2011 Feb 17 2020 T. M. Anderson 85,704 85,704 $0.47 Feb 16 2011 Feb 17 2020 R. Maskalunas 85,704 85,704 $0.47 Feb 16 2011 Feb 17 2020 L. Horsch 154,268 154,268 $0.47 Feb 16 2011 Feb 17 2020 J. T. Cooney 62,715 - - 62,715 $0.47 Jan 3 2012 Jan 3 2021
Restricted Stock Units
Director January 1, 2012 Awarded
(exercised) Cancelled December 31, 2012
Weighted Average
Grant date Fair market
value Vesting date Fully vested
date J.T. Cooney 327,476 - 327,476 $0.16 Sep 14 2014 Sep 14 2014 M.F. Niemela 164,213 - 164,213 $0.16 Sep 14 2014 Sep 14 2014
Annual Report & Accounts 2012 16
Risks and Uncertainties The key risks and uncertainties facing the Company are considered as part of the Company’s established process for identifying, evaluating and managing risk. Impacts of significant risks and their mitigation are monitored at Board meetings throughout the year and are subject to annual review by the Audit Committee. The key risks facing the business and the processes in place to manage those risks are: Bank Obligations In March 2013, the Company amended its agreement with the bank, which will renew its loan facilities so that they mature between March 2016 and March 2018. The Company successfully met its bank covenants in each quarter in 2012. Employee Retention The Company reinstated its savings and retirement match in 2012 for employees up to 6% of their income. This will fully complete the reinstatement of the 10% compensation reduction that was implemented in July 2009. The Company paid out a bonus and profit sharing dollars to its employees based upon meeting certain profitability targets. On November 21, 2012, the Board approved an award to an additional key employee under the terms of its 2010 Equity Incentive Plan at a price of 31.5p per restricted stock unit (RSU) for a cumulative grant of 2,300,446 units. The awarded stock units will vest in three years from the date of the grant and require continued employment for the period. Economic and Industry Conditions Somero’s financial performance is affected by a number of factors, including the cyclical nature of the non-residential concrete construction industry, as well as the varying economic conditions of the geographic markets Somero serves, primarily North America and Western Europe. Somero also has a growing presence in Asia, Eastern Europe, Australia, the Middle East, Africa and Latin America. Demand in these markets continues to fluctuate in response to overall economic conditions and to the amount of private sector spending on commercial construction projects, especially by retailers such as WalMart and Costco, where Somero’s Large Laser Screed products have been utilized. New Product Innovation The S-15M mid-sized Laser Screed® model was designed with simplified controls making it easy to learn and operate. Using cutting-edge technology developed by Somero engineers, it is a fully operational screed with high production and quality values. The S-15m screeds 15m2 (160 sf) of concrete per pass with a 6m (20') telescopic boom reaching out over the concrete. The S-15m gives the contractor increased productivity, improved quality and lowers their operating costs, giving them a significant return on their investment. The STS-11m topping spreader machine is designed to disperse a wide variety of shake-on toppings over freshly screeded concrete. Concrete toppings are frequently spread over concrete with shovels. The STS-11m controls the spreading accuracy of the material, giving the floor a more consistent finish and vastly improving the productivity and reducing the cost of material for the contractor.
Annual Report & Accounts 2012 17
Product Replacement Demand The Company’s financial performance is also dependent on the replacement or refurbishment of older products as they reach the end of their expected life cycles. Somero equipment is in a period of demand for replacement and refurbishment, as older machines reach the end of their lifecycles. Somero’s level of replacement demand is also dependent on its ability to continue developing enhanced models that encourage customers to replace older machines. Geographic Expansion Somero’s financial performance is dependent upon its ability to successfully enter and penetrate geographic markets outside the US. Currently, Europe and China represent Somero’s primary markets outside the US. Somero has primarily focused its efforts on China with a secondary focus on India, Asia, Eastern Europe, Australia, the Middle East, Africa and Latin America. We continue to promote acceptance of the Company’s technology, methods and products through our education and marketing efforts in emerging markets. Interest Rates Somero’s financial performance is also linked to prevailing interest rates. See “Liquidity and Capital Resources” below. In March 2013, the Company will amend its agreement with the bank, which will renew its loan facilities so that they mature between March 2016 and March 2018. Liquidity and Capital Resources Liquidity The Company’s principal liquidity needs are for payroll, lease obligations, purchases of component parts and trade-in inventory (as part of making new sales), and interest and principal payments on its long-term debt. The Company’s primary sources of liquidity are cash balances, cash provided by operations and its available revolving line of credit with Citizens Bank of up to US$6.0m. Operations are primarily funded through excess cash or draw-downs under the Citizens’ revolving line of credit. Capital Resources Currently, the Company’s capital expenditure plans include improvements to our manufacturing facility, online parts ordering and other replacement information technology. One element of Somero’s strategy is to identify and acquire businesses that have complementary products and services. Somero may finance such future acquisitions from internally generated funds, bank borrowings, public or private securities offerings, or some combination of these methods. In addition, the Company may issue debt or equity securities as some or all of the consideration for such acquisitions. Somero cannot predict the level of financing that may be required in connection with future acquisitions. As of December 31, 2012, the Company had US$3.1m in aggregate principal outstanding in term loans under its Citizens Bank Financing Agreement, and US$0.7m drawn under the revolving portion of its Citizens Bank Financing Agreement. The strong performance and relationship with its bank will enable the Company to amend its loan facilities so that they mature between March 2016 and March 2018. The amended agreement will replace the previous asset based lending facility with a more conventional bank financing facility.
Annual Report & Accounts 2012 18
The amended facility, along with simplified covenants, will allow management to focus on implementation of its strategic plan, successfully introduce new products into the market and maximize opportunities from investments in emerging markets. The Company’s financing agreement with Citizens Bank imposes various restrictions and covenants on the Company which could potentially limit its ability to respond to market conditions, to provide for unanticipated capital investments or to take advantage of business opportunities. The restrictive covenants include limitations on the incurrence of additional indebtedness, limitations on the creation of liens and limitations on asset sales and other fundamental changes, limitations on payment of dividends and limitations on the redemption or repurchase of outstanding capital stock, among other restrictions. The covenants also include financial measures such as a minimum debt service ratio, minimum net tangible asset ratio and a maximum funded debt to EBITDA ratio. The Company was in compliance with all debt covenants at the end of 2012. The directors believe that funds generated from operations, together with existing cash, will be sufficient to meet the Company’s debt obligations over the next 12 months. The directors also expect that existing cash and available funds from the financing agreement with Citizens Bank and funds generated from operations will be sufficient to meet anticipated operating requirements and to fund planned capital expenditures for the remainder of 2013. Somero had capital expenditures of US$0.55m in 2012 and US$0.13m in 2011. The majority of this expenditure was related to an ERP upgrade, leasehold improvements to a new facility in China, hardware upgrades and software upgrades. The directors will, from time to time, evaluate opportunities to sell equity or debt securities, and/or obtain credit facilities from lenders, which could result in dilution to the Company’s stockholders and increased interest expense. Other Financial Arrangements Quantitative and Qualitative Disclosure About Market Risk The Company is exposed to market risk from changes in interest rates and foreign currency exchange rates because it funds its operations through long and short-term borrowings and receives revenues and incurs expenses in a variety of foreign currencies. The Company does not currently hedge against the risk of exchange rate fluctuations. A summary of the Company’s primary market risk exposures follows. Foreign Currency Risk The Company’s foreign sales and results of operations are subject to the impact of foreign currency fluctuations because it receives revenues and incurs expenses in a variety of foreign currencies. Although Somero does not engage in hedging against currency exchange risk, it mitigates this risk by increasing its list prices in foreign currencies in order to maintain the price level when converted into US dollars. Historically, Somero has been able to increase prices to accommodate for fluctuations in exchange rates that would otherwise negatively impact its prices when converted into US dollars. In 2012, the Company began a move towards pricing its products and services in US dollars around the world in order to significantly reduce its exposure to foreign currency risk.
Annual Report & Accounts 2012 19
Payments to Creditors The Company’s policy is to set payment terms when agreeing the terms of each transaction. It is the Company’s general policy to pay suppliers according to the set terms, to insure suppliers are informed of the terms of payment and to abide by these terms whenever possible. Corporate Social Responsibility Somero Enterprises believes, as a good corporate citizen, it must care about the communities it is involved in, keep the environment healthy, provide a safe and rewarding place to work and behave ethically in all its business dealings. Donations During the year, the Company made no political donations. Charitable donations were made in the amount of US$19,171 for 2012. Employment Policies The Company supports equal opportunities in employment and advancement and opposes all forms of unlawful or unfair discrimination on the grounds of color, race, religion, age, nationality, gender or marital status. Full and fair consideration is given to applications for employment from disabled people. As an equal opportunities employer, all our benefits are accessible to every staff member and we encourage and support personal and professional development. The Company has well established structures to communicate with employees at every level and to encourage their involvement regarding the Company’s performance and future activities. As an organization, Somero Enterprises, Inc. prides itself on its honesty, integrity and high professional standards to deliver its services to its customers and in dealing with its staff and the public. It also demands the maintenance of these high standards in everything that it does. To this end, the Company has devised this policy and procedure in order to give encouragement and support to employees in coming forward and reporting certain types of conduct or activities that will fall short of these high standards. Under the Public Interest Disclosure Act 1998, employees who report wrongdoing of certain kinds have specific protection. The Company aims to ensure that by adherence to this policy and through proper use of the procedure, as far as possible, any such report shall be made internally in the first instance by making it possible for all employees to approach an appropriate person within the Company in order to draw their concerns to the attention of someone who has authority to act. This policy and procedure is aimed at ensuring that any employee who wishes to voice a concern regarding potential or actual wrongdoing on the part of the Company or anyone with whom the Company is associated feels sufficiently comfortable to do so. Director Training After receiving formal AIM compliance training in August 2007, Messrs. Cooney, Horsch and Niemela received an update and refresher on AIM rules in early 2012.
Annual Report & Accounts 2012 20
Health and Safety The Board considers health and safety a key priority and believes it essential to conduct business to ensure the health, safety and welfare of all our employees and all other persons who may be affected by our activities. This includes members of the public, customers and trade contractors we may employ. Our internal Safety Committee monitors these issues and reports to senior management monthly. We maintain ISO 9001 certification for quality. Environment It is our intention to take all reasonable measures to conduct our business activities so that damage to the environment and pollution is minimized.
Annual General Meeting (AGM) The notice of the AGM is included on page 53 in the Annual Report. It is approved by the Board of Directors and signed on behalf of the Board. Michael F. Niemela Company Secretary February 26, 2013
Annual Report & Accounts 2012 21
Corporate Governance While the Company is not required to comply with the provisions of the Combined Code and the UK Corporate Governance Code, it is the intention of the directors that the Company will indeed comply with both codes. With the exception of the following matters, the Company is in compliance with the June 2008 edition of FRC Combined Code on Corporate Governance and the June 2010 UK Corporate Governance Code. A.1.2 Senior independent director has not been named. C.3.5 Allowing for the size of the Company, there is currently no internal audit function as suggested by the Combined Code. The finance function continues to carry out regular and random internal checks on all systems and procedures to insure internal compliance. We do not feel the need, therefore, to appoint separate staff to carry out an internal audit function. A.6.1 Also, the Board has not undertaken a formal evaluation of its own performance and that of its committees and individual directors. As suggested by the Combined Code, as of the end of 2012, relationships with the majority of all major stockholders have been maintained on a regular basis keeping them fully informed regarding the trading of the Company and any new developments. Auditor payments related to 2012 were US$152,000 and for 2011 were US$142,000. Board of Directors The Company is controlled through the Board of Directors which is comprised of five members, three of whom are nonexecutive directors. The Board considers that the Non-Executive Chairman of the Board, Mr. Horsch, as well as Messrs Anderson and Maskalunas, who have been appointed as non-executive directors, are each independent in character and judgment and accordingly considers each of them to be an independent director for the purposes of the Combined Code. The names and biographical details of the directors are located on pages 12 and 13 of this report. The Company holds monthly Board meetings and more frequent meetings as required. There is a separation of roles and responsibilities of the Chairman and the Chief Executive. As the Non-Executive Chairman, Mr. Horsch is responsible for leadership of the Board, ensuring its effectiveness on all aspects of its role and setting its agenda; ensuring that the directors receive accurate, timely and clear information, and appropriate induction and training; ensuring effective communication with stockholders; and facilitating the effective contribution of non-executive directors in particular, and ensuring constructive relations between the executive and non-executive directors. Non-executive directors are responsible for constructively challenging and helping to develop proposals on strategy; scrutinizing the performance of management in meeting agreed goals and objectives, and monitoring the reporting of performance; satisfying themselves on the integrity of financial information, and that financial controls and systems of risk management are robust and defensible; and responsibility for determining appropriate levels of remuneration of executive directors, and having a prime role in appointing, and where necessary removing, executive directors, and in succession planning. The directors are provided with regular and timely information on the financial performance of the Company together with other reports from functional areas within the Company as requested.
Annual Report & Accounts 2012 22
During the year, there were 12 regularly scheduled monthly Board meetings, two Audit Committee meetings, two Remuneration Committee meeting and one Nominations Committee meeting, with perfect attendance. The Board is responsible for overall Company strategy, acquisition and divestment policy, approval of major capital expenditure projects and consideration of significant financing matters. It monitors the exposure to key business risks, considers environmental and employee issues and key appointments. It ensures that all directors receive appropriate training on appointment and then subsequently as appropriate. A budget is established for this purpose. All directors, in accordance with the Code, will submit themselves for re-election at least once every three years. The Board has three committees, the Audit Committee, the Remuneration Committee and the Nominations Committee, with formally delegated rules and responsibilities. Each of these committees meets regularly, at least once each year. The Audit Committee is comprised of Messrs Maskalunas, Anderson and Horsch, and is chaired by Mr. Maskalunas. The Audit Committee determines and examines any matters relating to the financial affairs of the Company, including the terms of engagement of the Company’s auditors and, in consultation with the auditors, the scope of the audit. It receives and reviews reports from management and the Company’s auditors relating to the interim and annual accounts and the accounting and internal control systems in use throughout the Company. In addition, it ensures that the financial performance, position and prospects of the Company are properly monitored and reported on. The Audit Committee has unrestricted access to the Company’s auditors. The Remuneration Committee is comprised of Messrs Anderson, Maskalunas and Horsch, and is chaired by Mr. Anderson. The Remuneration Committee measures the performance of the executive directors and key members of senior management as a prelude to recommending their annual remuneration, bonus awards, and awards of stock options to the Board for final determination. The Remuneration Committee also makes recommendations to the Board concerning the allocation of stock options to employees. The Nominations Committee is comprised of Messrs Horsch, Anderson and Maskalunas and is chaired by Mr. Horsch. The Nominations Committee regularly reviews the structure, size and composition (including the skills, knowledge and experience) required of the Board compared to its current position and makes recommendations to the Board with regard to any changes; gives full consideration to succession planning for directors and other senior executives in the course of its work, taking into account the challenges and opportunities facing the Company, and what skills and expertise are therefore needed on the Board in the future; and is responsible for identifying and nominating for the approval of the Board, candidates to fill Board vacancies as and when they arise. The Company adopted a code for directors’ and applicable employees’ stock dealings. The directors will comply with Rule 21 of the AIM rules relating to directors’ dealings and will take all reasonable steps to ensure compliance by Somero’s applicable employees.
Annual Report & Accounts 2012 23
Relations with Stockholders The directors are committed to maintaining good communications with the stockholders and quickly respond to all queries received. All stockholders have at least 20 working days’ notice of the AGM at which all directors and committee chairs are introduced and available for questions. Institutional investors and analysts are invited to briefings by the Company immediately after the announcement of the Company’s full year results and all stockholders are encouraged to participate in the Company’s AGM. Accountability and Audit Financial Reporting A review of the performance and financial position of the Company is included in the financial review. The Board uses this, together with the Chairman’s Statement, the Chief Executive’s Statement and the Directors’ Report to present a balanced and understandable assessment of the Company’s position and prospects. The statement of directors’ responsibilities for the financial statements is described on page 23. Internal Control An ongoing process for identifying, evaluating and managing the significant risks faced by the Company has been established and that process is regularly reviewed by the Board and accords with the Internal Control Guidance to directors on the Combined code. Steps continue to be taken to embed internal control and risk management further into the operations of the business and deal with areas of improvement coming to management and Board attention. The Board implemented a review of 18 key risk areas starting in 2007 where one of the risk areas was reviewed with results reported to the entire Board. In 2008 there was one additional risk area reviewed with a report of the results to the Board. In 2009 and 2010, due to the ongoing restructurings, none of the 18 risk areas were formally reported on to the Board. In 2011, three additional risk areas were examined with results reported to the entire Board. In 2012, three additional risk areas were examined with results reported to the entire board. The reporting systems include formal consideration of all significant business risks at the monthly Board meetings and are still subject to continuous review by the Board throughout the year. The monthly management information includes some key risk indicators with the emphasis on early warning systems. Risk management principles are embedded within all significant projects. The directors are responsible for the system of internal control and reviewing its effectiveness. Such a system is designed to manage rather than eliminate the risk of failure to achieve business objectives, and can provide only reasonable but not absolute assurance against material misstatement or loss. The key risk management activities are described under the following headings: Strategic control – The Board reviews the Company’s strategic plans each year. On a regular basis, the Company’s significant risks are updated and appropriate control strategies and accountabilities are agreed.
Annual Report & Accounts 2012 24
Allocation of responsibilities and control environment – The Board has set clear terms of reference for each of its committees and the Company has an organizational structure with clearly defined and documented delegation of authority to executive management and reporting systems for financial results, risk exposure and control assessment. Financial control – The Company has a comprehensive system for reporting financial results to the Board. Quality and integrity of personnel – The Company is committed to competence and integrity of management and staff at all levels, through its values statement, comprehensive recruitment, training and appraisal programs. IT Systems – The Company has established controls and procedures over the security of data held on computer systems and have put in place suitable disaster recovery arrangements. Controls over central functions – A number of the Company’s key functions, including treasury and taxation, are dealt with centrally. The Chief Financial Officer reports on an as needed basis to keep the Board updated. Internal audit – There is no dedicated resource for internal audit functions which is considered sufficient for the Company due to its size. Role of the Executive Committee – Day-to-day management of the Company’s activities is delegated to senior management which is considered sufficient for the Company. Risk management reporting and Board review – The Board has overall responsibility for identifying, evaluating and managing major business risks facing the Company. It annually reviews all operating unit assessments of business risk exposure and control, including compliance assessments, and determines appropriate action, taking into account the recommendations of senior management. An ongoing review of the effectiveness of the system of internal control for the year ended December 31, 2012 has been maintained and has taken account of any material developments since the year end. Audit Committee A summary of the process the Board (where applicable, through its committees) has applied in reviewing the effectiveness of the system of internal control is set out as follows: During the year, the Audit Committee of the Board, comprising three non-executive directors; a. meets regularly with the external auditors and executive directors attending by invitation; b. receives and considers reports relating to the monitoring of the adequacy of the Company’s internal controls, the suitability of its accounting policies and financial reporting and matters arising from the external auditors work; c. monitors the nature and extent of non-audit work undertaken by the external auditors; and d. makes recommendations to the Board on these matters.
Annual Report & Accounts 2012 25
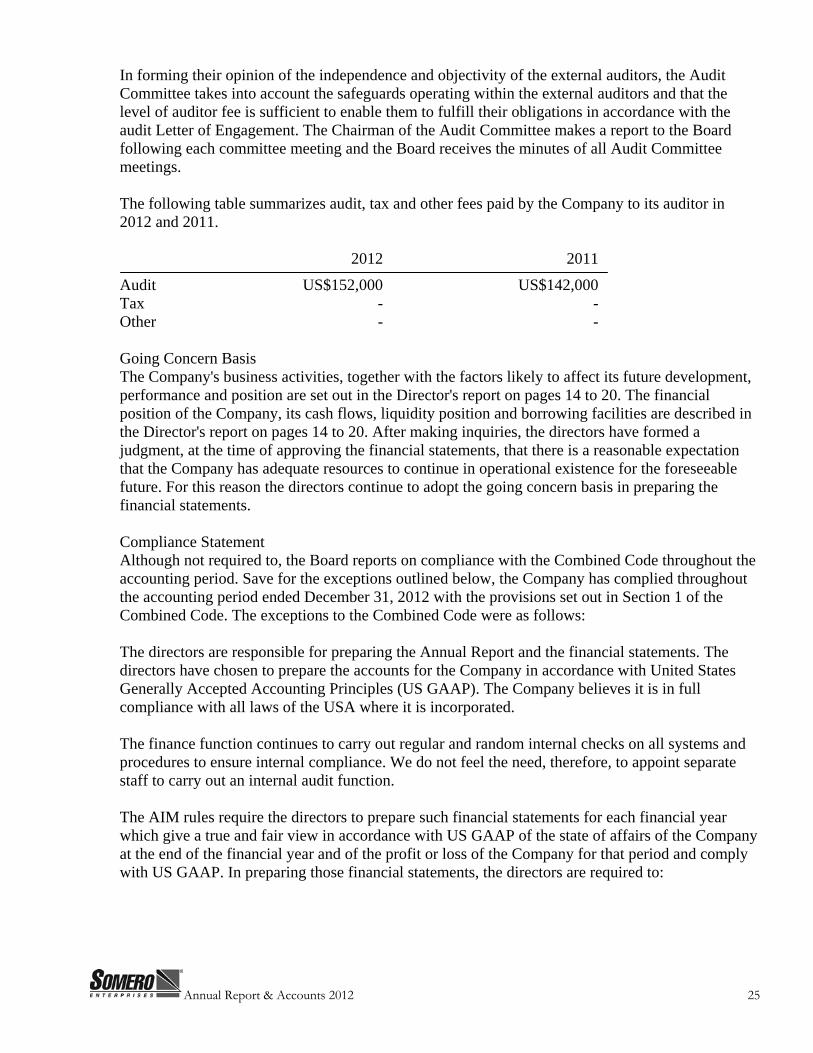
In forming their opinion of the independence and objectivity of the external auditors, the Audit Committee takes into account the safeguards operating within the external auditors and that the level of auditor fee is sufficient to enable them to fulfill their obligations in accordance with the audit Letter of Engagement. The Chairman of the Audit Committee makes a report to the Board following each committee meeting and the Board receives the minutes of all Audit Committee meetings. The following table summarizes audit, tax and other fees paid by the Company to its auditor in 2012 and 2011.
2012 2011
Audit US$152,000 US$142,000 Tax - - Other - - Going Concern Basis The Company's business activities, together with the factors likely to affect its future development, performance and position are set out in the Director's report on pages 14 to 20. The financial position of the Company, its cash flows, liquidity position and borrowing facilities are described in the Director's report on pages 14 to 20. After making inquiries, the directors have formed a judgment, at the time of approving the financial statements, that there is a reasonable expectation that the Company has adequate resources to continue in operational existence for the foreseeable future. For this reason the directors continue to adopt the going concern basis in preparing the financial statements. Compliance Statement Although not required to, the Board reports on compliance with the Combined Code throughout the accounting period. Save for the exceptions outlined below, the Company has complied throughout the accounting period ended December 31, 2012 with the provisions set out in Section 1 of the Combined Code. The exceptions to the Combined Code were as follows: The directors are responsible for preparing the Annual Report and the financial statements. The directors have chosen to prepare the accounts for the Company in accordance with United States Generally Accepted Accounting Principles (US GAAP). The Company believes it is in full compliance with all laws of the USA where it is incorporated. The finance function continues to carry out regular and random internal checks on all systems and procedures to ensure internal compliance. We do not feel the need, therefore, to appoint separate staff to carry out an internal audit function. The AIM rules require the directors to prepare such financial statements for each financial year which give a true and fair view in accordance with US GAAP of the state of affairs of the Company at the end of the financial year and of the profit or loss of the Company for that period and comply with US GAAP. In preparing those financial statements, the directors are required to:
Annual Report & Accounts 2012 26
- select suitable accounting policies and then apply them consistently; - make judgments and estimates that are reasonable and prudent; - state whether applicable accounting standards have been followed; and - prepare the financial statements on the going concern basis, unless it is inappropriate to presume
that the Company will continue in business. The directors are responsible for the system of internal control, for safeguarding the assets of the Company and hence for taking reasonable steps for the prevention and detection of fraud and other irregularities. This report has been approved by the Board and adopted for submission for ratification by the stockholders. This report is unaudited.
Annual Report & Accounts 2012 27
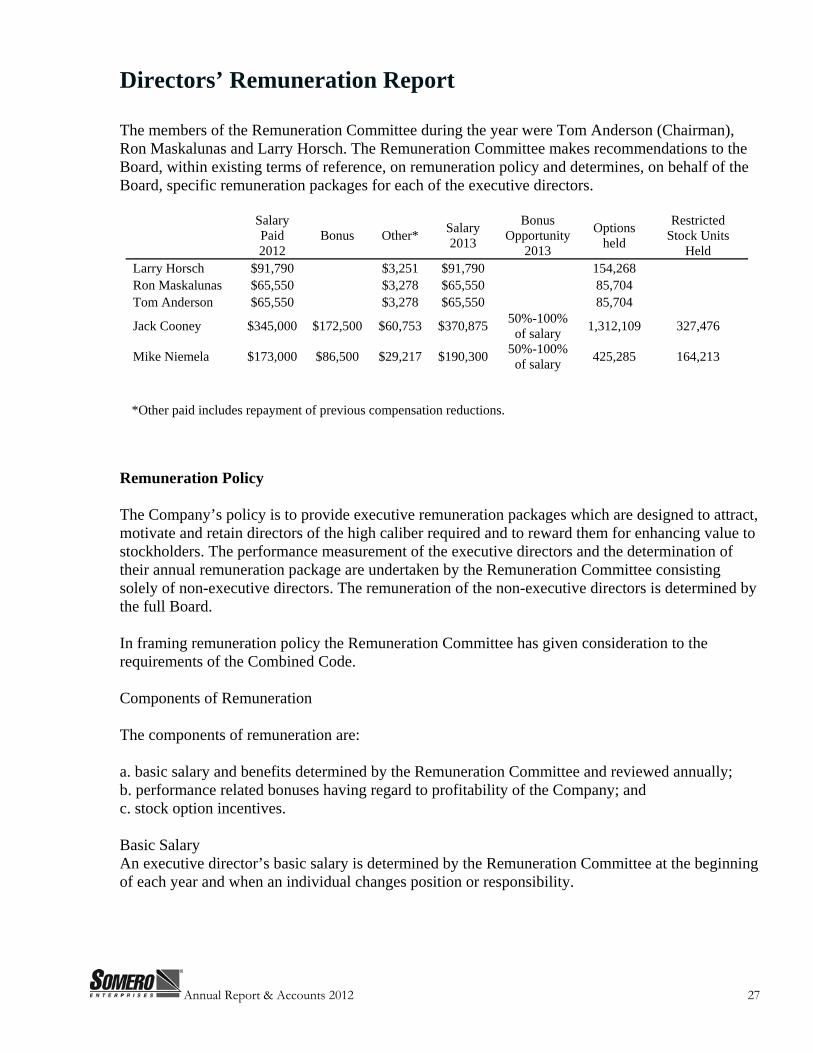
Directors’ Remuneration Report The members of the Remuneration Committee during the year were Tom Anderson (Chairman), Ron Maskalunas and Larry Horsch. The Remuneration Committee makes recommendations to the Board, within existing terms of reference, on remuneration policy and determines, on behalf of the Board, specific remuneration packages for each of the executive directors.
Salary Paid 2012
Bonus Other* Salary 2013
Bonus Opportunity
2013
Options held
Restricted Stock Units
Held Larry Horsch $91,790 $3,251 $91,790 154,268 Ron Maskalunas $65,550 $3,278 $65,550 85,704 Tom Anderson $65,550 $3,278 $65,550 85,704
Jack Cooney $345,000 $172,500 $60,753 $370,875 50%-100% of salary 1,312,109 327,476
Mike Niemela $173,000 $86,500 $29,217 $190,300 50%-100% of salary 425,285 164,213
*Other paid includes repayment of previous compensation reductions.
Remuneration Policy The Company’s policy is to provide executive remuneration packages which are designed to attract, motivate and retain directors of the high caliber required and to reward them for enhancing value to stockholders. The performance measurement of the executive directors and the determination of their annual remuneration package are undertaken by the Remuneration Committee consisting solely of non-executive directors. The remuneration of the non-executive directors is determined by the full Board. In framing remuneration policy the Remuneration Committee has given consideration to the requirements of the Combined Code. Components of Remuneration The components of remuneration are: a. basic salary and benefits determined by the Remuneration Committee and reviewed annually; b. performance related bonuses having regard to profitability of the Company; and c. stock option incentives. Basic Salary An executive director’s basic salary is determined by the Remuneration Committee at the beginning of each year and when an individual changes position or responsibility.
Annual Report & Accounts 2012 28
Cash Compensation In the year ended December 31, 2012, the executive directors received bonuses as shown in the table. Directors’ Contracts The Company has entered into employment agreements with certain members of senior management. The terms of these agreements range from six to 18 months and include non-compete and non-disclosure provisions as well as providing for defined severance payments in the event of termination or change in control. If any existing contract of employment is breached by the Company in the event of termination, the Company would be liable to pay, as damages, an amount approximating the net loss of salary and contractual benefits for the unexpired notice period. The Remuneration Committee will seek to ensure that the director fulfills his obligation to mitigate his losses and will also give consideration to phased payments where appropriate. With the approval of the Remuneration Committee, executive directors are entitled, under their service agreements to perform duties outside the Company and to receive fees for those duties. Equity Incentives The Remuneration Committee approves the grant of equity awards to executive directors under the Company’s discretionary equity incentive schemes. In 2010, the Remuneration Committee adopted Somero’s 2010 Equity Incentive Plan that made 5.6 million stock options available to be granted, which is 10% of the 56 million shares that are issued and outstanding. At that time, all other equity incentive plans were abandoned. Other than as disclosed above, the equity awards issued to executive directors do not have any performance criteria attached to them. At the time they were first issued, it was not felt that performance criteria were appropriate. For more information, see Note #14 on pages 48 to 51 within the Notes to the Financial Statements. Restricted Stock Units On November 21, 2012, the Board approved an award of 21,097 units to an additional key employee under the terms of its 2010 Equity Incentive Plan at a price of 31.5p per restricted stock unit (RSU) for a cumulative grant of 2,300,446 units. The awarded stock units will vest in three years from the date of the grant and require continued employment for the period. Stock Options An initial grant was made in February 2010 for 2.3 million stock options as replacements for grants under the old option plan which was cancelled and the old plan was abandoned. The grants have a three year vesting and a strike price of 30p, a 100% premium over the market price on the date of grant. The remaining options will only be issued for new key employees and superior performance. Directors and Officers Insurance The Company maintains customary D&O insurance.
Annual Report & Accounts 2012 29
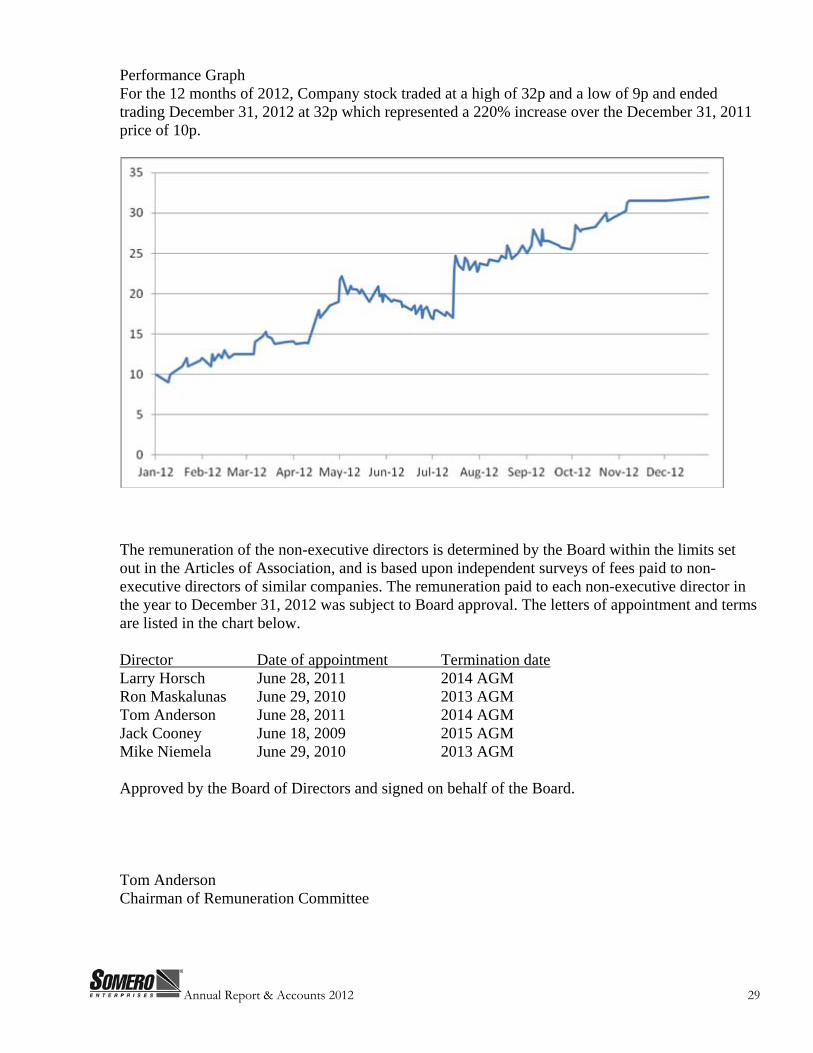
Performance Graph For the 12 months of 2012, Company stock traded at a high of 32p and a low of 9p and ended trading December 31, 2012 at 32p which represented a 220% increase over the December 31, 2011 price of 10p.
The remuneration of the non-executive directors is determined by the Board within the limits set out in the Articles of Association, and is based upon independent surveys of fees paid to non-executive directors of similar companies. The remuneration paid to each non-executive director in the year to December 31, 2012 was subject to Board approval. The letters of appointment and terms are listed in the chart below. Director Date of appointment Termination date Larry Horsch June 28, 2011 2014 AGM Ron Maskalunas June 29, 2010 2013 AGM Tom Anderson June 28, 2011 2014 AGM Jack Cooney June 18, 2009 2015 AGM Mike Niemela June 29, 2010 2013 AGM Approved by the Board of Directors and signed on behalf of the Board. Tom Anderson Chairman of Remuneration Committee
Annual Report & Accounts 2012 30
Independent Auditors’ Report To the Board of Directors and Stockholders of Somero Enterprises, Inc. We have audited the accompanying consolidated financial statements of Somero Enterprises, Inc., a Delaware corporation, which comprise the consolidated balance sheets as of December 31, 2012 and 2011, and the related consolidated statements of operations, changes in stockholders' equity, and cash flows for the years then ended, and the related notes to the consolidated financial statements. Management’s Responsibility for the Consolidated Financial Statements Management is responsible for the preparation and fair presentation of these consolidated financial statements in accordance with accounting principles generally accepted in the United States of America; this includes the design, implementation, and maintenance of internal control relevant to the preparation and fair presentation of financial statements that are free from material misstatement, whether due to fraud or error. Auditor’s Responsibility Our responsibility is to express an opinion on these consolidated financial statements based on our audits. We conducted our audits in accordance with auditing standards generally accepted in the United States of America. Those standards require that we plan and perform the audit to obtain reasonable assurance about whether the consolidated financial statements are free from material misstatement. An audit involves performing procedures to obtain audit evidence about the amounts and disclosures in the consolidated financial statements. The procedures selected depend on the auditor's judgment, including the assessment of the risks of material misstatement of the financial statements, whether due to fraud or error. In making those risk assessments, the auditor considers internal control relevant to the entity's preparation and fair presentation of the financial statements in order to design audit procedures that are appropriate in the circumstances, but not for the purpose of expressing an opinion on the effectiveness of the entity's internal control. Accordingly, we express no such opinion. An audit also includes evaluating the appropriateness of accounting policies used and the reasonableness of significant accounting estimates made by management, as well as evaluating the overall presentation of the consolidated financial statements We believe that the audit evidence we have obtained is sufficient and appropriate to provide a basis for our audit opinion. Opinion In our opinion, the consolidated financial statements referred to above present fairly, in all material respects, the financial position of Somero Enterprises, Inc. as of December 31, 2012 and 2011, and the results of their operations and their cash flows for the years then ended in conformity with accounting principles generally accepted in the United States of America.
February 26, 2013
Annual Report & Accounts 2012 31
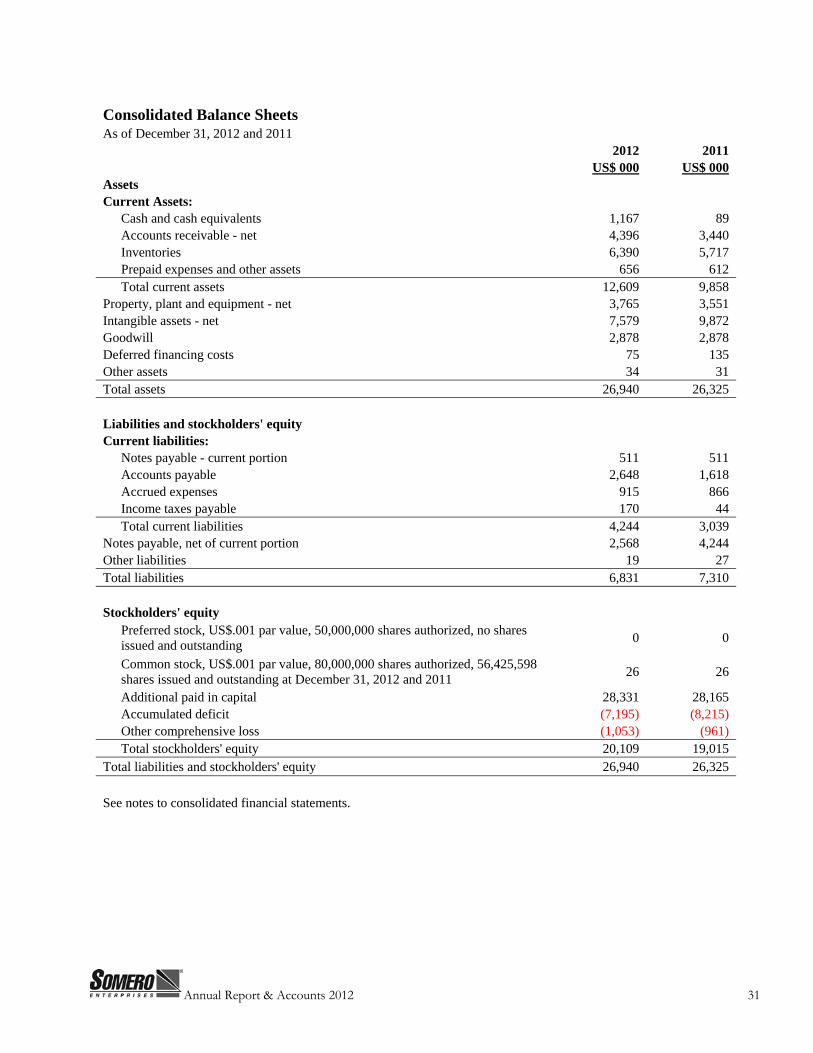
Consolidated Balance Sheets As of December 31, 2012 and 2011
2012 2011 US$ 000 US$ 000
Assets Current Assets:
Cash and cash equivalents 1,167 89 Accounts receivable - net 4,396 3,440 Inventories 6,390 5,717 Prepaid expenses and other assets 656 612
Total current assets 12,609 9,858 Property, plant and equipment - net 3,765 3,551 Intangible assets - net 7,579 9,872 Goodwill 2,878 2,878 Deferred financing costs 75 135 Other assets 34 31 Total assets 26,940 26,325
Liabilities and stockholders' equity Current liabilities:
Notes payable - current portion 511 511 Accounts payable 2,648 1,618 Accrued expenses 915 866 Income taxes payable 170 44
Total current liabilities 4,244 3,039 Notes payable, net of current portion 2,568 4,244 Other liabilities 19 27 Total liabilities 6,831 7,310
Stockholders' equity
Preferred stock, US$.001 par value, 50,000,000 shares authorized, no shares issued and outstanding 0 0
Common stock, US$.001 par value, 80,000,000 shares authorized, 56,425,598 shares issued and outstanding at December 31, 2012 and 2011 26 26
Additional paid in capital 28,331 28,165 Accumulated deficit (7,195) (8,215) Other comprehensive loss (1,053) (961)
Total stockholders' equity 20,109 19,015 Total liabilities and stockholders' equity 26,940 26,325
See notes to consolidated financial statements.
Annual Report & Accounts 2012 32
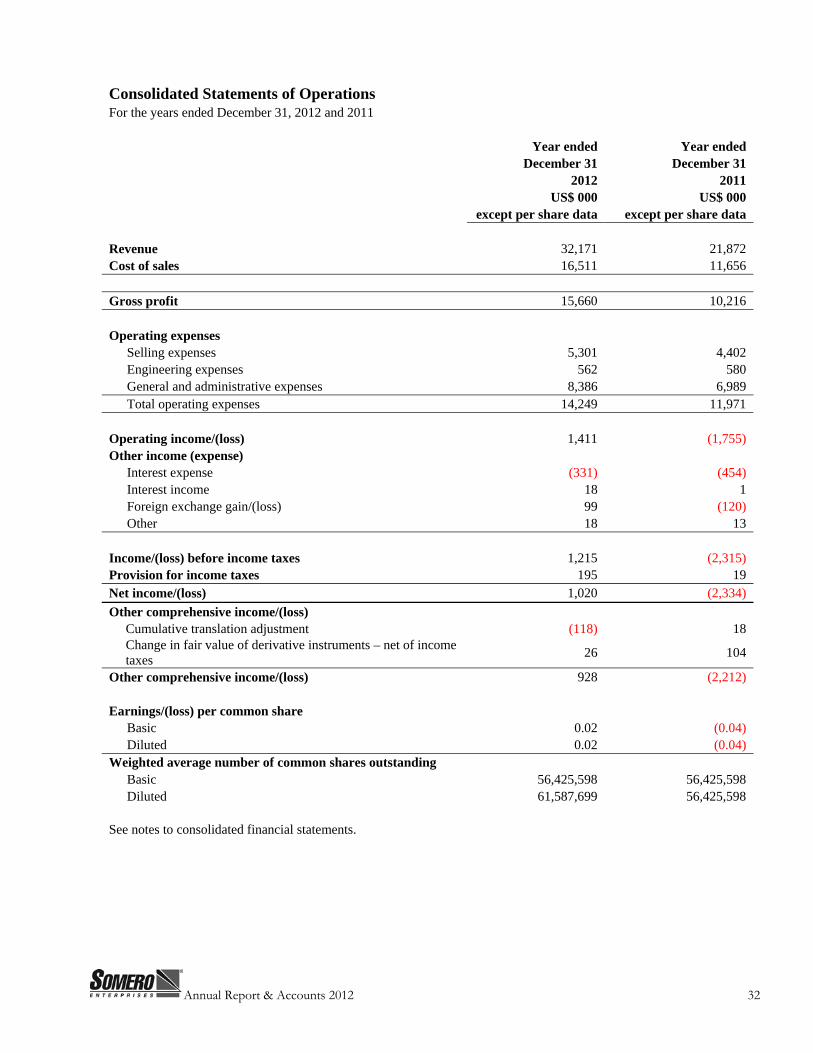
Consolidated Statements of Operations For the years ended December 31, 2012 and 2011
Year ended Year ended December 31 December 31
2012 2011 US$ 000 US$ 000
except per share data except per share data
Revenue 32,171 21,872 Cost of sales 16,511 11,656
Gross profit 15,660 10,216
Operating expenses Selling expenses 5,301 4,402 Engineering expenses 562 580 General and administrative expenses 8,386 6,989
Total operating expenses 14,249 11,971
Operating income/(loss) 1,411 (1,755) Other income (expense)
Interest expense (331) (454) Interest income 18 1 Foreign exchange gain/(loss) 99 (120)
Other 18 13
Income/(loss) before income taxes 1,215 (2,315) Provision for income taxes 195 19 Net income/(loss) 1,020 (2,334) Other comprehensive income/(loss)
Cumulative translation adjustment (118) 18 Change in fair value of derivative instruments – net of income taxes 26 104
Other comprehensive income/(loss) 928 (2,212)
Earnings/(loss) per common share Basic 0.02 (0.04)
Diluted 0.02 (0.04) Weighted average number of common shares outstanding
Basic 56,425,598 56,425,598 Diluted 61,587,699 56,425,598
See notes to consolidated financial statements.
Annual Report & Accounts 2012 33
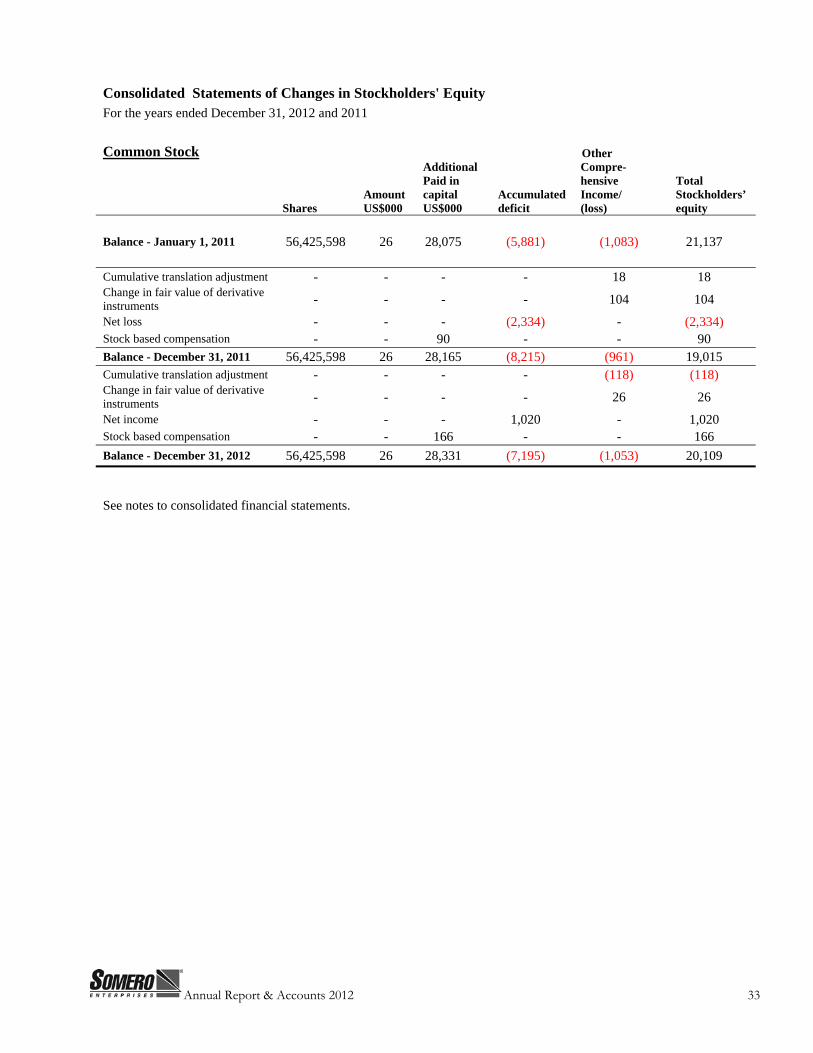
Consolidated Statements of Changes in Stockholders' Equity For the years ended December 31, 2012 and 2011
Common Stock Other
Shares
Amount US$000
Additional Paid in capital US$000
Accumulated deficit
Compre-hensive Income/ (loss)
Total Stockholders’ equity
Balance - January 1, 2011 56,425,598 26 28,075 (5,881) (1,083) 21,137
Cumulative translation adjustment - - - - 18 18 Change in fair value of derivative instruments - - - - 104 104 Net loss - - - (2,334) - (2,334) Stock based compensation - - 90 - - 90 Balance - December 31, 2011 56,425,598 26 28,165 (8,215) (961) 19,015 Cumulative translation adjustment - - - - (118) (118) Change in fair value of derivative instruments - - - - 26 26 Net income - - - 1,020 - 1,020 Stock based compensation - - 166 - - 166 Balance - December 31, 2012 56,425,598 26 28,331 (7,195) (1,053) 20,109
See notes to consolidated financial statements.
Annual Report & Accounts 2012 34
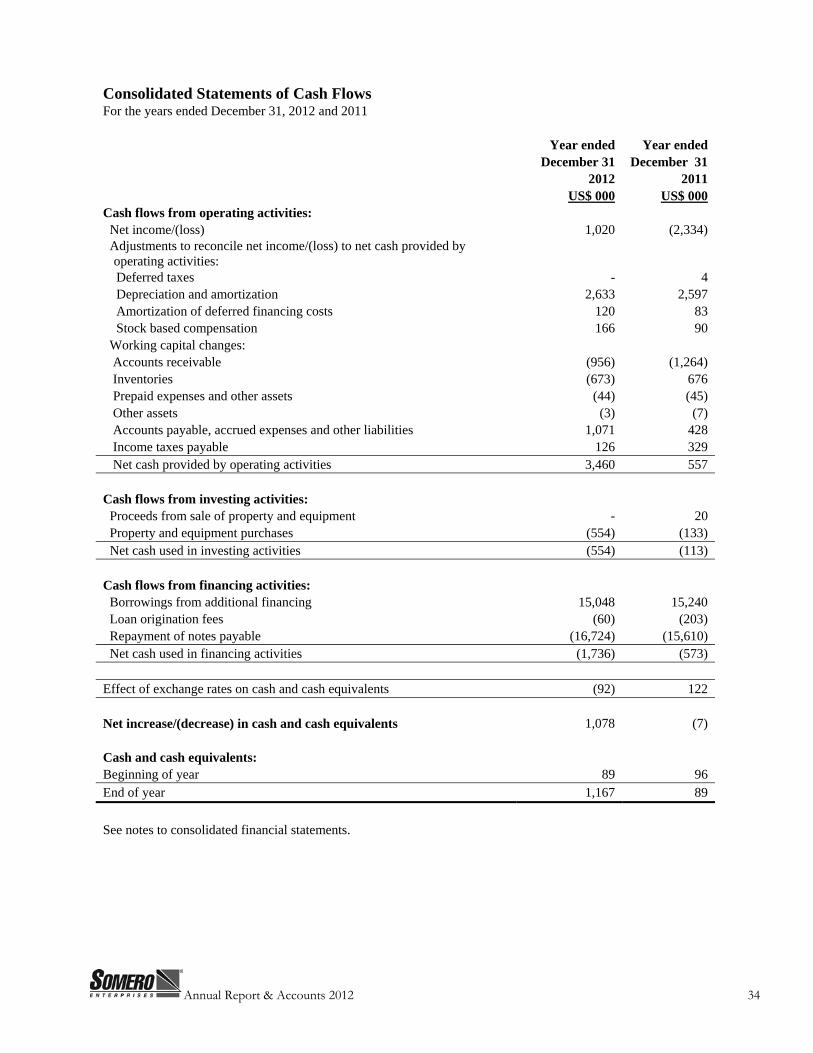
Consolidated Statements of Cash Flows For the years ended December 31, 2012 and 2011
Year ended Year ended December 31 December 31
2012 2011 US$ 000 US$ 000
Cash flows from operating activities: Net income/(loss) 1,020 (2,334) Adjustments to reconcile net income/(loss) to net cash provided by
operating activities: Deferred taxes - 4 Depreciation and amortization 2,633 2,597 Amortization of deferred financing costs 120 83 Stock based compensation 166 90 Working capital changes: Accounts receivable (956) (1,264) Inventories (673) 676 Prepaid expenses and other assets (44) (45) Other assets (3) (7) Accounts payable, accrued expenses and other liabilities 1,071 428 Income taxes payable 126 329 Net cash provided by operating activities 3,460 557
Cash flows from investing activities: Proceeds from sale of property and equipment - 20 Property and equipment purchases (554) (133) Net cash used in investing activities (554) (113)
Cash flows from financing activities: Borrowings from additional financing 15,048 15,240 Loan origination fees (60) (203) Repayment of notes payable (16,724) (15,610) Net cash used in financing activities (1,736) (573)
Effect of exchange rates on cash and cash equivalents (92) 122
Net increase/(decrease) in cash and cash equivalents 1,078 (7)
Cash and cash equivalents: Beginning of year 89 96 End of year 1,167 89
See notes to consolidated financial statements.
Annual Report & Accounts 2012 35
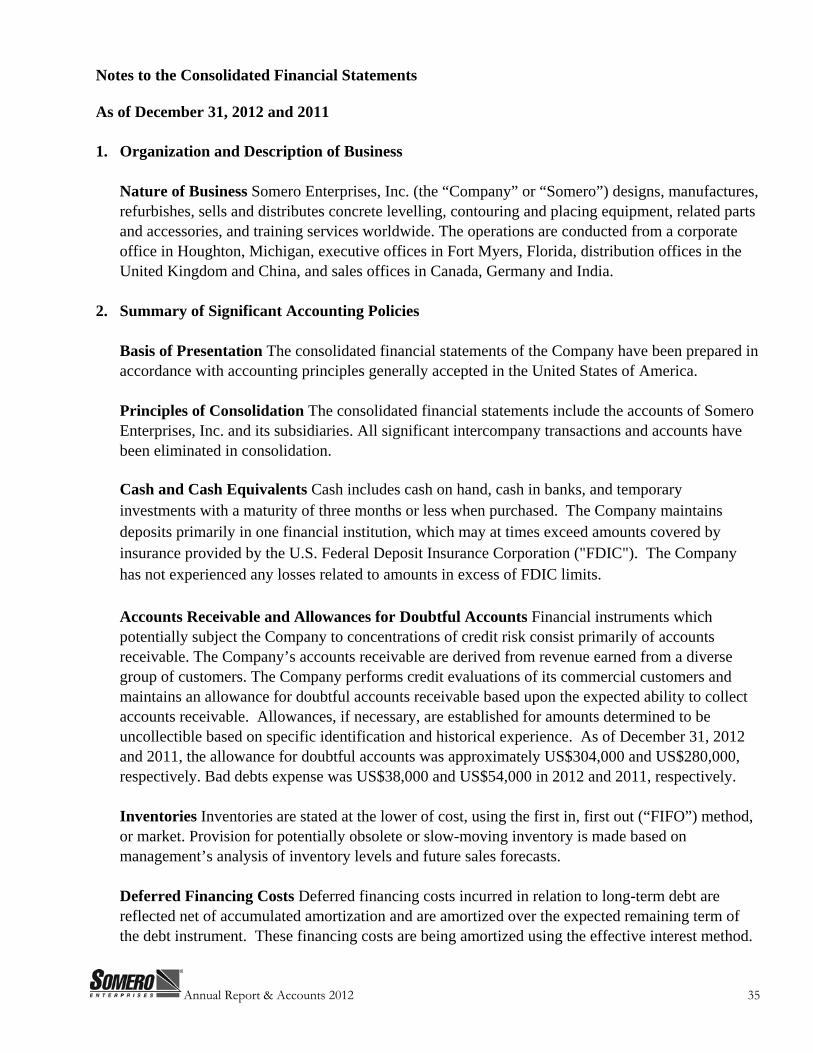
Notes to the Consolidated Financial Statements As of December 31, 2012 and 2011
1. Organization and Description of Business
Nature of Business Somero Enterprises, Inc. (the “Company” or “Somero”) designs, manufactures, refurbishes, sells and distributes concrete levelling, contouring and placing equipment, related parts and accessories, and training services worldwide. The operations are conducted from a corporate office in Houghton, Michigan, executive offices in Fort Myers, Florida, distribution offices in the United Kingdom and China, and sales offices in Canada, Germany and India.
2. Summary of Significant Accounting Policies
Basis of Presentation The consolidated financial statements of the Company have been prepared in accordance with accounting principles generally accepted in the United States of America. Principles of Consolidation The consolidated financial statements include the accounts of Somero Enterprises, Inc. and its subsidiaries. All significant intercompany transactions and accounts have been eliminated in consolidation. Cash and Cash Equivalents Cash includes cash on hand, cash in banks, and temporary investments with a maturity of three months or less when purchased. The Company maintains deposits primarily in one financial institution, which may at times exceed amounts covered by insurance provided by the U.S. Federal Deposit Insurance Corporation ("FDIC"). The Company has not experienced any losses related to amounts in excess of FDIC limits. Accounts Receivable and Allowances for Doubtful Accounts Financial instruments which potentially subject the Company to concentrations of credit risk consist primarily of accounts receivable. The Company’s accounts receivable are derived from revenue earned from a diverse group of customers. The Company performs credit evaluations of its commercial customers and maintains an allowance for doubtful accounts receivable based upon the expected ability to collect accounts receivable. Allowances, if necessary, are established for amounts determined to be uncollectible based on specific identification and historical experience. As of December 31, 2012 and 2011, the allowance for doubtful accounts was approximately US$304,000 and US$280,000, respectively. Bad debts expense was US$38,000 and US$54,000 in 2012 and 2011, respectively. Inventories Inventories are stated at the lower of cost, using the first in, first out (“FIFO”) method, or market. Provision for potentially obsolete or slow-moving inventory is made based on management’s analysis of inventory levels and future sales forecasts. Deferred Financing Costs Deferred financing costs incurred in relation to long-term debt are reflected net of accumulated amortization and are amortized over the expected remaining term of the debt instrument. These financing costs are being amortized using the effective interest method.
Annual Report & Accounts 2012 36
Intangible Assets and Goodwill Intangible assets consist primarily of customer relationships and patents, and are carried at their fair value when acquired, less accumulated amortization. Intangible assets are amortized using the straight-line method over a period of three to twelve years, which is their estimated period of economic benefit. Goodwill is not amortized but is subject to impairment tests on an annual basis, and the Company has chosen December 31 as its periodic assessment date. Goodwill represents the excess cost of the business combination over the Group’s interest in the fair value of the identifiable assets and liabilities. Goodwill arose from the Company’s prior sale from Dover Corporation to The Gores Group in 2005. The Company did not incur a goodwill impairment loss for the year ended December 31, 2012 or 2011. (see Note 4 for more information.)
The Company evaluates the carrying value of long-lived assets, excluding goodwill, whenever events and circumstances indicate the carrying amount of an asset may not be recoverable. For the year ended December 31, 2012, the Company did not incur a goodwill impairment loss and tested its other intangible assets including customer relationships and technology for impairment and found no impairment. The carrying value of a long-lived asset is considered impaired when the anticipated undiscounted cash flows from such asset (or asset group) are separately identifiable and less than the asset’s (or asset group’s) carrying value. In that event, a loss is recognized to the extent that the carrying value exceeds the fair value of the long-lived asset. Fair value is determined primarily using the anticipated cash flows discounted at a rate commensurate with the risk involved. (See Note 4 for more information.) Revenue Recognition The Company recognizes revenue on sales of equipment, parts and accessories when persuasive evidence of an arrangement exists, delivery has occurred or services have been rendered, the price is fixed or determinable, and collectability is reasonably assured. For product sales where shipping terms are F.O.B. shipping point, revenue is recognized upon shipment. For arrangements which include F.O.B. destination shipping terms, revenue is recognized upon delivery to the customer. Standard products do not have customer acceptance criteria. Revenues for training are deferred until the training is completed unless the training is deemed inconsequential or perfunctory. Warranty Liability The Company provides warranties on all equipment sales ranging from 60 days to three years, depending on the product. Warranty liabilities are estimated net of the warranty passed through to the Company from vendors, based on specific identification of issues and historical experience.
2012 2011 Balance, January 1 (73,000) (62,000) Warranty charges 264,000 98,000 Accruals (292,000) (109,000) Balance, December 31 (101,000) (73,000)
Annual Report & Accounts 2012 37
Property, Plant and Equipment Property, plant and equipment is stated at estimated market value based on an independent appraisal at the acquisition date or at cost for subsequent acquisitions, net of accumulated depreciation and amortization. Land is not depreciated. Depreciation is computed using the straight-line method over the estimated useful lives of the assets, which is 31.5 to 40 years for buildings (depending on the nature of the building), 15 years for improvements, and 2 to 10 years for machinery and equipment. Income Taxes The Company determines income taxes using the asset and liability approach. Tax laws require items to be included in tax filings at different times than the items reflected in the financial statements. Deferred tax assets and liabilities are recognized for the future tax consequences attributable to temporary differences between the financial statement carrying amounts of existing assets and liabilities and their respective tax basis and operating loss and tax credit carry forwards. Deferred tax assets and liabilities are measured using enacted tax rates expected to apply to taxable income in the years in which those temporary differences are expected to be recovered or settled. The effect on deferred tax assets and liabilities of a change in tax rates is recognized in income in the period that includes the enactment date. Deferred tax assets are reduced by a valuation allowance, if necessary, to the extent that it appears more likely than not, that such assets will be unrecoverable. In June 2006, the Financial Accounting Standards Board (FASB) issued accounting guidance to create a single model to address accounting for uncertainty in tax positions. This guidance clarifies that a tax position must be more likely than not of being sustained before being recognized in financial statements. The Company evaluates tax positions that have been taken or are expected to be taken in its tax returns, and records a liability for uncertain tax positions. This involves a two-step approach to recognizing and measuring uncertain tax positions. First, tax positions are recognized if the weight of available evidence indicates that it is more likely than not that the position will be sustained upon examination, including resolution of related appeals or litigation processes, if any. Second, the tax position is measured as the largest amount of tax benefit that has a greater than 50% likelihood of being realized upon settlement. The Company recognizes interest and penalties related to unrecognized tax benefits in the provision/ (benefit) for income taxes in general and administrative expenses in the accompanying consolidated financial statements. The Company is subject to a three year statute of limitations by major tax jurisdictions. Use of Estimates The preparation of financial statements in conformity with accounting principles generally accepted in the United States of America requires management to make estimates and assumptions that affect the amounts reported in the financial statements and accompanying notes. Actual results could differ from those estimates. Stock Based Compensation The Company recognizes the cost of employee services received in exchange for an award of equity instruments in the financial statements over the period the employee is required to perform the services in exchange for the award (presumptively the vesting period). The Company measures the cost of employee services in exchange for an award based on the grant-date fair value of the award.
Annual Report & Accounts 2012 38
Transactions in and Translation of Foreign Currency The functional currency for the Company’s subsidiaries outside the United States is the applicable local currency. Balance sheet amounts are translated at December 31 exchange rates and statement of operations accounts are translated at average rates. The resulting gains or losses are charged directly to accumulated other comprehensive income/(loss). The Company is also exposed to market risks related to fluctuations in foreign exchange rates because some sales transactions, and some assets and liabilities of its foreign subsidiaries, are denominated in foreign currencies other than the designated functional currency. Gains and losses from transactions are included as foreign exchange gain/(loss) in the accompanying consolidated statements of operations.
Comprehensive Income/(loss) Comprehensive income/(loss), is the combination of reported net income/(loss) and other comprehensive income/(loss) (“OCI”). OCI is changes in equity of a business enterprise during a period from transactions and other events and circumstances from non-owner sources not included in net income/(loss). Total comprehensive income/(loss) was approximately US$928,000 and US$(2,212,000), for the years ended December 31, 2012 and 2011, respectively.
2012 2011 US$000 US$000
Net Income/(loss) 1,020 (2,334) Cumulative Translation Adjustment (118) 18 Change in fair value of derivative instruments – net of income taxes 26 104 Total Comprehensive Income/(loss) 928 (2,212)
Earnings/(loss) Per Share Basic earnings/(loss) per share represents income/(loss) available to common stockholders divided by the weighted average number of common shares outstanding during the year. Diluted earnings/(loss) per share reflect additional common shares that would have been outstanding if dilutive potential common shares had been issued. Potential common shares that may be issued by the Company relate to outstanding stock options. All common stock equivalents were anti-dilutive as of December 31, 2011. Earnings/(loss) per common share have been computed based on the following:
2012 2011
US$000 US$000 Net income/(loss) 1,020 (2,334)
Basic weighted shares outstanding 56,425,598 56,425,598 Net dilutive effect of stock options and RSU's 5,162,101 - Diluted weighted average shares outstanding 61,587,699 56,425,598
Fair Value Measurements The Company uses fair value measurements in areas that include, but are not limited to: impairment testing of goodwill and long-lived assets and stock-based compensation arrangements. The carrying values of cash and cash equivalents, accounts receivable,
Annual Report & Accounts 2012 39
accounts payable, and other current assets and liabilities approximate fair value because of the short-term nature of these instruments. The carrying value of our long-term debt approximates fair value due to the variable nature of the interest rates under our Credit Facility.
The FASB has issued accounting guidance on fair value measurements. This guidance provides a common definition of fair value and a framework for measuring assets and liabilities at fair values when a particular standard prescribes it. This guidance also specifies a fair value hierarchy based upon the observability of inputs used in valuation techniques. These valuation techniques may be based upon observable and unobservable inputs. Observable inputs reflect market data obtained from independent sources, while unobservable inputs reflect the Company’s market assumptions. These two types of inputs create the following fair value hierarchy.
• Level 1 – Quoted prices for identical instruments in active markets. • Level 2 – Quoted prices for similar assets and liabilities in active markets; quoted prices for
identical or similar assets and liabilities in markets that are not active; and model-derived other inputs that are observable or can be corroborated by observable market data for substantially the full term of the assets and liabilities.
• Level 3 –Unobservable inputs for the asset or liability which are supported by little or no market activity and reflect the Company’s assumptions that a market participant would use in pricing the asset or liability.
Fair Value Measurements at Reporting Date
Quoted Prices In Active Markets for Significant Other Significant Unobservable December 31, 2012 and Identical Assets Observable Inputs Inputs 2011 (Level 1) (Level 2) (Level 3)
Assets: US$000 US$000 US$000 US$000 Goodwill 2,878 2,878
There were no changes in Level 3 assets in 2012.
New Accounting Pronouncements
In June 2011, the FASB issued new accounting guidance Accounting Standards Update (ASU) 2011-05, Presentation of Comprehensive Income, which amends various sections of ASC Topic 220 and allows an entity the option to present the total of comprehensive income, the components of net income, and the components of other comprehensive income either in a single continuous statement of comprehensive income or in two separate but consecutive statements. In both choices, an entity is required to present each component of net income along with total net income, each component of other comprehensive income along with a total for other comprehensive income, and a total amount for comprehensive income. ASU 2011-05 eliminates the option to present the components of other comprehensive income as part of the statement of changes in
Annual Report & Accounts 2012 40
stockholders’ equity. The amendments in ASU 2011-05 do not change the items that must be reported in other comprehensive income or when an item of other comprehensive income must be reclassified to net income. ASU 2011-05 should be applied retrospectively. The amendments in ASU 2011-05 are effective for fiscal years ending after December 15, 2012, and interim periods within those years. The Company’s adoption of this ASU did not have a material effect on the Company’s consolidated financial statements. In December 2011, the FASB issued new accounting guidance ASU 2011-12, Deferral of the Effective Date for Amendments to the Presentation of Reclassifications of Items Out of Accumulated Other Comprehensive Income in Accounting Standard Update No. 2011-05, which amends various sections of ASC Topic 220-10. The amended sections indefinitely defer the effective date of the presentation of reclassification adjustments out of accumulated other comprehensive income on the components of net income and other comprehensive income, which ASU 2011-05 would require. All other requirements of ASU 2011-05 are unaffected by this new guidance. The amendments in ASU 2011-12 are effective concurrent with ASU 2011-05, for fiscal years ending after December 15, 2012, and interim and annual periods thereafter. The Company’s adoption of this ASU did not have a material effect on the Company’s consolidated financial statements. In July 2012, the FASB issued guidance to amend Topic 350, Intangibles-Goodwill and Other. The objective of this update is to reduce the cost and complexity of performing an impairment test for indefinite-lived intangible assets by simplifying how an entity tests those assets impairment and to improve consistency in impairment testing guidance among long-lived asset categories. The amendments permit an entity to first assess qualitative factors to determine whether it is more likely than not (more than 50%) that an indefinite-lived intangible asset is impaired as a basis for determining whether it is necessary to perform the quantitative impairment test in accordance with Subtopic 350-30, Intangibles-Goodwill and Other-General Intangibles Other than Goodwill. This guidance is effective for annual and interim goodwill impairment tests performed for fiscal years beginning after September 15, 2012 with earlier implementation permitted. The Company implemented this guidance when performing its impairment evaluation at December 31, 2011 and there was no impact upon its financial statements. In February 2013, the FASB issued new accounting guidance ASU No. 2013-02, Reporting of Amounts Reclassified Out of Accumulated Other Comprehensive Income, an amendment to FASB ASC Topic 220. ASU No. 2013-02 requires disclosure of amounts reclassified out of accumulated other comprehensive income by component. In addition, an entity is required to present either on the face of the statement of operations or in the notes, significant amounts reclassified out of accumulated other comprehensive income by the respective line items of net income but only if the amount reclassified is required to be reclassified to net income in its entirety in the same reporting period. For amounts not reclassified in their entirety to net income, an entity is required to cross-reference to other disclosures that provide additional detail about those amounts. This ASU is effective prospectively for fiscal and interim periods beginning after December 15, 2013. The guidance is not expected to have a material effect on the Company’s consolidated financial statements.
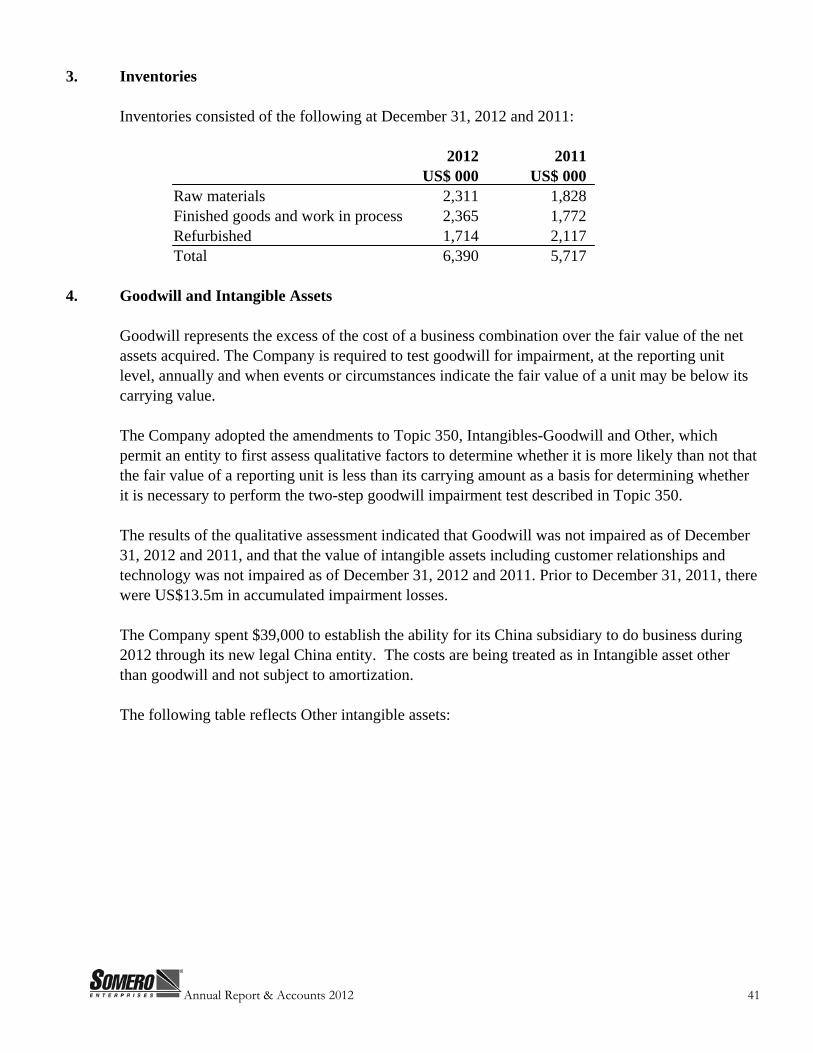
Annual Report & Accounts 2012 41
3. Inventories Inventories consisted of the following at December 31, 2012 and 2011: 2012 2011 US$ 000 US$ 000 Raw materials 2,311 1,828 Finished goods and work in process 2,365 1,772 Refurbished 1,714 2,117 Total 6,390 5,717 4. Goodwill and Intangible Assets Goodwill represents the excess of the cost of a business combination over the fair value of the net
assets acquired. The Company is required to test goodwill for impairment, at the reporting unit level, annually and when events or circumstances indicate the fair value of a unit may be below its carrying value.
The Company adopted the amendments to Topic 350, Intangibles-Goodwill and Other, which permit an entity to first assess qualitative factors to determine whether it is more likely than not that the fair value of a reporting unit is less than its carrying amount as a basis for determining whether it is necessary to perform the two-step goodwill impairment test described in Topic 350. The results of the qualitative assessment indicated that Goodwill was not impaired as of December 31, 2012 and 2011, and that the value of intangible assets including customer relationships and technology was not impaired as of December 31, 2012 and 2011. Prior to December 31, 2011, there were US$13.5m in accumulated impairment losses. The Company spent $39,000 to establish the ability for its China subsidiary to do business during 2012 through its new legal China entity. The costs are being treated as in Intangible asset other than goodwill and not subject to amortization. The following table reflects Other intangible assets:
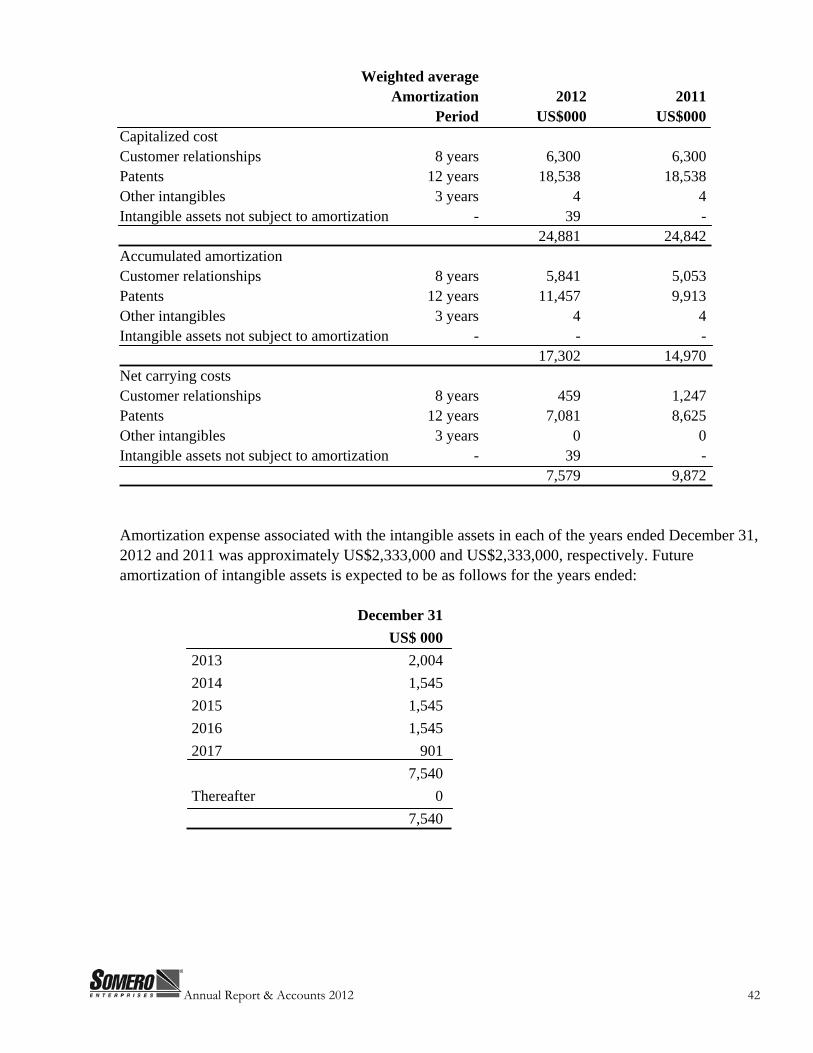
Annual Report & Accounts 2012 42
Weighted average Amortization 2012 2011 Period US$000 US$000 Capitalized cost Customer relationships 8 years 6,300 6,300 Patents 12 years 18,538 18,538 Other intangibles 3 years 4 4 Intangible assets not subject to amortization - 39 - 24,881 24,842 Accumulated amortization Customer relationships 8 years 5,841 5,053 Patents 12 years 11,457 9,913 Other intangibles 3 years 4 4 Intangible assets not subject to amortization - - - 17,302 14,970 Net carrying costs Customer relationships 8 years 459 1,247 Patents 12 years 7,081 8,625 Other intangibles 3 years 0 0 Intangible assets not subject to amortization - 39 - 7,579 9,872 Amortization expense associated with the intangible assets in each of the years ended December 31, 2012 and 2011 was approximately US$2,333,000 and US$2,333,000, respectively. Future amortization of intangible assets is expected to be as follows for the years ended: December 31
US$ 000 2013 2,004 2014 1,545 2015 1,545 2016 1,545 2017 901 7,540 Thereafter 0 7,540
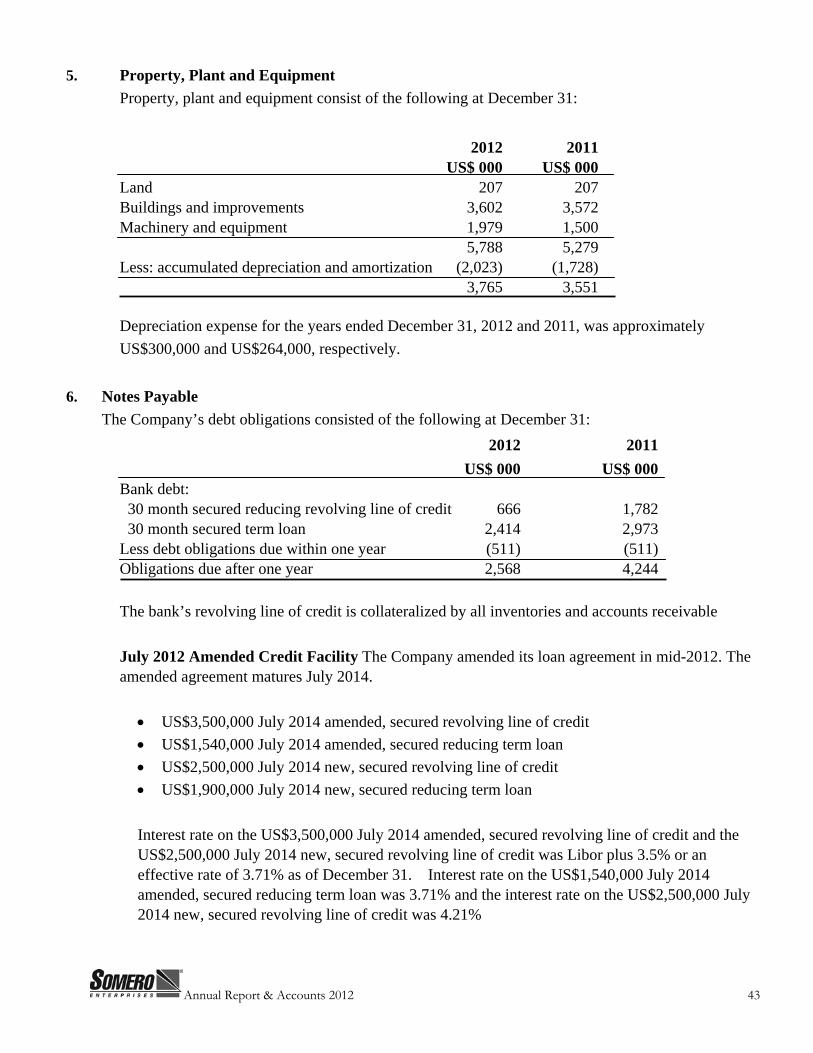
Annual Report & Accounts 2012 43
5. Property, Plant and Equipment Property, plant and equipment consist of the following at December 31:
2012 2011 US$ 000 US$ 000 Land 207 207 Buildings and improvements 3,602 3,572 Machinery and equipment 1,979 1,500 5,788 5,279 Less: accumulated depreciation and amortization (2,023) (1,728) 3,765 3,551 Depreciation expense for the years ended December 31, 2012 and 2011, was approximately
US$300,000 and US$264,000, respectively.
6. Notes Payable The Company’s debt obligations consisted of the following at December 31: 2012 2011
US$ 000 US$ 000 Bank debt: 30 month secured reducing revolving line of credit 666 1,782 30 month secured term loan 2,414 2,973 Less debt obligations due within one year (511) (511) Obligations due after one year 2,568 4,244 The bank’s revolving line of credit is collateralized by all inventories and accounts receivable July 2012 Amended Credit Facility The Company amended its loan agreement in mid-2012. The amended agreement matures July 2014.
• US$3,500,000 July 2014 amended, secured revolving line of credit • US$1,540,000 July 2014 amended, secured reducing term loan • US$2,500,000 July 2014 new, secured revolving line of credit • US$1,900,000 July 2014 new, secured reducing term loan
Interest rate on the US$3,500,000 July 2014 amended, secured revolving line of credit and the US$2,500,000 July 2014 new, secured revolving line of credit was Libor plus 3.5% or an effective rate of 3.71% as of December 31. Interest rate on the US$1,540,000 July 2014 amended, secured reducing term loan was 3.71% and the interest rate on the US$2,500,000 July 2014 new, secured revolving line of credit was 4.21%
Annual Report & Accounts 2012 44
Future Payments The future payments by year under the Company’s amended loan are as follows: December 31 US$ 000
2013 511 2014 2,568 Total payments 3,079
March 2013 Amended Credit Facility The Company plans to enter into an amended credit facility in March 2013. The new agreement will mature between March 2016 and March 2018.
• US$5,000,000 March 2016 secured revolving line of credit • US$6,000,000 March 2018 delayed draw term loan • US$1,477,000 March 2018 Commercial Real Estate Mortgage
The Company will enter into a new credit facility up to a maximum of US$12,477,000. The interest rates on each of the loans will be Libor plus a percentage based upon a covenant schedule up to a maximum of Libor plus 3.5%. The Company’s new loan facility is secured by substantially all of its business assets. The fees that will be paid to the bank are US$30,000.
Interest
Interest expense on the notes payable for the years ended December 31, 2012 and 2011, was approximately US$328,000 and US$454,000, respectively, related to the debt obligations. Interest expense includes US$26,000 and US$104,000 in 2012 and 2011, respectively, related to the loss on cash flow hedges as a result of paying off interest rate swaps in 2009 that were recognized in the statements of operations as interest expense and removed from other comprehensive income/(loss).
7. Retirement Program
The Company has a savings and retirement plan for its employees, which is intended to qualify under Section 401(k) of the Internal Revenue Code (“IRC”). This savings and retirement plan provides for voluntary contributions by participating employees, not to exceed maximum limits set forth by the IRC. The Company match vests immediately. The Company matched 100% of the employee’s contribution up to the first 6% of the employee’s compensation through June 30, 2009. From July 1, 2009 through December 31, 2011, the Company suspended the match. The Company reinstated its 401k match in 2012 for employees up to 6% of their income. The Company contributed approximately US$161,000 to the savings and retirement plan during the year ended December 31, 2012 and no such contribution was made during 2011.
Annual Report & Accounts 2012 45
8. Operating Leases The Company leases property, vehicles and office equipment under leases accounted for as operating leases without renewal options. Future minimum payments by year under non-cancellable operating leases with initial terms in excess of one year were as follows:
December 31 US$ 000 2013 276 2014 229 2015 210 2016 111 Thereafter - Total 478
9. Supplemental Cash Flow and Non-Cash Financing Disclosures 2012 2011 US$ 000 US$ 000
Cash paid for interest 195 259 Cash paid/ (received) for taxes 11 (355) Non-cash financing activities – Change in fair value of derivative instruments (26) (104) Inventory received in lieu of payment - 119
10. Business and Credit Concentration The Company’s line of business could be significantly impacted by, among other things, the state of
the general economy, the Company’s ability to continue to protect its intellectual property rights, and the potential future growth of competitors. Any of the foregoing may significantly affect management’s estimates and the Company’s performance. At December 31, 2012 and 2011, the Company had two customers which represented 29% and 30% of total accounts receivables, respectively.
11. Commitments and Contingencies
The Company has entered into employment agreements with certain members of senior management. The terms of these are for renewable one year periods and include non-compete and nondisclosure provisions as well as provide for defined severance payments in the event of termination or change in control.
The Company is subject to various unresolved legal actions which arise in the normal course of its
business. Although it is not possible to predict with certainty the outcome of these unresolved legal actions or the range of possible losses, the Company believes these unresolved legal actions will not have a material effect on its consolidated financial statements.
12. Income Taxes
The Company adopted guidance from the FASB in 2007 which clarifies the accounting for uncertainty in income taxes recognized in an enterprise’s financial statements. The guidance also prescribes a recognition threshold and measurement attribute for the
Annual Report & Accounts 2012 46
financial statement recognition and measurement of a tax position taken or expected to be taken in a tax return. This pronouncement also provides guidance on derecognition, classification, interest and penalties, accounting in interim periods, disclosures and transition. The Company is subject to U.S. federal income tax as well as income tax of multiple state jurisdictions. The Company began business in 2005. The statute of limitations for all federal, foreign and state income tax matters for tax years from 2009 forward are still open. The Company has no federal, foreign or state income tax returns currently under examination.
12/31/2012 12/31/2011 US$ 000 US$ 000 Current Income Tax Federal 136 (24) State - - Foreign 59 43 Total current income tax provision 195 19
Deferred tax expense Federal - - State - - Foreign - - Total deferred tax provision/(benefit) - -
Total provision/(benefit) 195 19
Annual Report & Accounts 2012 47
The components of the net deferred income tax asset at December 31, 2012 and 2011 were as follows:
12/31/2012 12/31/2011 US$ 000 US$ 000 Deferred Tax Asset Intangibles 1,775 1,530 Intangibles - Foreign 122 121 Goodwill 1,968 2,336 Stock-based compensation 102 43 Net Operating Loss - State 67 74 Net Operating Loss - Foreign 883 757 Net Operating Loss - Federal - 442 Foreign Tax Credit Carryover 237 237 Other 278 216 Gross deferred tax asset 5,431 5,756
Valuation Allowance (5,073) (5,416) Deferred tax asset 359 340
Deferred Tax Liability Depreciation (246) (236) Prepaids (113) (104) Net deferred tax asset (liability) - -
Current - - Non-current - - Net deferred tax asset - -
Rate Reconciliation Consolidated Income/(loss) before tax 1,216 (2,315) Statutory rate 34% 34% Statutory tax expense 413 (787)
State taxes 1 1 Revaluation of Deferred Tax Assets 30 45 Meals and Entertainment 25 22 Foreign Tax Items 122 125 Valuation Allowance (343) 131 Other (53) 482 Tax provision 195 19
At December 31, 2012, the Company had no net deferred tax assets. In assessing the realizability of deferred tax assets, management considers whether it is more likely than not that some portion or all of the deferred tax assets will not be realized. The ultimate realization of the deferred tax assets is dependent upon the generation of future taxable income during the periods in which those temporary differences become deductible. Since realization of any future tax benefit at December 31, 2012 and 2011 was not sufficiently assured, a valuation allowance for the 2012 and 2011 net deferred tax asset was provided for. The Company has US$4,869,368 in state loss carry forwards with varying expiration dates and US$3,395,756 in foreign loss carry forwards with indefinite expiration dates.
Annual Report & Accounts 2012 48
13. Revenues by Geographic Region The Company sells its product to customers throughout the world. The breakdown by location is as
follows: 2012 2011 US$ 000 US$ 000
United States and U.S. possessions 15,377 9,124 Canada 2,758 1,027 Rest of world 14,036 11,721 Total 32,171 21,872
A significant portion of the Company’s long-lived assets are located in the United States. 14. Stock Based Compensation
The Company has one stock-based compensation plan, which is described below. The compensation cost that has been charged against income/(loss) for the plan was approximately US$166,000 and US$90,000 for the years ended December 31, 2012 and 2011, respectively. The income tax effect recognized for stock based compensation was approximately a benefit of US$32,000 in each of the years ended December 31, 2012 and 2011.
Stock Options
An initial grant was made in February 2010 for 2.3 million stock options as replacements for grants under the old option plan, which were cancelled when the old plan was abandoned. The grants have a three year vesting and a strike price of 30p, a 100% premium over the market price on the date of grant. The remaining stock options will only be issued for new key employees and superior performance.
Options granted under the Plan have a term of up to 10 years and generally vest over a three-year period beginning on the date of the grant. Options under the Plan must be granted at a price not less than the fair market value at the date of grant. The fair value of each option award is estimated on the date of grant using the Black-Scholes-Merton option pricing model. The risk-free interest rate is based on the U.S. Treasury rate for the expected term at the time of grant, volatility is based on the average long-term implied volatilities of peer companies as our Company has limited trading history and the expected life is based on the average of the life of the options of 10 years and an average vesting period of 3 years. The following table illustrates the assumptions for the Black-Scholes model used in determining the fair value of options granted to employees for the years ended December 31, 2012 and 2011. No new options were granted in 2012.
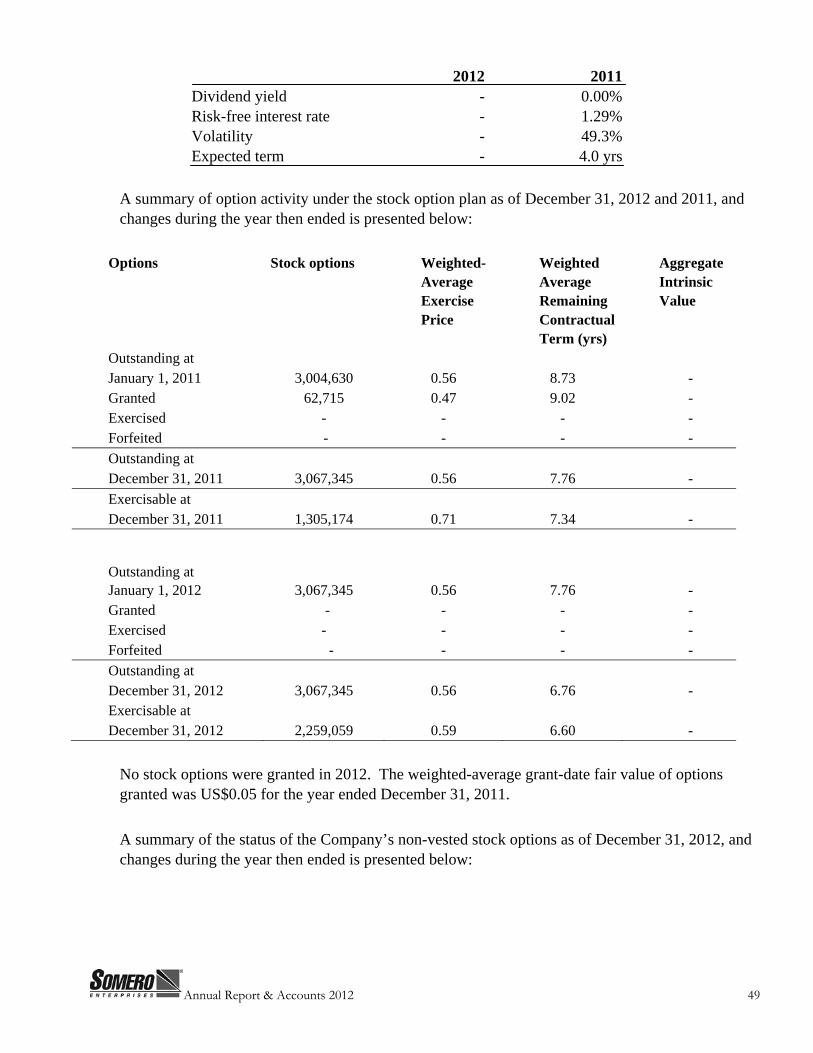
Annual Report & Accounts 2012 49
2012 2011 Dividend yield - 0.00% Risk-free interest rate - 1.29% Volatility - 49.3% Expected term - 4.0 yrs
A summary of option activity under the stock option plan as of December 31, 2012 and 2011, and changes during the year then ended is presented below:
Options Stock options Weighted- Weighted Aggregate Average Average Intrinsic Exercise Remaining Value Price Contractual
Term (yrs) Outstanding at January 1, 2011 3,004,630 0.56 8.73 - Granted 62,715 0.47 9.02 - Exercised - - - - Forfeited - - - - Outstanding at December 31, 2011 3,067,345 0.56 7.76 - Exercisable at December 31, 2011 1,305,174 0.71 7.34 - Outstanding at
January 1, 2012 3,067,345 0.56 7.76 - Granted - - - - Exercised - - - - Forfeited - - - - Outstanding at December 31, 2012 3,067,345 0.56 6.76 - Exercisable at December 31, 2012 2,259,059 0.59 6.60 -
No stock options were granted in 2012. The weighted-average grant-date fair value of options granted was US$0.05 for the year ended December 31, 2011. A summary of the status of the Company’s non-vested stock options as of December 31, 2012, and changes during the year then ended is presented below:
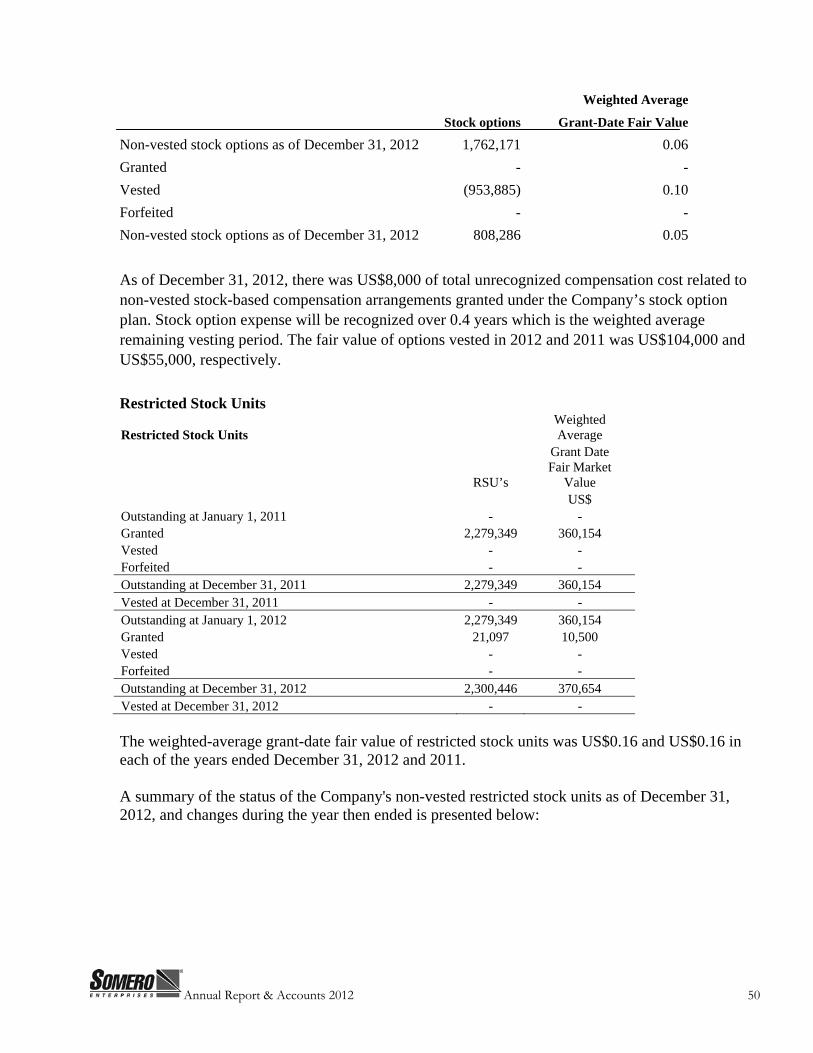
Annual Report & Accounts 2012 50
Weighted Average
Stock options Grant-Date Fair Value
Non-vested stock options as of December 31, 2012 1,762,171 0.06 Granted - - Vested (953,885) 0.10 Forfeited - - Non-vested stock options as of December 31, 2012 808,286 0.05
As of December 31, 2012, there was US$8,000 of total unrecognized compensation cost related to non-vested stock-based compensation arrangements granted under the Company’s stock option plan. Stock option expense will be recognized over 0.4 years which is the weighted average remaining vesting period. The fair value of options vested in 2012 and 2011 was US$104,000 and US$55,000, respectively. Restricted Stock Units
Restricted Stock Units Weighted Average
Grant Date
RSU’s Fair Market
Value US$
Outstanding at January 1, 2011 - - Granted 2,279,349 360,154 Vested - - Forfeited - - Outstanding at December 31, 2011 2,279,349 360,154 Vested at December 31, 2011 - - Outstanding at January 1, 2012 2,279,349 360,154 Granted 21,097 10,500 Vested - - Forfeited - - Outstanding at December 31, 2012 2,300,446 370,654 Vested at December 31, 2012 - - The weighted-average grant-date fair value of restricted stock units was US$0.16 and US$0.16 in each of the years ended December 31, 2012 and 2011. A summary of the status of the Company's non-vested restricted stock units as of December 31, 2012, and changes during the year then ended is presented below:
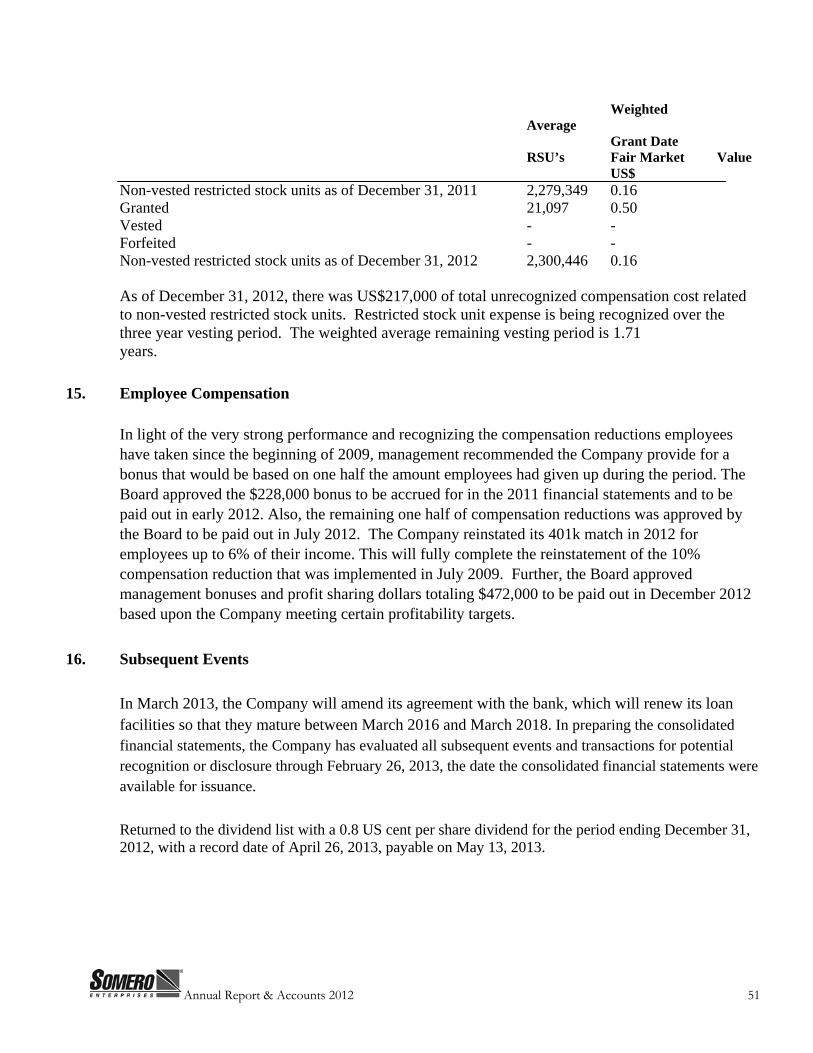
Annual Report & Accounts 2012 51
Weighted Average Grant Date RSU’s Fair Market Value US$ Non-vested restricted stock units as of December 31, 2011 2,279,349 0.16 Granted 21,097 0.50 Vested - - Forfeited - - Non-vested restricted stock units as of December 31, 2012 2,300,446 0.16 As of December 31, 2012, there was US$217,000 of total unrecognized compensation cost related to non-vested restricted stock units. Restricted stock unit expense is being recognized over the three year vesting period. The weighted average remaining vesting period is 1.71 years.
15. Employee Compensation
In light of the very strong performance and recognizing the compensation reductions employees have taken since the beginning of 2009, management recommended the Company provide for a bonus that would be based on one half the amount employees had given up during the period. The Board approved the $228,000 bonus to be accrued for in the 2011 financial statements and to be paid out in early 2012. Also, the remaining one half of compensation reductions was approved by the Board to be paid out in July 2012. The Company reinstated its 401k match in 2012 for employees up to 6% of their income. This will fully complete the reinstatement of the 10% compensation reduction that was implemented in July 2009. Further, the Board approved management bonuses and profit sharing dollars totaling $472,000 to be paid out in December 2012 based upon the Company meeting certain profitability targets.
16. Subsequent Events In March 2013, the Company will amend its agreement with the bank, which will renew its loan facilities so that they mature between March 2016 and March 2018. In preparing the consolidated financial statements, the Company has evaluated all subsequent events and transactions for potential recognition or disclosure through February 26, 2013, the date the consolidated financial statements were available for issuance. Returned to the dividend list with a 0.8 US cent per share dividend for the period ending December 31, 2012, with a record date of April 26, 2013, payable on May 13, 2013.
Annual Report & Accounts 2012 52
Advisers and Corporate Information
Directors
Lawrence Horsch – Chairman and Non-Executive Director John T. Cooney – President and Chief Executive Officer
Michael F. Niemela – Chief Financial Officer and Secretary Ronald Maskalunas – Non-Executive Director
Thomas M. Anderson – Non-Executive Director Registered and Head Office Somero Enterprises, Inc 16831 Link Court Fort Myers, Florida 33912 USA Registered Number Incorporated in the State of Delaware, USA under the Delaware General Corporation Law with registered number 3589295 Registrars Computershare Investor Services (Jersey) Limited Queensway House Hilgrove Street St Helier Jersey JE1 1ES Channel Islands
Nomad Canaccord Genuity Hawkpoint 41 Lothbury London EC2R 7AE UK
Broker Canaccord Genuity 9th Floor 88 Wood Street London EC2V 7QR UK
Advisers Legal Brown Rudnick LLP 8 Clifford Street London W1S 2LQ UK
Auditors Whitley Penn LLP Suite 400 8343 Douglas Ave Dallas, TX 75225
Annual Report & Accounts 2012 53
Notice of Annual General Meeting of Stockholders
SOMERO ENTERPRISES, INC. (the “Company”) (Incorporated in the State of Delaware, USA under the Delaware General Corporation Law (the “DGCL”) with registered number 3589295) Notice is given that the Annual General Meeting of Stockholders (the “AGM”) of the Company will be held at the offices of Collins Stewart Hawkpoint Plc., 88 Wood Street, London EC2V 7QR on April 30, 2013 at 11:00 am local time for the following purposes: To consider and, if thought fit, to pass the following resolutions: 1. To ratify the Directors’ Report and the Annual Report and the Company audited financial statements for the year ended December 31, 2012. 2. To ratify the Directors’ Remuneration Report for the year ended December 31, 2012. 3. To re-elect Ronald Maskalunas as a Class I Director. 4. To re-elect Michael Niemela as a Class I Director. 4. To ratify the appointment of Whitley Penn LLP as the auditors of the Company for the fiscal year ending December 31, 2013. 5. To consider and act upon any matters incidental to the foregoing purposes and any other matters which may properly come before the AGM or any adjourned session thereof. Please refer to the Annual Report and form of proxy, which forms a part of this Notice and is incorporated in this Notice by reference, for further information with respect to the business to be transacted at the AGM. Stockholders of record at the close of business on March 6, 2013 are entitled to receive notice of, and vote at, the AGM or any adjournment or postponement of the AGM. Whether or not you expect to attend the AGM, please complete, date and return the enclosed proxy as promptly as possible in order to ensure your representation at the AGM. To be effective, proxies must be sent to or deposited at the office of the Company’s registrars (Computershare Investor Services PLC, The Pavilions, Bridgwater Road, Bristol BS99 6ZY) so as to be received not later than 48 hours before the time for the AGM (provided that the Company may waive such requirement in its sole discretion). Even if you have given your proxy, you may still vote in person if you attend the AGM. You may inspect a complete list of the stockholders eligible to vote at the AGM during normal business hours at our offices located at 16831 Link Court, Fort Myers, Florida 33912, USA, during the ten days prior to the date of the AGM and also at the location indicated above during the AGM. The Board of Directors unanimously recommends a vote “FOR” each of the proposed resolutions. All stockholders are cordially invited to attend the AGM. By order of the Board of Directors. Michael Niemela, Secretary March 6, 2013 Notes: 1. The Company’s Board of Directors has approved the Annual Report (including the Director’s Report and the Directors’ Remuneration Report contained therein) and the Company’s audited financial statements for the year ended December, 31 2012. Stockholder ratification of the Annual Report (including the Director’s Report and the Directors’ Remuneration Report contained therein) and the Company’s audited financial statements for the year ended December 31, 2012 is not mandatory under Delaware law. However, the Board is submitting the Annual Report (including the Director’s Report and the Directors’ Remuneration Report contained therein) and the Company’s audited financial statements for the year ended December 31, 2012 to the stockholders for ratification as a matter of good corporate practice. If ratification is not approved a majority of the shares of common stock voting at the AGM in person or by proxy, the Board will reconsider its approval thereof. 2. The Company’s Board of Directors has selected Whitley Penn LLP to serve as the Company’s auditors until the next Annual AGM of Stockholders. Stockholders ratification of the selection of Whitley Penn LLP as the Company’s auditors is not mandatory under Delaware law. However, the Board is submitting the selection of Whitley Penn LLP to the stockholders for ratification as a matter of good corporate practice. If ratification is not approved a majority of the shares of common stock voting at the AGM in person or by proxy, the Board will reconsider its approval thereof. 3. In accordance with the Company’s Bylaws, the holders of one-third in voting power of all issued and outstanding stock entitled to vote at the AGM, present in person or presented by proxy, shall constitute a quorum for the transaction of business.