Embed Size (px)
Citation preview
Somerset County, Maryland
Water Resources Element March 2010

Somerset County Comprehensive Plan - 1 - Water Resources Element
Water Resources Element The Water Resources Element of the Somerset County Comprehensive Plan creates a policy framework for sustaining public drinking water supplies and protecting the County’s waterways and riparian ecosystems by effectively managing point and nonpoint source water pollution. It complies with the requirements of Article 66B of the Annotated Code of Maryland—as modified by Maryland House Bill 1141, passed in 2006.
The Water Resources Element identifies opportunities to manage existing water supplies, wastewater effluent, and stormwater runoff, in a way that balances the needs of the natural environment with the County’s projected growth, including the growth projected for the County’s municipalities. In this way, the Water Resources Element helps to protect the local and regional ecosystem while ensuring clean drinking water for future generations of Somerset County residents.
Interjurisdictional Coordination There are two incorporated municipalities in Somerset County: Princess Anne and Crisfield. Residents and businesses of six areas of the County (Princess Anne, Crisfield, Fairmount, and the communities of Rhodes Point, Ewell, and Tylerton on Smith Island) are served by community water and/or sewer service. The City of Crisfield manages its own, while the Somerset County Sanitary District (SCSD) operates the Princess Anne system.
The County recognizes the importance of interjurisdictional water resources planning. This Countywide Water Resources Element compiles, to the greatest degree possible, up-to-date data from the municipalities, in order to coordinate water resources, growth, and land use planning. In particular, the draft Municipal Growth Elements (MGE) and Water Resources Elements (WRE) from the County’s two municipalities—Crisfield and Princess Anne—were reviewed in the preparation of this Element. The future water and sewer system boundaries reflect MGE boundaries. Where possible, the County has also obtained data and information on water resources from adjoining Counties, in order to paint the fullest possible picture of future impacts to the Wicomico, Manokin, Big Annemessex, and other rivers and streams that drain the County.
I. Goals Maintain a safe and adequate water supply, and adequate amounts of wastewater treatment capacity to serve projected growth.
Take steps to protect and restore water quality, and to meet water quality regulatory requirements in the county’s rivers and streams.
II. County Projections and Scenarios
A. Watersheds This Element takes a watershed-based approach in analyzing the impact of future growth on Somerset County’s water resources—particularly in relation to nutrients discharged to the County’s streams. Land in Somerset County drains to one of ten major watersheds (or “8-digit watersheds,” referring to the numeric classification system used by the Maryland Department of the Environment). These watersheds, shown on Map 1, are: the Big Annemessex River, Dividing Creek, Lower Chesapeake Bay, Lower Pocomoke River, Lower Wicomico River, Manokin River, Monie Bay, Pocomoke Sound, Tangier Sound, and Wicomico Creek.

Somerset County Comprehensive Plan - 2 - Water Resources Element

Somerset County Comprehensive Plan - 3 - Water Resources Element
B. Population Projections The Water Resources Element uses Countywide population projections developed by the Maryland Department of Planning (MDP), shown in Table 1. These projections indicate that the County population will reach approximately 29,350 by the year 2030, an annual increase of approximately 0.5 percent per year, or 12 percent overall between 2008 and 2030.
Table 1. Population Projections for the Water Resources Element Year Change, 2008-2030
2008 2010 2015 2020 2025 2030 Number Percent Annual
Increase 26,119 26,550 27,500 28,300 28,950 29,350 3,231 12% 0.50%
Sources: 2008: MDP, 2008 Estimates for Maryland’s Jurisdictions All Other Years: MDP, Projected Total Population for Maryland’s Jurisdictions (Revisions, December 2008).
C. Future Development Scenario To gauge the impacts of alternative land use and water resources policies, this Water Resources Element uses three scenarios for the distribution of future growth. These scenarios are:
• Trends: Continues past trends whereby approximately half of all new residential and non-residential growth is directed to existing Priority Funding Areas (PFAs), or to areas identified for future public water and sewer service by the County’s Water and Sewer Master Plan. Remaining development would occur in areas outside of public water and sewer service. This scenario represents the 1996 Comprehensive Plan, as expressed through current zoning.
• PFA Focus: All new growth would be directed to existing PFAs, including Princess Anne, Crisfield, and areas surrounding the two municipalities that have been identified for future public water and sewer service by the County’s Water and Sewer Master Plan.1
• Hybrid: This scenario is a middle ground between the Trends and PFA Focus scenarios. Approximately three-quarters of new development would be directed to existing PFAs, or to areas identified for future public water and sewer service by the County’s Water and Sewer Master Plan. Remaining development would occur in areas outside of public water and sewer service.
A negligible amount of new development would occur in areas outside of public water and sewer service.
Because water and sewer service is often measured in terms of Equivalent Dwelling Units, or EDU,2
A more detailed account of how these projections were developed is included in the Water Resources Element Appendix.
the Water Resources Element uses housing units as the basis for its water, sewer, and nonpoint source pollution analyses. Table 2 shows the projected watershed-level distribution of housing units in each of the three scenarios described above. The projected increase of 1,428 housing units represents an annual increase of approximately 0.6 percent per year between 2008-2030, or 13 percent overall. The rate of housing growth outpaces population growth due to projected declines in household size through 2030.
1 Other areas identified for future water and sewer service, such as Deal Island/Dames Quarter, Pocomoke City, and Marion, are not considered to be a “PFA” for purposes of these scenarios. This assumption is used only for the purpose of modeling future scenarios, and does not preclude the future extension of service to these areas. 2 An EDU represents the average amount of water used by one household, and is also used to calculate residential and non-residential (e.g., businesses) water demand. In Somerset County, one EDU equals 250 gpd, except in Crisfield, where one EDU is 277 gpd.

Somerset County Comprehensive Plan - 4 - Water Resources Element
Table 2. Housing Unit Projections by Watershed
Watersheds 2008
Existing
2008-2030 Growth
1 Trends PFA Hybrid
Increment Total Incr. Total Incr. Total Big Annemessex River Crisfield 192 41 233 82 274 62 254 Remainder of Watershed 656 82 728 656 41 697 Dividing Creek 168 67 235 168 33 201 Lower Chesapeake Bay 233 8 241 533 4 237 Lower Pocomoke River 526 88 614 526 44 570 Lower Wicomico River 292 18 310 292 9 301 Manokin River Princess Anne 2,793 316 3,109 632 3,425 474 3,267 Remainder of Watershed 1,062 203 1,265 1,062 101 1,163 Monie Bay 527 69 596 527 35 562 Pocomoke Sound Crisfield 227 149 376 299 526 224 451 Remainder of Watershed 803 110 913 803 55 858 Tangier Sound Crisfield 2,058 208 2,266 416 2,474 321 2,370 Remainder of Watershed 625 7 632 625 3 628 Wicomico Creek 616 64 680 616 32 648 Total 10,778 1,428 12,206 1,428 12,206 1,428 12,206 1: Source: Maryland Property View 2007
III. Drinking Water Assessment This section describes existing conditions and projected future demand for drinking water in Somerset County.
A. Public Water Systems In Somerset County, groundwater is the sole source of drinking water, and the source of virtually all domestic and industrially consumed water. Table 3 summarizes water sources and other characteristics of the public drinking water systems in the County. Map 2 shows the location of these water service areas as of 2008, areas that are expected to receive service within two years, and areas expected to receive service at a later date (more than two years—potentially within ten years). A more detailed description of the aquifers used by these public systems is included in the Water Resources Element Appendix. More detailed information on existing and proposed future water service areas can be found in the County’s Water and Sewer Master Plan.
Approximately 5,223 dwelling units in Somerset County (slightly more than half of all dwelling units in the County) and a considerable share of businesses receive drinking water from municipal, County, or community water systems. These systems are described in Table 3. All public water systems are supplied by groundwater wells.

Somerset County Comprehensive Plan - 5 - Water Resources Element

Somerset County Comprehensive Plan - 6 - Water Resources Element
Table 3. Public Drinking Water System Characteristics
Water System¹ Source Aquifer
(number of wells) Source Concerns and
System Issues
Crisfield Potomac, Paleocene, Piney Point (5 total) Fluoride
Princess Anne Patapsco (1), Manokin (6) Fluoride (Patapsco); Iron (Manokin) Fairmount (Rumbley, Frenchtown) Patapsco (2) Fluoride, iron Midtown Patapsco Fluoride, disinfection Hill Patapsco Fluoride, disinfection Field Patapsco Fluoride, disinfection Ewell (Smith Island) Patapsco (5) Fluoride, disinfection Rhodes Point(Smith Island) Patapsco (2) Fluoride, disinfection Tylerton (Smith Island) Patapsco (1) Fluoride, disinfection Eastern Correctional Institution Patapsco (2), Manokin (2) Fluoride, iron Eden Mobile Home Park Manokin Iron Source: 2008 Somerset County Water and Sewer Master Plan Notes 1: SCSD operates the systems in Princess Anne, Fairmount, and Rumbley/Frenchtown. The City of Crisfield operates its water system. The Maryland Environmental Service (MES) operates the ECI water system. All other public or community water systems in Somerset County are privately operated.
Table 4 shows existing and projected future drinking water supplies, demands, surpluses, and deficits for major public water systems under each of the three scenarios described above.3
This analysis includes the 2009 agreement between the County, MDE, and ECI to expand water withdrawals for the Princess Anne system. Under the agreement, the County will develop two new wells near Revell’s Neck Road (south of Princess Anne, in the vicinity of ECI), with permitted withdrawals of 450,000 gpd (in addition to the County’s existing permitted withdrawals for the Princess Anne system). That raw water will be treated via reverse osmosis to remove fluoride at an expanded water treatment plant (WTP) at ECI before being conveyed to the Princess Anne system via new water distribution lines. As part of the WTP upgrade, ECI will also increase its own system capacity to as much as 710,000 gpd.
Crisfield and Princess Anne will have adequate capacity to support growth and development through 2030 (and beyond), regardless of scenario.
4
B. Other Water Use
The Smith Island systems will not have adequate capacity to support growth through 2030. Section III-C discusses options for addressing shortfalls in public water systems.
All residential units and businesses in Somerset County outside of the above public water systems rely on individual or community wells. These wells are drilled in a variety of water-bearing formations, particularly the Pleistocene (surficial aquifer), Manokin, Piney Point, and Pocomoke aquifers.5
Table 5 shows the distribution of Countywide water use in 2000. Although not a precise representation of current water use, Table 5 does highlight the County’s major water users: public systems, private residential users, commercial users, and livestock. The remainder of this section discusses those major categories of non-public water users in greater detail.
3 The Field, Hill, Midtown, and Eden systems serve very small populations (Eden is the largest, with a capacity of approximately 20,000 gpd, or 80 EDU). None of these systems are capable of supporting significant amounts of growth, and are therefore assumed to remain largely unchanged through 2030. 4 Source: MES. 19 August 2009. 5 Source: 2008 Somerset Water and Sewer Plan

Somerset County Comprehensive Plan - 7 - Water Resources Element
Table 4. Public Water System Demand and Capacity, 2030
Crisfield Princess Anne 5 Fairmount/Rumbley/
FrenchtownSmith Island (Combined)6, 7
ECI
6 Trend 8 PFA Hybrid Trend PFA Hybrid Trend PFA Hybrid Trend PFA Hybrid
Existing Water Production
gpd1
1,500,000 2 896,000 60,000 191,000 500,000
EDU 5,415 2 3,584 240 764 2,000
Demand, 2007 gpd 800,000 733,000 61,000 199,250 500,000
EDU 2,888 2,932 244 797 2,000
Net Available Capacity, 2007
gpd 700,000 163,000 (1,000) -8,250 0 EDU 2,527 652 (4) -33 0
Total New Projected Demand
gpd 3
190,337 311,702 251,020 195,873 282,747 239,310 23,212 2,750 9,741 1,922 0 961 210,000
EDU 687 1,125 906 783 1,131 957 93 11 39 8 0 4 0
Grand Total Demand, 2030
gpd 990,337 1,111,702 1,051,020 928,873 1,015,747 972,310 84,212 63,750 70,741 201,203 199,250 200,227 710,000 EDU 3,575 4,013 3,794 3,707 4,055 3,881 337 255 283 805 797 801 2,840
Future Capacity, 2030
gpd 4
1,481,540 1,346,000 60,000 191,000 710,000 EDU 5,349 5,384 240 764 2,840
Net Available Projected Capacity, 2030
gpd 491,203 369,838 430,520 417,127 330,253 373,690 (24,212) (3,750) (10,741) (10,172) (8,250) (9,211) 0
EDU 1,773 1,335 1,554 1,669 1,321 1,495 (97) (15) (43) (41) (33) (37) 0
Notes: 1: Indicates the more restrictive of either the district’s permitted withdrawal or the water treatment plant’s treatment capacity. Sources: SCSD, City of Crisfield, Town of Princess Anne. 2: gpd = gallons per day; EDU = An Equivalent Dwelling Unit (EDU), equal to 250 gpd. This figure represents the average amount of water used by one household, and is also used to calculate residential and non-residential (e.g., businesses) water demand. For Crisfield, one EDU equals 277 gpd. 3: Includes all existing and projected new residential and nonresidential demand, as well as new demand from system extensions. Assumes that new nonresidential development is 10% of residential development, based on existing ratios of nonresidential EDUs to residential EDUs. 4: Reflects all potential or planned system upgrades and expansions. Sources: 2008 Somerset County Water and Sewer Master Plan, County Staff, Crisfield and Princess Anne WREs, and Maryland Environmental Service (MES) for ECI. 5: For Crisfield, the Trends Scenario reflects the City’s Draft WRE (28 July 2009) 6: For systems other than Princess Anne and Crisfield, it is assumed that the public system growth rate in system equals growth rate in underlying watershed. 7: The withdrawal permit for the combined Fairmount system is 60,000 gpd. However, the County believes that this limit was issued in error, given the permitted capacities of the previously separate Frenchtown, Rumbley, and Fairmount systems. The pumping capacity of the Fairmount well alone is in excess of 122,400 gpd, and other wells are available. 8: MES did not report ECI’s future water demand; this figure is presumed to match the system’s future capacity.

Somerset County Comprehensive Plan - 8 - Water Resources Element
Table 5. Freshwater Withdrawals in Somerset County, 2000
Type of Withdrawal Surface Water
(MGD) Groundwater
(MGD) Total
(MGD) Percent of County
Withdrawals Commercial 0 0.78 0.78 16.5% Industrial 0 0.02 0.02 0.4% Mining 0 0 0 0.0% Livestock Watering 0.02 0.64 0.66 14.0% Aquaculture 0 0 0 0.0% Irrigation 0 0.4 0.4 8.5% Self-supplied domestic 0 1.16 1.16 24.5% Public Supply 0 1.71 1.71 36.2% Total 0.02 4.71 4.73 100.0% Source: USGS MD-DE-DE Water Science Center http://md.water.usgs.gov/freshwater/withdrawals/#top
Private Residential Wells Approximately 5,555 residential units in Somerset County (more than half of the County total) rely on individual wells (or, in a few cases such as mobile home parks, community wells) for drinking water supply, as do most businesses in rural portions of the County. These residential and small commercial uses accounted for approximately 1.16 MGD of groundwater withdrawal in 2000. The Piney Point aquifer is frequently used in the western and southern portions of the County, while the Manokin and Piney Point aquifers are most frequently used in the central portion of the County. Residents in the southern and southeastern portions of the County draw a limited amount of water from the Pocomoke aquifer. Individual wells near Crisfield, Rumbley, Frenchtown, and on Smith Island also use the Pocomoke aquifer.
Major Commercial, Industrial, and Institutional Users As shown in Table 5, commercial and industrial activities outside of public systems account for approximately one-fifth of all water used in Somerset County. The largest concentrations of commercial water use are found in the Princess Anne and Crisfield areas, as well as along the western coast. The majority of industrial users are located in the Princess Anne and Pocomoke City areas, including the Smurfit, Lankford Sysco, and Perdue, which currently use approximately 68,000 gpd.
Agricultural Water Users As is the case throughout the Eastern Shore, Somerset County’s farmers use surface water and primarily groundwater for crop irrigation and livestock (primarily poultry) watering. One concentrated area of irrigation is the southeastern corner of the County, along Shelltown Road, where drip irrigation supports crops such as tomatoes and peppers. Groundwater for irrigation is generally drawn from the surficial aquifer.
C. Issues and Discussion – Water
Water Supply Concerns The Manokin aquifer, which is by far the most commonly used aquifer in the County, has seen substantial drawdowns in the past few years. A fairly large drawdown of the aquifer (referred to as a “cone of depression”) recently formed in the Princess Anne area and the area surrounding the Eastern Correctional Institution (ECI). This resulted in problems for some domestic and commercial wells in the Manokin, and has made it difficult to attract new businesses to the area, particularly around ECI. Some individual wells have also had to be replaced. A similar cone of depression has also been observed in northern Somerset County, in the vicinity of Allen, MD.

Somerset County Comprehensive Plan - 9 - Water Resources Element
To address water supply concerns in the Manokin, the County plans to drill two new wells into the Manokin aquifer to serve the Princess Anne system. These two wells will draw additional supplies from the Manokin. More important, the new wells will allow greater flexibility for maintenance of the other wells in the Princess Anne system, and will help to reduce the magnitude of the cone of depression from existing wells.6
The ECI area is a candidate site for a new federal prison. Locating this prison near ECI would further increase water demand in the Princess Anne area.
To further reduce the cone of depression in the Manokin aquifer, ECI has shifted its withdrawals from the Manokin to the Patapsco aquifer.
Beyond the Manokin’s capacity concerns, the Smith Island water systems (which rely on the heavily-used Patapsco aquifer) still have inadequate capacity to support potential growth through 2030. The County should work with MDE to determine whether additional withdrawals to support these communities could be obtained. Expanded withdrawals, along with concerted water conservation efforts (see below), may be the only options for serving populations on Smith Island.
SCSD believes that adequate water capacity exists in the Patapsco aquifer to serve the Fairmount system. However, this system’s withdrawal permit does not allow for additional growth. The Fairmount system could be interconnected to the Princess Anne water system (approximately 7 miles away via MD 361). Although expensive, this option should be considered, particularly if additional withdrawals from the Patapsco aquifer are not permitted.
Groundwater Recharge The capacity of the County’s confined aquifers is increasingly strained by new development throughout the Delmarva Peninsula. The US Geological Society (USGS) reports that “withdrawals from Maryland Coastal Plain aquifers have caused ground-water levels in confined aquifers to decline by tens to hundreds of feet from their original levels. Continued water-level declines could affect the long-term sustainability of ground-water resources in agricultural areas of the Eastern Shore.”7
Groundwater and surface water resources are also linked. Water from surficial aquifers can comprise a significant amount of the base flow of streams and rivers. While groundwater withdrawn through wells is typically returned to the ground or surface via point source discharges, septic systems, and absorption of runoff from outdoor water uses (such as watering of lawns), large withdrawals can potentially impact the quality and quantity of flows in nearby surface water bodies.
In most cases, the recharge areas for these aquifers (particularly the Piney Point), are not necessarily found on the Eastern Shore.
There exists no comprehensive study of the water-bearing formations used by Somerset County residents and businesses. Individual (e.g., project-specific) groundwater studies do not take into account the cumulative impacts of heavy demand on the Manokin and other formations from both the Eastern and Western Shore. In addition, the Water Balance methodology recommended by Models and Guidelines #26 (the state’s official guidance for preparation of the Water Resources Element) is not applicable for the Coastal Plain. Thus, while the County understands that its groundwater supplies are limited and declining, there is no reliable measure of water supply against which to compare current and especially projected water demands.
6 Sources: Somerset County SCSD and 2009 Princess Anne Comprehensive Plan. 7 Source: USGS. 2006. Sustainability of the Ground Water Resources in the Atlantic Coastal Plain of Maryland. USGS Fact Sheet 2006-3009

Somerset County Comprehensive Plan - 10 - Water Resources Element
MDE, the Maryland Geological Survey (MGS), and the US Geological Survey (USGS) have begun work on a Coastal Plain Aquifer Study, but that study remains incomplete. The County should use the data and recommendations of the Coastal Plain Aquifer Study (once completed) to shape its own water use policies and ordinances—particularly those that relate to groundwater appropriations and protection of aquifer recharge areas. However, the County also recognizes the need for and supports the development of broader regional water policies to protect already scarce resources.
For purposes of this Water Resources Element (and lacking specific evidence to the contrary), this Water Resources Element presumes that the MDE groundwater permit issued for each public drinking water system reflects the safe yield of the aquifer(s) used by that system. However, given the status of groundwater resources on the Delmarva Peninsula, the County should take a more proactive approach to managing water supplies by establishing a water supply allocation system. Such systems are used in other jurisdictions with water supply concerns. Water supply allocation systems can help to manage groundwater resources until the Coastal Plain Aquifer study is complete (indeed, such an allocation system may eventually be required based on the findings of the Coastal Plain Aquifer study).
Water Quality The primary water quality concern for some public systems in Somerset County is elevated fluoride levels, particularly in systems that draw water from the Patapsco aquifer, but fluoride concentrations do not exceed US EPA safety thresholds. However, MDE requires the County to remove fluoride via reverse-osmosis (a requirement that will apply to the upgraded ECI WTP). A Source Water Assessment completed in March of 2005 found that due to the protected nature of confined aquifers the water systems were not susceptible to contaminants originating at the land surface. In addition, four public systems are susceptible to iron (Eden MHP, Princess Anne, ECI, and Fairmount).
High concentrations of chloride and sodium are common problems for individual wells in the western and southern neck areas of the County. In other areas, high iron concentrations limit water use. High nitrate concentrations are a problem in a few isolated areas where shallow unconfined aquifers have become contaminated from septic effluent, chicken manure stockpiles, or the over-application of fertilizer.
Groundwater Protection The SCSD and Somerset County Health Department administer the County’s Groundwater Management program, which governs the protection of the County’s aquifers. The program’s regulations are based on the Groundwater Protection Report, which defines these Management Areas and associated requirements, and was adopted by reference into the County’s 1996 Comprehensive Plan. The Groundwater Management program establishes criteria for septic tank location in three Management Zones, which were created based on the ability of the soil to accept and filter septic effluent without polluting the underlying aquifer.
To the north and east of Princess Anne in Management Area A, current regulations require a two-acre minimum area for a septic field and an adequate treatment zone of 2 to 4 feet between septic field and aquifer unless development is on a central sewer system. Management Area B1, surrounding Princess Anne to the west and extending towards Pocomoke City, requires soil borings and specially designed septic systems as a condition of development approval. The remainder of the County, Management Area B2, is subject to normal septic field testing.
Water Conservation Somerset County currently has no policy for ensuring compliance with the Maryland Water Conservation Plumbing Fixtures Act (MWCPFA), which requires that new plumbing fixtures sold or installed as part of new construction are designed to conserve water. The Water and Sewer Master Plan identifies the need to establish such a policy, a recommendation that this Water Resources Element endorses.
Somerset County Comprehensive Plan - 11 - Water Resources Element
The Eastern Correctional Institute has installed water meters to monitor water usage and implemented its own water conservation procedure. The County should follow suit by making a concerted effort to understand water usage in major public systems, and to educate citizens about water conservation. In particular, the County should contact UMES to investigate opportunities to develop a public information campaign on water conservation, or to develop broader Water Resources curriculum at the college.
Potential New Water Supplies To accommodate long term growth, the County and its municipalities should begin to investigate the feasibility of other new and expanded sources of drinking water, including different aquifers and surface water bodies.
Surface water cannot be ruled out as a potential new source of drinking water, and should be included in any comprehensive study of new drinking water sources. However, many factors discourage the use of surface water as a potable water source. In particular, the County’s flat topography makes the construction of surface impoundments impractical. Contamination of surface waters (particularly with bacteria and biological materials), intrusion of salt water from the Chesapeake Bay, and long distance conveyance are also impediments to the use of surface water impoundments.
To address concerns about water supplies, many Maryland counties have begun to investigate the feasibility of withdrawing and treating brackish tidal waters for public water supplies. While the desalinization technology necessary for such systems is extremely expensive and energy-intensive, it should not be ruled out over the very long term. In particular, Somerset County should examine opportunities to participate in regional consortiums (perhaps with neighboring counties) intended to promote desalinization.
IV. Wastewater Assessment This section describes existing conditions and projected future demand for public wastewater treatment capacity in Somerset County.
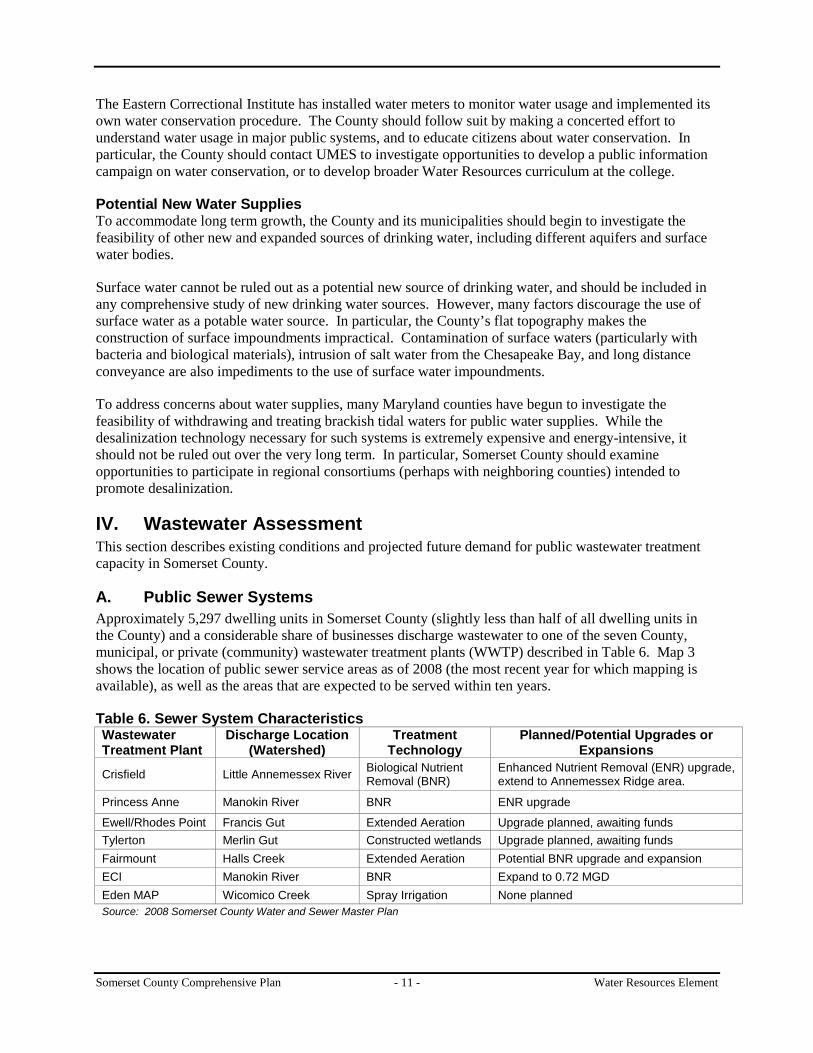
A. Public Sewer Systems Approximately 5,297 dwelling units in Somerset County (slightly less than half of all dwelling units in the County) and a considerable share of businesses discharge wastewater to one of the seven County, municipal, or private (community) wastewater treatment plants (WWTP) described in Table 6. Map 3 shows the location of public sewer service areas as of 2008 (the most recent year for which mapping is available), as well as the areas that are expected to be served within ten years.
Table 6. Sewer System Characteristics Wastewater Treatment Plant
Discharge Location (Watershed)
Treatment Technology
Planned/Potential Upgrades or Expansions
Crisfield Little Annemessex River Biological Nutrient Removal (BNR)
Enhanced Nutrient Removal (ENR) upgrade, extend to Annemessex Ridge area.
Princess Anne Manokin River BNR ENR upgrade
Ewell/Rhodes Point Francis Gut Extended Aeration Upgrade planned, awaiting funds Tylerton Merlin Gut Constructed wetlands Upgrade planned, awaiting funds Fairmount Halls Creek Extended Aeration Potential BNR upgrade and expansion ECI Manokin River BNR Expand to 0.72 MGD Eden MAP Wicomico Creek Spray Irrigation None planned Source: 2008 Somerset County Water and Sewer Master Plan

Somerset County Comprehensive Plan - 12 - Water Resources Element

Somerset County Comprehensive Plan - 13 - Water Resources Element
Somerset County owns and/or operates the Princess Anne, Ewell/Rhodes Point, Tylerton, and Fairmount plants. The City of Crisfield owns and operates their wastewater treatment plant. ECI is operated by the Maryland Environmental Service (MES). Approximately two-thirds of the County population on community sewer systems is served by the Crisfield and Princess Anne systems. All of the County’s major sewer systems have available capacity to support some additional growth and development.
Table 7 shows as the projected public sewer supplies, demands, surpluses, and deficits for public wastewater systems in 2030. All public systems will have enough capacity to support growth through 2030, with the exception of Fairmount. Both the Princess Anne and Crisfield systems have infiltration/inflow (I/I) problems which, if minimized, would reduce the hydraulic flows to these wastewater treatment plants and make more capacity available. Once I/I is addressed, a plan to connect failing septic systems to these systems could be implemented.
B. Nutrient Discharges and Assimilative Capacity Nitrogen and phosphorus (more generally referred to as “nutrients”) from WWTPs and from stormwater and other “non-point sources” are the primary contributors to degraded water quality in the Chesapeake Bay and its tributaries. As a result of Maryland’s participation in the Chesapeake Bay 2000 Agreement, and resulting state policies designed to help restore the Bay, water and sewer planning must take into account the “assimilative capacity” of a receiving body of water—the mass of nutrients that the stream can receive while still maintaining acceptable water quality. This section describes the key limits on assimilative capacity as they apply to the County’s WWTPs.
Point Source Caps and Discharges To address nutrient loads from point sources such as WWTPs, the state has established Chesapeake Bay Tributary Strategy point source caps. These caps are numerical limits on the amount of nitrogen and phosphorus that WWTPs can discharge to the Bay and its tributaries (expressed as pounds per year of nitrogen and phosphorus). Nitrogen and phosphorus point source caps have been established for the Crisfield and Princess Anne WWTPs. Caps have also been calculated for the Smith Island and Fairmount WWTPs, but will only be formally established upon expansion of those facilities. Table 8 compares these nutrient caps against existing and projected nutrient discharges at the County’s largest WWTPs.
SCSD is currently conducting a preliminary engineering study for upgrade of the Princess Anne WWTP to Enhanced Nutrient Removal (ENR) technology. When implemented, this upgrade will reduce total phosphorous discharges from 2.0 mg per liter of effluent to 0.3 mg/L, total nitrogen from 6.0 mg/L to 3.0 mg/L, and will bring total discharges below nutrient cap limits. Construction is scheduled for completion in 2013. Expansion of the ECI WWTP is scheduled to begin in 2012. It is not clear whether this expansion will include upgrade to ENR, although based on the likely nutrient discharges from the expanded plant, such upgrade may become necessary (Table 8 does not show ENR upgrade).
TMDL One measure of assimilative capacity is the Total Maximum Daily Load (TMDL), a series of calculations required by the Clean Water Act. A TMDL is the maximum amount of pollutant that a water body, such as a river or a lake, can receive without impairing water quality. Water bodies are classified as “impaired” when they are too polluted or otherwise degraded to support their designated and existing uses. The TMDL is typically expressed as separate discharge limits from point sources such as WWTPs, as well as non-point sources such as stormwater or agricultural runoff.

Somerset County Comprehensive Plan - 14 - Water Resources Element
Table 7. Sewer System Demand and Capacity, 2030
Crisfield Princess Anne 5 Smith Island (Combined) Fairmount6
ECI
6 Trend PFA Hybrid Trend PFA Hybrid Trend PFA Hybrid Trend PFA Hybrid
Existing Treatment Capacity
gpd1
1,000,000 2 1,260,000 85,000 40,000 480,000
EDU 3,610 2 5,040 340 160 1,920
Average Daily Flow, 2007
gpd 680,000 480,000 40,000 32,000 480,000 EDU 2,455 1,920 160 128 1,920
Net Available Capacity, 2007
gpd 320,000 780,000 45,000 8,000 0 EDU 1,155 3,120 180 32 0
Total Projected Demand, 2030
gpd 3
870,337 991,702 931,020 675,873 762,747 719,310 41,922 40,000 40,961 55,462 32,000 38,991 720,000 EDU 3,142 3,580 3,361 2,703 3,051 2,877 168 160 164 210 128 156 2,880
Future Capacitygpd 4
1,000,000 1,260,000 85,000 40,000 720,000 EDU 3,610 5,040 340 160 2,880
Net Available Projected Capacity, 2030
gpd 129,663 8,298 68,980 584,127 497,253 540,690 43,078 45,000 44,039 (12,462) 8,000 1,009 0
EDU 468 52 271 2,337 1,989 2,163 172 180 176 (50) 32 4 0 Notes: 1: Indicates the more restrictive of either the facility’s permitted discharge or its treatment capacity. 2: gpd = gallons per day; EDU = An Equivalent Dwelling Unit (EDU), equal to 250 gpd. This figure represents the average amount of water used by one household, and is also used to calculate residential and non-residential (e.g., businesses) water demand. For Crisfield, one EDU equals 277 gpd. 3: Includes all existing and projected new residential and non-residential demand, as well as new demand from system extensions. New nonresidential demand is assumed to be 10 percent of new residential demand. 4: Reflects all potential or planned system upgrades and expansions. Sources: 2008 Somerset County Water and Sewer Master Plan, County Staff, Crisfield and Princess Anne WREs, and Maryland Environmental Service (MES) for ECI. 5: For Crisfield, the Trends Scenario reflects the City’s Draft WRE (28 July 2009) 6: For systems other than Princess Anne, Crisfield, it is assumed that the public system growth rate in system equals growth rate in underlying watershed.

Somerset County Comprehensive Plan - 15 - Water Resources Element
The impaired waters list is called the 303(d) list, named after the section in the Act that establishes TMDLs. All of Somerset County's 8-digit watersheds are impaired for either nutrients (nitrogen and/or phosphorus) or bacteria. Table 9 shows the approved nutrient TMDLs that affect Somerset County. The Manokin River TMDL is the only such limit that impacts significant point sources (e.g., public WWTPs) in Somerset County. However, as is shown in Table 9, the nitrogen TMDL for the Manokin River does not appear to be as restrictive as the existing point source cap for the Princess Anne WWTP (although the TMDL also applies to discharges from the ECI WWTP). As the more restrictive limit, the point source cap therefore governs the Princess Anne system. A comparison of projected nonpoint source loads to the nonpoint source (or Load Allocation) component of these TMDLs is discussed in Section VI.
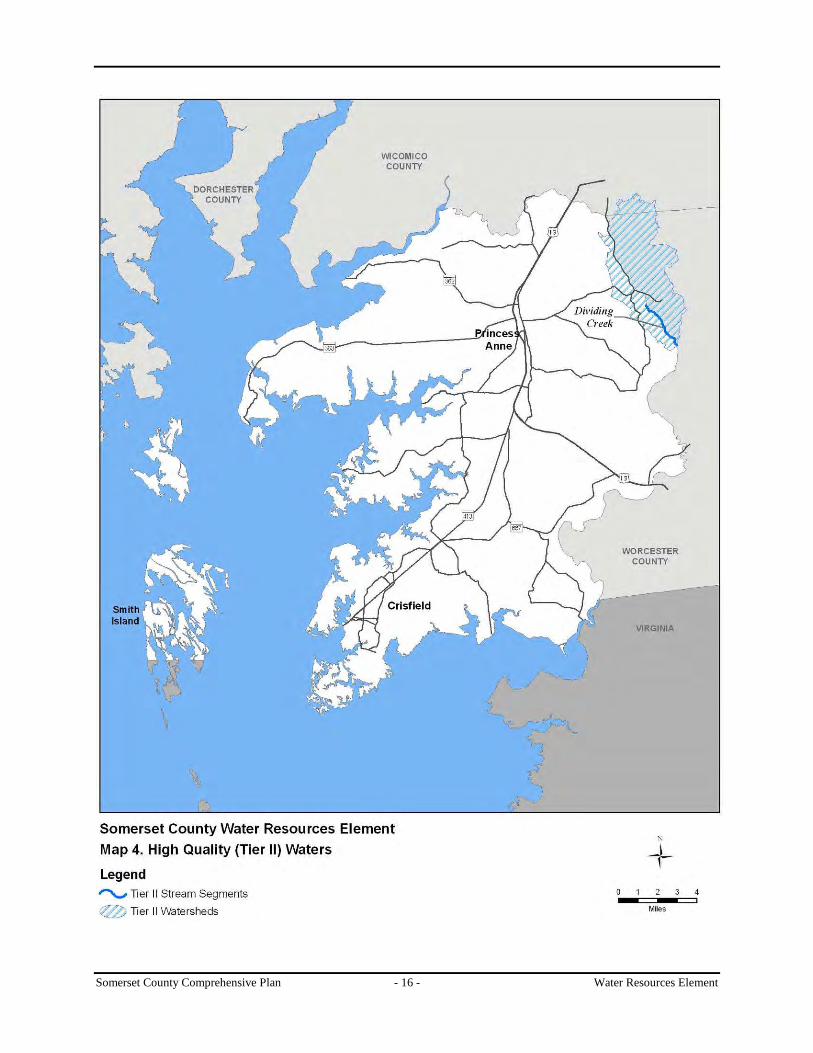
Antidegradation Maryland’s antidegradation policy significantly limits new discharge permits and expansions of existing discharges that would degrade water quality in Tier II (high quality) waters, as defined by the US Environmental Protection Agency (EPA). In these areas, new nutrient discharges can be permitted, as long as they do not degrade existing water quality. Somerset County has one stretch of Tier II waters, a segment of Dividing Creek, as shown in Map 4. None of the WWTPs listed in Table 7 discharge to this Tier II stream.
C. Alternative Wastewater Disposal Options A number of other opportunities exist to protect and improve water quality while still accommodating projected growth and development. This section summarizes key concepts that the County and its municipalities may wish to consider.
Nutrient Trading Under the state’s Policy for Nutrient Cap Management and Trading,8
With a large existing and projected capacity surplus, the Princess Anne WWTP (which is scheduled for ENR upgrade) may be in a position to sell excess capacity to another WWTP, such as the Fairmount system. However, given the County’s and Princess Anne’s emphasis on concentrating growth in and around existing public services, the County may not wish to sell this capacity.
an ENR-enabled WWTP on the Eastern Shore can agree to forego a certain amount of development in exchange for payment, and then send or “trade” that excess treatment capacity to another WWTP on the Eastern Shore in need of capacity. The receiving WWTP would then be allowed to expand beyond its current permitted capacity, provided that such expansion does not exacerbate existing water quality impairments or violate TMDLs.
WWTPs with ENR technology may also be able to expand their facilities by accepting effluent from other WWTPs without BNR or ENR technology, and then by retiring those WWTPs and their outfalls. For example, it is possible that the Fairmount WWTP might eventually be retired, with flows from the community diverted to the Princess Anne WWTP. Although the cost of sewer infrastructure (specifically new wastewater collection lines) is considerable, such an arrangement may be the most preferable way to address potential nutrient cap overages in the Fairmount area.
The connection of houses and businesses on septic systems to sewer systems (and the subsequent retirement of those septic systems) can also generate nutrient credits. The amount of credit depends on the location of these septic systems. Under the state policy, Princess Anne or any other WWTP could receive the following nitrogen credits for each type of septic system retired:
8 Information available at: http://www.mde.state.md.us/Water/nutrientcap.asp
Somerset County Comprehensive Plan - 16 - Water Resources Element

Somerset County Comprehensive Plan - 17 - Water Resources Element
Table 8. Nutrient Caps and Projected Nutrient Discharges Crisfield Princess Anne Smith Island Fairmount
ECI Trends PFA Hybrid Trends PFA Hybrid Trends PFA Hybrid Trends PFA Hybrid Projected Capacity, 2030 MGD 1.00 1.26 0.09 0.04 0.72
Existing Nutrient LoadsTN2
6,151 1 11,681 803 642 11,681 TP 615 1 2,920 37 29 2,920
Likely Nutrient Caps, 2030TN 3
12,182 15,350 1,538 1,731 23,268 TP 914 1,151 257 289 3,878
Projected ADF, 2030 MGD 0.86 0.99 0.93 0.67 0.76 0.72 0.04 0.04 0.04 0.05 0.03 0.04 0.72 Assumed Treatment Technology, 2030 ENR ENR Secondary Secondary BNR
Estimated Nutrient Discharges, 2030, lbs/year
TN 3
7,888 8,995 8,441 6,150 6,942 6,546 2,295 2,190 2,243 2,520 1,752 2,136 11,681 TP 789 900 844 615 694 655 765 730 748 840 584 712 2,920
Remaining Discharge Capacity (overage)
TN 4,294 3,187 3,741 9,200 8,408 8,804 (757) (652) (705) (789) (21) (405) 11,587 TP 125 14 70 536 457 496 (508) (473) (491) (551) (295) (423) 958
Notes: 1: TN = Total Nitrogen (lbs/year); TP = Total Phosphorus (lbs/year) 2: Source: SCSD. Crisfield (ENR) assumes 3 mg/L TN and 0.3 mg/L TP. 3: Sources: MDE's ENR Fact Sheets for Crisfield and Princess Anne (http://www.mde.state.md.us/Water/CBWRF/pop_up/enr_status_map.asp); other systems: MDE (2009). Caps for systems other than Crisfield and Princess Anne will only become effective upon expansion of the WWTP.
Table 9. Approved Nutrient TMDLs for Somerset County Watersheds Watershed Impairing Nutrient Nonpoint Source TMDL (lbs/year) Point Source TMDL (lbs/year)
Lower Wicomico River1 Nitrogen 832,460 409,130 Phosphorus 33,850 68,190
Manokin River Nitrogen 301,890 42,730
Wicomico Creek2 Nitrogen 101,538 0 Phosphorus 5,833 0
Notes: 1: The Lower Wicomico River watershed includes substantial portions of Wicomico County, including the entire City of Salisbury, MD, as well as a small portion of Sussex County, Delaware. Approximately 94 percent of the Lower Wicomico River watershed is outside of Somerset County, as are all major nutrient point sources. 2: The Wicomico Creek watershed includes portions of Wicomico County. Approximately 40 percent of the Wicomico Creek watershed is outside of Somerset County.

Somerset County Comprehensive Plan - 18 - Water Resources Element
• Septic systems in the Chesapeake Bay Critical Area: approximately 12.2 lbs/year per EDU retired (equivalent to approximately 5 EDU in an ENR facility).9
• Septic systems within 1,000 feet of any perennial surface water: 7.5 lbs/year per EDU retired (equivalent to approximately 3 EDU in an ENR facility).
• Any other septic system: 4.6 lbs/year per EDU retired (equivalent to approximately 2 EDU in an ENR facility).
Elimination of septic systems could help to address potential nutrient overages in the Fairmount system.
In addition, MDE and the Maryland Department of Agriculture (MDA) are developing guidelines that would allow trades between nonpoint sources (such as agriculture) and point sources.
Land Application of Treated Wastewater The application of treated wastewater effluent directly to the soil can allow pollutants to be absorbed before the effluent reaches receiving streams. Spray irrigation is the most common form of land application, although other options (such as drip irrigation or subsurface discharge) can also be considered. Spray irrigation is already used as a disposal method for the Eden Mobile Home Park. Any future land application system would likely be paired with an existing surface discharge to maximize system capacity without exceeding nutrient caps or TMDLs.
Factors such as slope, soil depth and granularity, water table depth and behavior, and buffers from streams and developed areas are important in determining true suitability.10 Other important considerations for land application include storage and seasonal restrictions. Land application systems typically require large storage lagoons capable of holding several months’ worth of effluent. Land application may not be permitted during winter months, when frozen soil cannot accept effluent, or during other months when water tables rise. Based on County discussions with MDE, the amount of land in Somerset County that is suitable for spray irrigation is extremely limited.11
Tertiary Treatment Wetlands
In this system, effluent is treated at a WWTP (either BNR or ENR) and then discharged into a series of constructed, vegetated (typically, forested) wetlands. These wetlands purify the effluent to the point where the eventual discharge is essentially free of nutrients and other pollutants. The best-known application of this technology occurs in Clayton County, Georgia. In this system (which treats 9.3 million gallons of wastewater per day), the wetland-treated effluent is pure enough to be used for drinking water.12
Other smaller applications of tertiary treatment wetlands can be found throughout Maryland. These facilities are typically used at schools and other institutional uses. Implementation of such a facility would depend heavily on soil characteristics and other conditions. The Tylerton WWTP uses constructed wetlands that are equivalent to secondary treatment (higher per-liter nutrient loads than BNR).
Wastewater Reuse In some cases, treated wastewater effluent can be used to recharge groundwater aquifers. As with tertiary treatment wetlands, effluent is treated to potable (or better) standards before being injected into the
9 This assumes a treatment standard of 3 mg nitrogen per liter of discharged effluent, and standard discharge of 250 gallons per day, per EDU. 10 Please see the Water Resources Element Appendix for further detail on this calculation. 11 The Preliminary Spray Irrigation Site Capacity Estimate for Somerset County, included in the Water Resources Element Appendix, likely overestimates the amount of land that is suitable for spray irrigation. 12 For more information, see http://www.ccwa1.com/operations/water.reclamation.aspx

Somerset County Comprehensive Plan - 19 - Water Resources Element
aquifer. One such large-scale system is in place in Orange County, California.13
In the Pocomoke area of the County, which is already heavily industrial, there are proposals in place for an ethanol production facility, carbon dioxide processing facility, and agricultural greenhouses. Preliminary discussions between the ethanol production facility developer and the SCSD suggest that reuse of the wastewater effluent from Princess Anne WWTP may be an option.
In that system, treated effluent is used not only to recharge the aquifer (and to provide some drinking water as a result), but also to halt and even reverse saltwater intrusion from the Pacific Ocean into the aquifer. Given the documented drops in aquifer levels on the Eastern Shore, and the presence of saltwater intrusion in some areas, this approach may have merit in Somerset County, and particularly for the Manokin aquifer which has documented well failures. The County should work with MDE in future investigations of the feasibility of such a system.
Additional Issues In the Deal Island/Wenona area, population densities average 350 persons per square mile, which exceeds the currently required County health standard of two acres per septic tank. However, due to a lack of community interest, Deal Island is not listed as a recommended service area for sewerage in the Water and Sewer Plan. In light of nutrient impairments and an eventual nutrient TMDL for the Tangier Sound watershed, which includes Deal Island, it may be necessary to revisit this recommendation.
V. Programmatic Assessment of Nonpoint Source Policies Nonpoint sources of nutrient pollution include agricultural run off, erosion and sediment from development, stormwater runoff from roads, atmospheric deposition, and any other source other than an outfall pipe. These sources are called nonpoint because they involve widely dispersed activities, and hence are difficult to measure. All non-point sources of pollution eventually reach the waters of the Chesapeake Bay unless filtered or retained by some structural or nonstructural technique.
Various technologies reduce nutrients from agricultural and developed lands. Nutrient reduction technologies for nonpoint source pollution are generally referred to as "Best Management Practices" (BMPs). Examples of these technologies include animal waste storage, agricultural nutrient management planning, stormwater settling ponds, and erosion controls. Natural controls or “low-impact development” techniques are extremely effective in reducing the amount of pollutants that reach waterways. Woodlands and wetlands release fewer nutrients into the Bay than any other land use. For these reasons, forests, grasslands, and wetlands are critical to restoring and maintaining the health of the aquatic environment.
This section characterizes the policies and procedures in place to manage nonpoint source pollution in Somerset County.
A. Maryland Stormwater Design Manual The 2000 Maryland Stormwater Design Manual, Volumes I & II is incorporated by reference into the Somerset County Code, and serves as the official guide for stormwater methods, principles, and practices.
The 2007 Maryland Stormwater Management Act mandates substantial revision of the Stormwater Design Manual. The most notable provision of the 2007 Act is the requirement that new development use Environmentally Sensitive Design (ESD) techniques, which are intended to “maintain pre-development runoff characteristics” on the site.14
13 For more information, see
ESD emphasizes the minimization and treatment of stormwater on each parcel through a variety of small-scale techniques that mimic natural stormwater absorption and dispersal processes.
http://www.gwrsystem.com/ 14 Source: MDE. http://www.mde.state.md.us/assets/document/act - a state perspective.pdf

Somerset County Comprehensive Plan - 20 - Water Resources Element
The County should revise its Stormwater Management Ordinance to incorporate the provisions of the revised Maryland Stormwater Design Manual and other enhanced stormwater management policies recommended by MDE, pursuant to the Stormwater Management Act of 2007.
B. Land Preservation, Parks, and Recreation Plan Somerset County’s 2005 Land Preservation, Parks, and Recreation Plan (LPPRP) was adopted as an amendment to the 1996 Comprehensive Plan, and contains numerous goals, policies, and implementation actions, many of which address issues similar to those analyzed as part of this WRE. Key LPPRP goals, policies, and implementation strategies that support the policies in this WRE are listed below.
• Work with the State to complete protection of Green Infrastructure. The only area with large unprotected areas is in the north east part of the County.
• Adopt zoning in the rural area that supports the natural resource conservation goals and agricultural land resources. Such zoning will also be supportive of natural resource land conservation and protect the County’s rural character.
• Continue efforts to promote watershed protection as part of the State’s Tributary Strategies program.
• Continue pursuing opportunities to increase [eco] tourism. The County should strengthen its participation in implementing the projects recommended in Lower Eastern Shore Heritage Area Management Plan.
C. Other Nonpoint Source Management Policies and Considerations
Failing Septic Systems The Somerset County Health Department estimates that there are approximately 5,072 homes with individual septic systems installed throughout the County, of which approximately 1.5 percent annually apply for replacement systems. Based on the rate of applications, the County assumes that nearly 3 percent of all septic systems may not be operating properly. Areas with noticeably higher rates of septic failures include Manokin (northeast of Crisfield) and the Oriole area.
The County should work with the municipalities to evaluate ways to address these areas of failing septic systems, either by connection to public sewer systems, or through the alternative wastewater disposal options discussed above. The Water and Sewer Plan suggests that collection systems be installed to eliminate these septic systems, with pump stations and denied access force mains used to convey wastewater to one of the County’s existing wastewater treatment plants. As described in Section 4.C, the County could also consider new wastewater collection and treatment systems, tied to land application (or another alternative disposal method) to address failing septic systems.
Septic Denitrification Denitrification units can reduce the nitrogen loading from septic systems by approximately 50 percent. A negligible number of Somerset County’s existing septic systems currently utilize denitrification units, and the County does not currently require denitrification units for new septic systems.
Maryland Senate Bill 554 (from the 2009 legislative session) now requires all new development on septic systems in the Chesapeake Bay Critical Area to include Best Available Technology (BAT) for nitrogen removal, as defined by MDE.15
15 More information is available at:
The County may wish to consider similar requirements in other areas, such as near perennial waterways, or in watersheds that are impaired by nitrogen. Indeed, septic denitrification can be one approach to meeting TMDL requirements.
http://www.mde.state.md.us/Water/CBWRF/osds/brf_bat.asp

Somerset County Comprehensive Plan - 21 - Water Resources Element
The nonpoint source analysis (Section VI) assumes that one-quarter of all new residential and non-residential development outside of public sewer systems will utilize denitrification units. Although not explicitly a goal of the County’s existing Comprehensive Plan, this level of implementation is reasonably foreseeable in the next two decades.
Agriculture Agriculture is important to the aesthetic and economic value of Somerset County, and is one of Maryland’s largest and most important industries. However, runoff from cropland and livestock activities can carry nutrients, sediments, and pollutants from manure, fertilizers, and other sources into waterways. On Maryland’s Eastern Shore as a whole, agriculture is the largest contributor of nitrogen and phosphorus to the Bay and its tributaries.
In Somerset County, however, the agricultural community has always recognized the economic and historical importance of the jobs and products provided by the local seafood industry. As a result, farmers in Somerset County have historically led local efforts to restore the Bay and its tributaries—particularly Tangier Sound. Throughout the years, the agricultural community has proactively used federal, state, and local funds to implement Best Management Practices to minimize or eliminate runoff and pollution from cropland and livestock production.
Nearly one-third of the County’s land is preserved and/or owned by federal and state government, and more than 80 percent of the County’s cropland is dedicated to no-till or minimum-till crops—which have lower nutrient impacts than high-till crops. For several years, the County’s agricultural community has participated in research into the proper application of fertilizer, chemicals, and poultry manure handling and storage, in cooperation with the Somerset County Soil Conservation District, the University of Maryland, and the University of Delaware. Every agricultural producer in Somerset County has a nutrient management plan, monitored by MDA.
Agriculture continues to be a substantial source of nutrients throughout the Bay watershed, and Somerset County should continue to work with MDE and MDA to reduce nonpoint source nutrient loads from all sources. However, Somerset County’s agricultural community has demonstrated that productive agriculture and a healthy Bay can go hand in hand.
Stormwater Retrofits Stormwater retrofits can help to reduce nonpoint source pollution, particularly in more densely developed areas. The County should identify locations where such retrofits could address concentrations of nonpoint source pollution (“hot spots”), or where retrofits can help to protect environmentally sensitive areas. Future retrofit funds and implementation activities should be targeted to these priority areas. This recommendation is in addition to ESD requirements for new development, as required by the 2007 Maryland Stormwater Management Act.
Sedimentation and Erosion Sedimentation and other impacts resulting from construction activity, and increased stormwater flows to streams and rivers from development are also a potential threat to water quality. Most new non-agricultural development in Somerset County requires a sedimentation and erosion control plan.
VI. Total Nutrient Loads and Assimilative Capacity Nutrient loads from point sources (WWTPs), stormwater, and other nonpoint sources are major contributors to degraded water quality in the Chesapeake Bay and its tributaries. This section evaluates existing and projected point and nonpoint source pollution loads.

Somerset County Comprehensive Plan - 22 - Water Resources Element
A. Nonpoint Source Nutrient Loading Table 10 shows the estimated existing and future nonpoint source loading (nitrogen and phosphorus) in each 8-digit watershed in Somerset County, for each future land use scenario. Nonpoint source nutrient loads (including septic systems) were estimated using methodology developed by the Maryland Department of the Environment, as modified by the County to reflect revised nutrient loading rates. More detail on the nonpoint source evaluation methodology is presented in the Water Resources Element Appendix.
Future nutrient loads would decrease significantly in all watersheds, compared to current levels. This is due largely to the nonpoint source model’s assumption16
All three future land use scenarios would achieve the nutrient reductions required by the completed TMDLs for the Lower Wicomico River, Manokin River, and Wicomico Creek watersheds. Because the Manokin River watershed is entirely within Somerset County, the available assimilative capacity reflects all discharges within the watershed. The Lower Wicomico River and Wicomico Cree watersheds are shared with Wicomico County. The total nonpoint source loading in these watersheds compared to the TMDLs are shown in Table 11 (based on the August 20, 2009 draft Wicomico County Water Resources Element).
that nutrient-reducing Best Management Practices (BMPs) for urban stormwater and agricultural runoff would be more widely implemented by 2030. The PFA scenario would result in the lowest nonpoint source discharges, but the differences between the scenarios are relatively minor (varying by less than one percent of existing discharges).
Table 11. Total Nonpoint Source Discharge and TMDLs, Shared Watersheds
(all data in lbs/year)
Lower Wicomico River Wicomico Creek TN TP TN TP
TMDL 832,460 33,850 101,538 5,833 Nutrient Discharges
Somerset County
Existing 27,805 2,043 76,868 5,816 Trends 19,667 1,337 50,648 3,744 PFA 19,265 1,328 50,818 3,708 Hybrid 19,498 1,333 50,184 3,726
Wicomico County
Existing 390,997 25,096 35,975 3,021 Future 356,344 1 22,172 36,742 2,840
Total
Existing 418,802 27,139 112,843 8,837 Trends 376,011 23,509 87,390 6,584 PFA 375,609 23,501 87,560 6,547 Hybrid 375,842 24,833 86,926 6,565
Available Assimilative Capacity (Overage) vs. TMDL Total Nonpoint Source Discharges
Existing 413,658 6,711 (11,305) (3,004) Trends 456,449 10,341 14,148 (751) PFA 456,851 10,349 13,978 (714) Hybrid 456,618 9,017 14,612 (732)
Notes: 1: Future discharges for Wicomico represent the average of the three scenarios evaluated as part of the August 20, 2009 draft of the Wicomico County Water Resources Element.
16 The model uses loading rates from the Chesapeake Bay Program Watershed Model, Phase 4.3.

Somerset County Comprehensive Plan - 23 - Water Resources Element
Table 10: Current and Projected Future Nonpoint Source Loading
(all data in lbs/year)
1
Big
Ann
emes
sex
Riv
er
Div
idin
g C
reek
Low
er
Che
sape
ake
Bay
Low
er P
ocom
oke
Riv
er
Low
er W
icom
ico
Riv
er
Man
okin
Riv
er
Mon
ie B
ay
Poco
mok
e So
und
Tang
ier S
ound
Wic
omic
o C
reek
Tota
l
Exis
ting
Nonpoint Source Discharge
TN 127,659 60,974 52,695 144,105 27,805 369,955 99,300 192,907 129,876 76,868 1,282,142 TP 8,970 4,530 1,051 11,185 2,043 27,219 6,440 13,510 4,882 5,816 85,645
Nonpoint Source TMDL
TN
832,460 301,890
101,538
TP 33,850 5,833
Available Assimilative Capacity (Overage) vs. TMDL
TN 2
See Table 11
(68,065) See Table 11 TP
Tren
ds Nonpoint
TN 124,529 40,793 51,356 93,809 19,667 251,798 72,693 135,416 119,450 50,648 960,158 TP 9,065 2,922 995 7,050 1,337 17,641 4,266 8,879 3,835 3,744 59,735
Available Assimilative Capacity (Overage) vs. TMDL
TN 2
See Table 11
50,092 See Table
11 TP
PFA
Nonpoint TN 123,154 39,932 51,348 91,188 19,265 248,691 71,459 133,954 118,602 50,818 948,410 TP 8,967 2,856 994 7,026 1,328 17,512 4,206 8,796 3,849 3,708 59,242
Available Assimilative Capacity (Overage) vs. TMDL
TN 2
See Table 11
53,199 See Table
11 TP
Hyb
rid Nonpoint
TN 138,985 40,314 51,352 93,305 19,498 249,794 72,133 134,568 118,677 50,184 953,502 TP 9,016 2,889 995 7,038 1,333 17,577 4,236 8,838 3,842 3,726 59,488
Available Assimilative Capacity (Overage) vs. TMDL
TN 2
See Table 11
52,096 See Table
11 TP
Notes: 1: Includes septic systems 2: Reflects Load Allocation (LA) limits set by adopted TMDLs for each watershed. Where no TMDL has been adopted, or where the watershed is not impaired, no numerical standards are shown.

Somerset County Comprehensive Plan - 24 - Water Resources Element
Based on these data, TMDLs would be met in all cases except for phosphorus in the Wicomico Creek watershed. In this case, the per-acre phosphorus contributions from Wicomico and Somerset Counties are approximately equal, implying that both jurisdictions should make concentrated efforts to implement phosphorus-reducing nonpoint source BMPs in this watershed.
B. Total Nutrient Loading Table 12 shows the total combined point and nonpoint source discharge in each 8-digit watershed in Somerset County. This table combines the information in Tables 8 and 10 (including the ECI facility).
As with the nonpoint source loadings alone, all three scenarios would considerably reduce nutrient loading compared to existing levels. The PFA growth scenario results in the lowest levels of nonpoint source nitrogen and phosphorus discharges, but the differences between scenarios are minimal.
C. Impervious Surface Impervious surfaces are primarily human-made surfaces that do not allow rainwater to enter the ground. Impervious cover creates runoff that can cause stream bank erosion, sedimentation of streams, and adverse effects on water quality and aquatic life. The amount of impervious surface in a watershed is a key indicator of water quality. Water quality in streams tends to decline as watersheds approach ten percent impervious coverage, and drops sharply when the watershed approaches 25 percent impervious coverage. Table 13 summarizes existing and potential impervious coverage in Somerset County by watershed.
Countywide, less than two percent of all land is impervious. Even in Somerset County’s most developed watersheds—Tangier Sound and Manokin River—impervious surface coverage is under five percent. Under the land use and development scenarios considered in this Element, countywide impervious coverage would increase slightly by 2030, with most 8-digit watersheds experiencing some increase in impervious coverage.
While none of the County’s major watersheds would approach ten percent impervious—the first tipping point with regard to water quality—some smaller sub-watersheds (particularly those in and around municipalities) may already approach or exceed such thresholds. In these cases, stormwater management retrofits can help to reduce the impact of large amounts of impervious surface.
D. Choice of Land Use Plan The primary purpose of this Water Resources Element is to evaluate the water resources impacts of projected land use and development trends, and to provide input into the Comprehensive Plan’s recommended future land use pattern. Ideally, the Water Resources Element should use measures of assimilative capacity, such as completed TMDLs for nutrients, to guide direction of growth and land use patterns within the County. Because TMDLs have not been completed for all of County’s impaired 8-digit waterways, particularly Tangier Sound, it is difficult to definitively identify appropriate receiving waters for the County’s point and nonpoint source nutrient loads, or to direct future growth toward the corresponding watersheds.
However, because TMDLs are not available (US EPA expects to complete the Chesapeake Bay TMDL by the end of 2010), the WRE must make recommendations based on the best available data. The preferred land use plan should minimize future nutrient loads and impervious surface in all watersheds. As shown in Tables 11 and 12, the County’s current land use plan, coupled with implementation of Tributary Strategy BMPs and upgrades to public wastewater treatment plants, could result in a substantial reduction in total nutrient loads to the Chesapeake Bay and its tributaries. More important, none of the future land use scenarios evaluated in this WRE appear likely to generate nutrients in excess of established TMDLs.

Somerset County Comprehensive Plan - 25 - Water Resources Element
Table 12. Total Nutrient Loading, All Scenarios
(all data in lbs/year) Big
Ann
emes
sex
Riv
er
Div
idin
g C
reek
Low
er
Che
sape
ake
Bay
Low
er
Poco
mok
e R
iver
Low
er W
icom
ico
Riv
er
Man
okin
Riv
er
Mon
ie B
ay
Poco
mok
e So
und
Tang
ier S
ound
Wic
omic
o C
reek
Tota
l
Exis
ting
Nonpoint TN 127,659 60,974 52,695 144,105 27,805 369,955 99,300 192,907 129,876 76,868 1,282,142 TP 8,970 4,530 1,051 11,185 2,043 27,219 6,440 13,510 4,882 5,816 85,645
Point TN 642
803
23,362
6,205
31,013
TP 29 37 5,840 621 6,527
Total TN 128,301 60,974 53,498 144,105 27,805 393,317 99,300 192,907 136,081 76,868 1,313,155 TP 8,999 4,530 1,088 11,185 2,043 33,059 6,440 13,510 5,503 5,816 92,172
Tren
ds
Nonpoint TN 124,529 40,793 51,356 93,809 19,667 251,798 72,693 135,416 119,450 50,648 960,158 TP 9,065 2,922 995 7,050 1,337 17,641 4,266 8,879 3,835 3,744 59,735
Point TN 2,520
2,295
17,849
7,942
30,589
TP 840 765 3,537 794 5,935
Total TN 127,049 40,793 53,651 93,809 19,667 269,647 72,693 135,416 127,392 50,648 990,747 TP 9,905 2,922 1,760 7,050 1,337 21,178 4,266 8,879 4,629 3,744 65,670
PFA
Nonpoint TN 123,154 39,932 51,348 91,188 19,265 248,691 71,459 133,954 118,602 50,818 948,410 TP 8,967 2,856 994 7,026 1,328 17,512 4,206 8,796 3,849 3,708 59,242
Point TN 1,752
2,190
18,642
9,050
31,616
TP 584 730 3,616 905 5,834
Total TN 124,906 39,932 53,538 91,188 19,265 267,333 71,459 133,954 127,652 50,818 980,026 TP 9,551 2,856 1,724 7,026 1,328 21,128 4,206 8,796 4,754 3,708 65,076
Hyb
rid
Nonpoint TN 138,985 40,314 51,352 93,305 19,498 249,794 72,133 134,568 118,677 50,184 953,502 TP 9,016 2,889 995 7,038 1,333 17,577 4,236 8,838 3,842 3,726 59,488
Point TN 2,136
2,243
18,245
8,496
31,102
TP 712 748 3,577 850 5,884
Total TN 141,121 40,314 53,595 93,305 19,498 268,039 72,133 134,568 127,173 50,184 984,604 TP 9,728 2,889 1,743 7,038 1,333 21,154 4,236 8,838 4,692 3,726 65,372
Somerset County Comprehensive Plan - 26 - Water Resources Element
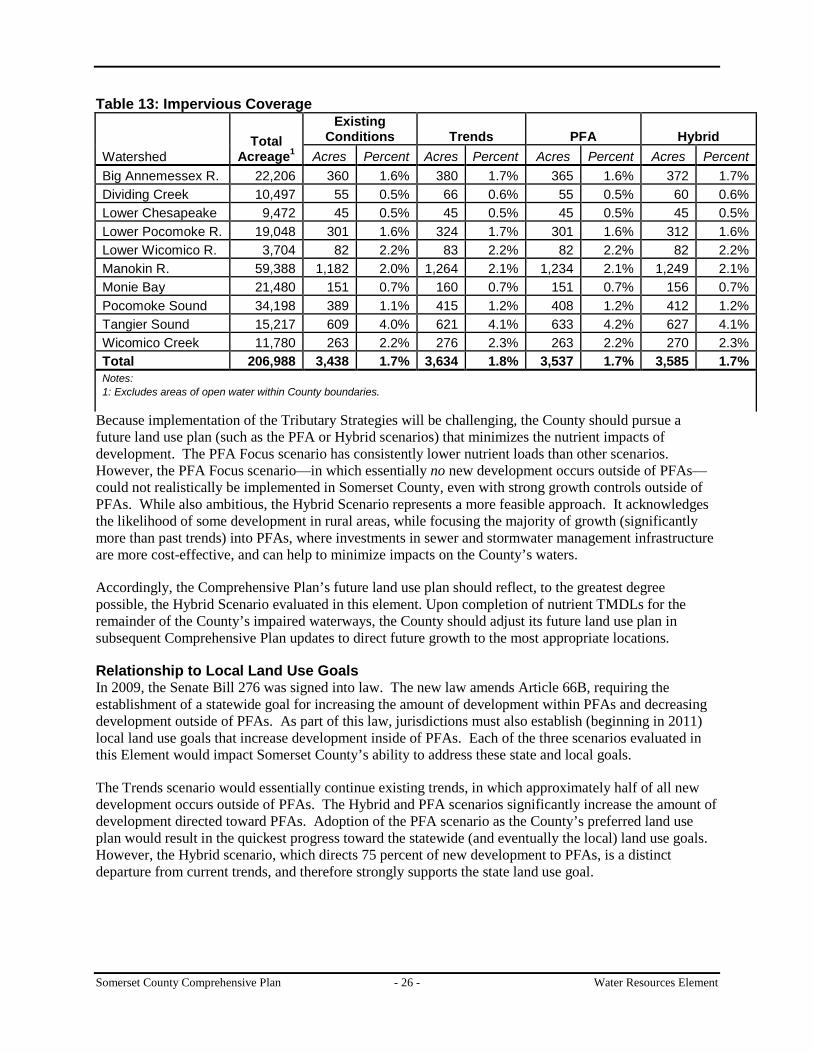
Table 13: Impervious Coverage
Watershed Total
Acreage
Existing Conditions
1 Trends PFA Hybrid
Acres Percent Acres Percent Acres Percent Acres Percent Big Annemessex R. 22,206 360 1.6% 380 1.7% 365 1.6% 372 1.7% Dividing Creek 10,497 55 0.5% 66 0.6% 55 0.5% 60 0.6% Lower Chesapeake 9,472 45 0.5% 45 0.5% 45 0.5% 45 0.5% Lower Pocomoke R. 19,048 301 1.6% 324 1.7% 301 1.6% 312 1.6% Lower Wicomico R. 3,704 82 2.2% 83 2.2% 82 2.2% 82 2.2% Manokin R. 59,388 1,182 2.0% 1,264 2.1% 1,234 2.1% 1,249 2.1% Monie Bay 21,480 151 0.7% 160 0.7% 151 0.7% 156 0.7% Pocomoke Sound 34,198 389 1.1% 415 1.2% 408 1.2% 412 1.2% Tangier Sound 15,217 609 4.0% 621 4.1% 633 4.2% 627 4.1% Wicomico Creek 11,780 263 2.2% 276 2.3% 263 2.2% 270 2.3% Total 206,988 3,438 1.7% 3,634 1.8% 3,537 1.7% 3,585 1.7% Notes: 1: Excludes areas of open water within County boundaries.
Because implementation of the Tributary Strategies will be challenging, the County should pursue a future land use plan (such as the PFA or Hybrid scenarios) that minimizes the nutrient impacts of development. The PFA Focus scenario has consistently lower nutrient loads than other scenarios. However, the PFA Focus scenario—in which essentially no new development occurs outside of PFAs—could not realistically be implemented in Somerset County, even with strong growth controls outside of PFAs. While also ambitious, the Hybrid Scenario represents a more feasible approach. It acknowledges the likelihood of some development in rural areas, while focusing the majority of growth (significantly more than past trends) into PFAs, where investments in sewer and stormwater management infrastructure are more cost-effective, and can help to minimize impacts on the County’s waters.
Accordingly, the Comprehensive Plan’s future land use plan should reflect, to the greatest degree possible, the Hybrid Scenario evaluated in this element. Upon completion of nutrient TMDLs for the remainder of the County’s impaired waterways, the County should adjust its future land use plan in subsequent Comprehensive Plan updates to direct future growth to the most appropriate locations.
Relationship to Local Land Use Goals In 2009, the Senate Bill 276 was signed into law. The new law amends Article 66B, requiring the establishment of a statewide goal for increasing the amount of development within PFAs and decreasing development outside of PFAs. As part of this law, jurisdictions must also establish (beginning in 2011) local land use goals that increase development inside of PFAs. Each of the three scenarios evaluated in this Element would impact Somerset County’s ability to address these state and local goals.
The Trends scenario would essentially continue existing trends, in which approximately half of all new development occurs outside of PFAs. The Hybrid and PFA scenarios significantly increase the amount of development directed toward PFAs. Adoption of the PFA scenario as the County’s preferred land use plan would result in the quickest progress toward the statewide (and eventually the local) land use goals. However, the Hybrid scenario, which directs 75 percent of new development to PFAs, is a distinct departure from current trends, and therefore strongly supports the state land use goal.

Somerset County Comprehensive Plan - 27 - Water Resources Element
VII. Water Resources Policies and Actions This section describes policies and implementation strategies that the County should pursue in order to achieve the goals of this Water Resources Element.
Drinking Water 1. Work with MDE, MGS, and USGS to complete the Coastal Plain Aquifer Study, and use the results
of this study to guide future decisions regarding groundwater withdrawals.
2. Work with MDE to identify new sources of drinking water, specifically by evaluating the quality and quantity of water in the County’s deeper and less frequently used aquifers.
3. Consider interconnecting the Fairmount water system with the Princess Anne water system, particularly if additional groundwater withdrawals are not permitted.
4. Establish a water supply capacity allocation system to better monitor and manage the County’s limited groundwater resources.
5. Upon completion of the Coastal Plain Aquifer Study, work with MDE, DNR, other appropriate state agencies, and neighboring jurisdictions to identify and protect key recharge areas for the Manokin aquifer. Advocate for state policies to protect the Patapsco and other aquifers, whose recharge areas do not fall within Somerset County.
6. Amend the County’s building and land development codes to require water conserving fixtures and appliances in new development within public water service areas, and to encourage retrofits of water conserving fixtures and appliances in existing development.
7. Form a partnership with UMES to develop a public education program regarding water conservation, as well as broader curriculum related to water resources.
8. Work with MDE and the County Health Department to identify and remediate (or replace—with state funding) wells contaminated by nitrates.
Sewer Systems 9. Work with MDE and system operators to investigate the following options to address potential future
nutrient discharge overages:
• Complete ENR upgrades at the Princess Anne WWTP.
• Upgrading the Smith Island WWTP to BNR or ENR technology.
• For the Fairmount and ECI WWTP’s, upgrade the facilities to BNR (Fairmount) or ENR (both) technology; obtain nutrient credits from the Princess Anne WWTP or another facility; use alternative wastewater disposal techniques (such as spray irrigation); or investigate options to retire the facility and connect its system to the Princess Anne sewer system.
10. Establish a wastewater capacity allocation system to better monitor and manage the County’s limited groundwater resources.
11. Continue to identify areas where failing septic systems or other public health concerns exist, and work with municipalities to extend public water and/or sewer service those areas. As part of this effort, work with MDE to obtain nutrient credits for such sewer service extensions.

Somerset County Comprehensive Plan - 28 - Water Resources Element
Nonpoint Source Pollution 12. Amend the County’s Stormwater Management ordinance to incorporate by reference the Maryland
Stormwater Design manual, as revised by MDE to reflect provisions of the Stormwater Management Act of 2007—including the required use of ESD for new development.
13. Consider requiring new development outside of existing or planned public sewer service areas, but within 1,000 feet of perennial waterways to use septic denitrification systems. Investigate opportunities to obtain nonpoint-to-point source credits for such upgrades.
14. Work with MDE, DNR, and the Maryland Department of Agriculture (MDA) to assist farmers in adopting Best Management Practices to reduce nonpoint source loads of nutrients and other pollutants.
General 15. To the greatest degree possible, updates to the County’s Future Land Use Plan should reflect the
Hybrid Scenario evaluated in the WRE.
16. Update the County’s Water and Sewer Master Plan (with assistance from MDP to ensure consistency with the Comprehensive Plan) to reflect revised population and public water/sewer system data. Also identify the need to evaluate opportunities to implement alternative wastewater disposal methods, such as land application of treated wastewater, tertiary treatment wetlands, wastewater reuse, and nutrient trading.
17. Continue to support land preservation activities such as MALPF and Rural Legacy, and specifically encourage such activities (including the purchase of land by private conservation organizations) on land that drains to Tier II waterways, and in sub-watersheds where impervious coverage approaches or exceeds 10 percent.
18. As part of future Comprehensive Plan updates, and re-run the nonpoint source loading analysis, incorporating up-to-date land use data and nutrient loading rates.
19. Work with UMES to develop curriculum related to water resources, water conservation, and similar subjects.
20. Consider participating in a regional water resources committee, along with MDE, MDP, and neighboring counties. The purpose of such a committee would be to coordinate information and decisions involving groundwater, surface water discharges (particularly to shared rivers such as the Pocomoke), and growth and development.

Somerset County Comprehensive Plan -A-1 - Water Resources Element APPENDIX
Water Resources Element Appendix
Housing Unit Projection Methodology
The following assumptions were used to develop the housing unit projections for each Water Resources Element Scenario.
Trends Scenario
In this scenario, 50% of all projected new residential units (714 of 1,428 projected units by 2030) would be built within incorporated municipalities or areas likely to have public water and sewer service by 2030. This included Princess Anne, Crisfield, and surrounding areas. For ease of description, this Appendix refers to those areas as “public infrastructure areas.” Other future water and sewer service areas, such as the expansion of the Fairmount sewer service area, are intended primarily to address failing septic systems, and are thus included in the “rural” portion of this scenario.
For example, in 2008, the portion of the Crisfield public infrastructure area within the Tangier Sound watershed had approximately 29 percent of the total residential development capacity in all of Somerset County’s public infrastructure areas. Thus, of the 714 units projected to be built in public infrastructure areas by 2030, 208 (29 percent of that total) would be built in the Tangier Sound portion of the Crisfield public infrastructure area.
The remaining projected 714 housing units were distributed amongst the remaining rural (i.e., not likely to receive public water or sewer service from the Princess Anne or Crisfield systems) portions of the County’s 8-digit watersheds in proportion to the residential development capacity in each of those watersheds.
PFA Focus Scenario
In this scenario, 100% of all projected new residential units would be built within the County’s existing and future public infrastructure areas, in proportion to the residential development capacity in each of those areas.
Hybrid Scenario
In this scenario, 75% of all projected new residential units (1,071 of 1,428 projected units by 2030) would be built within the County’s existing and future public infrastructure areas, in proportion to the residential development capacity in each of those areas.
The remaining projected 357 housing units were distributed amongst the remaining portions of the County’s 8-digit watersheds in proportion to the residential development capacity in each of those watersheds.
Assignment of Acreages This section discusses how the Existing Conditions (Year 2007) Land Use/Land Cover acreages within each 8-digit watershed were altered to reflect projected development under each of the three growth scenarios analyzed in the Water Resources Element. Year 2007 Land Use/Land Cover data and categories were provided by the Maryland Department of Planning.

Somerset County Comprehensive Plan -A-2 - Water Resources Element APPENDIX
Residential Development
As part of the Water Resources Element, Somerset County worked with the Maryland Department of Planning to prepare a residential Development Capacity analysis.
For the WRE, the New Housing Capacity (NHC—a product of the Development Capacity analysis) was summed for three categories in each major water and sewer service area (divided by 8-digit watershed) and each rural 8-digit watershed (areas of the watershed outside of major water and sewer service areas, as defined in the Trends Scenario above):
• Urban (LU/LC Codes 11-18, 191, and 192)
• Agricultural (LU/LC Codes 21-25, 241, and 242)
• Forest (LU/LC Codes 41-44)
It was assumed that new residential development would occur in the same ratio as residential development capacity. For example, in the Pocomoke Sound portion of the Crisfield public infrastructure area, 80 percent of existing residential development was within “Low Density” LU/LC areas, 18 percent was within “Medium Density” areas, and two percent was within “High” density areas. These percentages were applied to projected residential units.
The following gross densities were used for all geographies to convert new units into new acreage:
• Rural (LU/LC 191, 192): 0.2 units/acre. Not used within PFAs.
• Low Density (LU/LC 11): 2 units/acre
• Medium Density (LU/LC 12): 5 units/acre
• High Density (LU/LC 13): 10 units/acre
New residential acreage within each geography was then assigned to the Urban, Agricultural, or Forest categories according to the ratio of NHC. For example, in the Pocomoke Sound portion of the Crisfield public infrastructure area, 36 percent of all NHC was within the Urban category.
New development assigned to the urban category was deemed to be “infill,” and thus would not result in any land use acreage change. In theory, there could be shifts from low density to medium density, and so on. However, because the nonpoint source model’s loading rates are the same for all urban development types, there was no need to further parse the urban category.
New development assigned to the agricultural category would result in an equal loss of agricultural land in that watershed. Reductions in agricultural land were concentrated in the LU/LC 21 (cropland) category for simplicity (since the nonpoint source model’s loading rates do not distinguish among agriculture types).
Similarly, new development assigned to the forest category would result in an equal loss of forest land in that watershed. Reductions in agricultural land were concentrated in the LU/LC 41 (deciduous forest) category for simplicity (since the nonpoint source model’s loading rates do not distinguish among forest types).

Somerset County Comprehensive Plan -A-3 - Water Resources Element APPENDIX
Nonresidential Development
In all scenarios, nonresidential acreage (commercial and industrial land) was projected to grow proportionately with new residential acreage, within each PFA and watershed.
For example, in 2007, there were 34 acres of commercial land and 1,131 acres of residential land use in the Wicomico Creek Watershed. The ratio of 34 to 1,131 is 0.03. In 2030, the Trends scenario projected that residential uses in this watershed would account for 134 additional acres (excluding infill). Using the 0.03 ratio, this equates to approximately 4 acres of new commercial development in the Wicomico Creek Watershed (excluding any potential infill).
Nonresidential acreage replaced agricultural and forest acreage using the same methodology as described above for residential acreage.

Somerset County Comprehensive Plan -A-4 - Water Resources Element APPENDIX
Wastewater Reuse—Spray Irrigation
Option A, Preliminary Spray Irrigation Site Capacity Estimate (from M&G 26, page 67) was used to determine the acreage in Somerset County that could be appropriate for future land application (spray irrigation) of treated wastewater effluent. The 2007 Somerset County Soil Survey was used to identify soil types and permeability classes that most closely matched the drainage categories listed in the state guidelines. Table A-1 shows the results of this analysis. Map A-1 shows areas that, based on this analysis, might be suitable for land application.
Table A-1. Potential Land Application Acreage in Somerset County
Drainage Category Estimated Site Capacity for Each 100 Acres Total Potential Land Area
Excessively drained
1
640,000 gpd 312 acres
Well drained 480,000 gpd 9,204 acres
Moderately well drained 320,000 gpd 8,768 acres
Total 18,284 acres Notes: 1: Limited to Agricultural land (Land Use/Land Cover categories 21, 22, and 23) outside of municipal and existing/future sewer service area boundaries. Does not include buffers from streams or developed areas.
Developed areas, bare ground, wetlands, and forests were not considered appropriate for land application. Forests, in particular, should be preserved due to their ability to filter and reduce nonpoint source pollution. There is an additional 6,377 acres of excessively, well, or moderately well drained forest land.
It is understood that Option A is a coarse level of analysis, and is preliminary in nature. More detailed evaluations of soil characteristics, water table, and other factors are necessary before identifying specific locations for land application. These results indicate that, in some areas, wastewater collection and treatment systems tied to land application could theoretically be appropriate ways to address failing septic systems. For example, a 50-acre plot of “well drained” land (with appropriate depth to bedrock, buffers, and other favorable physical conditions) could replace as many as 1,000 septic systems. However, based on discussions with representatives from MDE, the County believes that the acreage identified in Table A-1 is likely an overstatement, and that very few true opportunities exist for the use of land application in Somerset County.
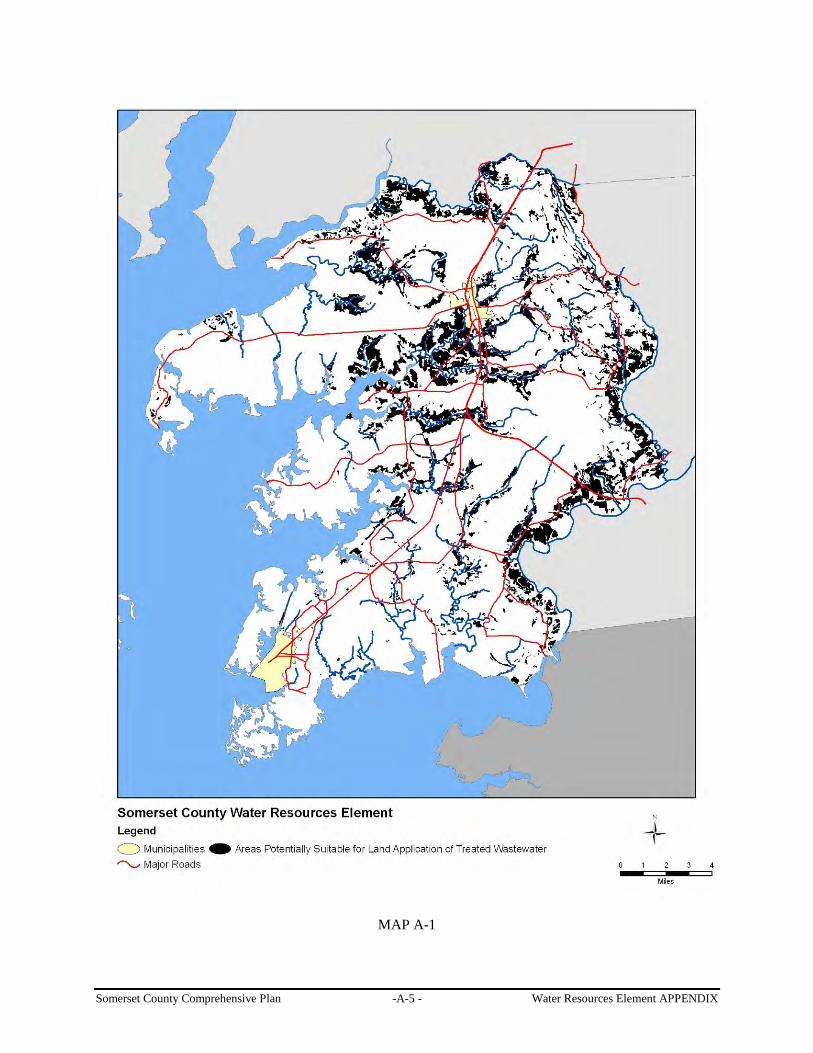
Somerset County Comprehensive Plan -A-5 - Water Resources Element APPENDIX
MAP A-1
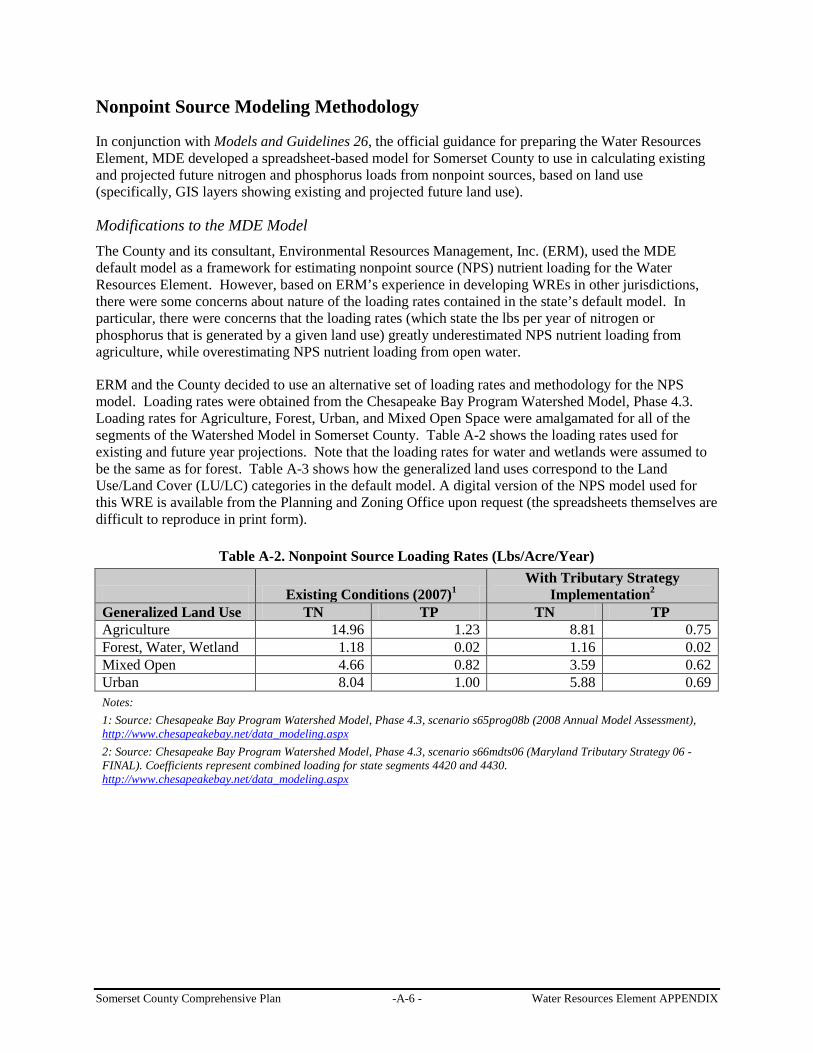
Somerset County Comprehensive Plan -A-6 - Water Resources Element APPENDIX
Nonpoint Source Modeling Methodology
In conjunction with Models and Guidelines 26, the official guidance for preparing the Water Resources Element, MDE developed a spreadsheet-based model for Somerset County to use in calculating existing and projected future nitrogen and phosphorus loads from nonpoint sources, based on land use (specifically, GIS layers showing existing and projected future land use).
Modifications to the MDE Model The County and its consultant, Environmental Resources Management, Inc. (ERM), used the MDE default model as a framework for estimating nonpoint source (NPS) nutrient loading for the Water Resources Element. However, based on ERM’s experience in developing WREs in other jurisdictions, there were some concerns about nature of the loading rates contained in the state’s default model. In particular, there were concerns that the loading rates (which state the lbs per year of nitrogen or phosphorus that is generated by a given land use) greatly underestimated NPS nutrient loading from agriculture, while overestimating NPS nutrient loading from open water.
ERM and the County decided to use an alternative set of loading rates and methodology for the NPS model. Loading rates were obtained from the Chesapeake Bay Program Watershed Model, Phase 4.3. Loading rates for Agriculture, Forest, Urban, and Mixed Open Space were amalgamated for all of the segments of the Watershed Model in Somerset County. Table A-2 shows the loading rates used for existing and future year projections. Note that the loading rates for water and wetlands were assumed to be the same as for forest. Table A-3 shows how the generalized land uses correspond to the Land Use/Land Cover (LU/LC) categories in the default model. A digital version of the NPS model used for this WRE is available from the Planning and Zoning Office upon request (the spreadsheets themselves are difficult to reproduce in print form).
Table A-2. Nonpoint Source Loading Rates (Lbs/Acre/Year)
Existing Conditions (2007)With Tributary Strategy
Implementation1 Generalized Land Use
2 TN TP TN TP
Agriculture 14.96 1.23 8.81 0.75 Forest, Water, Wetland 1.18 0.02 1.16 0.02 Mixed Open 4.66 0.82 3.59 0.62 Urban 8.04 1.00 5.88 0.69 Notes: 1: Source: Chesapeake Bay Program Watershed Model, Phase 4.3, scenario s65prog08b (2008 Annual Model Assessment), http://www.chesapeakebay.net/data_modeling.aspx 2: Source: Chesapeake Bay Program Watershed Model, Phase 4.3, scenario s66mdts06 (Maryland Tributary Strategy 06 - FINAL). Coefficients represent combined loading for state segments 4420 and 4430. http://www.chesapeakebay.net/data_modeling.aspx

Somerset County Comprehensive Plan -A-7 - Water Resources Element APPENDIX
Table A-3. Correspondence Table: Chesapeake Bay Model Generalized Land use to MDP LU/LC
CBP Generalized Land Use
MDP Land Use/Land Cover Category Code
Agriculture
Cropland 21 Pasture 22 Orchards 23 Row and Garden Crops 25 Feeding Operations 241 Agricultural Buildings 242
Forest
Deciduous Forest 41 Evergreen Forest 42 Mixed Forest 43 Brush 44 Water 50 Wetland 60
Mixed Open Urban Open Space 18 Bare Ground 73
Urban
Low Density Residential 11 Medium Density Residential 12 High Density Residential 13 Commercial 14 Industrial 15 Institutional 16 Extractive 17 Transportation 80 Rural Residential 191, 192
The default state model uses separate loading rates for the pervious and impervious portion of each LU/LC category. Because the Chesapeake Bay Watershed Model’s data do not distinguish between pervious and impervious, the Somerset County NPS model applied the loading rates in Table A-2 directly to the LU/LC acreage, without segregating pervious and impervious.
Septic Denitrification Systems Somerset County estimates that 727 homes with septic systems have installed nitrogen-removing (denitrification) technology, although the exact location of these retrofits has not been confirmed. For purposes of the nonpoint source model, 727 denitrified septic systems were distributed amongst the County’s watersheds according to the share of existing housing units in each watershed.
NPS Model Outputs The tables and graphs below are the detailed output of the Somerset County NPS model described above and in section 6 of the Water Resources Element.

Somerset County Comprehensive Plan -A-8 - Water Resources Element APPENDIX
Table A-4. Land Use and Septic Systems
Existing Trends
Scenario PFA Focus Scenario
Hybrid Scenario
(Acres) (Acres) (Acres) (Acres)
Development 17,491 19,066 17,531 18,298
Agriculture 49,562 48,575 49,343 48,959
Forest 138,351 137,368 138,135 137,752
Water 145,590 145,590 145,590 145,590
Other 1,584 1,980 1,980 1,980
Total Area 352,578 352,578 352,578 352,578
Residential Septic (EDUs) 5,221 5,073 4,334 4,719
Non-Residential Septic (EDUs) 3,091 1,733 1,492 1,689
Table A-5. Total Nitrogen Loading
Existing Trends
Scenario PFA Focus Scenario
Hybrid Scenario
(Lbs/Yr) (Lbs/Yr) (Lbs/Yr) (Lbs/Yr)
Development NPS 140,631 116,883 107,477 112,180
Agriculture NPS 741,446 458,385 465,533 461,959
Forest NPS 163,255 159,641 160,532 160,087
Water NPS 171,796 169,036 169,036 169,036
Other Terrestrial NPS 11,420 11,309 11,309 11,309
Total Terrestrial Load 1,228,548 915,255 913,888 914,571
Residential Septic (EDUs) 43,661 40,379 30,628 34,521
Non-Residential Septic (EDUs) 9,933 4,524 3,894 4,409
Total Septic Load 53,594 44,903 34,522 38,931
Total NPS Nitrogen Load 1,282,142 960,158 948,410 953,502
Total PS Load 31,013 30,222 31,634 30,928
Total Nitrogen Load (NPS+PS) 1,313,155 990,380 980,044 984,430

Somerset County Comprehensive Plan -A-9 - Water Resources Element APPENDIX
Figure A-1. Total Nitrogen Load
0
200,000
400,000
600,000
800,000
1,000,000
1,200,000
1,400,000
Existing Trends PFA Focus Hybrid
(lbs/
yr) Total PS Load
Total Septic Load
Total Terrestrial Load
Figure A-2. Nitrogen Loading from Development
0
50,000
100,000
150,000
200,000
250,000
Existing Trends PFA Focus Hybrid
(lbs/
yr) Total PS Load
Total Septic Load
Development NPS

Somerset County Comprehensive Plan -A-10 - Water Resources Element APPENDIX
Table A-6. Total Phosphorus Loading
Existing Trends
Scenario PFA Focus Scenario
Hybrid Scenario
(Lbs/Yr) (Lbs/Yr) (Lbs/Yr) (Lbs/Yr)
Development NPS 17,491 13,155 12,727 13,284
Agriculture NPS 60,961 36,431 39,413 39,110
Forest NPS 2,767 2,747 2,763 2,755
Water NPS 2,912 2,912 2,912 2,912
Other Terrestrial NPS 1,514 1,339 1,428 1,428
Total Terrestrial Load 85,645 56,584 59,242 59,488
Total PS Load 6,527 5,808 5,835 5,822
Total Phosphorus Load (NPS+PS) 92,172 62,392 65,077 65,310
Figure A-3. Total Phosphorus Load
0
10,000
20,000
30,000
40,000
50,000
60,000
70,000
80,000
90,000
100,000
Existing Trends PFA Focus Hybrid
(lbs/
yr)
Total PS Load
Total Terrestrial Load

Somerset County Comprehensive Plan -A-11 - Water Resources Element APPENDIX
Figure A-4. Phosphorus Loading from Development
0
5,000
10,000
15,000
20,000
25,000
30,000
Existing Trends PFA Focus Hybrid
(lbs/
yr)
Total PS Load
Development NPS
Table A-7. Impervious Cover and Open Space
Existing (2007) Trends PFA Focus Hybrid
Total Impervious Cover 3,438 3,634 3,537 3,585
Countywide Impervious Percentage 1.7% 1.8% 1.7% 1.7%
County Land in Agriculture 49,562 48,575 49,343 48,959
County Land in Forest 82,834 81,851 82,618 82,234

Somerset County Comprehensive Plan -A-12 - Water Resources Element APPENDIX
Figure A-5. Open Space
0
20,000
40,000
60,000
80,000
100,000
120,000
140,000
Existing Trends PFA Focus Hybrid
Acre
s Forest
Agriculture
Figure A-6. Total Impervious Cover
3,300
3,350
3,400
3,450
3,500
3,550
3,600
3,650
Existing Trends PFA Focus Hybrid
Acre
s
Total Impervious Cover
Alternative NPS Model At MDE’s request, the County ran the default state NPS model using the same acreages, housing unit totals, and scenarios as in the model described above. The results of that model are shown in Table A-8. A digital version of the default state NPS model is available from the Department of Technical Services upon request.
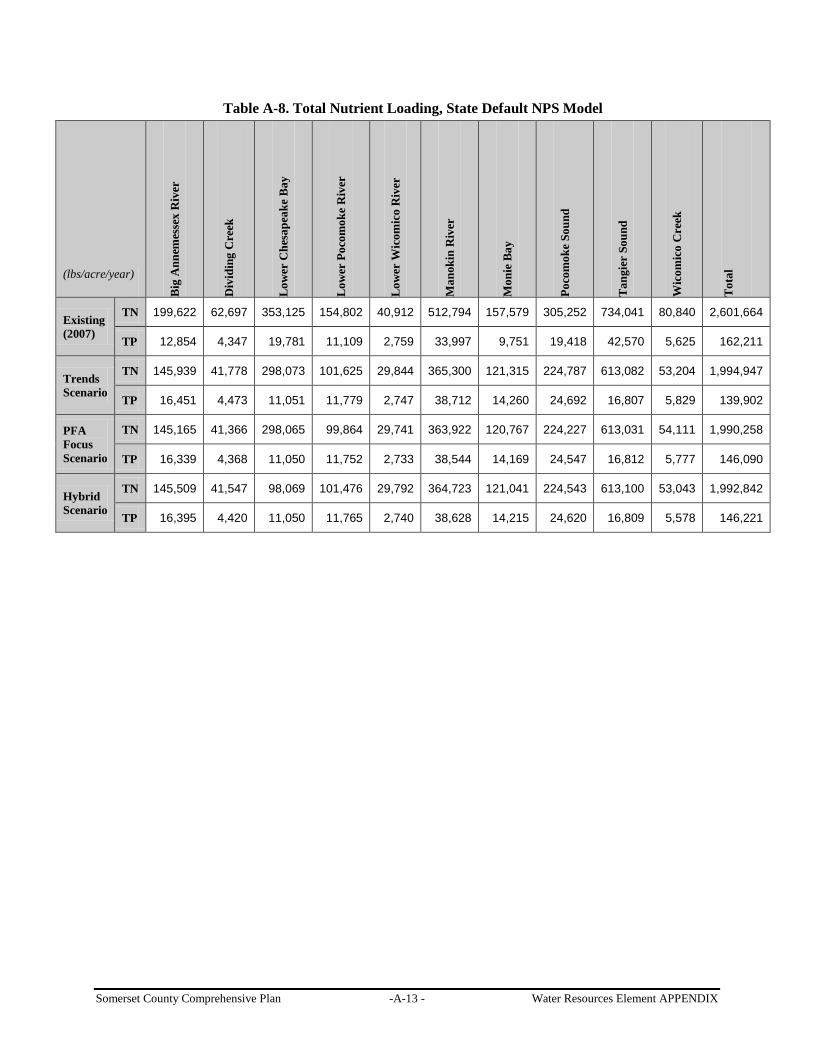
Somerset County Comprehensive Plan -A-13 - Water Resources Element APPENDIX
Table A-8. Total Nutrient Loading, State Default NPS Model
(lbs/acre/year)
Big
Ann
emes
sex
Riv
er
Div
idin
g C
reek
Low
er C
hesa
peak
e B
ay
Low
er P
ocom
oke
Riv
er
Low
er W
icom
ico
Riv
er
Man
okin
Riv
er
Mon
ie B
ay
Poco
mok
e So
und
Tan
gier
Sou
nd
Wic
omic
o C
reek
Tot
al
Existing (2007)
TN 199,622 62,697 353,125 154,802 40,912 512,794 157,579 305,252 734,041 80,840 2,601,664
TP 12,854 4,347 19,781 11,109 2,759 33,997 9,751 19,418 42,570 5,625 162,211
Trends Scenario
TN 145,939 41,778 298,073 101,625 29,844 365,300 121,315 224,787 613,082 53,204 1,994,947
TP 16,451 4,473 11,051 11,779 2,747 38,712 14,260 24,692 16,807 5,829 139,902
PFA Focus Scenario
TN 145,165 41,366 298,065 99,864 29,741 363,922 120,767 224,227 613,031 54,111 1,990,258
TP 16,339 4,368 11,050 11,752 2,733 38,544 14,169 24,547 16,812 5,777 146,090
Hybrid Scenario
TN 145,509 41,547 98,069 101,476 29,792 364,723 121,041 224,543 613,100 53,043 1,992,842
TP 16,395 4,420 11,050 11,765 2,740 38,628 14,215 24,620 16,809 5,578 146,221