Embed Size (px)
Citation preview
Sonic Corporation Equity Analysis
and Valuation
Analysis Group
CJ Edgmon [email protected]
Mel Shook [email protected]
Nathan Fernandez [email protected]
Chris Walker [email protected]
Eddie Valls [email protected]
Table of Contents Executive Summary 4
Business and Industry Analysis 10
Company Overview 10
Industry Overview 12
Five Forces Model 13
Rivalry Among Existing Firms 14
Threat of New Entrants 17
Threat of Substitute Products 19
Bargaining Power of Customers 21
Bargaining Power of Suppliers 22
Value Chain Analysis 24
Firm Competitive Advantage Analysis 26
Accounting Analysis 29
Key Accounting Policies 29
Potential Accounting Flexibility 32
Actual Accounting Strategy 36
Qualitative Analysis of Disclosure 37
Quantitative Analysis of Disclosure 38
Potential “Red Flags” 46
Undo Accounting Distortions 47
Ratio Analysis, Forecast Financials, and Cost of Capital Estimation 49
Financial Analysis 49
Liquidity Analysis 49
Profitability Analysis 58
Capital Structure Analysis 64
Internal Growth Rate and Sustainable Growth Rate Analysis 69
Financial Statement Forecasting 71
Cost of Capital Estimation 74
Analysis of Valuations 77
Method of Comparables 77
Intrinsic Valuations 82
Analyst’s Recommendation 91
Appendix 93
Sales Manipulation Diagnostic Ratios 93
Core Expense Manipulation Diagnostic Ratios 94
Effects of Goodwill on Net Income Table 95
Capitalization of Operating Lease Tables 96
Income Statements – Actual and Forecast 104
Balance Sheets – Actual and Forecast 106
Cash Flow Statements – Actual and Forecast 110
Regression Summaries 114
Weighted Average Cost of Debt Table 120
Beta Summary Table 122
Weighted Average Cost of Capital Table 123
Liquidity Analysis Tables 125
Profitability Analysis Tables 128
Capital Structure Analysis Tables 130
IGR & SGR Table 131
Ratio Tables 132
Free Cash Flow Models 141
Residual Income Models 142
Long Run ROE Residual Income Models 147
Abnormal Earnings Growth Models 150
Method of Comparables 152
References 153
4
Executive Summary
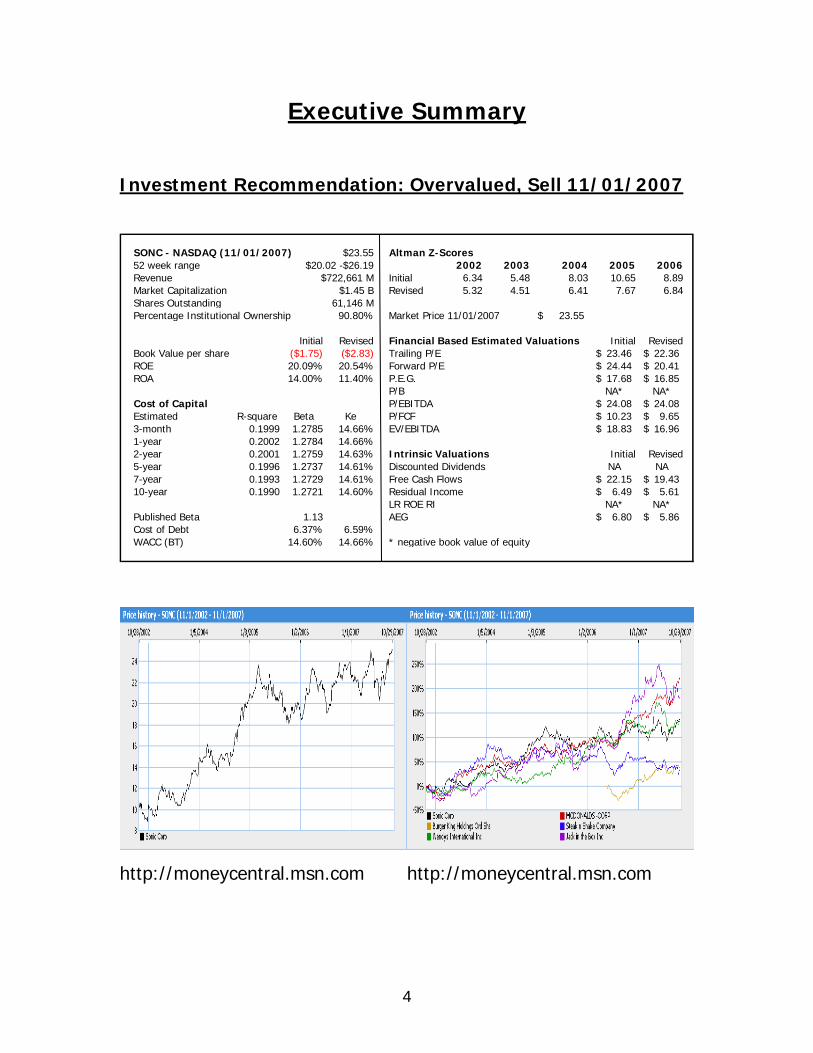
Investment Recommendation: Overvalued, Sell 11/01/2007
SONC - NASDAQ (11/01/2007) $23.55 Altman Z-Scores52 week range $20.02 -$26.19 2002 2003 2004 2005 2006Revenue $722,661 M Initial 6.34 5.48 8.03 10.65 8.89Market Capitalization $1.45 B Revised 5.32 4.51 6.41 7.67 6.84Shares Outstanding 61,146 MPercentage Institutional Ownership 90.80% Market Price 11/01/2007 23.55$
Initial Revised Financial Based Estimated Valuations Initial RevisedBook Value per share ($1.75) ($2.83) Trailing P/E 23.46$ 22.36$ ROE 20.09% 20.54% Forward P/E 24.44$ 20.41$ ROA 14.00% 11.40% P.E.G. 17.68$ 16.85$
P/B NA* NA*Cost of Capital P/EBITDA 24.08$ 24.08$ Estimated R-square Beta Ke P/FCF 10.23$ 9.65$ 3-month 0.1999 1.2785 14.66% EV/EBITDA 18.83$ 16.96$ 1-year 0.2002 1.2784 14.66%2-year 0.2001 1.2759 14.63% Intrinsic Valuations Initial Revised5-year 0.1996 1.2737 14.61% Discounted Dividends NA NA7-year 0.1993 1.2729 14.61% Free Cash Flows 22.15$ 19.43$ 10-year 0.1990 1.2721 14.60% Residual Income 6.49$ 5.61$
LR ROE RI NA* NA*Published Beta 1.13 AEG 6.80$ 5.86$ Cost of Debt 6.37% 6.59%WACC (BT) 14.60% 14.66% * negative book value of equity
http://moneycentral.msn.com http://moneycentral.msn.com
5
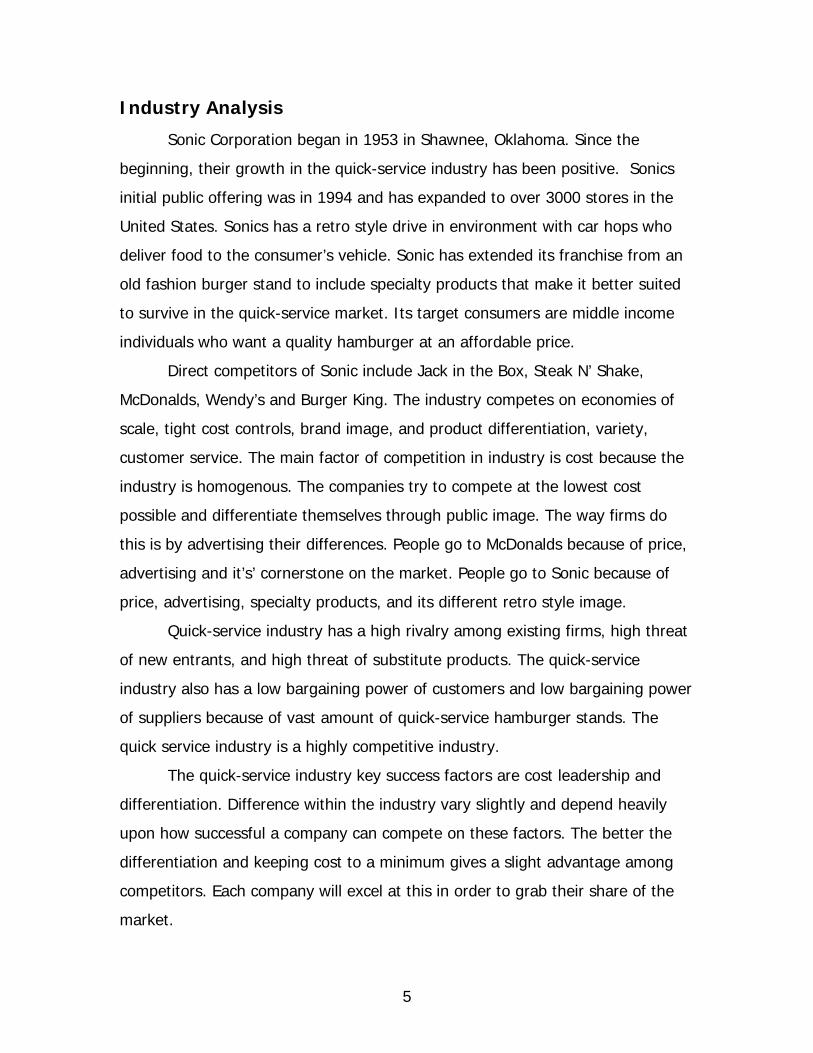
Industry Analysis
Sonic Corporation began in 1953 in Shawnee, Oklahoma. Since the
beginning, their growth in the quick-service industry has been positive. Sonics
initial public offering was in 1994 and has expanded to over 3000 stores in the
United States. Sonics has a retro style drive in environment with car hops who
deliver food to the consumer’s vehicle. Sonic has extended its franchise from an
old fashion burger stand to include specialty products that make it better suited
to survive in the quick-service market. Its target consumers are middle income
individuals who want a quality hamburger at an affordable price.
Direct competitors of Sonic include Jack in the Box, Steak N’ Shake,
McDonalds, Wendy’s and Burger King. The industry competes on economies of
scale, tight cost controls, brand image, and product differentiation, variety,
customer service. The main factor of competition in industry is cost because the
industry is homogenous. The companies try to compete at the lowest cost
possible and differentiate themselves through public image. The way firms do
this is by advertising their differences. People go to McDonalds because of price,
advertising and it’s’ cornerstone on the market. People go to Sonic because of
price, advertising, specialty products, and its different retro style image.
Quick-service industry has a high rivalry among existing firms, high threat
of new entrants, and high threat of substitute products. The quick-service
industry also has a low bargaining power of customers and low bargaining power
of suppliers because of vast amount of quick-service hamburger stands. The
quick service industry is a highly competitive industry.
The quick-service industry key success factors are cost leadership and
differentiation. Difference within the industry vary slightly and depend heavily
upon how successful a company can compete on these factors. The better the
differentiation and keeping cost to a minimum gives a slight advantage among
competitors. Each company will excel at this in order to grab their share of the
market.
6
Accounting Analysis
The basis for an accurate valuation is the analysis of the financial
statements. In order to get good information from the company’s reports it is
essential that a company fully disclose as much information as possible. Some
companies may attempt to hide deficiencies in the company by being less than
forthcoming in their accounting policies. Manipulation of expenses or sales can
be hidden by disclosing only what is required by the SEC rather than disclosing
what may be needed by analysts or other external readers to fairly value the
firm.
Sonic did a good job of disclosing information in their 10-k’s. Even though
they list operating leases off the balance sheet, they did an adequate job of
showing the off balance sheet operating leases, allowing us to restate them as
capital leases. Sonic was also slow to write off goodwill, but adequate disclosure
allowed us to calculate the amortization of goodwill in our restated financials.
Source of funds and interest rate calculations were readily available allowing us
to calculate the cost of debt and the weighted average cost of capital.
One area of concern was Sonic’s repurchase of stock in 2007. The
accounting flexibility provided by the repurchase allowed Sonic to show a
negative stockholder’s equity. This was a concern to us because it made the
valuation more difficult. There is no disclosure in management’s discussion about
why the repurchase took place. The negative value of stockholder’s equity, along
with our valuations, only added to our apprehension about buying or holding
Sonic stock.
7
Financial Analysis, Forecast Financials, and Cost of Capital
Estimation
An analysis was performed on the financial statements of Sonic in order to
determine which items needed to be forecasted and, more importantly, what
would be used to drive the forecast. Average growth of sales at Sonic has
exceeded the industry average by over 7% over the last 6 years. The success of
Sonic, in large part, will depend on continued future growth. We estimated a
future growth in sales of 11% in 2008 and 10% years 2009-2017. An asset
turnover rate of 1.11 was used to forecast future asset balances. This number
came from an average for Sonic over the past 6 years. Retained earnings and
stockholder equity were adjusted each year by the amount of net income
earned. Cash flows were forecast based on a CFFO/sales ratio of .16 in year
2008 climbing to .19 years 2013 to 2017.
A beta of 1.28 was calculated by using regression models on the return of
the S & P 500, Sonic’s returns, and risk free rates. A weighted average cost of
debt was calculated using data we collected from Sonic’s 10-k. This information
was put into the Capital Appreciation Model to calculate a cost of capital of
14.66%. This allowed us to arrive at a before tax weighted average cost of
capital of 12.41%
This data allowed us to utilize the various valuation models to determine
whether or not Sonic is overvalued, fairly valued or undervalued. In liquidity
analysis Sonic is overvalued even with manipulation of the cost of equity and the
growth rate. The forecasted financials ratios shows that Sonic had high gross
margin, operating margin, net margin, and return on assets. These ratios
convey that Sonic has high profit margins. The capital structure analysis of Sonic
was at average with the industry. The only outlier was the debt service margin
which was high because of low current assets from 2002-2004.
8
Valuations
Once the industry analysis, accounting polices, and financial ratios are
examined thoroughly, a future investor can evaluate the firms share price
through equity valuations. Using various models of valuations, a firm share price
can be determined as fairly valued, undervalued, or overvalued.
The first valuation model that is used to formulate a share price for Sonic
is the method of comparables. The method of comparables provides the investor
with seven ratios to compute both before and after restated share prices. From
this valuation method, Sonic is classified as being in between a fairly valued to
an overvalued firm. The relevant ratios that produced share prices are the P/E
forward and trailing, P.E.G., P/EBITDA, EV/EBITDA, and P/FCF. Two other ratios,
P/B and D/P, were irrelevant to our valuation. The P/B produces a negative share
value due to a negative book value of equity and Sonic is not a dividend paying
firm. However, this model is inaccurate because it is based on industry averages
and excludes intrinsic information.
The intrinsic valuation models, which are based on theory, are essential in
estimating the firm’s market value of equity. Not all of the models are equally
useful. The degree of reliance on the perpetuity determines the sensitivity and
therefore the reliability of the model. The free cash flow model and the dividend
discount model are highly sensitive and should not be considered to be as
accurate as the residual income model, the long run residual income model, and
the abnormal earnings growth model. The dividend discount model was not used
to value Sonic because they do not pay a dividend. In order to have the after
restatement FCF model equal to the observed share price, the WACC would have
to be 12.4% with a 7% growth rate. However, a 7% growth rate is not
reasonable or sustainable. The Residual Income model would have to have a
cost of equity of 5.1% and a growth rate of zero to equal the observed share
price. This is also unreasonable because the cost of equity is estimated to be at
least twice 5.1%. The residual income model was used for four different data
9
sets; including before restatement, after restatement, after restatement but
before the stock repurchase, and after restatement treating the stock repurchase
as a dividend. This was necessary because the stock repurchase created a
negative book value of equity. The last two data sets allowed us to see Sonic
with a positive book value of equity. However, all four data sets used in the RI
model suggested that Sonic is overvalued. The long run RI model also used data
sets that allowed Sonic’s book value of equity to be positive. The long-run RI
model suggested that the firm was overvalued, because the majority of the
prices generated by the model fell below the 20% range, which surrounds the
observed share price. The AEG model was used with data before and after the
restatement. The AEG model is the second most reliable behind the RI model. It
also suggested that Sonic is overvalued. In conclusion, the method of
comparables and the intrinsic valuations both indicate that Sonic is overvalued.
10
Business and Industry Analysis
Company Overview
The Sonic Corporation began as a single root beer stand in 1953 in
Shawnee, Oklahoma. Troy Smith, the owner of the stand, eventually added an
intercom system and carhops in order to differentiate his business from the
competition. These innovative ideas are what helped propel Sonic Corp. to
become the Nation’s largest drive-in chain (www.sonicdrivein.com). However,
Sonic’s main competitors are not drive-in chains. They primarily compete with
McDonald’s Corp., Steak and Shake Company, Burger King Corp., Jack in the Box
Inc., and Wendy’s International Inc. As of August 31, 2006, Sonic Corp. had a
market cap of 1.44 billion and had 3,188 Sonic Drive-Ins, which consisted of
2,565 Franchise Drive-Ins and 623 Partner Drive-Ins. These drive-ins are mainly
located in the southern two thirds of the United States and also include 2 drive-
ins in Mexico. Their executive headquarters are located at 300 Johnny Bench
Drive, Oklahoma City, Oklahoma.
A Sonic Drive-In consists of 24 to 36 covered Drive-In spaces where a
customer is able to place their order over an intercom system. The customer is
able to choose from an array of made-to-order items; such as extra long cheese
coneys, slushes, limeades, hamburgers, and tator tots. They also offer an
extensive breakfast menu which is available throughout the day. The order is
then delivered to the customer’s car by a carhop within an average of four
minutes (Sonic 10-k 2006). Sonic Corp. claims that they will continue to grow if
they continue to offer “made-to-order American classics, signature menu items,
and speedy service from friendly Carhops” (www.sonicdrivein.com).
11
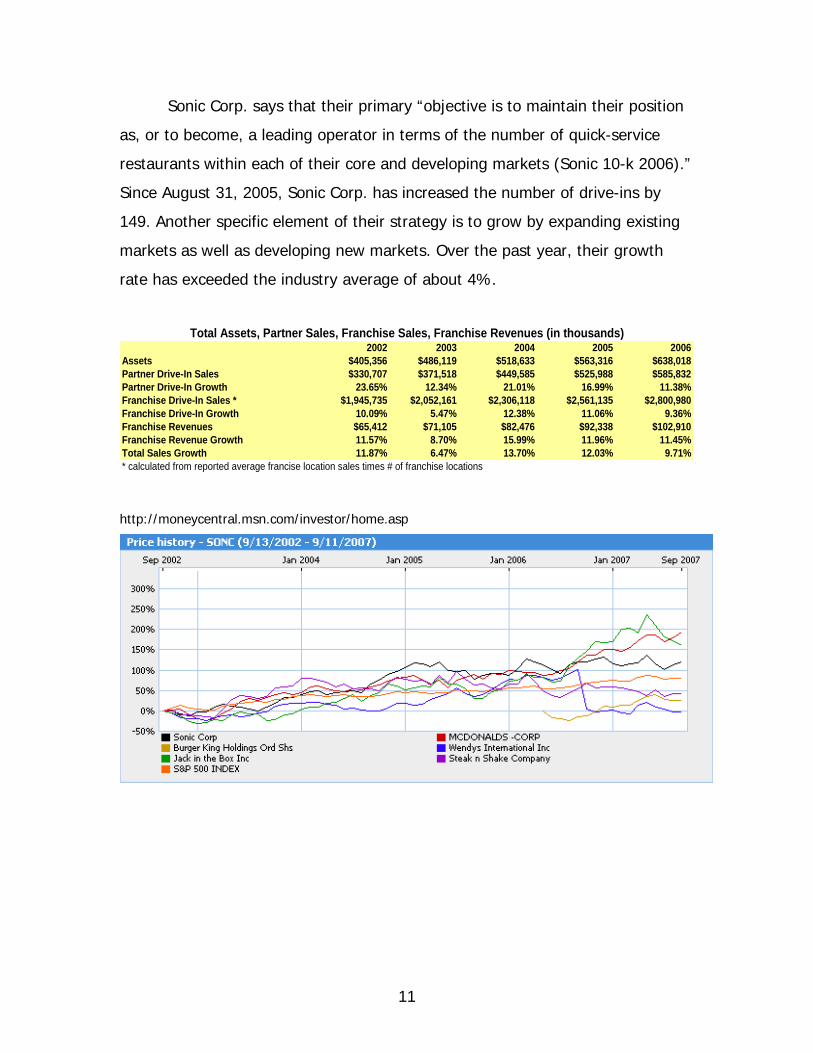
Sonic Corp. says that their primary “objective is to maintain their position
as, or to become, a leading operator in terms of the number of quick-service
restaurants within each of their core and developing markets (Sonic 10-k 2006).”
Since August 31, 2005, Sonic Corp. has increased the number of drive-ins by
149. Another specific element of their strategy is to grow by expanding existing
markets as well as developing new markets. Over the past year, their growth
rate has exceeded the industry average of about 4%.
2002 2003 2004 2005 2006Assets $405,356 $486,119 $518,633 $563,316 $638,018Partner Drive-In Sales $330,707 $371,518 $449,585 $525,988 $585,832Partner Drive-In Growth 23.65% 12.34% 21.01% 16.99% 11.38%Franchise Drive-In Sales * $1,945,735 $2,052,161 $2,306,118 $2,561,135 $2,800,980Franchise Drive-In Growth 10.09% 5.47% 12.38% 11.06% 9.36%Franchise Revenues $65,412 $71,105 $82,476 $92,338 $102,910Franchise Revenue Growth 11.57% 8.70% 15.99% 11.96% 11.45%Total Sales Growth 11.87% 6.47% 13.70% 12.03% 9.71%* calculated from reported average francise location sales times # of franchise locations
Total Assets, Partner Sales, Franchise Sales, Franchise Revenues (in thousands)
http://moneycentral.msn.com/investor/home.asp
12
Industry Overview
The restaurant industry is a part of the consumer services sector.
According to the National Restaurant Association (NRA), there are approximately
935,000 restaurant and food-service outlets in the United States. These firms
employ more than 12 million people. Sales for all outlets exceeded $500 billion in
2006, and sales for 2007 are estimated to reach $537 billion
(www.restaurant.org). Restaurant sector sales, classified as eating places by
Standard Industry Code (SIC) 5812, accounted for approximately $345 billion in
2006. There are approximately 400,000 locations that are classified in the eating
places sector.
The eating places sector is about equally divided into full-service
restaurants and quick-service restaurants. Full-service restaurants are defined as
locations where customers sit down and are waited on by a waitperson or server.
These restaurant companies include Chili’s, Morton’s, Applebee’s, and Outback
Steakhouse. Sonic Corp. (SONC) primarily competes in the quick-service (QSR)
or limited-service burger segment. Sonic Corp. competes with companies such as
McDonalds Corp (MCD), Burger King Holdings Ord Shares (BKC), Wendy’s
International Inc (WEN), Jack in the Box Inc (JBX), and Steak n Shake Company
(SNS).
QSR magazine.com defines the market for these competitors as the
“burger” segment, and they estimate 2006 sales to be approximately $59 billion.
Overall, the restaurant industry is highly fragmented. However, these major
competitors in the burger segment control a significant market share of this
segment.
13
Consumer income and convenience are the major drivers in the choice to
dine out or eat at home. Income and convenience also play roles in whether a
consumer chooses to dine at a full-service restaurant or a quick-service
restaurant.
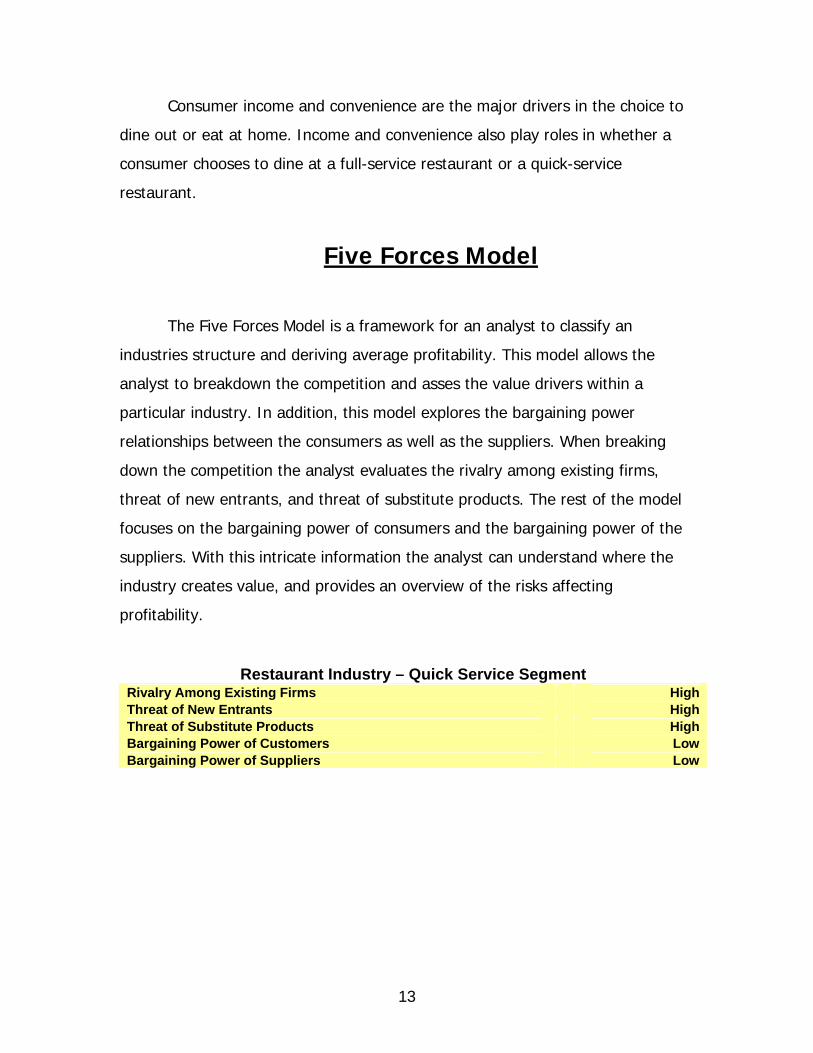
Five Forces Model
The Five Forces Model is a framework for an analyst to classify an
industries structure and deriving average profitability. This model allows the
analyst to breakdown the competition and asses the value drivers within a
particular industry. In addition, this model explores the bargaining power
relationships between the consumers as well as the suppliers. When breaking
down the competition the analyst evaluates the rivalry among existing firms,
threat of new entrants, and threat of substitute products. The rest of the model
focuses on the bargaining power of consumers and the bargaining power of the
suppliers. With this intricate information the analyst can understand where the
industry creates value, and provides an overview of the risks affecting
profitability.
Restaurant Industry – Quick Service Segment Rivalry Among Existing Firms HighThreat of New Entrants HighThreat of Substitute Products HighBargaining Power of Customers LowBargaining Power of Suppliers Low
14
Rivalry Among Existing Firms
Rivalry among existing firms in an industry depends on the level of
concentration, industry growth, switching costs, differentiation, economies of
scale, fixed to variable costs, excess capacity and exit barriers.
Industry Growth
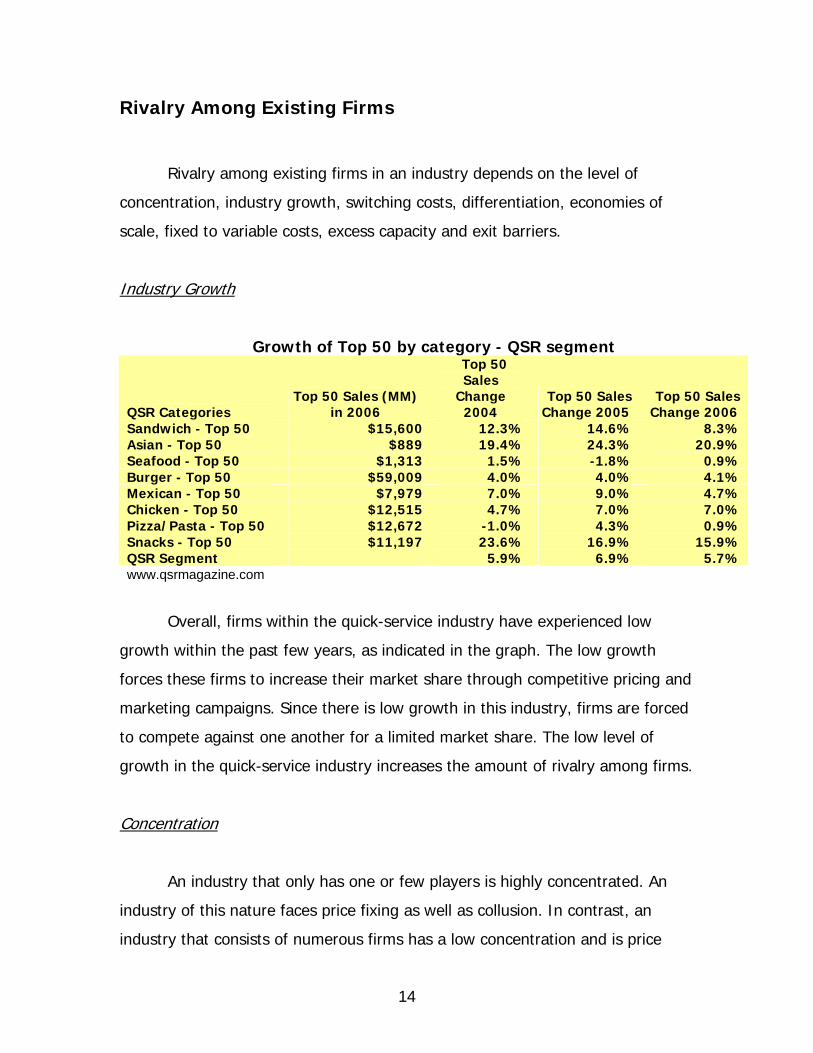
Growth of Top 50 by category - QSR segment
QSR Categories Top 50 Sales (MM)
in 2006
Top 50 Sales
Change 2004
Top 50 Sales Change 2005
Top 50 Sales Change 2006
Sandwich - Top 50 $15,600 12.3% 14.6% 8.3%Asian - Top 50 $889 19.4% 24.3% 20.9%Seafood - Top 50 $1,313 1.5% -1.8% 0.9%Burger - Top 50 $59,009 4.0% 4.0% 4.1%Mexican - Top 50 $7,979 7.0% 9.0% 4.7%Chicken - Top 50 $12,515 4.7% 7.0% 7.0%Pizza/Pasta - Top 50 $12,672 -1.0% 4.3% 0.9%Snacks - Top 50 $11,197 23.6% 16.9% 15.9%QSR Segment 5.9% 6.9% 5.7%www.qsrmagazine.com
Overall, firms within the quick-service industry have experienced low
growth within the past few years, as indicated in the graph. The low growth
forces these firms to increase their market share through competitive pricing and
marketing campaigns. Since there is low growth in this industry, firms are forced
to compete against one another for a limited market share. The low level of
growth in the quick-service industry increases the amount of rivalry among firms.
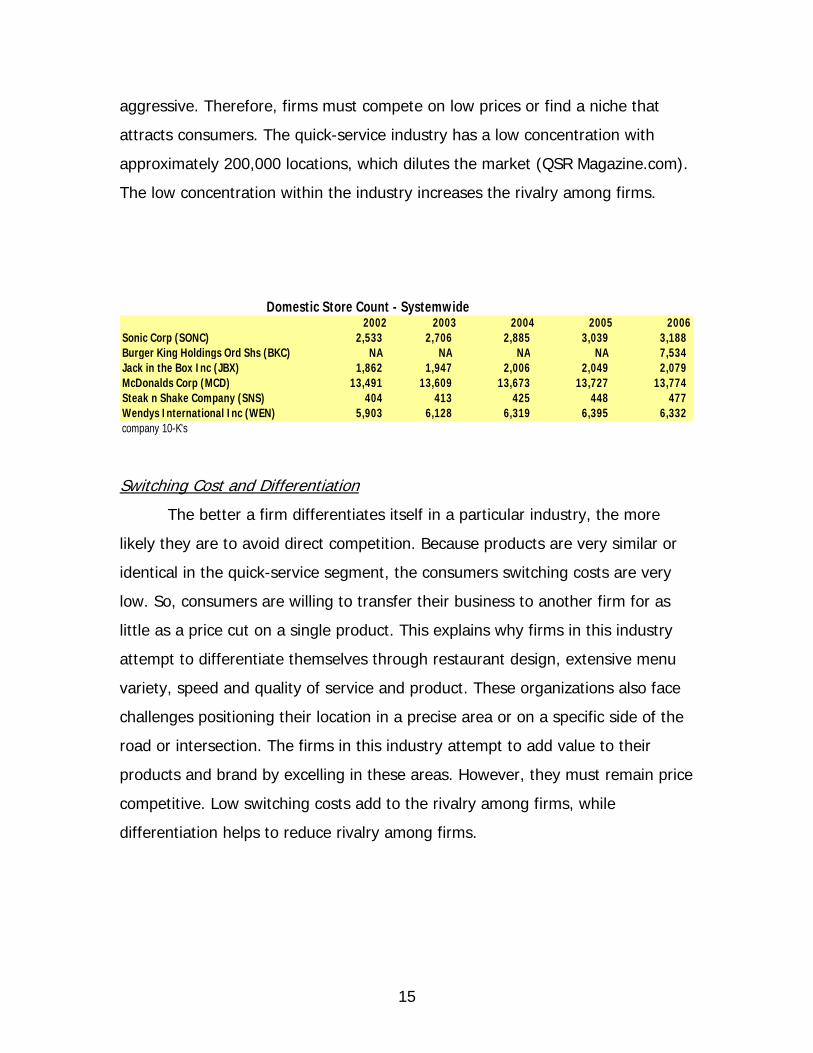
Concentration
An industry that only has one or few players is highly concentrated. An
industry of this nature faces price fixing as well as collusion. In contrast, an
industry that consists of numerous firms has a low concentration and is price
15
aggressive. Therefore, firms must compete on low prices or find a niche that
attracts consumers. The quick-service industry has a low concentration with
approximately 200,000 locations, which dilutes the market (QSR Magazine.com).
The low concentration within the industry increases the rivalry among firms.
2002 2003 2004 2005 2006Sonic Corp (SONC) 2,533 2,706 2,885 3,039 3,188 Burger King Holdings Ord Shs (BKC) NA NA NA NA 7,534 Jack in the Box Inc (JBX) 1,862 1,947 2,006 2,049 2,079 McDonalds Corp (MCD) 13,491 13,609 13,673 13,727 13,774 Steak n Shake Company (SNS) 404 413 425 448 477 Wendys International Inc (WEN) 5,903 6,128 6,319 6,395 6,332 company 10-K's
Domestic Store Count - Systemwide
Switching Cost and Differentiation
The better a firm differentiates itself in a particular industry, the more
likely they are to avoid direct competition. Because products are very similar or
identical in the quick-service segment, the consumers switching costs are very
low. So, consumers are willing to transfer their business to another firm for as
little as a price cut on a single product. This explains why firms in this industry
attempt to differentiate themselves through restaurant design, extensive menu
variety, speed and quality of service and product. These organizations also face
challenges positioning their location in a precise area or on a specific side of the
road or intersection. The firms in this industry attempt to add value to their
products and brand by excelling in these areas. However, they must remain price
competitive. Low switching costs add to the rivalry among firms, while
differentiation helps to reduce rivalry among firms.
16
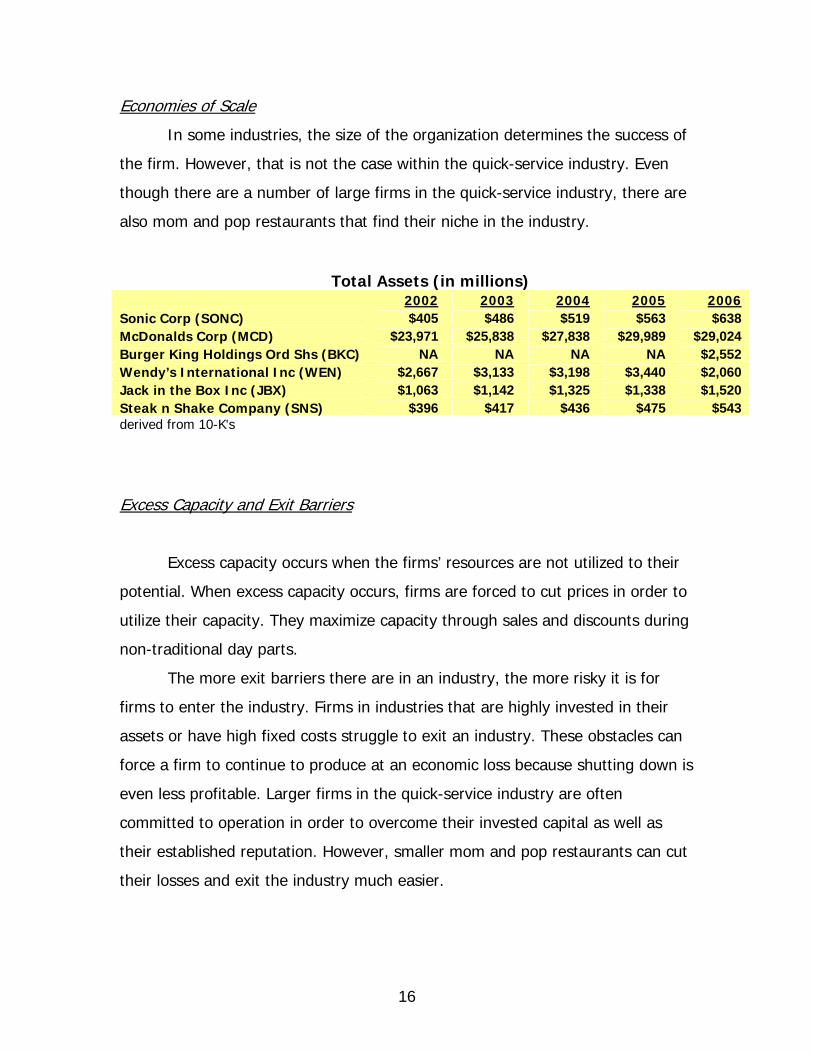
Economies of Scale
In some industries, the size of the organization determines the success of
the firm. However, that is not the case within the quick-service industry. Even
though there are a number of large firms in the quick-service industry, there are
also mom and pop restaurants that find their niche in the industry.
Total Assets (in millions) 2002 2003 2004 2005 2006Sonic Corp (SONC) $405 $486 $519 $563 $638McDonalds Corp (MCD) $23,971 $25,838 $27,838 $29,989 $29,024Burger King Holdings Ord Shs (BKC) NA NA NA NA $2,552Wendy’s International Inc (WEN) $2,667 $3,133 $3,198 $3,440 $2,060Jack in the Box Inc (JBX) $1,063 $1,142 $1,325 $1,338 $1,520Steak n Shake Company (SNS) $396 $417 $436 $475 $543derived from 10-K's
Excess Capacity and Exit Barriers
Excess capacity occurs when the firms’ resources are not utilized to their
potential. When excess capacity occurs, firms are forced to cut prices in order to
utilize their capacity. They maximize capacity through sales and discounts during
non-traditional day parts.
The more exit barriers there are in an industry, the more risky it is for
firms to enter the industry. Firms in industries that are highly invested in their
assets or have high fixed costs struggle to exit an industry. These obstacles can
force a firm to continue to produce at an economic loss because shutting down is
even less profitable. Larger firms in the quick-service industry are often
committed to operation in order to overcome their invested capital as well as
their established reputation. However, smaller mom and pop restaurants can cut
their losses and exit the industry much easier.
17
Conclusions
The quick-service industry is a low concentrated, highly competitive
industry that has seen low growth in recent years. While there is some
differentiation within the industry, low switching costs offset any advantage
gained from differentiation. In addition, few firms have the economies of scale
needed to gain a competitive advantage. Also, firms in the industry reach their
full capacity through price competition.
Threat of New Entrants
The threat of new entrants in an industry is dependent on several factors.
Economies of scale, first mover advantage, access to channels of distribution,
supplier relations, and legal barriers are all determinates of this threat. The
industry is structured so that smaller businesses can battle for market share by
providing a service that the larger competitors can not, such as superior
customer service or healthy and quality food products. In some cases, a low
concentrated industry, like the quick-service industry, is forced to lower prices
and attempts to recover profits by cutting expenses or tightening the entire
supply chain.
Economies of Scale
The quick-service industry faces high risks of new entrants. A new firm
can enter the industry without being dragged down by large amounts of debt
which means that the new entrants do not need a significant number of assets or
large amounts of capital to be profitable in the industry. The quick-service
industry also does not take an extensive degree of research and development
18
prior to entering. However, the new entrant still must find a niche in the market
because they will be at a disadvantage to existing firms in the industry.
Supplier Relations and Channel Access
The major firms in the quick-service industry gain a portion of their
competitive advantage through supply chain management. The larger players in
the industry are able to buy their products in bulk. So, these firms are able to
enjoy discounts and price cuts. Not to mention, the larger existing firms have
long well established relationships with loyal suppliers. However, this is where
few industry players also clash for a competitive edge, and provide fresh non-
frozen healthy products with fewer supplier channels. This illustrates those firms
with un-established supply chains can still enter the industry and not necessarily
be at a competitive disadvantage.
Legal Barriers
Throughout the quick-service industry there are multiple segments. Sonic
is a part of the burger segment within the industry, which faces state laws that
regulate franchises as well as regulations adopted by the Federal Trade
Commission. Additional laws consist of abiding by federal and state
environmental regulations, labor laws, safety and fire codes, and most
importantly licensing restrictions. However, these legal barriers are not
significant enough to defer a firm from entering the quick-service industry.
Conclusions
The threat of new entrants in the quick-service industry is high because
there are few barriers to entry. The threat of new entrants in the quick service
industry is a high risk to the existing organizations. The information provides an
19
illustration of how new entrants do not necessarily have to have large economies
of scale to enter the industry. The legal barriers that new entrants are forced to
face are manageable. Therefore, existing firms are at risk of new entrants.
Threat of Substitute Products
The threat of substitute products has a major effect on the quick-service
industry. Ultimately, every industry competitor produces virtually the same menu
items in a differentiated fashion. Therefore, firms in this industry that are
profitable are the firms that not only compete on price, but on the overall
perception of value experienced by the customer.
Relative Price and Performance
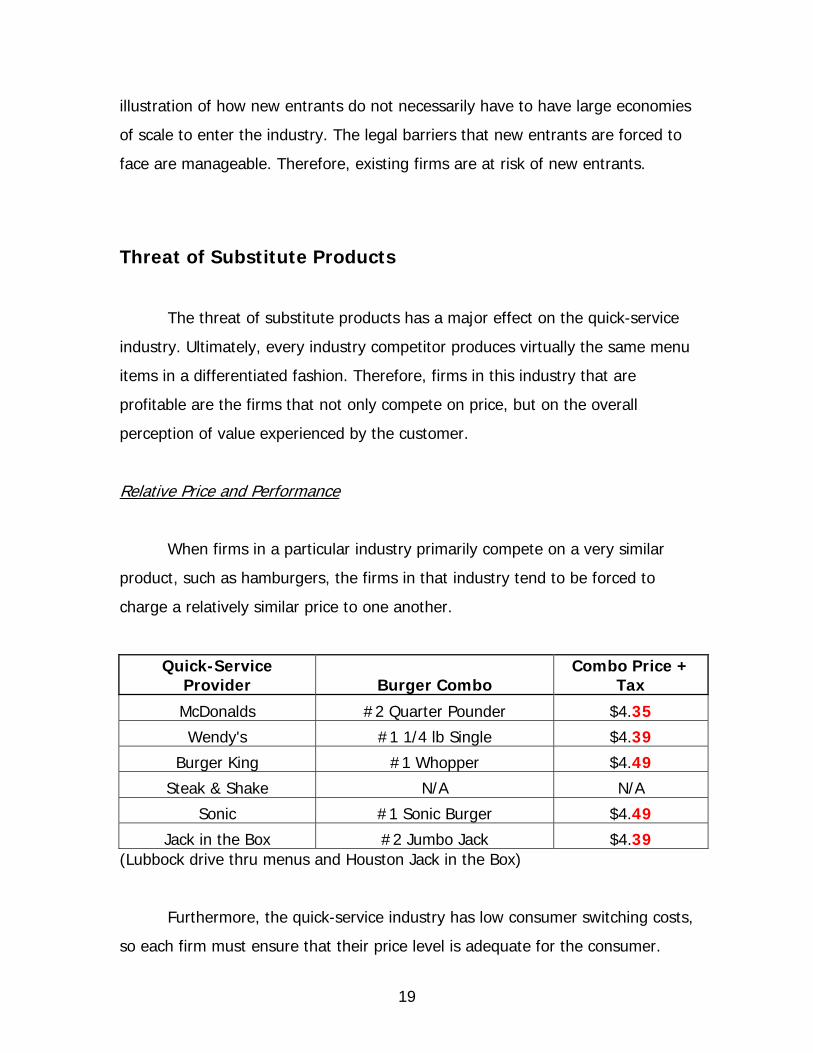
When firms in a particular industry primarily compete on a very similar
product, such as hamburgers, the firms in that industry tend to be forced to
charge a relatively similar price to one another.
Quick-Service Provider Burger Combo
Combo Price + Tax
McDonalds #2 Quarter Pounder $4.35
Wendy's #1 1/4 lb Single $4.39
Burger King #1 Whopper $4.49
Steak & Shake N/A N/A
Sonic #1 Sonic Burger $4.49
Jack in the Box #2 Jumbo Jack $4.39 (Lubbock drive thru menus and Houston Jack in the Box)
Furthermore, the quick-service industry has low consumer switching costs,
so each firm must ensure that their price level is adequate for the consumer.
20
Ultimately, all competitors within the quick-service industry provide the same
generalized function to the consumer; therefore, firms must extract as much
value as possible while simultaneously providing a fair market price. These
organizations in this industry attempt to extract maximum value by providing
speedy and quality customer service, differentiated menu items, and a
convenience factor. Also, consumers interpret added value when they receive a
lower price. So, many of the burger quick-service firms have began adding value
menus.
Buyers’ Willingness to Switch
The quick-service industry provides the consumer with such a wide variety
of choices that it forces the firms to take extreme measures when determining
the geographic locations of their stores. Because all industry competitors provide
the same function, consumers’ willingness to switch is very high. Therefore,
convenience is a major factor in determining the location of a firm; even to the
extreme of what side of the street the business is on. In addition to location,
new signature products, upcoming sales promotion, consumer service
commitments, and economic conditions all have significant impact on the firms’
ability to overcome the consumers’ willingness to switch (Sonic 10-k 2006). This
is the basis for establishing a loyal customer base and attracting new consumers,
which will eventually lead to higher profits and firm growth.
Conclusions
When competing in the quick-service industry there is no method to
avoiding substitute products. This demonstrates why substitute products are a
major risk for existing firms. To succeed in an industry with low switching costs,
firms must focus on their core competencies. Sonic’s commitment to speedy
service and assortment of products is a few of their core competencies used to
21
achieve desirable profits and increase shareholder value. They must also
continue to attract and build a loyal clientele to reach future growth
expectations. Sonic currently has the “industry-leading customer frequency,”
showing how repeat business is a crucial part in being successful
(www.sonicdrivein.com).
Bargaining Power of Customers
One-fifth of the United States of America’s population eats in a quick
service restaurant every day. The QSR industry offers food, a necessity, and
affordable prices. So it is no wonder why so many people eat at these places.
When millions of people gladly pay these low prices there can not be much
room, if any, to bargain for cheaper food.
Price Sensitivity
The price sensitivity of an average customer is derived from the
relationship between their perceived value and the cost of the product. High
price sensitive customers can be found in industries where there are
undifferentiated products and low switching costs. The switching costs are low
due to an abundance of quick service restaurants in a given area, and
transferring between two is effortless. In the fast food industry, menus consist
of similar products however, differentiate among type: burgers, chicken, or
Mexican. In a customer’s cost structure, food is ranked very high because it is a
necessity in every day life. Dollar and Value Menus allow people with the
tightest budgets to remain customers of the fast food industry. Most quick-
service restaurants maintain approximately the same price level, and customers
expect them to. A burger is a burger, and so people value one restaurant’s
products equal to the next one. A substantial upward or downward change in
22
price would result in equal reactions by the customers. In this instance, the
customer would eat at the below market priced restaurant. But a large drop or
increase in price is rare for the QSR industry, and so customers do not shop by
price. When a person has decided to eat fast food he or she must choose from
the restaurants located in the area (convenience) and from his or her perceived
value (taste) of the different product lines. In the case of the quick-service
industry, customers are considered low price sensitive for not shopping on price.
Relative Bargaining Power
The relative bargaining power of a customer is their ability to demand a
drop in prices. The customers’ bargaining power comes from the cost of not
doing business with the fast food restaurant. However, for the individual
customer, this power is miniscule because “On average, one-fifth of the
population of the USA (45 million people) eat in a fast-food restaurant each day,”
(Oxford University Press). Thus, a handful of price-disputing customers are not
threatening to the industry. Also, the individual customer holds little power when
considering the proportion of loss in sales to total revenue a restaurant will
sustain. However, one of the few instances when the customer holds bargaining
power is when a restaurant prices their items too high. In this case the
customer can choose to go elsewhere as long as alternatives are offered. Even
for highly price sensitive fast food customers, there is a slim chance for price
reduction, because individually they have no bargaining power in scale of such a
large customer base.
Bargaining Power of Suppliers
Fast Food suppliers are abundant and compete heavily for the supply contracts
of these businesses. The differences between each supplier are minimal, so, the
23
price and quality of service will be a major factor in determining suppliers.
Besides lower prices, in comparison to other suppliers, quick-service restaurants
want consistent supplier services. Restaurants want the quality of food supplies
to consistently meet their food standards and be delivered on time. The
restaurants reputation is hurt when cases of food poisoning arise, and the
restaurant looses sales if food or container supplies arrive late. In both cases
the restaurant is initially hurt, but blame falls on the supplier. The supplier is
demanded to have low prices and consistent services if they want a profiting
business.
Price Sensitivity
In the quick-service restaurant industry suppliers are viewed as having
low price sensitivity for favoring the accumulation of contracts and retention with
restaurants more important than getting a higher price for their service. The
supplier is in a position to receive more contracts from restaurants if they can
offer lower prices in comparison to the overall supply industry. They can retain
their restaurant contracts with consistent quality of service and willingness to
alter prices along with the changes in market.
Relative Bargaining Power
The bargaining power in the restaurant-supplier relationship gravitates to
the prior party. Restaurants buy in bulk volumes and buy regularly. For the
supplier this relationship delivers a steady stream of revenue, and is highly
desirable. The little bargaining power of the supplier is threatened even more
when a competitor is able to offer lower costing products, which, at a price
would not return a profit for the original supplier. Some instances, the supplier
will take a loss in profits if it means keeping the contract (cost cuts can always
be made in the future to reduce profit loss). In this relationship the restaurants
24
hold the power to bargain, while suppliers must cut costs, reduce prices, and
even take profit losses in order compete in this industry.
Value Chain Analysis
Competitive Strategies
The quick service industry has a high degree of rivalry among existing
firms, a threat of new entrants, and a threat of substitute products. Also, there is
low bargaining power of customers and a moderate power with suppliers. The
quick service industry is a highly competitive market that relies on price and
brand imaging. In order to remain profitable, the companies take into great
consideration the economies of scale, brand imaging, tight cost control, and
product differentiation.
Economies of scale
The quick service industry is a highly competitive market that places an
emphasis on marketing similar products with a different brand image.
Competitors try and use their large scale to influence buying power from
suppliers in the quick-service industry. Also there are many competing quick
service restaurants; there is additional competition with the mom & pop stores.
Brand image
Brand Image identifies what the industry represents. Consumers relate to
brand imaging by gathering some information from the media to inform them on
the quick-service industry. Ways brand image can be affected in the quick
25
service segment is health concerns like reports of contaminated meats, which
decrease sales. This and other factors can have a significant impact on the whole
industry. Brand image is a factor in the quick-service industry but can not be the
focus of the quick service industry because of cost controls.
Tight cost controls
Tight cost control is a way to achieve a competitive advantage in a highly
undifferentiated market, such as the quick service industry. In order to do this,
companies need to “achieve cost leadership, economies of scale and scope,
efficient production, better sourcing and lower input costs” (Business Analysis
and Valuation). Economies of scale and scope in an undifferentiated market
decrease in cost because of large scale operations (www.answers.com). Lower
input costs require minimizing cost of materials, direct labor, and overhead.
Efficient production is achieving cost leadership by producing products at the
lowest cost with the fewest resources (www.investopedia.com). In conclusion,
implementing tight cost controls is an important aspect of the quick-service
industry.
Product differentiation quality, variety, customer service
Product differentiation brings customers to a place of business. Whether it
be because of quality, variety or customer service; differentiation between the
different quick service companies helps bring in the revenue. There are multiple
burger businesses across the nation, and in order to bring business to a specific
firm there needs to be a reason for the consumer to choose one firm over the
other. All of the quick service giants incorporate themes and characters to help
bring out their core values and ideas. In effect advertising is necessary in order
to compete with the large quick service chains but not at the local level.
26
Competitors in the industry try to differentiate themselves through innovation
and reinventing other competitors’ products.
Firm Competitive Advantage Analysis
There are two ways that a company can compete in a market. They are
through cost leadership or differentiation. The difference between the two is that
in a cost leadership industry there are very similar products that must be
produced at the lowest cost possible; while differentiation relies on the
differences in products. Sonic Corporation, like most of the industry, can be
classified as falling somewhere between cost leadership and differentiation.
Economies of Scale
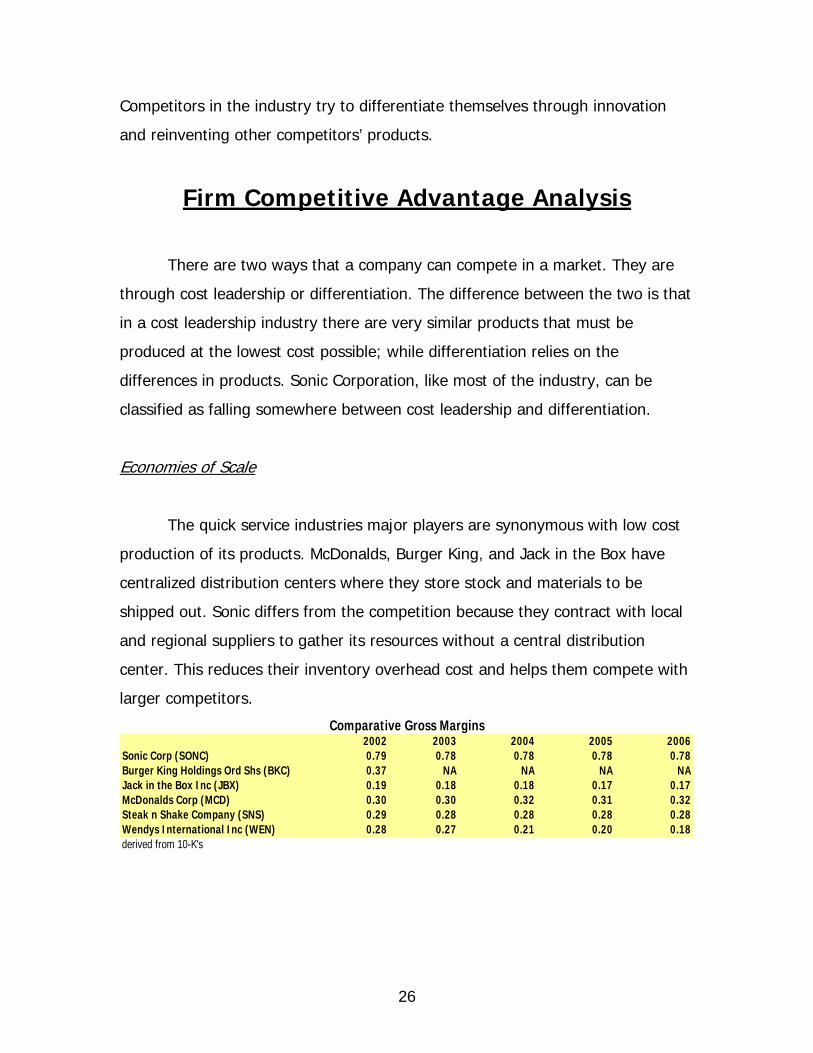
The quick service industries major players are synonymous with low cost
production of its products. McDonalds, Burger King, and Jack in the Box have
centralized distribution centers where they store stock and materials to be
shipped out. Sonic differs from the competition because they contract with local
and regional suppliers to gather its resources without a central distribution
center. This reduces their inventory overhead cost and helps them compete with
larger competitors.
2002 2003 2004 2005 2006Sonic Corp (SONC) 0.79 0.78 0.78 0.78 0.78Burger King Holdings Ord Shs (BKC) 0.37 NA NA NA NAJack in the Box Inc (JBX) 0.19 0.18 0.18 0.17 0.17McDonalds Corp (MCD) 0.30 0.30 0.32 0.31 0.32Steak n Shake Company (SNS) 0.29 0.28 0.28 0.28 0.28Wendys International Inc (WEN) 0.28 0.27 0.21 0.20 0.18derived from 10-K's
Comparative Gross Margins
27
Tight Cost Control
Sonic utilizes cost control by minimizing cost of materials, direct labor, and
overhead. In order to minimize materials and overhead Sonic differs from
McDonalds, Burger King, and Wendy’s by using local resources to gather their
product. This lowers the overhead costs. Also, Sonic minimizes direct labor costs
through efficient production by cutting back employee time during non peak
hours and increasing employee hours during peak hours for maximum
production. Another way they use effective productivity is by having drink
specials from 3-5 pm. This draws customers in at slow points during the day
maximizing productivity.
Brand Image
A firm can face a tremendous set back if the image of their company is
perceived negatively by the customer. Each of the quick service chains rely on
their specific image. Advertisements play a huge role in conveying why each
consumer should try or come back to a quick service business. During the past
couple of years, Sonic has come up with two quirky personas through advertising
to draw attention towards new items They also have car-hops who deliver food
to the car instead of picking it up by drive through. Another difference is Sonics
wide variety of specialty beverages like the Limeades and slushes. Sonic spent
“approximately $145 million for fiscal year 2006” and will increase its advertising
expense to “160 million for fiscal year 2007” (Sonic 10-K 2006). Assuming that
Sonic will be spending more money on advertising next year their brand image
will continue to be a source for attracting new and continued customers.
28
Product differentiation, variety, and customer service
Product differentiation is hard to accomplish when the firm is in the burger
segment, because a burger is just a burger. Differentiation does not only come
from changing an existing industry product. Firms can also differentiate by
offering different products. Sonic’s ability to draw on its specialty beverages,
such as its limeades and slushes, differs from its competitors because they are
offering something that no one else has. Another differentiating factor for Sonic
is its variety. It offers the same variety of burgers and fries but also adds tator-
tots, corn dogs, extra long cheese coneys and various other products that the
other competitors do not have to the menu. Also Sonic’s buildings stand out from
the competitions because they have a new, unique retro fitted look. They also
put a twist on customer service by bringing the food to the customer’s drive-in
space. This makes the customer service more personal and interactive. Sonic
personalizes the quick service experience by this interaction, yet they still
maintain an average “wait time of 4 minutes.”(Sonic 10-K 2006)
29
Accounting Analysis
A firm’s financial statements do not always credibly reflect economic
consequences of business activities. In fact, a lot of the information within a
financial report is reliant on the firm’s interpretations and judgments. So, the
implementation of accounting analysis helps to view the financial statements
with as little managerial bias as possible. Thus, outsiders can see a more true
and transparent picture of how the firm operates. There is a series of six steps
that analysts follow in order to successfully complete the accounting analysis.
The first step is identifying a firm’s key accounting policies and seeing how they
relate to their key success factors and how they relate to the industry. The
second step is to assess the degree of potential accounting flexibility given to
managers as it relates to the key accounting policies. The next step is to
evaluate the actual accounting strategies used by managers as well as the
motives behind those strategies. After that, the quality and depth of disclosure
needs to be evaluated. The fifth step is to determine if there are any red flags,
which might need to be evaluated more in depth. The final step in the
accounting analysis process is to undo the accounting distortions. So, the analyst
is left with accounting numbers that are free of management biases (Palepu &
Healy).
Key Accounting Policies
The industry characteristics and the firm’s competitive strategy are
important factors in determining the firm’s risks and key success factors. It is
also important for an analyst to ensure that their accounting policies are in line
with the firm’s key success factors. Therefore, it is imperative for an analyst to
identify and evaluate the policies that are used by managers to measure those
30
key factors and risks. As determined in the “Firms Competitive Advantage
Analysis” section, Sonic’s key success factors are tight cost control, economies of
scale, brand image, differentiation through menu variety and personal service,
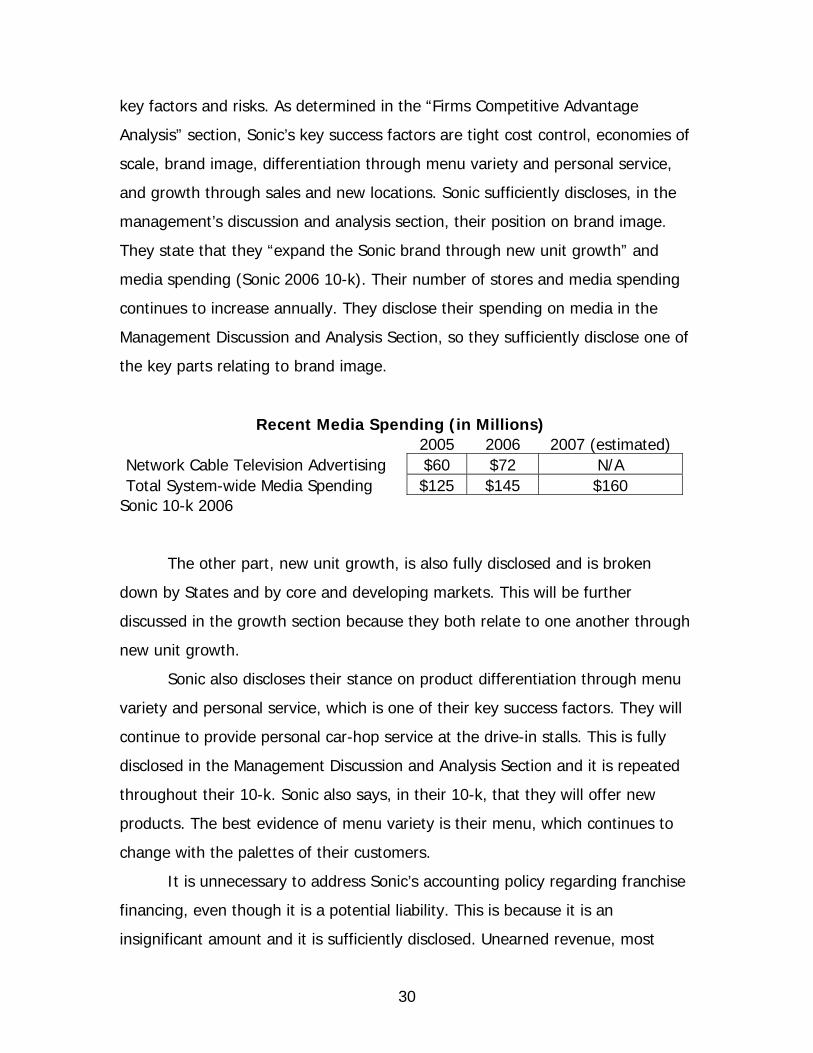
and growth through sales and new locations. Sonic sufficiently discloses, in the
management’s discussion and analysis section, their position on brand image.
They state that they “expand the Sonic brand through new unit growth” and
media spending (Sonic 2006 10-k). Their number of stores and media spending
continues to increase annually. They disclose their spending on media in the
Management Discussion and Analysis Section, so they sufficiently disclose one of
the key parts relating to brand image.
Recent Media Spending (in Millions) 2005 2006 2007 (estimated) Network Cable Television Advertising $60 $72 N/A Total System-wide Media Spending $125 $145 $160
Sonic 10-k 2006
The other part, new unit growth, is also fully disclosed and is broken
down by States and by core and developing markets. This will be further
discussed in the growth section because they both relate to one another through
new unit growth.
Sonic also discloses their stance on product differentiation through menu
variety and personal service, which is one of their key success factors. They will
continue to provide personal car-hop service at the drive-in stalls. This is fully
disclosed in the Management Discussion and Analysis Section and it is repeated
throughout their 10-k. Sonic also says, in their 10-k, that they will offer new
products. The best evidence of menu variety is their menu, which continues to
change with the palettes of their customers.
It is unnecessary to address Sonic’s accounting policy regarding franchise
financing, even though it is a potential liability. This is because it is an
insignificant amount and it is sufficiently disclosed. Unearned revenue, most
31
recently called “Deposits from franchises” by Sonic, is another area that is an
insignificant amount and does not need to be evaluated.
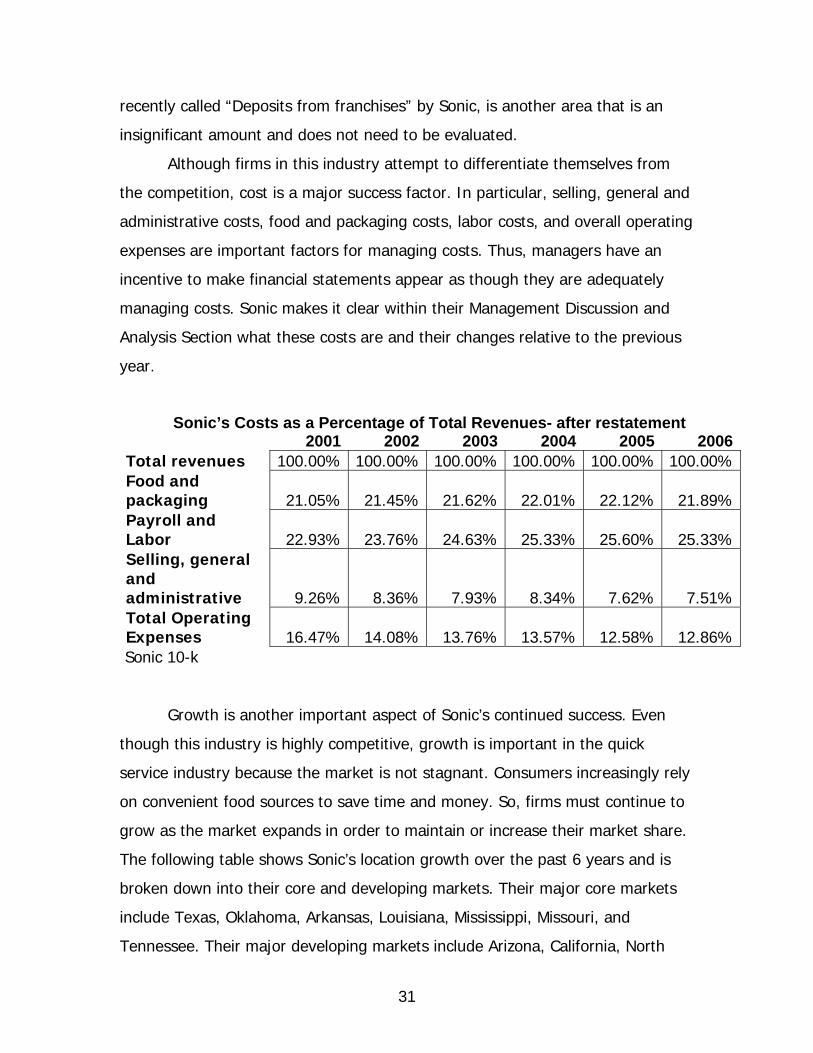
Although firms in this industry attempt to differentiate themselves from
the competition, cost is a major success factor. In particular, selling, general and
administrative costs, food and packaging costs, labor costs, and overall operating
expenses are important factors for managing costs. Thus, managers have an
incentive to make financial statements appear as though they are adequately
managing costs. Sonic makes it clear within their Management Discussion and
Analysis Section what these costs are and their changes relative to the previous
year.
Sonic’s Costs as a Percentage of Total Revenues- after restatement 2001 2002 2003 2004 2005 2006Total revenues 100.00% 100.00% 100.00% 100.00% 100.00% 100.00%Food and packaging 21.05% 21.45% 21.62% 22.01% 22.12% 21.89%Payroll and Labor 22.93% 23.76% 24.63% 25.33% 25.60% 25.33%Selling, general and administrative 9.26% 8.36% 7.93% 8.34% 7.62% 7.51%Total Operating Expenses 16.47% 14.08% 13.76% 13.57% 12.58% 12.86%
Sonic 10-k
Growth is another important aspect of Sonic’s continued success. Even
though this industry is highly competitive, growth is important in the quick
service industry because the market is not stagnant. Consumers increasingly rely
on convenient food sources to save time and money. So, firms must continue to
grow as the market expands in order to maintain or increase their market share.
The following table shows Sonic’s location growth over the past 6 years and is
broken down into their core and developing markets. Their major core markets
include Texas, Oklahoma, Arkansas, Louisiana, Mississippi, Missouri, and
Tennessee. Their major developing markets include Arizona, California, North
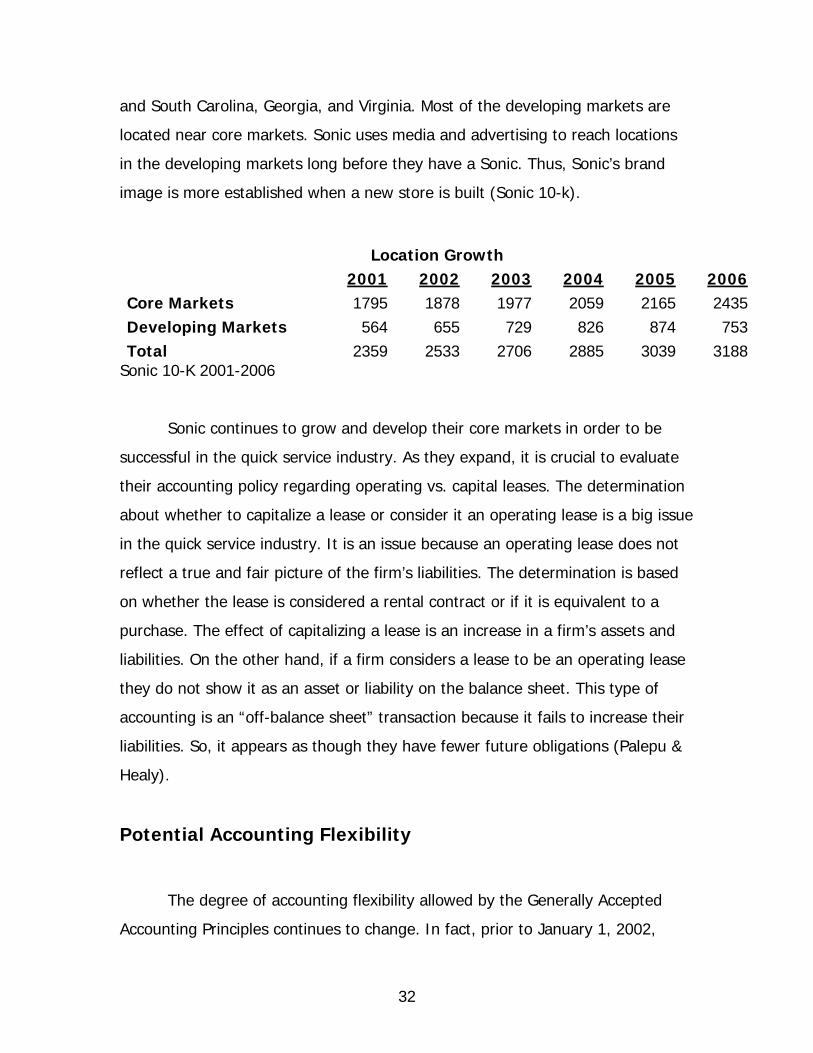
32
and South Carolina, Georgia, and Virginia. Most of the developing markets are
located near core markets. Sonic uses media and advertising to reach locations
in the developing markets long before they have a Sonic. Thus, Sonic’s brand
image is more established when a new store is built (Sonic 10-k).
Location Growth 2001 2002 2003 2004 2005 2006Core Markets 1795 1878 1977 2059 2165 2435Developing Markets 564 655 729 826 874 753Total 2359 2533 2706 2885 3039 3188
Sonic 10-K 2001-2006
Sonic continues to grow and develop their core markets in order to be
successful in the quick service industry. As they expand, it is crucial to evaluate
their accounting policy regarding operating vs. capital leases. The determination
about whether to capitalize a lease or consider it an operating lease is a big issue
in the quick service industry. It is an issue because an operating lease does not
reflect a true and fair picture of the firm’s liabilities. The determination is based
on whether the lease is considered a rental contract or if it is equivalent to a
purchase. The effect of capitalizing a lease is an increase in a firm’s assets and
liabilities. On the other hand, if a firm considers a lease to be an operating lease
they do not show it as an asset or liability on the balance sheet. This type of
accounting is an “off-balance sheet” transaction because it fails to increase their
liabilities. So, it appears as though they have fewer future obligations (Palepu &
Healy).
Potential Accounting Flexibility
The degree of accounting flexibility allowed by the Generally Accepted
Accounting Principles continues to change. In fact, prior to January 1, 2002,
33
“purchased goodwill and identifiable intangible assets were capitalized and
amortized over their useful lives” (www.unilever.com P.3). However, post
January 1, 2002 GAAP, under SFAS 142, states that goodwill and other
identifiable intangible assets that have indefinite useful lives will no longer be
amortized (www.unilever.com P.3). This allows managers the freedom to
amortize goodwill only when they believe that it is impaired. In fact, the common
policy across the quick service industry is to amortize goodwill only when
managers believe that it has been impaired. The majority of the goodwill comes
from repurchasing franchise owned locations. The most recent goodwill increase
of $8.5 million was a result of the Tennessee and Kentucky acquisition. This
obviously allows for a lot of management interpretation and provides no “real”
policy regarding when a company should amortize goodwill. Companies in the
quick service industry undoubtedly use this policy to their advantage because the
majority of them have not found it necessary to decrease a significant amount of
their goodwill.
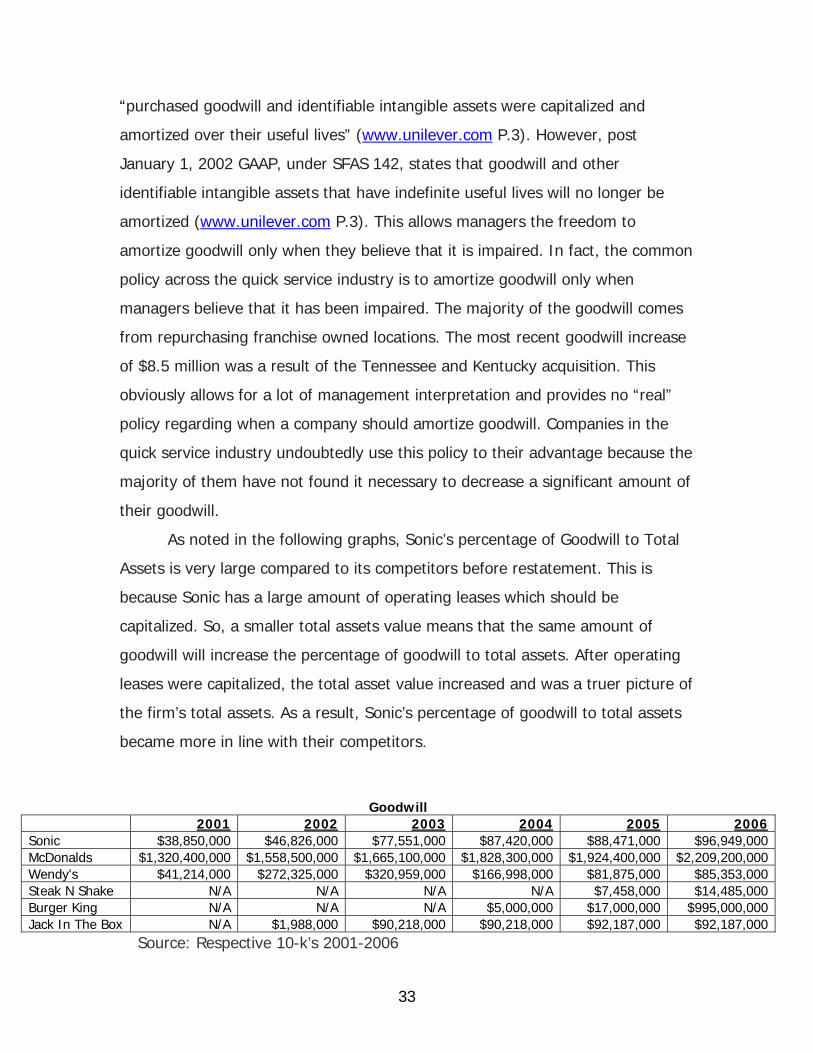
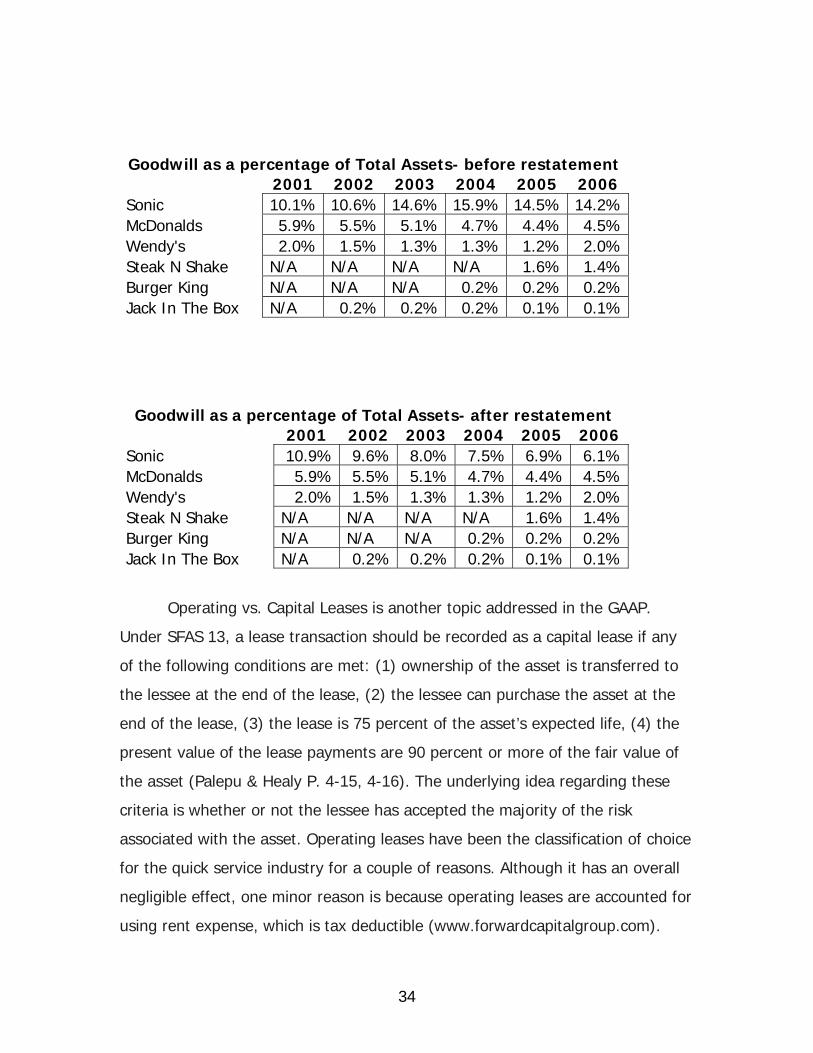
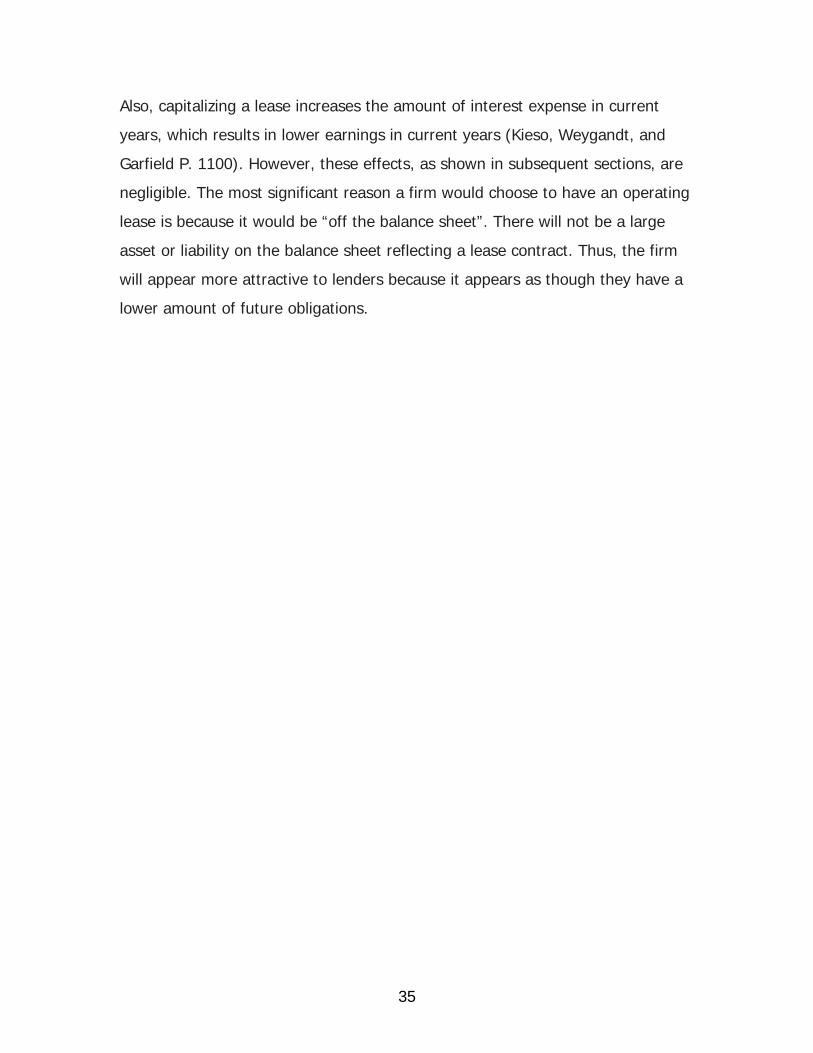
As noted in the following graphs, Sonic’s percentage of Goodwill to Total
Assets is very large compared to its competitors before restatement. This is
because Sonic has a large amount of operating leases which should be
capitalized. So, a smaller total assets value means that the same amount of
goodwill will increase the percentage of goodwill to total assets. After operating
leases were capitalized, the total asset value increased and was a truer picture of
the firm’s total assets. As a result, Sonic’s percentage of goodwill to total assets
became more in line with their competitors.
Goodwill 2001 2002 2003 2004 2005 2006Sonic $38,850,000 $46,826,000 $77,551,000 $87,420,000 $88,471,000 $96,949,000McDonalds $1,320,400,000 $1,558,500,000 $1,665,100,000 $1,828,300,000 $1,924,400,000 $2,209,200,000Wendy's $41,214,000 $272,325,000 $320,959,000 $166,998,000 $81,875,000 $85,353,000Steak N Shake N/A N/A N/A N/A $7,458,000 $14,485,000Burger King N/A N/A N/A $5,000,000 $17,000,000 $995,000,000Jack In The Box N/A $1,988,000 $90,218,000 $90,218,000 $92,187,000 $92,187,000 Source: Respective 10-k’s 2001-2006
34
Goodwill as a percentage of Total Assets- before restatement 2001 2002 2003 2004 2005 2006 Sonic 10.1% 10.6% 14.6% 15.9% 14.5% 14.2% McDonalds 5.9% 5.5% 5.1% 4.7% 4.4% 4.5% Wendy's 2.0% 1.5% 1.3% 1.3% 1.2% 2.0% Steak N Shake N/A N/A N/A N/A 1.6% 1.4% Burger King N/A N/A N/A 0.2% 0.2% 0.2% Jack In The Box N/A 0.2% 0.2% 0.2% 0.1% 0.1%
Goodwill as a percentage of Total Assets- after restatement 2001 2002 2003 2004 2005 2006 Sonic 10.9% 9.6% 8.0% 7.5% 6.9% 6.1% McDonalds 5.9% 5.5% 5.1% 4.7% 4.4% 4.5% Wendy's 2.0% 1.5% 1.3% 1.3% 1.2% 2.0% Steak N Shake N/A N/A N/A N/A 1.6% 1.4% Burger King N/A N/A N/A 0.2% 0.2% 0.2% Jack In The Box N/A 0.2% 0.2% 0.2% 0.1% 0.1%
Operating vs. Capital Leases is another topic addressed in the GAAP.
Under SFAS 13, a lease transaction should be recorded as a capital lease if any
of the following conditions are met: (1) ownership of the asset is transferred to
the lessee at the end of the lease, (2) the lessee can purchase the asset at the
end of the lease, (3) the lease is 75 percent of the asset’s expected life, (4) the
present value of the lease payments are 90 percent or more of the fair value of
the asset (Palepu & Healy P. 4-15, 4-16). The underlying idea regarding these
criteria is whether or not the lessee has accepted the majority of the risk
associated with the asset. Operating leases have been the classification of choice
for the quick service industry for a couple of reasons. Although it has an overall
negligible effect, one minor reason is because operating leases are accounted for
using rent expense, which is tax deductible (www.forwardcapitalgroup.com).
35
Also, capitalizing a lease increases the amount of interest expense in current
years, which results in lower earnings in current years (Kieso, Weygandt, and
Garfield P. 1100). However, these effects, as shown in subsequent sections, are
negligible. The most significant reason a firm would choose to have an operating
lease is because it would be “off the balance sheet”. There will not be a large
asset or liability on the balance sheet reflecting a lease contract. Thus, the firm
will appear more attractive to lenders because it appears as though they have a
lower amount of future obligations.
36
Actual Accounting Strategy
Managers can exploit accounting flexibility when preparing their financial
statements. Managers can either utilize aggressive, conservative, or a
combination of the two accounting strategies when reporting the firm’s economic
situation. However, this discretion provides the ability to conceal a firm’s true
performance and yet still meet GAAP requirements. GAAP standards allow firms
the luxury of disclosure. Higher levels of disclosure allow users to get a true and
fair picture of the firm. In contrast, lower levels of disclosure force users to make
assumptions and can be at times misleading. Sonic displays a moderately
aggressive strategy in their financial reports.
Within Sonics’ financial statements there is a high level of disclosure.
However, Sonic fails to report their operating leases on their balance sheet, but
they do provide sufficient disclosure to make the adjustment. Instead Sonic
includes their operating leases within their operating expenses on their income
statement in order to keep the lease “off the balance sheet”. Reclassifying these
operating leases to capital leases would increase Sonics debt on the balance
sheet and also make them less attractive to future investors, as shown in the
subsequent sections.
Sonic demonstrates their aggressive or “liberal” strategy when
communicating the firm’s goodwill and other intangible assets. The majority of
Sonics intangible assets is not subject to amortization and is only tested for
impairment annually. The impairment process provides the managers of Sonic
with strong incentives to take an aggressive approach because goodwill consists
of over 15% of their total assets. The amount of goodwill that will be impaired
for a given year depends on managements expectations of net income for that
particular year. Sonic has no detailed structure for impairing goodwill, and only
impairs a small amount each year. Furthermore, when restating Sonics goodwill
was impaired the goodwill over a five year period. For instance, when taking a
“liberal” approach if Sonic has a better year than expected, managers will want
37
to impair more goodwill in order to reduce taxes. However, in the circumstance
that Sonic has a below average year the managers would likely avoid impairing
goodwill in order to represent a higher net income that year. This “liberal”
strategy of impairing goodwill is consistent throughout the quick-service industry,
except for Wendy’s. Wendy’s takes a much more conservative approach to
impairing goodwill. Goodwill is reported to the tune of $320,959,000 in Wendys
10k as of 2003, and $166,998,000 as of 2004. Consequently this significant
reduction has a major effect on Wendy’s net income in year 2004. Wendys net
income as of 2003 was $235,999,000 and 2004’s net income was a staggering
$52,035,000 (Wendy’s 03’ and 04’ 10Ks). The $153,961,000 reduction to
goodwill makes up over 80% of the reduction to net income. This fluctuation in
net income illustrates why Sonic chooses a more “liberal” approach to impairing
goodwill.
Qualitative Analysis of Disclosure
All companies have to disclose their financial information in a report called
a 10-K. This report gives investors information on a companies well being.
Moreover the qualitative analysis section divulges the overall satisfaction of
information for the company being evaluated.
Sonic’s overall transparency is fair. There are some areas of concern in
Sonic’s 10-k specifically goodwill. It seems that there has been major increases
over the past couple years of Sonic’s goodwill, boosting its overall intangible
assets. Goodwill can not be measured accurately. Sonic has shown no interest in
impairing its goodwill or depreciating it. Also, Sonic provides very little
information about their operating leases. “An operating lease is not capitalized; it
is accounted for as a rental expense” (investopedia.com). This increases both
their assets and liabilities making it hard to evaluate. Another area of concern is
38
the fact that sonic is selling and buying back its capital leases. This is caused by
the underperforming of its franchisees and Sonic, under contract, has the ability
to buy back the franchised businesses. In the process some value is lost and
Sonic incorporates this as goodwill. Furthermore, Sonic, like other competitors,
does not provide supplementary data and financial statements. Meaning that it
believes the information it provides is sufficient.
Sonic also discloses good information. Some of the good items Sonic
discloses compared to other competitors are franchise operations and sales. It
gives specific information on the average sales for franchises and company
owned drive-ins. There is also good information on how Sonic is trying to expand
and where. Last of all Sonic has been including more information in its 2005 and
2006 10-k’s than in previous years.
Quantitative Analysis
Here we examine the accounting ratios of core sales manipulation and
core expense manipulation in relation to the quick service industry. In doing
quantitative analysis for an industry, the given numbers of the different financial
statements are compared and examined for inconsistencies. Any noted
inconsistency should be investigated for motives. Such motives are the result of
distortions in sales and expense accounting methods used to hide information
from investors.
In the quantitative analysis of the QSI we compare the financial
disclosures of Sonic and its competitors. The graphs were created from the
information given in the I-Metrix program from Edgar Online, which is composed
of our competitor’s 10-k’s.
39
Core Sales Manipulation Diagnostics
Core sales diagnostics or revenue diagnostics is a set of tools we have
used in this section to expose any possible discrepancies with the company’s
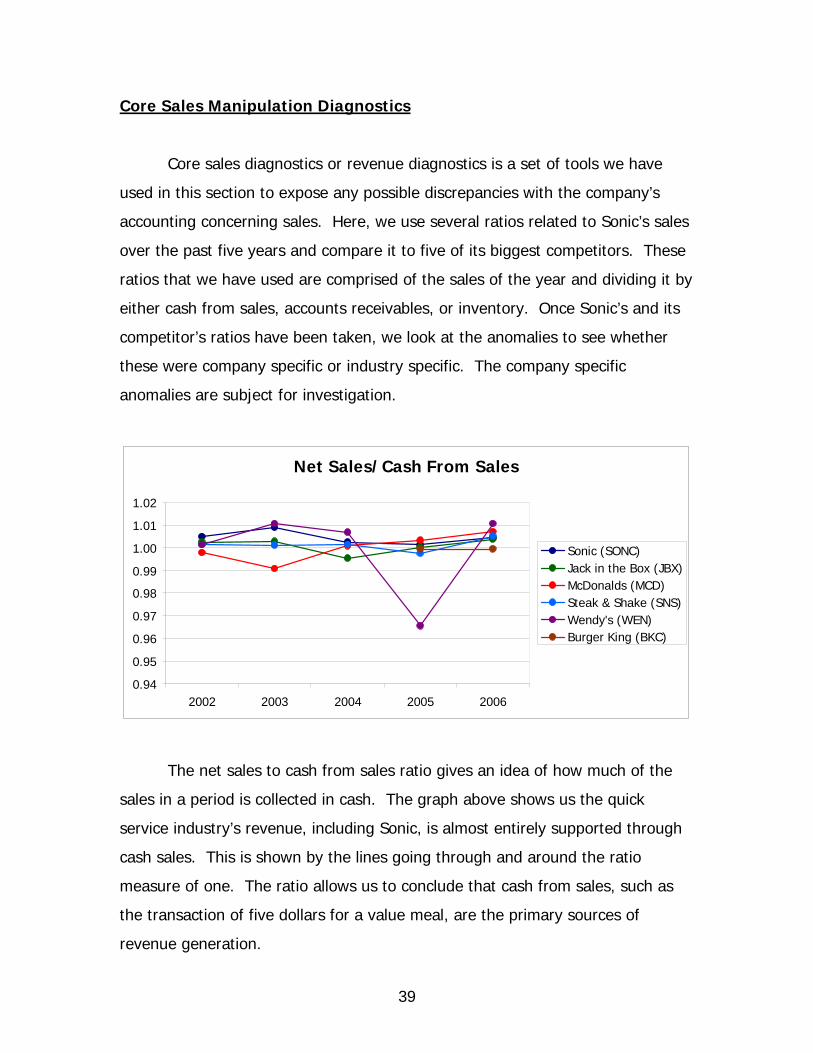
accounting concerning sales. Here, we use several ratios related to Sonic’s sales
over the past five years and compare it to five of its biggest competitors. These
ratios that we have used are comprised of the sales of the year and dividing it by
either cash from sales, accounts receivables, or inventory. Once Sonic’s and its
competitor’s ratios have been taken, we look at the anomalies to see whether
these were company specific or industry specific. The company specific
anomalies are subject for investigation.
Net Sales/Cash From Sales
0.94
0.95
0.96
0.97
0.98
0.99
1.00
1.01
1.02
2002 2003 2004 2005 2006
Sonic (SONC)Jack in the Box (JBX)McDonalds (MCD)Steak & Shake (SNS)Wendy's (WEN)Burger King (BKC)
The net sales to cash from sales ratio gives an idea of how much of the
sales in a period is collected in cash. The graph above shows us the quick
service industry’s revenue, including Sonic, is almost entirely supported through
cash sales. This is shown by the lines going through and around the ratio
measure of one. The ratio allows us to conclude that cash from sales, such as
the transaction of five dollars for a value meal, are the primary sources of
revenue generation.
40
Wendy’s seems to stand out a little in 2005 because of a drop that looks
big on the graph. However, it is just a one time dip and it should not matter
since we are looking for trends. This could be the result of its decrease in sales,
a climb in receivables, or a huge increase in net income.
Net Sales/Accounts Receivable
0.00
50.00
100.00
150.00
200.00
250.00
2002 2003 2004 2005 2006
Sonic (SONC)Jack in the Box (JBX)McDonalds (MCD)Steak & Shake (SNS)Wendy's (WEN)Burger King (BKC)
Days Sales Outstanding
0.00
5.00
10.00
15.00
20.00
25.00
2002 2003 2004 2005 2006
Sonic (SONC)Jack in the Box (JBX)McDonalds (MCD)Steak & Shake (SNS)Wendy's (WEN)Burger King (BKC)
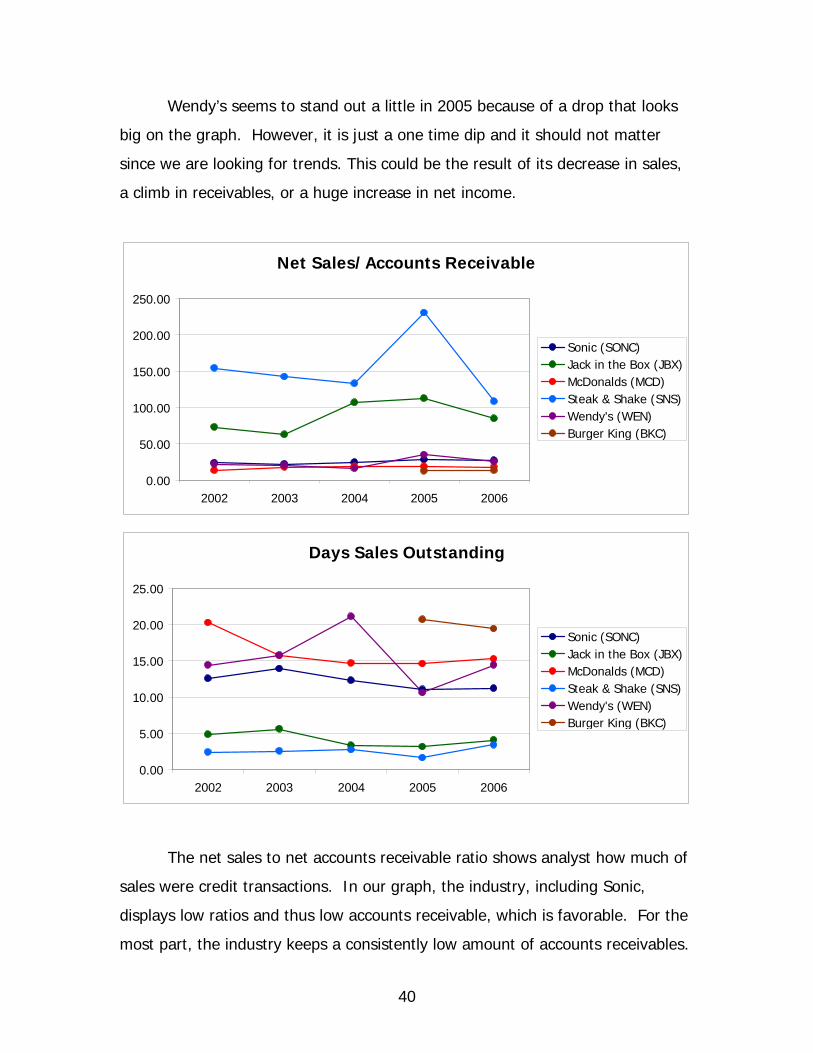
The net sales to net accounts receivable ratio shows analyst how much of
sales were credit transactions. In our graph, the industry, including Sonic,
displays low ratios and thus low accounts receivable, which is favorable. For the
most part, the industry keeps a consistently low amount of accounts receivables.
41
The majority of receivables come from franchising fees. These franchise
fees, deposits from franchises, or annual licensing fees are the costs of the
franchisee for obtaining the companies’ resources like suppliers, advertising,
trademarks, and insurance (investopedia.com). These fees are collected by the
corporation on regular periods and are recorded as credited sales.
Steak and Shake displays a spike in 2005 due to a huge drop in
receivables. The drop in receivables came from the reduction in the amount of
franchise fees collected. This is due to Steak & Shake purchasing the ownership
of a large amount of franchises. The following year Steak and Shake did return
to its trend of reducing credit sales.
Net Sales/Inventory
0.00
20.00
40.00
60.00
80.00
100.00
120.00
140.00
160.00
2002 2003 2004 2005 2006
Sonic (SONC)Jack in the Box (JBX)McDonalds (MCD)Steak & Shake (SNS)Wendy's (WEN)Burger King (BKC) N/A
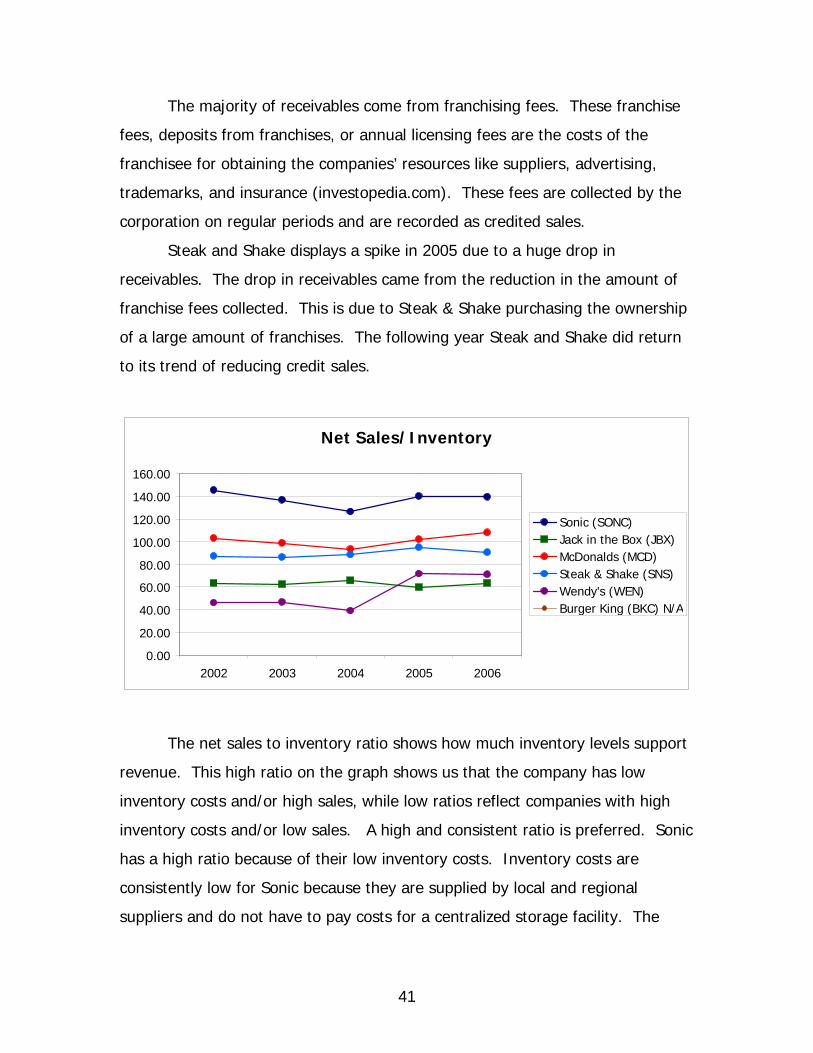
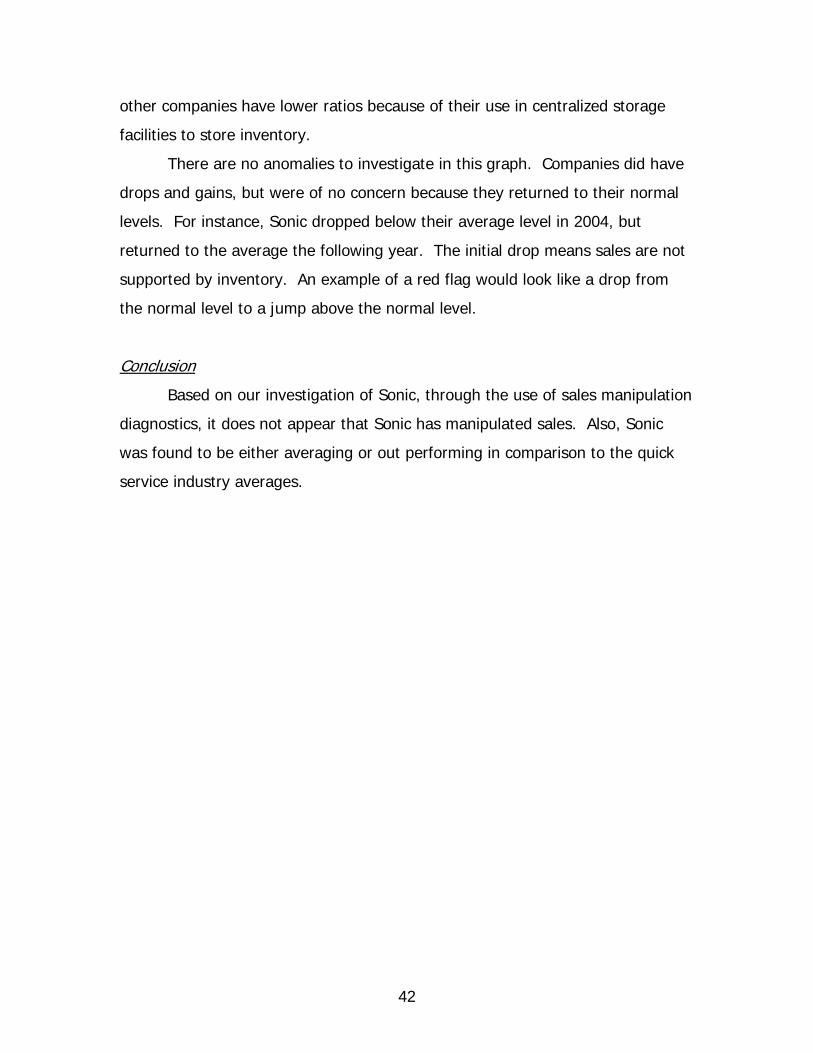
The net sales to inventory ratio shows how much inventory levels support
revenue. This high ratio on the graph shows us that the company has low
inventory costs and/or high sales, while low ratios reflect companies with high
inventory costs and/or low sales. A high and consistent ratio is preferred. Sonic
has a high ratio because of their low inventory costs. Inventory costs are
consistently low for Sonic because they are supplied by local and regional
suppliers and do not have to pay costs for a centralized storage facility. The
42
other companies have lower ratios because of their use in centralized storage
facilities to store inventory.
There are no anomalies to investigate in this graph. Companies did have
drops and gains, but were of no concern because they returned to their normal
levels. For instance, Sonic dropped below their average level in 2004, but
returned to the average the following year. The initial drop means sales are not
supported by inventory. An example of a red flag would look like a drop from
the normal level to a jump above the normal level.
Conclusion
Based on our investigation of Sonic, through the use of sales manipulation
diagnostics, it does not appear that Sonic has manipulated sales. Also, Sonic
was found to be either averaging or out performing in comparison to the quick
service industry averages.
43
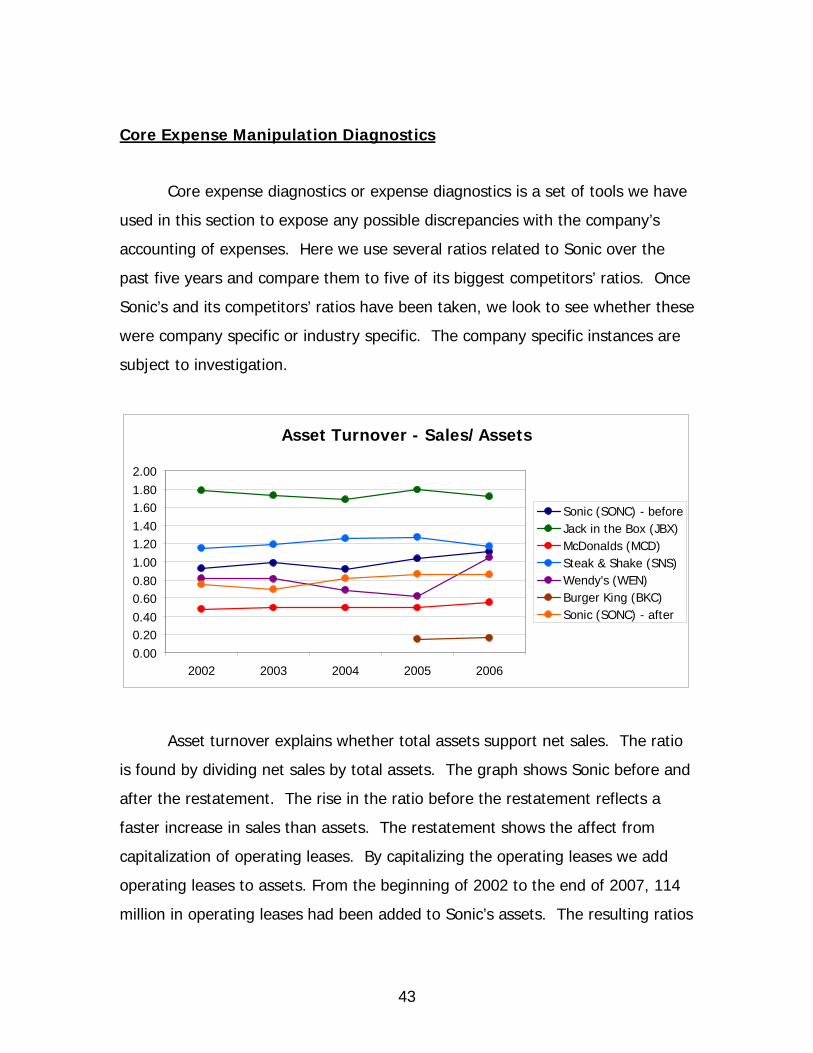
Core Expense Manipulation Diagnostics
Core expense diagnostics or expense diagnostics is a set of tools we have
used in this section to expose any possible discrepancies with the company’s
accounting of expenses. Here we use several ratios related to Sonic over the
past five years and compare them to five of its biggest competitors’ ratios. Once
Sonic’s and its competitors’ ratios have been taken, we look to see whether these
were company specific or industry specific. The company specific instances are
subject to investigation.
Asset Turnover - Sales/Assets
0.000.200.400.600.801.001.201.401.601.802.00
2002 2003 2004 2005 2006
Sonic (SONC) - beforeJack in the Box (JBX)McDonalds (MCD)Steak & Shake (SNS)Wendy's (WEN)Burger King (BKC)Sonic (SONC) - after
Asset turnover explains whether total assets support net sales. The ratio
is found by dividing net sales by total assets. The graph shows Sonic before and
after the restatement. The rise in the ratio before the restatement reflects a
faster increase in sales than assets. The restatement shows the affect from
capitalization of operating leases. By capitalizing the operating leases we add
operating leases to assets. From the beginning of 2002 to the end of 2007, 114
million in operating leases had been added to Sonic’s assets. The resulting ratios
44
from the restatement are stable and there seems to be no expense manipulation
with assets.
Change in CFFO/Change in OI
-10.00
-8.00
-6.00
-4.00
-2.00
0.00
2.00
4.00
6.00
2002 2003 2004 2005 2006
Sonic (SONC) - before
Jack in the Box (JBX)
McDonalds (MCD)
Steak & Shake (SNS)
Wendy's (WEN)
Burger King (BKC) - distortsaccuracySonic (SONC) - after
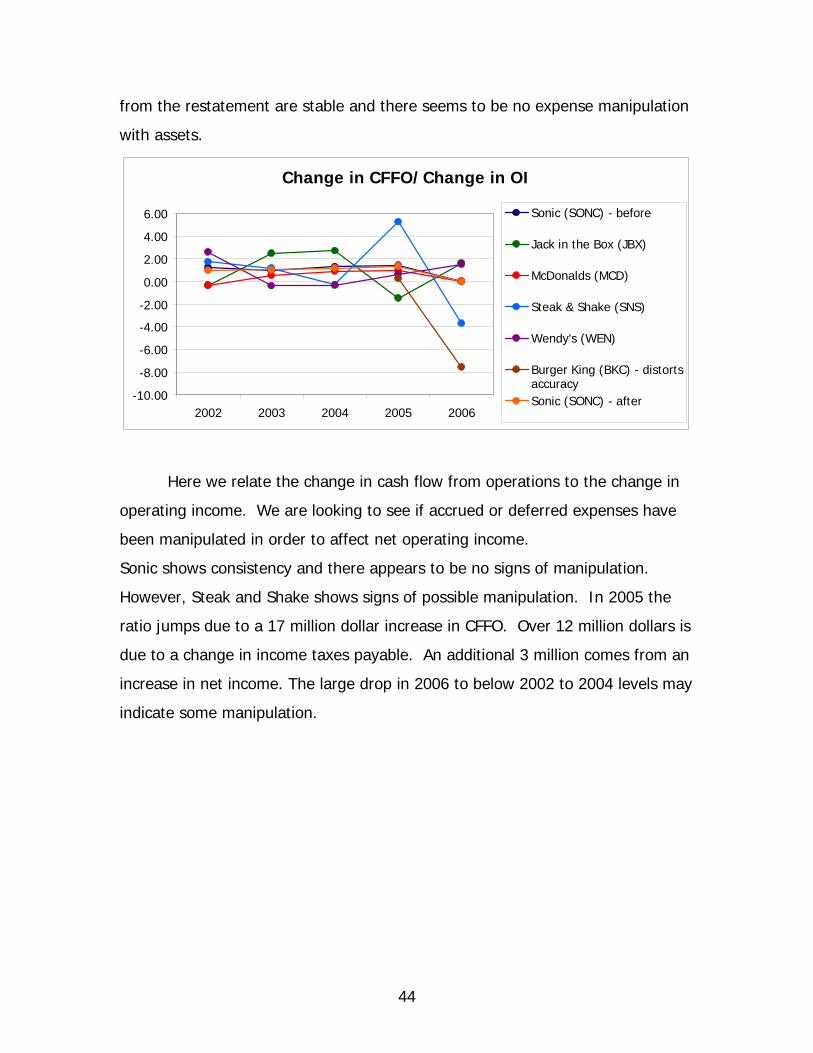
Here we relate the change in cash flow from operations to the change in
operating income. We are looking to see if accrued or deferred expenses have
been manipulated in order to affect net operating income.
Sonic shows consistency and there appears to be no signs of manipulation.
However, Steak and Shake shows signs of possible manipulation. In 2005 the
ratio jumps due to a 17 million dollar increase in CFFO. Over 12 million dollars is
due to a change in income taxes payable. An additional 3 million comes from an
increase in net income. The large drop in 2006 to below 2002 to 2004 levels may
indicate some manipulation.
45
Change in CFFO/Change in NOA
-1.50
-1.00
-0.50
0.00
0.50
1.00
1.50
2.00
2.50
3.00
2002 2003 2004 2005 20060.00
2.00
4.00
6.00
8.00
10.00
12.00 Sonic (SONC) - before
Jack in the Box (JBX)
McDonalds (MCD)
Steak & Shake (SNS)
Wendy's (WEN)
Sonic (SONC) - after
Burger King (BKC)secondary axis
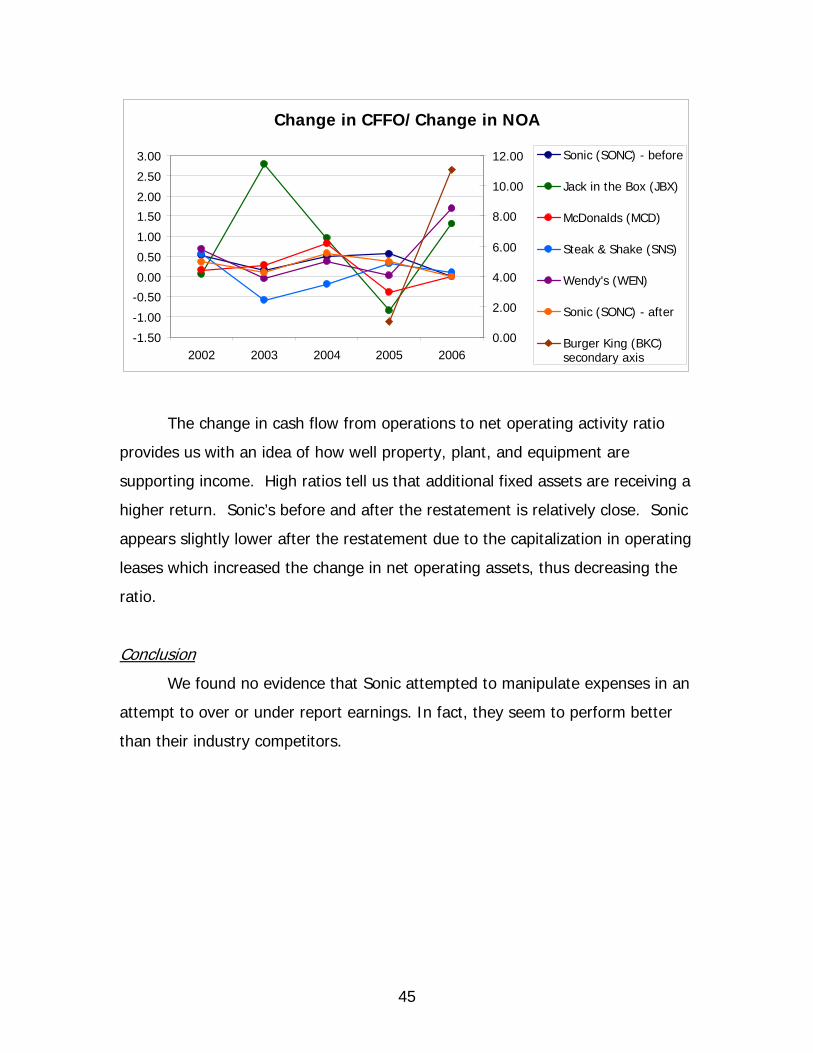
The change in cash flow from operations to net operating activity ratio
provides us with an idea of how well property, plant, and equipment are
supporting income. High ratios tell us that additional fixed assets are receiving a
higher return. Sonic’s before and after the restatement is relatively close. Sonic
appears slightly lower after the restatement due to the capitalization in operating
leases which increased the change in net operating assets, thus decreasing the
ratio.
Conclusion
We found no evidence that Sonic attempted to manipulate expenses in an
attempt to over or under report earnings. In fact, they seem to perform better
than their industry competitors.
46
Potential “Red Flags”
Analysis of the diagnostic ratios and researching the 10-K’s of companies
should reveal if there has been any manipulation of information that create
distortions to the reader. This manipulation would be considered a “red flag” to
any investor or analyst reviewing a particular company. While we did not
discover anything that would indicate manipulation with intent to deceive, there
are several items that we uncovered in Sonics’ 10-K’s that need to be discussed.
Sonic also has Goodwill exceeding $96 million on the balance sheet that
comes from the acquisition of stores owned by franchisees. This Goodwill has
been growing steadily over the last five years with little impairment being taken.
Most of these were purchased in order to take back markets from financially
weak franchisees or franchisees wanting to get out of business. These
acquisitions are consistent with Sonics’ growth strategy, however, they leave an
asset on the books that really has lost it’s economic benefit or value. Therefore,
we believe this Goodwill should have been impaired over the previous five years.
Sonic has some capital leases which equate to approximately $36 million
at present value, according to information disclosed in their 2006 10-K. These
capital leases are carried on their balance sheet, as they should be. However,
Sonic has over $168 million in operating lease payments listed in the 10-K that
are not on the balance sheet. These are future obligations that are non-
cancellable and should be shown as both an asset and a liability in order to truly
reflect Sonics’ financial position.
47
Undo Accounting Distortions
Goodwill is the excess amount above identifiable assets and liabilities paid
in the acquisition of another company. Sonic has been accumulating Goodwill for
a number of years with little impairment being taken. We believe this distorts the
true value of the company and should be undone. We began to undo this
distortion in 2001 by taking the ending balance in 2001 and writing the
impairment off over 5 years. Each subsequent year we took the increase in
Goodwill and wrote it off over the next 5 years. This leaves Sonic with a balance
of Goodwill in 2006 of $17,506 to be charge in 2007-2010. This is a considerable
difference from the $96,949 shown on the balance sheet in the 2006 10-K. Table
2-4 reflects the impairment of Goodwill over the previous years, beginning in
2001.
In order to compute the present value of the $168,707,000 in outstanding
lease payments we had to find the current discount rate that would be applicable
to Sonic. Fortunately, Sonic was able to help with the information disclosed in
the 10-K by providing us information on interest paid on capital leases, future
value of all payments, and the present value of all payments. From that data we
were able to get an implied interest rate for each of the years 2001-2006. Using
that interest rate, and information provided on future operating lease payments,
we were able to discount operating leases back to present value. Tables 2-5
through 2-10 provide our calculations.
Once the calculations were available, balance sheets and income
statements were recalculated to reflect the changes. Table 2-11 reflects the
changes to the income statement for each period reflecting both the impairment
of Goodwill and the capitalization of operating leases. Not only do these changes
affect the current period, it is worthy to note the cumulative effect to Net Income
which flows into Retained Earnings. Table 2-12 reflects the changes in the
48
Balance Sheet. As mentioned, you can see the cumulative effect to Retained
Earnings.
Another item worth noting is the effect on assets and liabilities. In the
earlier years the difference between Assets and Liabilities is small, but it
increases each year. This gives a true reflection to the reader about the impact
of impairing Goodwill and capitalizing operating leases. At first glance, one might
not notice the change in Liabilities and Stockholder’s Equity of $47 million.
However, this really reflects a decrease of over $54 million in Retained Earnings
and an increase in Non-Current Liabilities of over $101 million. This information
will be useful to the reader moving forward into the valuation of the company.
49
Financial Analysis, Forecast Financials, and Cost of
Capital Estimation
Financial Analysis
The value of a firm is measured by its profitability and its growth (business
analysis & valuation book). The value and growth of a firm can be seen through
company ratios. Ratios are used to help give a financial analyst an idea of how a
company compares to its competitors. Ratios can also used to help forecast financials.
These ratios are divided into three sections: liquidity ratios, profitability ratios, and
capital structure ratios. Firms that have the most accurate ratios and financial
understanding will have a better chance at forecasting future profitability and growth.
Liquidity Analysis
The results from the liquidity ratios offer insight into how capable a firm is at
meeting their short term obligations. The inventory turnover, receivables turnover, and
working capital turnover indicate the firm’s operating efficiency. The larger these ratios
are, the more efficient the company is. Other liquidity ratios include the quick ratio and
the current ratio. If these ratios are too low, it might suggest that the company does
not have enough liquid assets to meet their short term obligations. On the other hand,
if these ratios are too high, it might indicate that firm is failing to expand their business
because they are holding too much short term assets. All of these ratios are important
to lenders that analyze the risk associated with lending money to a firm. A general rule
is that higher liquidity ratios are better. However, not every rule associated with
liquidity is universal because the results have to be analyzed in the context of the
industry. Also, the ratio averages within the text have been computed using the 2003-
2006 data because it is a closer reflection of the businesses today and because they are
free of distortions from September 11th, 2001.
50
Current Ratio
Current Ratio
0.00
0.20
0.40
0.60
0.80
1.00
1.20
1.40
1.60
1.80
2002 2003 2004 2005 2006
Sonic (SONC)Jack in the Box (JBX)McDonalds (MCD)Steak & Shake (SNS)Wendy's (WEN)Burger King (BKC)
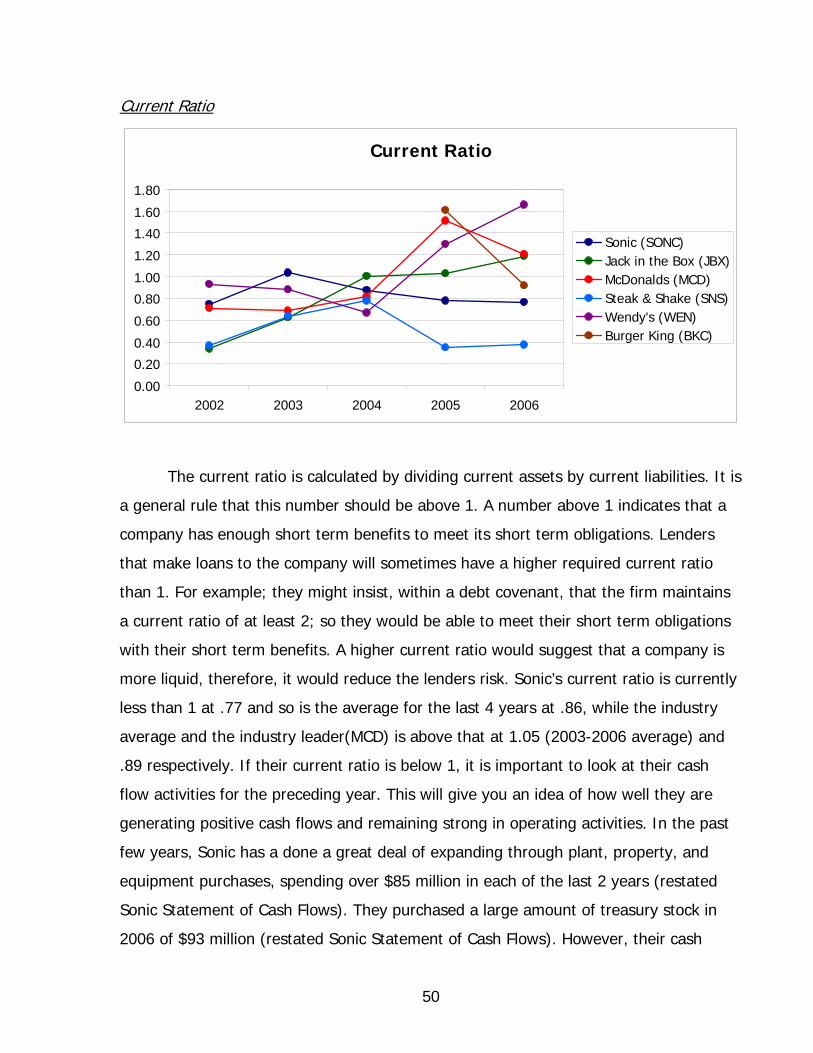
The current ratio is calculated by dividing current assets by current liabilities. It is
a general rule that this number should be above 1. A number above 1 indicates that a
company has enough short term benefits to meet its short term obligations. Lenders
that make loans to the company will sometimes have a higher required current ratio
than 1. For example; they might insist, within a debt covenant, that the firm maintains
a current ratio of at least 2; so they would be able to meet their short term obligations
with their short term benefits. A higher current ratio would suggest that a company is
more liquid, therefore, it would reduce the lenders risk. Sonic’s current ratio is currently
less than 1 at .77 and so is the average for the last 4 years at .86, while the industry
average and the industry leader(MCD) is above that at 1.05 (2003-2006 average) and
.89 respectively. If their current ratio is below 1, it is important to look at their cash
flow activities for the preceding year. This will give you an idea of how well they are
generating positive cash flows and remaining strong in operating activities. In the past
few years, Sonic has a done a great deal of expanding through plant, property, and
equipment purchases, spending over $85 million in each of the last 2 years (restated
Sonic Statement of Cash Flows). They purchased a large amount of treasury stock in
2006 of $93 million (restated Sonic Statement of Cash Flows). However, their cash
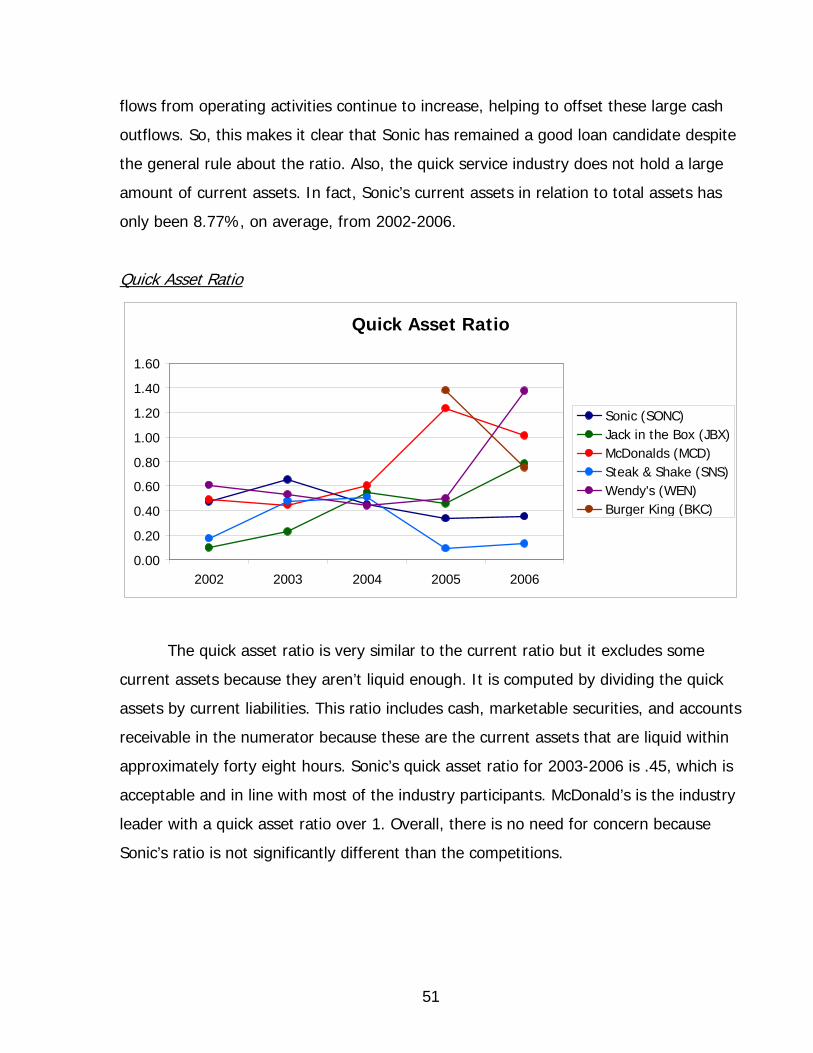
51
flows from operating activities continue to increase, helping to offset these large cash
outflows. So, this makes it clear that Sonic has remained a good loan candidate despite
the general rule about the ratio. Also, the quick service industry does not hold a large
amount of current assets. In fact, Sonic’s current assets in relation to total assets has
only been 8.77%, on average, from 2002-2006.
Quick Asset Ratio
Quick Asset Ratio
0.00
0.20
0.40
0.60
0.80
1.00
1.20
1.40
1.60
2002 2003 2004 2005 2006
Sonic (SONC)Jack in the Box (JBX)McDonalds (MCD)Steak & Shake (SNS)Wendy's (WEN)Burger King (BKC)
The quick asset ratio is very similar to the current ratio but it excludes some
current assets because they aren’t liquid enough. It is computed by dividing the quick
assets by current liabilities. This ratio includes cash, marketable securities, and accounts
receivable in the numerator because these are the current assets that are liquid within
approximately forty eight hours. Sonic’s quick asset ratio for 2003-2006 is .45, which is
acceptable and in line with most of the industry participants. McDonald’s is the industry
leader with a quick asset ratio over 1. Overall, there is no need for concern because
Sonic’s ratio is not significantly different than the competitions.
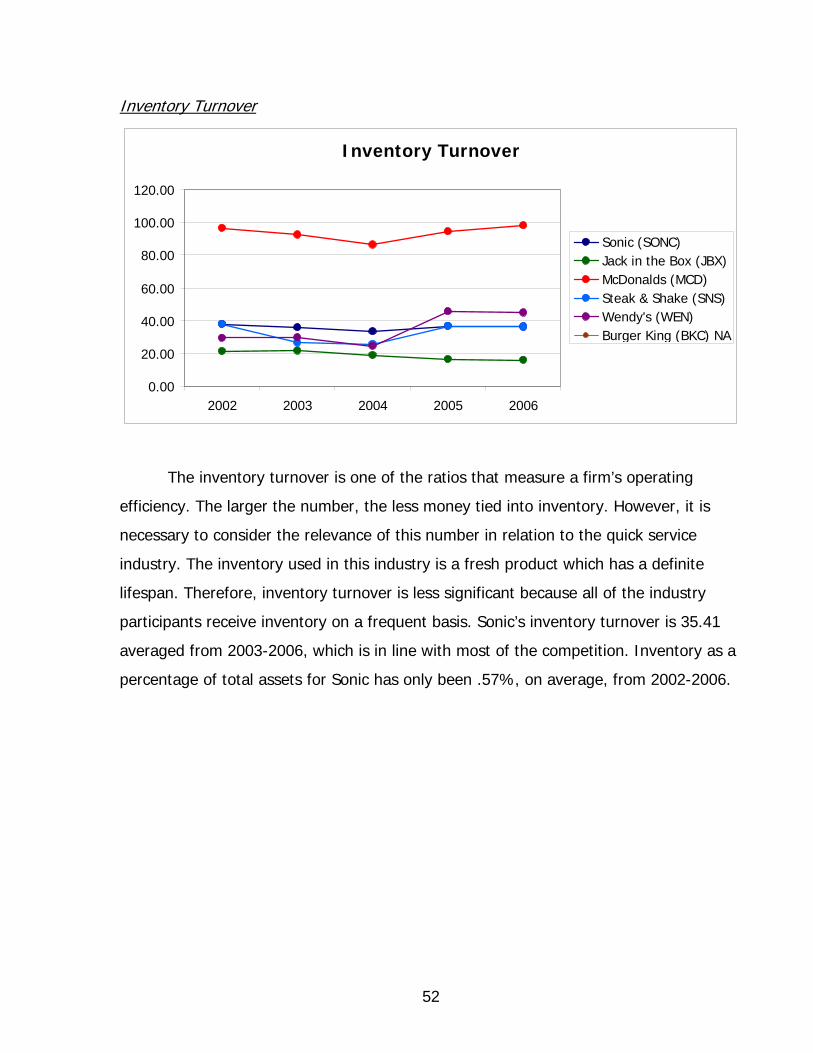
52
Inventory Turnover
Inventory Turnover
0.00
20.00
40.00
60.00
80.00
100.00
120.00
2002 2003 2004 2005 2006
Sonic (SONC)Jack in the Box (JBX)McDonalds (MCD)Steak & Shake (SNS)Wendy's (WEN)Burger King (BKC) NA
The inventory turnover is one of the ratios that measure a firm’s operating
efficiency. The larger the number, the less money tied into inventory. However, it is
necessary to consider the relevance of this number in relation to the quick service
industry. The inventory used in this industry is a fresh product which has a definite
lifespan. Therefore, inventory turnover is less significant because all of the industry
participants receive inventory on a frequent basis. Sonic’s inventory turnover is 35.41
averaged from 2003-2006, which is in line with most of the competition. Inventory as a
percentage of total assets for Sonic has only been .57%, on average, from 2002-2006.
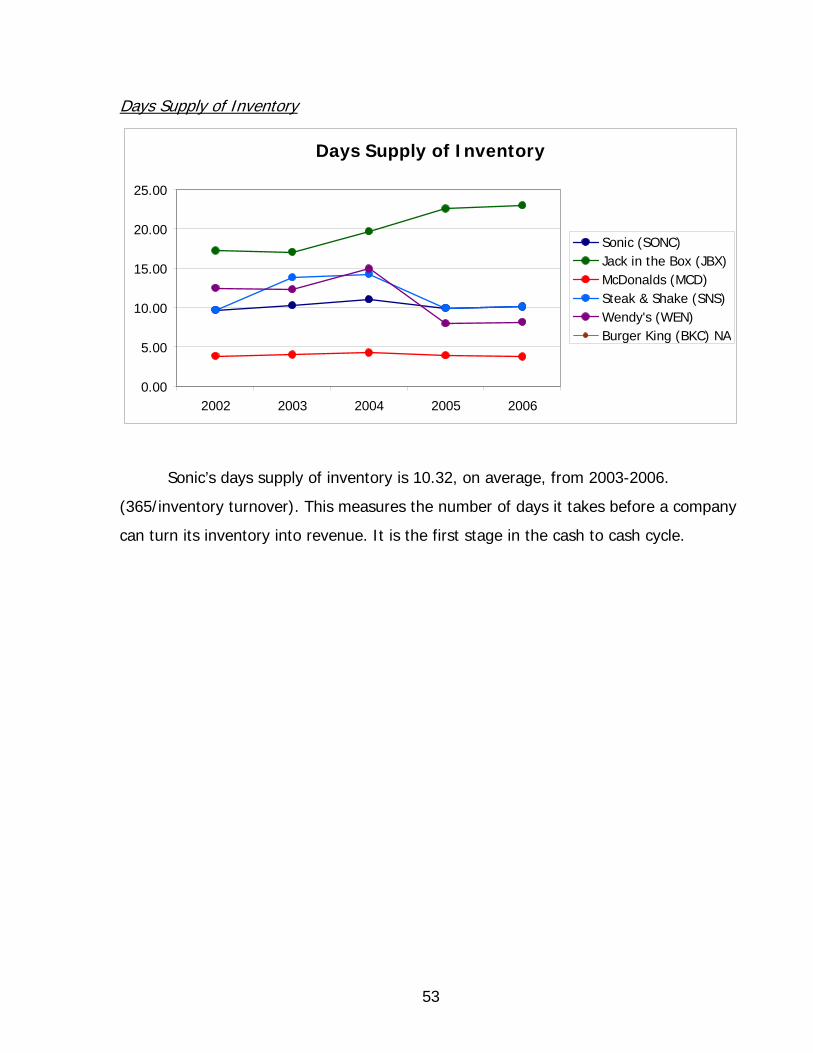
53
Days Supply of Inventory
Days Supply of Inventory
0.00
5.00
10.00
15.00
20.00
25.00
2002 2003 2004 2005 2006
Sonic (SONC)Jack in the Box (JBX)McDonalds (MCD)Steak & Shake (SNS)Wendy's (WEN)Burger King (BKC) NA
Sonic’s days supply of inventory is 10.32, on average, from 2003-2006.
(365/inventory turnover). This measures the number of days it takes before a company
can turn its inventory into revenue. It is the first stage in the cash to cash cycle.
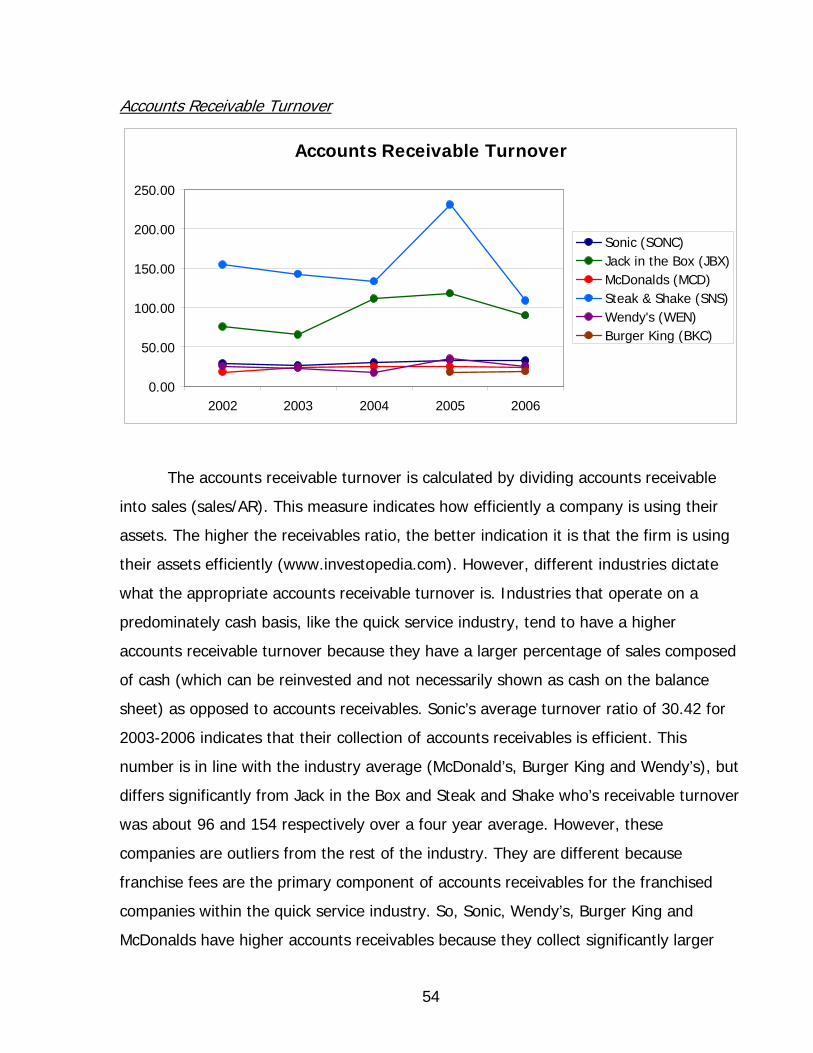
54
Accounts Receivable Turnover
Accounts Receivable Turnover
0.00
50.00
100.00
150.00
200.00
250.00
2002 2003 2004 2005 2006
Sonic (SONC)Jack in the Box (JBX)McDonalds (MCD)Steak & Shake (SNS)Wendy's (WEN)Burger King (BKC)
The accounts receivable turnover is calculated by dividing accounts receivable
into sales (sales/AR). This measure indicates how efficiently a company is using their
assets. The higher the receivables ratio, the better indication it is that the firm is using
their assets efficiently (www.investopedia.com). However, different industries dictate
what the appropriate accounts receivable turnover is. Industries that operate on a
predominately cash basis, like the quick service industry, tend to have a higher
accounts receivable turnover because they have a larger percentage of sales composed
of cash (which can be reinvested and not necessarily shown as cash on the balance
sheet) as opposed to accounts receivables. Sonic’s average turnover ratio of 30.42 for
2003-2006 indicates that their collection of accounts receivables is efficient. This
number is in line with the industry average (McDonald’s, Burger King and Wendy’s), but
differs significantly from Jack in the Box and Steak and Shake who’s receivable turnover
was about 96 and 154 respectively over a four year average. However, these
companies are outliers from the rest of the industry. They are different because
franchise fees are the primary component of accounts receivables for the franchised
companies within the quick service industry. So, Sonic, Wendy’s, Burger King and
McDonalds have higher accounts receivables because they collect significantly larger
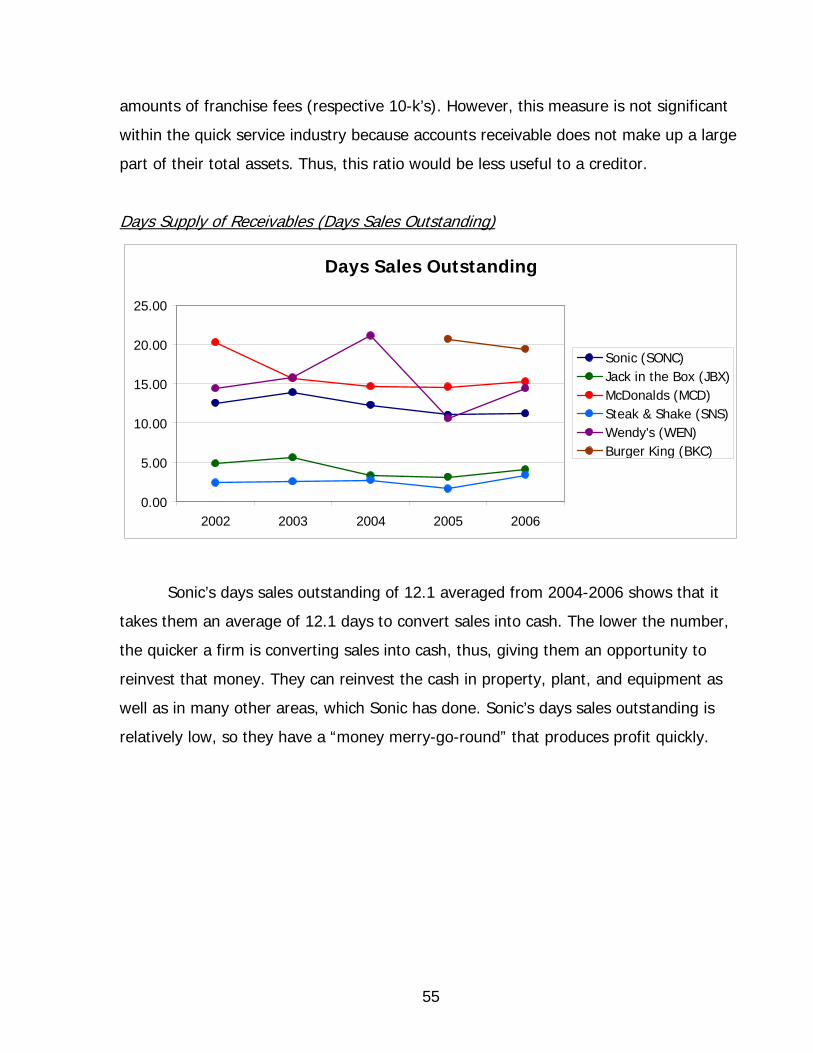
55
amounts of franchise fees (respective 10-k’s). However, this measure is not significant
within the quick service industry because accounts receivable does not make up a large
part of their total assets. Thus, this ratio would be less useful to a creditor.
Days Supply of Receivables (Days Sales Outstanding)
Days Sales Outstanding
0.00
5.00
10.00
15.00
20.00
25.00
2002 2003 2004 2005 2006
Sonic (SONC)Jack in the Box (JBX)McDonalds (MCD)Steak & Shake (SNS)Wendy's (WEN)Burger King (BKC)
Sonic’s days sales outstanding of 12.1 averaged from 2004-2006 shows that it
takes them an average of 12.1 days to convert sales into cash. The lower the number,
the quicker a firm is converting sales into cash, thus, giving them an opportunity to
reinvest that money. They can reinvest the cash in property, plant, and equipment as
well as in many other areas, which Sonic has done. Sonic’s days sales outstanding is
relatively low, so they have a “money merry-go-round” that produces profit quickly.
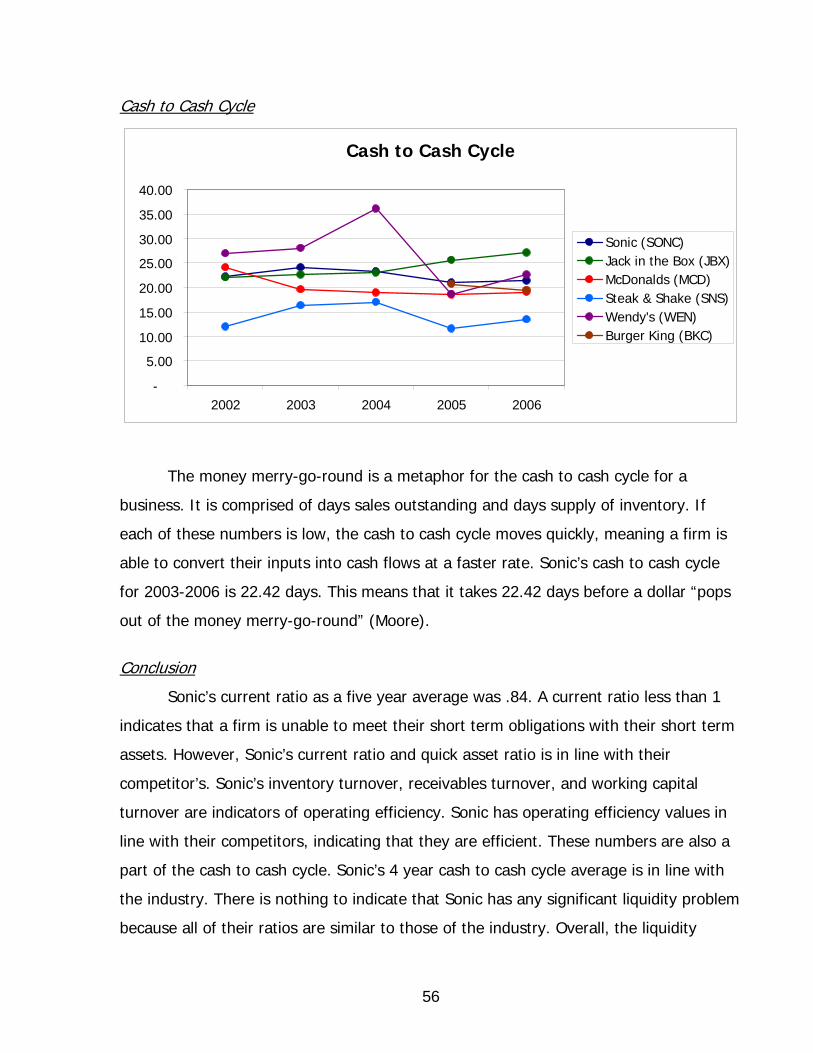
56
Cash to Cash Cycle
Cash to Cash Cycle
-
5.00
10.00
15.00
20.00
25.00
30.00
35.00
40.00
2002 2003 2004 2005 2006
Sonic (SONC)Jack in the Box (JBX)McDonalds (MCD)Steak & Shake (SNS)Wendy's (WEN)Burger King (BKC)
The money merry-go-round is a metaphor for the cash to cash cycle for a
business. It is comprised of days sales outstanding and days supply of inventory. If
each of these numbers is low, the cash to cash cycle moves quickly, meaning a firm is
able to convert their inputs into cash flows at a faster rate. Sonic’s cash to cash cycle
for 2003-2006 is 22.42 days. This means that it takes 22.42 days before a dollar “pops
out of the money merry-go-round” (Moore).
Conclusion
Sonic’s current ratio as a five year average was .84. A current ratio less than 1
indicates that a firm is unable to meet their short term obligations with their short term
assets. However, Sonic’s current ratio and quick asset ratio is in line with their
competitor’s. Sonic’s inventory turnover, receivables turnover, and working capital
turnover are indicators of operating efficiency. Sonic has operating efficiency values in
line with their competitors, indicating that they are efficient. These numbers are also a
part of the cash to cash cycle. Sonic’s 4 year cash to cash cycle average is in line with
the industry. There is nothing to indicate that Sonic has any significant liquidity problem
because all of their ratios are similar to those of the industry. Overall, the liquidity
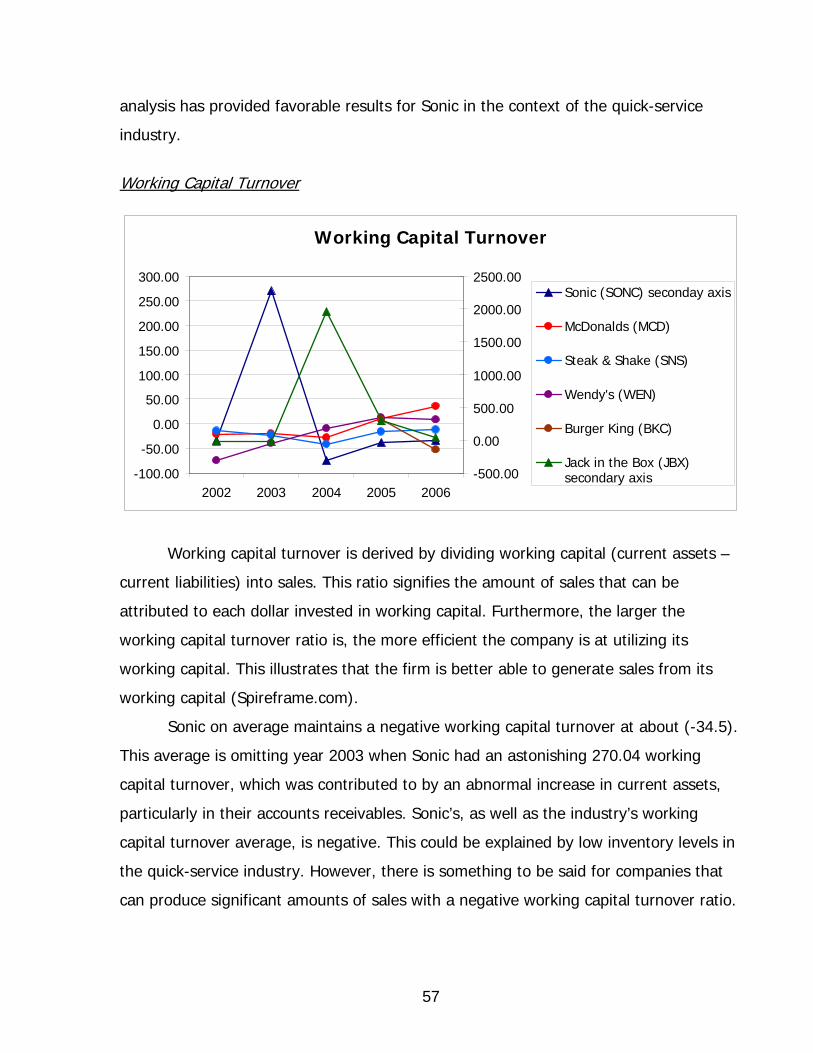
57
analysis has provided favorable results for Sonic in the context of the quick-service
industry.
Working Capital Turnover
Working Capital Turnover
-100.00
-50.00
0.00
50.00
100.00
150.00
200.00
250.00
300.00
2002 2003 2004 2005 2006-500.00
0.00
500.00
1000.00
1500.00
2000.00
2500.00Sonic (SONC) seconday axis
McDonalds (MCD)
Steak & Shake (SNS)
Wendy's (WEN)
Burger King (BKC)
Jack in the Box (JBX)secondary axis
Working capital turnover is derived by dividing working capital (current assets –
current liabilities) into sales. This ratio signifies the amount of sales that can be
attributed to each dollar invested in working capital. Furthermore, the larger the
working capital turnover ratio is, the more efficient the company is at utilizing its
working capital. This illustrates that the firm is better able to generate sales from its
working capital (Spireframe.com).
Sonic on average maintains a negative working capital turnover at about (-34.5).
This average is omitting year 2003 when Sonic had an astonishing 270.04 working
capital turnover, which was contributed to by an abnormal increase in current assets,
particularly in their accounts receivables. Sonic’s, as well as the industry’s working
capital turnover average, is negative. This could be explained by low inventory levels in
the quick-service industry. However, there is something to be said for companies that
can produce significant amounts of sales with a negative working capital turnover ratio.
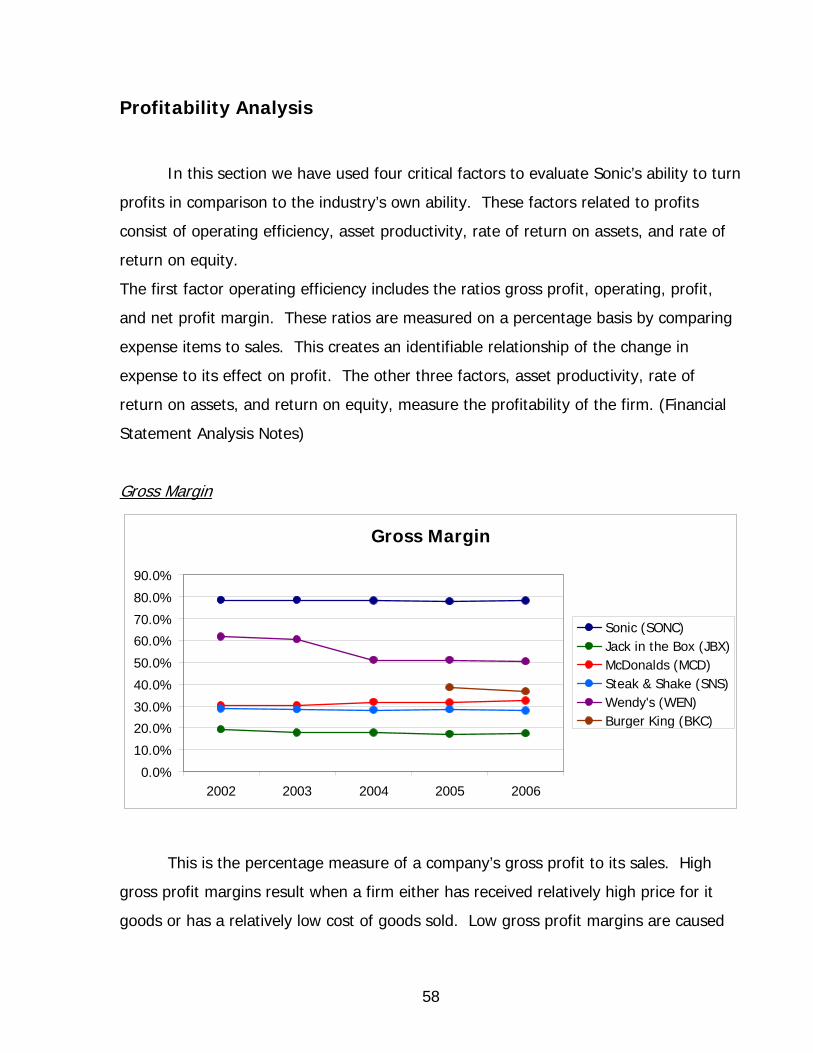
58
Profitability Analysis
In this section we have used four critical factors to evaluate Sonic’s ability to turn
profits in comparison to the industry’s own ability. These factors related to profits
consist of operating efficiency, asset productivity, rate of return on assets, and rate of
return on equity.
The first factor operating efficiency includes the ratios gross profit, operating, profit,
and net profit margin. These ratios are measured on a percentage basis by comparing
expense items to sales. This creates an identifiable relationship of the change in
expense to its effect on profit. The other three factors, asset productivity, rate of
return on assets, and return on equity, measure the profitability of the firm. (Financial
Statement Analysis Notes)
Gross Margin
Gross Margin
0.0%
10.0%
20.0%
30.0%
40.0%
50.0%
60.0%
70.0%
80.0%
90.0%
2002 2003 2004 2005 2006
Sonic (SONC)Jack in the Box (JBX)McDonalds (MCD)Steak & Shake (SNS)Wendy's (WEN)Burger King (BKC)
This is the percentage measure of a company’s gross profit to its sales. High
gross profit margins result when a firm either has received relatively high price for it
goods or has a relatively low cost of goods sold. Low gross profit margins are caused
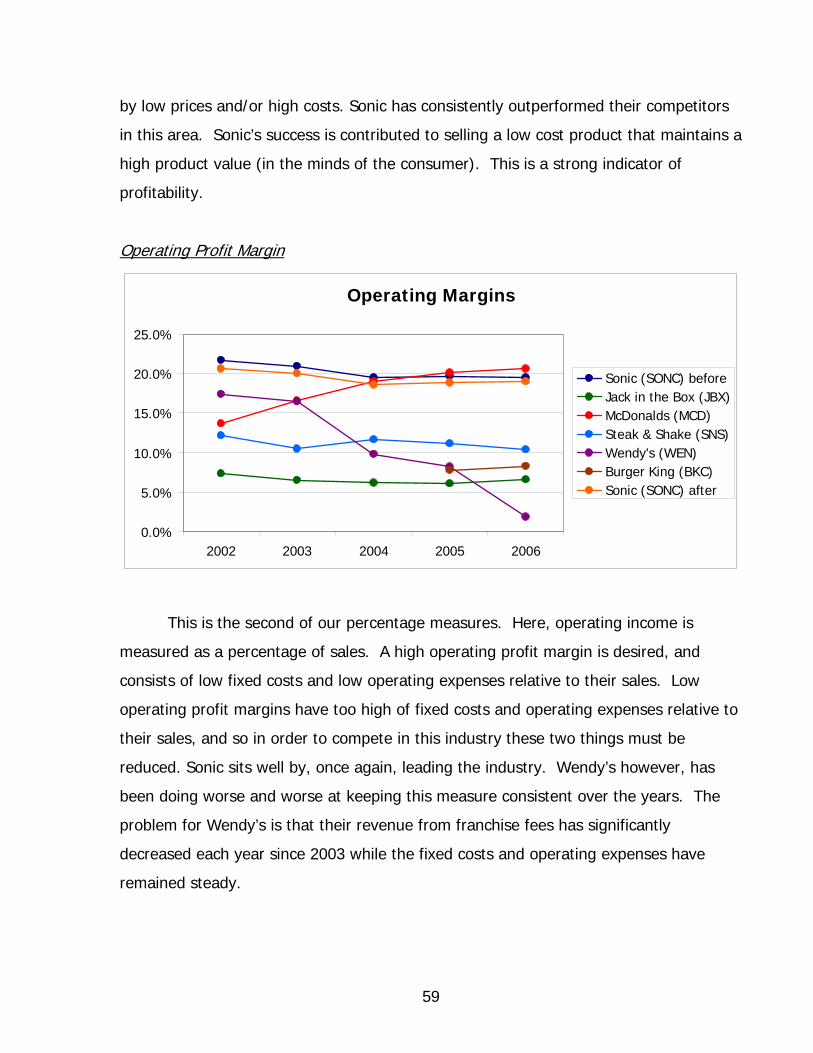
59
by low prices and/or high costs. Sonic has consistently outperformed their competitors
in this area. Sonic’s success is contributed to selling a low cost product that maintains a
high product value (in the minds of the consumer). This is a strong indicator of
profitability.
Operating Profit Margin
Operating Margins
0.0%
5.0%
10.0%
15.0%
20.0%
25.0%
2002 2003 2004 2005 2006
Sonic (SONC) beforeJack in the Box (JBX)McDonalds (MCD)Steak & Shake (SNS)Wendy's (WEN)Burger King (BKC)Sonic (SONC) after
This is the second of our percentage measures. Here, operating income is
measured as a percentage of sales. A high operating profit margin is desired, and
consists of low fixed costs and low operating expenses relative to their sales. Low
operating profit margins have too high of fixed costs and operating expenses relative to
their sales, and so in order to compete in this industry these two things must be
reduced. Sonic sits well by, once again, leading the industry. Wendy’s however, has
been doing worse and worse at keeping this measure consistent over the years. The
problem for Wendy’s is that their revenue from franchise fees has significantly
decreased each year since 2003 while the fixed costs and operating expenses have
remained steady.
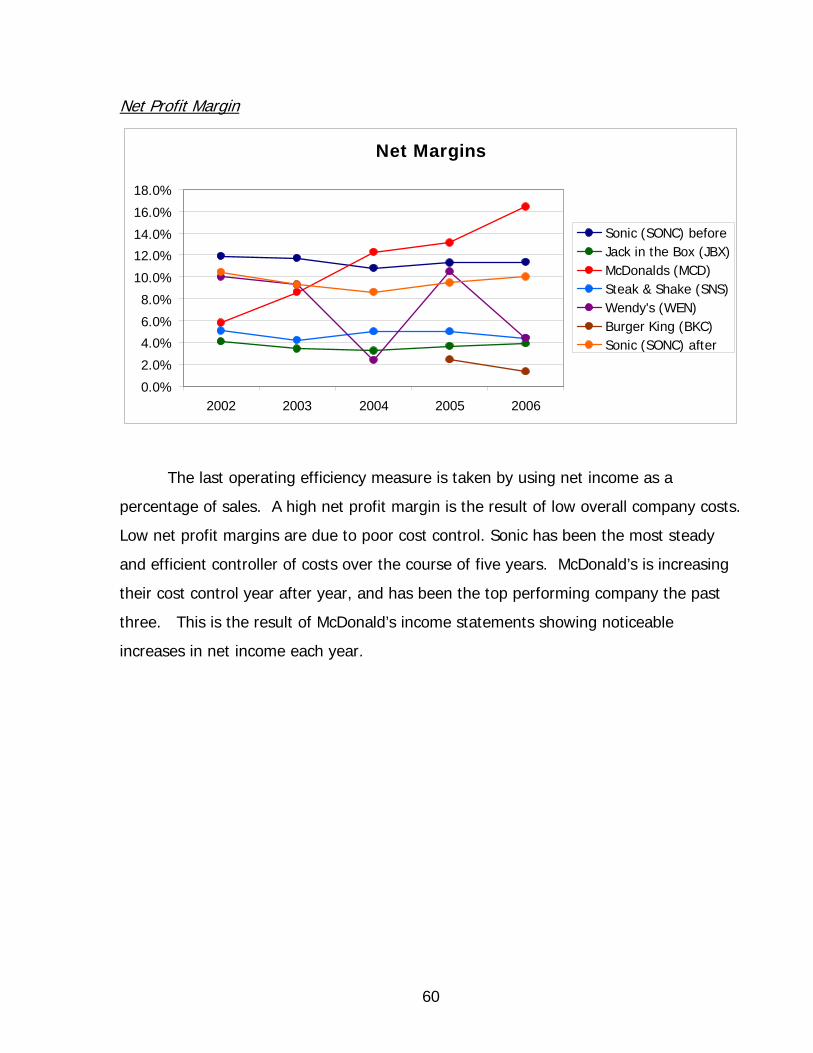
60
Net Profit Margin
Net Margins
0.0%
2.0%
4.0%
6.0%
8.0%
10.0%
12.0%
14.0%
16.0%
18.0%
2002 2003 2004 2005 2006
Sonic (SONC) beforeJack in the Box (JBX)McDonalds (MCD)Steak & Shake (SNS)Wendy's (WEN)Burger King (BKC)Sonic (SONC) after
The last operating efficiency measure is taken by using net income as a
percentage of sales. A high net profit margin is the result of low overall company costs.
Low net profit margins are due to poor cost control. Sonic has been the most steady
and efficient controller of costs over the course of five years. McDonald’s is increasing
their cost control year after year, and has been the top performing company the past
three. This is the result of McDonald’s income statements showing noticeable
increases in net income each year.
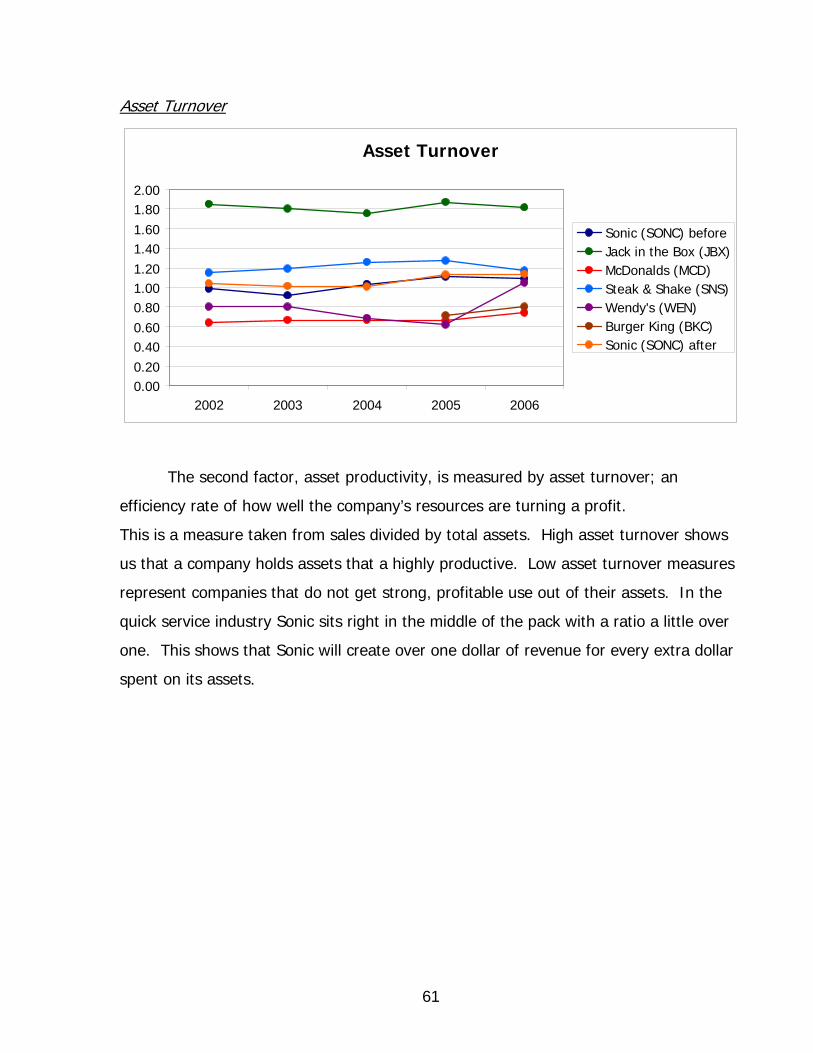
61
Asset Turnover
Asset Turnover
0.000.200.400.600.801.001.201.401.601.802.00
2002 2003 2004 2005 2006
Sonic (SONC) beforeJack in the Box (JBX)McDonalds (MCD)Steak & Shake (SNS)Wendy's (WEN)Burger King (BKC)Sonic (SONC) after
The second factor, asset productivity, is measured by asset turnover; an
efficiency rate of how well the company’s resources are turning a profit.
This is a measure taken from sales divided by total assets. High asset turnover shows
us that a company holds assets that a highly productive. Low asset turnover measures
represent companies that do not get strong, profitable use out of their assets. In the
quick service industry Sonic sits right in the middle of the pack with a ratio a little over
one. This shows that Sonic will create over one dollar of revenue for every extra dollar
spent on its assets.
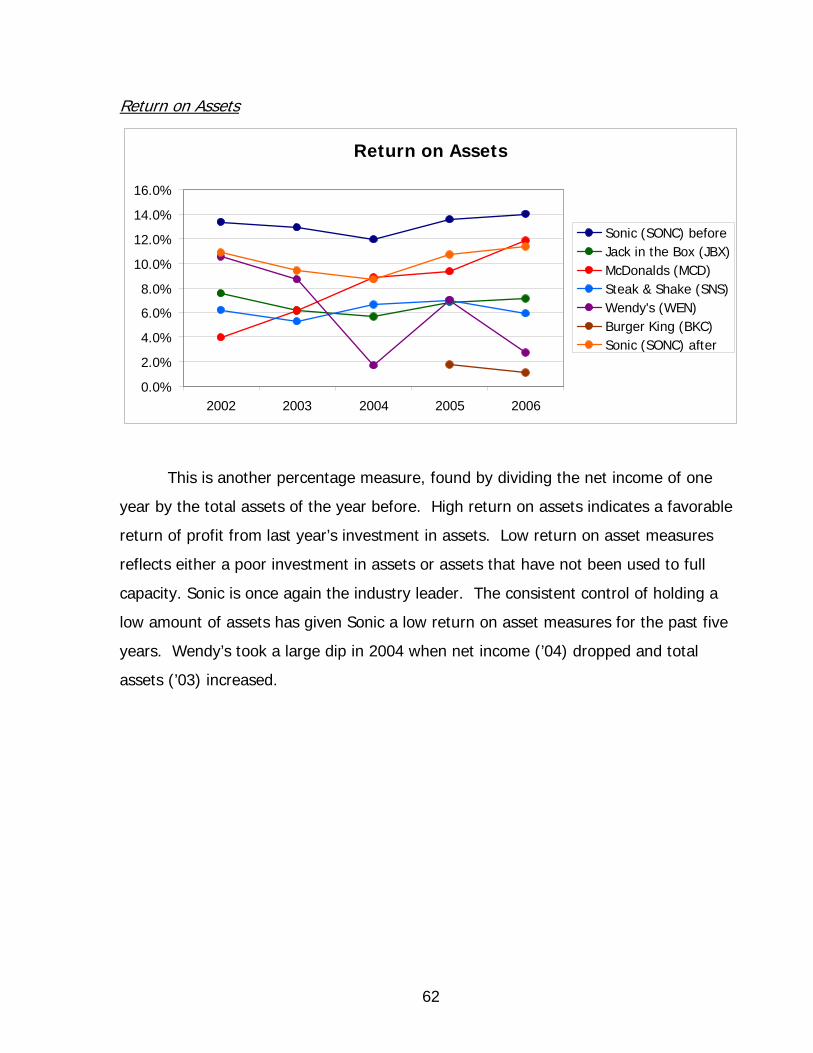
62
Return on Assets
Return on Assets
0.0%
2.0%
4.0%
6.0%
8.0%
10.0%
12.0%
14.0%
16.0%
2002 2003 2004 2005 2006
Sonic (SONC) beforeJack in the Box (JBX)McDonalds (MCD)Steak & Shake (SNS)Wendy's (WEN)Burger King (BKC)Sonic (SONC) after
This is another percentage measure, found by dividing the net income of one
year by the total assets of the year before. High return on assets indicates a favorable
return of profit from last year’s investment in assets. Low return on asset measures
reflects either a poor investment in assets or assets that have not been used to full
capacity. Sonic is once again the industry leader. The consistent control of holding a
low amount of assets has given Sonic a low return on asset measures for the past five
years. Wendy’s took a large dip in 2004 when net income (’04) dropped and total
assets (’03) increased.
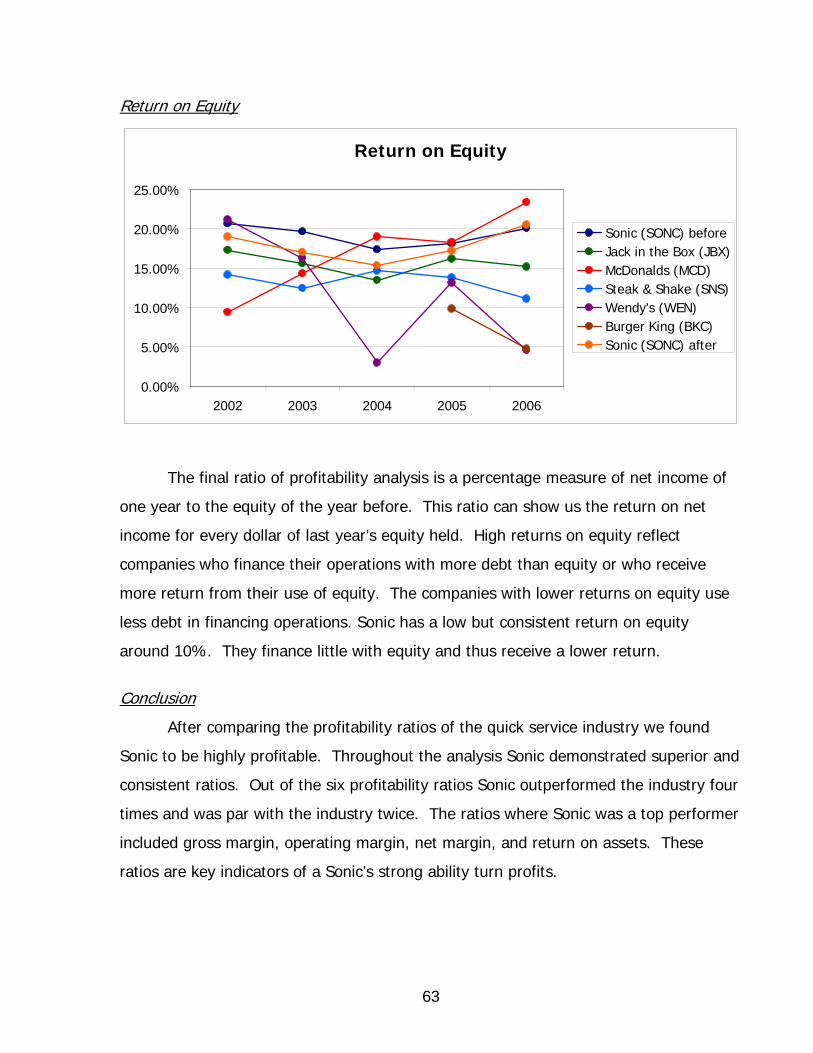
63
Return on Equity
Return on Equity
0.00%
5.00%
10.00%
15.00%
20.00%
25.00%
2002 2003 2004 2005 2006
Sonic (SONC) beforeJack in the Box (JBX)McDonalds (MCD)Steak & Shake (SNS)Wendy's (WEN)Burger King (BKC)Sonic (SONC) after
The final ratio of profitability analysis is a percentage measure of net income of
one year to the equity of the year before. This ratio can show us the return on net
income for every dollar of last year’s equity held. High returns on equity reflect
companies who finance their operations with more debt than equity or who receive
more return from their use of equity. The companies with lower returns on equity use
less debt in financing operations. Sonic has a low but consistent return on equity
around 10%. They finance little with equity and thus receive a lower return.
Conclusion
After comparing the profitability ratios of the quick service industry we found
Sonic to be highly profitable. Throughout the analysis Sonic demonstrated superior and
consistent ratios. Out of the six profitability ratios Sonic outperformed the industry four
times and was par with the industry twice. The ratios where Sonic was a top performer
included gross margin, operating margin, net margin, and return on assets. These
ratios are key indicators of a Sonic’s strong ability turn profits.
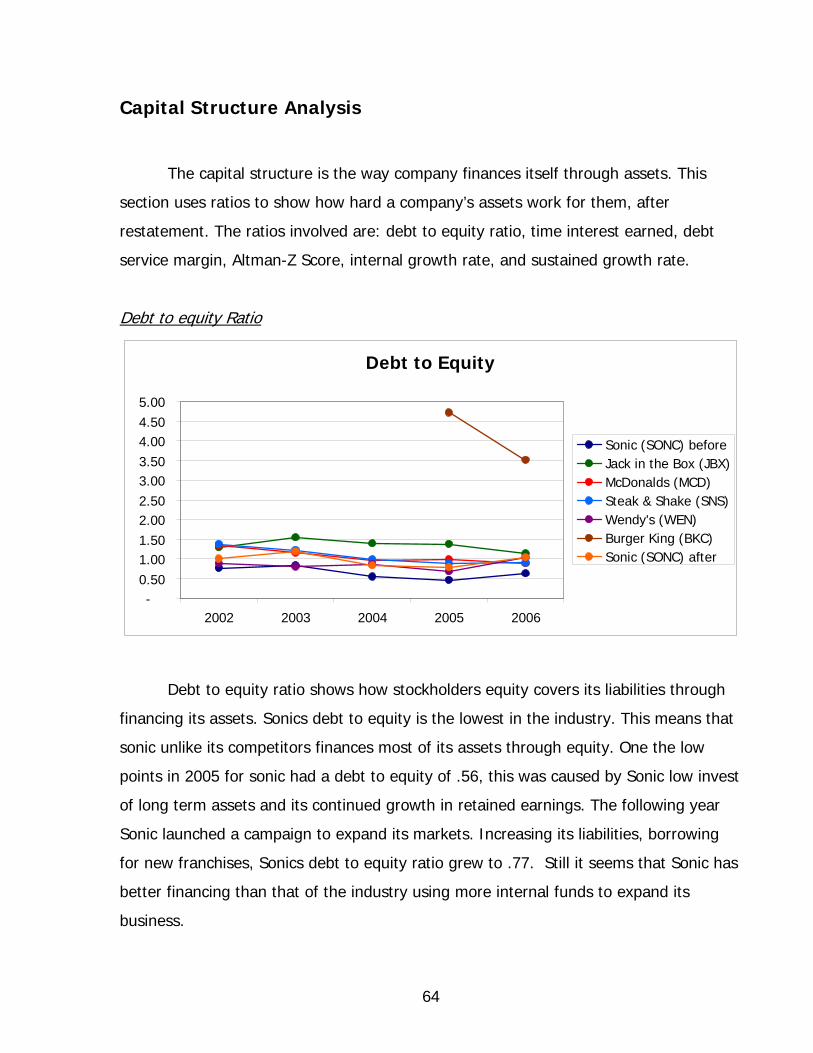
64
Capital Structure Analysis
The capital structure is the way company finances itself through assets. This
section uses ratios to show how hard a company’s assets work for them, after
restatement. The ratios involved are: debt to equity ratio, time interest earned, debt
service margin, Altman-Z Score, internal growth rate, and sustained growth rate.
Debt to equity Ratio
Debt to Equity
-0.501.001.502.002.503.003.504.004.505.00
2002 2003 2004 2005 2006
Sonic (SONC) beforeJack in the Box (JBX)McDonalds (MCD)Steak & Shake (SNS)Wendy's (WEN)Burger King (BKC)Sonic (SONC) after
Debt to equity ratio shows how stockholders equity covers its liabilities through
financing its assets. Sonics debt to equity is the lowest in the industry. This means that
sonic unlike its competitors finances most of its assets through equity. One the low
points in 2005 for sonic had a debt to equity of .56, this was caused by Sonic low invest
of long term assets and its continued growth in retained earnings. The following year
Sonic launched a campaign to expand its markets. Increasing its liabilities, borrowing
for new franchises, Sonics debt to equity ratio grew to .77. Still it seems that Sonic has
better financing than that of the industry using more internal funds to expand its
business.
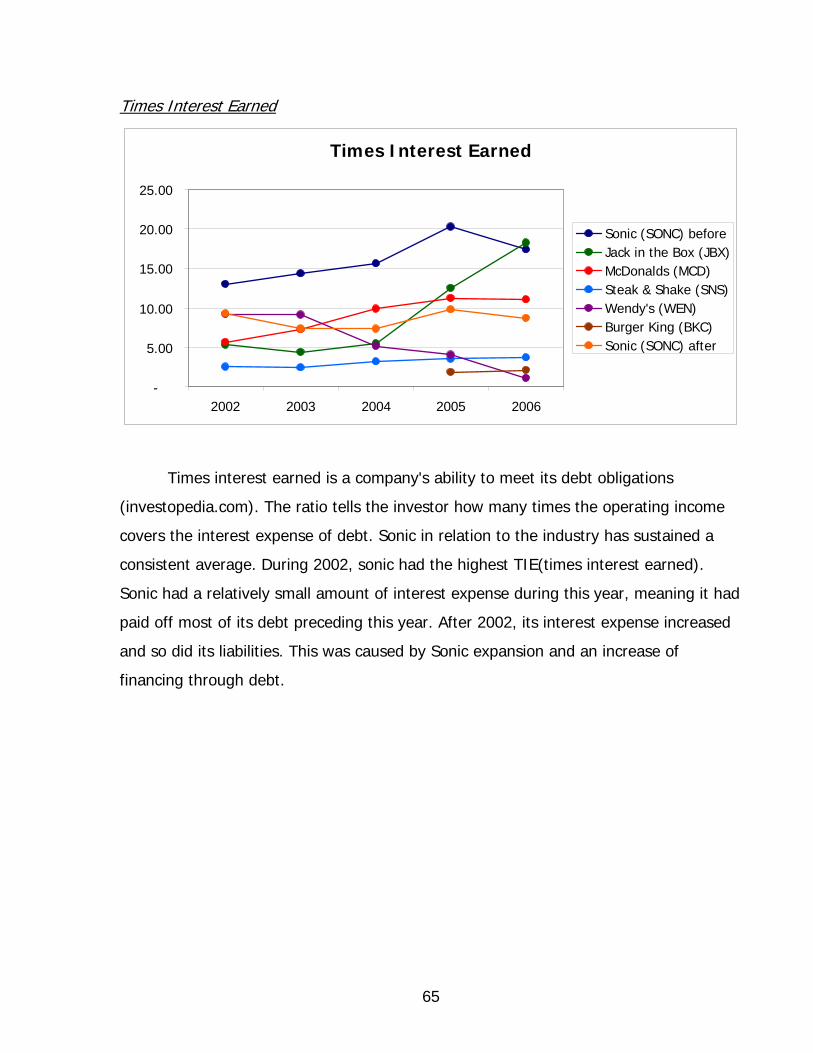
65
Times Interest Earned
Times Interest Earned
-
5.00
10.00
15.00
20.00
25.00
2002 2003 2004 2005 2006
Sonic (SONC) beforeJack in the Box (JBX)McDonalds (MCD)Steak & Shake (SNS)Wendy's (WEN)Burger King (BKC)Sonic (SONC) after
Times interest earned is a company's ability to meet its debt obligations
(investopedia.com). The ratio tells the investor how many times the operating income
covers the interest expense of debt. Sonic in relation to the industry has sustained a
consistent average. During 2002, sonic had the highest TIE(times interest earned).
Sonic had a relatively small amount of interest expense during this year, meaning it had
paid off most of its debt preceding this year. After 2002, its interest expense increased
and so did its liabilities. This was caused by Sonic expansion and an increase of
financing through debt.
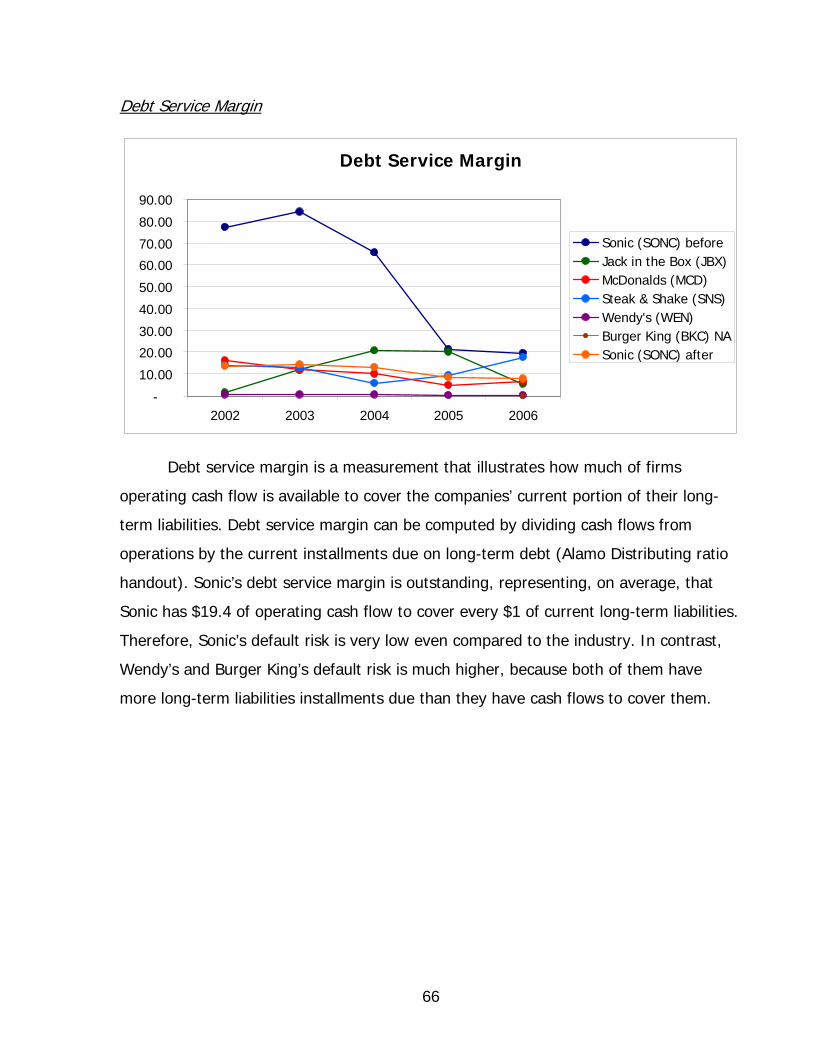
66
Debt Service Margin
Debt Service Margin
-
10.00
20.00
30.00
40.00
50.00
60.00
70.00
80.00
90.00
2002 2003 2004 2005 2006
Sonic (SONC) beforeJack in the Box (JBX)McDonalds (MCD)Steak & Shake (SNS)Wendy's (WEN)Burger King (BKC) NASonic (SONC) after
Debt service margin is a measurement that illustrates how much of firms
operating cash flow is available to cover the companies’ current portion of their long-
term liabilities. Debt service margin can be computed by dividing cash flows from
operations by the current installments due on long-term debt (Alamo Distributing ratio
handout). Sonic’s debt service margin is outstanding, representing, on average, that
Sonic has $19.4 of operating cash flow to cover every $1 of current long-term liabilities.
Therefore, Sonic’s default risk is very low even compared to the industry. In contrast,
Wendy’s and Burger King’s default risk is much higher, because both of them have
more long-term liabilities installments due than they have cash flows to cover them.
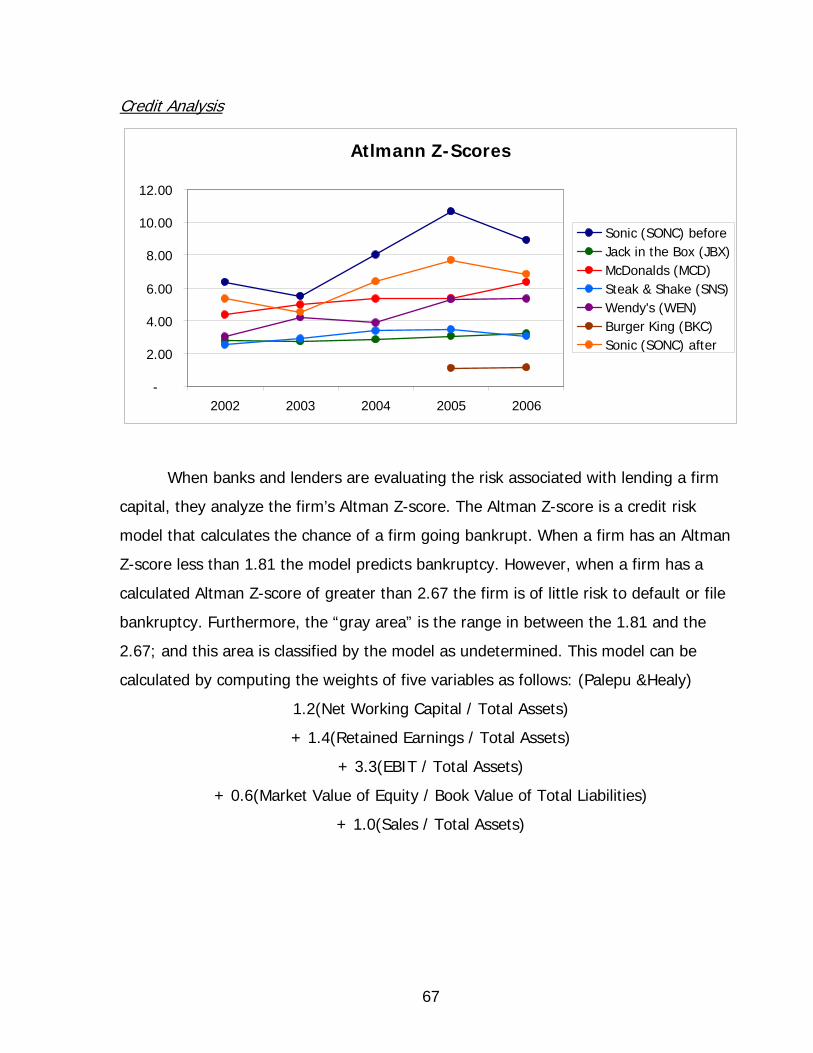
67
Credit Analysis
Atlmann Z-Scores
-
2.00
4.00
6.00
8.00
10.00
12.00
2002 2003 2004 2005 2006
Sonic (SONC) beforeJack in the Box (JBX)McDonalds (MCD)Steak & Shake (SNS)Wendy's (WEN)Burger King (BKC)Sonic (SONC) after
When banks and lenders are evaluating the risk associated with lending a firm
capital, they analyze the firm’s Altman Z-score. The Altman Z-score is a credit risk
model that calculates the chance of a firm going bankrupt. When a firm has an Altman
Z-score less than 1.81 the model predicts bankruptcy. However, when a firm has a
calculated Altman Z-score of greater than 2.67 the firm is of little risk to default or file
bankruptcy. Furthermore, the “gray area” is the range in between the 1.81 and the
2.67; and this area is classified by the model as undetermined. This model can be
calculated by computing the weights of five variables as follows: (Palepu &Healy)
1.2(Net Working Capital / Total Assets)
+ 1.4(Retained Earnings / Total Assets)
+ 3.3(EBIT / Total Assets)
+ 0.6(Market Value of Equity / Book Value of Total Liabilities)
+ 1.0(Sales / Total Assets)
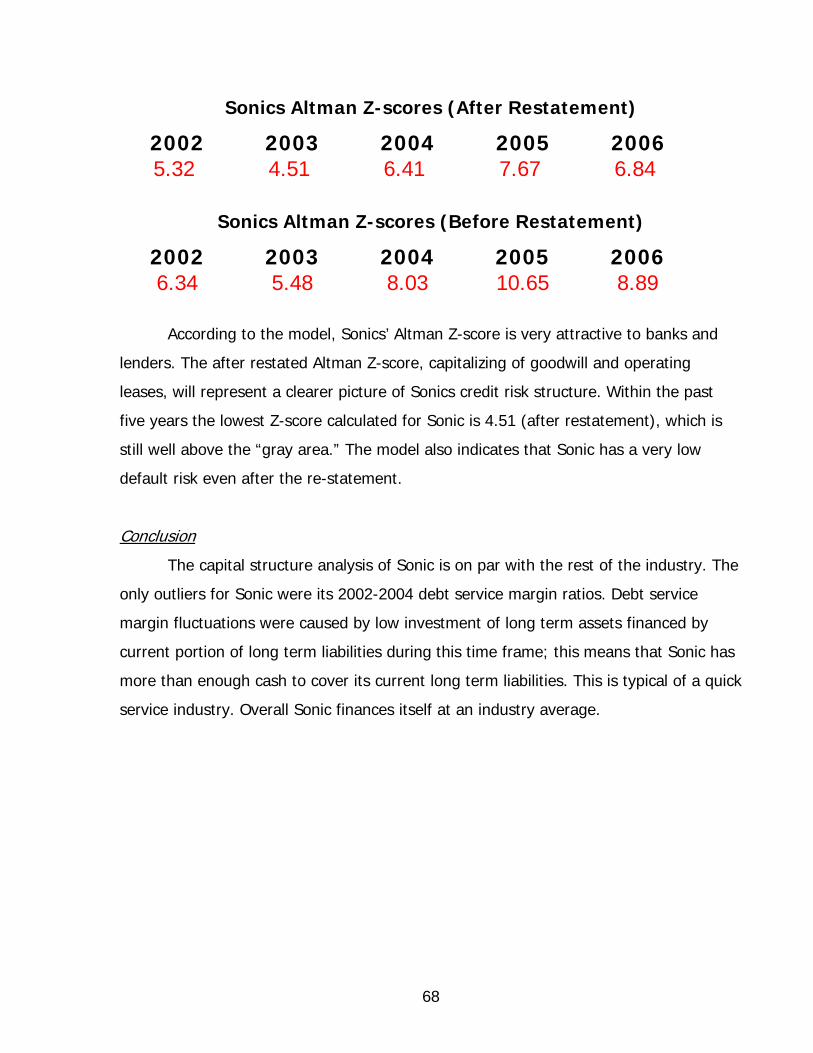
68
Sonics Altman Z-scores (After Restatement)
2002 2003 2004 2005 2006 5.32 4.51 6.41 7.67 6.84
Sonics Altman Z-scores (Before Restatement)
2002 2003 2004 2005 2006 6.34 5.48 8.03 10.65 8.89
According to the model, Sonics’ Altman Z-score is very attractive to banks and
lenders. The after restated Altman Z-score, capitalizing of goodwill and operating
leases, will represent a clearer picture of Sonics credit risk structure. Within the past
five years the lowest Z-score calculated for Sonic is 4.51 (after restatement), which is
still well above the “gray area.” The model also indicates that Sonic has a very low
default risk even after the re-statement.
Conclusion
The capital structure analysis of Sonic is on par with the rest of the industry. The
only outliers for Sonic were its 2002-2004 debt service margin ratios. Debt service
margin fluctuations were caused by low investment of long term assets financed by
current portion of long term liabilities during this time frame; this means that Sonic has
more than enough cash to cover its current long term liabilities. This is typical of a quick
service industry. Overall Sonic finances itself at an industry average.
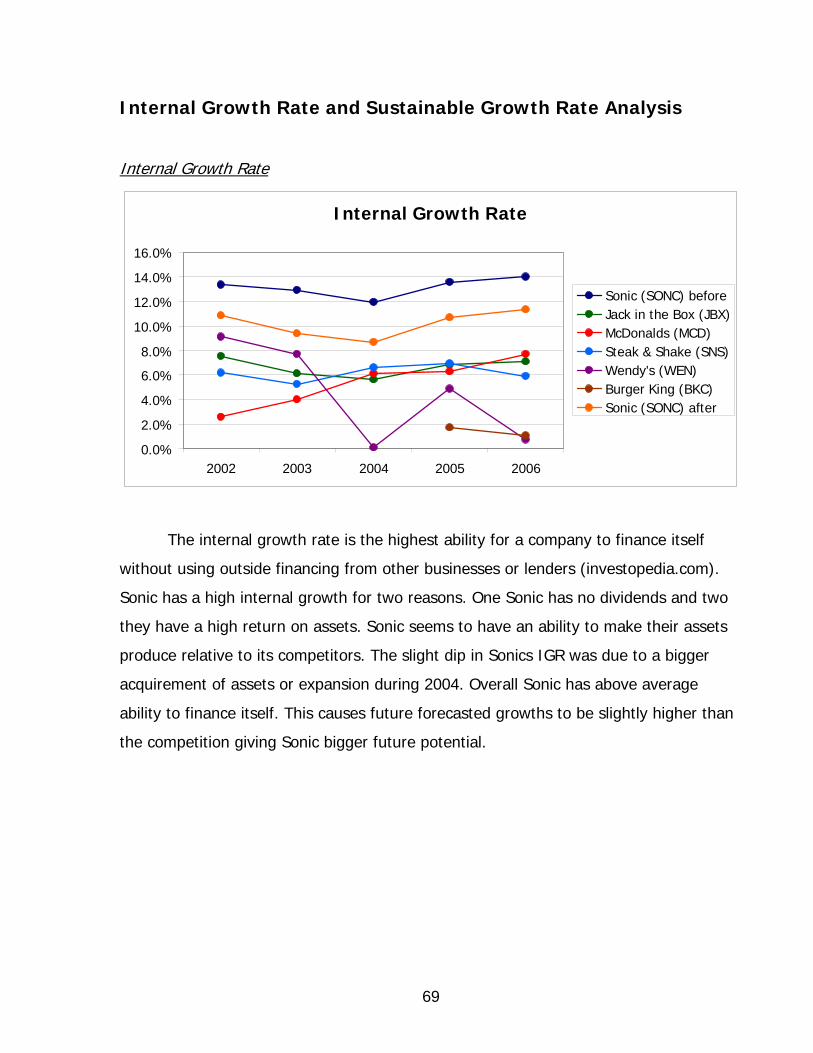
69
Internal Growth Rate and Sustainable Growth Rate Analysis
Internal Growth Rate
Internal Growth Rate
0.0%
2.0%
4.0%
6.0%
8.0%
10.0%
12.0%
14.0%
16.0%
2002 2003 2004 2005 2006
Sonic (SONC) beforeJack in the Box (JBX)McDonalds (MCD)Steak & Shake (SNS)Wendy's (WEN)Burger King (BKC)Sonic (SONC) after
The internal growth rate is the highest ability for a company to finance itself
without using outside financing from other businesses or lenders (investopedia.com).
Sonic has a high internal growth for two reasons. One Sonic has no dividends and two
they have a high return on assets. Sonic seems to have an ability to make their assets
produce relative to its competitors. The slight dip in Sonics IGR was due to a bigger
acquirement of assets or expansion during 2004. Overall Sonic has above average
ability to finance itself. This causes future forecasted growths to be slightly higher than
the competition giving Sonic bigger future potential.
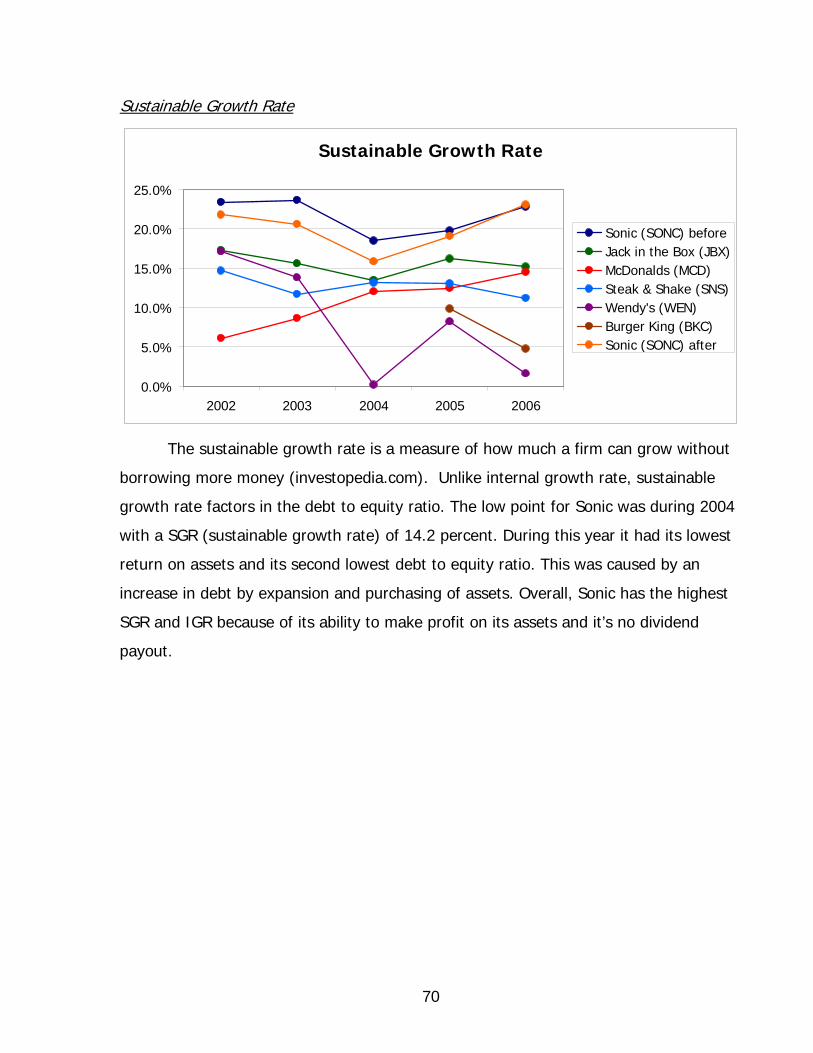
70
Sustainable Growth Rate
Sustainable Growth Rate
0.0%
5.0%
10.0%
15.0%
20.0%
25.0%
2002 2003 2004 2005 2006
Sonic (SONC) beforeJack in the Box (JBX)McDonalds (MCD)Steak & Shake (SNS)Wendy's (WEN)Burger King (BKC)Sonic (SONC) after
The sustainable growth rate is a measure of how much a firm can grow without
borrowing more money (investopedia.com). Unlike internal growth rate, sustainable
growth rate factors in the debt to equity ratio. The low point for Sonic was during 2004
with a SGR (sustainable growth rate) of 14.2 percent. During this year it had its lowest
return on assets and its second lowest debt to equity ratio. This was caused by an
increase in debt by expansion and purchasing of assets. Overall, Sonic has the highest
SGR and IGR because of its ability to make profit on its assets and it’s no dividend
payout.
71
Financial Statements Forecast
Forecasting the financial statements allows us to look at what we believe the
structure of the firm will be in the future. There are a number of assumptions to be
made in forecasting, and if we are diligent in our selection of the assumptions, we can
get a clearer picture of the firm’s value. If we are wrong in our assumptions, we will
adversely impact the valuation of the firm.
We forecast the income statement by applying a growth factor to future
revenues based on the past 5 year’s history. The balance sheet was forecast using the
asset turnover ratio applied to our forecast revenues. Finally, we applied a ratio of cash
flow from operations to revenues to project cash flow from operations. We projected
cash flow from investing as the change to property, plant, equipment and capital leases
from one period to the next. As you can see, the assumption on revenues growth is the
primary driver in our forecast. As I stated previously, an incorrect assumption would
adversely impact our valuation.
Sonic has two items we discussed in the “Red Flags” section that should be
addressed here – off balance sheet operating leases and Goodwill. We restated all
financial statements to reflect the capitalization of operating leases and the amortization
of Goodwill over a five year period. The net effect of these changes can be seen in the
printed financial statements, since we forecast both the actual reported data and the
restated data. We will discuss the impact in each of the appropriate sections.
Income Statement
Our forecasting begins with the income statement. It is the easiest to forecast,
but maybe the most critical to the success of the valuation since the balance sheet and
the cash flow statement are tied to our assumption on revenue growth. We chose
72
revenue growth over sales growth due the nature of the franchising business.
Franchising fees account for about 15% of total revenues, and they are an integral
component of the business strategy for firms like Sonic. Also, they are recurring items,
unlike some occasional “other income” revenues.
We looked at the growth of Sonic’s revenues over the past 5 years and found
their growth in revenues ranged from 21% down to a recent 11%. Their business
model is based on future growth through the development of markets in the U.S that
they currently do not serve – i.e. Montana, as well as expansion in underdeveloped
markets in the U.S – i.e. California. The industry average revenue growth is about half
of the 11% growth Sonic has been experiencing over the past couple of years. While
we believe Sonic will continue to grow, we think their growth will probably decline to
about 10% in 2009 and stay at that level for the term of our forecast.
Jack in the Box, McDonalds, and Steak and Shake averaged growth of about 8%
over the previous 5 years as opposed to Sonic’s 17% growth over the same period.
Jack in the Box and McDonalds grew at about 9% in 2006 while Sonic’s growth was at
11.27% in 2006 and 11.14% in 2007. Again, we believe our basic revenues assumption
is valid for the income statement forecast.
The restatement of operating leases and goodwill has no direct impact on the
forecasting of revenues. However, they do impact the income statement by reducing
net income due to the amortization of goodwill, and to a lesser extent the capitalization
of operating leases.
Another item of significance is the purchase of treasury stock by Sonic in fiscal
2007. Sonic acquired approximately $577 million of treasury stock in a “modified Dutch
auction”. This was done through the use of retained earnings and acquisition of debt.
The effect on the income statement will be an increase to interest expense of
73
approximately 2% of revenues – doubling their current 2% level to 4%. We reflected
this change in our forecasted interest expense and forecasted net income.
Balance Sheet
Next, we focused our attention on the balance sheet. Before restatement, Sonic’s
asset turnover rate averaged 0.99. After restatement, the asset turnover rate was 1.07.
The asset turnover rates for the 2 most recent years were closer to 1.11 before
restatement and 1.13 after restatement. Clearly, Sonic is a different company than it
was 3-5 years ago, therefore we used an asset turnover rate of 1.11 before
restatement and 1.13 after restatement to forecast Sonic’s total assets. Since one of the
main effects of the restatement was the capitalization of operating leases, we forecast
property, plant, equipment and capital leases 70% and 80% of total assets for before
restatement and after restatement, respectively.
We forecast Accounts Receivable at 3.10% moving forward to reflect the
continuing growth of the franchise portion of Sonic’s business. The growth of this sector
is important to Sonic’s strategy.
Since Sonic does not pay dividends, we added net income to retained earnings
and stockholders equity each year of the forecast. The effects of the capitalization of
operating leases and the amortization of goodwill can be seen in the difference between
retained earnings in the before and after restatement forecasts.
The most significant change to the balance sheet occurred in October 2006.
According to the 2007 10-K, Sonic repurchased common stock for approximately $577
million dollars bringing the total of treasury stock to about 55 million shares. This leaves
shares in the open market to about 60 million. The effect of the repurchase leaves
Sonic with a negative stockholder’s equity of $106,802,000 before restatement and
$173,276,000 after restatement at the end of fiscal 2007. This will be a problem valuing
74
the company based on the Residual Income and Long Run Return on Equity Residual
Income models.
Cash Flow Statement
Our primary assumption in the cash flow statement was based on cash flow from
operations divided by revenues (CFFO/Revenues). Sonic was stable at about 0.19 over
the past 5 years, but again they are a different company over the past couple of years.
Their CFFO/Revenues dropped to 0.18 in 2006 and 0.16 in 2007. We therefore assumed
a ratio of 0.16 in 2008 with a ramp up to 0.19 in 2009. We used the same assumption
for both the before and after restatement forecasts.
Cash flows from investing activities are reflected by the net change in assets
each year. You are able to see the effects of the changes to operating leases and
goodwill in our forecasts.
Cost of Capital Estimation
One of the most difficult tasks for any firm is to estimate the weighted average
cost of capital. The primary difficulty lies in estimating the cost of equity. However, in
order to estimate the cost of capital we must estimate both the cost of equity and the
cost of debt.
We first estimated the cost of debt by finding rates that most accurately reflected
current liabilities. Sonic gives us rates for several accounts in their 10-k. Other rates not
found in the 10-k were acquired from the St Louis Federal Reserve website. We used
the 3 month non-financial rate for AA commercial paper. These rates, as well as those
given by Sonic, can be seen in the attached table (3-1). Rates for non-current liabilities
75
were given to us by Sonic in their 10-k. The weighted average cost of debt for Sonic is
estimated to be 6.59%
The cost of equity is arrived at by using the Capital Asset Pricing Model (CAPM).
We needed to determine several factors in order to utilize this model – a risk free rate,
the market risk premium, a size premium, and beta. Our risk free rate is the 5 year U.S.
Treasury rate as posted 11/07/2007 on the Wall Street Journal website. According to
Palipu and Healy “Over the 1925-2005 period, returns to the Standard and Poor’s 500
index have exceeded the rate on intermediate-term treasury bonds by 6.8%” (Palipu
and Healy page 8-3). So we used the 6.8% as the market risk premium. We used a size
premium of 1.5 based on Table 8-1 on page 8-4 of Palipu and Healy’s Business Analysis
and Valuation. Lastly, we needed to arrive at a beta to be able to utilize CAPM.
We began by acquiring beginning of the month prices for Sonic stock from the
Yahoo Finance website and calculated the returns each month. We also downloaded the
S & P 500 index closings for the same dates from Yahoo Finance and calculated the
returns. Next we retrieved interest rates from the St Louis Federal Reserve website for
3 month, 1 year, 2 year, 5 year, 7 year, and 10 year treasuries for dates matching Sonic
prices and the S & P 500 closings. We converted these annual rates to monthly rates
and calculated the market risk premium.
Our next task was to determine the stability over time. We ran 25 regressions on
the 5 interest rates over horizons of 24, 36, 48, 60, and 72 months (summary Table 3-
2). We determined the best adjusted R Square was .1639 on the 1 year rate at 24
months. In fact, our best horizon was 24 months for each of the 5 interest rates. The
adjusted R-Square told us that, at best, only about 16% of Sonic’s return could be
explained by the market risk premium. It may confirm what we have previously stated –
Sonic is a different company over the last 24 months.
By comparing interest rates from the 6 different time periods and comparing
them in the 5 different horizons we are looking at two things. First, the 24, 36, 48, 60
76
and 72 month horizons help us determine the stability of beta over time. Because beta
is used as a measure of risk, it is important to find a stable beta. Second, the 6 different
interest rates give us an indication of investor’s time preference for holding Sonic’s
stock. It appears investors look at Sonic as a short term investment that would probably
be held for about 1 year.
The coefficient of determination on the 1 year 24 month regression is 1.28. This
is the number we use as our beta. While it is not the 1.13 stated on the Yahoo Finance
website, it is the best number we get from our regression analysis.
We now have all of the factors needed to estimate our cost of equity in the
CAPM. Plugging in all the factors we arrive at a cost of equity of 14.66%. Combined
with our cost of debt of 6.59% we are now able to compute a before tax weighted
average cost of capital of 12.41% and an after tax cost of capital of 11.72% after
restatement (Table 3-3). The WACC before restatement was 13.93% before tax and
13.72% after tax.
Conclusion
Based on data we have discussed, Sonic has demonstrated the ability to exceed their
competitor’s performance on several levels. Revenue growth exceeds them all by at
least 6% over the past 5 years and 5% over the previous 2 years. Sonic’s growth in
operating income also exceeds their competitors over the previous 5year and 2 year
periods. Sonic appears to be in a position to achieve a sustained level of growth in the
future. As we move forward to valuations, we will get a better idea of the value Sonic is
creating for investors and the company.
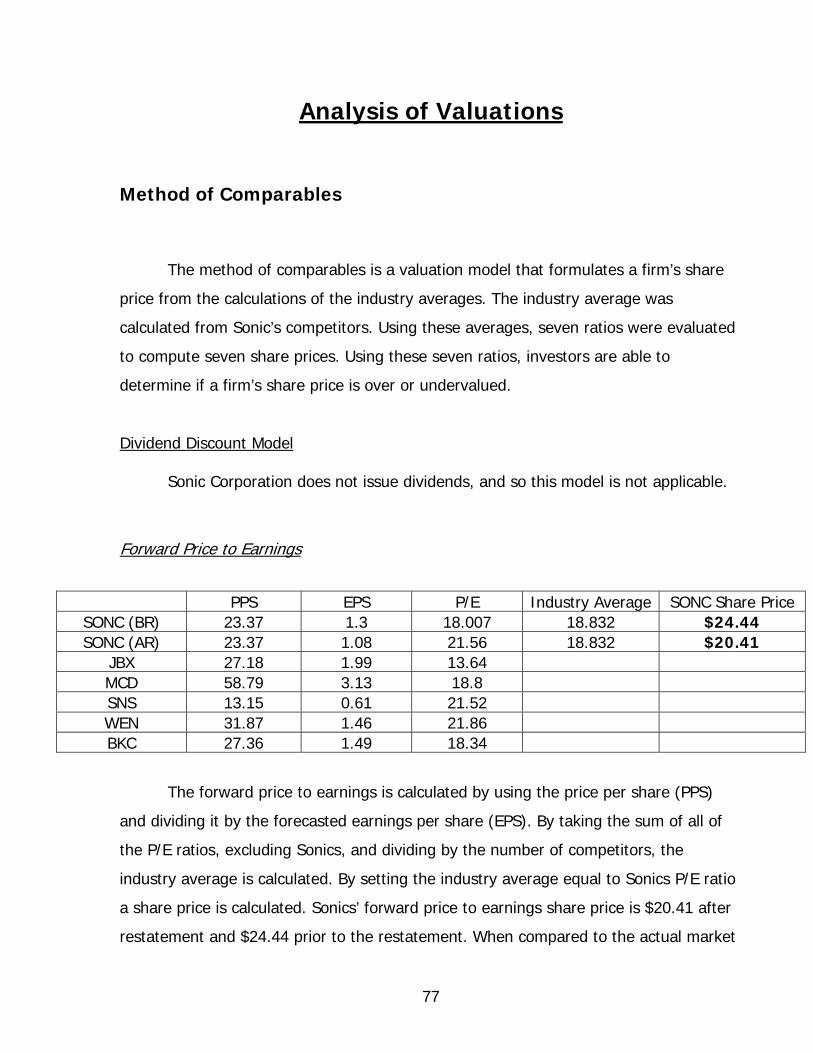
77
Analysis of Valuations
Method of Comparables
The method of comparables is a valuation model that formulates a firm’s share
price from the calculations of the industry averages. The industry average was
calculated from Sonic’s competitors. Using these averages, seven ratios were evaluated
to compute seven share prices. Using these seven ratios, investors are able to
determine if a firm’s share price is over or undervalued.
Dividend Discount Model
Sonic Corporation does not issue dividends, and so this model is not applicable.
Forward Price to Earnings
The forward price to earnings is calculated by using the price per share (PPS)
and dividing it by the forecasted earnings per share (EPS). By taking the sum of all of
the P/E ratios, excluding Sonics, and dividing by the number of competitors, the
industry average is calculated. By setting the industry average equal to Sonics P/E ratio
a share price is calculated. Sonics’ forward price to earnings share price is $20.41 after
restatement and $24.44 prior to the restatement. When compared to the actual market
PPS EPS P/E Industry Average SONC Share Price SONC (BR) 23.37 1.3 18.007 18.832 $24.44 SONC (AR) 23.37 1.08 21.56 18.832 $20.41
JBX 27.18 1.99 13.64 MCD 58.79 3.13 18.8 SNS 13.15 0.61 21.52 WEN 31.87 1.46 21.86 BKC 27.36 1.49 18.34
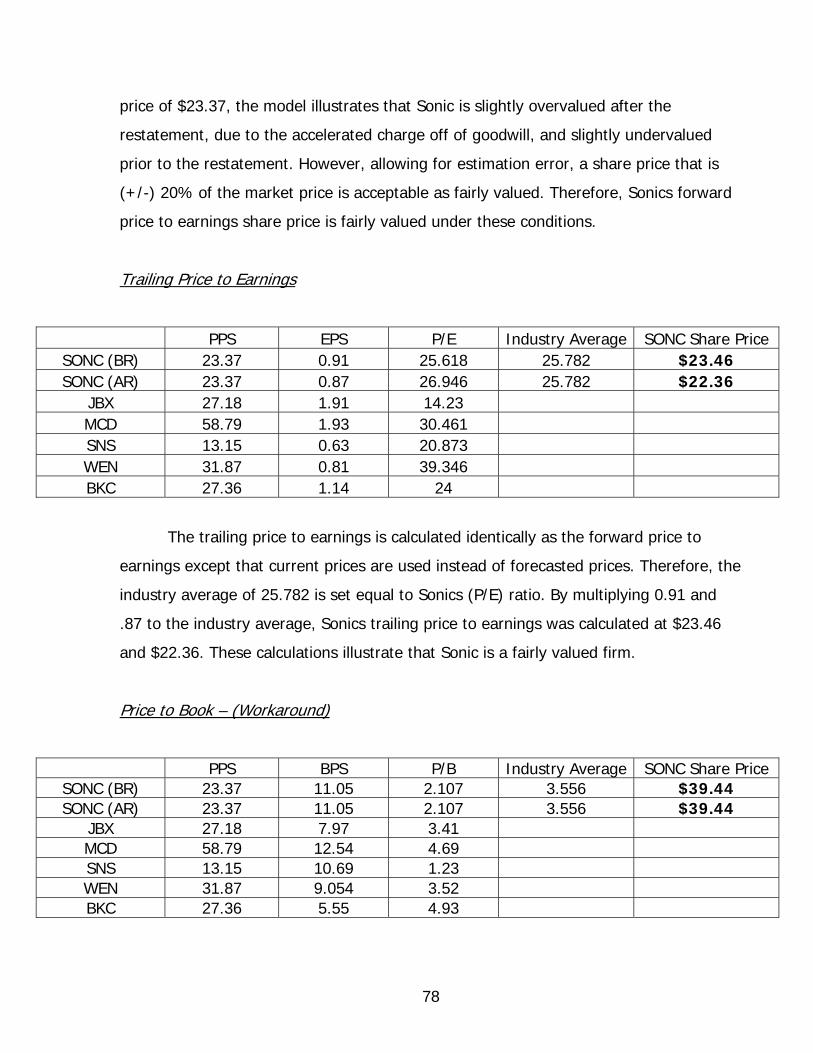
78
price of $23.37, the model illustrates that Sonic is slightly overvalued after the
restatement, due to the accelerated charge off of goodwill, and slightly undervalued
prior to the restatement. However, allowing for estimation error, a share price that is
(+/-) 20% of the market price is acceptable as fairly valued. Therefore, Sonics forward
price to earnings share price is fairly valued under these conditions.
Trailing Price to Earnings
PPS EPS P/E Industry Average SONC Share Price SONC (BR) 23.37 0.91 25.618 25.782 $23.46 SONC (AR) 23.37 0.87 26.946 25.782 $22.36
JBX 27.18 1.91 14.23 MCD 58.79 1.93 30.461 SNS 13.15 0.63 20.873 WEN 31.87 0.81 39.346 BKC 27.36 1.14 24
The trailing price to earnings is calculated identically as the forward price to
earnings except that current prices are used instead of forecasted prices. Therefore, the
industry average of 25.782 is set equal to Sonics (P/E) ratio. By multiplying 0.91 and
.87 to the industry average, Sonics trailing price to earnings was calculated at $23.46
and $22.36. These calculations illustrate that Sonic is a fairly valued firm.
Price to Book – (Workaround)
PPS BPS P/B Industry Average SONC Share Price SONC (BR) 23.37 11.05 2.107 3.556 $39.44 SONC (AR) 23.37 11.05 2.107 3.556 $39.44
JBX 27.18 7.97 3.41 MCD 58.79 12.54 4.69 SNS 13.15 10.69 1.23 WEN 31.87 9.054 3.52 BKC 27.36 5.55 4.93
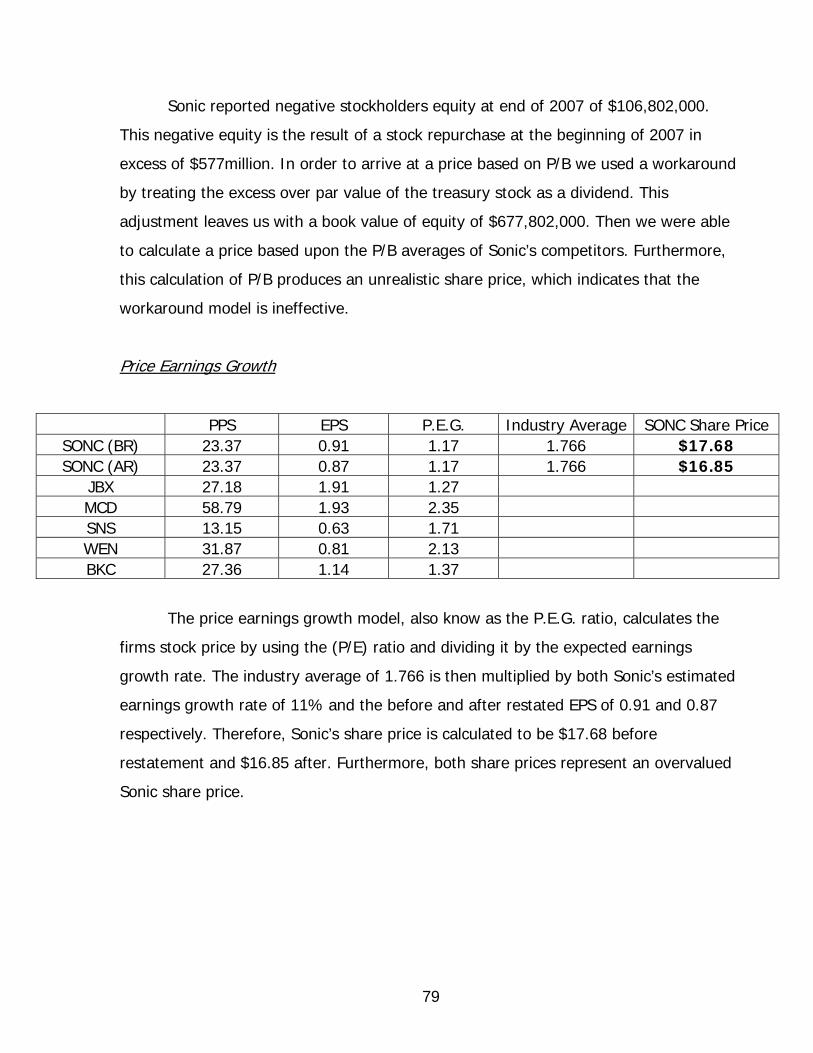
79
Sonic reported negative stockholders equity at end of 2007 of $106,802,000.
This negative equity is the result of a stock repurchase at the beginning of 2007 in
excess of $577million. In order to arrive at a price based on P/B we used a workaround
by treating the excess over par value of the treasury stock as a dividend. This
adjustment leaves us with a book value of equity of $677,802,000. Then we were able
to calculate a price based upon the P/B averages of Sonic’s competitors. Furthermore,
this calculation of P/B produces an unrealistic share price, which indicates that the
workaround model is ineffective.
Price Earnings Growth
PPS EPS P.E.G. Industry Average SONC Share Price SONC (BR) 23.37 0.91 1.17 1.766 $17.68 SONC (AR) 23.37 0.87 1.17 1.766 $16.85
JBX 27.18 1.91 1.27 MCD 58.79 1.93 2.35 SNS 13.15 0.63 1.71 WEN 31.87 0.81 2.13 BKC 27.36 1.14 1.37
The price earnings growth model, also know as the P.E.G. ratio, calculates the
firms stock price by using the (P/E) ratio and dividing it by the expected earnings
growth rate. The industry average of 1.766 is then multiplied by both Sonic’s estimated
earnings growth rate of 11% and the before and after restated EPS of 0.91 and 0.87
respectively. Therefore, Sonic’s share price is calculated to be $17.68 before
restatement and $16.85 after. Furthermore, both share prices represent an overvalued
Sonic share price.
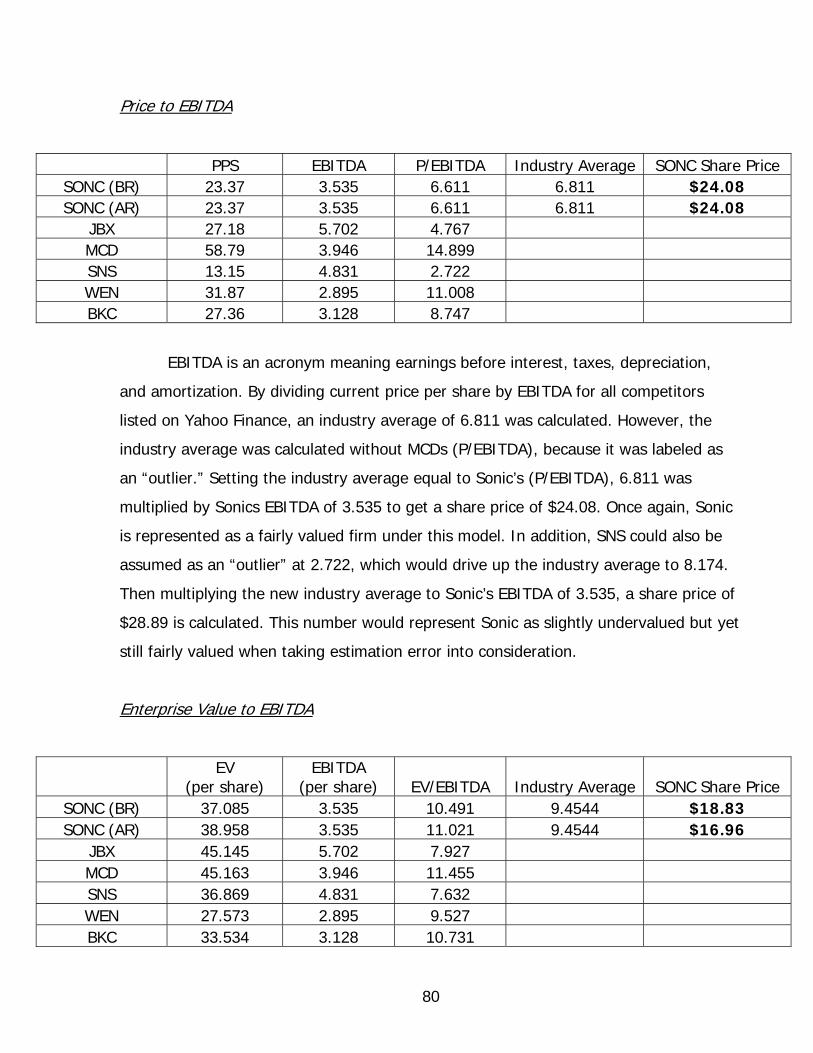
80
Price to EBITDA
PPS EBITDA P/EBITDA Industry Average SONC Share Price SONC (BR) 23.37 3.535 6.611 6.811 $24.08 SONC (AR) 23.37 3.535 6.611 6.811 $24.08
JBX 27.18 5.702 4.767 MCD 58.79 3.946 14.899 SNS 13.15 4.831 2.722 WEN 31.87 2.895 11.008 BKC 27.36 3.128 8.747
EBITDA is an acronym meaning earnings before interest, taxes, depreciation,
and amortization. By dividing current price per share by EBITDA for all competitors
listed on Yahoo Finance, an industry average of 6.811 was calculated. However, the
industry average was calculated without MCDs (P/EBITDA), because it was labeled as
an “outlier.” Setting the industry average equal to Sonic’s (P/EBITDA), 6.811 was
multiplied by Sonics EBITDA of 3.535 to get a share price of $24.08. Once again, Sonic
is represented as a fairly valued firm under this model. In addition, SNS could also be
assumed as an “outlier” at 2.722, which would drive up the industry average to 8.174.
Then multiplying the new industry average to Sonic’s EBITDA of 3.535, a share price of
$28.89 is calculated. This number would represent Sonic as slightly undervalued but yet
still fairly valued when taking estimation error into consideration.
Enterprise Value to EBITDA
EV
(per share) EBITDA
(per share) EV/EBITDA Industry Average SONC Share Price SONC (BR) 37.085 3.535 10.491 9.4544 $18.83 SONC (AR) 38.958 3.535 11.021 9.4544 $16.96
JBX 45.145 5.702 7.927 MCD 45.163 3.946 11.455 SNS 36.869 4.831 7.632 WEN 27.573 2.895 9.527 BKC 33.534 3.128 10.731
81
Enterprise value to EBITDA is a ratio used to formulate a share price by taking
enterprise value (EV), the value of the firms’ core underlying productive assets, and
dividing it by EBITDA. The enterprise value is computed by adding a firm’s book value
of liabilities to a firm’s market value of equity and subtracting the firm’s cash and
financial investments, which are the firms’ wasting assets. By multiplying the industry
average of 9.4544 to EBITDA the enterprise value is derived. From there, liabilities are
subtracted and cash and financial investments and are added back in order to
computed the market value of equity at $18.83 (br) and $16.96 (ar). The model
indicated that Sonic is an overvalued firm.
Price to Free Cash Flows
The price to free cash flows is another ratio model that determines an estimated
share price. Under this model, price per share is divided by free cash flows. First, the
free cash flows must be calculated. This is done by taking the sum of the cash flows
from operations and adding/subtracting them to the cash flows from investments.
Secondly, an industry average is calculated. The industry average was only calculated
from MCD, WEN, and JBX, because BKC had insufficient information and SNS has
negative free cash flows and both were labeled as “outliers.” Therefore, an industry
average of 23.689 was calculated. When formulating a share price the industry average
is multiplied to Sonic’s free cash flows per share both before and after restatement. The
before restatement free cash flows per share was .432, and the after restated free cash
flows per share was .407. The before restatement share price is calculated at $10.23,
and the after was calculated at $9.65. Furthermore, both of these share prices
represent an overvalued firm when compared to the market price of $23.37.
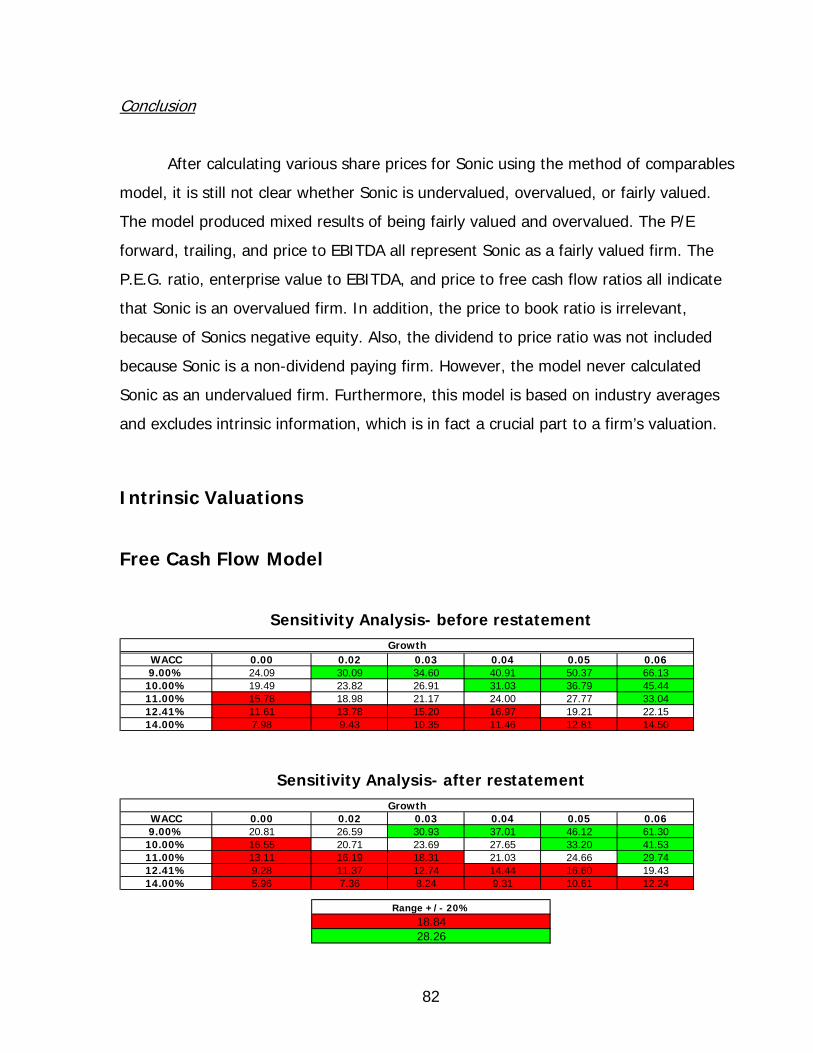
82
Conclusion
After calculating various share prices for Sonic using the method of comparables
model, it is still not clear whether Sonic is undervalued, overvalued, or fairly valued.
The model produced mixed results of being fairly valued and overvalued. The P/E
forward, trailing, and price to EBITDA all represent Sonic as a fairly valued firm. The
P.E.G. ratio, enterprise value to EBITDA, and price to free cash flow ratios all indicate
that Sonic is an overvalued firm. In addition, the price to book ratio is irrelevant,
because of Sonics negative equity. Also, the dividend to price ratio was not included
because Sonic is a non-dividend paying firm. However, the model never calculated
Sonic as an undervalued firm. Furthermore, this model is based on industry averages
and excludes intrinsic information, which is in fact a crucial part to a firm’s valuation. Intrinsic Valuations
Free Cash Flow Model
Sensitivity Analysis- before restatement
WACC 0.00 0.02 0.03 0.04 0.05 0.069.00% 24.09 30.09 34.60 40.91 50.37 66.13
10.00% 19.49 23.82 26.91 31.03 36.79 45.4411.00% 15.78 18.98 21.17 24.00 27.77 33.0412.41% 11.61 13.78 15.20 16.97 19.21 22.1514.00% 7.98 9.43 10.35 11.46 12.81 14.50
Growth
Sensitivity Analysis- after restatement
WACC 0.00 0.02 0.03 0.04 0.05 0.069.00% 20.81 26.59 30.93 37.01 46.12 61.30
10.00% 16.55 20.71 23.69 27.65 33.20 41.5311.00% 13.11 16.19 18.31 21.03 24.66 29.7412.41% 9.28 11.37 12.74 14.44 16.60 19.4314.00% 5.96 7.36 8.24 9.31 10.61 12.24
Growth
Range +/- 20%
18.8428.26
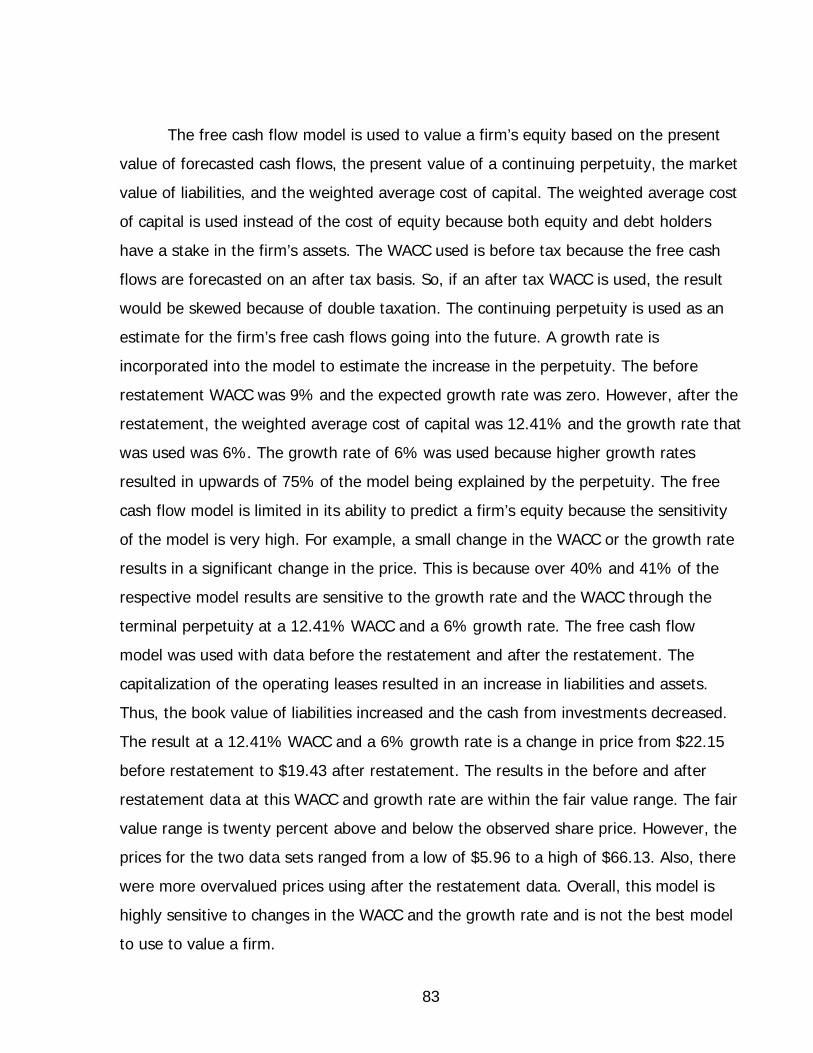
83
The free cash flow model is used to value a firm’s equity based on the present
value of forecasted cash flows, the present value of a continuing perpetuity, the market
value of liabilities, and the weighted average cost of capital. The weighted average cost
of capital is used instead of the cost of equity because both equity and debt holders
have a stake in the firm’s assets. The WACC used is before tax because the free cash
flows are forecasted on an after tax basis. So, if an after tax WACC is used, the result
would be skewed because of double taxation. The continuing perpetuity is used as an
estimate for the firm’s free cash flows going into the future. A growth rate is
incorporated into the model to estimate the increase in the perpetuity. The before
restatement WACC was 9% and the expected growth rate was zero. However, after the
restatement, the weighted average cost of capital was 12.41% and the growth rate that
was used was 6%. The growth rate of 6% was used because higher growth rates
resulted in upwards of 75% of the model being explained by the perpetuity. The free
cash flow model is limited in its ability to predict a firm’s equity because the sensitivity
of the model is very high. For example, a small change in the WACC or the growth rate
results in a significant change in the price. This is because over 40% and 41% of the
respective model results are sensitive to the growth rate and the WACC through the
terminal perpetuity at a 12.41% WACC and a 6% growth rate. The free cash flow
model was used with data before the restatement and after the restatement. The
capitalization of the operating leases resulted in an increase in liabilities and assets.
Thus, the book value of liabilities increased and the cash from investments decreased.
The result at a 12.41% WACC and a 6% growth rate is a change in price from $22.15
before restatement to $19.43 after restatement. The results in the before and after
restatement data at this WACC and growth rate are within the fair value range. The fair
value range is twenty percent above and below the observed share price. However, the
prices for the two data sets ranged from a low of $5.96 to a high of $66.13. Also, there
were more overvalued prices using after the restatement data. Overall, this model is
highly sensitive to changes in the WACC and the growth rate and is not the best model
to use to value a firm.
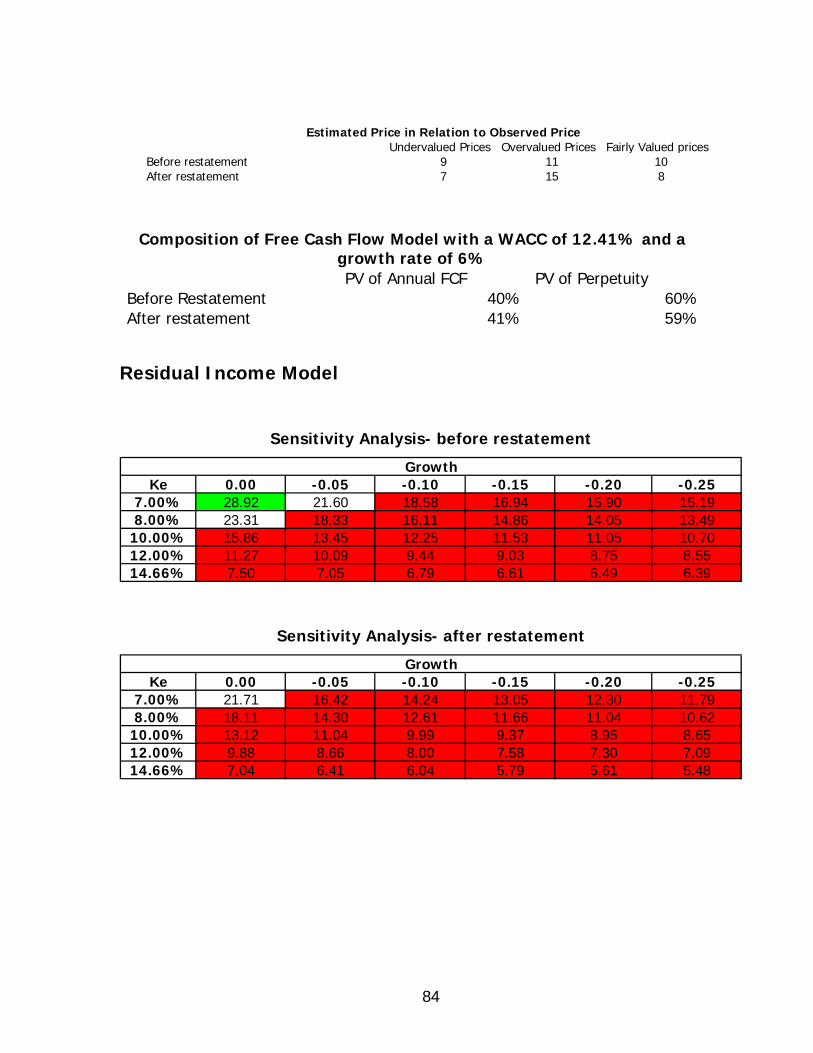
84
Estimated Price in Relation to Observed PriceUndervalued Prices Overvalued Prices Fairly Valued prices
Before restatement 9 11 10After restatement 7 15 8
Composition of Free Cash Flow Model with a WACC of 12.41% and a growth rate of 6%
PV of Annual FCF PV of Perpetuity Before Restatement 40% 60%After restatement 41% 59%
Residual Income Model
Sensitivity Analysis- before restatement
Ke 0.00 -0.05 -0.10 -0.15 -0.20 -0.257.00% 28.92 21.60 18.58 16.94 15.90 15.198.00% 23.31 18.33 16.11 14.86 14.05 13.49
10.00% 15.86 13.45 12.25 11.53 11.05 10.7012.00% 11.27 10.09 9.44 9.03 8.75 8.5514.66% 7.50 7.05 6.79 6.61 6.49 6.39
Growth
Sensitivity Analysis- after restatement
Ke 0.00 -0.05 -0.10 -0.15 -0.20 -0.257.00% 21.71 16.42 14.24 13.05 12.30 11.798.00% 18.11 14.30 12.61 11.66 11.04 10.62
10.00% 13.12 11.04 9.99 9.37 8.95 8.6512.00% 9.88 8.66 8.00 7.58 7.30 7.0914.66% 7.04 6.41 6.04 5.79 5.61 5.48
Growth
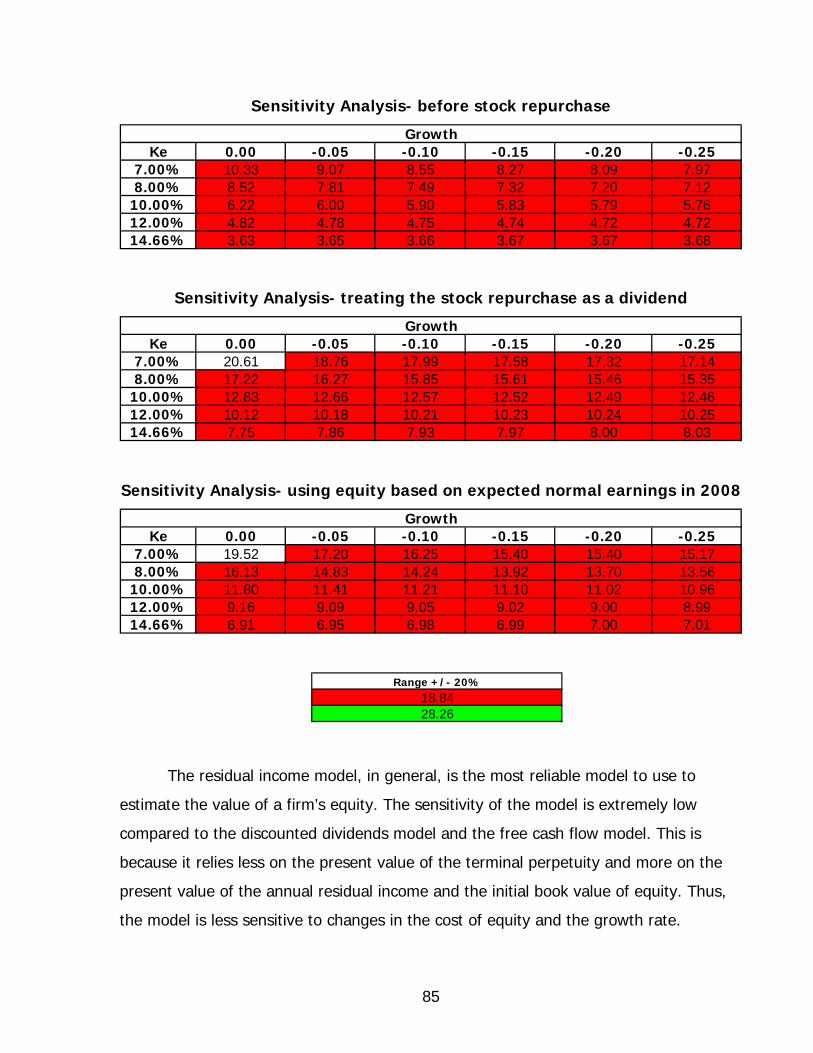
85
Sensitivity Analysis- before stock repurchase
Ke 0.00 -0.05 -0.10 -0.15 -0.20 -0.257.00% 10.33 9.07 8.55 8.27 8.09 7.978.00% 8.52 7.81 7.49 7.32 7.20 7.12
10.00% 6.22 6.00 5.90 5.83 5.79 5.7612.00% 4.82 4.78 4.75 4.74 4.72 4.7214.66% 3.63 3.65 3.66 3.67 3.67 3.68
Growth
Sensitivity Analysis- treating the stock repurchase as a dividend
Ke 0.00 -0.05 -0.10 -0.15 -0.20 -0.257.00% 20.61 18.76 17.99 17.58 17.32 17.148.00% 17.22 16.27 15.85 15.61 15.46 15.35
10.00% 12.83 12.66 12.57 12.52 12.49 12.4612.00% 10.12 10.18 10.21 10.23 10.24 10.2514.66% 7.75 7.86 7.93 7.97 8.00 8.03
Growth
Sensitivity Analysis- using equity based on expected normal earnings in 2008
Ke 0.00 -0.05 -0.10 -0.15 -0.20 -0.257.00% 19.52 17.20 16.25 15.40 15.40 15.178.00% 16.13 14.83 14.24 13.92 13.70 13.56
10.00% 11.80 11.41 11.21 11.10 11.02 10.9612.00% 9.16 9.09 9.05 9.02 9.00 8.9914.66% 6.91 6.95 6.98 6.99 7.00 7.01
Growth
Range +/- 20%18.8428.26
The residual income model, in general, is the most reliable model to use to
estimate the value of a firm’s equity. The sensitivity of the model is extremely low
compared to the discounted dividends model and the free cash flow model. This is
because it relies less on the present value of the terminal perpetuity and more on the
present value of the annual residual income and the initial book value of equity. Thus,
the model is less sensitive to changes in the cost of equity and the growth rate.
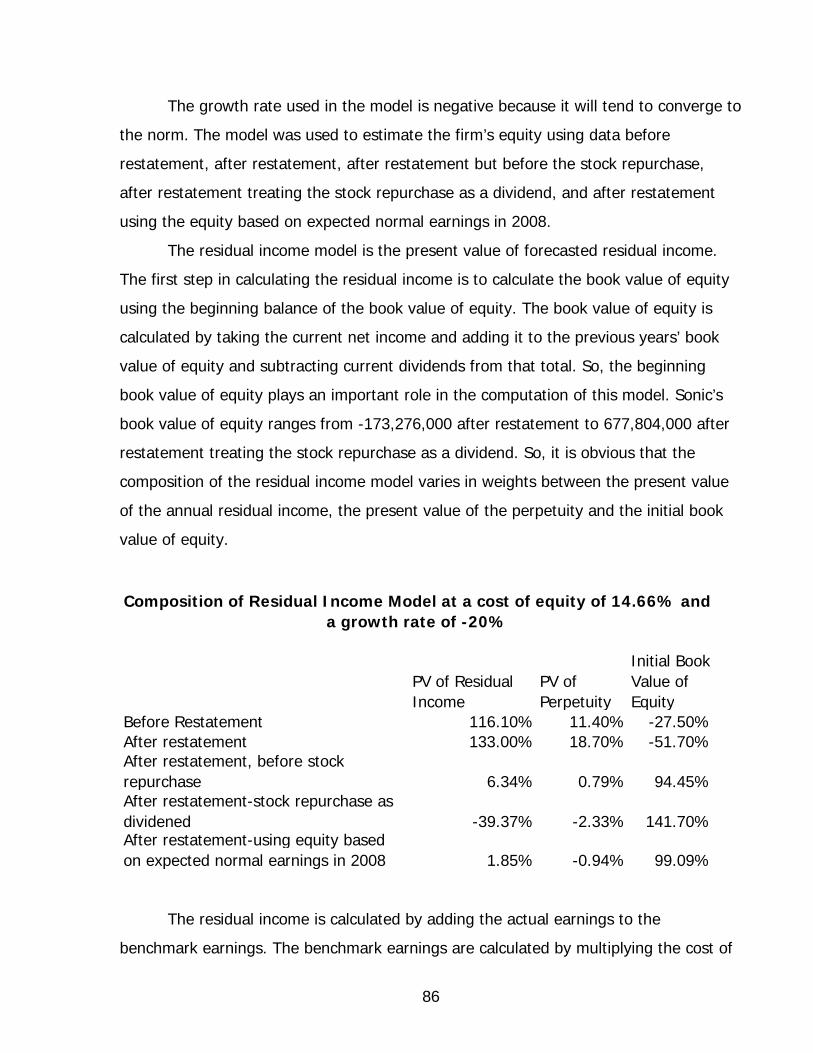
86
The growth rate used in the model is negative because it will tend to converge to
the norm. The model was used to estimate the firm’s equity using data before
restatement, after restatement, after restatement but before the stock repurchase,
after restatement treating the stock repurchase as a dividend, and after restatement
using the equity based on expected normal earnings in 2008.
The residual income model is the present value of forecasted residual income.
The first step in calculating the residual income is to calculate the book value of equity
using the beginning balance of the book value of equity. The book value of equity is
calculated by taking the current net income and adding it to the previous years’ book
value of equity and subtracting current dividends from that total. So, the beginning
book value of equity plays an important role in the computation of this model. Sonic’s
book value of equity ranges from -173,276,000 after restatement to 677,804,000 after
restatement treating the stock repurchase as a dividend. So, it is obvious that the
composition of the residual income model varies in weights between the present value
of the annual residual income, the present value of the perpetuity and the initial book
value of equity.
PV of Residual Income
PV of Perpetuity
Initial Book Value of Equity
Before Restatement 116.10% 11.40% -27.50%After restatement 133.00% 18.70% -51.70%After restatement, before stock repurchase 6.34% 0.79% 94.45%After restatement-stock repurchase as dividened -39.37% -2.33% 141.70%After restatement-using equity based on expected normal earnings in 2008 1.85% -0.94% 99.09%
Composition of Residual Income Model at a cost of equity of 14.66% and a growth rate of -20%
The residual income is calculated by adding the actual earnings to the
benchmark earnings. The benchmark earnings are calculated by multiplying the cost of
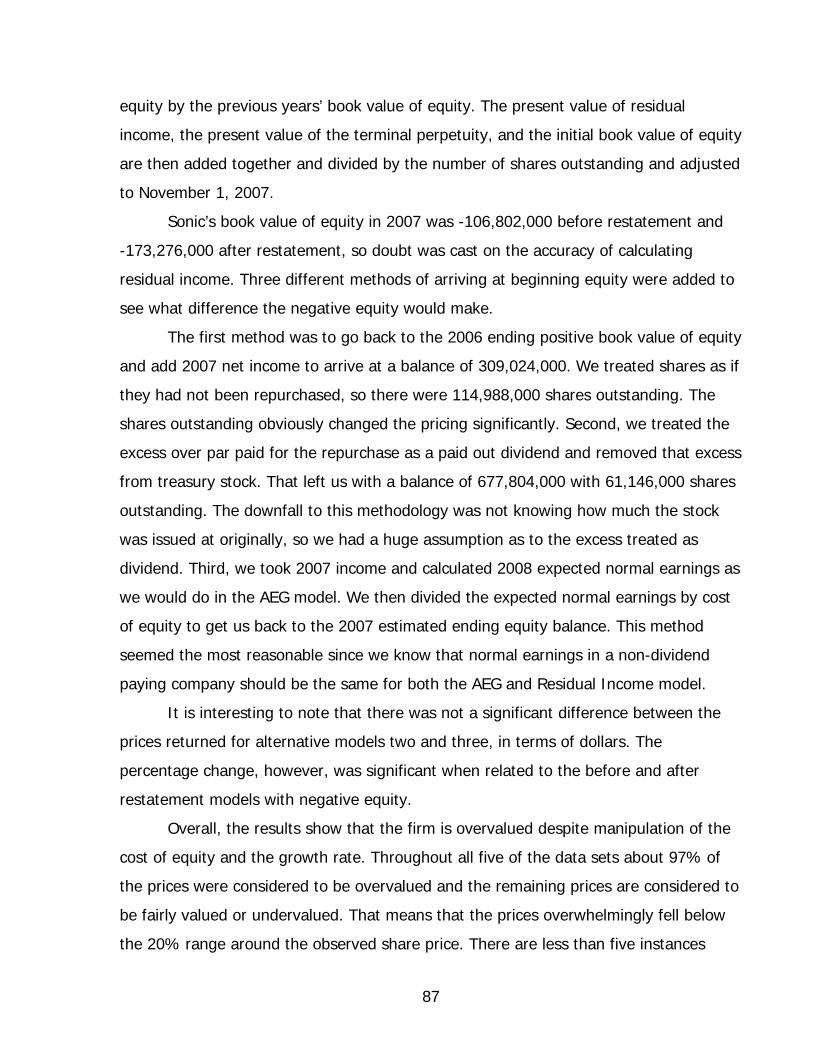
87
equity by the previous years’ book value of equity. The present value of residual
income, the present value of the terminal perpetuity, and the initial book value of equity
are then added together and divided by the number of shares outstanding and adjusted
to November 1, 2007.
Sonic’s book value of equity in 2007 was -106,802,000 before restatement and
-173,276,000 after restatement, so doubt was cast on the accuracy of calculating
residual income. Three different methods of arriving at beginning equity were added to
see what difference the negative equity would make.
The first method was to go back to the 2006 ending positive book value of equity
and add 2007 net income to arrive at a balance of 309,024,000. We treated shares as if
they had not been repurchased, so there were 114,988,000 shares outstanding. The
shares outstanding obviously changed the pricing significantly. Second, we treated the
excess over par paid for the repurchase as a paid out dividend and removed that excess
from treasury stock. That left us with a balance of 677,804,000 with 61,146,000 shares
outstanding. The downfall to this methodology was not knowing how much the stock
was issued at originally, so we had a huge assumption as to the excess treated as
dividend. Third, we took 2007 income and calculated 2008 expected normal earnings as
we would do in the AEG model. We then divided the expected normal earnings by cost
of equity to get us back to the 2007 estimated ending equity balance. This method
seemed the most reasonable since we know that normal earnings in a non-dividend
paying company should be the same for both the AEG and Residual Income model.
It is interesting to note that there was not a significant difference between the
prices returned for alternative models two and three, in terms of dollars. The
percentage change, however, was significant when related to the before and after
restatement models with negative equity.
Overall, the results show that the firm is overvalued despite manipulation of the
cost of equity and the growth rate. Throughout all five of the data sets about 97% of
the prices were considered to be overvalued and the remaining prices are considered to
be fairly valued or undervalued. That means that the prices overwhelmingly fell below
the 20% range around the observed share price. There are less than five instances
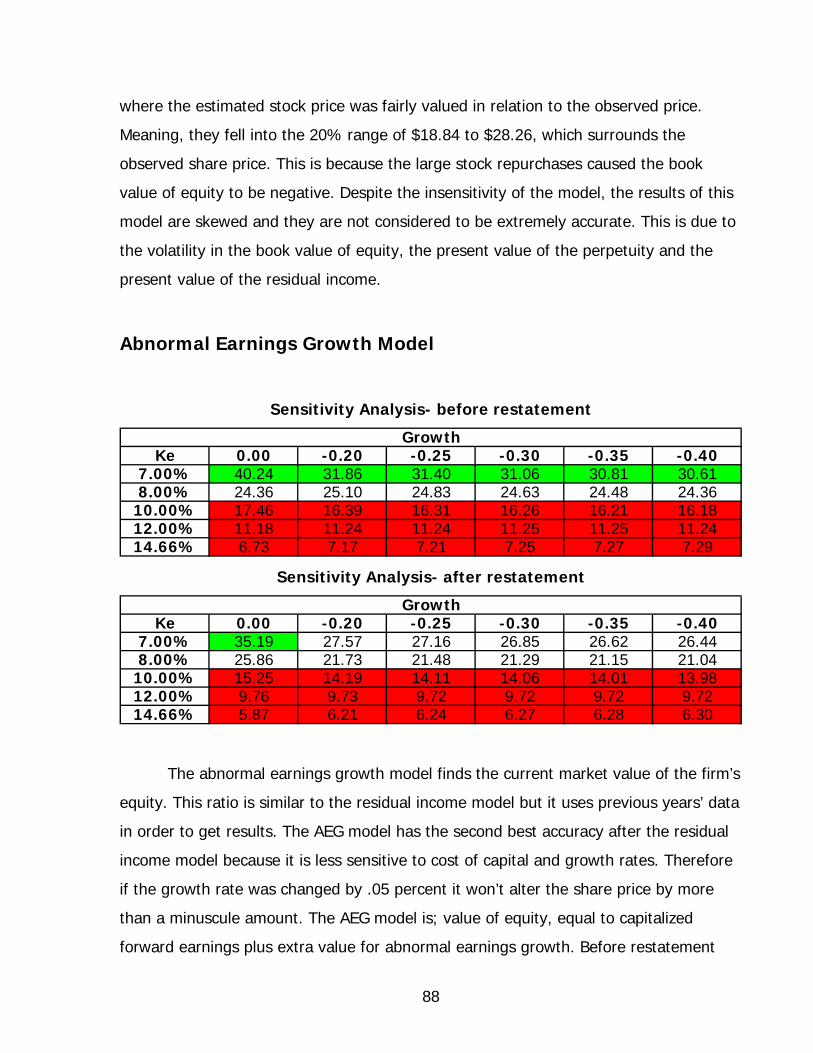
88
where the estimated stock price was fairly valued in relation to the observed price.
Meaning, they fell into the 20% range of $18.84 to $28.26, which surrounds the
observed share price. This is because the large stock repurchases caused the book
value of equity to be negative. Despite the insensitivity of the model, the results of this
model are skewed and they are not considered to be extremely accurate. This is due to
the volatility in the book value of equity, the present value of the perpetuity and the
present value of the residual income.
Abnormal Earnings Growth Model
Sensitivity Analysis- before restatement
Ke 0.00 -0.20 -0.25 -0.30 -0.35 -0.407.00% 40.24 31.86 31.40 31.06 30.81 30.618.00% 24.36 25.10 24.83 24.63 24.48 24.36
10.00% 17.46 16.39 16.31 16.26 16.21 16.1812.00% 11.18 11.24 11.24 11.25 11.25 11.2414.66% 6.73 7.17 7.21 7.25 7.27 7.29
Growth
Sensitivity Analysis- after restatement
Ke 0.00 -0.20 -0.25 -0.30 -0.35 -0.407.00% 35.19 27.57 27.16 26.85 26.62 26.448.00% 25.86 21.73 21.48 21.29 21.15 21.04
10.00% 15.25 14.19 14.11 14.06 14.01 13.9812.00% 9.76 9.73 9.72 9.72 9.72 9.7214.66% 5.87 6.21 6.24 6.27 6.28 6.30
Growth
The abnormal earnings growth model finds the current market value of the firm’s
equity. This ratio is similar to the residual income model but it uses previous years’ data
in order to get results. The AEG model has the second best accuracy after the residual
income model because it is less sensitive to cost of capital and growth rates. Therefore
if the growth rate was changed by .05 percent it won’t alter the share price by more
than a minuscule amount. The AEG model is; value of equity, equal to capitalized
forward earnings plus extra value for abnormal earnings growth. Before restatement

89
Sonics AEG share price was 39.46 at zero growth and a cost of capital of 7 percent.
After restatement they had a share price of 33.98 at zero growth and cost of capital of
7 percent. This drop in share prices was due to the change of capital leases to
operating leases and amortizing goodwill. Sonic is overvalued because its’ holding on to
these assets and creating intangible value of the firm.
Long-Run Residual Income Perpetuity Model
Sensitivity Analysis- Equity based on expected normal earnings 2008
Range +/- 20% ROE=.13 Ke 0.00 0.02 0.03 0.04 0.05 0.0618.84 7.00% 12.74 15.09 17.15 20.58 27.44 48.0228.26 8.00% 11.17 12.60 13.74 15.46 18.32 24.05
10.00% 8.96 9.48 9.85 10.34 11.03 12.0612.00% 7.49 7.60 7.68 7.78 7.90 8.0614.66% 6.15 6.03 5.95 5.86 5.75 5.61
Range +/- 20% Growth = .04 Ke 0.08 0.10 0.11 0.13 0.15 0.1718.84 7.00% 9.15 13.72 16.01 20.58 25.15 29.7328.26 8.00% 6.87 10.31 12.02 15.46 18.90 22.33
10.00% 4.59 6.89 8.04 10.34 12.64 14.9312.00% 3.46 5.18 6.05 7.78 9.51 11.2314.66% 2.60 3.91 4.56 5.86 7.16 8.46
Range +/- 20% Ke=.1466 Growth 0.08 0.10 0.11 0.13 0.15 0.1718.84 2.00% 3.29 4.39 4.93 6.03 7.13 8.2228.26 3.00% 2.98 4.17 4.76 5.95 7.14 8.33
4.00% 2.60 3.91 4.56 5.86 7.16 8.465.00% 2.16 3.59 4.31 5.75 7.18 8.626.00% 1.60 3.21 4.01 5.61 7.21 8.82
Growth
ROE
ROE
90
Sensitivity Analysis- Equity based on stock repurchase treated as dividend
Range +/- 20% ROE=.11 Ke 0.00 0.02 0.03 0.04 0.05 0.0618.84 7.00% 17.62 20.18 22.42 26.16 33.63 56.0528.26 8.00% 15.44 16.84 17.96 19.65 22.46 28.07
10.00% 12.39 12.67 12.87 13.14 13.52 14.0812.00% 10.36 10.17 10.04 9.88 9.68 9.4114.66% 8.51 8.06 7.78 7.45 7.04 6.55
Range +/- 20% Growth = .04 Ke 0.08 0.10 0.11 0.13 0.15 0.1718.84 7.00% 14.95 22.42 26.16 33.63 41.11 48.5828.26 8.00% 11.23 16.84 19.65 25.26 30.88 36.49
10.00% 7.51 11.26 13.14 16.89 20.65 24.4012.00% 5.65 8.47 9.88 12.71 15.53 18.3614.66% 4.26 6.38 7.45 9.57 11.70 13.83
Range +/- 20% Ke=.1466 Growth 0.08 0.10 0.11 0.13 0.15 0.1718.84 2.00% 5.37 7.17 8.06 9.85 11.65 13.4428.26 3.00% 4.86 6.81 7.78 9.73 11.67 13.62
4.00% 4.26 6.38 7.45 9.57 11.70 13.835.00% 3.52 5.87 7.04 9.39 11.74 14.096.00% 2.62 5.24 6.55 9.17 11.79 14.40
Growth
ROE
ROE
The long-run residual income perpetuity model is similar to the residual income
model. The main difference is that it uses return on equity with dividends in place of
net income time the cost of equity. Sonic is not a dividend paying company. In order to,
value Sonic with this model, we used two of the three alternative models discussed in
the Residual Income Models in order to arrive at a positive book value of equity. We felt
these models more accurately reflected the value of Sonic’s stock.
The long-run residual income perpetuity is computed; book value of equity
multiplied by one plus return on equity minus cost of equity divided by cost of equity
minus the growth rate. The model based on estimating equity from the expected
normal earnings is probably the most reliable method. As you can see from the
sensitivity tables, we do get some higher prices returned in the model. However, the
majority of prices support an assumption of being overvalued.
91
Analyst’s Recommendation
The consensus is that the Sonic Corporation is overvalued. This conclusion is
based on an industry analysis, accounting analysis, financial analysis, forecasting future
financial statements, method of comparables and results of intrinsic valuation models.
The results of the analysis are based on industry averages of the quick service
industry, including Burger King, McDonald’s, Jack in the Box, Steak and Shake, and
Wendy’s. These specific competitors were chosen because they were a good
representation of Sonic’s competitors based on their size and business models. Sonic
outperformed the competition in regards to the gross profit margin, net profit margin,
and growth rate. The growth rate for the industry is approximately 5%, while Sonic’s
growth rate has been sustained at over 11% for the last 6 years. This is significant
because the sustained growth is essential to a successful business strategy in the quick-
service industry.
Sonic is similar to their competitor’s when reporting financial data regarding
operating leases and goodwill. The operating leases should be reported as capital leases
and be shown on the balance sheet; however, most of the industry participants list
them off of the balance sheet. Additionally, Sonic carries a large amount of goodwill on
the balance sheet and does not decrease goodwill at a quick enough pace. These two
major inconsistencies required a restatement of the financial statements. Therefore, the
financial statements are reported as both before restatement and after restatement.
Although these irregularities appeared, there were no significant problems with Sonic’s
accounting disclosure.
Sonic’s method of comparables results illustrates that their prices ranged from
overvalued to fairly-valued. The price to book ratio is not included in the method of
comparables because Sonic has a negative book value of equity. However, a
workaround price to book method was used to calculate a P/B share price by treating
the excess over par value of the treasury stock as a dividend. The dividend to price
ratio was not included in the method of comparables because Sonic does not pay a
92
dividend. Furthermore, the method of comparables is not the best valuation method
because it does not use any intrinsic information to formulate a share price. The
intrinsic valuation methods, which use a theoretical base, overwhelmingly suggest that
Sonic’s observed market price of $23.37 is overvalued. The dividend discount model
was not used because Sonic does not pay a dividend. The free cash flow model
returned some fairly valued and under valued prices, however, it was mostly overvalued
prices. Even the less sensitive residual income model returned predominately
overvalued prices. The long run residual income model and the abnormal earnings
growth model also returned overvalued prices. Although there were some prices
returned showing Sonic to be fairly valued, or undervalued, the majority of models
support our premise that Sonic is overvalued. We suggest that current investors
consider selling their shares of the Sonic Corporation.
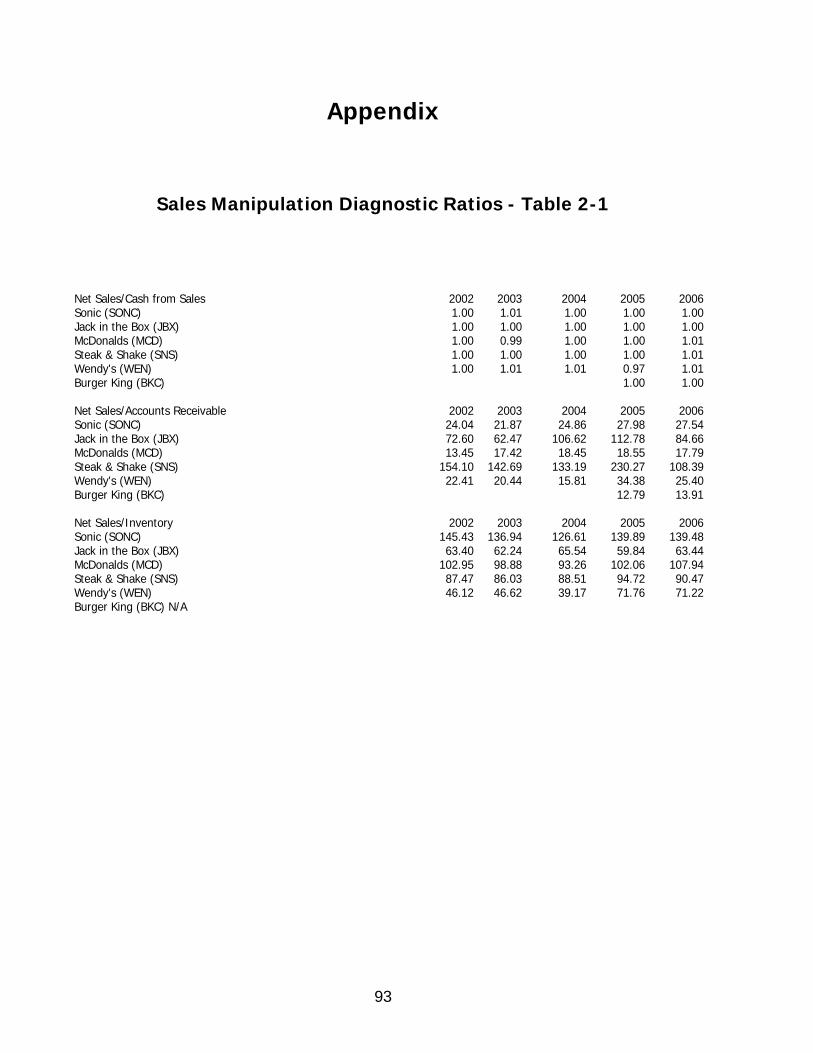
93
Appendix
Sales Manipulation Diagnostic Ratios - Table 2-1 Net Sales/Cash from Sales 2002 2003 2004 2005 2006Sonic (SONC) 1.00 1.01 1.00 1.00 1.00Jack in the Box (JBX) 1.00 1.00 1.00 1.00 1.00McDonalds (MCD) 1.00 0.99 1.00 1.00 1.01Steak & Shake (SNS) 1.00 1.00 1.00 1.00 1.01Wendy's (WEN) 1.00 1.01 1.01 0.97 1.01Burger King (BKC) 1.00 1.00
Net Sales/Accounts Receivable 2002 2003 2004 2005 2006Sonic (SONC) 24.04 21.87 24.86 27.98 27.54Jack in the Box (JBX) 72.60 62.47 106.62 112.78 84.66McDonalds (MCD) 13.45 17.42 18.45 18.55 17.79Steak & Shake (SNS) 154.10 142.69 133.19 230.27 108.39Wendy's (WEN) 22.41 20.44 15.81 34.38 25.40Burger King (BKC) 12.79 13.91
Net Sales/Inventory 2002 2003 2004 2005 2006Sonic (SONC) 145.43 136.94 126.61 139.89 139.48Jack in the Box (JBX) 63.40 62.24 65.54 59.84 63.44McDonalds (MCD) 102.95 98.88 93.26 102.06 107.94Steak & Shake (SNS) 87.47 86.03 88.51 94.72 90.47Wendy's (WEN) 46.12 46.62 39.17 71.76 71.22Burger King (BKC) N/A
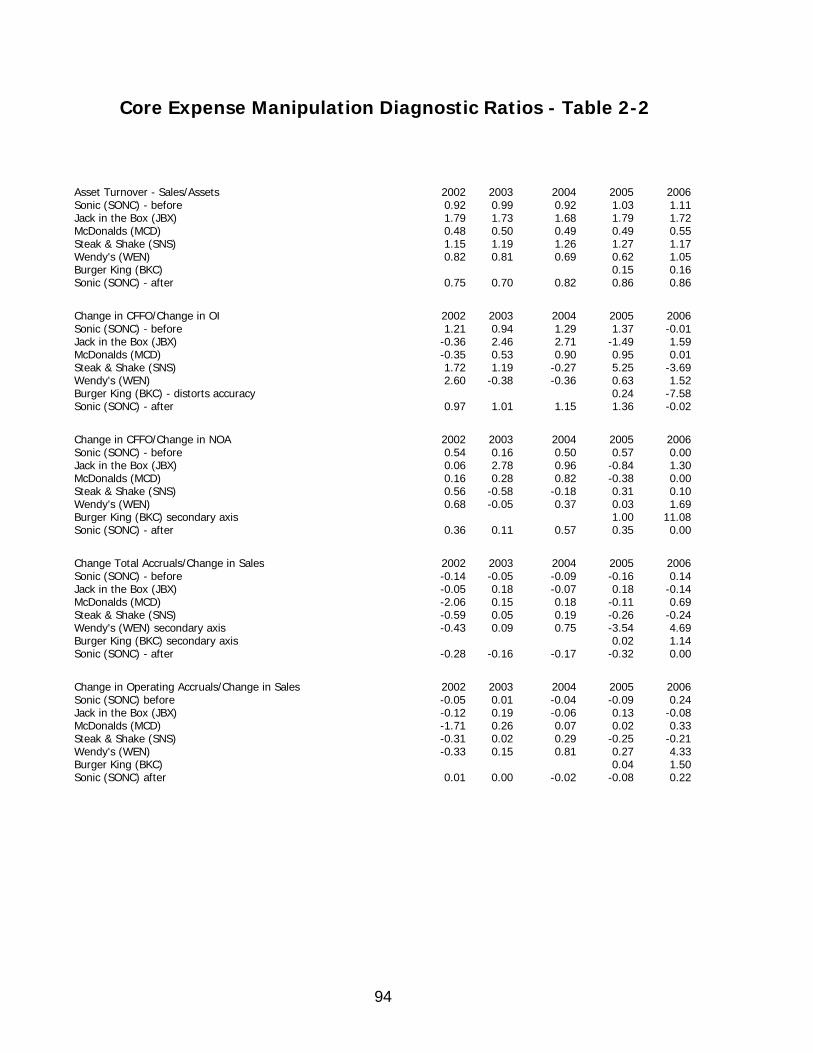
94
Core Expense Manipulation Diagnostic Ratios - Table 2-2 Asset Turnover - Sales/Assets 2002 2003 2004 2005 2006Sonic (SONC) - before 0.92 0.99 0.92 1.03 1.11Jack in the Box (JBX) 1.79 1.73 1.68 1.79 1.72McDonalds (MCD) 0.48 0.50 0.49 0.49 0.55Steak & Shake (SNS) 1.15 1.19 1.26 1.27 1.17Wendy's (WEN) 0.82 0.81 0.69 0.62 1.05Burger King (BKC) 0.15 0.16Sonic (SONC) - after 0.75 0.70 0.82 0.86 0.86 Change in CFFO/Change in OI 2002 2003 2004 2005 2006Sonic (SONC) - before 1.21 0.94 1.29 1.37 -0.01Jack in the Box (JBX) -0.36 2.46 2.71 -1.49 1.59McDonalds (MCD) -0.35 0.53 0.90 0.95 0.01Steak & Shake (SNS) 1.72 1.19 -0.27 5.25 -3.69Wendy's (WEN) 2.60 -0.38 -0.36 0.63 1.52Burger King (BKC) - distorts accuracy 0.24 -7.58Sonic (SONC) - after 0.97 1.01 1.15 1.36 -0.02 Change in CFFO/Change in NOA 2002 2003 2004 2005 2006Sonic (SONC) - before 0.54 0.16 0.50 0.57 0.00Jack in the Box (JBX) 0.06 2.78 0.96 -0.84 1.30McDonalds (MCD) 0.16 0.28 0.82 -0.38 0.00Steak & Shake (SNS) 0.56 -0.58 -0.18 0.31 0.10Wendy's (WEN) 0.68 -0.05 0.37 0.03 1.69Burger King (BKC) secondary axis 1.00 11.08Sonic (SONC) - after 0.36 0.11 0.57 0.35 0.00 Change Total Accruals/Change in Sales 2002 2003 2004 2005 2006Sonic (SONC) - before -0.14 -0.05 -0.09 -0.16 0.14Jack in the Box (JBX) -0.05 0.18 -0.07 0.18 -0.14McDonalds (MCD) -2.06 0.15 0.18 -0.11 0.69Steak & Shake (SNS) -0.59 0.05 0.19 -0.26 -0.24Wendy's (WEN) secondary axis -0.43 0.09 0.75 -3.54 4.69Burger King (BKC) secondary axis 0.02 1.14Sonic (SONC) - after -0.28 -0.16 -0.17 -0.32 0.00 Change in Operating Accruals/Change in Sales 2002 2003 2004 2005 2006Sonic (SONC) before -0.05 0.01 -0.04 -0.09 0.24Jack in the Box (JBX) -0.12 0.19 -0.06 0.13 -0.08McDonalds (MCD) -1.71 0.26 0.07 0.02 0.33Steak & Shake (SNS) -0.31 0.02 0.29 -0.25 -0.21Wendy's (WEN) -0.33 0.15 0.81 0.27 4.33Burger King (BKC) 0.04 1.50Sonic (SONC) after 0.01 0.00 -0.02 -0.08 0.22
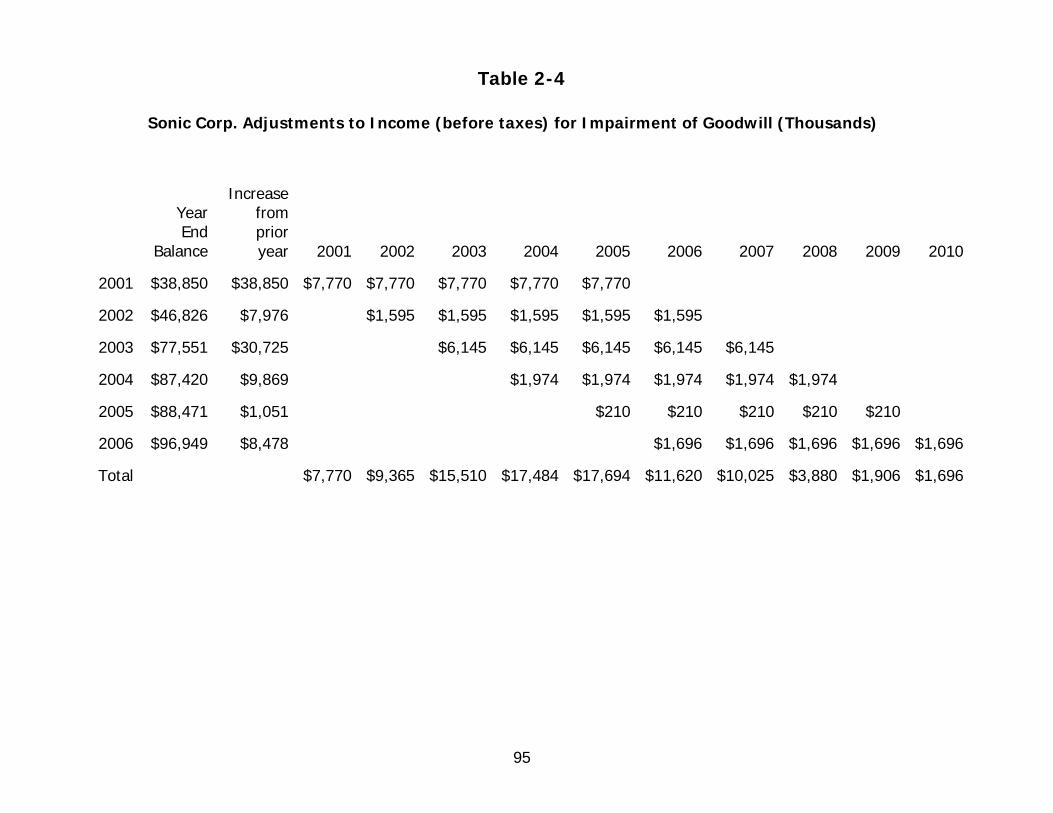
95
Table 2-4
Sonic Corp. Adjustments to Income (before taxes) for Impairment of Goodwill (Thousands)
Year End
Balance
Increase from prior year 2001 2002 2003 2004 2005 2006 2007 2008 2009 2010
2001 $38,850 $38,850 $7,770 $7,770 $7,770 $7,770 $7,770
2002 $46,826 $7,976 $1,595 $1,595 $1,595 $1,595 $1,595
2003 $77,551 $30,725 $6,145 $6,145 $6,145 $6,145 $6,145
2004 $87,420 $9,869 $1,974 $1,974 $1,974 $1,974 $1,974
2005 $88,471 $1,051 $210 $210 $210 $210 $210
2006 $96,949 $8,478 $1,696 $1,696 $1,696 $1,696 $1,696
Total $7,770 $9,365 $15,510 $17,484 $17,694 $11,620 $10,025 $3,880 $1,906 $1,696
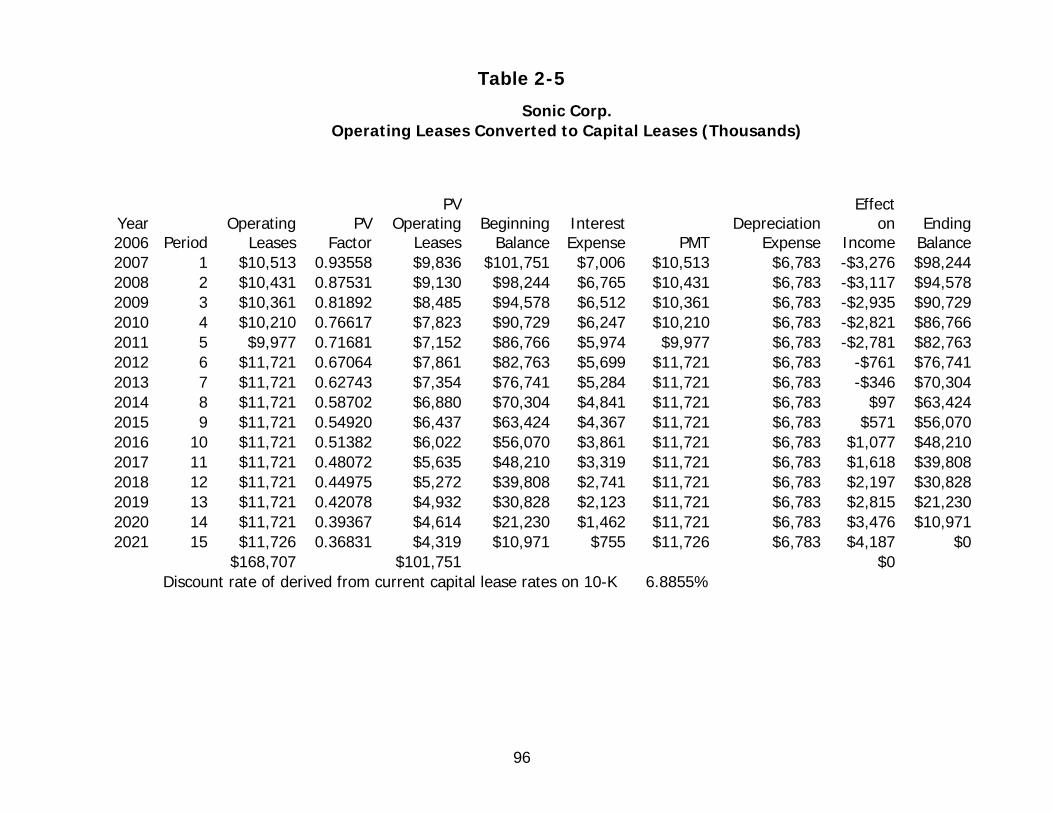
96
Table 2-5
Sonic Corp. Operating Leases Converted to Capital Leases (Thousands)
Year 2006 Period
Operating Leases
PV Factor
PV Operating
LeasesBeginning
BalanceInterest Expense PMT
Depreciation Expense
Effect on
IncomeEnding
Balance2007 1 $10,513 0.93558 $9,836 $101,751 $7,006 $10,513 $6,783 -$3,276 $98,2442008 2 $10,431 0.87531 $9,130 $98,244 $6,765 $10,431 $6,783 -$3,117 $94,5782009 3 $10,361 0.81892 $8,485 $94,578 $6,512 $10,361 $6,783 -$2,935 $90,7292010 4 $10,210 0.76617 $7,823 $90,729 $6,247 $10,210 $6,783 -$2,821 $86,7662011 5 $9,977 0.71681 $7,152 $86,766 $5,974 $9,977 $6,783 -$2,781 $82,7632012 6 $11,721 0.67064 $7,861 $82,763 $5,699 $11,721 $6,783 -$761 $76,7412013 7 $11,721 0.62743 $7,354 $76,741 $5,284 $11,721 $6,783 -$346 $70,3042014 8 $11,721 0.58702 $6,880 $70,304 $4,841 $11,721 $6,783 $97 $63,4242015 9 $11,721 0.54920 $6,437 $63,424 $4,367 $11,721 $6,783 $571 $56,0702016 10 $11,721 0.51382 $6,022 $56,070 $3,861 $11,721 $6,783 $1,077 $48,2102017 11 $11,721 0.48072 $5,635 $48,210 $3,319 $11,721 $6,783 $1,618 $39,8082018 12 $11,721 0.44975 $5,272 $39,808 $2,741 $11,721 $6,783 $2,197 $30,8282019 13 $11,721 0.42078 $4,932 $30,828 $2,123 $11,721 $6,783 $2,815 $21,2302020 14 $11,721 0.39367 $4,614 $21,230 $1,462 $11,721 $6,783 $3,476 $10,9712021 15 $11,726 0.36831 $4,319 $10,971 $755 $11,726 $6,783 $4,187 $0
$168,707 $101,751 $0 Discount rate of derived from current capital lease rates on 10-K 6.8855%
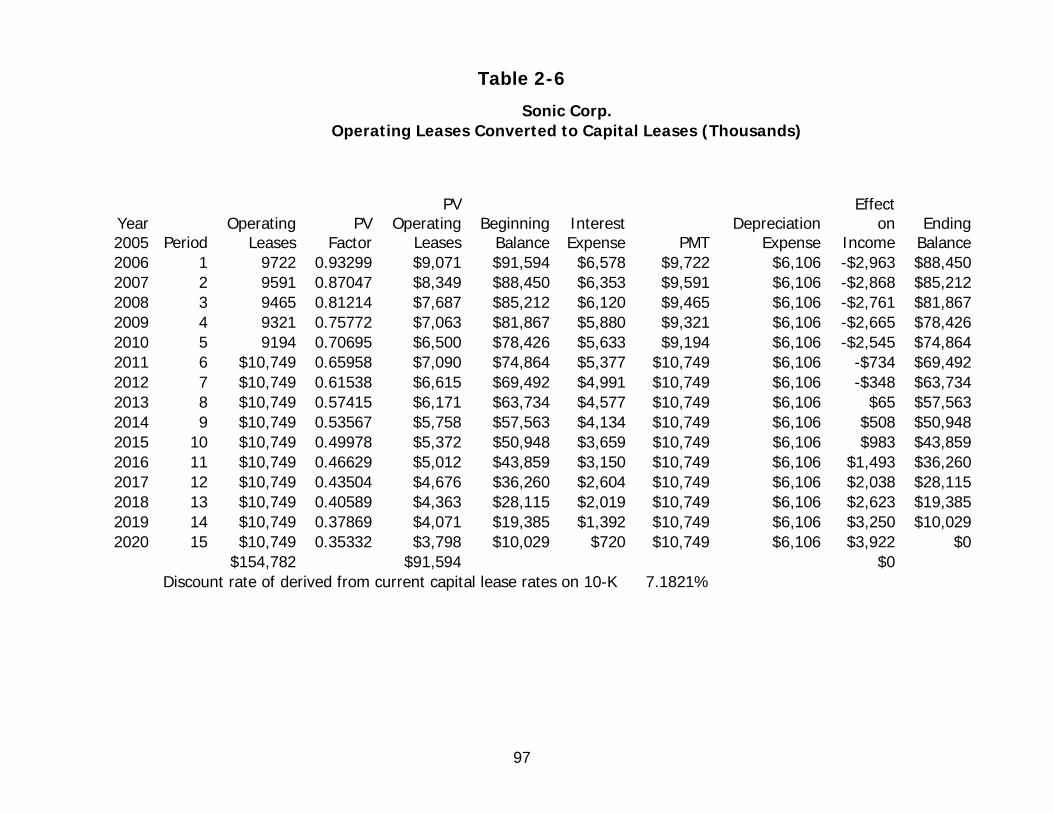
97
Table 2-6
Sonic Corp. Operating Leases Converted to Capital Leases (Thousands)
Year 2005 Period
Operating Leases
PV Factor
PV Operating
LeasesBeginning
BalanceInterest Expense PMT
Depreciation Expense
Effect on
IncomeEnding
Balance2006 1 9722 0.93299 $9,071 $91,594 $6,578 $9,722 $6,106 -$2,963 $88,4502007 2 9591 0.87047 $8,349 $88,450 $6,353 $9,591 $6,106 -$2,868 $85,2122008 3 9465 0.81214 $7,687 $85,212 $6,120 $9,465 $6,106 -$2,761 $81,8672009 4 9321 0.75772 $7,063 $81,867 $5,880 $9,321 $6,106 -$2,665 $78,4262010 5 9194 0.70695 $6,500 $78,426 $5,633 $9,194 $6,106 -$2,545 $74,8642011 6 $10,749 0.65958 $7,090 $74,864 $5,377 $10,749 $6,106 -$734 $69,4922012 7 $10,749 0.61538 $6,615 $69,492 $4,991 $10,749 $6,106 -$348 $63,7342013 8 $10,749 0.57415 $6,171 $63,734 $4,577 $10,749 $6,106 $65 $57,5632014 9 $10,749 0.53567 $5,758 $57,563 $4,134 $10,749 $6,106 $508 $50,9482015 10 $10,749 0.49978 $5,372 $50,948 $3,659 $10,749 $6,106 $983 $43,8592016 11 $10,749 0.46629 $5,012 $43,859 $3,150 $10,749 $6,106 $1,493 $36,2602017 12 $10,749 0.43504 $4,676 $36,260 $2,604 $10,749 $6,106 $2,038 $28,1152018 13 $10,749 0.40589 $4,363 $28,115 $2,019 $10,749 $6,106 $2,623 $19,3852019 14 $10,749 0.37869 $4,071 $19,385 $1,392 $10,749 $6,106 $3,250 $10,0292020 15 $10,749 0.35332 $3,798 $10,029 $720 $10,749 $6,106 $3,922 $0
$154,782 $91,594 $0 Discount rate of derived from current capital lease rates on 10-K 7.1821%
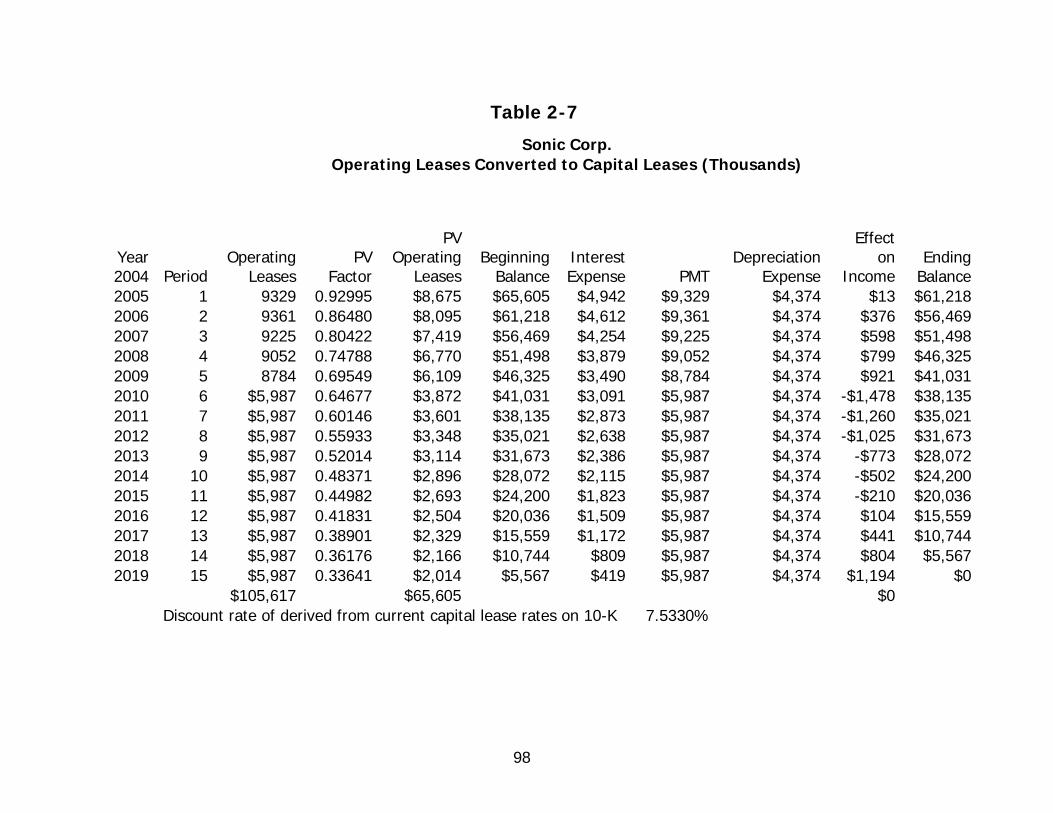
98
Table 2-7
Sonic Corp. Operating Leases Converted to Capital Leases (Thousands)
Year 2004 Period
Operating Leases
PV Factor
PV Operating
LeasesBeginning
BalanceInterest Expense PMT
Depreciation Expense
Effect on
IncomeEnding
Balance2005 1 9329 0.92995 $8,675 $65,605 $4,942 $9,329 $4,374 $13 $61,2182006 2 9361 0.86480 $8,095 $61,218 $4,612 $9,361 $4,374 $376 $56,4692007 3 9225 0.80422 $7,419 $56,469 $4,254 $9,225 $4,374 $598 $51,4982008 4 9052 0.74788 $6,770 $51,498 $3,879 $9,052 $4,374 $799 $46,3252009 5 8784 0.69549 $6,109 $46,325 $3,490 $8,784 $4,374 $921 $41,0312010 6 $5,987 0.64677 $3,872 $41,031 $3,091 $5,987 $4,374 -$1,478 $38,1352011 7 $5,987 0.60146 $3,601 $38,135 $2,873 $5,987 $4,374 -$1,260 $35,0212012 8 $5,987 0.55933 $3,348 $35,021 $2,638 $5,987 $4,374 -$1,025 $31,6732013 9 $5,987 0.52014 $3,114 $31,673 $2,386 $5,987 $4,374 -$773 $28,0722014 10 $5,987 0.48371 $2,896 $28,072 $2,115 $5,987 $4,374 -$502 $24,2002015 11 $5,987 0.44982 $2,693 $24,200 $1,823 $5,987 $4,374 -$210 $20,0362016 12 $5,987 0.41831 $2,504 $20,036 $1,509 $5,987 $4,374 $104 $15,5592017 13 $5,987 0.38901 $2,329 $15,559 $1,172 $5,987 $4,374 $441 $10,7442018 14 $5,987 0.36176 $2,166 $10,744 $809 $5,987 $4,374 $804 $5,5672019 15 $5,987 0.33641 $2,014 $5,567 $419 $5,987 $4,374 $1,194 $0
$105,617 $65,605 $0 Discount rate of derived from current capital lease rates on 10-K 7.5330%
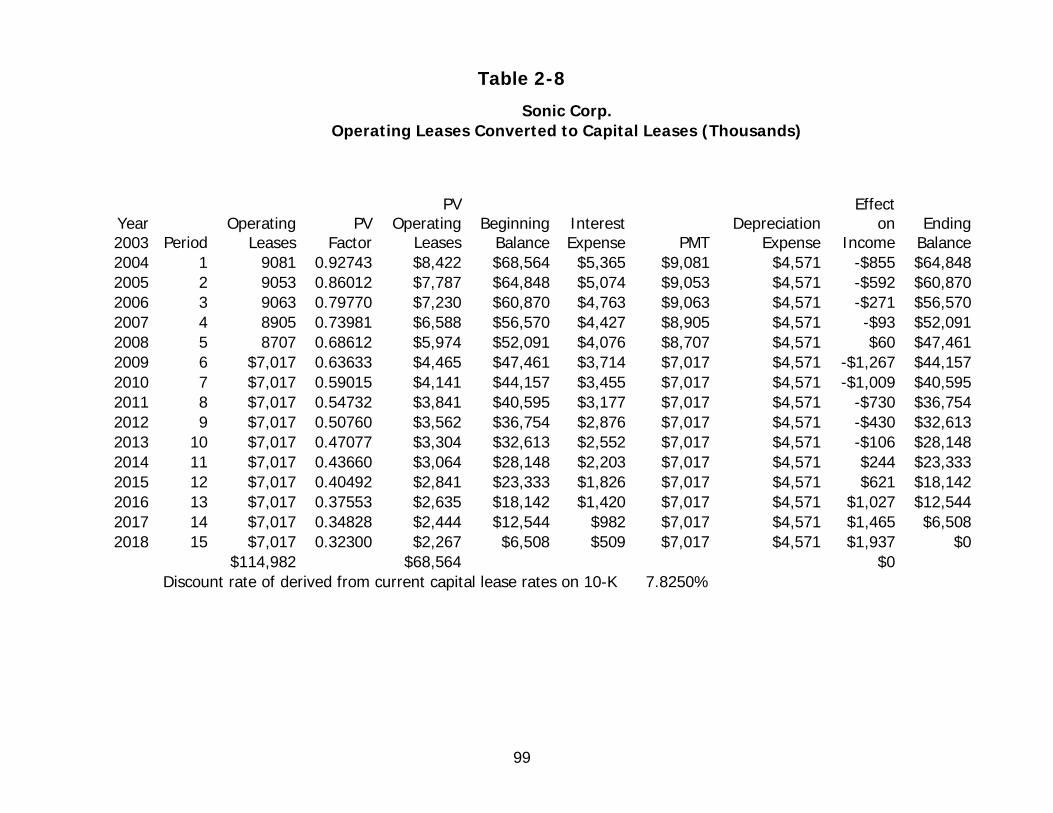
99
Table 2-8
Sonic Corp. Operating Leases Converted to Capital Leases (Thousands)
Year 2003 Period
Operating Leases
PV Factor
PV Operating
LeasesBeginning
BalanceInterest Expense PMT
Depreciation Expense
Effect on
IncomeEnding
Balance2004 1 9081 0.92743 $8,422 $68,564 $5,365 $9,081 $4,571 -$855 $64,8482005 2 9053 0.86012 $7,787 $64,848 $5,074 $9,053 $4,571 -$592 $60,8702006 3 9063 0.79770 $7,230 $60,870 $4,763 $9,063 $4,571 -$271 $56,5702007 4 8905 0.73981 $6,588 $56,570 $4,427 $8,905 $4,571 -$93 $52,0912008 5 8707 0.68612 $5,974 $52,091 $4,076 $8,707 $4,571 $60 $47,4612009 6 $7,017 0.63633 $4,465 $47,461 $3,714 $7,017 $4,571 -$1,267 $44,1572010 7 $7,017 0.59015 $4,141 $44,157 $3,455 $7,017 $4,571 -$1,009 $40,5952011 8 $7,017 0.54732 $3,841 $40,595 $3,177 $7,017 $4,571 -$730 $36,7542012 9 $7,017 0.50760 $3,562 $36,754 $2,876 $7,017 $4,571 -$430 $32,6132013 10 $7,017 0.47077 $3,304 $32,613 $2,552 $7,017 $4,571 -$106 $28,1482014 11 $7,017 0.43660 $3,064 $28,148 $2,203 $7,017 $4,571 $244 $23,3332015 12 $7,017 0.40492 $2,841 $23,333 $1,826 $7,017 $4,571 $621 $18,1422016 13 $7,017 0.37553 $2,635 $18,142 $1,420 $7,017 $4,571 $1,027 $12,5442017 14 $7,017 0.34828 $2,444 $12,544 $982 $7,017 $4,571 $1,465 $6,5082018 15 $7,017 0.32300 $2,267 $6,508 $509 $7,017 $4,571 $1,937 $0
$114,982 $68,564 $0 Discount rate of derived from current capital lease rates on 10-K 7.8250%
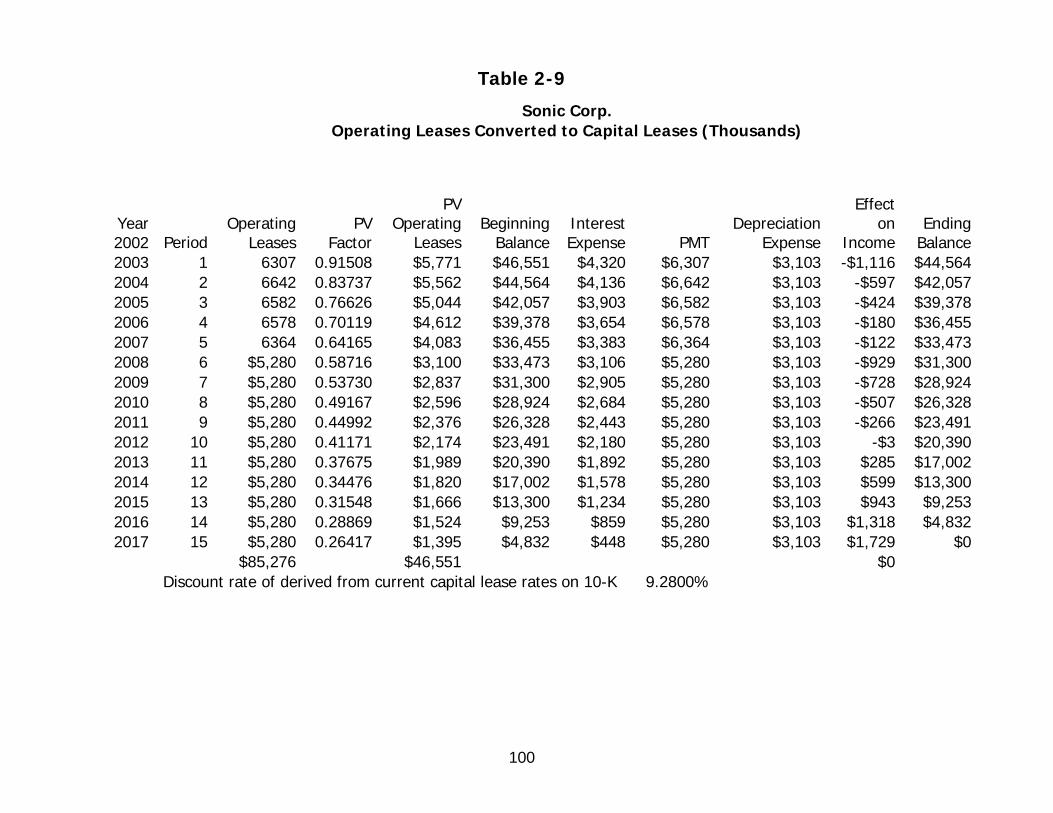
100
Table 2-9
Sonic Corp. Operating Leases Converted to Capital Leases (Thousands)
Year 2002 Period
Operating Leases
PV Factor
PV Operating
LeasesBeginning
BalanceInterest Expense PMT
Depreciation Expense
Effect on
IncomeEnding
Balance2003 1 6307 0.91508 $5,771 $46,551 $4,320 $6,307 $3,103 -$1,116 $44,5642004 2 6642 0.83737 $5,562 $44,564 $4,136 $6,642 $3,103 -$597 $42,0572005 3 6582 0.76626 $5,044 $42,057 $3,903 $6,582 $3,103 -$424 $39,3782006 4 6578 0.70119 $4,612 $39,378 $3,654 $6,578 $3,103 -$180 $36,4552007 5 6364 0.64165 $4,083 $36,455 $3,383 $6,364 $3,103 -$122 $33,4732008 6 $5,280 0.58716 $3,100 $33,473 $3,106 $5,280 $3,103 -$929 $31,3002009 7 $5,280 0.53730 $2,837 $31,300 $2,905 $5,280 $3,103 -$728 $28,9242010 8 $5,280 0.49167 $2,596 $28,924 $2,684 $5,280 $3,103 -$507 $26,3282011 9 $5,280 0.44992 $2,376 $26,328 $2,443 $5,280 $3,103 -$266 $23,4912012 10 $5,280 0.41171 $2,174 $23,491 $2,180 $5,280 $3,103 -$3 $20,3902013 11 $5,280 0.37675 $1,989 $20,390 $1,892 $5,280 $3,103 $285 $17,0022014 12 $5,280 0.34476 $1,820 $17,002 $1,578 $5,280 $3,103 $599 $13,3002015 13 $5,280 0.31548 $1,666 $13,300 $1,234 $5,280 $3,103 $943 $9,2532016 14 $5,280 0.28869 $1,524 $9,253 $859 $5,280 $3,103 $1,318 $4,8322017 15 $5,280 0.26417 $1,395 $4,832 $448 $5,280 $3,103 $1,729 $0
$85,276 $46,551 $0 Discount rate of derived from current capital lease rates on 10-K 9.2800%
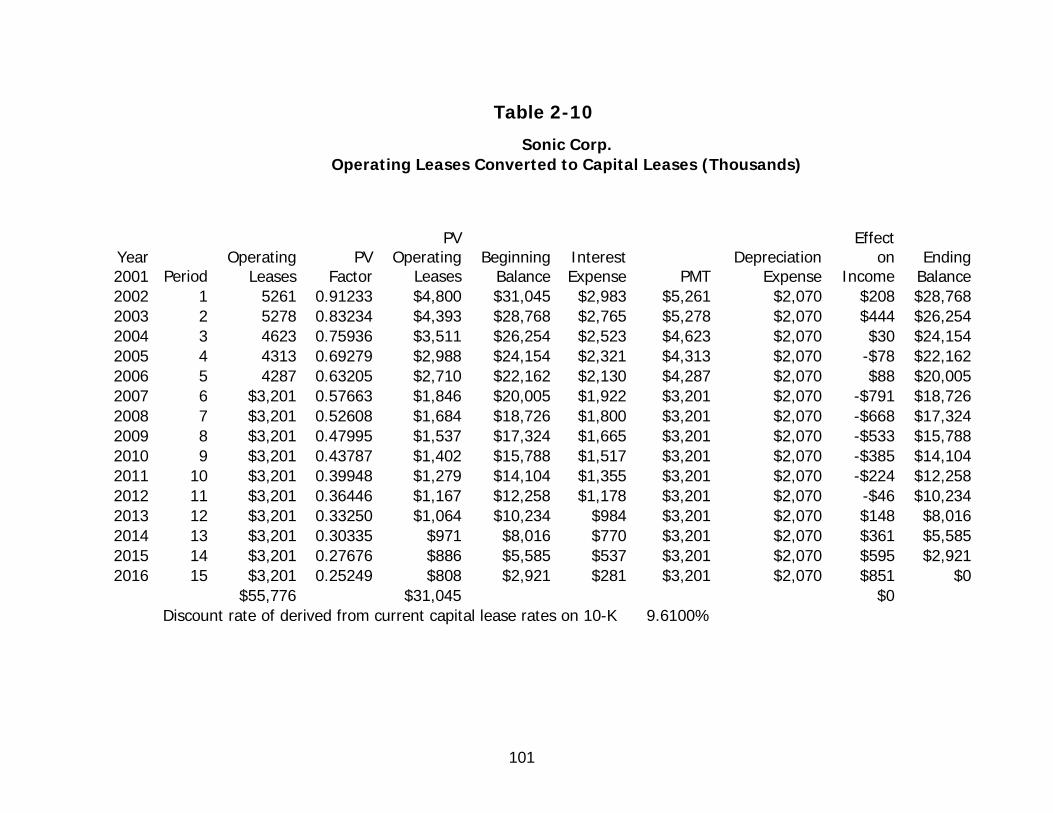
101
Table 2-10
Sonic Corp. Operating Leases Converted to Capital Leases (Thousands)
Year 2001 Period
Operating Leases
PV Factor
PV Operating
LeasesBeginning
BalanceInterest Expense PMT
Depreciation Expense
Effect on
IncomeEnding
Balance2002 1 5261 0.91233 $4,800 $31,045 $2,983 $5,261 $2,070 $208 $28,7682003 2 5278 0.83234 $4,393 $28,768 $2,765 $5,278 $2,070 $444 $26,2542004 3 4623 0.75936 $3,511 $26,254 $2,523 $4,623 $2,070 $30 $24,1542005 4 4313 0.69279 $2,988 $24,154 $2,321 $4,313 $2,070 -$78 $22,1622006 5 4287 0.63205 $2,710 $22,162 $2,130 $4,287 $2,070 $88 $20,0052007 6 $3,201 0.57663 $1,846 $20,005 $1,922 $3,201 $2,070 -$791 $18,7262008 7 $3,201 0.52608 $1,684 $18,726 $1,800 $3,201 $2,070 -$668 $17,3242009 8 $3,201 0.47995 $1,537 $17,324 $1,665 $3,201 $2,070 -$533 $15,7882010 9 $3,201 0.43787 $1,402 $15,788 $1,517 $3,201 $2,070 -$385 $14,1042011 10 $3,201 0.39948 $1,279 $14,104 $1,355 $3,201 $2,070 -$224 $12,2582012 11 $3,201 0.36446 $1,167 $12,258 $1,178 $3,201 $2,070 -$46 $10,2342013 12 $3,201 0.33250 $1,064 $10,234 $984 $3,201 $2,070 $148 $8,0162014 13 $3,201 0.30335 $971 $8,016 $770 $3,201 $2,070 $361 $5,5852015 14 $3,201 0.27676 $886 $5,585 $537 $3,201 $2,070 $595 $2,9212016 15 $3,201 0.25249 $808 $2,921 $281 $3,201 $2,070 $851 $0
$55,776 $31,045 $0 Discount rate of derived from current capital lease rates on 10-K 9.6100%
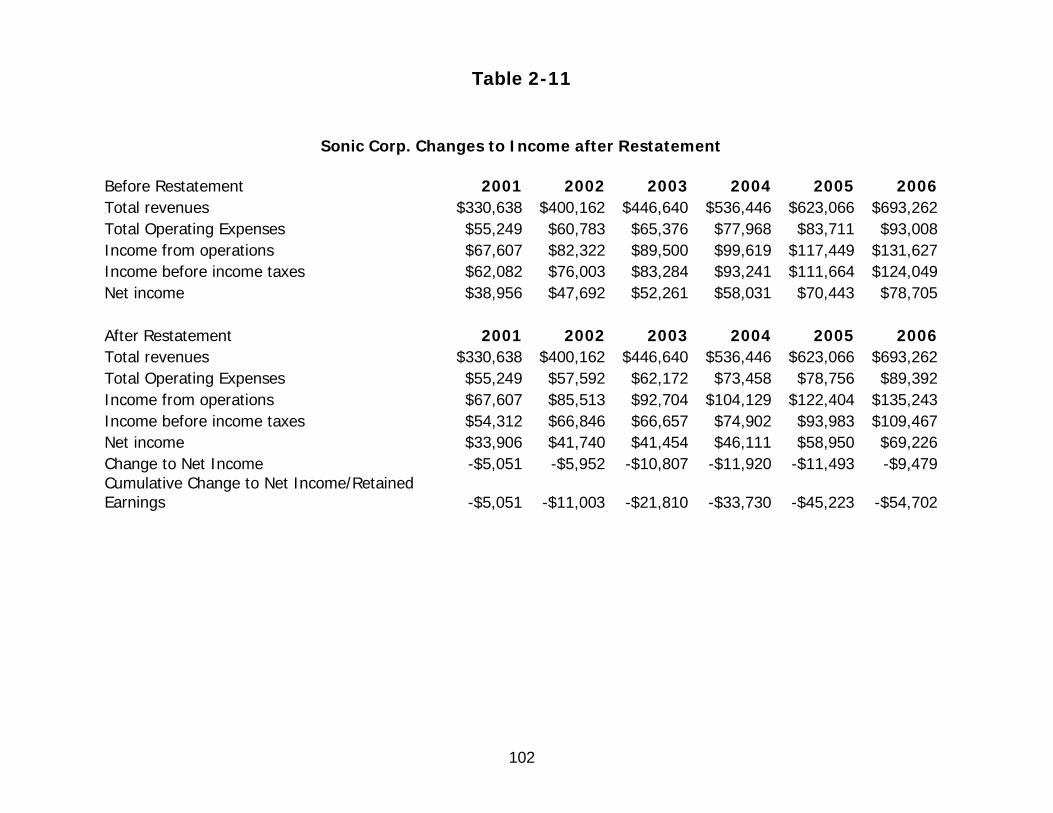
102
Table 2-11
Sonic Corp. Changes to Income after Restatement Before Restatement 2001 2002 2003 2004 2005 2006Total revenues $330,638 $400,162 $446,640 $536,446 $623,066 $693,262Total Operating Expenses $55,249 $60,783 $65,376 $77,968 $83,711 $93,008Income from operations $67,607 $82,322 $89,500 $99,619 $117,449 $131,627Income before income taxes $62,082 $76,003 $83,284 $93,241 $111,664 $124,049Net income $38,956 $47,692 $52,261 $58,031 $70,443 $78,705 After Restatement 2001 2002 2003 2004 2005 2006Total revenues $330,638 $400,162 $446,640 $536,446 $623,066 $693,262Total Operating Expenses $55,249 $57,592 $62,172 $73,458 $78,756 $89,392Income from operations $67,607 $85,513 $92,704 $104,129 $122,404 $135,243Income before income taxes $54,312 $66,846 $66,657 $74,902 $93,983 $109,467Net income $33,906 $41,740 $41,454 $46,111 $58,950 $69,226Change to Net Income -$5,051 -$5,952 -$10,807 -$11,920 -$11,493 -$9,479Cumulative Change to Net Income/Retained Earnings -$5,051 -$11,003 -$21,810 -$33,730 -$45,223 -$54,702
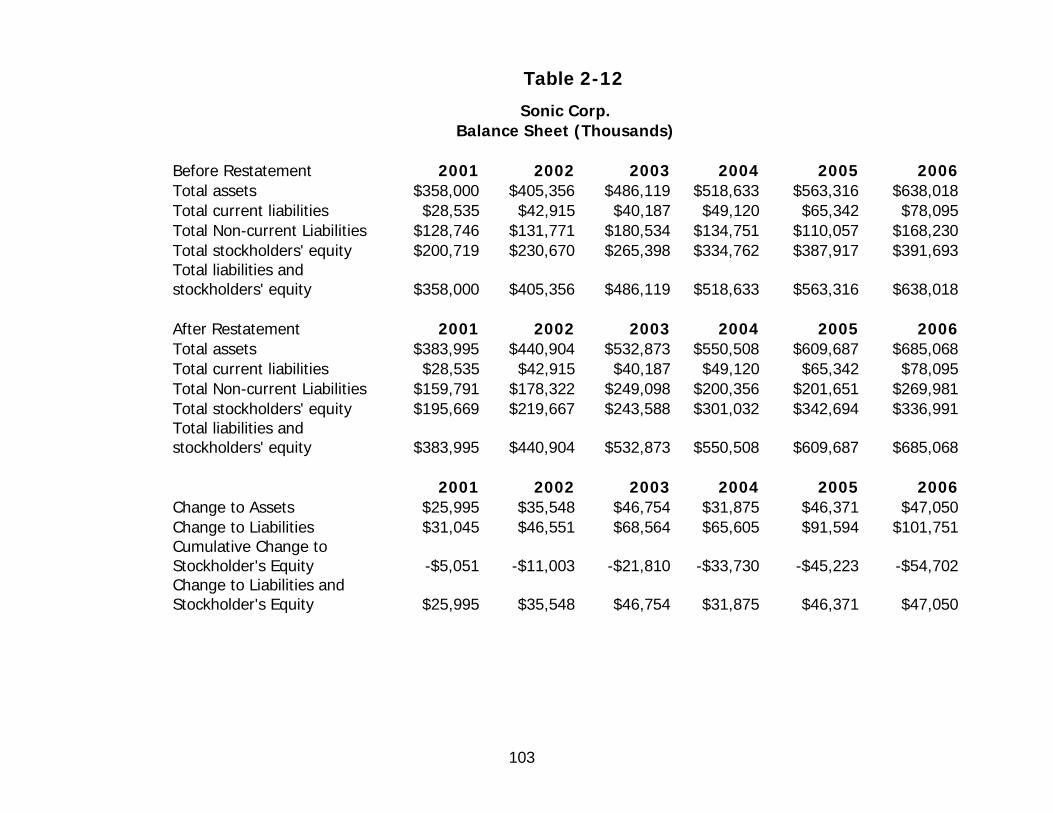
103
Table 2-12
Sonic Corp. Balance Sheet (Thousands)
Before Restatement 2001 2002 2003 2004 2005 2006Total assets $358,000 $405,356 $486,119 $518,633 $563,316 $638,018Total current liabilities $28,535 $42,915 $40,187 $49,120 $65,342 $78,095Total Non-current Liabilities $128,746 $131,771 $180,534 $134,751 $110,057 $168,230Total stockholders' equity $200,719 $230,670 $265,398 $334,762 $387,917 $391,693Total liabilities and stockholders' equity $358,000 $405,356 $486,119 $518,633 $563,316 $638,018 After Restatement 2001 2002 2003 2004 2005 2006Total assets $383,995 $440,904 $532,873 $550,508 $609,687 $685,068Total current liabilities $28,535 $42,915 $40,187 $49,120 $65,342 $78,095Total Non-current Liabilities $159,791 $178,322 $249,098 $200,356 $201,651 $269,981Total stockholders' equity $195,669 $219,667 $243,588 $301,032 $342,694 $336,991Total liabilities and stockholders' equity $383,995 $440,904 $532,873 $550,508 $609,687 $685,068 2001 2002 2003 2004 2005 2006Change to Assets $25,995 $35,548 $46,754 $31,875 $46,371 $47,050Change to Liabilities $31,045 $46,551 $68,564 $65,605 $91,594 $101,751Cumulative Change to Stockholder's Equity -$5,051 -$11,003 -$21,810 -$33,730 -$45,223 -$54,702Change to Liabilities and Stockholder's Equity $25,995 $35,548 $46,754 $31,875 $46,371 $47,050
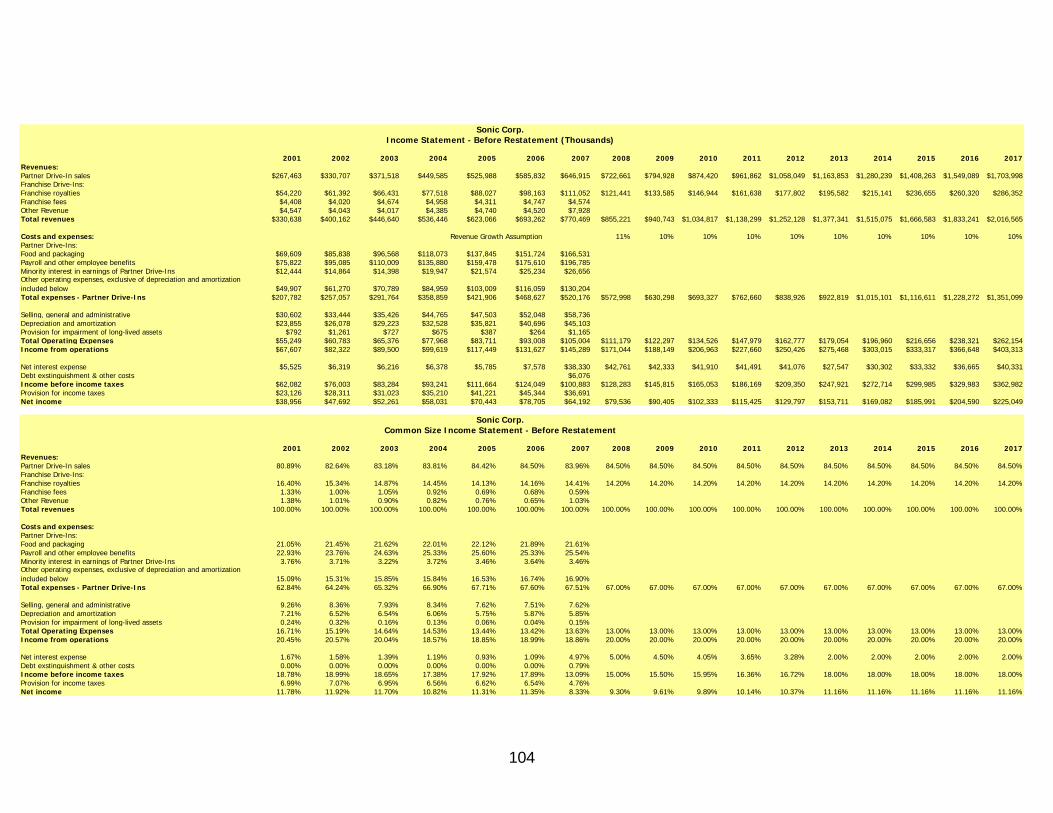
104
2001 2002 2003 2004 2005 2006 2007 2008 2009 2010 2011 2012 2013 2014 2015 2016 2017Revenues:Partner Drive-In sales $267,463 $330,707 $371,518 $449,585 $525,988 $585,832 $646,915 $722,661 $794,928 $874,420 $961,862 $1,058,049 $1,163,853 $1,280,239 $1,408,263 $1,549,089 $1,703,998Franchise Drive-Ins:Franchise royalties $54,220 $61,392 $66,431 $77,518 $88,027 $98,163 $111,052 $121,441 $133,585 $146,944 $161,638 $177,802 $195,582 $215,141 $236,655 $260,320 $286,352Franchise fees $4,408 $4,020 $4,674 $4,958 $4,311 $4,747 $4,574Other Revenue $4,547 $4,043 $4,017 $4,385 $4,740 $4,520 $7,928Total revenues $330,638 $400,162 $446,640 $536,446 $623,066 $693,262 $770,469 $855,221 $940,743 $1,034,817 $1,138,299 $1,252,128 $1,377,341 $1,515,075 $1,666,583 $1,833,241 $2,016,565
Costs and expenses: Revenue Growth Assumption 11% 10% 10% 10% 10% 10% 10% 10% 10% 10%Partner Drive-Ins:Food and packaging $69,609 $85,838 $96,568 $118,073 $137,845 $151,724 $166,531Payroll and other employee benefits $75,822 $95,085 $110,009 $135,880 $159,478 $175,610 $196,785Minority interest in earnings of Partner Drive-Ins $12,444 $14,864 $14,398 $19,947 $21,574 $25,234 $26,656Other operating expenses, exclusive of depreciation and amortization included below $49,907 $61,270 $70,789 $84,959 $103,009 $116,059 $130,204Total expenses - Partner Drive-Ins $207,782 $257,057 $291,764 $358,859 $421,906 $468,627 $520,176 $572,998 $630,298 $693,327 $762,660 $838,926 $922,819 $1,015,101 $1,116,611 $1,228,272 $1,351,099
Selling, general and administrative $30,602 $33,444 $35,426 $44,765 $47,503 $52,048 $58,736Depreciation and amortization $23,855 $26,078 $29,223 $32,528 $35,821 $40,696 $45,103Provision for impairment of long-lived assets $792 $1,261 $727 $675 $387 $264 $1,165Total Operating Expenses $55,249 $60,783 $65,376 $77,968 $83,711 $93,008 $105,004 $111,179 $122,297 $134,526 $147,979 $162,777 $179,054 $196,960 $216,656 $238,321 $262,154Income from operations $67,607 $82,322 $89,500 $99,619 $117,449 $131,627 $145,289 $171,044 $188,149 $206,963 $227,660 $250,426 $275,468 $303,015 $333,317 $366,648 $403,313
Net interest expense $5,525 $6,319 $6,216 $6,378 $5,785 $7,578 $38,330 $42,761 $42,333 $41,910 $41,491 $41,076 $27,547 $30,302 $33,332 $36,665 $40,331Debt exstinguishment & other costs $6,076Income before income taxes $62,082 $76,003 $83,284 $93,241 $111,664 $124,049 $100,883 $128,283 $145,815 $165,053 $186,169 $209,350 $247,921 $272,714 $299,985 $329,983 $362,982Provision for income taxes $23,126 $28,311 $31,023 $35,210 $41,221 $45,344 $36,691Net income $38,956 $47,692 $52,261 $58,031 $70,443 $78,705 $64,192 $79,536 $90,405 $102,333 $115,425 $129,797 $153,711 $169,082 $185,991 $204,590 $225,049
2001 2002 2003 2004 2005 2006 2007 2008 2009 2010 2011 2012 2013 2014 2015 2016 2017Revenues:Partner Drive-In sales 80.89% 82.64% 83.18% 83.81% 84.42% 84.50% 83.96% 84.50% 84.50% 84.50% 84.50% 84.50% 84.50% 84.50% 84.50% 84.50% 84.50%Franchise Drive-Ins:Franchise royalties 16.40% 15.34% 14.87% 14.45% 14.13% 14.16% 14.41% 14.20% 14.20% 14.20% 14.20% 14.20% 14.20% 14.20% 14.20% 14.20% 14.20%Franchise fees 1.33% 1.00% 1.05% 0.92% 0.69% 0.68% 0.59%Other Revenue 1.38% 1.01% 0.90% 0.82% 0.76% 0.65% 1.03%Total revenues 100.00% 100.00% 100.00% 100.00% 100.00% 100.00% 100.00% 100.00% 100.00% 100.00% 100.00% 100.00% 100.00% 100.00% 100.00% 100.00% 100.00%
Costs and expenses:Partner Drive-Ins:Food and packaging 21.05% 21.45% 21.62% 22.01% 22.12% 21.89% 21.61%Payroll and other employee benefits 22.93% 23.76% 24.63% 25.33% 25.60% 25.33% 25.54%Minority interest in earnings of Partner Drive-Ins 3.76% 3.71% 3.22% 3.72% 3.46% 3.64% 3.46%Other operating expenses, exclusive of depreciation and amortization included below 15.09% 15.31% 15.85% 15.84% 16.53% 16.74% 16.90%Total expenses - Partner Drive-Ins 62.84% 64.24% 65.32% 66.90% 67.71% 67.60% 67.51% 67.00% 67.00% 67.00% 67.00% 67.00% 67.00% 67.00% 67.00% 67.00% 67.00%
Selling, general and administrative 9.26% 8.36% 7.93% 8.34% 7.62% 7.51% 7.62%Depreciation and amortization 7.21% 6.52% 6.54% 6.06% 5.75% 5.87% 5.85%Provision for impairment of long-lived assets 0.24% 0.32% 0.16% 0.13% 0.06% 0.04% 0.15%Total Operating Expenses 16.71% 15.19% 14.64% 14.53% 13.44% 13.42% 13.63% 13.00% 13.00% 13.00% 13.00% 13.00% 13.00% 13.00% 13.00% 13.00% 13.00%Income from operations 20.45% 20.57% 20.04% 18.57% 18.85% 18.99% 18.86% 20.00% 20.00% 20.00% 20.00% 20.00% 20.00% 20.00% 20.00% 20.00% 20.00%
Net interest expense 1.67% 1.58% 1.39% 1.19% 0.93% 1.09% 4.97% 5.00% 4.50% 4.05% 3.65% 3.28% 2.00% 2.00% 2.00% 2.00% 2.00%Debt exstinguishment & other costs 0.00% 0.00% 0.00% 0.00% 0.00% 0.00% 0.79%Income before income taxes 18.78% 18.99% 18.65% 17.38% 17.92% 17.89% 13.09% 15.00% 15.50% 15.95% 16.36% 16.72% 18.00% 18.00% 18.00% 18.00% 18.00%Provision for income taxes 6.99% 7.07% 6.95% 6.56% 6.62% 6.54% 4.76%Net income 11.78% 11.92% 11.70% 10.82% 11.31% 11.35% 8.33% 9.30% 9.61% 9.89% 10.14% 10.37% 11.16% 11.16% 11.16% 11.16% 11.16%
Sonic Corp.Income Statement - Before Restatement (Thousands)
Sonic Corp.Common Size Income Statement - Before Restatement
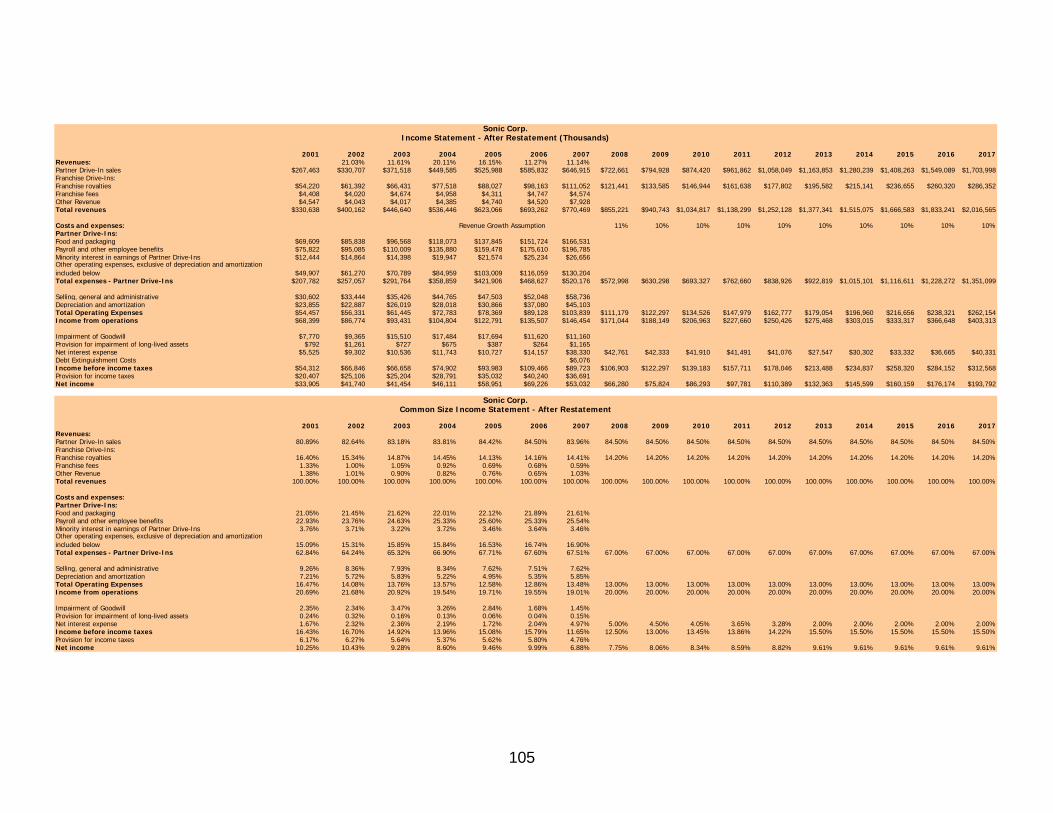
105
2001 2002 2003 2004 2005 2006 2007 2008 2009 2010 2011 2012 2013 2014 2015 2016 2017Revenues: 21.03% 11.61% 20.11% 16.15% 11.27% 11.14%Partner Drive-In sales $267,463 $330,707 $371,518 $449,585 $525,988 $585,832 $646,915 $722,661 $794,928 $874,420 $961,862 $1,058,049 $1,163,853 $1,280,239 $1,408,263 $1,549,089 $1,703,998Franchise Drive-Ins:Franchise royalties $54,220 $61,392 $66,431 $77,518 $88,027 $98,163 $111,052 $121,441 $133,585 $146,944 $161,638 $177,802 $195,582 $215,141 $236,655 $260,320 $286,352Franchise fees $4,408 $4,020 $4,674 $4,958 $4,311 $4,747 $4,574Other Revenue $4,547 $4,043 $4,017 $4,385 $4,740 $4,520 $7,928Total revenues $330,638 $400,162 $446,640 $536,446 $623,066 $693,262 $770,469 $855,221 $940,743 $1,034,817 $1,138,299 $1,252,128 $1,377,341 $1,515,075 $1,666,583 $1,833,241 $2,016,565
Costs and expenses: Revenue Growth Assumption 11% 10% 10% 10% 10% 10% 10% 10% 10% 10%Partner Drive-Ins:Food and packaging $69,609 $85,838 $96,568 $118,073 $137,845 $151,724 $166,531Payroll and other employee benefits $75,822 $95,085 $110,009 $135,880 $159,478 $175,610 $196,785Minority interest in earnings of Partner Drive-Ins $12,444 $14,864 $14,398 $19,947 $21,574 $25,234 $26,656Other operating expenses, exclusive of depreciation and amortization included below $49,907 $61,270 $70,789 $84,959 $103,009 $116,059 $130,204Total expenses - Partner Drive-Ins $207,782 $257,057 $291,764 $358,859 $421,906 $468,627 $520,176 $572,998 $630,298 $693,327 $762,660 $838,926 $922,819 $1,015,101 $1,116,611 $1,228,272 $1,351,099
Selling, general and administrative $30,602 $33,444 $35,426 $44,765 $47,503 $52,048 $58,736Depreciation and amortization $23,855 $22,887 $26,019 $28,018 $30,866 $37,080 $45,103Total Operating Expenses $54,457 $56,331 $61,445 $72,783 $78,369 $89,128 $103,839 $111,179 $122,297 $134,526 $147,979 $162,777 $179,054 $196,960 $216,656 $238,321 $262,154Income from operations $68,399 $86,774 $93,431 $104,804 $122,791 $135,507 $146,454 $171,044 $188,149 $206,963 $227,660 $250,426 $275,468 $303,015 $333,317 $366,648 $403,313
Impairment of Goodwill $7,770 $9,365 $15,510 $17,484 $17,694 $11,620 $11,160Provision for impairment of long-lived assets $792 $1,261 $727 $675 $387 $264 $1,165Net interest expense $5,525 $9,302 $10,536 $11,743 $10,727 $14,157 $38,330 $42,761 $42,333 $41,910 $41,491 $41,076 $27,547 $30,302 $33,332 $36,665 $40,331Debt Extinguishment Costs $6,076Income before income taxes $54,312 $66,846 $66,658 $74,902 $93,983 $109,466 $89,723 $106,903 $122,297 $139,183 $157,711 $178,046 $213,488 $234,837 $258,320 $284,152 $312,568Provision for income taxes $20,407 $25,106 $25,204 $28,791 $35,032 $40,240 $36,691Net income $33,905 $41,740 $41,454 $46,111 $58,951 $69,226 $53,032 $66,280 $75,824 $86,293 $97,781 $110,389 $132,363 $145,599 $160,159 $176,174 $193,792
2001 2002 2003 2004 2005 2006 2007 2008 2009 2010 2011 2012 2013 2014 2015 2016 2017Revenues:Partner Drive-In sales 80.89% 82.64% 83.18% 83.81% 84.42% 84.50% 83.96% 84.50% 84.50% 84.50% 84.50% 84.50% 84.50% 84.50% 84.50% 84.50% 84.50%Franchise Drive-Ins:Franchise royalties 16.40% 15.34% 14.87% 14.45% 14.13% 14.16% 14.41% 14.20% 14.20% 14.20% 14.20% 14.20% 14.20% 14.20% 14.20% 14.20% 14.20%Franchise fees 1.33% 1.00% 1.05% 0.92% 0.69% 0.68% 0.59%Other Revenue 1.38% 1.01% 0.90% 0.82% 0.76% 0.65% 1.03%Total revenues 100.00% 100.00% 100.00% 100.00% 100.00% 100.00% 100.00% 100.00% 100.00% 100.00% 100.00% 100.00% 100.00% 100.00% 100.00% 100.00% 100.00%
Costs and expenses:Partner Drive-Ins:Food and packaging 21.05% 21.45% 21.62% 22.01% 22.12% 21.89% 21.61%Payroll and other employee benefits 22.93% 23.76% 24.63% 25.33% 25.60% 25.33% 25.54%Minority interest in earnings of Partner Drive-Ins 3.76% 3.71% 3.22% 3.72% 3.46% 3.64% 3.46%Other operating expenses, exclusive of depreciation and amortization included below 15.09% 15.31% 15.85% 15.84% 16.53% 16.74% 16.90%Total expenses - Partner Drive-Ins 62.84% 64.24% 65.32% 66.90% 67.71% 67.60% 67.51% 67.00% 67.00% 67.00% 67.00% 67.00% 67.00% 67.00% 67.00% 67.00% 67.00%
Selling, general and administrative 9.26% 8.36% 7.93% 8.34% 7.62% 7.51% 7.62%Depreciation and amortization 7.21% 5.72% 5.83% 5.22% 4.95% 5.35% 5.85%Total Operating Expenses 16.47% 14.08% 13.76% 13.57% 12.58% 12.86% 13.48% 13.00% 13.00% 13.00% 13.00% 13.00% 13.00% 13.00% 13.00% 13.00% 13.00%Income from operations 20.69% 21.68% 20.92% 19.54% 19.71% 19.55% 19.01% 20.00% 20.00% 20.00% 20.00% 20.00% 20.00% 20.00% 20.00% 20.00% 20.00%
Impairment of Goodwill 2.35% 2.34% 3.47% 3.26% 2.84% 1.68% 1.45%Provision for impairment of long-lived assets 0.24% 0.32% 0.16% 0.13% 0.06% 0.04% 0.15%Net interest expense 1.67% 2.32% 2.36% 2.19% 1.72% 2.04% 4.97% 5.00% 4.50% 4.05% 3.65% 3.28% 2.00% 2.00% 2.00% 2.00% 2.00%Income before income taxes 16.43% 16.70% 14.92% 13.96% 15.08% 15.79% 11.65% 12.50% 13.00% 13.45% 13.86% 14.22% 15.50% 15.50% 15.50% 15.50% 15.50%Provision for income taxes 6.17% 6.27% 5.64% 5.37% 5.62% 5.80% 4.76%Net income 10.25% 10.43% 9.28% 8.60% 9.46% 9.99% 6.88% 7.75% 8.06% 8.34% 8.59% 8.82% 9.61% 9.61% 9.61% 9.61% 9.61%
Sonic Corp.Income Statement - After Restatement (Thousands)
Sonic Corp.Common Size Income Statement - After Restatement
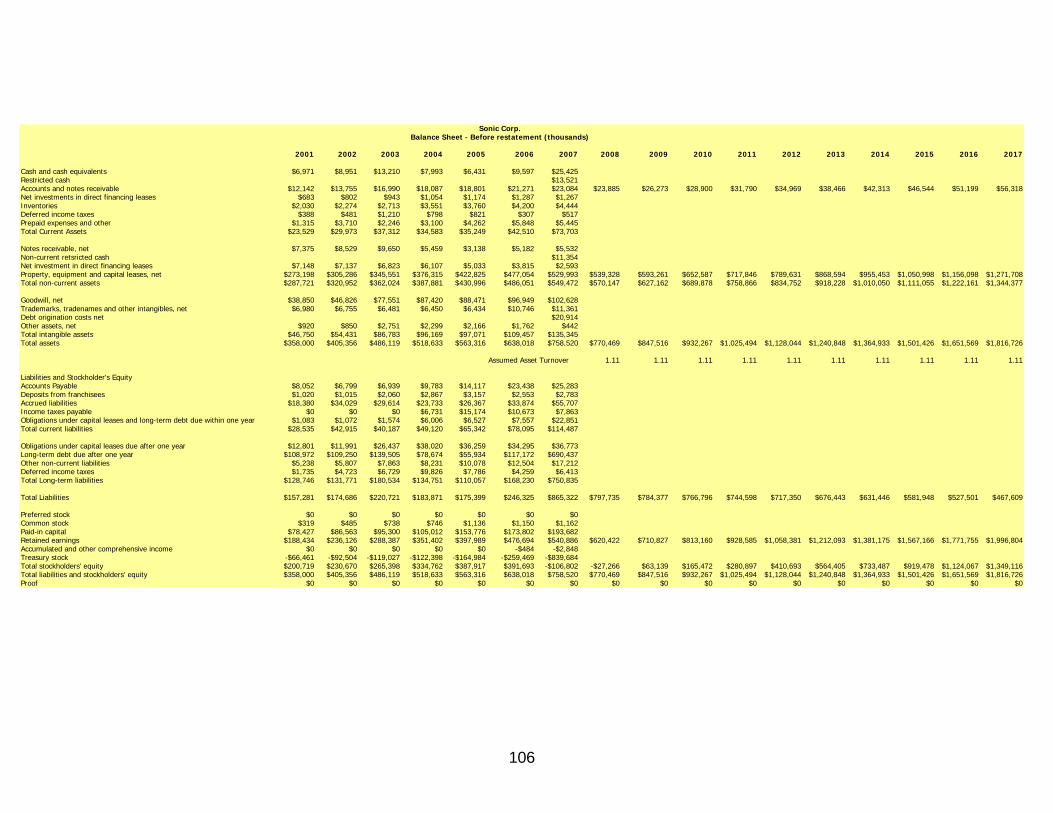
106
2001 2002 2003 2004 2005 2006 2007 2008 2009 2010 2011 2012 2013 2014 2015 2016 2017
Cash and cash equivalents $6,971 $8,951 $13,210 $7,993 $6,431 $9,597 $25,425Restricted cash $13,521Accounts and notes receivable $12,142 $13,755 $16,990 $18,087 $18,801 $21,271 $23,084 $23,885 $26,273 $28,900 $31,790 $34,969 $38,466 $42,313 $46,544 $51,199 $56,318Net investments in direct financing leases $683 $802 $943 $1,054 $1,174 $1,287 $1,267Inventories $2,030 $2,274 $2,713 $3,551 $3,760 $4,200 $4,444Deferred income taxes $388 $481 $1,210 $798 $821 $307 $517Prepaid expenses and other $1,315 $3,710 $2,246 $3,100 $4,262 $5,848 $5,445Total Current Assets $23,529 $29,973 $37,312 $34,583 $35,249 $42,510 $73,703
Notes receivable, net $7,375 $8,529 $9,650 $5,459 $3,138 $5,182 $5,532Non-current retsricted cash $11,354Net investment in direct financing leases $7,148 $7,137 $6,823 $6,107 $5,033 $3,815 $2,593Property, equipment and capital leases, net $273,198 $305,286 $345,551 $376,315 $422,825 $477,054 $529,993 $539,328 $593,261 $652,587 $717,846 $789,631 $868,594 $955,453 $1,050,998 $1,156,098 $1,271,708Total non-current assets $287,721 $320,952 $362,024 $387,881 $430,996 $486,051 $549,472 $570,147 $627,162 $689,878 $758,866 $834,752 $918,228 $1,010,050 $1,111,055 $1,222,161 $1,344,377
Goodwill, net $38,850 $46,826 $77,551 $87,420 $88,471 $96,949 $102,628Trademarks, tradenames and other intangibles, net $6,980 $6,755 $6,481 $6,450 $6,434 $10,746 $11,361Debt origination costs net $20,914Other assets, net $920 $850 $2,751 $2,299 $2,166 $1,762 $442Total intangible assets $46,750 $54,431 $86,783 $96,169 $97,071 $109,457 $135,345Total assets $358,000 $405,356 $486,119 $518,633 $563,316 $638,018 $758,520 $770,469 $847,516 $932,267 $1,025,494 $1,128,044 $1,240,848 $1,364,933 $1,501,426 $1,651,569 $1,816,726
Assumed Asset Turnover 1.11 1.11 1.11 1.11 1.11 1.11 1.11 1.11 1.11 1.11
Liabilities and Stockholder's EquityAccounts Payable $8,052 $6,799 $6,939 $9,783 $14,117 $23,438 $25,283Deposits from franchisees $1,020 $1,015 $2,060 $2,867 $3,157 $2,553 $2,783Accrued liabilities $18,380 $34,029 $29,614 $23,733 $26,367 $33,874 $55,707Income taxes payable $0 $0 $0 $6,731 $15,174 $10,673 $7,863Obligations under capital leases and long-term debt due within one year $1,083 $1,072 $1,574 $6,006 $6,527 $7,557 $22,851Total current liabilities $28,535 $42,915 $40,187 $49,120 $65,342 $78,095 $114,487
Obligations under capital leases due after one year $12,801 $11,991 $26,437 $38,020 $36,259 $34,295 $36,773Long-term debt due after one year $108,972 $109,250 $139,505 $78,674 $55,934 $117,172 $690,437Other non-current liabilities $5,238 $5,807 $7,863 $8,231 $10,078 $12,504 $17,212Deferred income taxes $1,735 $4,723 $6,729 $9,826 $7,786 $4,259 $6,413Total Long-term liabilities $128,746 $131,771 $180,534 $134,751 $110,057 $168,230 $750,835
Total Liabilities $157,281 $174,686 $220,721 $183,871 $175,399 $246,325 $865,322 $797,735 $784,377 $766,796 $744,598 $717,350 $676,443 $631,446 $581,948 $527,501 $467,609
Preferred stock $0 $0 $0 $0 $0 $0 $0Common stock $319 $485 $738 $746 $1,136 $1,150 $1,162Paid-in capital $78,427 $86,563 $95,300 $105,012 $153,776 $173,802 $193,682Retained earnings $188,434 $236,126 $288,387 $351,402 $397,989 $476,694 $540,886 $620,422 $710,827 $813,160 $928,585 $1,058,381 $1,212,093 $1,381,175 $1,567,166 $1,771,755 $1,996,804Accumulated and other comprehensive income $0 $0 $0 $0 $0 -$484 -$2,848Treasury stock -$66,461 -$92,504 -$119,027 -$122,398 -$164,984 -$259,469 -$839,684Total stockholders' equity $200,719 $230,670 $265,398 $334,762 $387,917 $391,693 -$106,802 -$27,266 $63,139 $165,472 $280,897 $410,693 $564,405 $733,487 $919,478 $1,124,067 $1,349,116Total liabilities and stockholders' equity $358,000 $405,356 $486,119 $518,633 $563,316 $638,018 $758,520 $770,469 $847,516 $932,267 $1,025,494 $1,128,044 $1,240,848 $1,364,933 $1,501,426 $1,651,569 $1,816,726Proof $0 $0 $0 $0 $0 $0 $0 $0 $0 $0 $0 $0 $0 $0 $0 $0 $0
Sonic Corp.Balance Sheet - Before restatement (thousands)
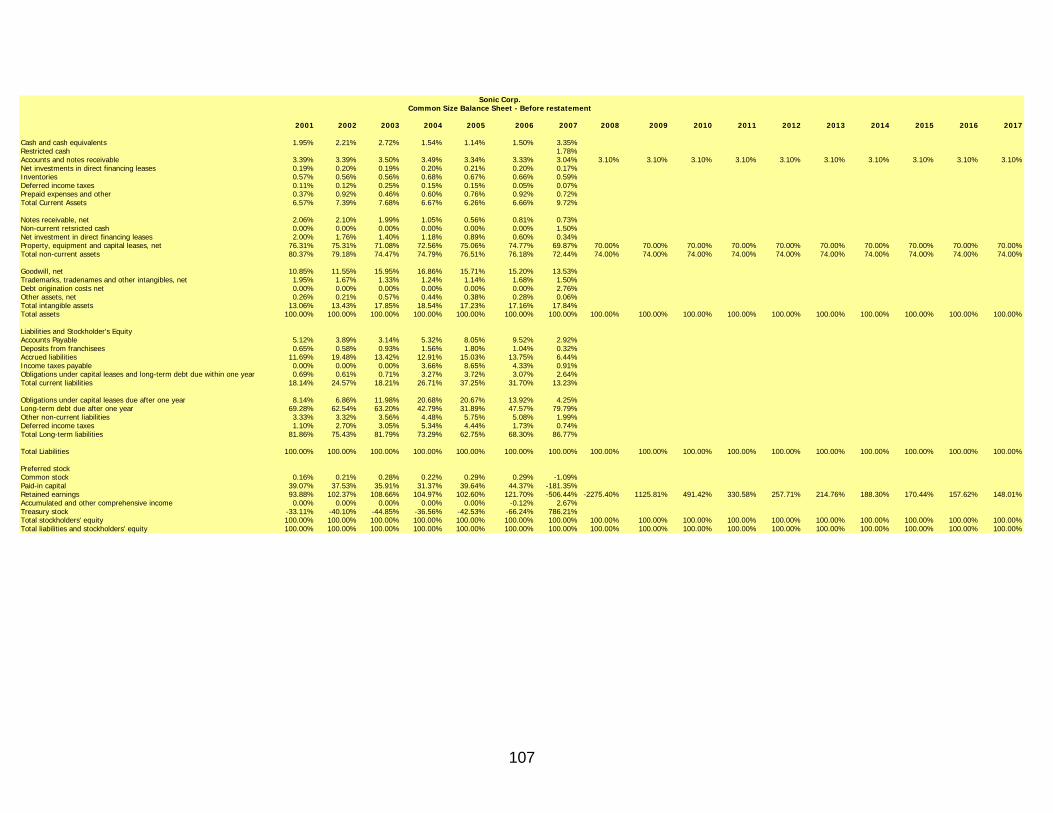
107
2001 2002 2003 2004 2005 2006 2007 2008 2009 2010 2011 2012 2013 2014 2015 2016 2017
Cash and cash equivalents 1.95% 2.21% 2.72% 1.54% 1.14% 1.50% 3.35%Restricted cash 1.78%Accounts and notes receivable 3.39% 3.39% 3.50% 3.49% 3.34% 3.33% 3.04% 3.10% 3.10% 3.10% 3.10% 3.10% 3.10% 3.10% 3.10% 3.10% 3.10%Net investments in direct financing leases 0.19% 0.20% 0.19% 0.20% 0.21% 0.20% 0.17%Inventories 0.57% 0.56% 0.56% 0.68% 0.67% 0.66% 0.59%Deferred income taxes 0.11% 0.12% 0.25% 0.15% 0.15% 0.05% 0.07%Prepaid expenses and other 0.37% 0.92% 0.46% 0.60% 0.76% 0.92% 0.72%Total Current Assets 6.57% 7.39% 7.68% 6.67% 6.26% 6.66% 9.72%
Notes receivable, net 2.06% 2.10% 1.99% 1.05% 0.56% 0.81% 0.73%Non-current retsricted cash 0.00% 0.00% 0.00% 0.00% 0.00% 0.00% 1.50%Net investment in direct financing leases 2.00% 1.76% 1.40% 1.18% 0.89% 0.60% 0.34%Property, equipment and capital leases, net 76.31% 75.31% 71.08% 72.56% 75.06% 74.77% 69.87% 70.00% 70.00% 70.00% 70.00% 70.00% 70.00% 70.00% 70.00% 70.00% 70.00%Total non-current assets 80.37% 79.18% 74.47% 74.79% 76.51% 76.18% 72.44% 74.00% 74.00% 74.00% 74.00% 74.00% 74.00% 74.00% 74.00% 74.00% 74.00%
Goodwill, net 10.85% 11.55% 15.95% 16.86% 15.71% 15.20% 13.53%Trademarks, tradenames and other intangibles, net 1.95% 1.67% 1.33% 1.24% 1.14% 1.68% 1.50%Debt origination costs net 0.00% 0.00% 0.00% 0.00% 0.00% 0.00% 2.76%Other assets, net 0.26% 0.21% 0.57% 0.44% 0.38% 0.28% 0.06%Total intangible assets 13.06% 13.43% 17.85% 18.54% 17.23% 17.16% 17.84%Total assets 100.00% 100.00% 100.00% 100.00% 100.00% 100.00% 100.00% 100.00% 100.00% 100.00% 100.00% 100.00% 100.00% 100.00% 100.00% 100.00% 100.00%
Liabilities and Stockholder's EquityAccounts Payable 5.12% 3.89% 3.14% 5.32% 8.05% 9.52% 2.92%Deposits from franchisees 0.65% 0.58% 0.93% 1.56% 1.80% 1.04% 0.32%Accrued liabilities 11.69% 19.48% 13.42% 12.91% 15.03% 13.75% 6.44%Income taxes payable 0.00% 0.00% 0.00% 3.66% 8.65% 4.33% 0.91%Obligations under capital leases and long-term debt due within one year 0.69% 0.61% 0.71% 3.27% 3.72% 3.07% 2.64%Total current liabilities 18.14% 24.57% 18.21% 26.71% 37.25% 31.70% 13.23%
Obligations under capital leases due after one year 8.14% 6.86% 11.98% 20.68% 20.67% 13.92% 4.25%Long-term debt due after one year 69.28% 62.54% 63.20% 42.79% 31.89% 47.57% 79.79%Other non-current liabilities 3.33% 3.32% 3.56% 4.48% 5.75% 5.08% 1.99%Deferred income taxes 1.10% 2.70% 3.05% 5.34% 4.44% 1.73% 0.74%Total Long-term liabilities 81.86% 75.43% 81.79% 73.29% 62.75% 68.30% 86.77%
Total Liabilities 100.00% 100.00% 100.00% 100.00% 100.00% 100.00% 100.00% 100.00% 100.00% 100.00% 100.00% 100.00% 100.00% 100.00% 100.00% 100.00% 100.00%
Preferred stockCommon stock 0.16% 0.21% 0.28% 0.22% 0.29% 0.29% -1.09%Paid-in capital 39.07% 37.53% 35.91% 31.37% 39.64% 44.37% -181.35%Retained earnings 93.88% 102.37% 108.66% 104.97% 102.60% 121.70% -506.44% -2275.40% 1125.81% 491.42% 330.58% 257.71% 214.76% 188.30% 170.44% 157.62% 148.01%Accumulated and other comprehensive income 0.00% 0.00% 0.00% 0.00% 0.00% -0.12% 2.67%Treasury stock -33.11% -40.10% -44.85% -36.56% -42.53% -66.24% 786.21%Total stockholders' equity 100.00% 100.00% 100.00% 100.00% 100.00% 100.00% 100.00% 100.00% 100.00% 100.00% 100.00% 100.00% 100.00% 100.00% 100.00% 100.00% 100.00%Total liabilities and stockholders' equity 100.00% 100.00% 100.00% 100.00% 100.00% 100.00% 100.00% 100.00% 100.00% 100.00% 100.00% 100.00% 100.00% 100.00% 100.00% 100.00% 100.00%
Sonic Corp.Common Size Balance Sheet - Before restatement
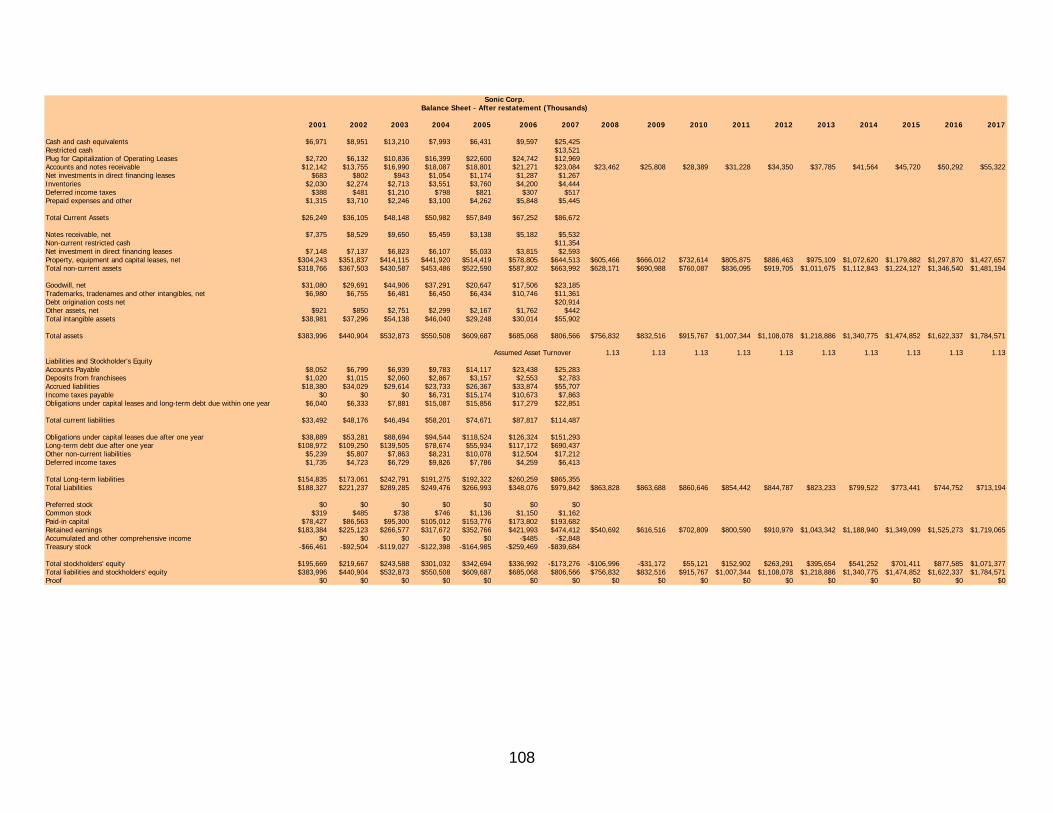
108
2001 2002 2003 2004 2005 2006 2007 2008 2009 2010 2011 2012 2013 2014 2015 2016 2017
Cash and cash equivalents $6,971 $8,951 $13,210 $7,993 $6,431 $9,597 $25,425Restricted cash $13,521Plug for Capitalization of Operating Leases $2,720 $6,132 $10,836 $16,399 $22,600 $24,742 $12,969Accounts and notes receivable $12,142 $13,755 $16,990 $18,087 $18,801 $21,271 $23,084 $23,462 $25,808 $28,389 $31,228 $34,350 $37,785 $41,564 $45,720 $50,292 $55,322Net investments in direct financing leases $683 $802 $943 $1,054 $1,174 $1,287 $1,267Inventories $2,030 $2,274 $2,713 $3,551 $3,760 $4,200 $4,444Deferred income taxes $388 $481 $1,210 $798 $821 $307 $517Prepaid expenses and other $1,315 $3,710 $2,246 $3,100 $4,262 $5,848 $5,445
Total Current Assets $26,249 $36,105 $48,148 $50,982 $57,849 $67,252 $86,672
Notes receivable, net $7,375 $8,529 $9,650 $5,459 $3,138 $5,182 $5,532Non-current restricted cash $11,354Net investment in direct financing leases $7,148 $7,137 $6,823 $6,107 $5,033 $3,815 $2,593Property, equipment and capital leases, net $304,243 $351,837 $414,115 $441,920 $514,419 $578,805 $644,513 $605,466 $666,012 $732,614 $805,875 $886,463 $975,109 $1,072,620 $1,179,882 $1,297,870 $1,427,657Total non-current assets $318,766 $367,503 $430,587 $453,486 $522,590 $587,802 $663,992 $628,171 $690,988 $760,087 $836,095 $919,705 $1,011,675 $1,112,843 $1,224,127 $1,346,540 $1,481,194
Goodwill, net $31,080 $29,691 $44,906 $37,291 $20,647 $17,506 $23,185Trademarks, tradenames and other intangibles, net $6,980 $6,755 $6,481 $6,450 $6,434 $10,746 $11,361Debt origination costs net $20,914Other assets, net $921 $850 $2,751 $2,299 $2,167 $1,762 $442Total intangible assets $38,981 $37,296 $54,138 $46,040 $29,248 $30,014 $55,902
Total assets $383,996 $440,904 $532,873 $550,508 $609,687 $685,068 $806,566 $756,832 $832,516 $915,767 $1,007,344 $1,108,078 $1,218,886 $1,340,775 $1,474,852 $1,622,337 $1,784,571
Assumed Asset Turnover 1.13 1.13 1.13 1.13 1.13 1.13 1.13 1.13 1.13 1.13Liabilities and Stockholder's EquityAccounts Payable $8,052 $6,799 $6,939 $9,783 $14,117 $23,438 $25,283Deposits from franchisees $1,020 $1,015 $2,060 $2,867 $3,157 $2,553 $2,783Accrued liabilities $18,380 $34,029 $29,614 $23,733 $26,367 $33,874 $55,707Income taxes payable $0 $0 $0 $6,731 $15,174 $10,673 $7,863Obligations under capital leases and long-term debt due within one year $6,040 $6,333 $7,881 $15,087 $15,856 $17,279 $22,851
Total current liabilities $33,492 $48,176 $46,494 $58,201 $74,671 $87,817 $114,487
Obligations under capital leases due after one year $38,889 $53,281 $88,694 $94,544 $118,524 $126,324 $151,293Long-term debt due after one year $108,972 $109,250 $139,505 $78,674 $55,934 $117,172 $690,437Other non-current liabilities $5,239 $5,807 $7,863 $8,231 $10,078 $12,504 $17,212Deferred income taxes $1,735 $4,723 $6,729 $9,826 $7,786 $4,259 $6,413
Total Long-term liabilities $154,835 $173,061 $242,791 $191,275 $192,322 $260,259 $865,355Total Liabilities $188,327 $221,237 $289,285 $249,476 $266,993 $348,076 $979,842 $863,828 $863,688 $860,646 $854,442 $844,787 $823,233 $799,522 $773,441 $744,752 $713,194
Preferred stock $0 $0 $0 $0 $0 $0 $0Common stock $319 $485 $738 $746 $1,136 $1,150 $1,162Paid-in capital $78,427 $86,563 $95,300 $105,012 $153,776 $173,802 $193,682Retained earnings $183,384 $225,123 $266,577 $317,672 $352,766 $421,993 $474,412 $540,692 $616,516 $702,809 $800,590 $910,979 $1,043,342 $1,188,940 $1,349,099 $1,525,273 $1,719,065Accumulated and other comprehensive income $0 $0 $0 $0 $0 -$485 -$2,848Treasury stock -$66,461 -$92,504 -$119,027 -$122,398 -$164,985 -$259,469 -$839,684
Total stockholders' equity $195,669 $219,667 $243,588 $301,032 $342,694 $336,992 -$173,276 -$106,996 -$31,172 $55,121 $152,902 $263,291 $395,654 $541,252 $701,411 $877,585 $1,071,377Total liabilities and stockholders' equity $383,996 $440,904 $532,873 $550,508 $609,687 $685,068 $806,566 $756,832 $832,516 $915,767 $1,007,344 $1,108,078 $1,218,886 $1,340,775 $1,474,852 $1,622,337 $1,784,571Proof $0 $0 $0 $0 $0 $0 $0 $0 $0 $0 $0 $0 $0 $0 $0 $0 $0
Sonic Corp.Balance Sheet - After restatement (Thousands)
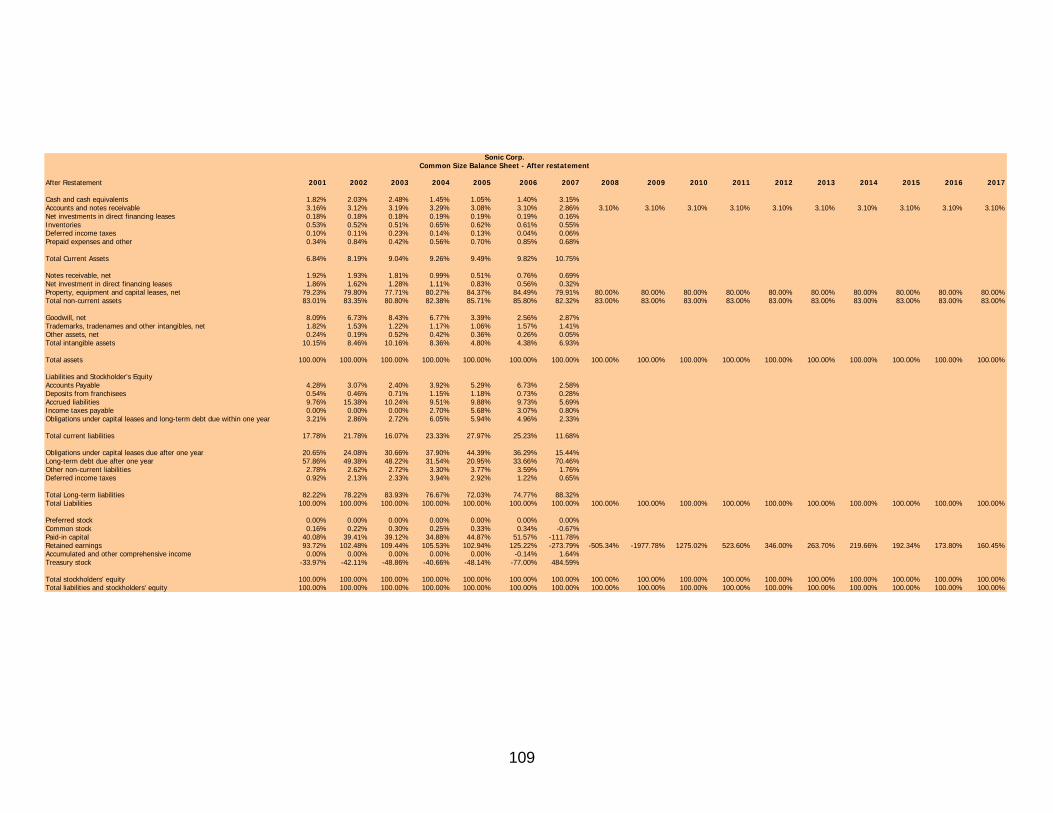
109
After Restatement 2001 2002 2003 2004 2005 2006 2007 2008 2009 2010 2011 2012 2013 2014 2015 2016 2017
Cash and cash equivalents 1.82% 2.03% 2.48% 1.45% 1.05% 1.40% 3.15%Accounts and notes receivable 3.16% 3.12% 3.19% 3.29% 3.08% 3.10% 2.86% 3.10% 3.10% 3.10% 3.10% 3.10% 3.10% 3.10% 3.10% 3.10% 3.10%Net investments in direct financing leases 0.18% 0.18% 0.18% 0.19% 0.19% 0.19% 0.16%Inventories 0.53% 0.52% 0.51% 0.65% 0.62% 0.61% 0.55%Deferred income taxes 0.10% 0.11% 0.23% 0.14% 0.13% 0.04% 0.06%Prepaid expenses and other 0.34% 0.84% 0.42% 0.56% 0.70% 0.85% 0.68%
Total Current Assets 6.84% 8.19% 9.04% 9.26% 9.49% 9.82% 10.75%
Notes receivable, net 1.92% 1.93% 1.81% 0.99% 0.51% 0.76% 0.69%Net investment in direct financing leases 1.86% 1.62% 1.28% 1.11% 0.83% 0.56% 0.32%Property, equipment and capital leases, net 79.23% 79.80% 77.71% 80.27% 84.37% 84.49% 79.91% 80.00% 80.00% 80.00% 80.00% 80.00% 80.00% 80.00% 80.00% 80.00% 80.00%Total non-current assets 83.01% 83.35% 80.80% 82.38% 85.71% 85.80% 82.32% 83.00% 83.00% 83.00% 83.00% 83.00% 83.00% 83.00% 83.00% 83.00% 83.00%
Goodwill, net 8.09% 6.73% 8.43% 6.77% 3.39% 2.56% 2.87%Trademarks, tradenames and other intangibles, net 1.82% 1.53% 1.22% 1.17% 1.06% 1.57% 1.41%Other assets, net 0.24% 0.19% 0.52% 0.42% 0.36% 0.26% 0.05%Total intangible assets 10.15% 8.46% 10.16% 8.36% 4.80% 4.38% 6.93%
Total assets 100.00% 100.00% 100.00% 100.00% 100.00% 100.00% 100.00% 100.00% 100.00% 100.00% 100.00% 100.00% 100.00% 100.00% 100.00% 100.00% 100.00%
Liabilities and Stockholder's EquityAccounts Payable 4.28% 3.07% 2.40% 3.92% 5.29% 6.73% 2.58%Deposits from franchisees 0.54% 0.46% 0.71% 1.15% 1.18% 0.73% 0.28%Accrued liabilities 9.76% 15.38% 10.24% 9.51% 9.88% 9.73% 5.69%Income taxes payable 0.00% 0.00% 0.00% 2.70% 5.68% 3.07% 0.80%Obligations under capital leases and long-term debt due within one year 3.21% 2.86% 2.72% 6.05% 5.94% 4.96% 2.33%
Total current liabilities 17.78% 21.78% 16.07% 23.33% 27.97% 25.23% 11.68%
Obligations under capital leases due after one year 20.65% 24.08% 30.66% 37.90% 44.39% 36.29% 15.44%Long-term debt due after one year 57.86% 49.38% 48.22% 31.54% 20.95% 33.66% 70.46%Other non-current liabilities 2.78% 2.62% 2.72% 3.30% 3.77% 3.59% 1.76%Deferred income taxes 0.92% 2.13% 2.33% 3.94% 2.92% 1.22% 0.65%
Total Long-term liabilities 82.22% 78.22% 83.93% 76.67% 72.03% 74.77% 88.32%Total Liabilities 100.00% 100.00% 100.00% 100.00% 100.00% 100.00% 100.00% 100.00% 100.00% 100.00% 100.00% 100.00% 100.00% 100.00% 100.00% 100.00% 100.00%
Preferred stock 0.00% 0.00% 0.00% 0.00% 0.00% 0.00% 0.00%Common stock 0.16% 0.22% 0.30% 0.25% 0.33% 0.34% -0.67%Paid-in capital 40.08% 39.41% 39.12% 34.88% 44.87% 51.57% -111.78%Retained earnings 93.72% 102.48% 109.44% 105.53% 102.94% 125.22% -273.79% -505.34% -1977.78% 1275.02% 523.60% 346.00% 263.70% 219.66% 192.34% 173.80% 160.45%Accumulated and other comprehensive income 0.00% 0.00% 0.00% 0.00% 0.00% -0.14% 1.64%Treasury stock -33.97% -42.11% -48.86% -40.66% -48.14% -77.00% 484.59%
Total stockholders' equity 100.00% 100.00% 100.00% 100.00% 100.00% 100.00% 100.00% 100.00% 100.00% 100.00% 100.00% 100.00% 100.00% 100.00% 100.00% 100.00% 100.00%Total liabilities and stockholders' equity 100.00% 100.00% 100.00% 100.00% 100.00% 100.00% 100.00% 100.00% 100.00% 100.00% 100.00% 100.00% 100.00% 100.00% 100.00% 100.00% 100.00%
Sonic Corp.Common Size Balance Sheet - After restatement
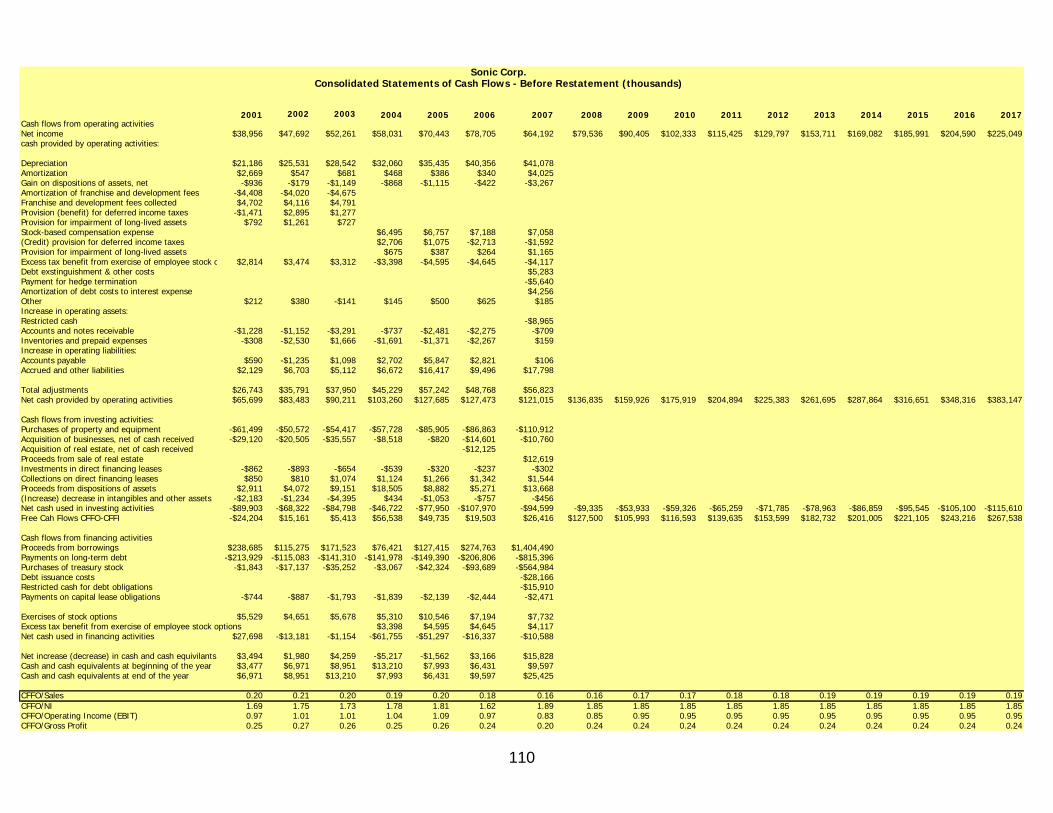
110
2001 2002 2003 2004 2005 2006 2007 2008 2009 2010 2011 2012 2013 2014 2015 2016 2017Cash flows from operating activitiesNet income $38,956 $47,692 $52,261 $58,031 $70,443 $78,705 $64,192 $79,536 $90,405 $102,333 $115,425 $129,797 $153,711 $169,082 $185,991 $204,590 $225,049cash provided by operating activities:
Depreciation $21,186 $25,531 $28,542 $32,060 $35,435 $40,356 $41,078Amortization $2,669 $547 $681 $468 $386 $340 $4,025Gain on dispositions of assets, net -$936 -$179 -$1,149 -$868 -$1,115 -$422 -$3,267Amortization of franchise and development fees -$4,408 -$4,020 -$4,675Franchise and development fees collected $4,702 $4,116 $4,791Provision (benefit) for deferred income taxes -$1,471 $2,895 $1,277Provision for impairment of long-lived assets $792 $1,261 $727Stock-based compensation expense $6,495 $6,757 $7,188 $7,058(Credit) provision for deferred income taxes $2,706 $1,075 -$2,713 -$1,592Provision for impairment of long-lived assets $675 $387 $264 $1,165Excess tax benefit from exercise of employee stock o $2,814 $3,474 $3,312 -$3,398 -$4,595 -$4,645 -$4,117Debt exstinguishment & other costs $5,283Payment for hedge termination -$5,640Amortization of debt costs to interest expense $4,256Other $212 $380 -$141 $145 $500 $625 $185Increase in operating assets:Restricted cash -$8,965Accounts and notes receivable -$1,228 -$1,152 -$3,291 -$737 -$2,481 -$2,275 -$709Inventories and prepaid expenses -$308 -$2,530 $1,666 -$1,691 -$1,371 -$2,267 $159Increase in operating liabilities:Accounts payable $590 -$1,235 $1,098 $2,702 $5,847 $2,821 $106Accrued and other liabilities $2,129 $6,703 $5,112 $6,672 $16,417 $9,496 $17,798
Total adjustments $26,743 $35,791 $37,950 $45,229 $57,242 $48,768 $56,823Net cash provided by operating activities $65,699 $83,483 $90,211 $103,260 $127,685 $127,473 $121,015 $136,835 $159,926 $175,919 $204,894 $225,383 $261,695 $287,864 $316,651 $348,316 $383,147
Cash flows from investing activities:Purchases of property and equipment -$61,499 -$50,572 -$54,417 -$57,728 -$85,905 -$86,863 -$110,912Acquisition of businesses, net of cash received -$29,120 -$20,505 -$35,557 -$8,518 -$820 -$14,601 -$10,760Acquisition of real estate, net of cash received -$12,125Proceeds from sale of real estate $12,619Investments in direct financing leases -$862 -$893 -$654 -$539 -$320 -$237 -$302Collections on direct financing leases $850 $810 $1,074 $1,124 $1,266 $1,342 $1,544Proceeds from dispositions of assets $2,911 $4,072 $9,151 $18,505 $8,882 $5,271 $13,668(Increase) decrease in intangibles and other assets -$2,183 -$1,234 -$4,395 $434 -$1,053 -$757 -$456Net cash used in investing activities -$89,903 -$68,322 -$84,798 -$46,722 -$77,950 -$107,970 -$94,599 -$9,335 -$53,933 -$59,326 -$65,259 -$71,785 -$78,963 -$86,859 -$95,545 -$105,100 -$115,610Free Cah Flows CFFO-CFFI -$24,204 $15,161 $5,413 $56,538 $49,735 $19,503 $26,416 $127,500 $105,993 $116,593 $139,635 $153,599 $182,732 $201,005 $221,105 $243,216 $267,538
Cash flows from financing activitiesProceeds from borrowings $238,685 $115,275 $171,523 $76,421 $127,415 $274,763 $1,404,490Payments on long-term debt -$213,929 -$115,083 -$141,310 -$141,978 -$149,390 -$206,806 -$815,396Purchases of treasury stock -$1,843 -$17,137 -$35,252 -$3,067 -$42,324 -$93,689 -$564,984Debt issuance costs -$28,166Restricted cash for debt obligations -$15,910Payments on capital lease obligations -$744 -$887 -$1,793 -$1,839 -$2,139 -$2,444 -$2,471
Exercises of stock options $5,529 $4,651 $5,678 $5,310 $10,546 $7,194 $7,732Excess tax benefit from exercise of employee stock options $3,398 $4,595 $4,645 $4,117Net cash used in financing activities $27,698 -$13,181 -$1,154 -$61,755 -$51,297 -$16,337 -$10,588
Net increase (decrease) in cash and cash equivilants $3,494 $1,980 $4,259 -$5,217 -$1,562 $3,166 $15,828Cash and cash equivalents at beginning of the year $3,477 $6,971 $8,951 $13,210 $7,993 $6,431 $9,597Cash and cash equivalents at end of the year $6,971 $8,951 $13,210 $7,993 $6,431 $9,597 $25,425
CFFO/Sales 0.20 0.21 0.20 0.19 0.20 0.18 0.16 0.16 0.17 0.17 0.18 0.18 0.19 0.19 0.19 0.19 0.19CFFO/NI 1.69 1.75 1.73 1.78 1.81 1.62 1.89 1.85 1.85 1.85 1.85 1.85 1.85 1.85 1.85 1.85 1.85CFFO/Operating Income (EBIT) 0.97 1.01 1.01 1.04 1.09 0.97 0.83 0.85 0.95 0.95 0.95 0.95 0.95 0.95 0.95 0.95 0.95CFFO/Gross Profit 0.25 0.27 0.26 0.25 0.26 0.24 0.20 0.24 0.24 0.24 0.24 0.24 0.24 0.24 0.24 0.24 0.24
Sonic Corp.Consolidated Statements of Cash Flows - Before Restatement (thousands)
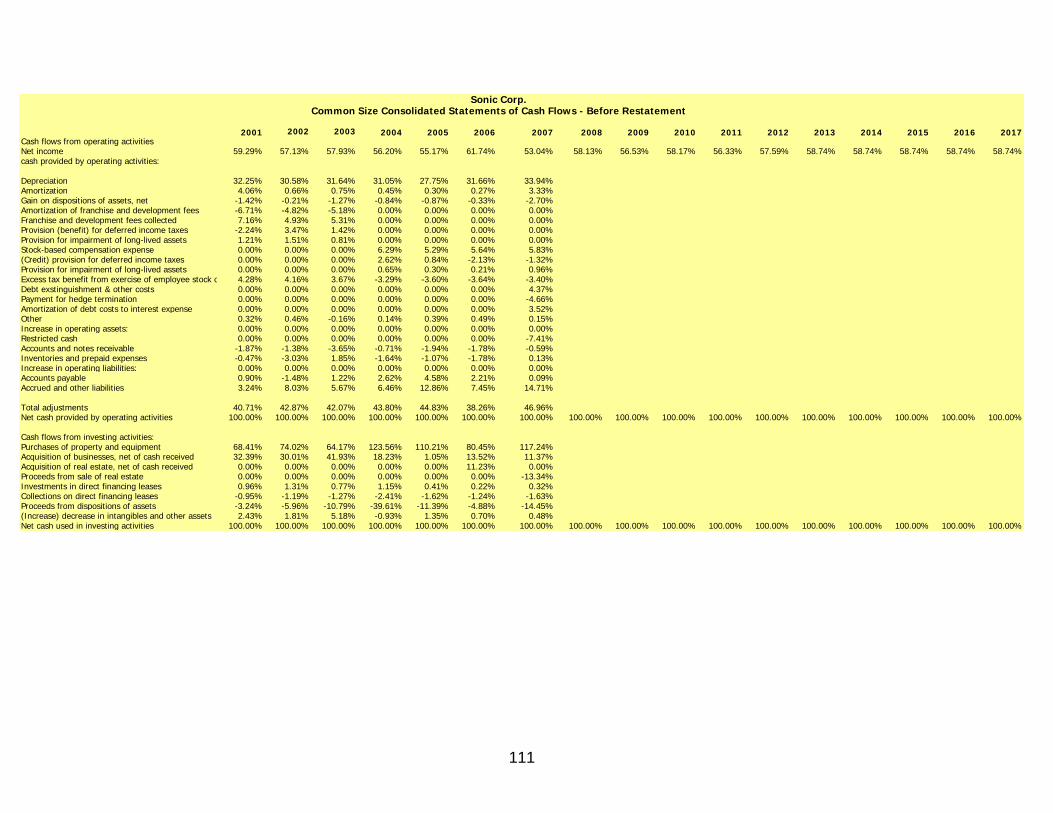
111
2001 2002 2003 2004 2005 2006 2007 2008 2009 2010 2011 2012 2013 2014 2015 2016 2017Cash flows from operating activitiesNet income 59.29% 57.13% 57.93% 56.20% 55.17% 61.74% 53.04% 58.13% 56.53% 58.17% 56.33% 57.59% 58.74% 58.74% 58.74% 58.74% 58.74%cash provided by operating activities:
Depreciation 32.25% 30.58% 31.64% 31.05% 27.75% 31.66% 33.94%Amortization 4.06% 0.66% 0.75% 0.45% 0.30% 0.27% 3.33%Gain on dispositions of assets, net -1.42% -0.21% -1.27% -0.84% -0.87% -0.33% -2.70%Amortization of franchise and development fees -6.71% -4.82% -5.18% 0.00% 0.00% 0.00% 0.00%Franchise and development fees collected 7.16% 4.93% 5.31% 0.00% 0.00% 0.00% 0.00%Provision (benefit) for deferred income taxes -2.24% 3.47% 1.42% 0.00% 0.00% 0.00% 0.00%Provision for impairment of long-lived assets 1.21% 1.51% 0.81% 0.00% 0.00% 0.00% 0.00%Stock-based compensation expense 0.00% 0.00% 0.00% 6.29% 5.29% 5.64% 5.83%(Credit) provision for deferred income taxes 0.00% 0.00% 0.00% 2.62% 0.84% -2.13% -1.32%Provision for impairment of long-lived assets 0.00% 0.00% 0.00% 0.65% 0.30% 0.21% 0.96%Excess tax benefit from exercise of employee stock o 4.28% 4.16% 3.67% -3.29% -3.60% -3.64% -3.40%Debt exstinguishment & other costs 0.00% 0.00% 0.00% 0.00% 0.00% 0.00% 4.37%Payment for hedge termination 0.00% 0.00% 0.00% 0.00% 0.00% 0.00% -4.66%Amortization of debt costs to interest expense 0.00% 0.00% 0.00% 0.00% 0.00% 0.00% 3.52%Other 0.32% 0.46% -0.16% 0.14% 0.39% 0.49% 0.15%Increase in operating assets: 0.00% 0.00% 0.00% 0.00% 0.00% 0.00% 0.00%Restricted cash 0.00% 0.00% 0.00% 0.00% 0.00% 0.00% -7.41%Accounts and notes receivable -1.87% -1.38% -3.65% -0.71% -1.94% -1.78% -0.59%Inventories and prepaid expenses -0.47% -3.03% 1.85% -1.64% -1.07% -1.78% 0.13%Increase in operating liabilities: 0.00% 0.00% 0.00% 0.00% 0.00% 0.00% 0.00%Accounts payable 0.90% -1.48% 1.22% 2.62% 4.58% 2.21% 0.09%Accrued and other liabilities 3.24% 8.03% 5.67% 6.46% 12.86% 7.45% 14.71%
Total adjustments 40.71% 42.87% 42.07% 43.80% 44.83% 38.26% 46.96%Net cash provided by operating activities 100.00% 100.00% 100.00% 100.00% 100.00% 100.00% 100.00% 100.00% 100.00% 100.00% 100.00% 100.00% 100.00% 100.00% 100.00% 100.00% 100.00%
Cash flows from investing activities:Purchases of property and equipment 68.41% 74.02% 64.17% 123.56% 110.21% 80.45% 117.24%Acquisition of businesses, net of cash received 32.39% 30.01% 41.93% 18.23% 1.05% 13.52% 11.37%Acquisition of real estate, net of cash received 0.00% 0.00% 0.00% 0.00% 0.00% 11.23% 0.00%Proceeds from sale of real estate 0.00% 0.00% 0.00% 0.00% 0.00% 0.00% -13.34%Investments in direct financing leases 0.96% 1.31% 0.77% 1.15% 0.41% 0.22% 0.32%Collections on direct financing leases -0.95% -1.19% -1.27% -2.41% -1.62% -1.24% -1.63%Proceeds from dispositions of assets -3.24% -5.96% -10.79% -39.61% -11.39% -4.88% -14.45%(Increase) decrease in intangibles and other assets 2.43% 1.81% 5.18% -0.93% 1.35% 0.70% 0.48%Net cash used in investing activities 100.00% 100.00% 100.00% 100.00% 100.00% 100.00% 100.00% 100.00% 100.00% 100.00% 100.00% 100.00% 100.00% 100.00% 100.00% 100.00% 100.00%
Sonic Corp.Common Size Consolidated Statements of Cash Flows - Before Restatement
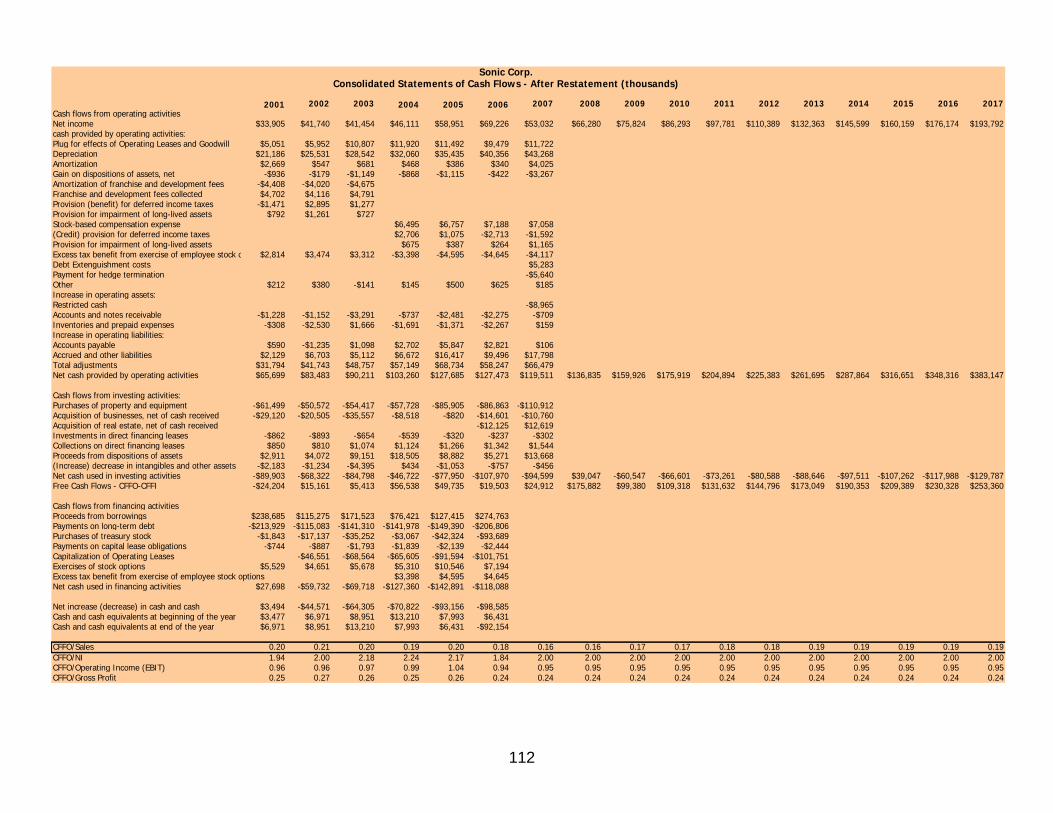
112
2001 2002 2003 2004 2005 2006 2007 2008 2009 2010 2011 2012 2013 2014 2015 2016 2017Cash flows from operating activitiesNet income $33,905 $41,740 $41,454 $46,111 $58,951 $69,226 $53,032 $66,280 $75,824 $86,293 $97,781 $110,389 $132,363 $145,599 $160,159 $176,174 $193,792cash provided by operating activities:Plug for effects of Operating Leases and Goodwill $5,051 $5,952 $10,807 $11,920 $11,492 $9,479 $11,722Depreciation $21,186 $25,531 $28,542 $32,060 $35,435 $40,356 $43,268Amortization $2,669 $547 $681 $468 $386 $340 $4,025Gain on dispositions of assets, net -$936 -$179 -$1,149 -$868 -$1,115 -$422 -$3,267Amortization of franchise and development fees -$4,408 -$4,020 -$4,675Franchise and development fees collected $4,702 $4,116 $4,791Provision (benefit) for deferred income taxes -$1,471 $2,895 $1,277Provision for impairment of long-lived assets $792 $1,261 $727Stock-based compensation expense $6,495 $6,757 $7,188 $7,058(Credit) provision for deferred income taxes $2,706 $1,075 -$2,713 -$1,592Provision for impairment of long-lived assets $675 $387 $264 $1,165Excess tax benefit from exercise of employee stock o $2,814 $3,474 $3,312 -$3,398 -$4,595 -$4,645 -$4,117Debt Extenguishment costs $5,283Payment for hedge termination -$5,640Other $212 $380 -$141 $145 $500 $625 $185Increase in operating assets:Restricted cash -$8,965Accounts and notes receivable -$1,228 -$1,152 -$3,291 -$737 -$2,481 -$2,275 -$709Inventories and prepaid expenses -$308 -$2,530 $1,666 -$1,691 -$1,371 -$2,267 $159Increase in operating liabilities:Accounts payable $590 -$1,235 $1,098 $2,702 $5,847 $2,821 $106Accrued and other liabilities $2,129 $6,703 $5,112 $6,672 $16,417 $9,496 $17,798Total adjustments $31,794 $41,743 $48,757 $57,149 $68,734 $58,247 $66,479Net cash provided by operating activities $65,699 $83,483 $90,211 $103,260 $127,685 $127,473 $119,511 $136,835 $159,926 $175,919 $204,894 $225,383 $261,695 $287,864 $316,651 $348,316 $383,147
Cash flows from investing activities:Purchases of property and equipment -$61,499 -$50,572 -$54,417 -$57,728 -$85,905 -$86,863 -$110,912Acquisition of businesses, net of cash received -$29,120 -$20,505 -$35,557 -$8,518 -$820 -$14,601 -$10,760Acquisition of real estate, net of cash received -$12,125 $12,619Investments in direct financing leases -$862 -$893 -$654 -$539 -$320 -$237 -$302Collections on direct financing leases $850 $810 $1,074 $1,124 $1,266 $1,342 $1,544Proceeds from dispositions of assets $2,911 $4,072 $9,151 $18,505 $8,882 $5,271 $13,668(Increase) decrease in intangibles and other assets -$2,183 -$1,234 -$4,395 $434 -$1,053 -$757 -$456Net cash used in investing activities -$89,903 -$68,322 -$84,798 -$46,722 -$77,950 -$107,970 -$94,599 $39,047 -$60,547 -$66,601 -$73,261 -$80,588 -$88,646 -$97,511 -$107,262 -$117,988 -$129,787Free Cash Flows - CFFO-CFFI -$24,204 $15,161 $5,413 $56,538 $49,735 $19,503 $24,912 $175,882 $99,380 $109,318 $131,632 $144,796 $173,049 $190,353 $209,389 $230,328 $253,360
Cash flows from financing activitiesProceeds from borrowings $238,685 $115,275 $171,523 $76,421 $127,415 $274,763Payments on long-term debt -$213,929 -$115,083 -$141,310 -$141,978 -$149,390 -$206,806Purchases of treasury stock -$1,843 -$17,137 -$35,252 -$3,067 -$42,324 -$93,689Payments on capital lease obligations -$744 -$887 -$1,793 -$1,839 -$2,139 -$2,444Capitalization of Operating Leases -$46,551 -$68,564 -$65,605 -$91,594 -$101,751Exercises of stock options $5,529 $4,651 $5,678 $5,310 $10,546 $7,194Excess tax benefit from exercise of employee stock options $3,398 $4,595 $4,645Net cash used in financing activities $27,698 -$59,732 -$69,718 -$127,360 -$142,891 -$118,088
Net increase (decrease) in cash and cash $3,494 -$44,571 -$64,305 -$70,822 -$93,156 -$98,585Cash and cash equivalents at beginning of the year $3,477 $6,971 $8,951 $13,210 $7,993 $6,431Cash and cash equivalents at end of the year $6,971 $8,951 $13,210 $7,993 $6,431 -$92,154
CFFO/Sales 0.20 0.21 0.20 0.19 0.20 0.18 0.16 0.16 0.17 0.17 0.18 0.18 0.19 0.19 0.19 0.19 0.19CFFO/NI 1.94 2.00 2.18 2.24 2.17 1.84 2.00 2.00 2.00 2.00 2.00 2.00 2.00 2.00 2.00 2.00 2.00CFFO/Operating Income (EBIT) 0.96 0.96 0.97 0.99 1.04 0.94 0.95 0.95 0.95 0.95 0.95 0.95 0.95 0.95 0.95 0.95 0.95CFFO/Gross Profit 0.25 0.27 0.26 0.25 0.26 0.24 0.24 0.24 0.24 0.24 0.24 0.24 0.24 0.24 0.24 0.24 0.24
Consolidated Statements of Cash Flows - After Restatement (thousands)Sonic Corp.
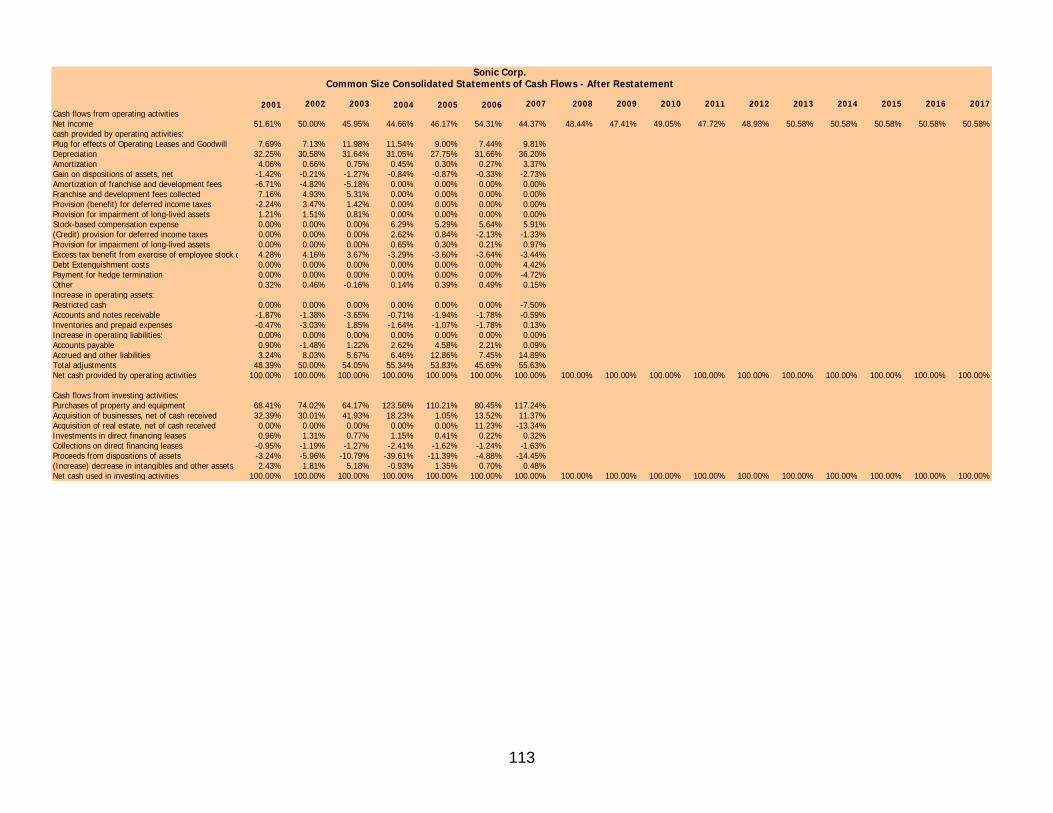
113
2001 2002 2003 2004 2005 2006 2007 2008 2009 2010 2011 2012 2013 2014 2015 2016 2017Cash flows from operating activitiesNet income 51.61% 50.00% 45.95% 44.66% 46.17% 54.31% 44.37% 48.44% 47.41% 49.05% 47.72% 48.98% 50.58% 50.58% 50.58% 50.58% 50.58%cash provided by operating activities:Plug for effects of Operating Leases and Goodwill 7.69% 7.13% 11.98% 11.54% 9.00% 7.44% 9.81%Depreciation 32.25% 30.58% 31.64% 31.05% 27.75% 31.66% 36.20%Amortization 4.06% 0.66% 0.75% 0.45% 0.30% 0.27% 3.37%Gain on dispositions of assets, net -1.42% -0.21% -1.27% -0.84% -0.87% -0.33% -2.73%Amortization of franchise and development fees -6.71% -4.82% -5.18% 0.00% 0.00% 0.00% 0.00%Franchise and development fees collected 7.16% 4.93% 5.31% 0.00% 0.00% 0.00% 0.00%Provision (benefit) for deferred income taxes -2.24% 3.47% 1.42% 0.00% 0.00% 0.00% 0.00%Provision for impairment of long-lived assets 1.21% 1.51% 0.81% 0.00% 0.00% 0.00% 0.00%Stock-based compensation expense 0.00% 0.00% 0.00% 6.29% 5.29% 5.64% 5.91%(Credit) provision for deferred income taxes 0.00% 0.00% 0.00% 2.62% 0.84% -2.13% -1.33%Provision for impairment of long-lived assets 0.00% 0.00% 0.00% 0.65% 0.30% 0.21% 0.97%Excess tax benefit from exercise of employee stock o 4.28% 4.16% 3.67% -3.29% -3.60% -3.64% -3.44%Debt Extenguishment costs 0.00% 0.00% 0.00% 0.00% 0.00% 0.00% 4.42%Payment for hedge termination 0.00% 0.00% 0.00% 0.00% 0.00% 0.00% -4.72%Other 0.32% 0.46% -0.16% 0.14% 0.39% 0.49% 0.15%Increase in operating assets:Restricted cash 0.00% 0.00% 0.00% 0.00% 0.00% 0.00% -7.50%Accounts and notes receivable -1.87% -1.38% -3.65% -0.71% -1.94% -1.78% -0.59%Inventories and prepaid expenses -0.47% -3.03% 1.85% -1.64% -1.07% -1.78% 0.13%Increase in operating liabilities: 0.00% 0.00% 0.00% 0.00% 0.00% 0.00% 0.00%Accounts payable 0.90% -1.48% 1.22% 2.62% 4.58% 2.21% 0.09%Accrued and other liabilities 3.24% 8.03% 5.67% 6.46% 12.86% 7.45% 14.89%Total adjustments 48.39% 50.00% 54.05% 55.34% 53.83% 45.69% 55.63%Net cash provided by operating activities 100.00% 100.00% 100.00% 100.00% 100.00% 100.00% 100.00% 100.00% 100.00% 100.00% 100.00% 100.00% 100.00% 100.00% 100.00% 100.00% 100.00%
Cash flows from investing activities:Purchases of property and equipment 68.41% 74.02% 64.17% 123.56% 110.21% 80.45% 117.24%Acquisition of businesses, net of cash received 32.39% 30.01% 41.93% 18.23% 1.05% 13.52% 11.37%Acquisition of real estate, net of cash received 0.00% 0.00% 0.00% 0.00% 0.00% 11.23% -13.34%Investments in direct financing leases 0.96% 1.31% 0.77% 1.15% 0.41% 0.22% 0.32%Collections on direct financing leases -0.95% -1.19% -1.27% -2.41% -1.62% -1.24% -1.63%Proceeds from dispositions of assets -3.24% -5.96% -10.79% -39.61% -11.39% -4.88% -14.45%(Increase) decrease in intangibles and other assets 2.43% 1.81% 5.18% -0.93% 1.35% 0.70% 0.48%Net cash used in investing activities 100.00% 100.00% 100.00% 100.00% 100.00% 100.00% 100.00% 100.00% 100.00% 100.00% 100.00% 100.00% 100.00% 100.00% 100.00% 100.00% 100.00%
Sonic Corp.Common Size Consolidated Statements of Cash Flows - After Restatement
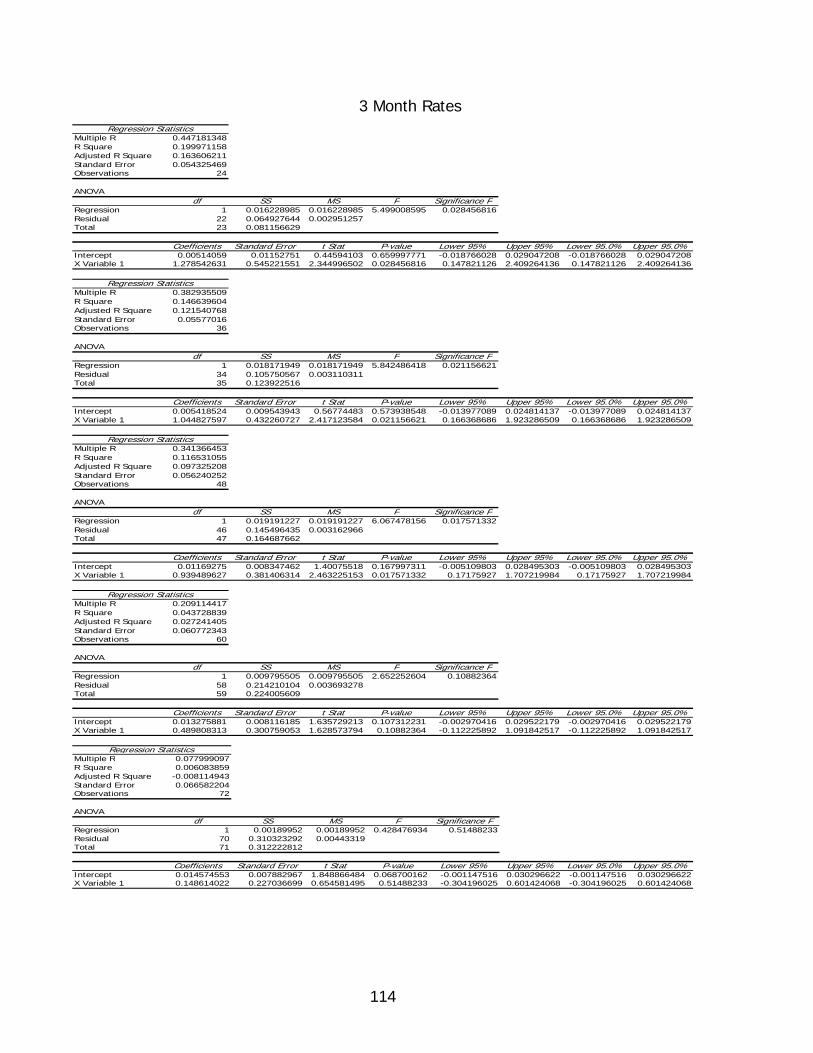
114
3 Month Rates Regression Statistics
Multiple R 0.447181348R Square 0.199971158Adjusted R Square 0.163606211Standard Error 0.054325469Observations 24
ANOVAdf SS MS F Significance F
Regression 1 0.016228985 0.016228985 5.499008595 0.028456816Residual 22 0.064927644 0.002951257Total 23 0.081156629
Coefficients Standard Error t Stat P-value Lower 95% Upper 95% Lower 95.0% Upper 95.0%Intercept 0.00514059 0.01152751 0.44594103 0.659997771 -0.018766028 0.029047208 -0.018766028 0.029047208X Variable 1 1.278542631 0.545221551 2.344996502 0.028456816 0.147821126 2.409264136 0.147821126 2.409264136
Regression StatisticsMultiple R 0.382935509R Square 0.146639604Adjusted R Square 0.121540768Standard Error 0.05577016Observations 36
ANOVAdf SS MS F Significance F
Regression 1 0.018171949 0.018171949 5.842486418 0.021156621Residual 34 0.105750567 0.003110311Total 35 0.123922516
Coefficients Standard Error t Stat P-value Lower 95% Upper 95% Lower 95.0% Upper 95.0%Intercept 0.005418524 0.009543943 0.56774483 0.573938548 -0.013977089 0.024814137 -0.013977089 0.024814137X Variable 1 1.044827597 0.432260727 2.417123584 0.021156621 0.166368686 1.923286509 0.166368686 1.923286509
Regression StatisticsMultiple R 0.341366453R Square 0.116531055Adjusted R Square 0.097325208Standard Error 0.056240252Observations 48
ANOVAdf SS MS F Significance F
Regression 1 0.019191227 0.019191227 6.067478156 0.017571332Residual 46 0.145496435 0.003162966Total 47 0.164687662
Coefficients Standard Error t Stat P-value Lower 95% Upper 95% Lower 95.0% Upper 95.0%Intercept 0.01169275 0.008347462 1.40075518 0.167997311 -0.005109803 0.028495303 -0.005109803 0.028495303X Variable 1 0.939489627 0.381406314 2.463225153 0.017571332 0.17175927 1.707219984 0.17175927 1.707219984
Regression StatisticsMultiple R 0.209114417R Square 0.043728839Adjusted R Square 0.027241405Standard Error 0.060772343Observations 60
ANOVAdf SS MS F Significance F
Regression 1 0.009795505 0.009795505 2.652252604 0.10882364Residual 58 0.214210104 0.003693278Total 59 0.224005609
Coefficients Standard Error t Stat P-value Lower 95% Upper 95% Lower 95.0% Upper 95.0%Intercept 0.013275881 0.008116185 1.635729213 0.107312231 -0.002970416 0.029522179 -0.002970416 0.029522179X Variable 1 0.489808313 0.300759053 1.628573794 0.10882364 -0.112225892 1.091842517 -0.112225892 1.091842517
Regression StatisticsMultiple R 0.077999097R Square 0.006083859Adjusted R Square -0.008114943Standard Error 0.066582204Observations 72
ANOVAdf SS MS F Significance F
Regression 1 0.00189952 0.00189952 0.428476934 0.51488233Residual 70 0.310323292 0.00443319Total 71 0.312222812
Coefficients Standard Error t Stat P-value Lower 95% Upper 95% Lower 95.0% Upper 95.0%Intercept 0.014574553 0.007882967 1.848866484 0.068700162 -0.001147516 0.030296622 -0.001147516 0.030296622X Variable 1 0.148614022 0.227036699 0.654581495 0.51488233 -0.304196025 0.601424068 -0.304196025 0.601424068
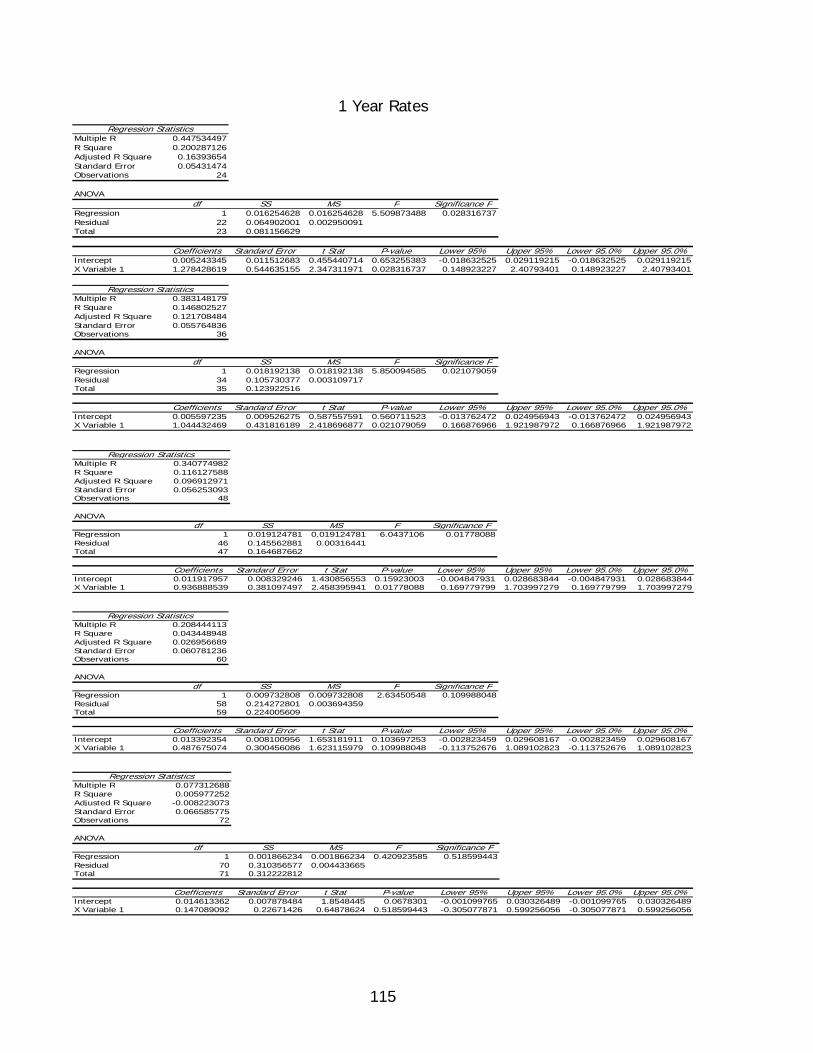
115
1 Year Rates Regression Statistics
Multiple R 0.447534497R Square 0.200287126Adjusted R Square 0.16393654Standard Error 0.05431474Observations 24
ANOVAdf SS MS F Significance F
Regression 1 0.016254628 0.016254628 5.509873488 0.028316737Residual 22 0.064902001 0.002950091Total 23 0.081156629
Coefficients Standard Error t Stat P-value Lower 95% Upper 95% Lower 95.0% Upper 95.0%Intercept 0.005243345 0.011512683 0.455440714 0.653255383 -0.018632525 0.029119215 -0.018632525 0.029119215X Variable 1 1.278428619 0.544635155 2.347311971 0.028316737 0.148923227 2.40793401 0.148923227 2.40793401
Regression StatisticsMultiple R 0.383148179R Square 0.146802527Adjusted R Square 0.121708484Standard Error 0.055764836Observations 36
ANOVAdf SS MS F Significance F
Regression 1 0.018192138 0.018192138 5.850094585 0.021079059Residual 34 0.105730377 0.003109717Total 35 0.123922516
Coefficients Standard Error t Stat P-value Lower 95% Upper 95% Lower 95.0% Upper 95.0%Intercept 0.005597235 0.009526275 0.587557591 0.560711523 -0.013762472 0.024956943 -0.013762472 0.024956943X Variable 1 1.044432469 0.431816189 2.418696877 0.021079059 0.166876966 1.921987972 0.166876966 1.921987972
Regression StatisticsMultiple R 0.340774982R Square 0.116127588Adjusted R Square 0.096912971Standard Error 0.056253093Observations 48
ANOVAdf SS MS F Significance F
Regression 1 0.019124781 0.019124781 6.0437106 0.01778088Residual 46 0.145562881 0.00316441Total 47 0.164687662
Coefficients Standard Error t Stat P-value Lower 95% Upper 95% Lower 95.0% Upper 95.0%Intercept 0.011917957 0.008329246 1.430856553 0.15923003 -0.004847931 0.028683844 -0.004847931 0.028683844X Variable 1 0.936888539 0.381097497 2.458395941 0.01778088 0.169779799 1.703997279 0.169779799 1.703997279
Regression StatisticsMultiple R 0.208444113R Square 0.043448948Adjusted R Square 0.026956689Standard Error 0.060781236Observations 60
ANOVAdf SS MS F Significance F
Regression 1 0.009732808 0.009732808 2.63450548 0.109988048Residual 58 0.214272801 0.003694359Total 59 0.224005609
Coefficients Standard Error t Stat P-value Lower 95% Upper 95% Lower 95.0% Upper 95.0%Intercept 0.013392354 0.008100956 1.653181911 0.103697253 -0.002823459 0.029608167 -0.002823459 0.029608167X Variable 1 0.487675074 0.300456086 1.623115979 0.109988048 -0.113752676 1.089102823 -0.113752676 1.089102823
Regression StatisticsMultiple R 0.077312688R Square 0.005977252Adjusted R Square -0.008223073Standard Error 0.066585775Observations 72
ANOVAdf SS MS F Significance F
Regression 1 0.001866234 0.001866234 0.420923585 0.518599443Residual 70 0.310356577 0.004433665Total 71 0.312222812
Coefficients Standard Error t Stat P-value Lower 95% Upper 95% Lower 95.0% Upper 95.0%Intercept 0.014613362 0.007878484 1.8548445 0.0678301 -0.001099765 0.030326489 -0.001099765 0.030326489X Variable 1 0.147089092 0.22671426 0.64878624 0.518599443 -0.305077871 0.599256056 -0.305077871 0.599256056

116
2 Year Rates Regression Statistics
Multiple R 0.447373848R Square 0.20014336Adjusted R Square 0.16378624Standard Error 0.054319622Observations 24
ANOVAdf SS MS F Significance F
Regression 1 0.01624296 0.01624296 5.504928882 0.028380391Residual 22 0.064913669 0.002950621Total 23 0.081156629
Coefficients Standard Error t Stat P-value Lower 95% Upper 95% Lower 95.0% Upper 95.0%Intercept 0.005137236 0.01152629 0.445697277 0.660171167 -0.018766851 0.029041323 -0.018766851 0.029041323X Variable 1 1.27590145 0.543802594 2.346258486 0.028380391 0.148122686 2.403680214 0.148122686 2.403680214
Regression StatisticsMultiple R 0.383230499R Square 0.146865615Adjusted R Square 0.121773428Standard Error 0.055762775Observations 36
ANOVAdf SS MS F Significance F
Regression 1 0.018199957 0.018199957 5.853041456 0.0210491Residual 34 0.105722559 0.003109487Total 35 0.123922516
Coefficients Standard Error t Stat P-value Lower 95% Upper 95% Lower 95.0% Upper 95.0%Intercept 0.005623565 0.009523443 0.590497036 0.558762353 -0.013730387 0.024977516 -0.013730387 0.024977516X Variable 1 1.043383924 0.431274063 2.419305986 0.0210491 0.166930152 1.919837695 0.166930152 1.919837695
Regression StatisticsMultiple R 0.339432134R Square 0.115214174Adjusted R Square 0.095979699Standard Error 0.056282152Observations 48
ANOVAdf SS MS F Significance F
Regression 1 0.018974353 0.018974353 5.98998292 0.0182645Residual 46 0.145713309 0.003167681Total 47 0.164687662
Coefficients Standard Error t Stat P-value Lower 95% Upper 95% Lower 95.0% Upper 95.0%Intercept 0.012060034 0.008322388 1.449107385 0.154090977 -0.004692048 0.028812117 -0.004692048 0.028812117X Variable 1 0.932484161 0.381003243 2.447444161 0.0182645 0.165565145 1.699403178 0.165565145 1.699403178
Regression StatisticsMultiple R 0.207364803R Square 0.043000162Adjusted R Square 0.026500164Standard Error 0.060795493Observations 60
ANOVAdf SS MS F Significance F
Regression 1 0.009632277 0.009632277 2.60607084 0.11188307Residual 58 0.214373332 0.003696092Total 59 0.224005609
Coefficients Standard Error t Stat P-value Lower 95% Upper 95% Lower 95.0% Upper 95.0%Intercept 0.013489508 0.008090648 1.667296375 0.100846885 -0.002705671 0.029684688 -0.002705671 0.029684688X Variable 1 0.484987616 0.300426018 1.61433294 0.11188307 -0.116379945 1.086355177 -0.116379945 1.086355177
Regression StatisticsMultiple R 0.076430521R Square 0.005841625Adjusted R Square -0.008360638Standard Error 0.066590317Observations 72
ANOVAdf SS MS F Significance F
Regression 1 0.001823888 0.001823888 0.411316478 0.523396482Residual 70 0.310398923 0.00443427Total 71 0.312222812
Coefficients Standard Error t Stat P-value Lower 95% Upper 95% Lower 95.0% Upper 95.0%Intercept 0.014653305 0.007874383 1.86088297 0.066960657 -0.001051644 0.030358253 -0.001051644 0.030358253X Variable 1 0.145135085 0.226299898 0.641339596 0.523396482 -0.306205461 0.596475631 -0.306205461 0.596475631
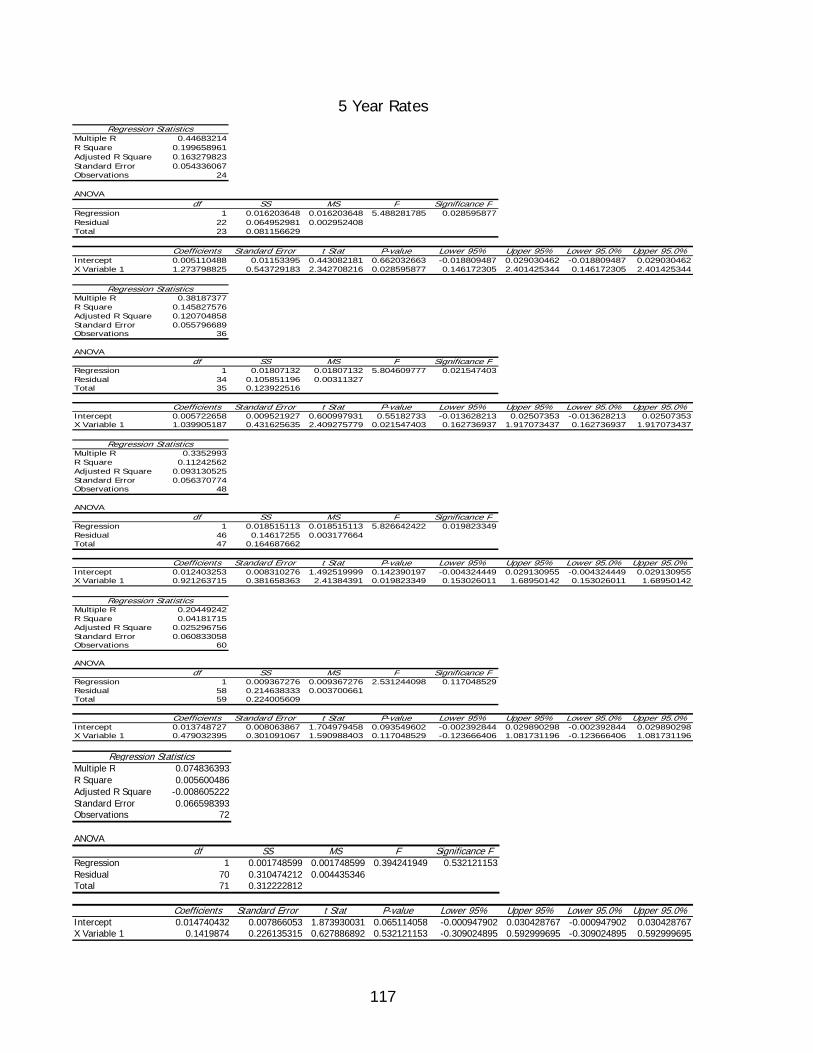
117
5 Year Rates Regression Statistics
Multiple R 0.44683214R Square 0.199658961Adjusted R Square 0.163279823Standard Error 0.054336067Observations 24
ANOVAdf SS MS F Significance F
Regression 1 0.016203648 0.016203648 5.488281785 0.028595877Residual 22 0.064952981 0.002952408Total 23 0.081156629
Coefficients Standard Error t Stat P-value Lower 95% Upper 95% Lower 95.0% Upper 95.0%Intercept 0.005110488 0.01153395 0.443082181 0.662032663 -0.018809487 0.029030462 -0.018809487 0.029030462X Variable 1 1.273798825 0.543729183 2.342708216 0.028595877 0.146172305 2.401425344 0.146172305 2.401425344
Regression StatisticsMultiple R 0.38187377R Square 0.145827576Adjusted R Square 0.120704858Standard Error 0.055796689Observations 36
ANOVAdf SS MS F Significance F
Regression 1 0.01807132 0.01807132 5.804609777 0.021547403Residual 34 0.105851196 0.00311327Total 35 0.123922516
Coefficients Standard Error t Stat P-value Lower 95% Upper 95% Lower 95.0% Upper 95.0%Intercept 0.005722658 0.009521927 0.600997931 0.55182733 -0.013628213 0.02507353 -0.013628213 0.02507353X Variable 1 1.039905187 0.431625635 2.409275779 0.021547403 0.162736937 1.917073437 0.162736937 1.917073437
Regression StatisticsMultiple R 0.3352993R Square 0.11242562Adjusted R Square 0.093130525Standard Error 0.056370774Observations 48
ANOVAdf SS MS F Significance F
Regression 1 0.018515113 0.018515113 5.826642422 0.019823349Residual 46 0.14617255 0.003177664Total 47 0.164687662
Coefficients Standard Error t Stat P-value Lower 95% Upper 95% Lower 95.0% Upper 95.0%Intercept 0.012403253 0.008310276 1.492519999 0.142390197 -0.004324449 0.029130955 -0.004324449 0.029130955X Variable 1 0.921263715 0.381658363 2.41384391 0.019823349 0.153026011 1.68950142 0.153026011 1.68950142
Regression StatisticsMultiple R 0.20449242R Square 0.04181715Adjusted R Square 0.025296756Standard Error 0.060833058Observations 60
ANOVAdf SS MS F Significance F
Regression 1 0.009367276 0.009367276 2.531244098 0.117048529Residual 58 0.214638333 0.003700661Total 59 0.224005609
Coefficients Standard Error t Stat P-value Lower 95% Upper 95% Lower 95.0% Upper 95.0%Intercept 0.013748727 0.008063867 1.704979458 0.093549602 -0.002392844 0.029890298 -0.002392844 0.029890298X Variable 1 0.479032395 0.301091067 1.590988403 0.117048529 -0.123666406 1.081731196 -0.123666406 1.081731196
Regression StatisticsMultiple R 0.074836393R Square 0.005600486Adjusted R Square -0.008605222Standard Error 0.066598393Observations 72
ANOVAdf SS MS F Significance F
Regression 1 0.001748599 0.001748599 0.394241949 0.532121153Residual 70 0.310474212 0.004435346Total 71 0.312222812
Coefficients Standard Error t Stat P-value Lower 95% Upper 95% Lower 95.0% Upper 95.0%Intercept 0.014740432 0.007866053 1.873930031 0.065114058 -0.000947902 0.030428767 -0.000947902 0.030428767X Variable 1 0.1419874 0.226135315 0.627886892 0.532121153 -0.309024895 0.592999695 -0.309024895 0.592999695
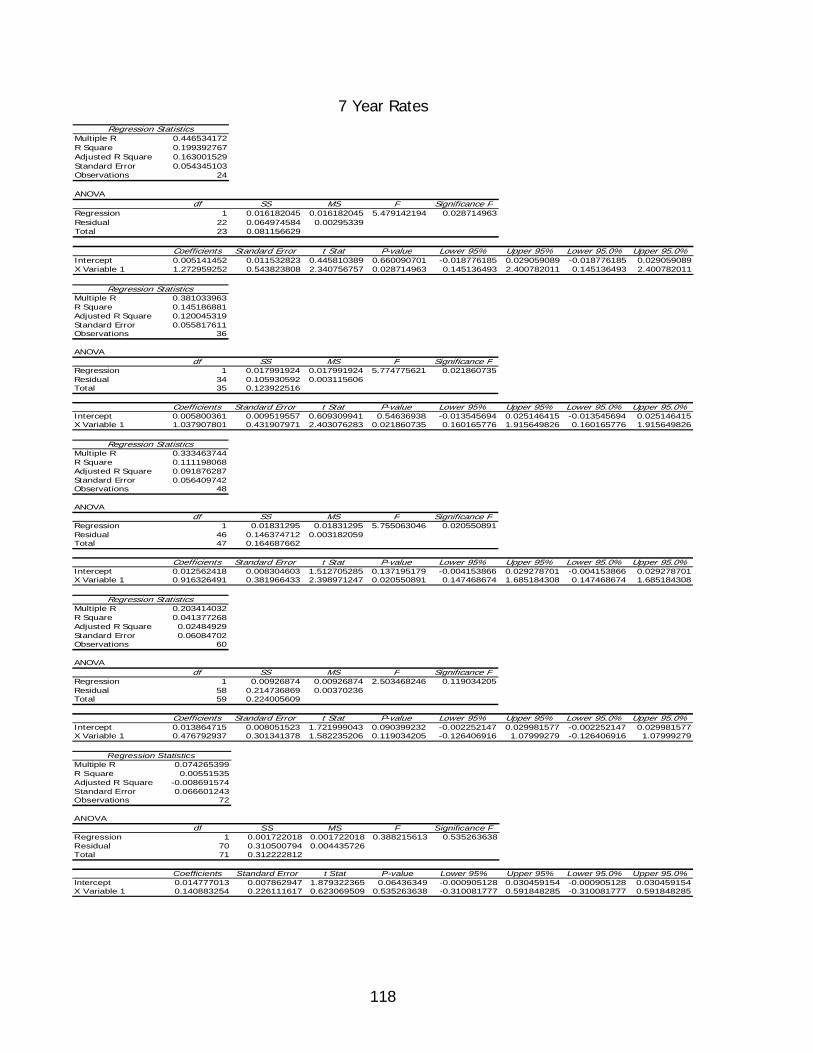
118
7 Year Rates Regression Statistics
Multiple R 0.446534172R Square 0.199392767Adjusted R Square 0.163001529Standard Error 0.054345103Observations 24
ANOVAdf SS MS F Significance F
Regression 1 0.016182045 0.016182045 5.479142194 0.028714963Residual 22 0.064974584 0.00295339Total 23 0.081156629
Coefficients Standard Error t Stat P-value Lower 95% Upper 95% Lower 95.0% Upper 95.0%Intercept 0.005141452 0.011532823 0.445810389 0.660090701 -0.018776185 0.029059089 -0.018776185 0.029059089X Variable 1 1.272959252 0.543823808 2.340756757 0.028714963 0.145136493 2.400782011 0.145136493 2.400782011
Regression StatisticsMultiple R 0.381033963R Square 0.145186881Adjusted R Square 0.120045319Standard Error 0.055817611Observations 36
ANOVAdf SS MS F Significance F
Regression 1 0.017991924 0.017991924 5.774775621 0.021860735Residual 34 0.105930592 0.003115606Total 35 0.123922516
Coefficients Standard Error t Stat P-value Lower 95% Upper 95% Lower 95.0% Upper 95.0%Intercept 0.005800361 0.009519557 0.609309941 0.54636938 -0.013545694 0.025146415 -0.013545694 0.025146415X Variable 1 1.037907801 0.431907971 2.403076283 0.021860735 0.160165776 1.915649826 0.160165776 1.915649826
Regression StatisticsMultiple R 0.333463744R Square 0.111198068Adjusted R Square 0.091876287Standard Error 0.056409742Observations 48
ANOVAdf SS MS F Significance F
Regression 1 0.01831295 0.01831295 5.755063046 0.020550891Residual 46 0.146374712 0.003182059Total 47 0.164687662
Coefficients Standard Error t Stat P-value Lower 95% Upper 95% Lower 95.0% Upper 95.0%Intercept 0.012562418 0.008304603 1.512705285 0.137195179 -0.004153866 0.029278701 -0.004153866 0.029278701X Variable 1 0.916326491 0.381966433 2.398971247 0.020550891 0.147468674 1.685184308 0.147468674 1.685184308
Regression StatisticsMultiple R 0.203414032R Square 0.041377268Adjusted R Square 0.02484929Standard Error 0.06084702Observations 60
ANOVAdf SS MS F Significance F
Regression 1 0.00926874 0.00926874 2.503468246 0.119034205Residual 58 0.214736869 0.00370236Total 59 0.224005609
Coefficients Standard Error t Stat P-value Lower 95% Upper 95% Lower 95.0% Upper 95.0%Intercept 0.013864715 0.008051523 1.721999043 0.090399232 -0.002252147 0.029981577 -0.002252147 0.029981577X Variable 1 0.476792937 0.301341378 1.582235206 0.119034205 -0.126406916 1.07999279 -0.126406916 1.07999279
Regression StatisticsMultiple R 0.074265399R Square 0.00551535Adjusted R Square -0.008691574Standard Error 0.066601243Observations 72
ANOVAdf SS MS F Significance F
Regression 1 0.001722018 0.001722018 0.388215613 0.535263638Residual 70 0.310500794 0.004435726Total 71 0.312222812
Coefficients Standard Error t Stat P-value Lower 95% Upper 95% Lower 95.0% Upper 95.0%Intercept 0.014777013 0.007862947 1.879322365 0.06436349 -0.000905128 0.030459154 -0.000905128 0.030459154X Variable 1 0.140883254 0.226111617 0.623069509 0.535263638 -0.310081777 0.591848285 -0.310081777 0.591848285
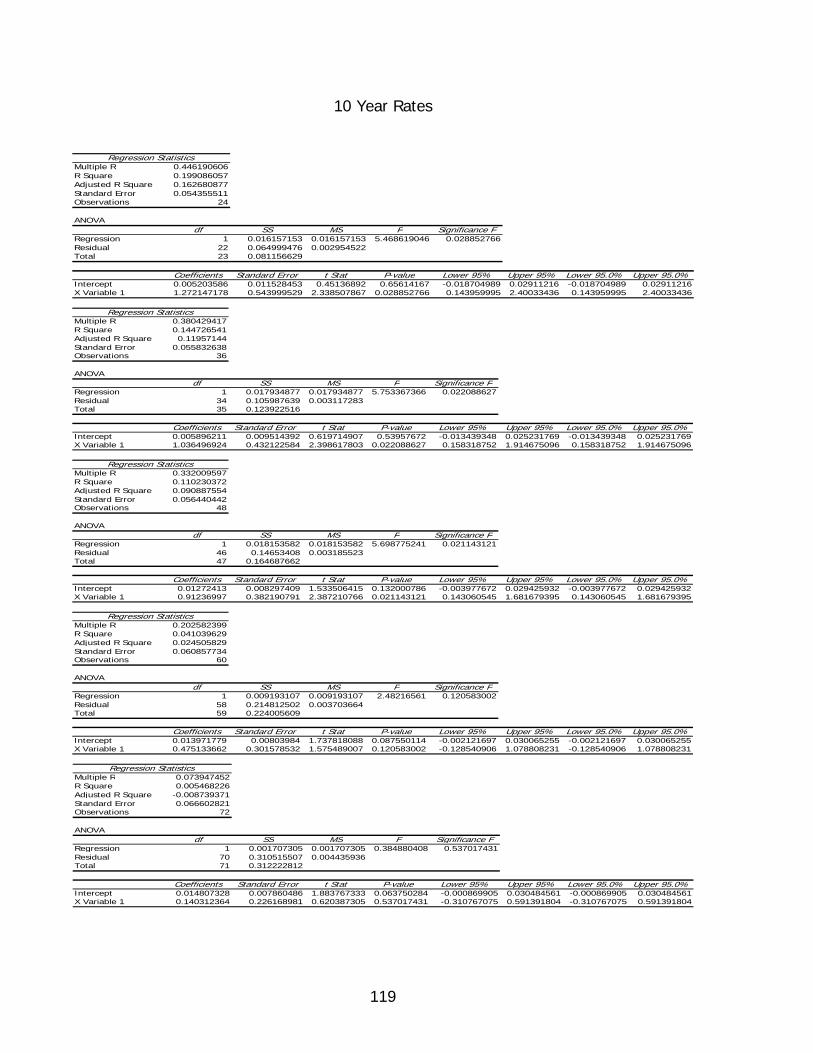
119
10 Year Rates
Regression Statistics
Multiple R 0.446190606R Square 0.199086057Adjusted R Square 0.162680877Standard Error 0.054355511Observations 24
ANOVAdf SS MS F Significance F
Regression 1 0.016157153 0.016157153 5.468619046 0.028852766Residual 22 0.064999476 0.002954522Total 23 0.081156629
Coefficients Standard Error t Stat P-value Lower 95% Upper 95% Lower 95.0% Upper 95.0%Intercept 0.005203586 0.011528453 0.45136892 0.65614167 -0.018704989 0.02911216 -0.018704989 0.02911216X Variable 1 1.272147178 0.543999529 2.338507867 0.028852766 0.143959995 2.40033436 0.143959995 2.40033436
Regression StatisticsMultiple R 0.380429417R Square 0.144726541Adjusted R Square 0.11957144Standard Error 0.055832638Observations 36
ANOVAdf SS MS F Significance F
Regression 1 0.017934877 0.017934877 5.753367366 0.022088627Residual 34 0.105987639 0.003117283Total 35 0.123922516
Coefficients Standard Error t Stat P-value Lower 95% Upper 95% Lower 95.0% Upper 95.0%Intercept 0.005896211 0.009514392 0.619714907 0.53957672 -0.013439348 0.025231769 -0.013439348 0.025231769X Variable 1 1.036496924 0.432122584 2.398617803 0.022088627 0.158318752 1.914675096 0.158318752 1.914675096
Regression StatisticsMultiple R 0.332009597R Square 0.110230372Adjusted R Square 0.090887554Standard Error 0.056440442Observations 48
ANOVAdf SS MS F Significance F
Regression 1 0.018153582 0.018153582 5.698775241 0.021143121Residual 46 0.14653408 0.003185523Total 47 0.164687662
Coefficients Standard Error t Stat P-value Lower 95% Upper 95% Lower 95.0% Upper 95.0%Intercept 0.01272413 0.008297409 1.533506415 0.132000786 -0.003977672 0.029425932 -0.003977672 0.029425932X Variable 1 0.91236997 0.382190791 2.387210766 0.021143121 0.143060545 1.681679395 0.143060545 1.681679395
Regression StatisticsMultiple R 0.202582399R Square 0.041039629Adjusted R Square 0.024505829Standard Error 0.060857734Observations 60
ANOVAdf SS MS F Significance F
Regression 1 0.009193107 0.009193107 2.48216561 0.120583002Residual 58 0.214812502 0.003703664Total 59 0.224005609
Coefficients Standard Error t Stat P-value Lower 95% Upper 95% Lower 95.0% Upper 95.0%Intercept 0.013971779 0.00803984 1.737818088 0.087550114 -0.002121697 0.030065255 -0.002121697 0.030065255X Variable 1 0.475133662 0.301578532 1.575489007 0.120583002 -0.128540906 1.078808231 -0.128540906 1.078808231
Regression StatisticsMultiple R 0.073947452R Square 0.005468226Adjusted R Square -0.008739371Standard Error 0.066602821Observations 72
ANOVAdf SS MS F Significance F
Regression 1 0.001707305 0.001707305 0.384880408 0.537017431Residual 70 0.310515507 0.004435936Total 71 0.312222812
Coefficients Standard Error t Stat P-value Lower 95% Upper 95% Lower 95.0% Upper 95.0%Intercept 0.014807328 0.007860486 1.883767333 0.063750284 -0.000869905 0.030484561 -0.000869905 0.030484561X Variable 1 0.140312364 0.226168981 0.620387305 0.537017431 -0.310767075 0.591391804 -0.310767075 0.591391804
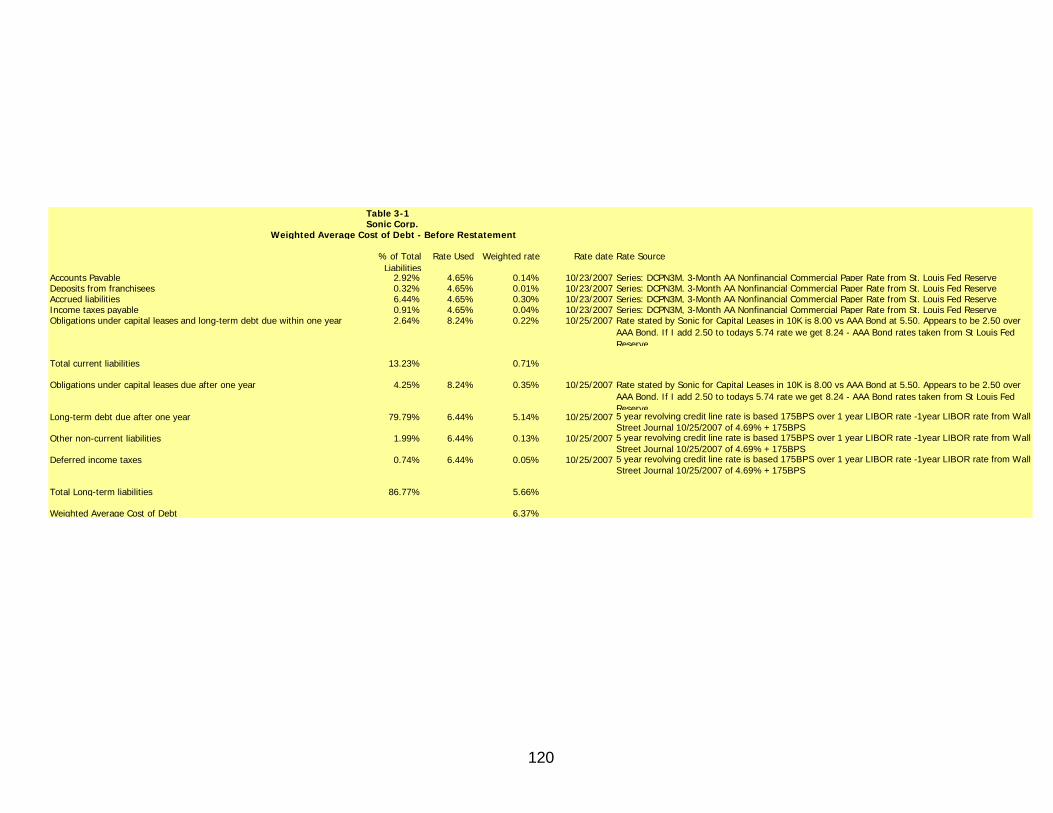
120
Table 3-1Sonic Corp.
Weighted Average Cost of Debt - Before Restatement
% of Total Liabilities
Rate Used Weighted rate Rate date Rate Source
Accounts Payable 2.92% 4.65% 0.14% 10/23/2007 Series: DCPN3M, 3-Month AA Nonfinancial Commercial Paper Rate from St. Louis Fed ReserveDeposits from franchisees 0.32% 4.65% 0.01% 10/23/2007 Series: DCPN3M, 3-Month AA Nonfinancial Commercial Paper Rate from St. Louis Fed ReserveAccrued liabilities 6.44% 4.65% 0.30% 10/23/2007 Series: DCPN3M, 3-Month AA Nonfinancial Commercial Paper Rate from St. Louis Fed ReserveIncome taxes payable 0.91% 4.65% 0.04% 10/23/2007 Series: DCPN3M, 3-Month AA Nonfinancial Commercial Paper Rate from St. Louis Fed ReserveObligations under capital leases and long-term debt due within one year 2.64% 8.24% 0.22% 10/25/2007 Rate stated by Sonic for Capital Leases in 10K is 8.00 vs AAA Bond at 5.50. Appears to be 2.50 over
AAA Bond. If I add 2.50 to todays 5.74 rate we get 8.24 - AAA Bond rates taken from St Louis Fed Reserve
Total current liabilities 13.23% 0.71%
Obligations under capital leases due after one year 4.25% 8.24% 0.35% 10/25/2007 Rate stated by Sonic for Capital Leases in 10K is 8.00 vs AAA Bond at 5.50. Appears to be 2.50 over AAA Bond. If I add 2.50 to todays 5.74 rate we get 8.24 - AAA Bond rates taken from St Louis Fed Reserve
Long-term debt due after one year 79.79% 6.44% 5.14% 10/25/2007 5 year revolving credit line rate is based 175BPS over 1 year LIBOR rate -1year LIBOR rate from Wall Street Journal 10/25/2007 of 4.69% + 175BPS
Other non-current liabilities 1.99% 6.44% 0.13% 10/25/2007 5 year revolving credit line rate is based 175BPS over 1 year LIBOR rate -1year LIBOR rate from Wall Street Journal 10/25/2007 of 4.69% + 175BPS
Deferred income taxes 0.74% 6.44% 0.05% 10/25/2007 5 year revolving credit line rate is based 175BPS over 1 year LIBOR rate -1year LIBOR rate from Wall Street Journal 10/25/2007 of 4.69% + 175BPS
Total Long-term liabilities 86.77% 5.66%
Weighted Average Cost of Debt 6.37%
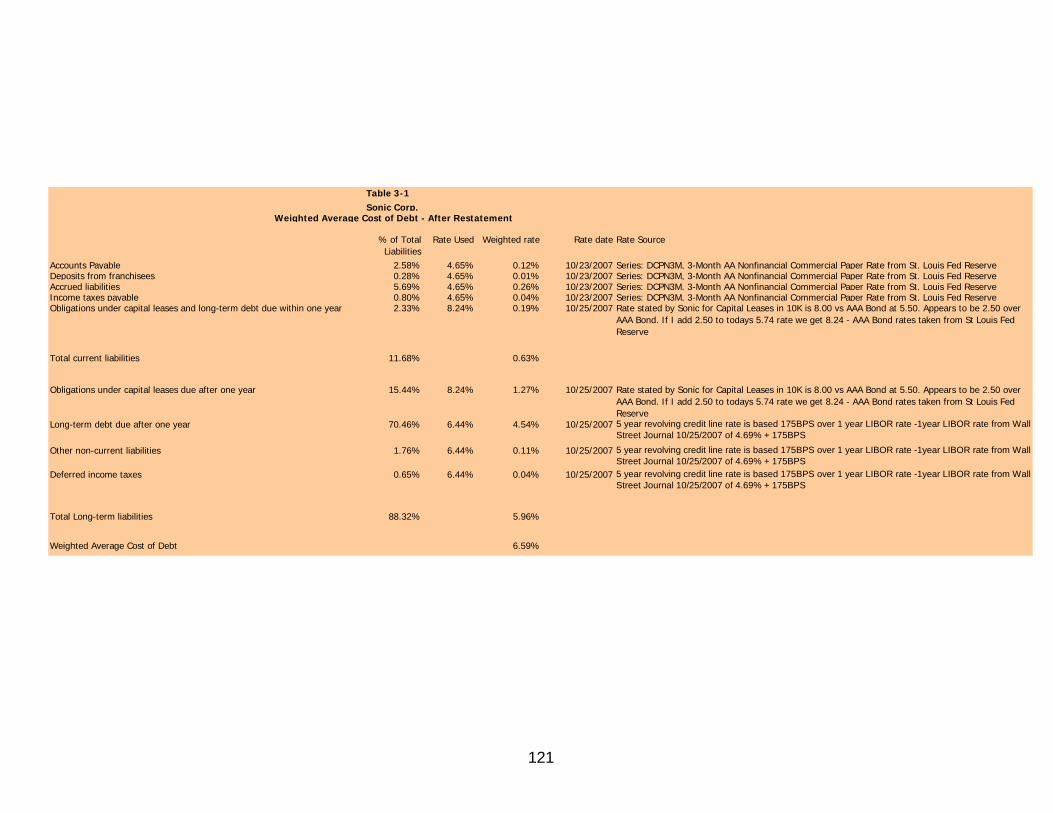
121
Table 3-1Sonic Corp.
Weighted Average Cost of Debt - After Restatement
% of Total Liabilities
Rate Used Weighted rate Rate date Rate Source
Accounts Payable 2.58% 4.65% 0.12% 10/23/2007 Series: DCPN3M, 3-Month AA Nonfinancial Commercial Paper Rate from St. Louis Fed ReserveDeposits from franchisees 0.28% 4.65% 0.01% 10/23/2007 Series: DCPN3M, 3-Month AA Nonfinancial Commercial Paper Rate from St. Louis Fed ReserveAccrued liabilities 5.69% 4.65% 0.26% 10/23/2007 Series: DCPN3M, 3-Month AA Nonfinancial Commercial Paper Rate from St. Louis Fed ReserveIncome taxes payable 0.80% 4.65% 0.04% 10/23/2007 Series: DCPN3M, 3-Month AA Nonfinancial Commercial Paper Rate from St. Louis Fed ReserveObligations under capital leases and long-term debt due within one year 2.33% 8.24% 0.19% 10/25/2007 Rate stated by Sonic for Capital Leases in 10K is 8.00 vs AAA Bond at 5.50. Appears to be 2.50 over
AAA Bond. If I add 2.50 to todays 5.74 rate we get 8.24 - AAA Bond rates taken from St Louis Fed Reserve
Total current liabilities 11.68% 0.63%
Obligations under capital leases due after one year 15.44% 8.24% 1.27% 10/25/2007 Rate stated by Sonic for Capital Leases in 10K is 8.00 vs AAA Bond at 5.50. Appears to be 2.50 over AAA Bond. If I add 2.50 to todays 5.74 rate we get 8.24 - AAA Bond rates taken from St Louis Fed Reserve
Long-term debt due after one year 70.46% 6.44% 4.54% 10/25/2007 5 year revolving credit line rate is based 175BPS over 1 year LIBOR rate -1year LIBOR rate from Wall Street Journal 10/25/2007 of 4.69% + 175BPS
Other non-current liabilities 1.76% 6.44% 0.11% 10/25/2007 5 year revolving credit line rate is based 175BPS over 1 year LIBOR rate -1year LIBOR rate from Wall Street Journal 10/25/2007 of 4.69% + 175BPS
Deferred income taxes 0.65% 6.44% 0.04% 10/25/2007 5 year revolving credit line rate is based 175BPS over 1 year LIBOR rate -1year LIBOR rate from Wall Street Journal 10/25/2007 of 4.69% + 175BPS
Total Long-term liabilities 88.32% 5.96%
Weighted Average Cost of Debt 6.59%
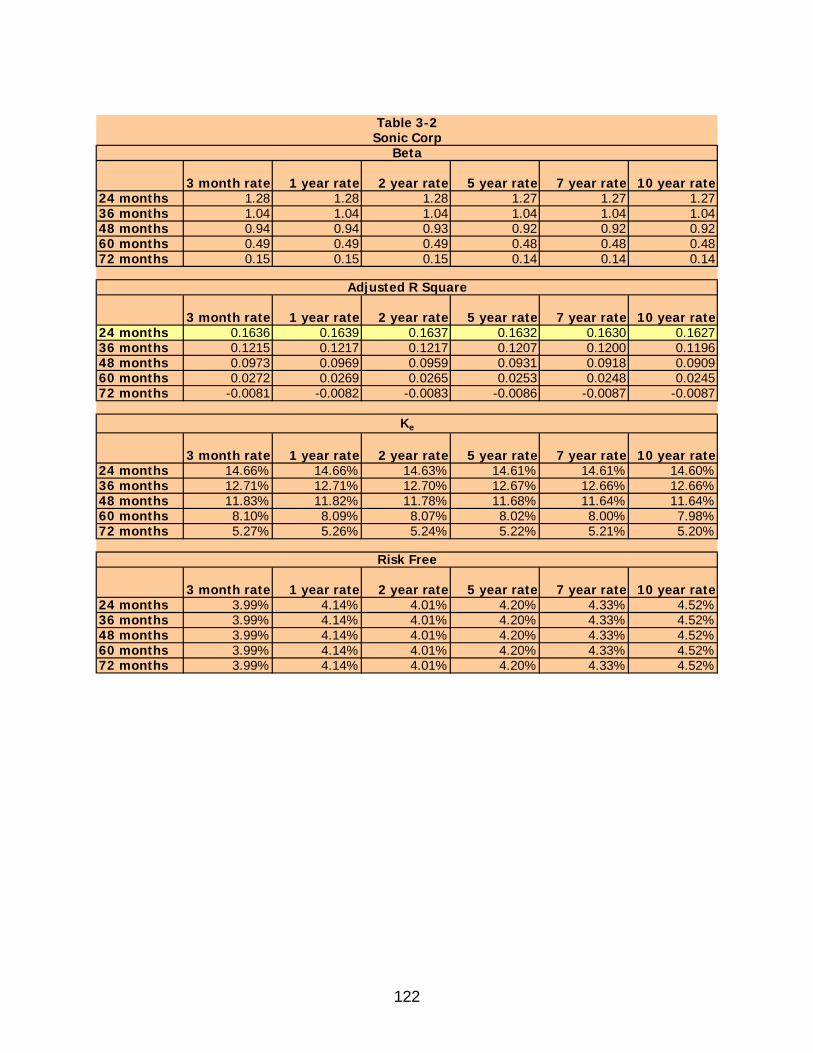
122
3 month rate 1 year rate 2 year rate 5 year rate 7 year rate 10 year rate24 months 1.28 1.28 1.28 1.27 1.27 1.2736 months 1.04 1.04 1.04 1.04 1.04 1.0448 months 0.94 0.94 0.93 0.92 0.92 0.9260 months 0.49 0.49 0.49 0.48 0.48 0.4872 months 0.15 0.15 0.15 0.14 0.14 0.14
3 month rate 1 year rate 2 year rate 5 year rate 7 year rate 10 year rate24 months 0.1636 0.1639 0.1637 0.1632 0.1630 0.162736 months 0.1215 0.1217 0.1217 0.1207 0.1200 0.119648 months 0.0973 0.0969 0.0959 0.0931 0.0918 0.090960 months 0.0272 0.0269 0.0265 0.0253 0.0248 0.024572 months -0.0081 -0.0082 -0.0083 -0.0086 -0.0087 -0.0087
3 month rate 1 year rate 2 year rate 5 year rate 7 year rate 10 year rate24 months 14.66% 14.66% 14.63% 14.61% 14.61% 14.60%36 months 12.71% 12.71% 12.70% 12.67% 12.66% 12.66%48 months 11.83% 11.82% 11.78% 11.68% 11.64% 11.64%60 months 8.10% 8.09% 8.07% 8.02% 8.00% 7.98%72 months 5.27% 5.26% 5.24% 5.22% 5.21% 5.20%
3 month rate 1 year rate 2 year rate 5 year rate 7 year rate 10 year rate24 months 3.99% 4.14% 4.01% 4.20% 4.33% 4.52%36 months 3.99% 4.14% 4.01% 4.20% 4.33% 4.52%48 months 3.99% 4.14% 4.01% 4.20% 4.33% 4.52%60 months 3.99% 4.14% 4.01% 4.20% 4.33% 4.52%72 months 3.99% 4.14% 4.01% 4.20% 4.33% 4.52%
Table 3-2Sonic Corp
Beta
Adjusted R Square
Ke
Risk Free
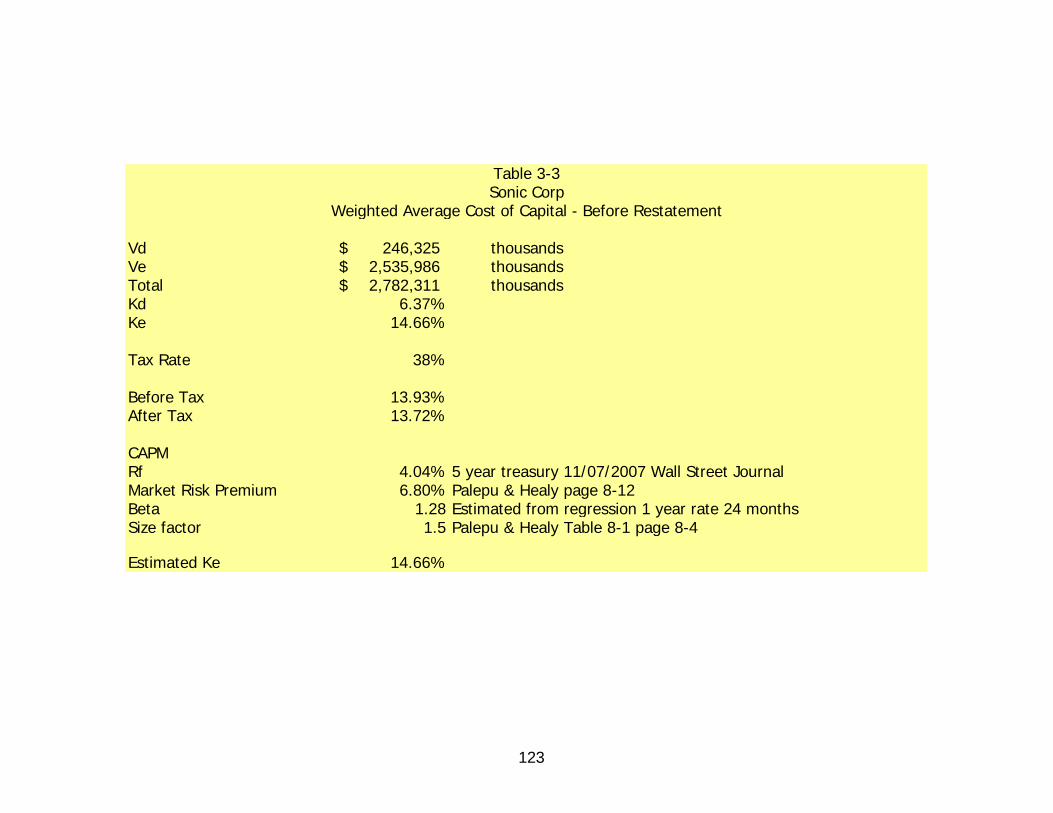
123
Vd 246,325$ thousandsVe 2,535,986$ thousandsTotal 2,782,311$ thousandsKd 6.37%Ke 14.66%
Tax Rate 38%
Before Tax 13.93%After Tax 13.72%
CAPMRf 4.04% 5 year treasury 11/07/2007 Wall Street JournalMarket Risk Premium 6.80% Palepu & Healy page 8-12Beta 1.28 Estimated from regression 1 year rate 24 monthsSize factor 1.5 Palepu & Healy Table 8-1 page 8-4
Estimated Ke 14.66%
Table 3-3Sonic Corp
Weighted Average Cost of Capital - Before Restatement
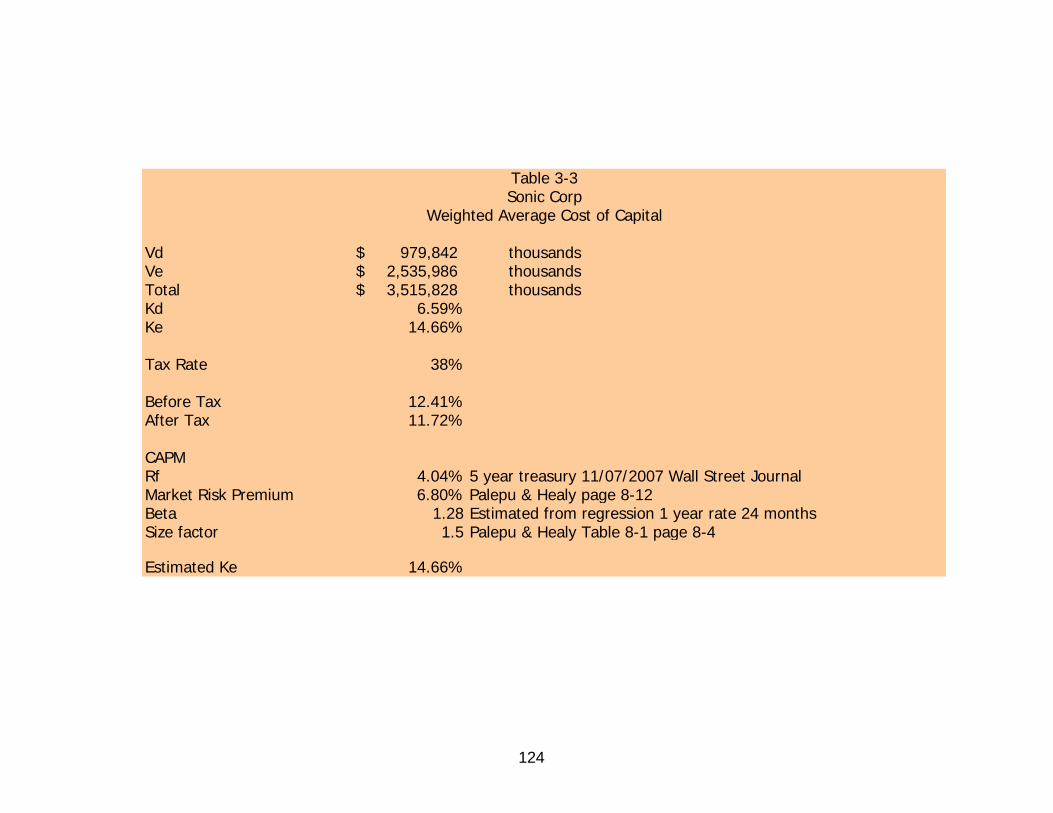
124
Vd 979,842$ thousandsVe 2,535,986$ thousandsTotal 3,515,828$ thousandsKd 6.59%Ke 14.66%
Tax Rate 38%
Before Tax 12.41%After Tax 11.72%
CAPMRf 4.04% 5 year treasury 11/07/2007 Wall Street JournalMarket Risk Premium 6.80% Palepu & Healy page 8-12Beta 1.28 Estimated from regression 1 year rate 24 monthsSize factor 1.5 Palepu & Healy Table 8-1 page 8-4
Estimated Ke 14.66%
Sonic CorpWeighted Average Cost of Capital
Table 3-3
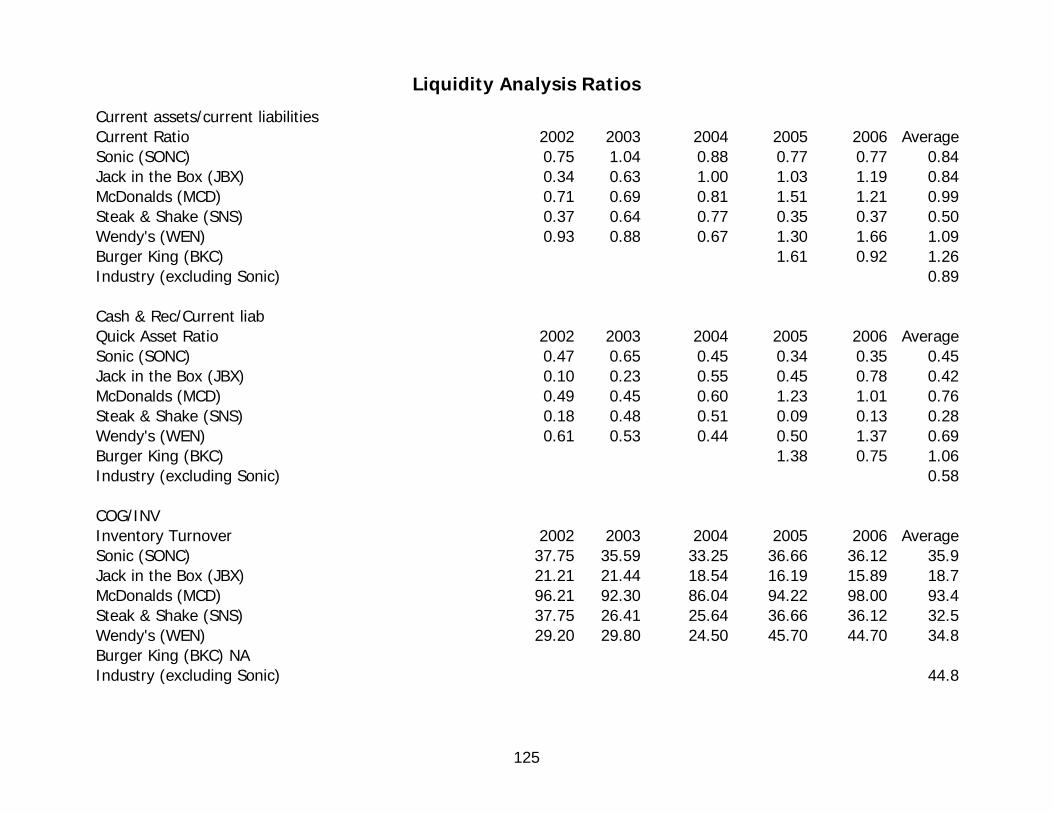
125
Liquidity Analysis Ratios
Current assets/current liabilities Current Ratio 2002 2003 2004 2005 2006 AverageSonic (SONC) 0.75 1.04 0.88 0.77 0.77 0.84Jack in the Box (JBX) 0.34 0.63 1.00 1.03 1.19 0.84McDonalds (MCD) 0.71 0.69 0.81 1.51 1.21 0.99Steak & Shake (SNS) 0.37 0.64 0.77 0.35 0.37 0.50Wendy's (WEN) 0.93 0.88 0.67 1.30 1.66 1.09Burger King (BKC) 1.61 0.92 1.26Industry (excluding Sonic) 0.89 Cash & Rec/Current liab Quick Asset Ratio 2002 2003 2004 2005 2006 AverageSonic (SONC) 0.47 0.65 0.45 0.34 0.35 0.45Jack in the Box (JBX) 0.10 0.23 0.55 0.45 0.78 0.42McDonalds (MCD) 0.49 0.45 0.60 1.23 1.01 0.76Steak & Shake (SNS) 0.18 0.48 0.51 0.09 0.13 0.28Wendy's (WEN) 0.61 0.53 0.44 0.50 1.37 0.69Burger King (BKC) 1.38 0.75 1.06Industry (excluding Sonic) 0.58 COG/INV Inventory Turnover 2002 2003 2004 2005 2006 AverageSonic (SONC) 37.75 35.59 33.25 36.66 36.12 35.9Jack in the Box (JBX) 21.21 21.44 18.54 16.19 15.89 18.7McDonalds (MCD) 96.21 92.30 86.04 94.22 98.00 93.4Steak & Shake (SNS) 37.75 26.41 25.64 36.66 36.12 32.5Wendy's (WEN) 29.20 29.80 24.50 45.70 44.70 34.8Burger King (BKC) NA Industry (excluding Sonic) 44.8
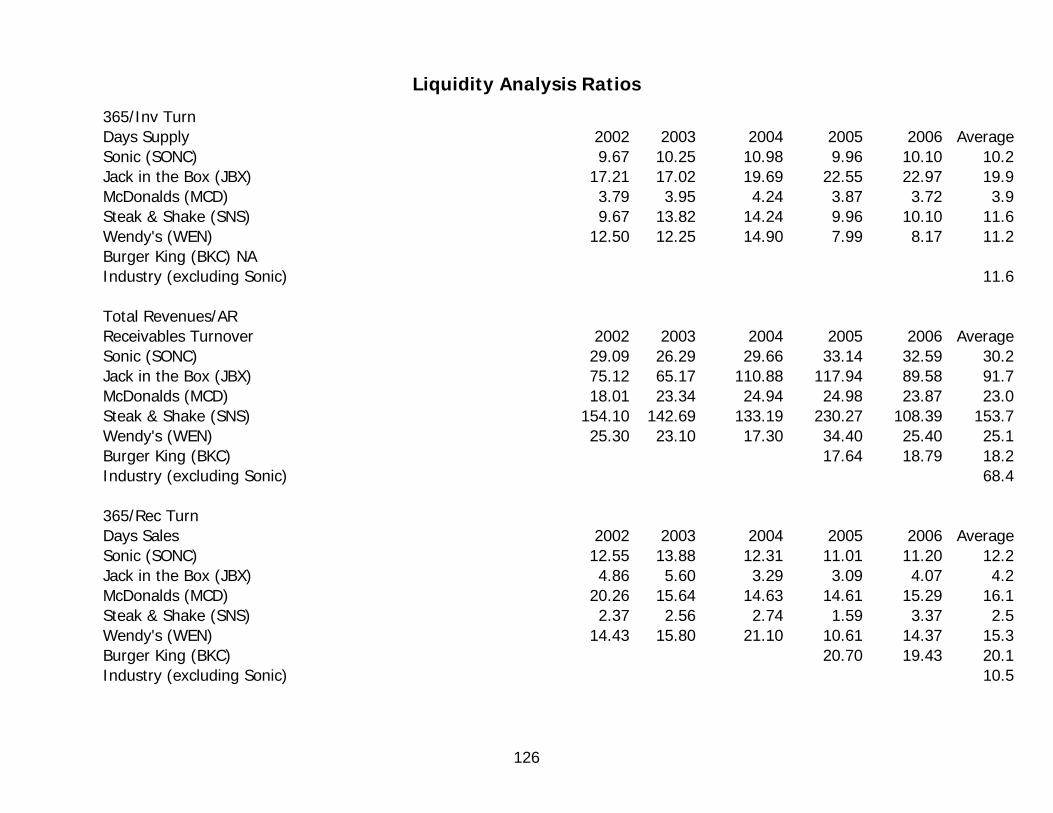
126
Liquidity Analysis Ratios
365/Inv Turn Days Supply 2002 2003 2004 2005 2006 Average Sonic (SONC) 9.67 10.25 10.98 9.96 10.10 10.2 Jack in the Box (JBX) 17.21 17.02 19.69 22.55 22.97 19.9 McDonalds (MCD) 3.79 3.95 4.24 3.87 3.72 3.9 Steak & Shake (SNS) 9.67 13.82 14.24 9.96 10.10 11.6 Wendy's (WEN) 12.50 12.25 14.90 7.99 8.17 11.2 Burger King (BKC) NA Industry (excluding Sonic) 11.6 Total Revenues/AR Receivables Turnover 2002 2003 2004 2005 2006 Average Sonic (SONC) 29.09 26.29 29.66 33.14 32.59 30.2 Jack in the Box (JBX) 75.12 65.17 110.88 117.94 89.58 91.7 McDonalds (MCD) 18.01 23.34 24.94 24.98 23.87 23.0 Steak & Shake (SNS) 154.10 142.69 133.19 230.27 108.39 153.7 Wendy's (WEN) 25.30 23.10 17.30 34.40 25.40 25.1 Burger King (BKC) 17.64 18.79 18.2 Industry (excluding Sonic) 68.4 365/Rec Turn Days Sales 2002 2003 2004 2005 2006 Average Sonic (SONC) 12.55 13.88 12.31 11.01 11.20 12.2 Jack in the Box (JBX) 4.86 5.60 3.29 3.09 4.07 4.2 McDonalds (MCD) 20.26 15.64 14.63 14.61 15.29 16.1 Steak & Shake (SNS) 2.37 2.56 2.74 1.59 3.37 2.5 Wendy's (WEN) 14.43 15.80 21.10 10.61 14.37 15.3 Burger King (BKC) 20.70 19.43 20.1 Industry (excluding Sonic) 10.5
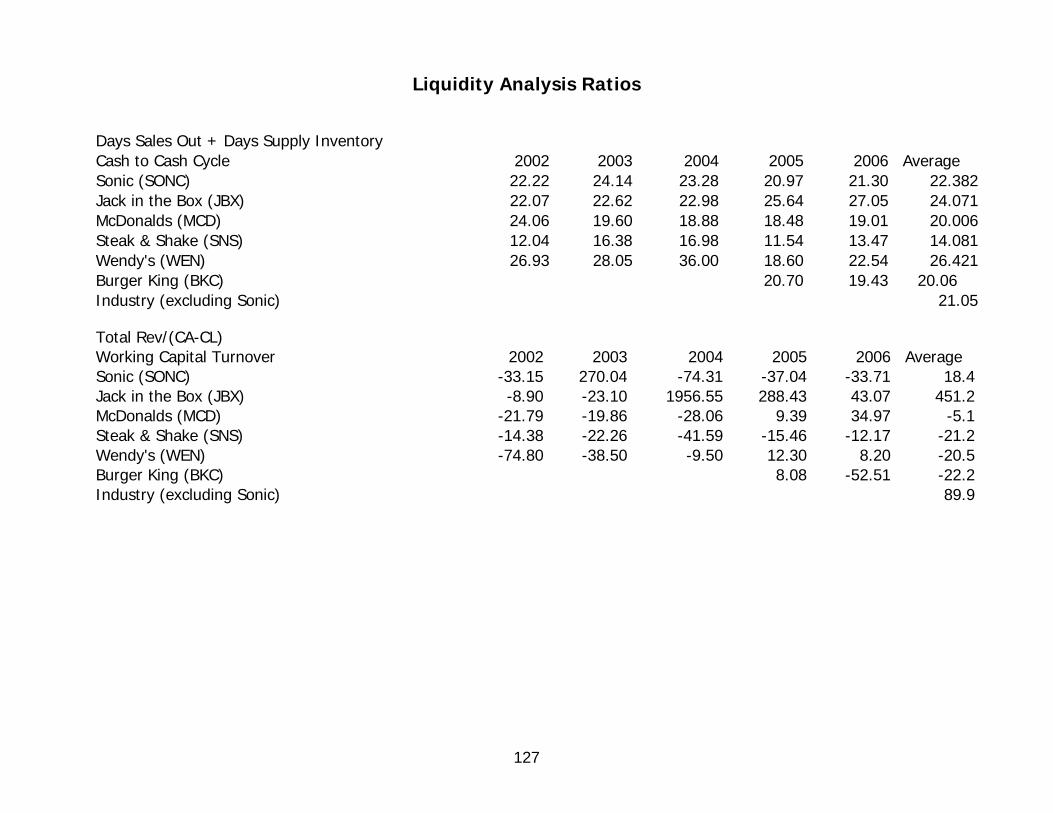
127
Liquidity Analysis Ratios
Days Sales Out + Days Supply Inventory Cash to Cash Cycle 2002 2003 2004 2005 2006 Average Sonic (SONC) 22.22 24.14 23.28 20.97 21.30 22.382Jack in the Box (JBX) 22.07 22.62 22.98 25.64 27.05 24.071McDonalds (MCD) 24.06 19.60 18.88 18.48 19.01 20.006Steak & Shake (SNS) 12.04 16.38 16.98 11.54 13.47 14.081Wendy's (WEN) 26.93 28.05 36.00 18.60 22.54 26.421Burger King (BKC) 20.70 19.43 20.06 Industry (excluding Sonic) 21.05
Total Rev/(CA-CL) Working Capital Turnover 2002 2003 2004 2005 2006 Average Sonic (SONC) -33.15 270.04 -74.31 -37.04 -33.71 18.4Jack in the Box (JBX) -8.90 -23.10 1956.55 288.43 43.07 451.2McDonalds (MCD) -21.79 -19.86 -28.06 9.39 34.97 -5.1Steak & Shake (SNS) -14.38 -22.26 -41.59 -15.46 -12.17 -21.2Wendy's (WEN) -74.80 -38.50 -9.50 12.30 8.20 -20.5Burger King (BKC) 8.08 -52.51 -22.2Industry (excluding Sonic) 89.9
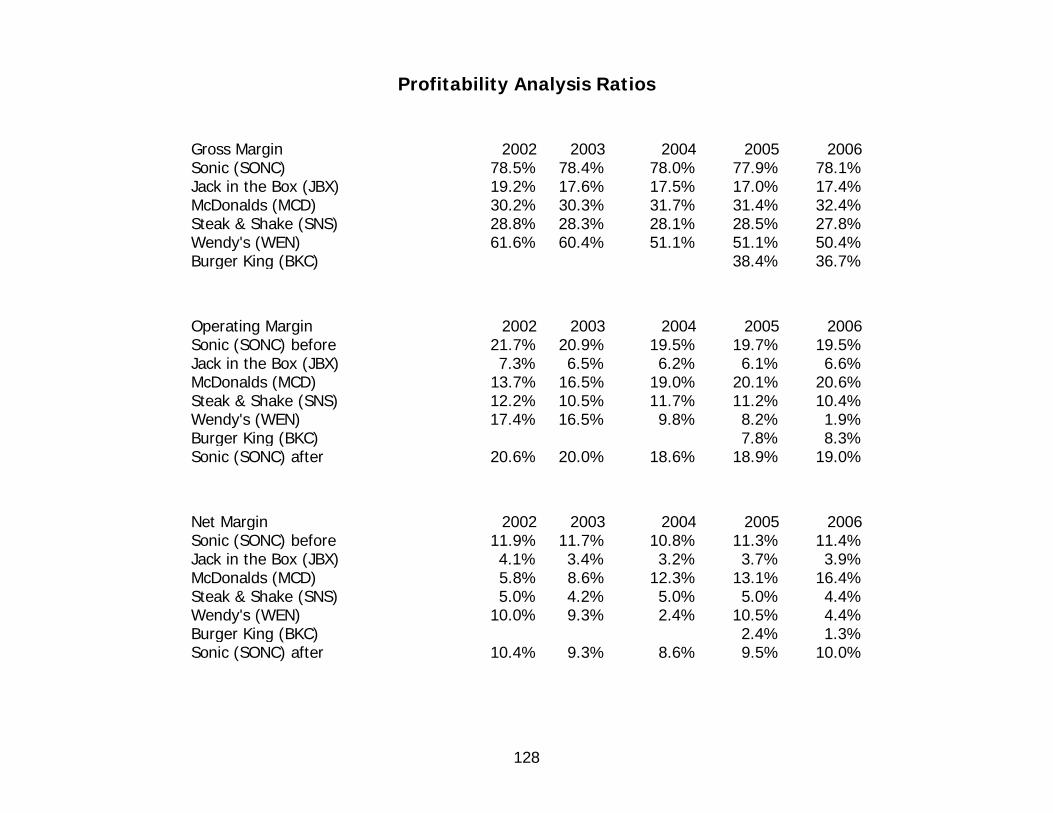
128
Profitability Analysis Ratios
Gross Margin 2002 2003 2004 2005 2006Sonic (SONC) 78.5% 78.4% 78.0% 77.9% 78.1%Jack in the Box (JBX) 19.2% 17.6% 17.5% 17.0% 17.4%McDonalds (MCD) 30.2% 30.3% 31.7% 31.4% 32.4%Steak & Shake (SNS) 28.8% 28.3% 28.1% 28.5% 27.8%Wendy's (WEN) 61.6% 60.4% 51.1% 51.1% 50.4%Burger King (BKC) 38.4% 36.7%
Operating Margin 2002 2003 2004 2005 2006Sonic (SONC) before 21.7% 20.9% 19.5% 19.7% 19.5%Jack in the Box (JBX) 7.3% 6.5% 6.2% 6.1% 6.6%McDonalds (MCD) 13.7% 16.5% 19.0% 20.1% 20.6%Steak & Shake (SNS) 12.2% 10.5% 11.7% 11.2% 10.4%Wendy's (WEN) 17.4% 16.5% 9.8% 8.2% 1.9%Burger King (BKC) 7.8% 8.3%Sonic (SONC) after 20.6% 20.0% 18.6% 18.9% 19.0%
Net Margin 2002 2003 2004 2005 2006Sonic (SONC) before 11.9% 11.7% 10.8% 11.3% 11.4%Jack in the Box (JBX) 4.1% 3.4% 3.2% 3.7% 3.9%McDonalds (MCD) 5.8% 8.6% 12.3% 13.1% 16.4%Steak & Shake (SNS) 5.0% 4.2% 5.0% 5.0% 4.4%Wendy's (WEN) 10.0% 9.3% 2.4% 10.5% 4.4%Burger King (BKC) 2.4% 1.3%Sonic (SONC) after 10.4% 9.3% 8.6% 9.5% 10.0%
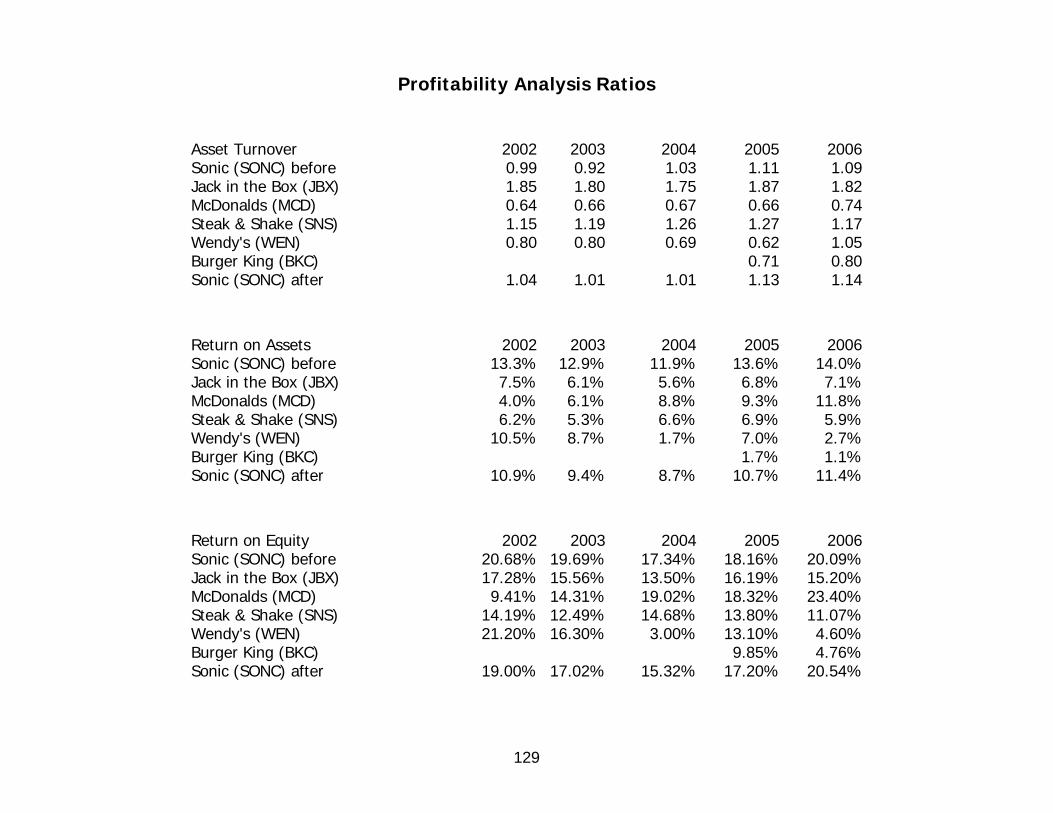
129
Profitability Analysis Ratios
Asset Turnover 2002 2003 2004 2005 2006Sonic (SONC) before 0.99 0.92 1.03 1.11 1.09Jack in the Box (JBX) 1.85 1.80 1.75 1.87 1.82McDonalds (MCD) 0.64 0.66 0.67 0.66 0.74Steak & Shake (SNS) 1.15 1.19 1.26 1.27 1.17Wendy's (WEN) 0.80 0.80 0.69 0.62 1.05Burger King (BKC) 0.71 0.80Sonic (SONC) after 1.04 1.01 1.01 1.13 1.14
Return on Assets 2002 2003 2004 2005 2006Sonic (SONC) before 13.3% 12.9% 11.9% 13.6% 14.0%Jack in the Box (JBX) 7.5% 6.1% 5.6% 6.8% 7.1%McDonalds (MCD) 4.0% 6.1% 8.8% 9.3% 11.8%Steak & Shake (SNS) 6.2% 5.3% 6.6% 6.9% 5.9%Wendy's (WEN) 10.5% 8.7% 1.7% 7.0% 2.7%Burger King (BKC) 1.7% 1.1%Sonic (SONC) after 10.9% 9.4% 8.7% 10.7% 11.4%
Return on Equity 2002 2003 2004 2005 2006Sonic (SONC) before 20.68% 19.69% 17.34% 18.16% 20.09%Jack in the Box (JBX) 17.28% 15.56% 13.50% 16.19% 15.20%McDonalds (MCD) 9.41% 14.31% 19.02% 18.32% 23.40%Steak & Shake (SNS) 14.19% 12.49% 14.68% 13.80% 11.07%Wendy's (WEN) 21.20% 16.30% 3.00% 13.10% 4.60%Burger King (BKC) 9.85% 4.76%Sonic (SONC) after 19.00% 17.02% 15.32% 17.20% 20.54%
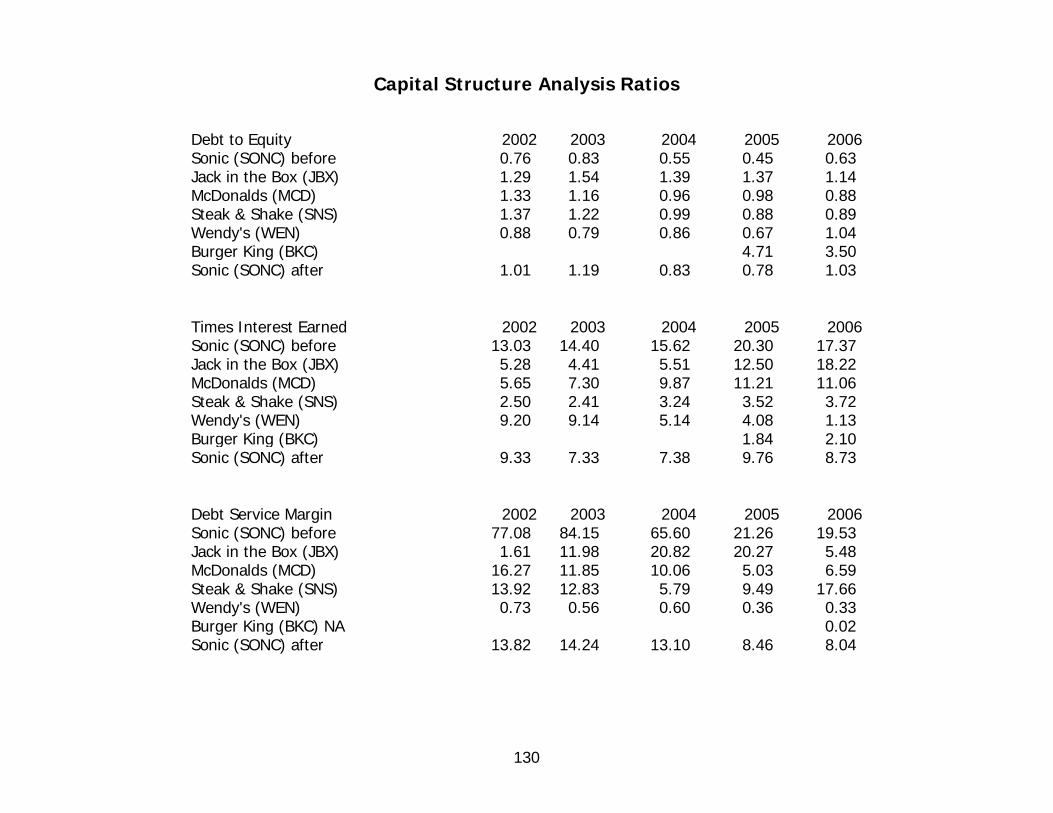
130
Capital Structure Analysis Ratios
Debt to Equity 2002 2003 2004 2005 2006Sonic (SONC) before 0.76 0.83 0.55 0.45 0.63 Jack in the Box (JBX) 1.29 1.54 1.39 1.37 1.14 McDonalds (MCD) 1.33 1.16 0.96 0.98 0.88 Steak & Shake (SNS) 1.37 1.22 0.99 0.88 0.89 Wendy's (WEN) 0.88 0.79 0.86 0.67 1.04 Burger King (BKC) 4.71 3.50 Sonic (SONC) after 1.01 1.19 0.83 0.78 1.03
Times Interest Earned 2002 2003 2004 2005 2006Sonic (SONC) before 13.03 14.40 15.62 20.30 17.37 Jack in the Box (JBX) 5.28 4.41 5.51 12.50 18.22 McDonalds (MCD) 5.65 7.30 9.87 11.21 11.06 Steak & Shake (SNS) 2.50 2.41 3.24 3.52 3.72 Wendy's (WEN) 9.20 9.14 5.14 4.08 1.13 Burger King (BKC) 1.84 2.10 Sonic (SONC) after 9.33 7.33 7.38 9.76 8.73
Debt Service Margin 2002 2003 2004 2005 2006Sonic (SONC) before 77.08 84.15 65.60 21.26 19.53 Jack in the Box (JBX) 1.61 11.98 20.82 20.27 5.48 McDonalds (MCD) 16.27 11.85 10.06 5.03 6.59 Steak & Shake (SNS) 13.92 12.83 5.79 9.49 17.66 Wendy's (WEN) 0.73 0.56 0.60 0.36 0.33 Burger King (BKC) NA 0.02 Sonic (SONC) after 13.82 14.24 13.10 8.46 8.04
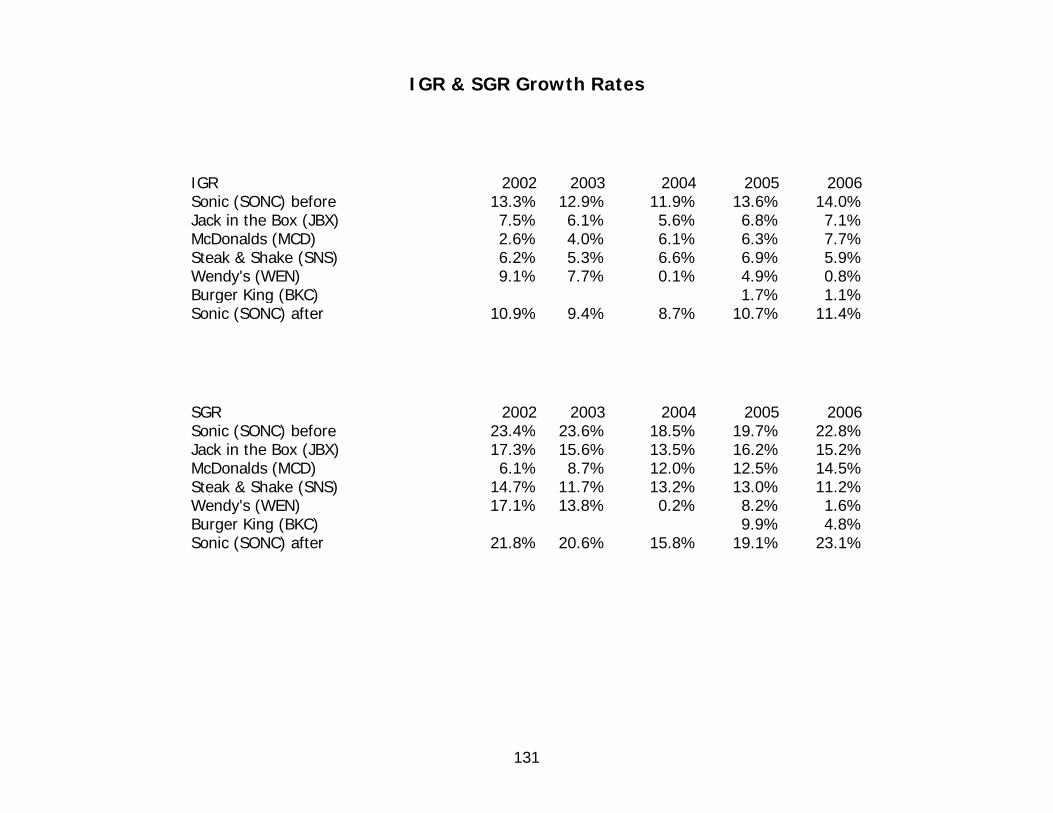
131
IGR & SGR Growth Rates
IGR 2002 2003 2004 2005 2006Sonic (SONC) before 13.3% 12.9% 11.9% 13.6% 14.0%Jack in the Box (JBX) 7.5% 6.1% 5.6% 6.8% 7.1%McDonalds (MCD) 2.6% 4.0% 6.1% 6.3% 7.7%Steak & Shake (SNS) 6.2% 5.3% 6.6% 6.9% 5.9%Wendy's (WEN) 9.1% 7.7% 0.1% 4.9% 0.8%Burger King (BKC) 1.7% 1.1%Sonic (SONC) after 10.9% 9.4% 8.7% 10.7% 11.4%
SGR 2002 2003 2004 2005 2006Sonic (SONC) before 23.4% 23.6% 18.5% 19.7% 22.8%Jack in the Box (JBX) 17.3% 15.6% 13.5% 16.2% 15.2%McDonalds (MCD) 6.1% 8.7% 12.0% 12.5% 14.5%Steak & Shake (SNS) 14.7% 11.7% 13.2% 13.0% 11.2%Wendy's (WEN) 17.1% 13.8% 0.2% 8.2% 1.6%Burger King (BKC) 9.9% 4.8%Sonic (SONC) after 21.8% 20.6% 15.8% 19.1% 23.1%
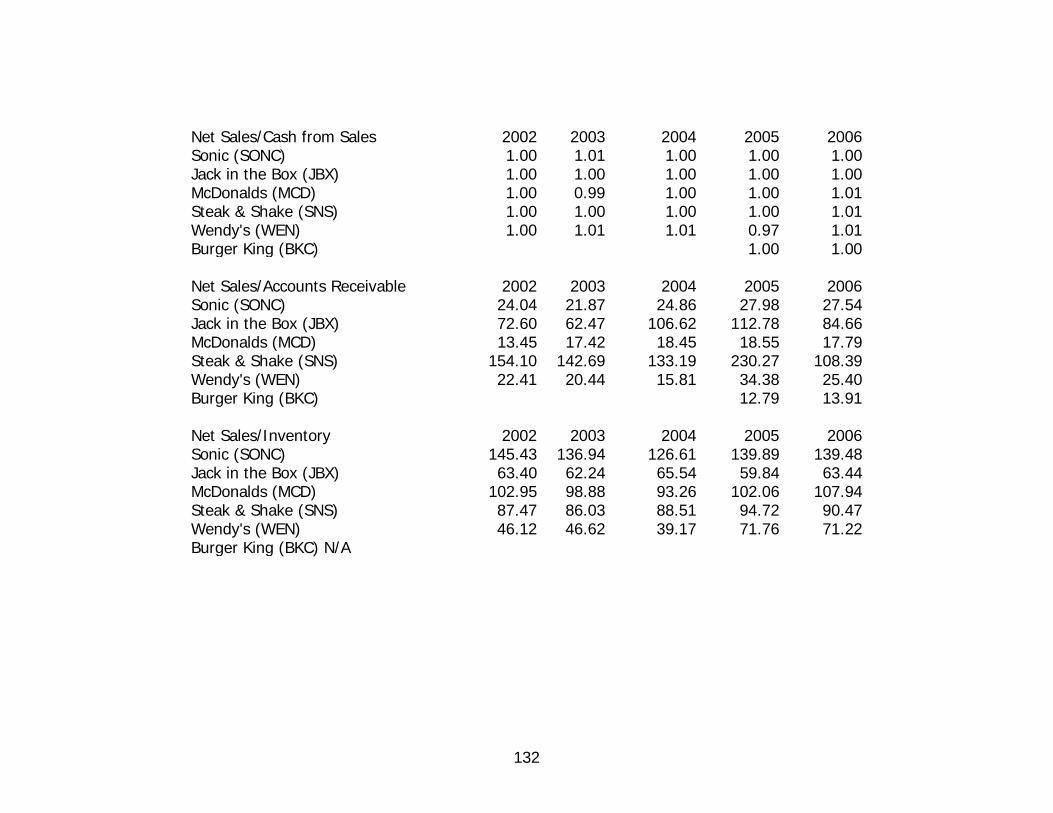
132
Net Sales/Cash from Sales 2002 2003 2004 2005 2006Sonic (SONC) 1.00 1.01 1.00 1.00 1.00Jack in the Box (JBX) 1.00 1.00 1.00 1.00 1.00McDonalds (MCD) 1.00 0.99 1.00 1.00 1.01Steak & Shake (SNS) 1.00 1.00 1.00 1.00 1.01Wendy's (WEN) 1.00 1.01 1.01 0.97 1.01Burger King (BKC) 1.00 1.00
Net Sales/Accounts Receivable 2002 2003 2004 2005 2006Sonic (SONC) 24.04 21.87 24.86 27.98 27.54Jack in the Box (JBX) 72.60 62.47 106.62 112.78 84.66McDonalds (MCD) 13.45 17.42 18.45 18.55 17.79Steak & Shake (SNS) 154.10 142.69 133.19 230.27 108.39Wendy's (WEN) 22.41 20.44 15.81 34.38 25.40Burger King (BKC) 12.79 13.91
Net Sales/Inventory 2002 2003 2004 2005 2006Sonic (SONC) 145.43 136.94 126.61 139.89 139.48Jack in the Box (JBX) 63.40 62.24 65.54 59.84 63.44McDonalds (MCD) 102.95 98.88 93.26 102.06 107.94Steak & Shake (SNS) 87.47 86.03 88.51 94.72 90.47Wendy's (WEN) 46.12 46.62 39.17 71.76 71.22Burger King (BKC) N/A
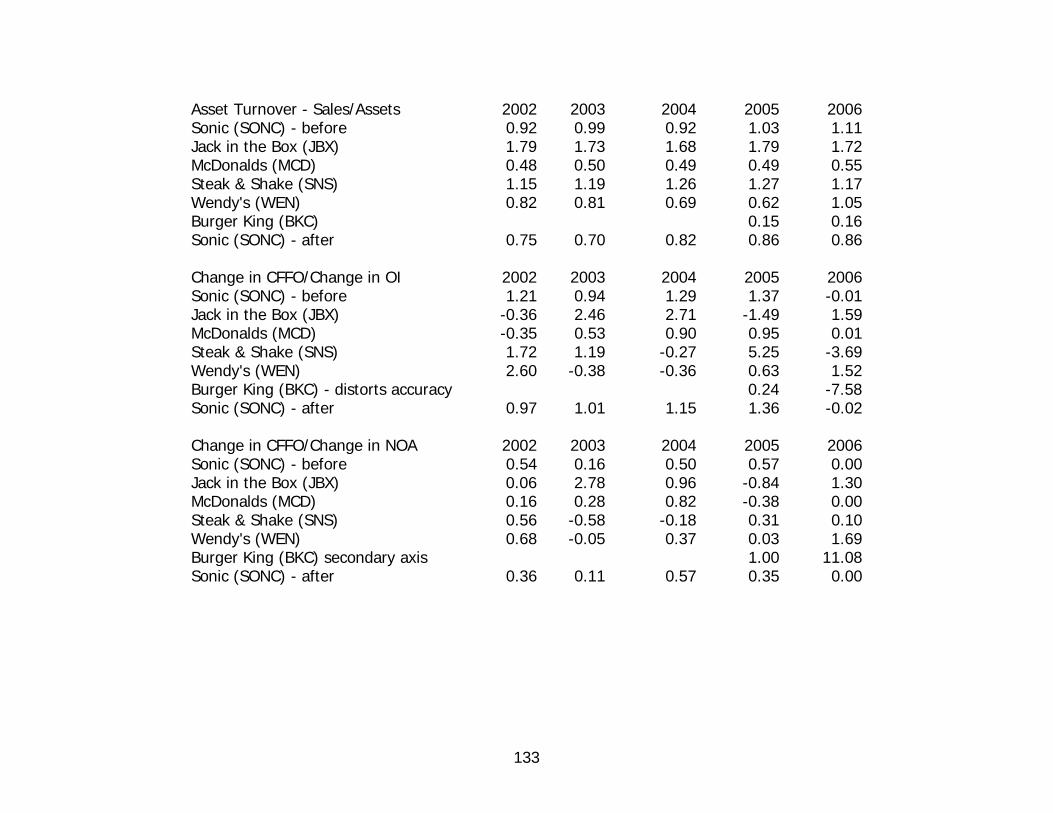
133
Asset Turnover - Sales/Assets 2002 2003 2004 2005 2006Sonic (SONC) - before 0.92 0.99 0.92 1.03 1.11Jack in the Box (JBX) 1.79 1.73 1.68 1.79 1.72McDonalds (MCD) 0.48 0.50 0.49 0.49 0.55Steak & Shake (SNS) 1.15 1.19 1.26 1.27 1.17Wendy's (WEN) 0.82 0.81 0.69 0.62 1.05Burger King (BKC) 0.15 0.16Sonic (SONC) - after 0.75 0.70 0.82 0.86 0.86
Change in CFFO/Change in OI 2002 2003 2004 2005 2006Sonic (SONC) - before 1.21 0.94 1.29 1.37 -0.01Jack in the Box (JBX) -0.36 2.46 2.71 -1.49 1.59McDonalds (MCD) -0.35 0.53 0.90 0.95 0.01Steak & Shake (SNS) 1.72 1.19 -0.27 5.25 -3.69Wendy's (WEN) 2.60 -0.38 -0.36 0.63 1.52Burger King (BKC) - distorts accuracy 0.24 -7.58Sonic (SONC) - after 0.97 1.01 1.15 1.36 -0.02
Change in CFFO/Change in NOA 2002 2003 2004 2005 2006Sonic (SONC) - before 0.54 0.16 0.50 0.57 0.00Jack in the Box (JBX) 0.06 2.78 0.96 -0.84 1.30McDonalds (MCD) 0.16 0.28 0.82 -0.38 0.00Steak & Shake (SNS) 0.56 -0.58 -0.18 0.31 0.10Wendy's (WEN) 0.68 -0.05 0.37 0.03 1.69Burger King (BKC) secondary axis 1.00 11.08Sonic (SONC) - after 0.36 0.11 0.57 0.35 0.00
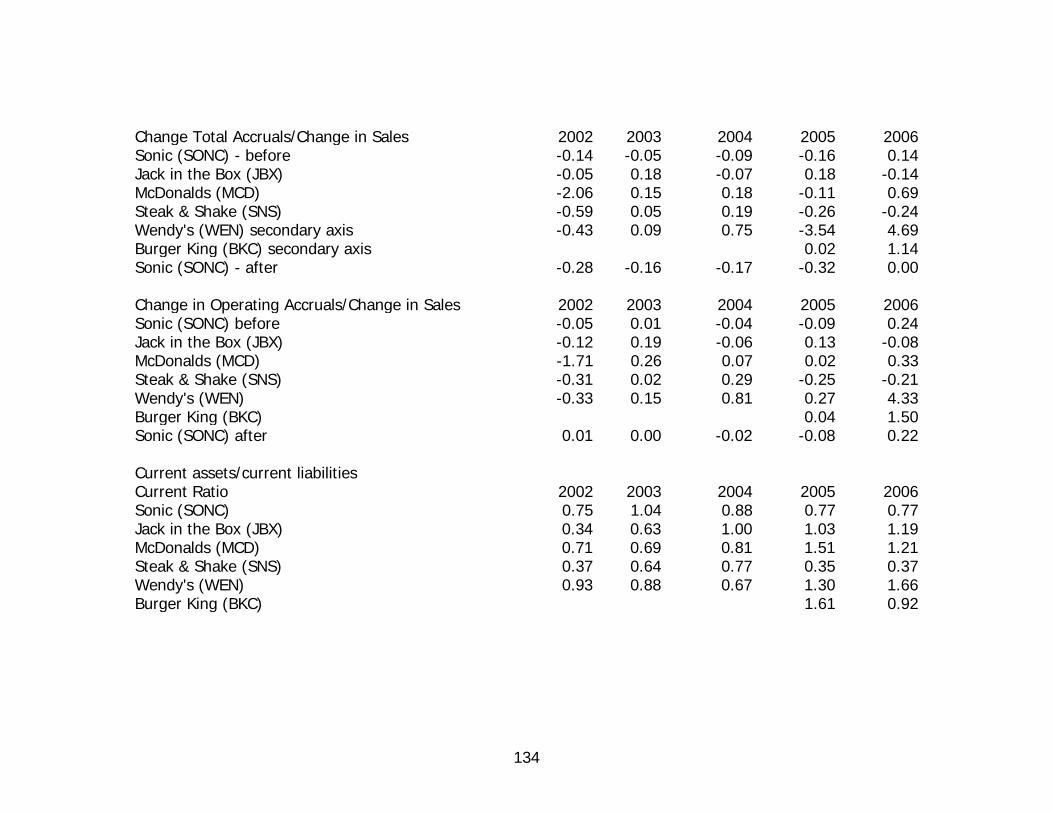
134
Change Total Accruals/Change in Sales 2002 2003 2004 2005 2006Sonic (SONC) - before -0.14 -0.05 -0.09 -0.16 0.14Jack in the Box (JBX) -0.05 0.18 -0.07 0.18 -0.14McDonalds (MCD) -2.06 0.15 0.18 -0.11 0.69Steak & Shake (SNS) -0.59 0.05 0.19 -0.26 -0.24Wendy's (WEN) secondary axis -0.43 0.09 0.75 -3.54 4.69Burger King (BKC) secondary axis 0.02 1.14Sonic (SONC) - after -0.28 -0.16 -0.17 -0.32 0.00
Change in Operating Accruals/Change in Sales 2002 2003 2004 2005 2006Sonic (SONC) before -0.05 0.01 -0.04 -0.09 0.24Jack in the Box (JBX) -0.12 0.19 -0.06 0.13 -0.08McDonalds (MCD) -1.71 0.26 0.07 0.02 0.33Steak & Shake (SNS) -0.31 0.02 0.29 -0.25 -0.21Wendy's (WEN) -0.33 0.15 0.81 0.27 4.33Burger King (BKC) 0.04 1.50Sonic (SONC) after 0.01 0.00 -0.02 -0.08 0.22
Current assets/current liabilitiesCurrent Ratio 2002 2003 2004 2005 2006Sonic (SONC) 0.75 1.04 0.88 0.77 0.77Jack in the Box (JBX) 0.34 0.63 1.00 1.03 1.19McDonalds (MCD) 0.71 0.69 0.81 1.51 1.21Steak & Shake (SNS) 0.37 0.64 0.77 0.35 0.37Wendy's (WEN) 0.93 0.88 0.67 1.30 1.66Burger King (BKC) 1.61 0.92
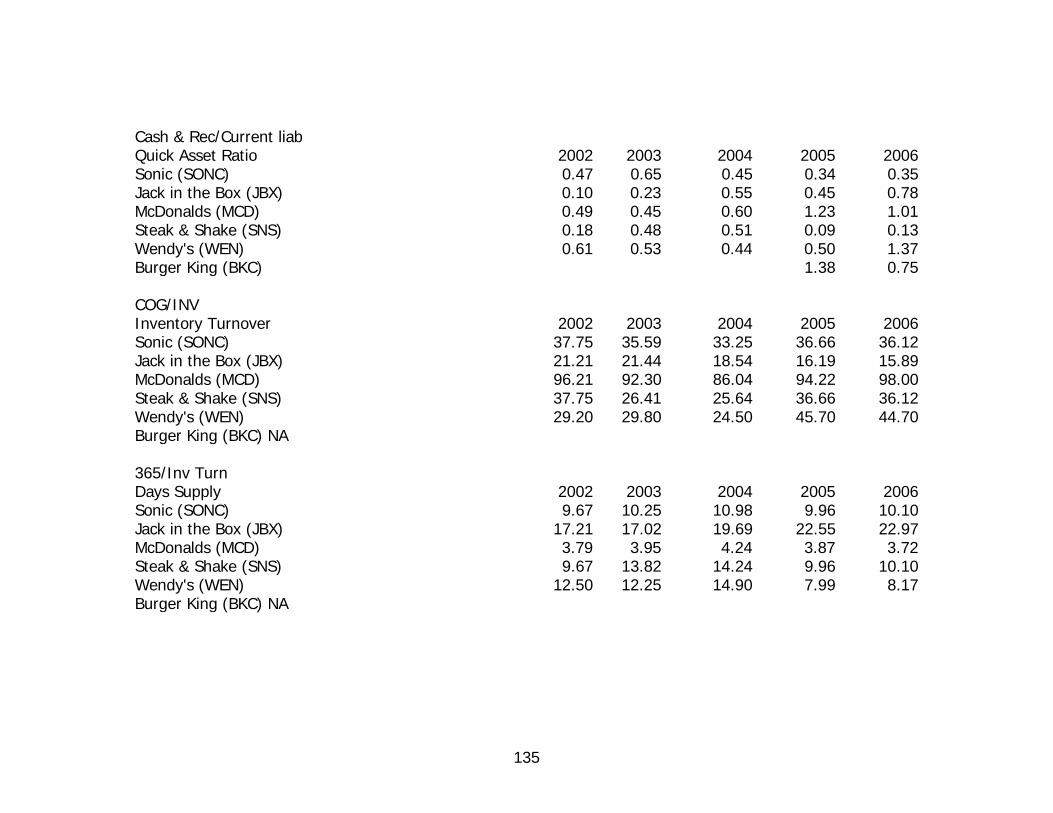
135
Cash & Rec/Current liabQuick Asset Ratio 2002 2003 2004 2005 2006Sonic (SONC) 0.47 0.65 0.45 0.34 0.35Jack in the Box (JBX) 0.10 0.23 0.55 0.45 0.78McDonalds (MCD) 0.49 0.45 0.60 1.23 1.01Steak & Shake (SNS) 0.18 0.48 0.51 0.09 0.13Wendy's (WEN) 0.61 0.53 0.44 0.50 1.37Burger King (BKC) 1.38 0.75
COG/INVInventory Turnover 2002 2003 2004 2005 2006Sonic (SONC) 37.75 35.59 33.25 36.66 36.12Jack in the Box (JBX) 21.21 21.44 18.54 16.19 15.89McDonalds (MCD) 96.21 92.30 86.04 94.22 98.00Steak & Shake (SNS) 37.75 26.41 25.64 36.66 36.12Wendy's (WEN) 29.20 29.80 24.50 45.70 44.70Burger King (BKC) NA
365/Inv TurnDays Supply 2002 2003 2004 2005 2006Sonic (SONC) 9.67 10.25 10.98 9.96 10.10Jack in the Box (JBX) 17.21 17.02 19.69 22.55 22.97McDonalds (MCD) 3.79 3.95 4.24 3.87 3.72Steak & Shake (SNS) 9.67 13.82 14.24 9.96 10.10Wendy's (WEN) 12.50 12.25 14.90 7.99 8.17Burger King (BKC) NA
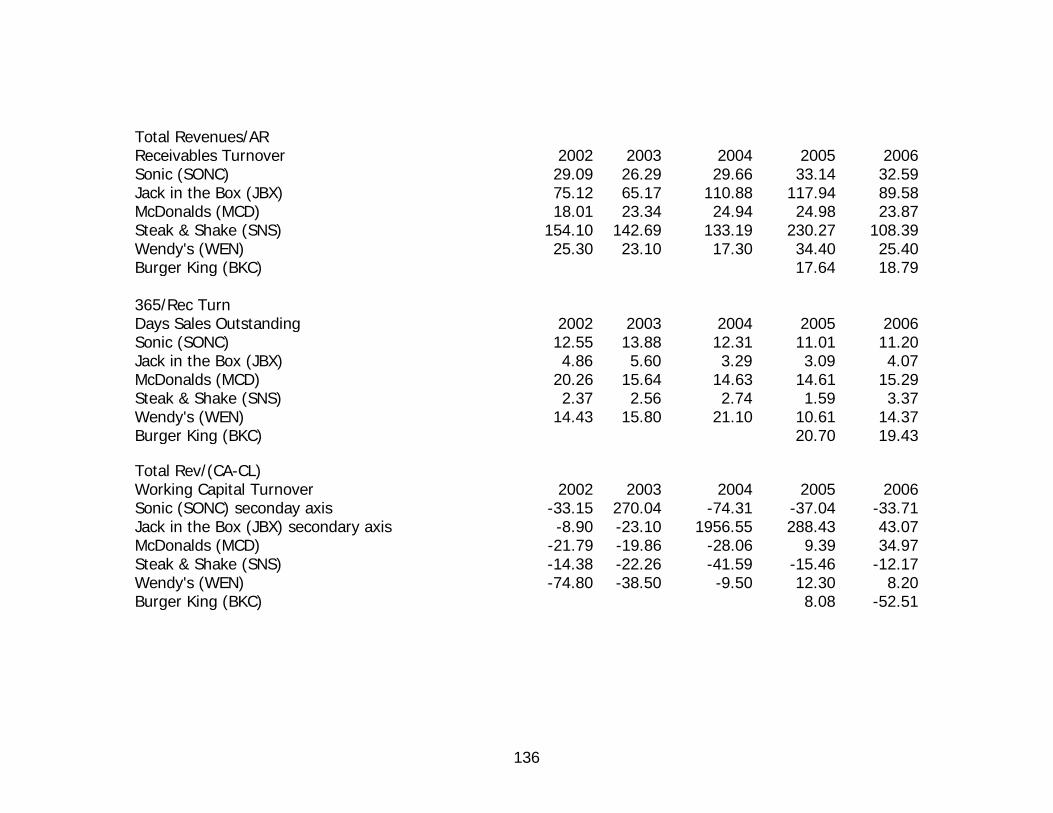
136
Total Revenues/ARReceivables Turnover 2002 2003 2004 2005 2006Sonic (SONC) 29.09 26.29 29.66 33.14 32.59Jack in the Box (JBX) 75.12 65.17 110.88 117.94 89.58McDonalds (MCD) 18.01 23.34 24.94 24.98 23.87Steak & Shake (SNS) 154.10 142.69 133.19 230.27 108.39Wendy's (WEN) 25.30 23.10 17.30 34.40 25.40Burger King (BKC) 17.64 18.79
365/Rec TurnDays Sales Outstanding 2002 2003 2004 2005 2006Sonic (SONC) 12.55 13.88 12.31 11.01 11.20Jack in the Box (JBX) 4.86 5.60 3.29 3.09 4.07McDonalds (MCD) 20.26 15.64 14.63 14.61 15.29Steak & Shake (SNS) 2.37 2.56 2.74 1.59 3.37Wendy's (WEN) 14.43 15.80 21.10 10.61 14.37Burger King (BKC) 20.70 19.43
Total Rev/(CA-CL)Working Capital Turnover 2002 2003 2004 2005 2006Sonic (SONC) seconday axis -33.15 270.04 -74.31 -37.04 -33.71Jack in the Box (JBX) secondary axis -8.90 -23.10 1956.55 288.43 43.07McDonalds (MCD) -21.79 -19.86 -28.06 9.39 34.97Steak & Shake (SNS) -14.38 -22.26 -41.59 -15.46 -12.17Wendy's (WEN) -74.80 -38.50 -9.50 12.30 8.20Burger King (BKC) 8.08 -52.51
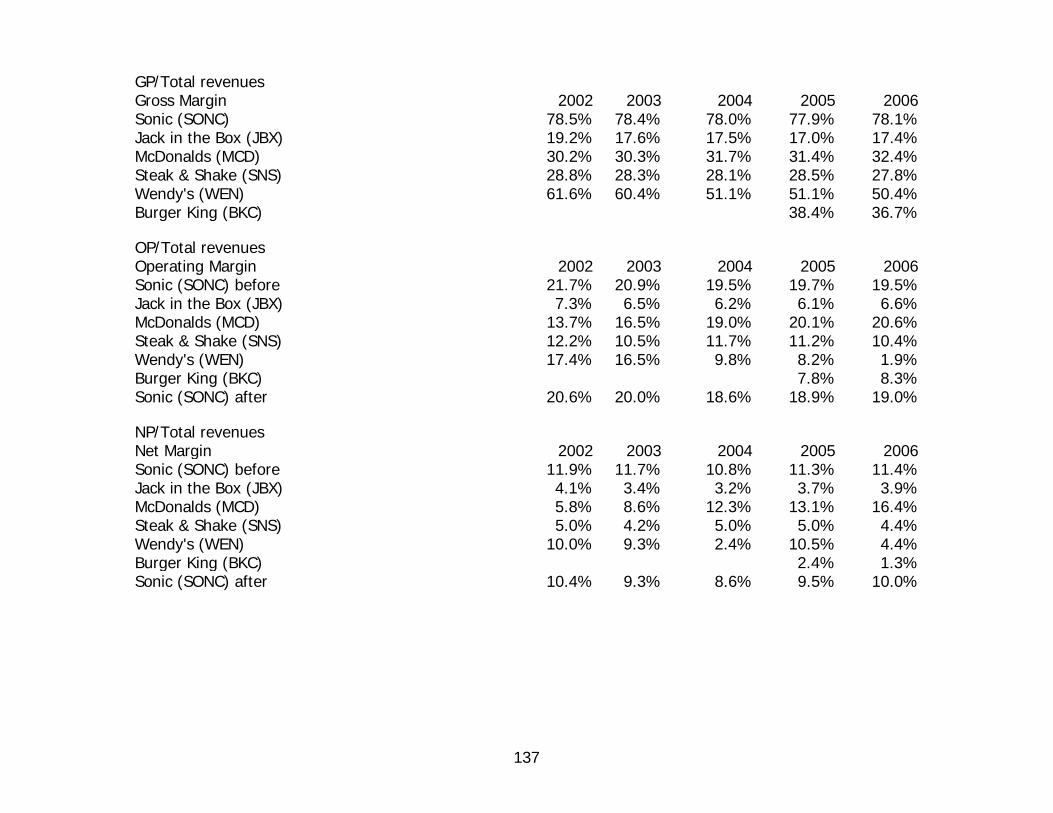
137
GP/Total revenuesGross Margin 2002 2003 2004 2005 2006Sonic (SONC) 78.5% 78.4% 78.0% 77.9% 78.1%Jack in the Box (JBX) 19.2% 17.6% 17.5% 17.0% 17.4%McDonalds (MCD) 30.2% 30.3% 31.7% 31.4% 32.4%Steak & Shake (SNS) 28.8% 28.3% 28.1% 28.5% 27.8%Wendy's (WEN) 61.6% 60.4% 51.1% 51.1% 50.4%Burger King (BKC) 38.4% 36.7%
OP/Total revenuesOperating Margin 2002 2003 2004 2005 2006Sonic (SONC) before 21.7% 20.9% 19.5% 19.7% 19.5%Jack in the Box (JBX) 7.3% 6.5% 6.2% 6.1% 6.6%McDonalds (MCD) 13.7% 16.5% 19.0% 20.1% 20.6%Steak & Shake (SNS) 12.2% 10.5% 11.7% 11.2% 10.4%Wendy's (WEN) 17.4% 16.5% 9.8% 8.2% 1.9%Burger King (BKC) 7.8% 8.3%Sonic (SONC) after 20.6% 20.0% 18.6% 18.9% 19.0%
NP/Total revenuesNet Margin 2002 2003 2004 2005 2006Sonic (SONC) before 11.9% 11.7% 10.8% 11.3% 11.4%Jack in the Box (JBX) 4.1% 3.4% 3.2% 3.7% 3.9%McDonalds (MCD) 5.8% 8.6% 12.3% 13.1% 16.4%Steak & Shake (SNS) 5.0% 4.2% 5.0% 5.0% 4.4%Wendy's (WEN) 10.0% 9.3% 2.4% 10.5% 4.4%Burger King (BKC) 2.4% 1.3%Sonic (SONC) after 10.4% 9.3% 8.6% 9.5% 10.0%
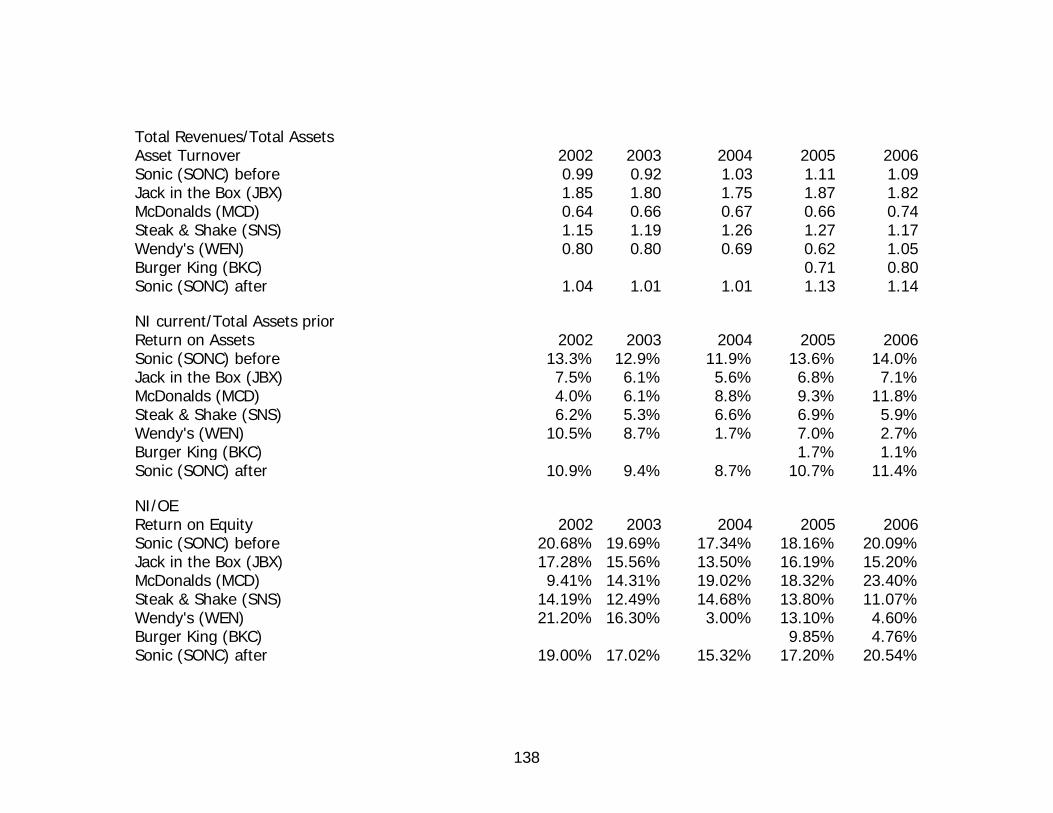
138
Total Revenues/Total AssetsAsset Turnover 2002 2003 2004 2005 2006Sonic (SONC) before 0.99 0.92 1.03 1.11 1.09Jack in the Box (JBX) 1.85 1.80 1.75 1.87 1.82McDonalds (MCD) 0.64 0.66 0.67 0.66 0.74Steak & Shake (SNS) 1.15 1.19 1.26 1.27 1.17Wendy's (WEN) 0.80 0.80 0.69 0.62 1.05Burger King (BKC) 0.71 0.80Sonic (SONC) after 1.04 1.01 1.01 1.13 1.14
NI current/Total Assets priorReturn on Assets 2002 2003 2004 2005 2006Sonic (SONC) before 13.3% 12.9% 11.9% 13.6% 14.0%Jack in the Box (JBX) 7.5% 6.1% 5.6% 6.8% 7.1%McDonalds (MCD) 4.0% 6.1% 8.8% 9.3% 11.8%Steak & Shake (SNS) 6.2% 5.3% 6.6% 6.9% 5.9%Wendy's (WEN) 10.5% 8.7% 1.7% 7.0% 2.7%Burger King (BKC) 1.7% 1.1%Sonic (SONC) after 10.9% 9.4% 8.7% 10.7% 11.4%
NI/OEReturn on Equity 2002 2003 2004 2005 2006Sonic (SONC) before 20.68% 19.69% 17.34% 18.16% 20.09%Jack in the Box (JBX) 17.28% 15.56% 13.50% 16.19% 15.20%McDonalds (MCD) 9.41% 14.31% 19.02% 18.32% 23.40%Steak & Shake (SNS) 14.19% 12.49% 14.68% 13.80% 11.07%Wendy's (WEN) 21.20% 16.30% 3.00% 13.10% 4.60%Burger King (BKC) 9.85% 4.76%Sonic (SONC) after 19.00% 17.02% 15.32% 17.20% 20.54%
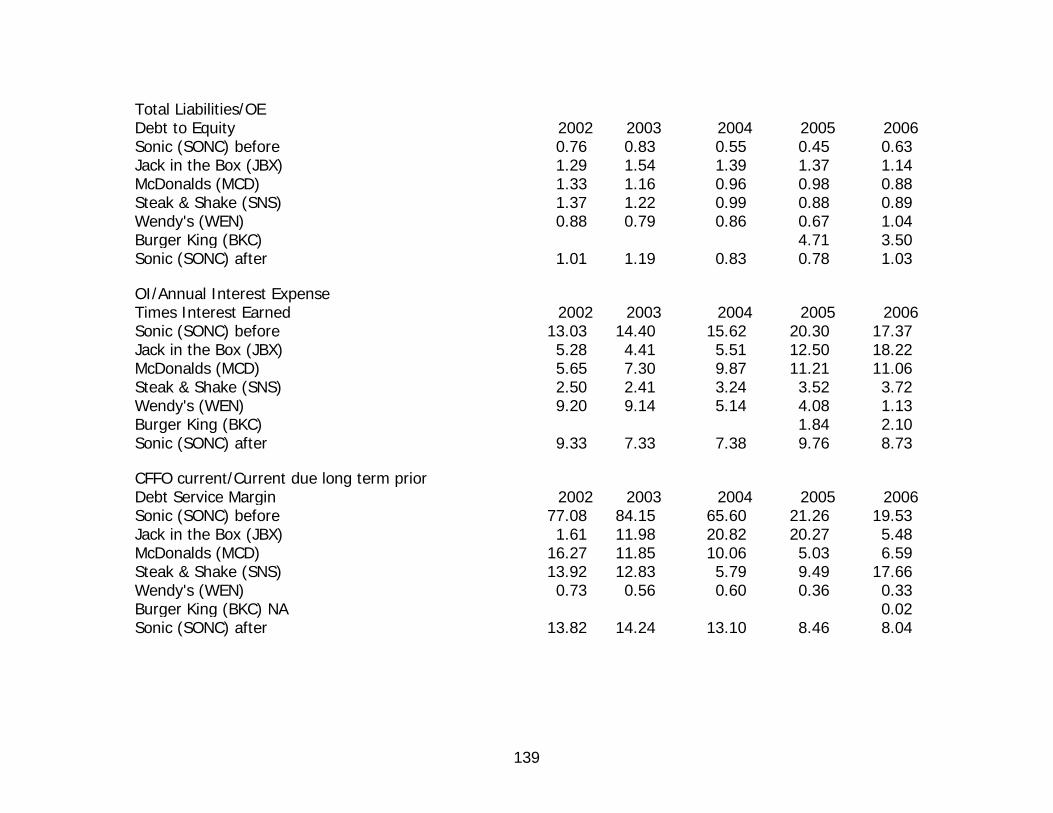
139
Total Liabilities/OEDebt to Equity 2002 2003 2004 2005 2006Sonic (SONC) before 0.76 0.83 0.55 0.45 0.63 Jack in the Box (JBX) 1.29 1.54 1.39 1.37 1.14 McDonalds (MCD) 1.33 1.16 0.96 0.98 0.88 Steak & Shake (SNS) 1.37 1.22 0.99 0.88 0.89 Wendy's (WEN) 0.88 0.79 0.86 0.67 1.04 Burger King (BKC) 4.71 3.50 Sonic (SONC) after 1.01 1.19 0.83 0.78 1.03
OI/Annual Interest ExpenseTimes Interest Earned 2002 2003 2004 2005 2006Sonic (SONC) before 13.03 14.40 15.62 20.30 17.37 Jack in the Box (JBX) 5.28 4.41 5.51 12.50 18.22 McDonalds (MCD) 5.65 7.30 9.87 11.21 11.06 Steak & Shake (SNS) 2.50 2.41 3.24 3.52 3.72 Wendy's (WEN) 9.20 9.14 5.14 4.08 1.13 Burger King (BKC) 1.84 2.10 Sonic (SONC) after 9.33 7.33 7.38 9.76 8.73
CFFO current/Current due long term priorDebt Service Margin 2002 2003 2004 2005 2006Sonic (SONC) before 77.08 84.15 65.60 21.26 19.53 Jack in the Box (JBX) 1.61 11.98 20.82 20.27 5.48 McDonalds (MCD) 16.27 11.85 10.06 5.03 6.59 Steak & Shake (SNS) 13.92 12.83 5.79 9.49 17.66 Wendy's (WEN) 0.73 0.56 0.60 0.36 0.33 Burger King (BKC) NA 0.02 Sonic (SONC) after 13.82 14.24 13.10 8.46 8.04
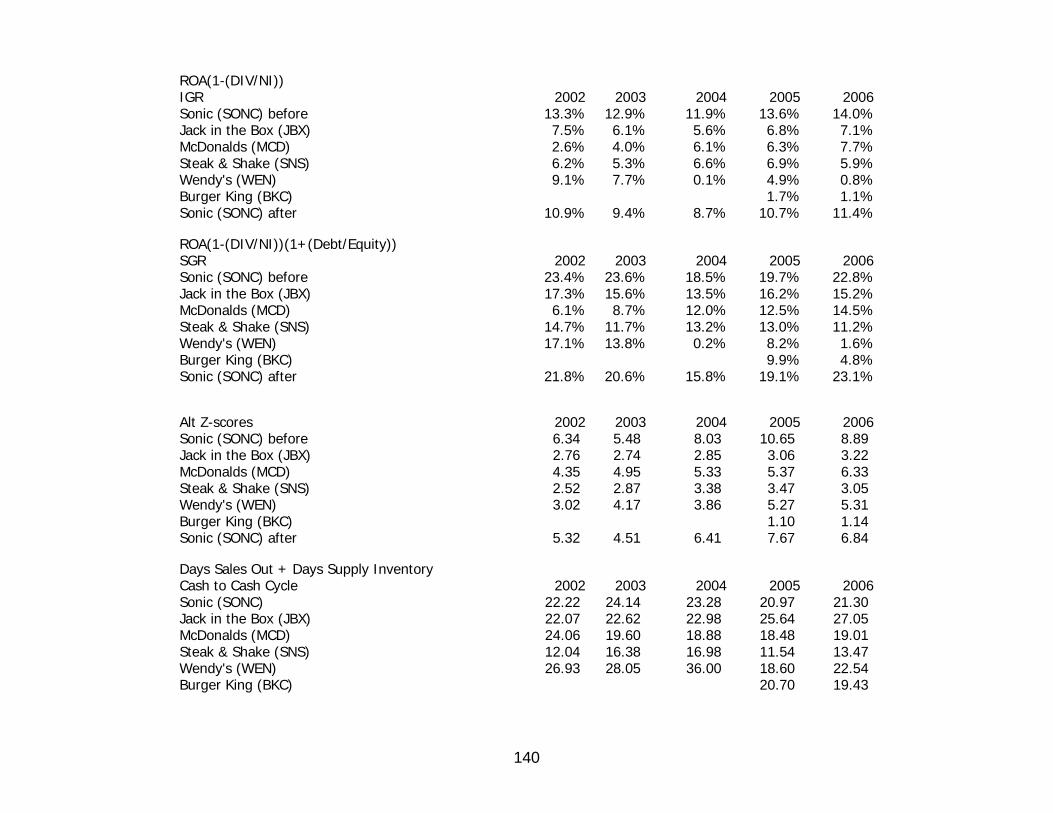
140
ROA(1-(DIV/NI))IGR 2002 2003 2004 2005 2006Sonic (SONC) before 13.3% 12.9% 11.9% 13.6% 14.0%Jack in the Box (JBX) 7.5% 6.1% 5.6% 6.8% 7.1%McDonalds (MCD) 2.6% 4.0% 6.1% 6.3% 7.7%Steak & Shake (SNS) 6.2% 5.3% 6.6% 6.9% 5.9%Wendy's (WEN) 9.1% 7.7% 0.1% 4.9% 0.8%Burger King (BKC) 1.7% 1.1%Sonic (SONC) after 10.9% 9.4% 8.7% 10.7% 11.4%
ROA(1-(DIV/NI))(1+(Debt/Equity))SGR 2002 2003 2004 2005 2006Sonic (SONC) before 23.4% 23.6% 18.5% 19.7% 22.8%Jack in the Box (JBX) 17.3% 15.6% 13.5% 16.2% 15.2%McDonalds (MCD) 6.1% 8.7% 12.0% 12.5% 14.5%Steak & Shake (SNS) 14.7% 11.7% 13.2% 13.0% 11.2%Wendy's (WEN) 17.1% 13.8% 0.2% 8.2% 1.6%Burger King (BKC) 9.9% 4.8%Sonic (SONC) after 21.8% 20.6% 15.8% 19.1% 23.1%
Alt Z-scores 2002 2003 2004 2005 2006Sonic (SONC) before 6.34 5.48 8.03 10.65 8.89 Jack in the Box (JBX) 2.76 2.74 2.85 3.06 3.22 McDonalds (MCD) 4.35 4.95 5.33 5.37 6.33 Steak & Shake (SNS) 2.52 2.87 3.38 3.47 3.05 Wendy's (WEN) 3.02 4.17 3.86 5.27 5.31 Burger King (BKC) 1.10 1.14 Sonic (SONC) after 5.32 4.51 6.41 7.67 6.84
Days Sales Out + Days Supply InventoryCash to Cash Cycle 2002 2003 2004 2005 2006Sonic (SONC) 22.22 24.14 23.28 20.97 21.30 Jack in the Box (JBX) 22.07 22.62 22.98 25.64 27.05 McDonalds (MCD) 24.06 19.60 18.88 18.48 19.01 Steak & Shake (SNS) 12.04 16.38 16.98 11.54 13.47 Wendy's (WEN) 26.93 28.05 36.00 18.60 22.54 Burger King (BKC) 20.70 19.43
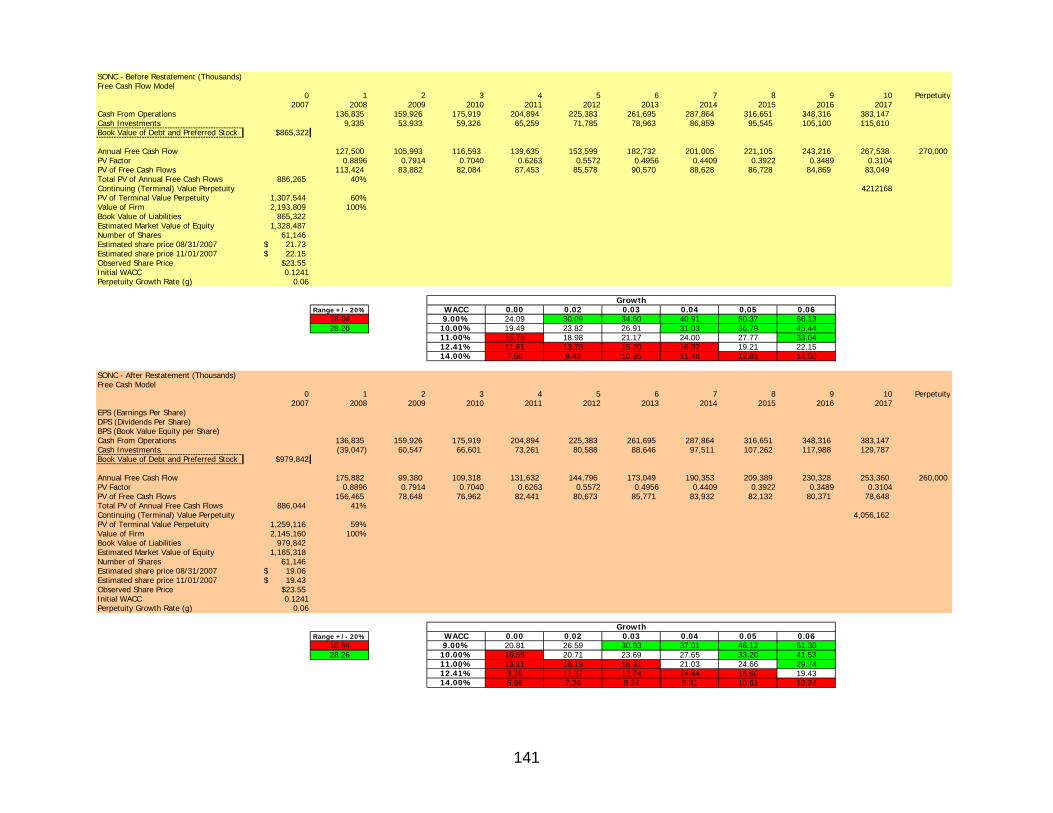
141
SONC - Before Restatement (Thousands)Free Cash Flow Model
0 1 2 3 4 5 6 7 8 9 10 Perpetuity2007 2008 2009 2010 2011 2012 2013 2014 2015 2016 2017
Cash From Operations 136,835 159,926 175,919 204,894 225,383 261,695 287,864 316,651 348,316 383,147 Cash Investments 9,335 53,933 59,326 65,259 71,785 78,963 86,859 95,545 105,100 115,610 Book Value of Debt and Preferred Stock $865,322
Annual Free Cash Flow 127,500 105,993 116,593 139,635 153,599 182,732 201,005 221,105 243,216 267,538 270,000 PV Factor 0.8896 0.7914 0.7040 0.6263 0.5572 0.4956 0.4409 0.3922 0.3489 0.3104PV of Free Cash Flows 113,424 83,882 82,084 87,453 85,578 90,570 88,628 86,728 84,869 83,049 Total PV of Annual Free Cash Flows 886,265 40%Continuing (Terminal) Value Perpetuity 4212168PV of Terminal Value Perpetuity 1,307,544 60%Value of Firm 2,193,809 100%Book Value of Liabilities 865,322 Estimated Market Value of Equity 1,328,487 Number of Shares 61,146 Estimated share price 08/31/2007 21.73$ Estimated share price 11/01/2007 22.15$ Observed Share Price $23.55Initial WACC 0.1241Perpetuity Growth Rate (g) 0.06
Range +/- 20% WACC 0.00 0.02 0.03 0.04 0.05 0.0618.84 9.00% 24.09 30.09 34.60 40.91 50.37 66.1328.26 10.00% 19.49 23.82 26.91 31.03 36.79 45.44
11.00% 15.78 18.98 21.17 24.00 27.77 33.0412.41% 11.61 13.78 15.20 16.97 19.21 22.1514.00% 7.98 9.43 10.35 11.46 12.81 14.50
Growth
SONC - After Restatement (Thousands)Free Cash Model
0 1 2 3 4 5 6 7 8 9 10 Perpetuity2007 2008 2009 2010 2011 2012 2013 2014 2015 2016 2017
EPS (Earnings Per Share)DPS (Dividends Per Share)BPS (Book Value Equity per Share)Cash From Operations 136,835 159,926 175,919 204,894 225,383 261,695 287,864 316,651 348,316 383,147 Cash Investments (39,047) 60,547 66,601 73,261 80,588 88,646 97,511 107,262 117,988 129,787 Book Value of Debt and Preferred Stock $979,842
Annual Free Cash Flow 175,882 99,380 109,318 131,632 144,796 173,049 190,353 209,389 230,328 253,360 260,000 PV Factor 0.8896 0.7914 0.7040 0.6263 0.5572 0.4956 0.4409 0.3922 0.3489 0.3104PV of Free Cash Flows 156,465 78,648 76,962 82,441 80,673 85,771 83,932 82,132 80,371 78,648 Total PV of Annual Free Cash Flows 886,044 41%Continuing (Terminal) Value Perpetuity 4,056,162 PV of Terminal Value Perpetuity 1,259,116 59%Value of Firm 2,145,160 100%Book Value of Liabilities 979,842 Estimated Market Value of Equity 1,165,318 Number of Shares 61,146 Estimated share price 08/31/2007 19.06$ Estimated share price 11/01/2007 19.43$ Observed Share Price $23.55Initial WACC 0.1241Perpetuity Growth Rate (g) 0.06
Range +/- 20% WACC 0.00 0.02 0.03 0.04 0.05 0.0618.84 9.00% 20.81 26.59 30.93 37.01 46.12 61.3028.26 10.00% 16.55 20.71 23.69 27.65 33.20 41.53
11.00% 13.11 16.19 18.31 21.03 24.66 29.7412.41% 9.28 11.37 12.74 14.44 16.60 19.4314.00% 5.96 7.36 8.24 9.31 10.61 12.24
Growth
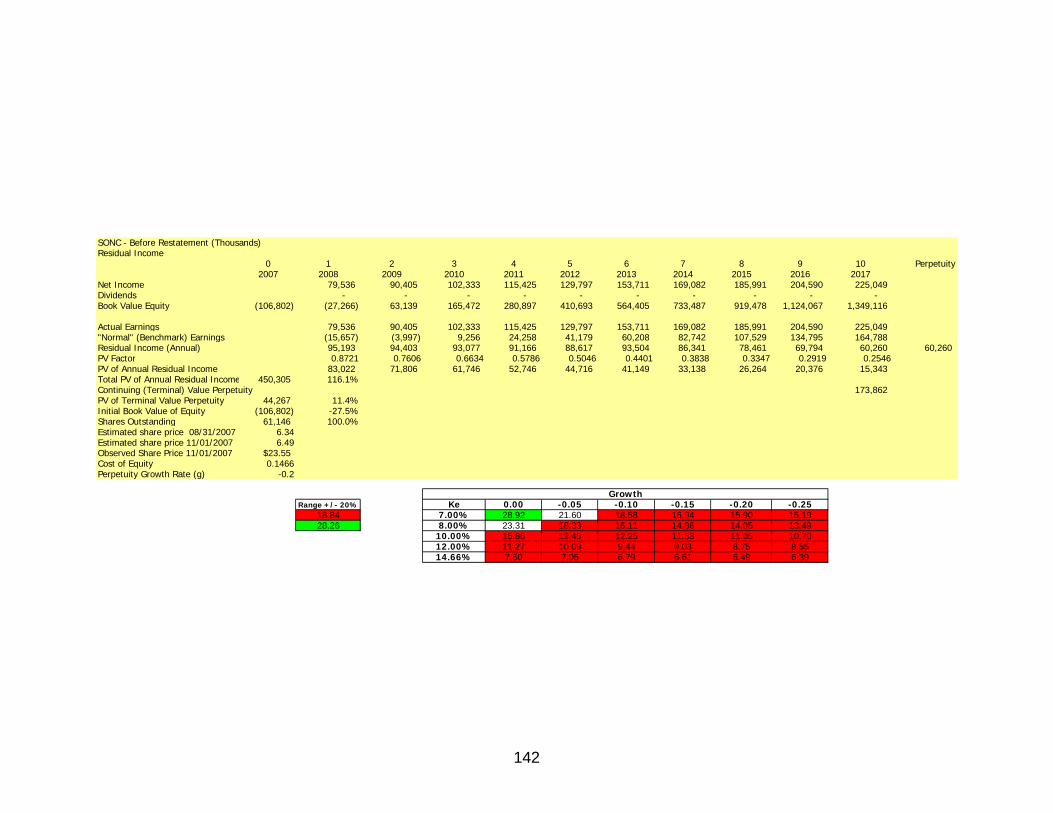
142
SONC - Before Restatement (Thousands)Residual Income
0 1 2 3 4 5 6 7 8 9 10 Perpetuity2007 2008 2009 2010 2011 2012 2013 2014 2015 2016 2017
Net Income 79,536 90,405 102,333 115,425 129,797 153,711 169,082 185,991 204,590 225,049 Dividends - - - - - - - - - - Book Value Equity (106,802) (27,266) 63,139 165,472 280,897 410,693 564,405 733,487 919,478 1,124,067 1,349,116
Actual Earnings 79,536 90,405 102,333 115,425 129,797 153,711 169,082 185,991 204,590 225,049 "Normal" (Benchmark) Earnings (15,657) (3,997) 9,256 24,258 41,179 60,208 82,742 107,529 134,795 164,788 Residual Income (Annual) 95,193 94,403 93,077 91,166 88,617 93,504 86,341 78,461 69,794 60,260 60,260 PV Factor 0.8721 0.7606 0.6634 0.5786 0.5046 0.4401 0.3838 0.3347 0.2919 0.2546PV of Annual Residual Income 83,022 71,806 61,746 52,746 44,716 41,149 33,138 26,264 20,376 15,343 Total PV of Annual Residual Income 450,305 116.1%Continuing (Terminal) Value Perpetuity 173,862 PV of Terminal Value Perpetuity 44,267 11.4%Initial Book Value of Equity (106,802) -27.5%Shares Outstanding 61,146 100.0%Estimated share price 08/31/2007 6.34Estimated share price 11/01/2007 6.49Observed Share Price 11/01/2007 $23.55Cost of Equity 0.1466Perpetuity Growth Rate (g) -0.2
Range +/- 20% Ke 0.00 -0.05 -0.10 -0.15 -0.20 -0.2518.84 7.00% 28.92 21.60 18.58 16.94 15.90 15.1928.26 8.00% 23.31 18.33 16.11 14.86 14.05 13.49
10.00% 15.86 13.45 12.25 11.53 11.05 10.7012.00% 11.27 10.09 9.44 9.03 8.75 8.5514.66% 7.50 7.05 6.79 6.61 6.49 6.39
Growth
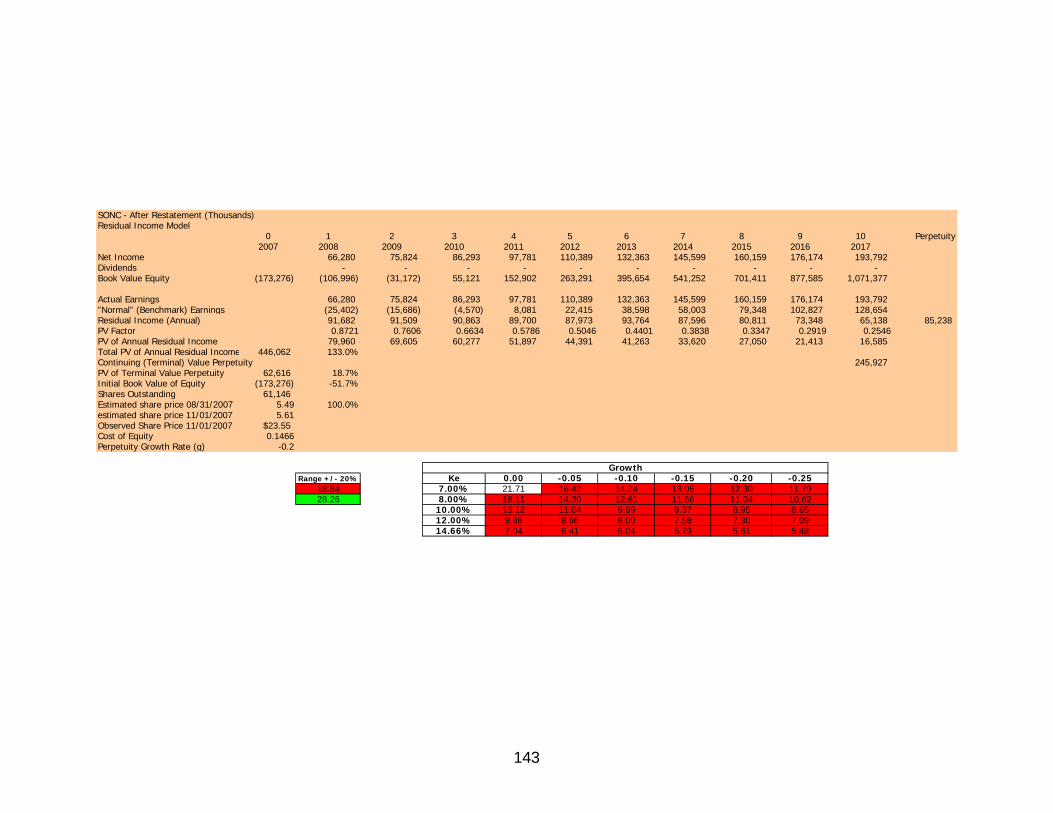
143
SONC - After Restatement (Thousands)Residual Income Model
0 1 2 3 4 5 6 7 8 9 10 Perpetuity2007 2008 2009 2010 2011 2012 2013 2014 2015 2016 2017
Net Income 66,280 75,824 86,293 97,781 110,389 132,363 145,599 160,159 176,174 193,792 Dividends - - - - - - - - - - Book Value Equity (173,276) (106,996) (31,172) 55,121 152,902 263,291 395,654 541,252 701,411 877,585 1,071,377
Actual Earnings 66,280 75,824 86,293 97,781 110,389 132,363 145,599 160,159 176,174 193,792 "Normal" (Benchmark) Earnings (25,402) (15,686) (4,570) 8,081 22,415 38,598 58,003 79,348 102,827 128,654 Residual Income (Annual) 91,682 91,509 90,863 89,700 87,973 93,764 87,596 80,811 73,348 65,138 85,238 PV Factor 0.8721 0.7606 0.6634 0.5786 0.5046 0.4401 0.3838 0.3347 0.2919 0.2546PV of Annual Residual Income 79,960 69,605 60,277 51,897 44,391 41,263 33,620 27,050 21,413 16,585 Total PV of Annual Residual Income 446,062 133.0%Continuing (Terminal) Value Perpetuity 245,927 PV of Terminal Value Perpetuity 62,616 18.7%Initial Book Value of Equity (173,276) -51.7%Shares Outstanding 61,146 Estimated share price 08/31/2007 5.49 100.0%estimated share price 11/01/2007 5.61Observed Share Price 11/01/2007 $23.55Cost of Equity 0.1466Perpetuity Growth Rate (g) -0.2
Range +/- 20% Ke 0.00 -0.05 -0.10 -0.15 -0.20 -0.2518.84 7.00% 21.71 16.42 14.24 13.05 12.30 11.7928.26 8.00% 18.11 14.30 12.61 11.66 11.04 10.62
10.00% 13.12 11.04 9.99 9.37 8.95 8.6512.00% 9.88 8.66 8.00 7.58 7.30 7.0914.66% 7.04 6.41 6.04 5.79 5.61 5.48
Growth
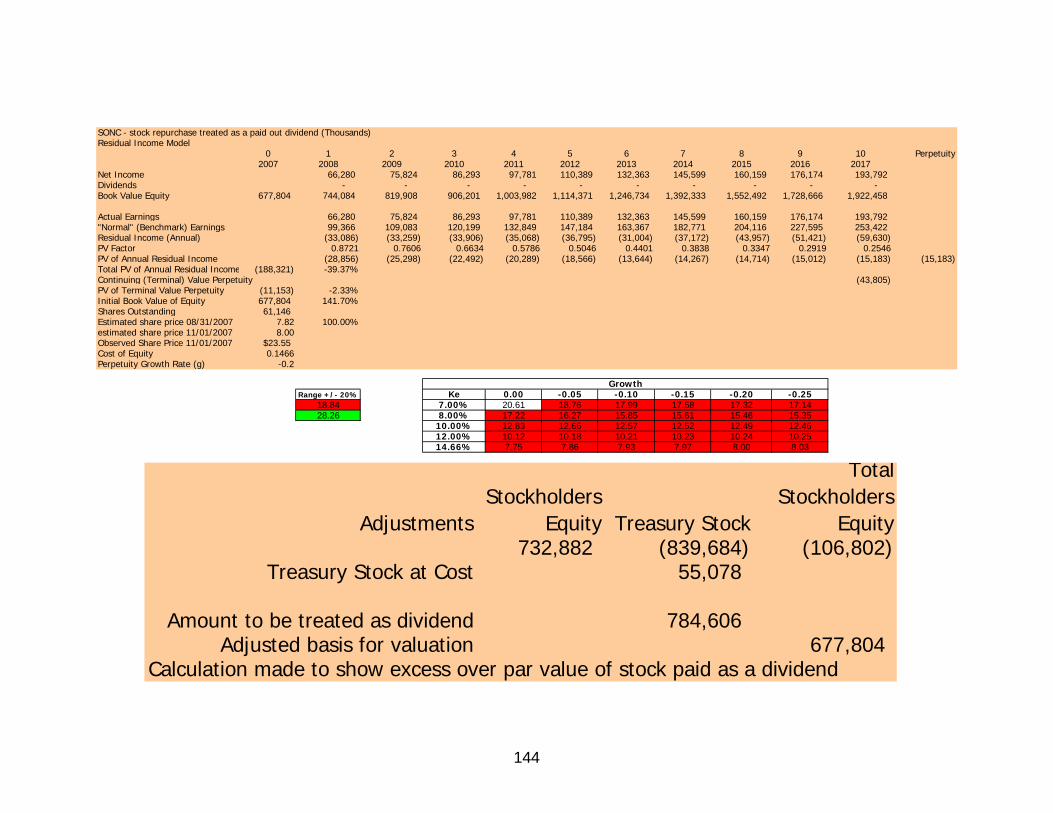
144
SONC - stock repurchase treated as a paid out dividend (Thousands)Residual Income Model
0 1 2 3 4 5 6 7 8 9 10 Perpetuity2007 2008 2009 2010 2011 2012 2013 2014 2015 2016 2017
Net Income 66,280 75,824 86,293 97,781 110,389 132,363 145,599 160,159 176,174 193,792 Dividends - - - - - - - - - - Book Value Equity 677,804 744,084 819,908 906,201 1,003,982 1,114,371 1,246,734 1,392,333 1,552,492 1,728,666 1,922,458
Actual Earnings 66,280 75,824 86,293 97,781 110,389 132,363 145,599 160,159 176,174 193,792 "Normal" (Benchmark) Earnings 99,366 109,083 120,199 132,849 147,184 163,367 182,771 204,116 227,595 253,422 Residual Income (Annual) (33,086) (33,259) (33,906) (35,068) (36,795) (31,004) (37,172) (43,957) (51,421) (59,630) PV Factor 0.8721 0.7606 0.6634 0.5786 0.5046 0.4401 0.3838 0.3347 0.2919 0.2546PV of Annual Residual Income (28,856) (25,298) (22,492) (20,289) (18,566) (13,644) (14,267) (14,714) (15,012) (15,183) (15,183) Total PV of Annual Residual Income (188,321) -39.37%Continuing (Terminal) Value Perpetuity (43,805) PV of Terminal Value Perpetuity (11,153) -2.33%Initial Book Value of Equity 677,804 141.70%Shares Outstanding 61,146 Estimated share price 08/31/2007 7.82 100.00%estimated share price 11/01/2007 8.00Observed Share Price 11/01/2007 $23.55Cost of Equity 0.1466Perpetuity Growth Rate (g) -0.2
Range +/- 20% Ke 0.00 -0.05 -0.10 -0.15 -0.20 -0.2518.84 7.00% 20.61 18.76 17.99 17.58 17.32 17.1428.26 8.00% 17.22 16.27 15.85 15.61 15.46 15.35
10.00% 12.83 12.66 12.57 12.52 12.49 12.4612.00% 10.12 10.18 10.21 10.23 10.24 10.2514.66% 7.75 7.86 7.93 7.97 8.00 8.03
Growth
AdjustmentsStockholders
Equity Treasury Stock
Total Stockholders
Equity732,882 (839,684) (106,802)
Treasury Stock at Cost 55,078
Amount to be treated as dividend 784,606 Adjusted basis for valuation 677,804
Calculation made to show excess over par value of stock paid as a dividend
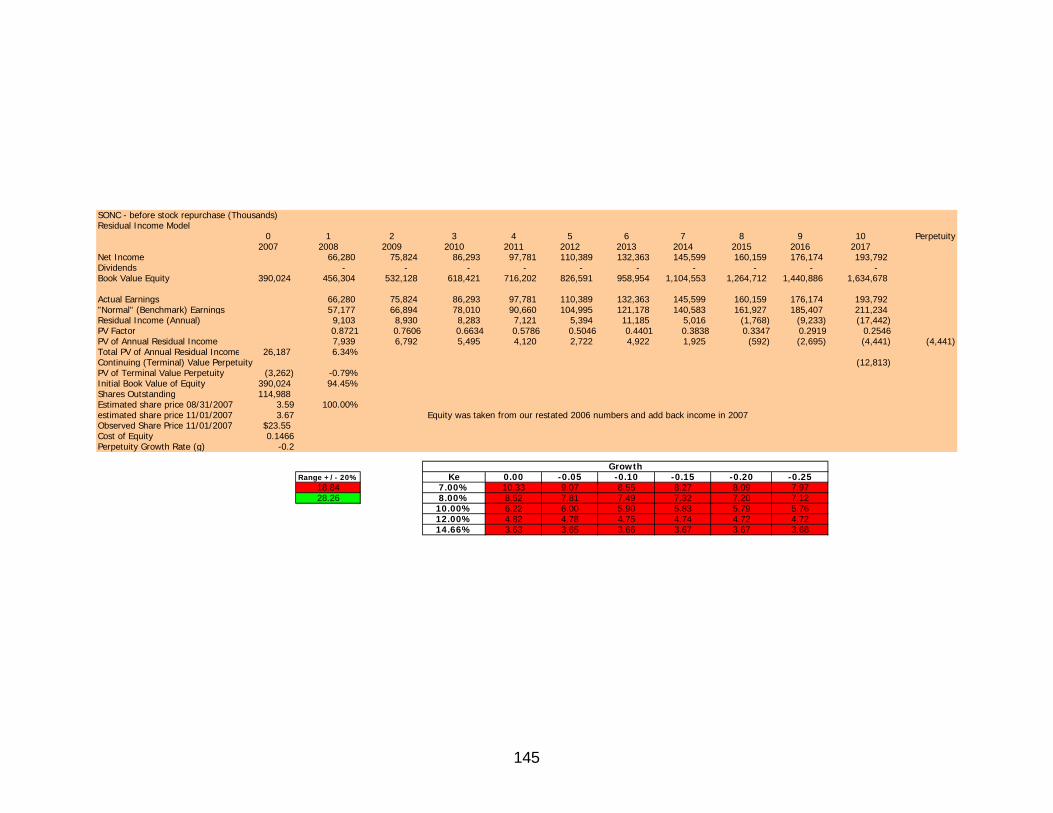
145
SONC - before stock repurchase (Thousands)Residual Income Model
0 1 2 3 4 5 6 7 8 9 10 Perpetuity2007 2008 2009 2010 2011 2012 2013 2014 2015 2016 2017
Net Income 66,280 75,824 86,293 97,781 110,389 132,363 145,599 160,159 176,174 193,792 Dividends - - - - - - - - - - Book Value Equity 390,024 456,304 532,128 618,421 716,202 826,591 958,954 1,104,553 1,264,712 1,440,886 1,634,678
Actual Earnings 66,280 75,824 86,293 97,781 110,389 132,363 145,599 160,159 176,174 193,792 "Normal" (Benchmark) Earnings 57,177 66,894 78,010 90,660 104,995 121,178 140,583 161,927 185,407 211,234 Residual Income (Annual) 9,103 8,930 8,283 7,121 5,394 11,185 5,016 (1,768) (9,233) (17,442) PV Factor 0.8721 0.7606 0.6634 0.5786 0.5046 0.4401 0.3838 0.3347 0.2919 0.2546PV of Annual Residual Income 7,939 6,792 5,495 4,120 2,722 4,922 1,925 (592) (2,695) (4,441) (4,441) Total PV of Annual Residual Income 26,187 6.34%Continuing (Terminal) Value Perpetuity (12,813) PV of Terminal Value Perpetuity (3,262) -0.79%Initial Book Value of Equity 390,024 94.45%Shares Outstanding 114,988 Estimated share price 08/31/2007 3.59 100.00%estimated share price 11/01/2007 3.67 Equity was taken from our restated 2006 numbers and add back income in 2007Observed Share Price 11/01/2007 $23.55Cost of Equity 0.1466Perpetuity Growth Rate (g) -0.2
Range +/- 20% Ke 0.00 -0.05 -0.10 -0.15 -0.20 -0.2518.84 7.00% 10.33 9.07 8.55 8.27 8.09 7.9728.26 8.00% 8.52 7.81 7.49 7.32 7.20 7.12
10.00% 6.22 6.00 5.90 5.83 5.79 5.7612.00% 4.82 4.78 4.75 4.74 4.72 4.7214.66% 3.63 3.65 3.66 3.67 3.67 3.68
Growth
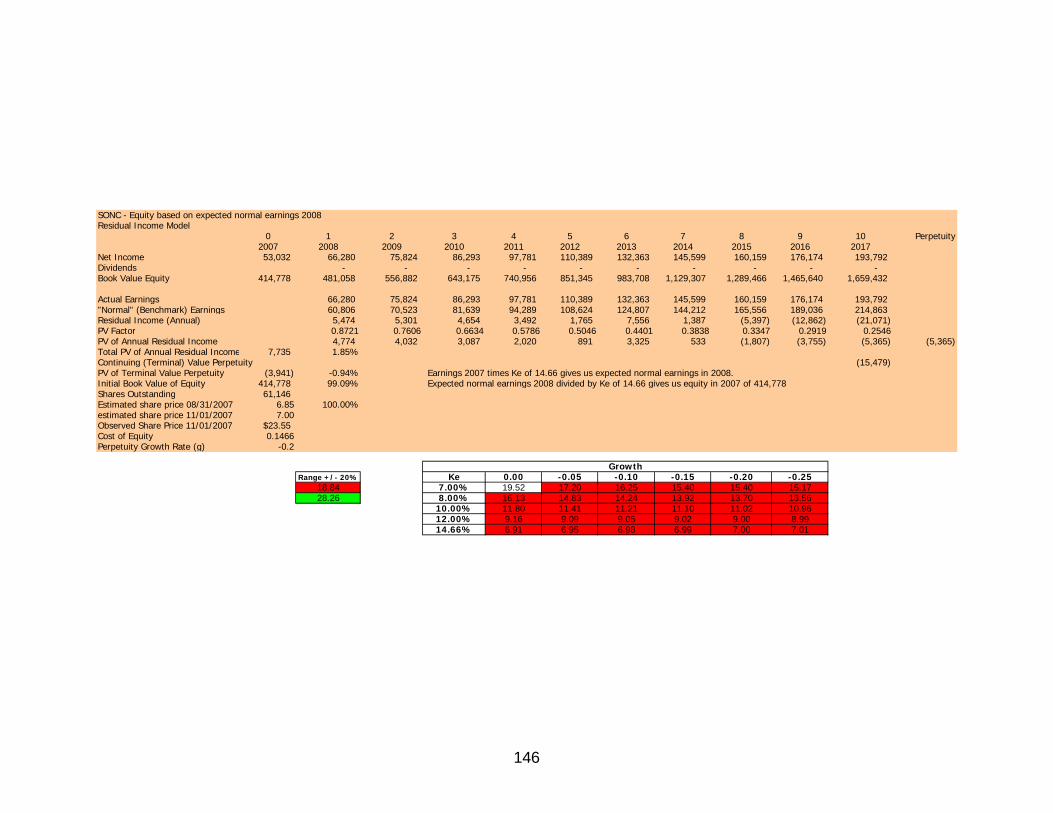
146
SONC - Equity based on expected normal earnings 2008Residual Income Model
0 1 2 3 4 5 6 7 8 9 10 Perpetuity2007 2008 2009 2010 2011 2012 2013 2014 2015 2016 2017
Net Income 53,032 66,280 75,824 86,293 97,781 110,389 132,363 145,599 160,159 176,174 193,792 Dividends - - - - - - - - - - Book Value Equity 414,778 481,058 556,882 643,175 740,956 851,345 983,708 1,129,307 1,289,466 1,465,640 1,659,432
Actual Earnings 66,280 75,824 86,293 97,781 110,389 132,363 145,599 160,159 176,174 193,792 "Normal" (Benchmark) Earnings 60,806 70,523 81,639 94,289 108,624 124,807 144,212 165,556 189,036 214,863 Residual Income (Annual) 5,474 5,301 4,654 3,492 1,765 7,556 1,387 (5,397) (12,862) (21,071) PV Factor 0.8721 0.7606 0.6634 0.5786 0.5046 0.4401 0.3838 0.3347 0.2919 0.2546PV of Annual Residual Income 4,774 4,032 3,087 2,020 891 3,325 533 (1,807) (3,755) (5,365) (5,365) Total PV of Annual Residual Income 7,735 1.85%Continuing (Terminal) Value Perpetuity (15,479) PV of Terminal Value Perpetuity (3,941) -0.94% Earnings 2007 times Ke of 14.66 gives us expected normal earnings in 2008.Initial Book Value of Equity 414,778 99.09% Expected normal earnings 2008 divided by Ke of 14.66 gives us equity in 2007 of 414,778Shares Outstanding 61,146 Estimated share price 08/31/2007 6.85 100.00%estimated share price 11/01/2007 7.00Observed Share Price 11/01/2007 $23.55Cost of Equity 0.1466Perpetuity Growth Rate (g) -0.2
Range +/- 20% Ke 0.00 -0.05 -0.10 -0.15 -0.20 -0.2518.84 7.00% 19.52 17.20 16.25 15.40 15.40 15.1728.26 8.00% 16.13 14.83 14.24 13.92 13.70 13.56
10.00% 11.80 11.41 11.21 11.10 11.02 10.9612.00% 9.16 9.09 9.05 9.02 9.00 8.9914.66% 6.91 6.95 6.98 6.99 7.00 7.01
Growth
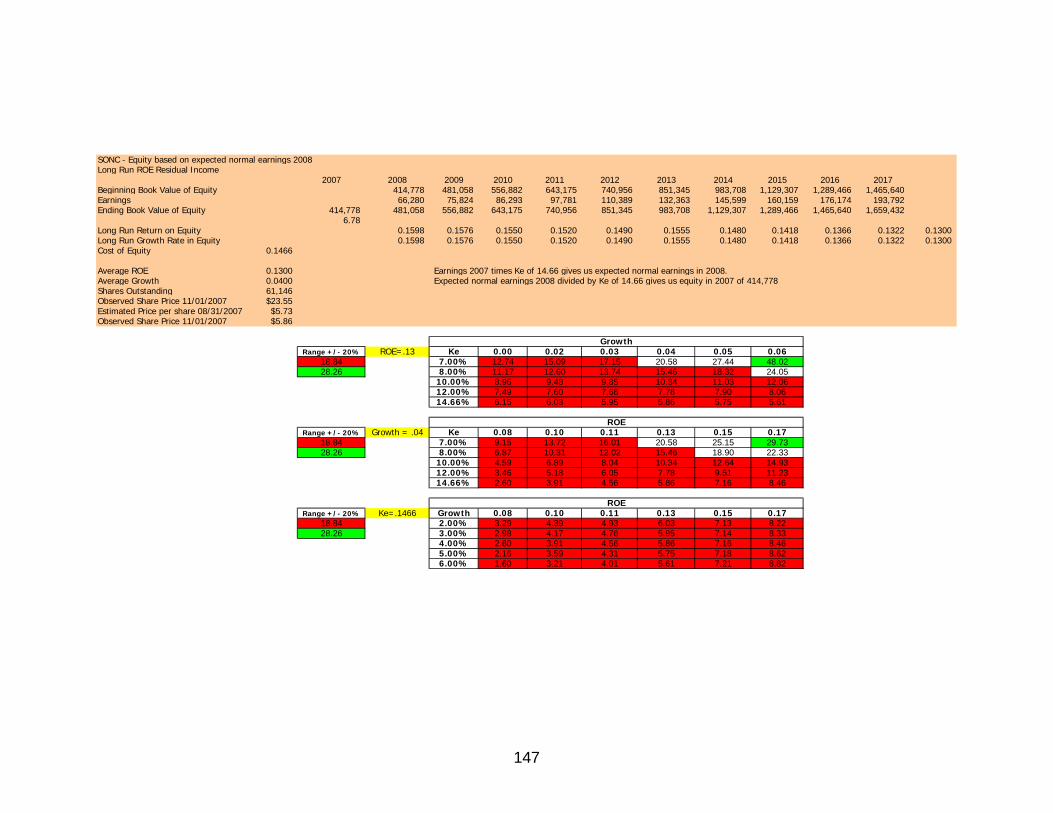
147
SONC - Equity based on expected normal earnings 2008Long Run ROE Residual Income
2007 2008 2009 2010 2011 2012 2013 2014 2015 2016 2017Beginning Book Value of Equity 414,778 481,058 556,882 643,175 740,956 851,345 983,708 1,129,307 1,289,466 1,465,640 Earnings 66,280 75,824 86,293 97,781 110,389 132,363 145,599 160,159 176,174 193,792 Ending Book Value of Equity 414,778 481,058 556,882 643,175 740,956 851,345 983,708 1,129,307 1,289,466 1,465,640 1,659,432
6.78 Long Run Return on Equity 0.1598 0.1576 0.1550 0.1520 0.1490 0.1555 0.1480 0.1418 0.1366 0.1322 0.1300 Long Run Growth Rate in Equity 0.1598 0.1576 0.1550 0.1520 0.1490 0.1555 0.1480 0.1418 0.1366 0.1322 0.1300 Cost of Equity 0.1466
Average ROE 0.1300 Earnings 2007 times Ke of 14.66 gives us expected normal earnings in 2008.Average Growth 0.0400 Expected normal earnings 2008 divided by Ke of 14.66 gives us equity in 2007 of 414,778Shares Outstanding 61,146 Observed Share Price 11/01/2007 $23.55Estimated Price per share 08/31/2007 $5.73Observed Share Price 11/01/2007 $5.86
Range +/- 20% ROE=.13 Ke 0.00 0.02 0.03 0.04 0.05 0.0618.84 7.00% 12.74 15.09 17.15 20.58 27.44 48.0228.26 8.00% 11.17 12.60 13.74 15.46 18.32 24.05
10.00% 8.96 9.48 9.85 10.34 11.03 12.0612.00% 7.49 7.60 7.68 7.78 7.90 8.0614.66% 6.15 6.03 5.95 5.86 5.75 5.61
Range +/- 20% Growth = .04 Ke 0.08 0.10 0.11 0.13 0.15 0.1718.84 7.00% 9.15 13.72 16.01 20.58 25.15 29.7328.26 8.00% 6.87 10.31 12.02 15.46 18.90 22.33
10.00% 4.59 6.89 8.04 10.34 12.64 14.9312.00% 3.46 5.18 6.05 7.78 9.51 11.2314.66% 2.60 3.91 4.56 5.86 7.16 8.46
Range +/- 20% Ke=.1466 Growth 0.08 0.10 0.11 0.13 0.15 0.1718.84 2.00% 3.29 4.39 4.93 6.03 7.13 8.2228.26 3.00% 2.98 4.17 4.76 5.95 7.14 8.33
4.00% 2.60 3.91 4.56 5.86 7.16 8.465.00% 2.16 3.59 4.31 5.75 7.18 8.626.00% 1.60 3.21 4.01 5.61 7.21 8.82
Growth
ROE
ROE
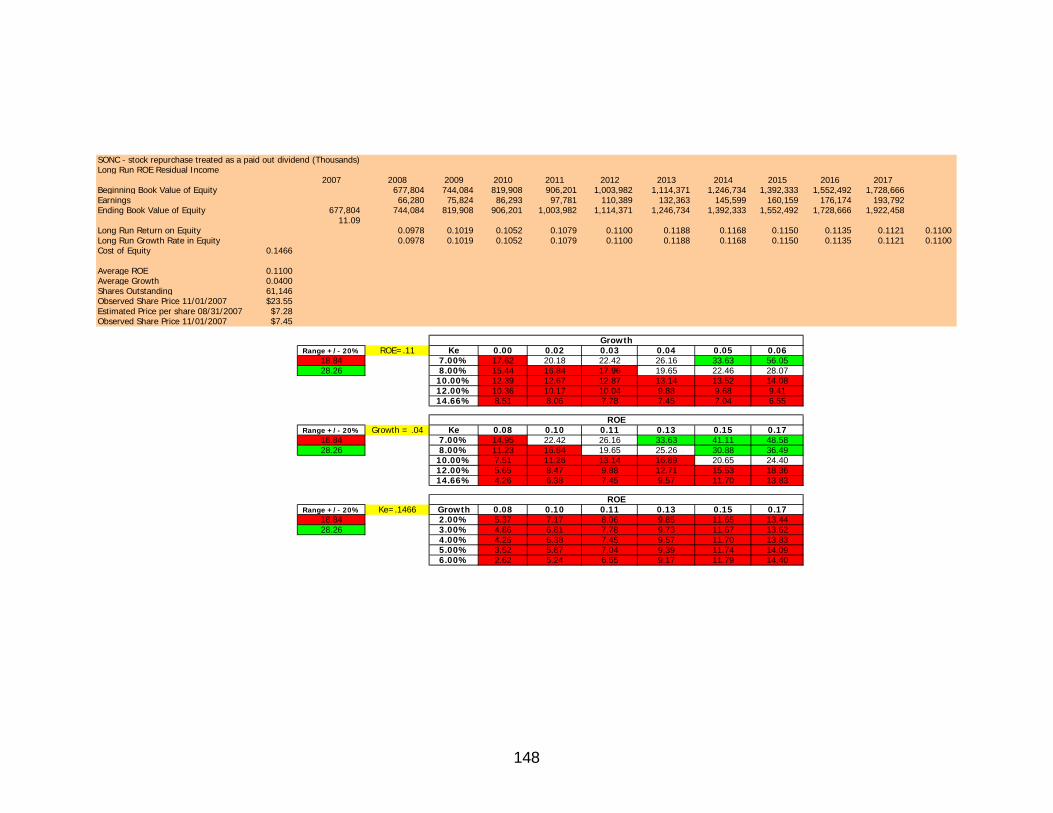
148
SONC - stock repurchase treated as a paid out dividend (Thousands)Long Run ROE Residual Income
2007 2008 2009 2010 2011 2012 2013 2014 2015 2016 2017Beginning Book Value of Equity 677,804 744,084 819,908 906,201 1,003,982 1,114,371 1,246,734 1,392,333 1,552,492 1,728,666 Earnings 66,280 75,824 86,293 97,781 110,389 132,363 145,599 160,159 176,174 193,792 Ending Book Value of Equity 677,804 744,084 819,908 906,201 1,003,982 1,114,371 1,246,734 1,392,333 1,552,492 1,728,666 1,922,458
11.09 Long Run Return on Equity 0.0978 0.1019 0.1052 0.1079 0.1100 0.1188 0.1168 0.1150 0.1135 0.1121 0.1100 Long Run Growth Rate in Equity 0.0978 0.1019 0.1052 0.1079 0.1100 0.1188 0.1168 0.1150 0.1135 0.1121 0.1100 Cost of Equity 0.1466
Average ROE 0.1100 Average Growth 0.0400 Shares Outstanding 61,146 Observed Share Price 11/01/2007 $23.55Estimated Price per share 08/31/2007 $7.28Observed Share Price 11/01/2007 $7.45
Range +/- 20% ROE=.11 Ke 0.00 0.02 0.03 0.04 0.05 0.0618.84 7.00% 17.62 20.18 22.42 26.16 33.63 56.0528.26 8.00% 15.44 16.84 17.96 19.65 22.46 28.07
10.00% 12.39 12.67 12.87 13.14 13.52 14.0812.00% 10.36 10.17 10.04 9.88 9.68 9.4114.66% 8.51 8.06 7.78 7.45 7.04 6.55
Range +/- 20% Growth = .04 Ke 0.08 0.10 0.11 0.13 0.15 0.1718.84 7.00% 14.95 22.42 26.16 33.63 41.11 48.5828.26 8.00% 11.23 16.84 19.65 25.26 30.88 36.49
10.00% 7.51 11.26 13.14 16.89 20.65 24.4012.00% 5.65 8.47 9.88 12.71 15.53 18.3614.66% 4.26 6.38 7.45 9.57 11.70 13.83
Range +/- 20% Ke=.1466 Growth 0.08 0.10 0.11 0.13 0.15 0.1718.84 2.00% 5.37 7.17 8.06 9.85 11.65 13.4428.26 3.00% 4.86 6.81 7.78 9.73 11.67 13.62
4.00% 4.26 6.38 7.45 9.57 11.70 13.835.00% 3.52 5.87 7.04 9.39 11.74 14.096.00% 2.62 5.24 6.55 9.17 11.79 14.40
Growth
ROE
ROE
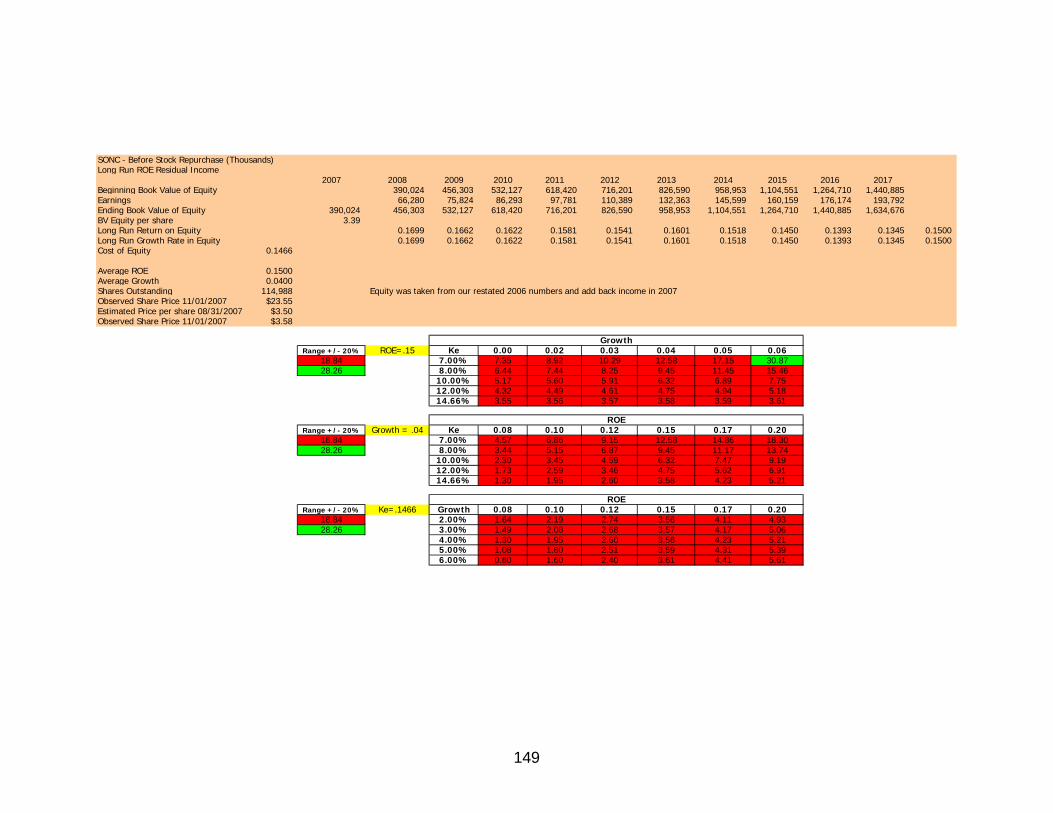
149
SONC - Before Stock Repurchase (Thousands)Long Run ROE Residual Income
2007 2008 2009 2010 2011 2012 2013 2014 2015 2016 2017Beginning Book Value of Equity 390,024 456,303 532,127 618,420 716,201 826,590 958,953 1,104,551 1,264,710 1,440,885 Earnings 66,280 75,824 86,293 97,781 110,389 132,363 145,599 160,159 176,174 193,792 Ending Book Value of Equity 390,024 456,303 532,127 618,420 716,201 826,590 958,953 1,104,551 1,264,710 1,440,885 1,634,676 BV Equity per share 3.39 Long Run Return on Equity 0.1699 0.1662 0.1622 0.1581 0.1541 0.1601 0.1518 0.1450 0.1393 0.1345 0.1500 Long Run Growth Rate in Equity 0.1699 0.1662 0.1622 0.1581 0.1541 0.1601 0.1518 0.1450 0.1393 0.1345 0.1500 Cost of Equity 0.1466
Average ROE 0.1500 Average Growth 0.0400 Shares Outstanding 114,988 Equity was taken from our restated 2006 numbers and add back income in 2007Observed Share Price 11/01/2007 $23.55Estimated Price per share 08/31/2007 $3.50Observed Share Price 11/01/2007 $3.58
Range +/- 20% ROE=.15 Ke 0.00 0.02 0.03 0.04 0.05 0.0618.84 7.00% 7.35 8.92 10.29 12.58 17.15 30.8728.26 8.00% 6.44 7.44 8.25 9.45 11.45 15.46
10.00% 5.17 5.60 5.91 6.32 6.89 7.7512.00% 4.32 4.49 4.61 4.75 4.94 5.1814.66% 3.55 3.56 3.57 3.58 3.59 3.61
Range +/- 20% Growth = .04 Ke 0.08 0.10 0.12 0.15 0.17 0.2018.84 7.00% 4.57 6.86 9.15 12.58 14.86 18.3028.26 8.00% 3.44 5.15 6.87 9.45 11.17 13.74
10.00% 2.30 3.45 4.59 6.32 7.47 9.1912.00% 1.73 2.59 3.46 4.75 5.62 6.9114.66% 1.30 1.95 2.60 3.58 4.23 5.21
Range +/- 20% Ke=.1466 Growth 0.08 0.10 0.12 0.15 0.17 0.2018.84 2.00% 1.64 2.19 2.74 3.56 4.11 4.9328.26 3.00% 1.49 2.08 2.68 3.57 4.17 5.06
4.00% 1.30 1.95 2.60 3.58 4.23 5.215.00% 1.08 1.80 2.51 3.59 4.31 5.396.00% 0.80 1.60 2.40 3.61 4.41 5.61
ROE
ROE
Growth
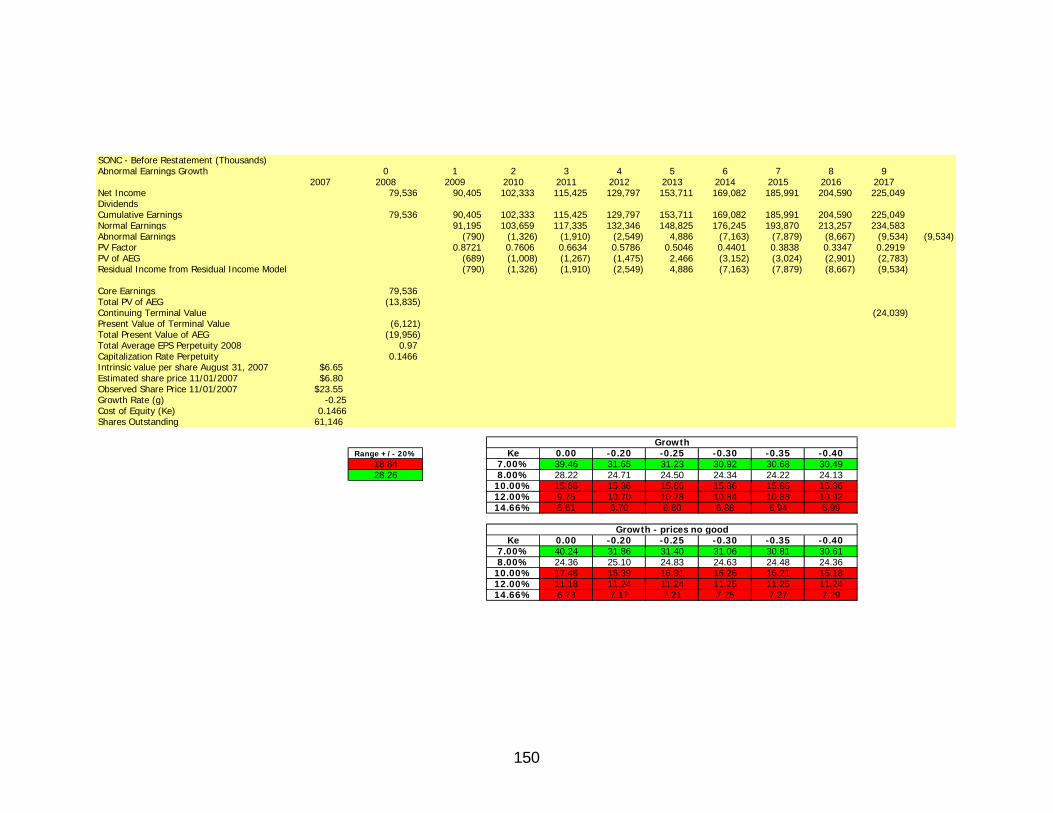
150
SONC - Before Restatement (Thousands)Abnormal Earnings Growth 0 1 2 3 4 5 6 7 8 9
2007 2008 2009 2010 2011 2012 2013 2014 2015 2016 2017Net Income 79,536 90,405 102,333 115,425 129,797 153,711 169,082 185,991 204,590 225,049 DividendsCumulative Earnings 79,536 90,405 102,333 115,425 129,797 153,711 169,082 185,991 204,590 225,049 Normal Earnings 91,195 103,659 117,335 132,346 148,825 176,245 193,870 213,257 234,583 Abnormal Earnings (790) (1,326) (1,910) (2,549) 4,886 (7,163) (7,879) (8,667) (9,534) (9,534) PV Factor 0.8721 0.7606 0.6634 0.5786 0.5046 0.4401 0.3838 0.3347 0.2919 PV of AEG (689) (1,008) (1,267) (1,475) 2,466 (3,152) (3,024) (2,901) (2,783) Residual Income from Residual Income Model (790) (1,326) (1,910) (2,549) 4,886 (7,163) (7,879) (8,667) (9,534)
Core Earnings 79,536 Total PV of AEG (13,835) Continuing Terminal Value (24,039) Present Value of Terminal Value (6,121) Total Present Value of AEG (19,956) Total Average EPS Perpetuity 2008 0.97 Capitalization Rate Perpetuity 0.1466 Intrinsic value per share August 31, 2007 $6.65Estimated share price 11/01/2007 $6.80Observed Share Price 11/01/2007 $23.55Growth Rate (g) -0.25Cost of Equity (Ke) 0.1466Shares Outstanding 61,146
Range +/- 20% Ke 0.00 -0.20 -0.25 -0.30 -0.35 -0.4018.84 7.00% 39.46 31.65 31.23 30.92 30.68 30.4928.26 8.00% 28.22 24.71 24.50 24.34 24.22 24.13
10.00% 15.86 15.86 15.86 15.86 15.86 15.8612.00% 9.75 10.70 10.78 10.84 10.88 10.9214.66% 5.61 6.70 6.80 6.88 6.94 6.99
Ke 0.00 -0.20 -0.25 -0.30 -0.35 -0.407.00% 40.24 31.86 31.40 31.06 30.81 30.618.00% 24.36 25.10 24.83 24.63 24.48 24.36
10.00% 17.46 16.39 16.31 16.26 16.21 16.1812.00% 11.18 11.24 11.24 11.25 11.25 11.2414.66% 6.73 7.17 7.21 7.25 7.27 7.29
Growth
Growth - prices no good
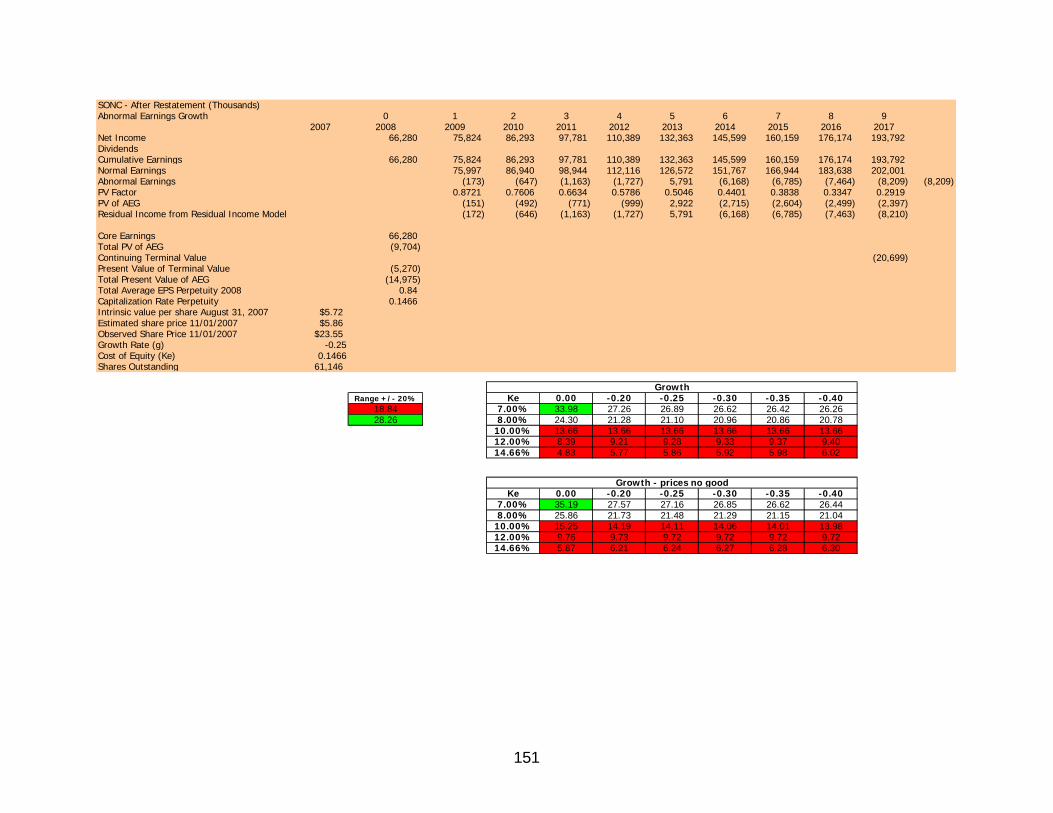
151
SONC - After Restatement (Thousands)Abnormal Earnings Growth 0 1 2 3 4 5 6 7 8 9
2007 2008 2009 2010 2011 2012 2013 2014 2015 2016 2017Net Income 66,280 75,824 86,293 97,781 110,389 132,363 145,599 160,159 176,174 193,792 DividendsCumulative Earnings 66,280 75,824 86,293 97,781 110,389 132,363 145,599 160,159 176,174 193,792 Normal Earnings 75,997 86,940 98,944 112,116 126,572 151,767 166,944 183,638 202,001 Abnormal Earnings (173) (647) (1,163) (1,727) 5,791 (6,168) (6,785) (7,464) (8,209) (8,209) PV Factor 0.8721 0.7606 0.6634 0.5786 0.5046 0.4401 0.3838 0.3347 0.2919 PV of AEG (151) (492) (771) (999) 2,922 (2,715) (2,604) (2,499) (2,397) Residual Income from Residual Income Model (172) (646) (1,163) (1,727) 5,791 (6,168) (6,785) (7,463) (8,210)
Core Earnings 66,280 Total PV of AEG (9,704) Continuing Terminal Value (20,699) Present Value of Terminal Value (5,270) Total Present Value of AEG (14,975) Total Average EPS Perpetuity 2008 0.84 Capitalization Rate Perpetuity 0.1466 Intrinsic value per share August 31, 2007 $5.72Estimated share price 11/01/2007 $5.86Observed Share Price 11/01/2007 $23.55Growth Rate (g) -0.25Cost of Equity (Ke) 0.1466Shares Outstanding 61,146
Range +/- 20% Ke 0.00 -0.20 -0.25 -0.30 -0.35 -0.4018.84 7.00% 33.98 27.26 26.89 26.62 26.42 26.2628.26 8.00% 24.30 21.28 21.10 20.96 20.86 20.78
10.00% 13.66 13.66 13.66 13.66 13.66 13.6612.00% 8.39 9.21 9.28 9.33 9.37 9.4014.66% 4.83 5.77 5.86 5.92 5.98 6.02
Ke 0.00 -0.20 -0.25 -0.30 -0.35 -0.407.00% 35.19 27.57 27.16 26.85 26.62 26.448.00% 25.86 21.73 21.48 21.29 21.15 21.04
10.00% 15.25 14.19 14.11 14.06 14.01 13.9812.00% 9.76 9.73 9.72 9.72 9.72 9.7214.66% 5.87 6.21 6.24 6.27 6.28 6.30
Growth
Growth - prices no good
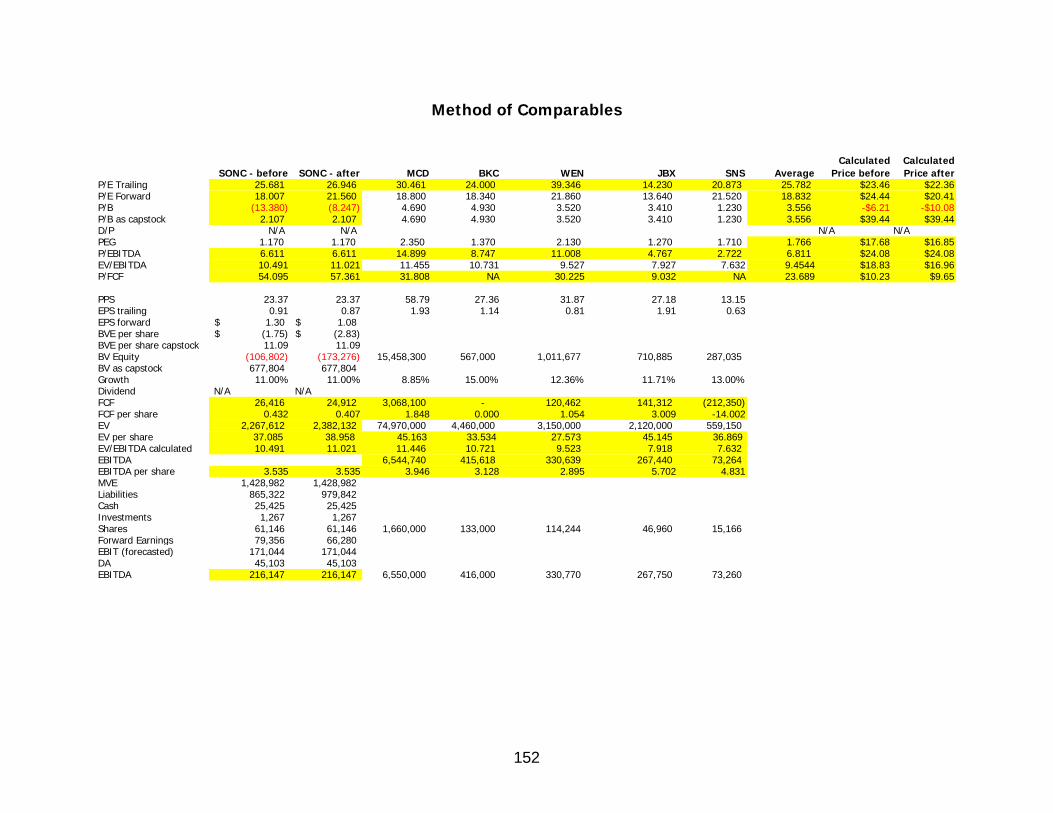
152
Method of Comparables
SONC - before SONC - after MCD BKC WEN JBX SNS AverageCalculated
Price beforeCalculated Price after
P/E Trailing 25.681 26.946 30.461 24.000 39.346 14.230 20.873 25.782 $23.46 $22.36P/E Forward 18.007 21.560 18.800 18.340 21.860 13.640 21.520 18.832 $24.44 $20.41P/B (13.380) (8.247) 4.690 4.930 3.520 3.410 1.230 3.556 -$6.21 -$10.08P/B as capstock 2.107 2.107 4.690 4.930 3.520 3.410 1.230 3.556 $39.44 $39.44D/P N/A N/A N/A N/APEG 1.170 1.170 2.350 1.370 2.130 1.270 1.710 1.766 $17.68 $16.85P/EBITDA 6.611 6.611 14.899 8.747 11.008 4.767 2.722 6.811 $24.08 $24.08EV/EBITDA 10.491 11.021 11.455 10.731 9.527 7.927 7.632 9.4544 $18.83 $16.96P/FCF 54.095 57.361 31.808 NA 30.225 9.032 NA 23.689 $10.23 $9.65
PPS 23.37 23.37 58.79 27.36 31.87 27.18 13.15EPS trailing 0.91 0.87 1.93 1.14 0.81 1.91 0.63EPS forward 1.30$ 1.08$ BVE per share (1.75)$ (2.83)$ BVE per share capstock 11.09 11.09BV Equity (106,802) (173,276) 15,458,300 567,000 1,011,677 710,885 287,035 BV as capstock 677,804 677,804 Growth 11.00% 11.00% 8.85% 15.00% 12.36% 11.71% 13.00%Dividend N/A N/A FCF 26,416 24,912 3,068,100 - 120,462 141,312 (212,350) FCF per share 0.432 0.407 1.848 0.000 1.054 3.009 -14.002EV 2,267,612 2,382,132 74,970,000 4,460,000 3,150,000 2,120,000 559,150 EV per share 37.085 38.958 45.163 33.534 27.573 45.145 36.869 EV/EBITDA calculated 10.491 11.021 11.446 10.721 9.523 7.918 7.632 EBITDA 6,544,740 415,618 330,639 267,440 73,264 EBITDA per share 3.535 3.535 3.946 3.128 2.895 5.702 4.831MVE 1,428,982 1,428,982 Liabilities 865,322 979,842 Cash 25,425 25,425 Investments 1,267 1,267 Shares 61,146 61,146 1,660,000 133,000 114,244 46,960 15,166 Forward Earnings 79,356 66,280 EBIT (forecasted) 171,044 171,044 DA 45,103 45,103 EBITDA 216,147 216,147 6,550,000 416,000 330,770 267,750 73,260
153
References
1.) www.sonicdrivein.com
Sonic 2001-2006 10-k
2.) www.answers.com
3.) Oxford University Press
4.) www.qsrmagazine.com
5.) Business Analysis & Valuation Palepu and Healy
6.) http://www.unilever.com/Images/us_gaap_03_tcm3-11471_tcm13- 5342.pdf
7.) Burger King 2004-2006 10-k
8.) Steak N Shake 2001-2006 10-k
9.) Jack In The Box 2001-2006 10-k
10.) McDonalds 2001-2006 10-k
11.) Wendy’s 2001-2006 10-k
12.) EdgarOnline-Imetrix
13.) Moore chapter 2 sample questions
14.) Intermediate Accounting 12th Edition Donald Kieso, Jerry Weygandt, Terry
Warfield
15.) www.investopedia.com
16.) http://www.spireframe.com/docs/financial_ratio_working_capital_turnover.aspx
17.) Alamo Distributing Ratio Handout (Mark Moore)
18.) St. Louis Federal Reserve website
19.) Wall Street Journal website
20.) http://moneycentral.msn.com