Embed Size (px)
Citation preview
Sonoco 4th Quarter and Full-Year 2019 ResultsInvestor Presentation February 2020
2
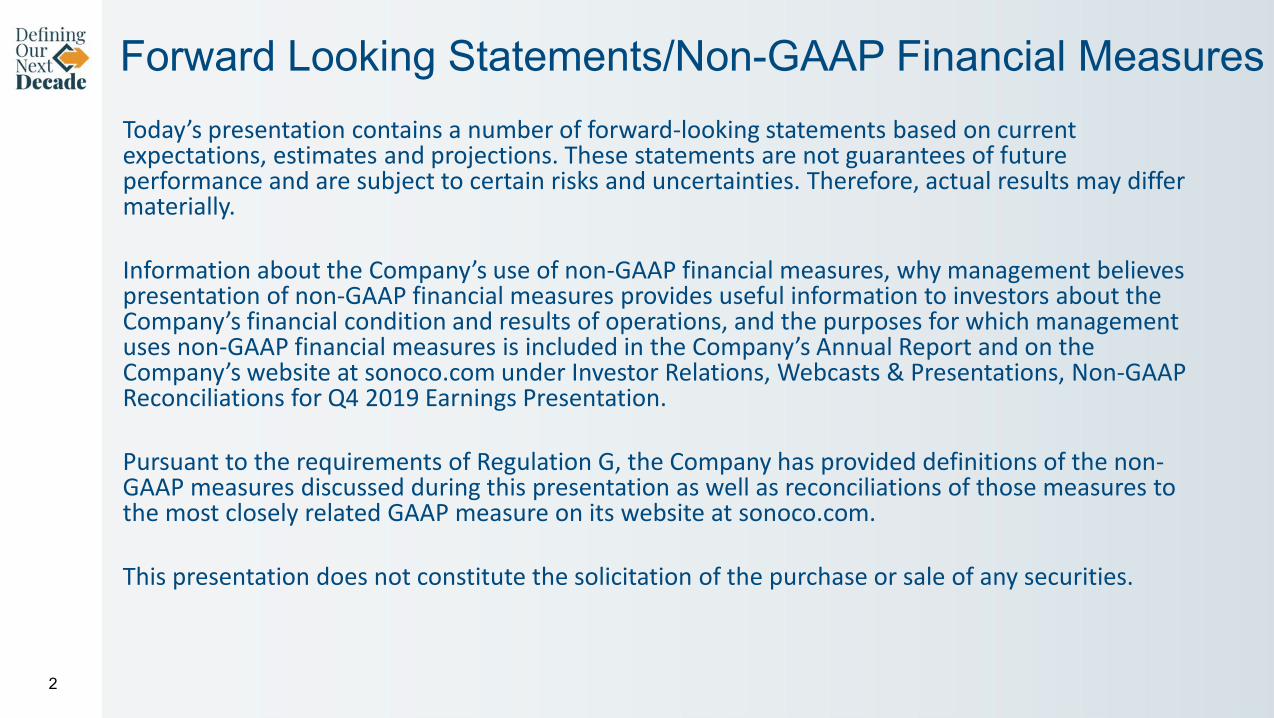
Forward Looking Statements/Non-GAAP Financial MeasuresToday’s presentation contains a number of forward-looking statements based on current expectations, estimates and projections. These statements are not guarantees of future performance and are subject to certain risks and uncertainties. Therefore, actual results may differ materially.
Information about the Company’s use of non-GAAP financial measures, why management believes presentation of non-GAAP financial measures provides useful information to investors about the Company’s financial condition and results of operations, and the purposes for which management uses non-GAAP financial measures is included in the Company’s Annual Report and on the Company’s website at sonoco.com under Investor Relations, Webcasts & Presentations, Non-GAAP Reconciliations for Q4 2019 Earnings Presentation.
Pursuant to the requirements of Regulation G, the Company has provided definitions of the non-GAAP measures discussed during this presentation as well as reconciliations of those measures to the most closely related GAAP measure on its website at sonoco.com.
This presentation does not constitute the solicitation of the purchase or sale of any securities.
3
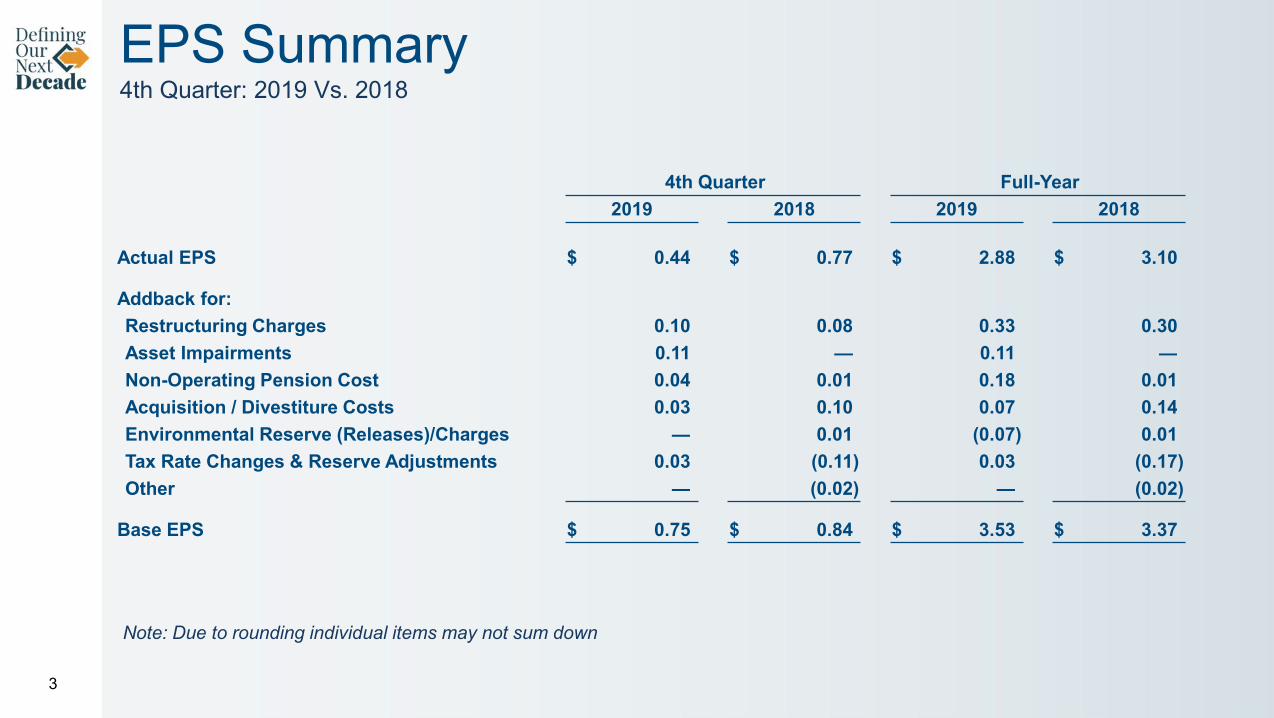
EPS Summary4th Quarter: 2019 Vs. 2018
4th Quarter Full-Year2019 2018 2019 2018
Actual EPS $ 0.44 $ 0.77 $ 2.88 $ 3.10
Addback for:Restructuring Charges 0.10 0.08 0.33 0.30Asset Impairments 0.11 — 0.11 —Non-Operating Pension Cost 0.04 0.01 0.18 0.01Acquisition / Divestiture Costs 0.03 0.10 0.07 0.14Environmental Reserve (Releases)/Charges — 0.01 (0.07) 0.01Tax Rate Changes & Reserve Adjustments 0.03 (0.11) 0.03 (0.17)Other — (0.02) — (0.02)
Base EPS $ 0.75 $ 0.84 $ 3.53 $ 3.37
Note: Due to rounding individual items may not sum down
4
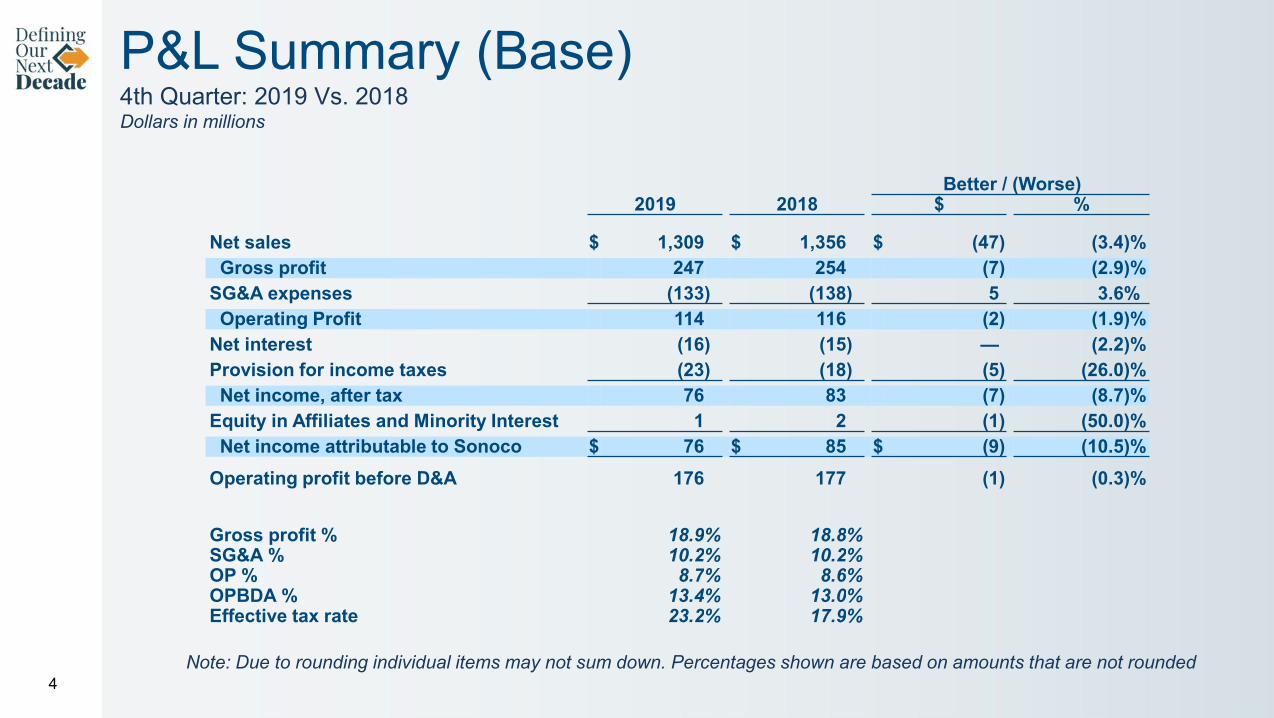
Better / (Worse)2019 2018 $ %
Net sales $ 1,309 $ 1,356 $ (47) (3.4)%Gross profit 247 254 (7) (2.9)%
SG&A expenses (133) (138) 5 3.6%Operating Profit 114 116 (2) (1.9)%
Net interest (16) (15) — (2.2)%Provision for income taxes (23) (18) (5) (26.0)%Net income, after tax 76 83 (7) (8.7)%
Equity in Affiliates and Minority Interest 1 2 (1) (50.0)%Net income attributable to Sonoco $ 76 $ 85 $ (9) (10.5)%
Operating profit before D&A 176 177 (1) (0.3)%
Gross profit % 18.9% 18.8%SG&A % 10.2% 10.2%OP % 8.7% 8.6%OPBDA % 13.4% 13.0%Effective tax rate 23.2% 17.9%
P&L Summary (Base)4th Quarter: 2019 Vs. 2018Dollars in millions
Note: Due to rounding individual items may not sum down. Percentages shown are based on amounts that are not rounded
5
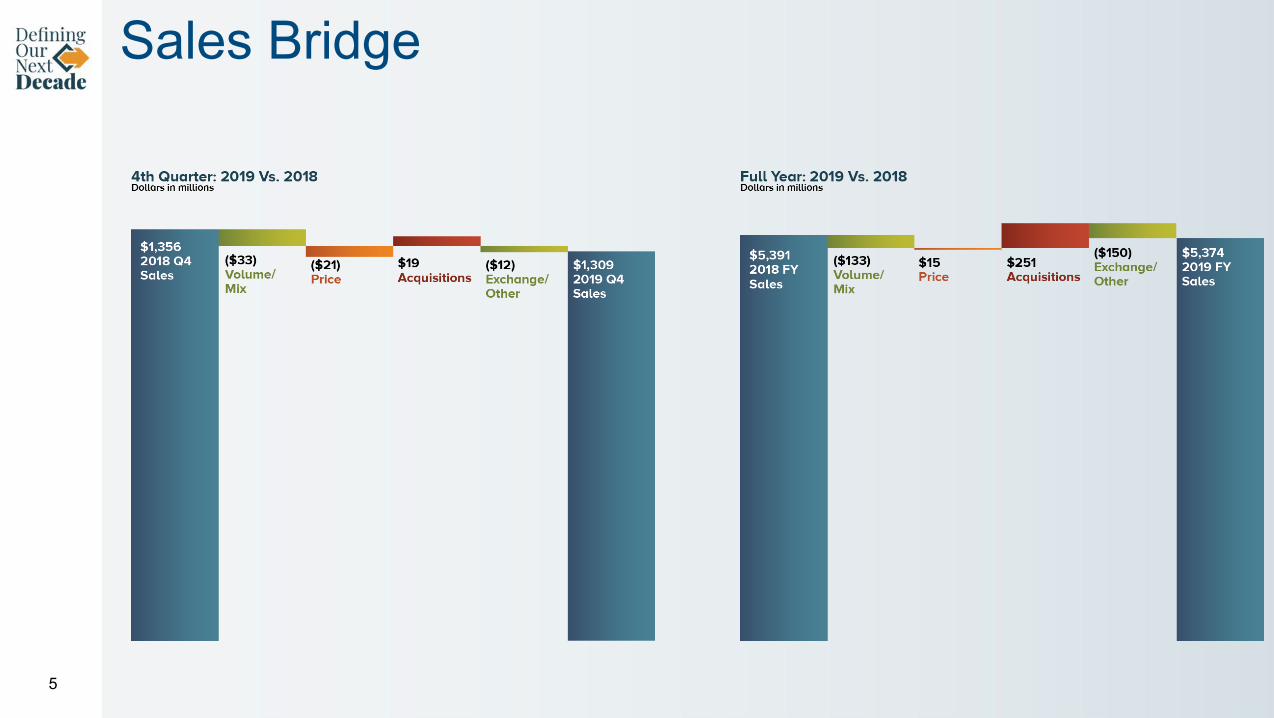
Sales Bridge
6
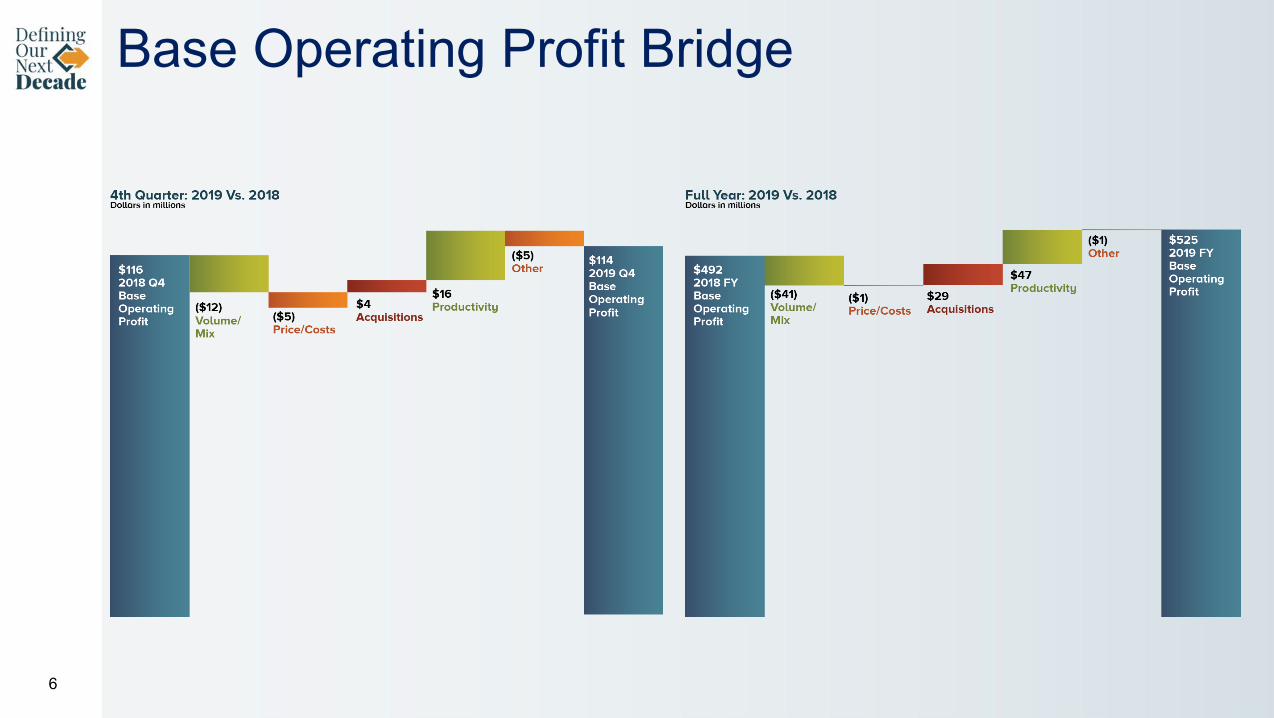
Base Operating Profit Bridge
7
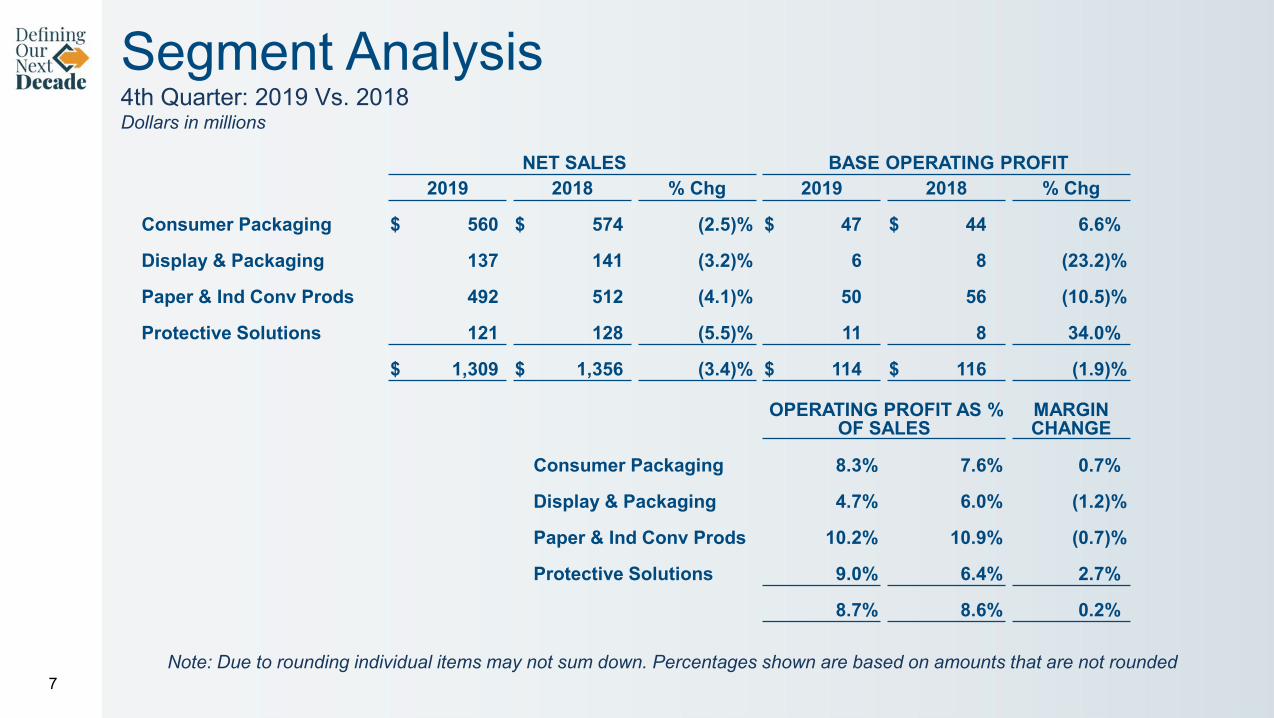
Segment Analysis4th Quarter: 2019 Vs. 2018Dollars in millions
NET SALES BASE OPERATING PROFIT2019 2018 % Chg 2019 2018 % Chg
Consumer Packaging $ 560 $ 574 (2.5)% $ 47 $ 44 6.6%
Display & Packaging 137 141 (3.2)% 6 8 (23.2)%
Paper & Ind Conv Prods 492 512 (4.1)% 50 56 (10.5)%
Protective Solutions 121 128 (5.5)% 11 8 34.0%
$ 1,309 $ 1,356 (3.4)% $ 114 $ 116 (1.9)%
OPERATING PROFIT AS % OF SALES
MARGINCHANGE
Consumer Packaging 8.3% 7.6% 0.7%
Display & Packaging 4.7% 6.0% (1.2)%
Paper & Ind Conv Prods 10.2% 10.9% (0.7)%
Protective Solutions 9.0% 6.4% 2.7%
8.7% 8.6% 0.2%
Note: Due to rounding individual items may not sum down. Percentages shown are based on amounts that are not rounded
8
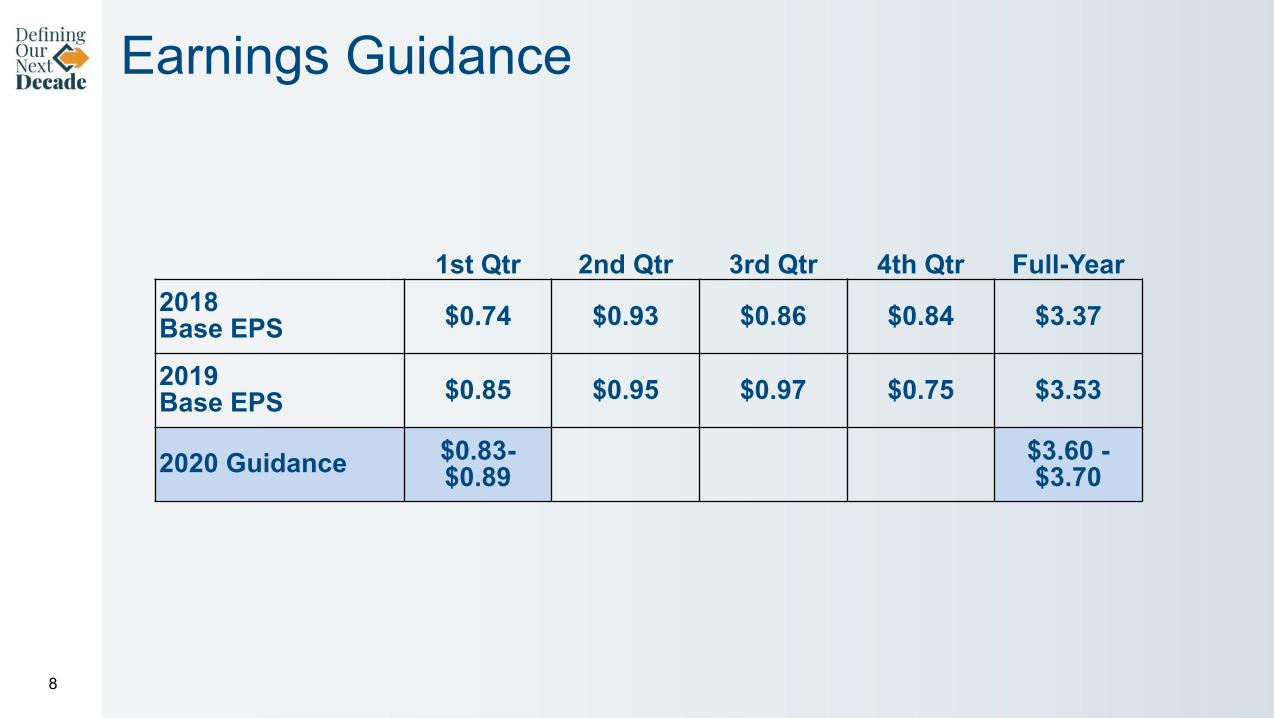
1st Qtr 2nd Qtr 3rd Qtr 4th Qtr Full-Year2018 Base EPS $0.74 $0.93 $0.86 $0.84 $3.37
2019 Base EPS $0.85 $0.95 $0.97 $0.75 $3.53
2020 Guidance $0.83-$0.89
$3.60 -$3.70
Earnings Guidance
9
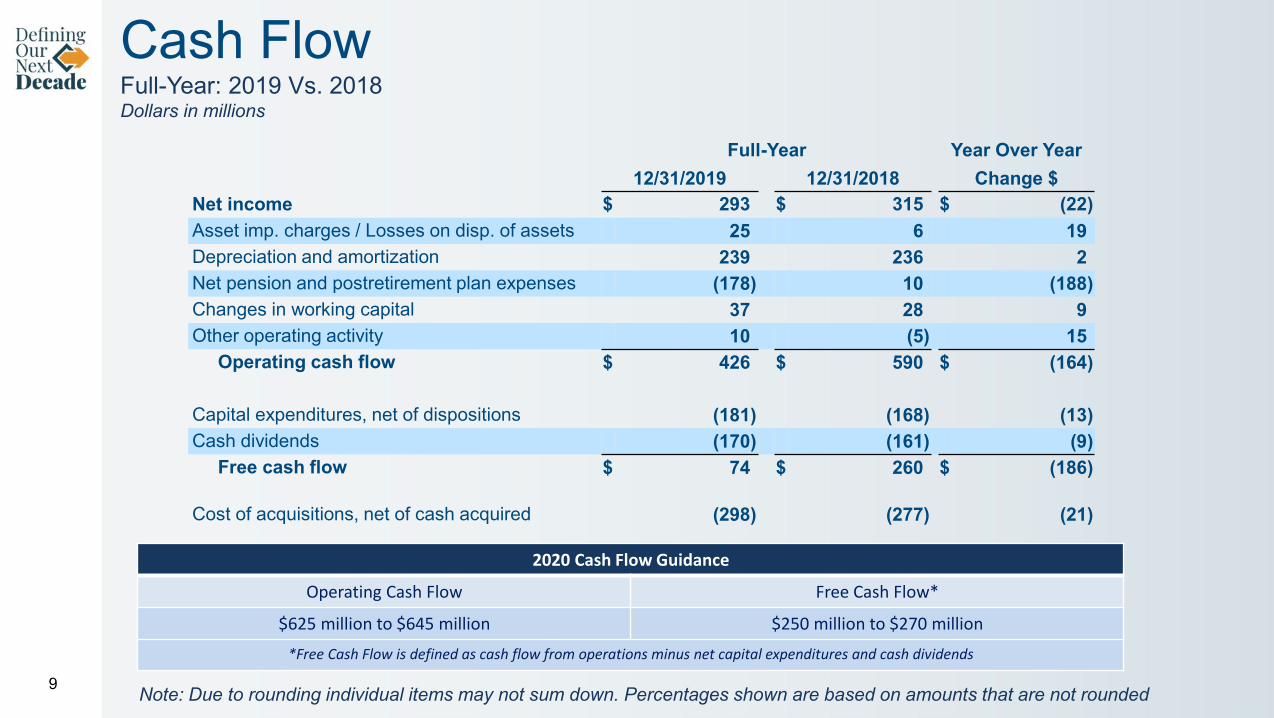
Cash FlowFull-Year: 2019 Vs. 2018 Dollars in millions
Full-Year Year Over Year12/31/2019 12/31/2018 Change $
Net income $ 293 $ 315 $ (22)Asset imp. charges / Losses on disp. of assets 25 6 19Depreciation and amortization 239 236 2Net pension and postretirement plan expenses (178) 10 (188)Changes in working capital 37 28 9Other operating activity 10 (5) 15
Operating cash flow $ 426 $ 590 $ (164)
Capital expenditures, net of dispositions (181) (168) (13)Cash dividends (170) (161) (9)
Free cash flow $ 74 $ 260 $ (186)
Cost of acquisitions, net of cash acquired (298) (277) (21)
2020 Cash Flow Guidance
Operating Cash Flow Free Cash Flow*
$625 million to $645 million $250 million to $270 million
*Free Cash Flow is defined as cash flow from operations minus net capital expenditures and cash dividends
Note: Due to rounding individual items may not sum down. Percentages shown are based on amounts that are not rounded
10
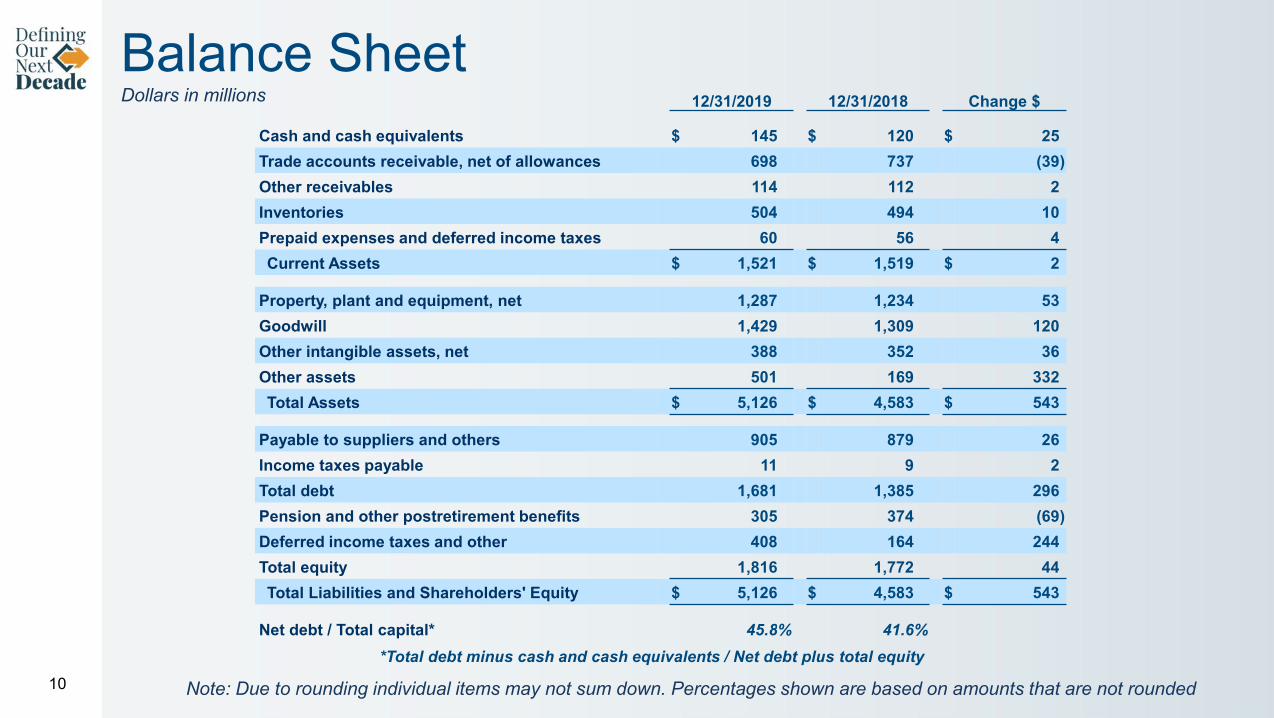
12/31/2019 12/31/2018 Change $
Cash and cash equivalents $ 145 $ 120 $ 25Trade accounts receivable, net of allowances 698 737 (39)Other receivables 114 112 2Inventories 504 494 10Prepaid expenses and deferred income taxes 60 56 4Current Assets $ 1,521 $ 1,519 $ 2
Property, plant and equipment, net 1,287 1,234 53Goodwill 1,429 1,309 120Other intangible assets, net 388 352 36Other assets 501 169 332Total Assets $ 5,126 $ 4,583 $ 543
Payable to suppliers and others 905 879 26Income taxes payable 11 9 2Total debt 1,681 1,385 296Pension and other postretirement benefits 305 374 (69)Deferred income taxes and other 408 164 244Total equity 1,816 1,772 44Total Liabilities and Shareholders' Equity $ 5,126 $ 4,583 $ 543
Net debt / Total capital* 45.8% 41.6%
Balance SheetDollars in millions
*Total debt minus cash and cash equivalents / Net debt plus total equity
Note: Due to rounding individual items may not sum down. Percentages shown are based on amounts that are not rounded
Appendix
11
Howard Coker
R. Howard Coker, 57, is President and CEO of Sonoco. In this role, Coker has global leadership, sales and operating responsibility for all of the Company’s diversified consumer, industrial and protective packaging businesses. He previously served as Senior Vice President, Global Paper/Industrial Converted Products.
Coker also served as Senior Vice President, Rigid Paper Containers and Paper/Engineered Carriers International, where he had responsibility for the Company’s global composite can operations in North America, South America, Europe and Asia, as well as paper, tube and core operations in Europe, Latin America and Australasia.
Prior to that, Coker served as Vice President, Rigid Paper and Closures, North America. In this role, he had responsibility for Sonoco's 21 rigid paper container and seven metal and peelable membrane closure operations in the United States, Canada and Mexico. He was also elected a Corporate Officer in February 2009.
He also served as Group Vice President and held several leadership positions running global consumer-related and industrial businesses.
Coker joined Sonoco in 1985.
He is a 1985 graduate of Wofford College with a B.A. in Business Administration, and he received an MBA from Wake Forest University in 1990.
He is married, has three children and lives in Hartsville, SC.
12
President and CEO of Sonoco
Rodger Fuller
Rodger Fuller, 58, is Executive Vice President of Sonoco. In this role, he is responsible for all Industrial and Consumer operations globally, which includes the Company’s Display and Packaging and Protective Solutions segments. Fuller previously served as Senior Vice President, Global Consumer Packaging, Display & Packaging and Protective Solutions, responsible for all of Sonoco’s Consumer-related businesses, including Global Rigid Paper and Closures; Global Plastics; Global Flexible Packaging; Display & Packaging; and Protective Solutions.
He also previously served as Senior Vice President, Paper/Engineered Carriers U.S./Canada & Display and Packaging. Prior to this, he was Group Vice President, Paper and Industrial Converting, U.S. and Canada, and Vice President, Global Primary Materials Group. Rodger began his career at Sonoco in 1985 in the Consumer sector of Sonoco, having held several senior leadership positions, including Vice President, Global Rigid Paper & Closures and Global Plastics.
He has a BS degree in Business from Berry College and MBA from Emory University. He is active in industry and community service organizations, including serving on the board of the Paper and Packaging Board, American Forest and Paper Association and the Hartsville United Way.
He and his wife have two grown children and reside in Hartsville.
13
Executive Vice President
Julie Albrecht
Julie Albrecht, 52, is Vice President and Chief Financial Officer.She was promoted to VP and CFO in March 2019. She joined Sonoco in March 2017 as Corporate VP, Treasurer and Assistant CFO, holding responsibility for the Company’s treasury, tax and risk management functions. In that role, she was responsible for the Company’s relationships with the credit rating agencies and commercial banks and has handled financings for four acquisitions totaling approximately $690 million. She also has been instrumental in the Company’s efforts to drive significant improvement in cash flow from operations in 2018 and 2019 and has been responsible for risk management of the Company’s retirement benefit plans.
She is a graduate of Wake Forest University with a B.S. in Accounting.
Julie, her husband and their two children live in Columbia, SC.
14
Vice President and Chief Financial Officer
15
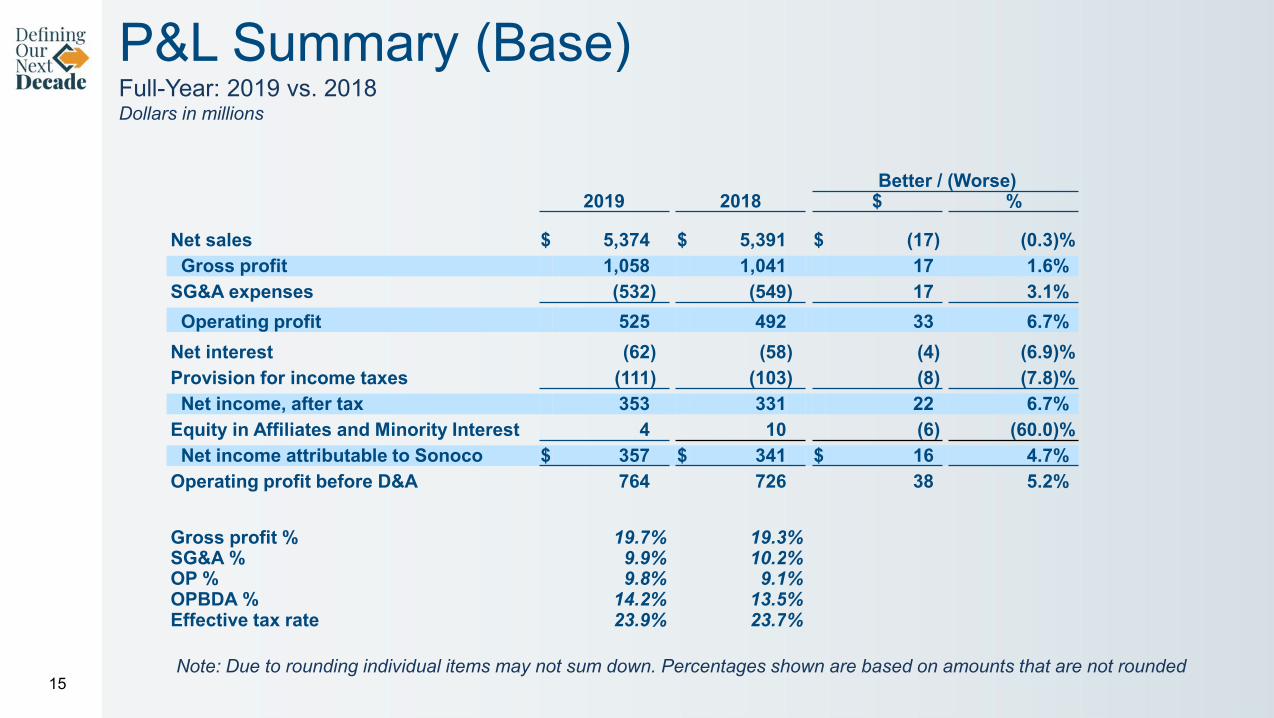
Better / (Worse)2019 2018 $ %
Net sales $ 5,374 $ 5,391 $ (17) (0.3)%Gross profit 1,058 1,041 17 1.6%
SG&A expenses (532) (549) 17 3.1%Operating profit 525 492 33 6.7%
Net interest (62) (58) (4) (6.9)%Provision for income taxes (111) (103) (8) (7.8)%Net income, after tax 353 331 22 6.7%
Equity in Affiliates and Minority Interest 4 10 (6) (60.0)%Net income attributable to Sonoco $ 357 $ 341 $ 16 4.7%
Operating profit before D&A 764 726 38 5.2%
Gross profit % 19.7% 19.3%SG&A % 9.9% 10.2%OP % 9.8% 9.1%OPBDA % 14.2% 13.5%Effective tax rate 23.9% 23.7%
P&L Summary (Base)Full-Year: 2019 vs. 2018Dollars in millions
Note: Due to rounding individual items may not sum down. Percentages shown are based on amounts that are not rounded
16
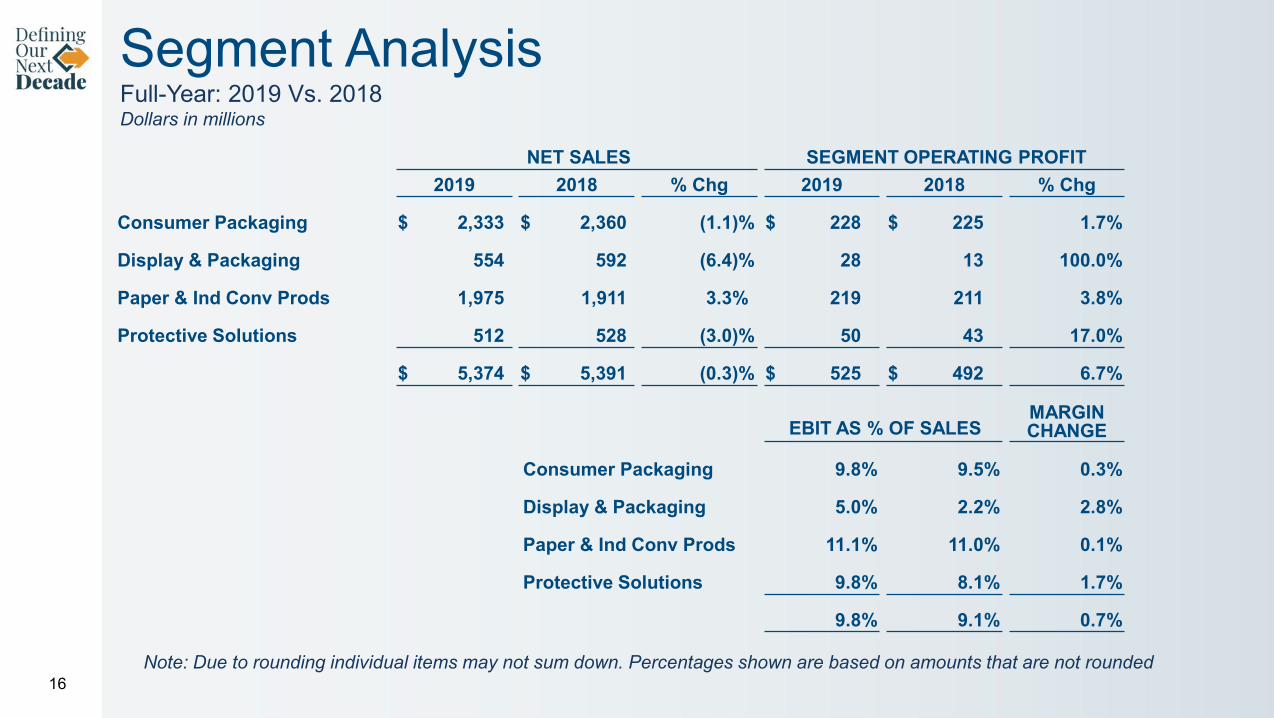
Segment AnalysisFull-Year: 2019 Vs. 2018Dollars in millions
NET SALES SEGMENT OPERATING PROFIT2019 2018 % Chg 2019 2018 % Chg
Consumer Packaging $ 2,333 $ 2,360 (1.1)% $ 228 $ 225 1.7%
Display & Packaging 554 592 (6.4)% 28 13 100.0%
Paper & Ind Conv Prods 1,975 1,911 3.3% 219 211 3.8%
Protective Solutions 512 528 (3.0)% 50 43 17.0%
$ 5,374 $ 5,391 (0.3)% $ 525 $ 492 6.7%
EBIT AS % OF SALESMARGINCHANGE
Consumer Packaging 9.8% 9.5% 0.3%
Display & Packaging 5.0% 2.2% 2.8%
Paper & Ind Conv Prods 11.1% 11.0% 0.1%
Protective Solutions 9.8% 8.1% 1.7%
9.8% 9.1% 0.7%
Note: Due to rounding individual items may not sum down. Percentages shown are based on amounts that are not rounded
17
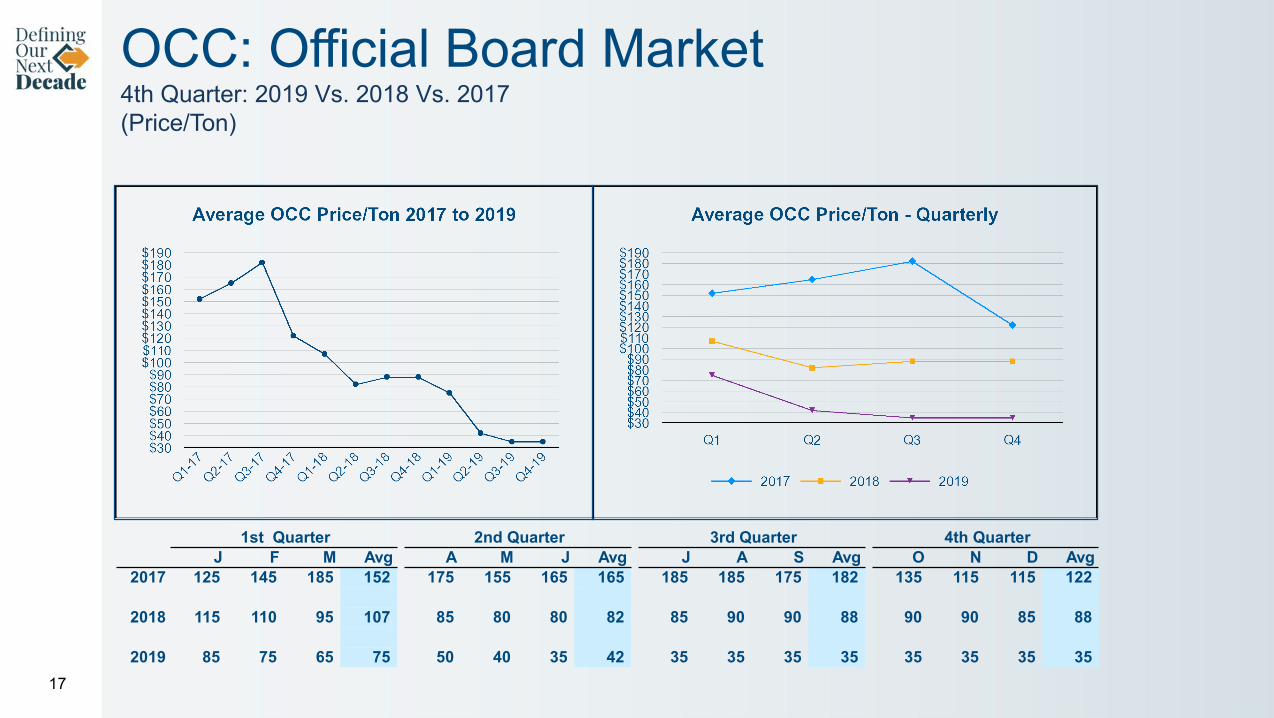
OCC: Official Board Market4th Quarter: 2019 Vs. 2018 Vs. 2017(Price/Ton)
1st Quarter 2nd Quarter 3rd Quarter 4th QuarterJ F M Avg A M J Avg J A S Avg O N D Avg
2017 125 145 185 152 175 155 165 165 185 185 175 182 135 115 115 122
2018 115 110 95 107 85 80 80 82 85 90 90 88 90 90 85 88
2019 85 75 65 75 50 40 35 42 35 35 35 35 35 35 35 35