Embed Size (px)
DESCRIPTION
SoonerPoll: Tulsa Mayoral Election 6/21/16
Citation preview
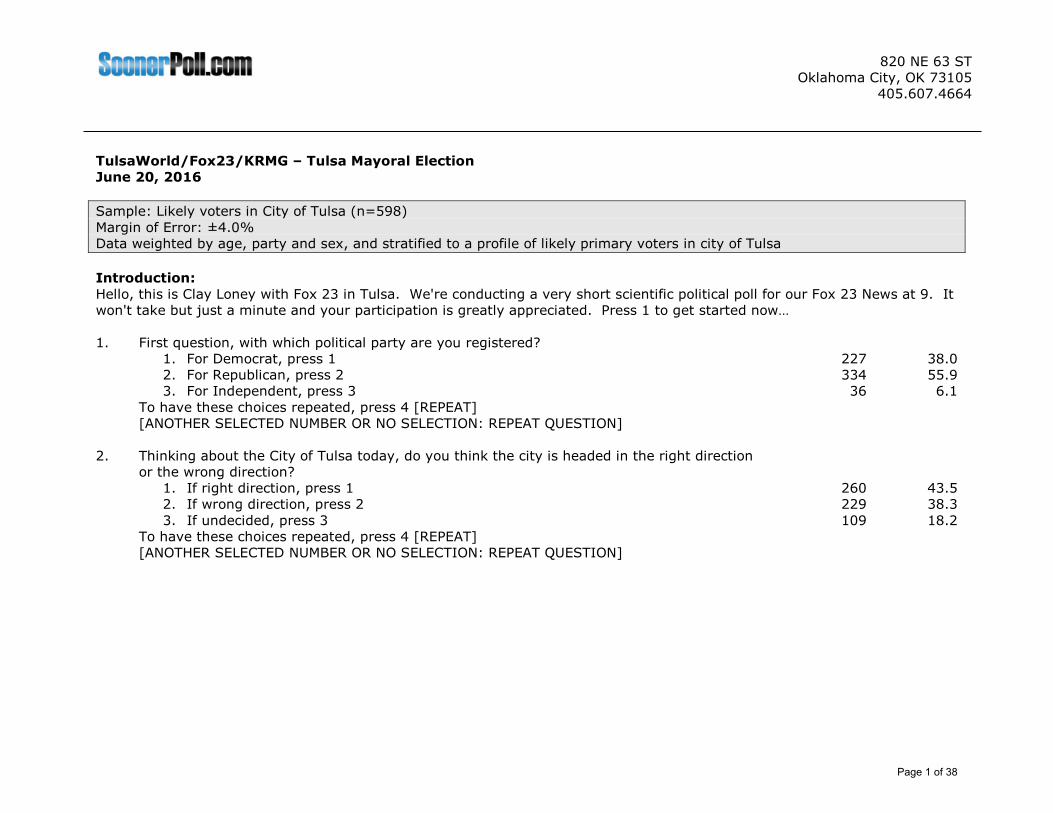
TulsaWorld/Fox23/KRMG – Tulsa Mayoral Election
June 20, 2016
Sample: Likely voters in City of Tulsa (n=598)
Margin of Error: ±4.0%
Data weighted by age, party and sex, and stratified to a profile of likely primary voters in city of Tulsa
Introduction:
Hello, this is Clay Loney with Fox 23 in Tulsa. We're conducting a very short scientific political poll for our Fox 23 News at 9. It
won't take but just a minute and your participation is greatly appreciated. Press 1 to get started now…
1. First question, with which political party are you registered?
1. For Democrat, press 1
2. For Republican, press 2
3. For Independent, press 3
To have these choices repeated, press 4 [REPEAT]
[ANOTHER SELECTED NUMBER OR NO SELECTION: REPEAT QUESTION]
227
334
36
38.0
55.9
6.1
2. Thinking about the City of Tulsa today, do you think the city is headed in the right direction
or the wrong direction?
1. If right direction, press 1
2. If wrong direction, press 2
3. If undecided, press 3
To have these choices repeated, press 4 [REPEAT]
[ANOTHER SELECTED NUMBER OR NO SELECTION: REPEAT QUESTION]
260
229
109
43.5
38.3
18.2
820 NE 63 ST
Oklahoma City, OK 73105
405.607.4664
Page 1 of 38
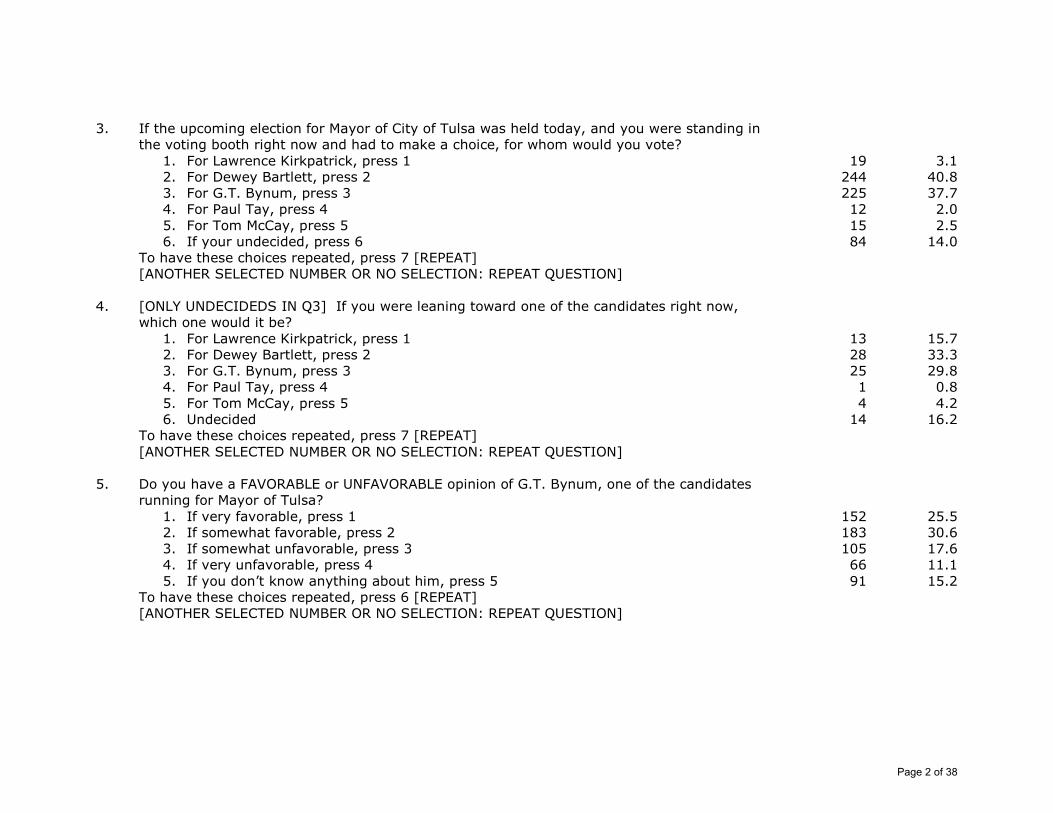
3. If the upcoming election for Mayor of City of Tulsa was held today, and you were standing in
the voting booth right now and had to make a choice, for whom would you vote?
1. For Lawrence Kirkpatrick, press 1
2. For Dewey Bartlett, press 2
3. For G.T. Bynum, press 3
4. For Paul Tay, press 4
5. For Tom McCay, press 5
6. If your undecided, press 6
To have these choices repeated, press 7 [REPEAT]
[ANOTHER SELECTED NUMBER OR NO SELECTION: REPEAT QUESTION]
19
244
225
12
15
84
3.1
40.8
37.7
2.0
2.5
14.0
4. [ONLY UNDECIDEDS IN Q3] If you were leaning toward one of the candidates right now,
which one would it be?
1. For Lawrence Kirkpatrick, press 1
2. For Dewey Bartlett, press 2
3. For G.T. Bynum, press 3
4. For Paul Tay, press 4
5. For Tom McCay, press 5
6. Undecided
To have these choices repeated, press 7 [REPEAT]
[ANOTHER SELECTED NUMBER OR NO SELECTION: REPEAT QUESTION]
13
28
25
1
4
14
15.7
33.3
29.8
0.8
4.2
16.2
5. Do you have a FAVORABLE or UNFAVORABLE opinion of G.T. Bynum, one of the candidates
running for Mayor of Tulsa?
1. If very favorable, press 1
2. If somewhat favorable, press 2
3. If somewhat unfavorable, press 3
4. If very unfavorable, press 4
5. If you don’t know anything about him, press 5
To have these choices repeated, press 6 [REPEAT]
[ANOTHER SELECTED NUMBER OR NO SELECTION: REPEAT QUESTION]
152
183
105
66
91
25.5
30.6
17.6
11.1
15.2
Page 2 of 38
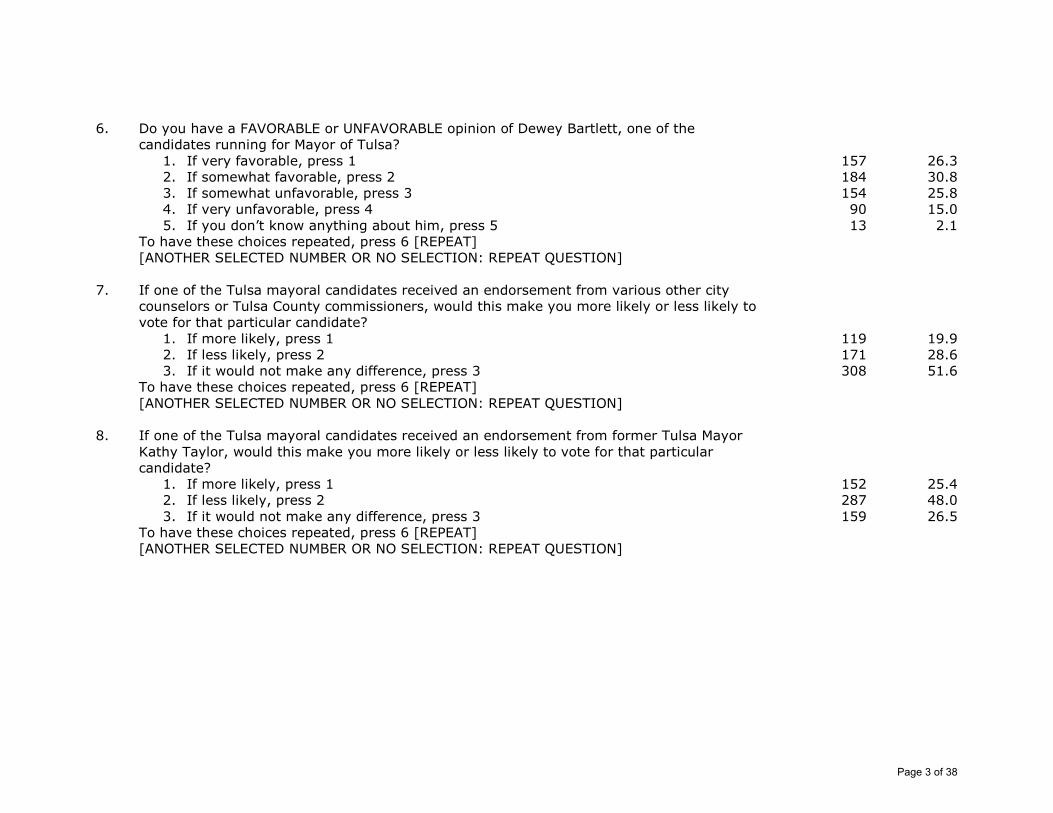
6. Do you have a FAVORABLE or UNFAVORABLE opinion of Dewey Bartlett, one of the
candidates running for Mayor of Tulsa?
1. If very favorable, press 1
2. If somewhat favorable, press 2
3. If somewhat unfavorable, press 3
4. If very unfavorable, press 4
5. If you don’t know anything about him, press 5
To have these choices repeated, press 6 [REPEAT]
[ANOTHER SELECTED NUMBER OR NO SELECTION: REPEAT QUESTION]
157
184
154
90
13
26.3
30.8
25.8
15.0
2.1
7. If one of the Tulsa mayoral candidates received an endorsement from various other city
counselors or Tulsa County commissioners, would this make you more likely or less likely to
vote for that particular candidate?
1. If more likely, press 1
2. If less likely, press 2
3. If it would not make any difference, press 3
To have these choices repeated, press 6 [REPEAT]
[ANOTHER SELECTED NUMBER OR NO SELECTION: REPEAT QUESTION]
119
171
308
19.9
28.6
51.6
8. If one of the Tulsa mayoral candidates received an endorsement from former Tulsa Mayor
Kathy Taylor, would this make you more likely or less likely to vote for that particular
candidate?
1. If more likely, press 1
2. If less likely, press 2
3. If it would not make any difference, press 3
To have these choices repeated, press 6 [REPEAT]
[ANOTHER SELECTED NUMBER OR NO SELECTION: REPEAT QUESTION]
152
287
159
25.4
48.0
26.5
Page 3 of 38
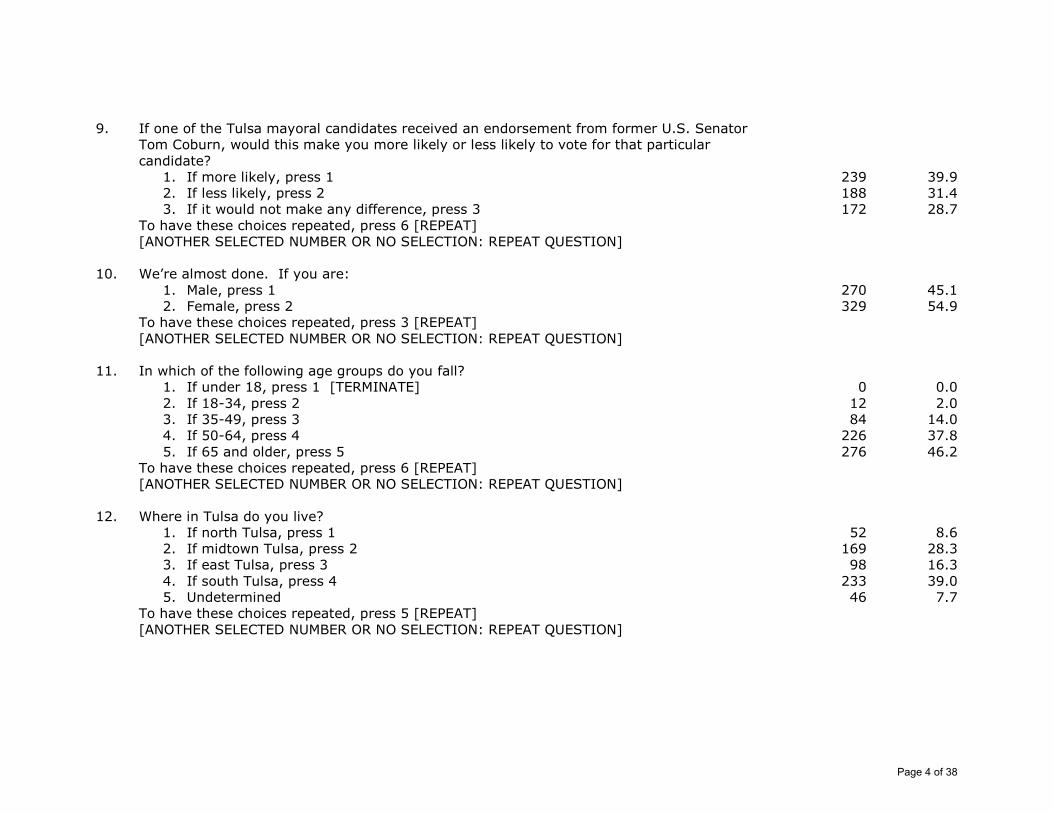
9. If one of the Tulsa mayoral candidates received an endorsement from former U.S. Senator
Tom Coburn, would this make you more likely or less likely to vote for that particular
candidate?
1. If more likely, press 1
2. If less likely, press 2
3. If it would not make any difference, press 3
To have these choices repeated, press 6 [REPEAT]
[ANOTHER SELECTED NUMBER OR NO SELECTION: REPEAT QUESTION]
239
188
172
39.9
31.4
28.7
10. We’re almost done. If you are:
1. Male, press 1
2. Female, press 2
To have these choices repeated, press 3 [REPEAT]
[ANOTHER SELECTED NUMBER OR NO SELECTION: REPEAT QUESTION]
270
329
45.1
54.9
11. In which of the following age groups do you fall?
1. If under 18, press 1 [TERMINATE]
2. If 18-34, press 2
3. If 35-49, press 3
4. If 50-64, press 4
5. If 65 and older, press 5
To have these choices repeated, press 6 [REPEAT]
[ANOTHER SELECTED NUMBER OR NO SELECTION: REPEAT QUESTION]
0
12
84
226
276
0.0
2.0
14.0
37.8
46.2
12. Where in Tulsa do you live?
1. If north Tulsa, press 1
2. If midtown Tulsa, press 2
3. If east Tulsa, press 3
4. If south Tulsa, press 4
5. Undetermined
To have these choices repeated, press 5 [REPEAT]
[ANOTHER SELECTED NUMBER OR NO SELECTION: REPEAT QUESTION]
52
169
98
233
46
8.6
28.3
16.3
39.0
7.7
Page 4 of 38
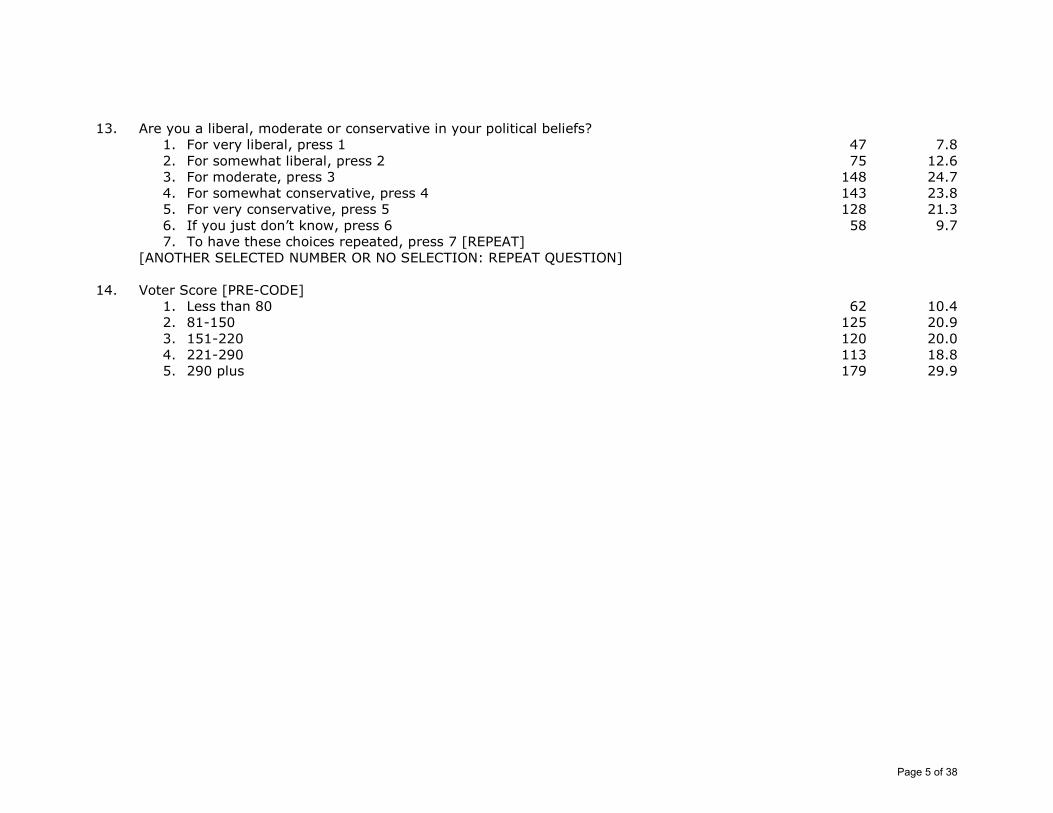
13. Are you a liberal, moderate or conservative in your political beliefs?
1. For very liberal, press 1
2. For somewhat liberal, press 2
3. For moderate, press 3
4. For somewhat conservative, press 4
5. For very conservative, press 5
6. If you just don’t know, press 6
7. To have these choices repeated, press 7 [REPEAT]
[ANOTHER SELECTED NUMBER OR NO SELECTION: REPEAT QUESTION]
47
75
148
143
128
58
7.8
12.6
24.7
23.8
21.3
9.7
14. Voter Score [PRE-CODE]
1. Less than 80
2. 81-150
3. 151-220
4. 221-290
5. 290 plus
62
125
120
113
179
10.4
20.9
20.0
18.8
29.9
Page 5 of 38
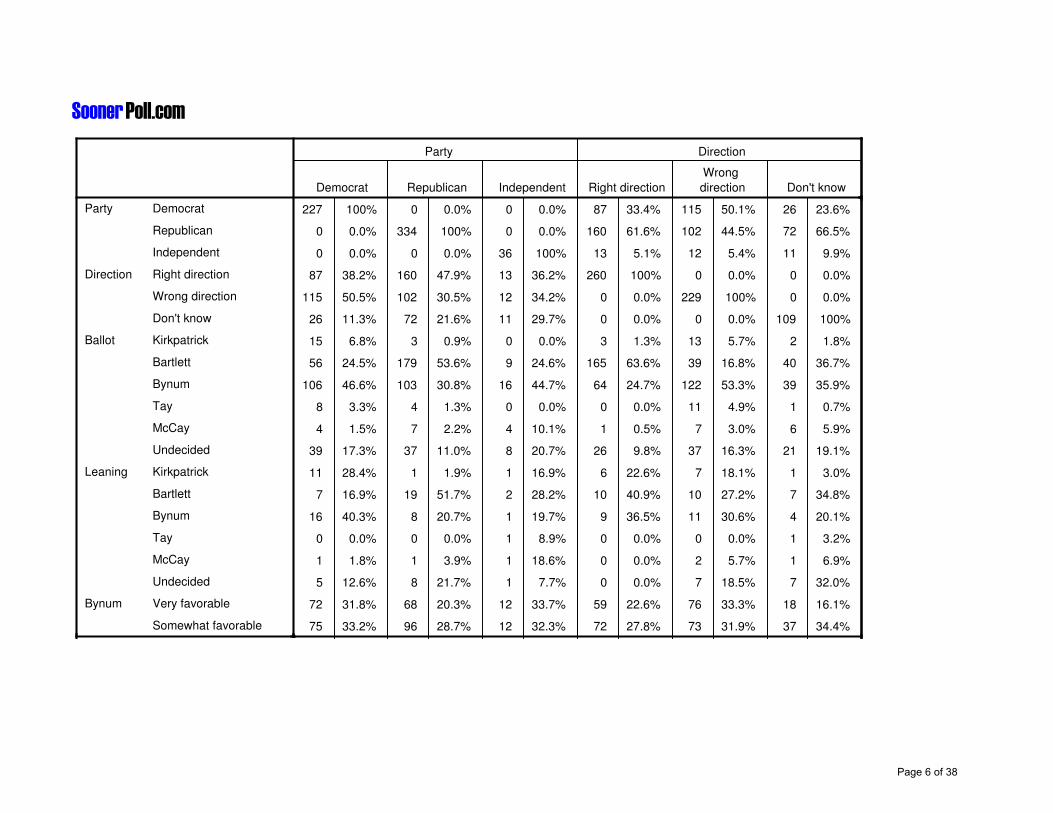
SoonerPoll.com
Party Direction
Democrat Republican Independent Right direction
Wrong
direction Don't know
Party Democrat
Republican
Independent
Direction Right direction
Wrong direction
Don't know
Ballot Kirkpatrick
Bartlett
Bynum
Tay
McCay
Undecided
Leaning Kirkpatrick
Bartlett
Bynum
Tay
McCay
Undecided
Bynum Very favorable
Somewhat favorable
227 100% 0 0.0% 0 0.0% 87 33.4% 115 50.1% 26 23.6%
0 0.0% 334 100% 0 0.0% 160 61.6% 102 44.5% 72 66.5%
0 0.0% 0 0.0% 36 100% 13 5.1% 12 5.4% 11 9.9%
87 38.2% 160 47.9% 13 36.2% 260 100% 0 0.0% 0 0.0%
115 50.5% 102 30.5% 12 34.2% 0 0.0% 229 100% 0 0.0%
26 11.3% 72 21.6% 11 29.7% 0 0.0% 0 0.0% 109 100%
15 6.8% 3 0.9% 0 0.0% 3 1.3% 13 5.7% 2 1.8%
56 24.5% 179 53.6% 9 24.6% 165 63.6% 39 16.8% 40 36.7%
106 46.6% 103 30.8% 16 44.7% 64 24.7% 122 53.3% 39 35.9%
8 3.3% 4 1.3% 0 0.0% 0 0.0% 11 4.9% 1 0.7%
4 1.5% 7 2.2% 4 10.1% 1 0.5% 7 3.0% 6 5.9%
39 17.3% 37 11.0% 8 20.7% 26 9.8% 37 16.3% 21 19.1%
11 28.4% 1 1.9% 1 16.9% 6 22.6% 7 18.1% 1 3.0%
7 16.9% 19 51.7% 2 28.2% 10 40.9% 10 27.2% 7 34.8%
16 40.3% 8 20.7% 1 19.7% 9 36.5% 11 30.6% 4 20.1%
0 0.0% 0 0.0% 1 8.9% 0 0.0% 0 0.0% 1 3.2%
1 1.8% 1 3.9% 1 18.6% 0 0.0% 2 5.7% 1 6.9%
5 12.6% 8 21.7% 1 7.7% 0 0.0% 7 18.5% 7 32.0%
72 31.8% 68 20.3% 12 33.7% 59 22.6% 76 33.3% 18 16.1%
75 33.2% 96 28.7% 12 32.3% 72 27.8% 73 31.9% 37 34.4%
Page 6 of 38
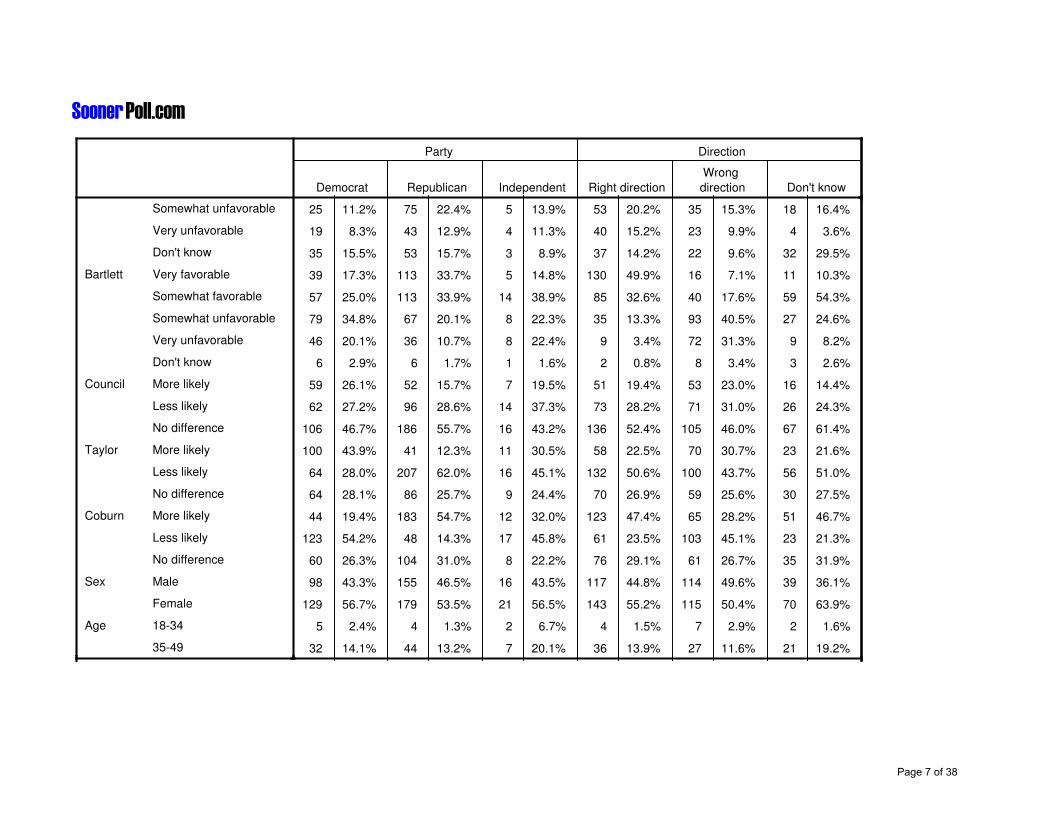
SoonerPoll.com
Party Direction
Democrat Republican Independent Right direction
Wrong
direction Don't know
Somewhat unfavorable
Very unfavorable
Don't know
Bartlett Very favorable
Somewhat favorable
Somewhat unfavorable
Very unfavorable
Don't know
Council More likely
Less likely
No difference
Taylor More likely
Less likely
No difference
Coburn More likely
Less likely
No difference
Sex Male
Female
Age 18-34
35-49
25 11.2% 75 22.4% 5 13.9% 53 20.2% 35 15.3% 18 16.4%
19 8.3% 43 12.9% 4 11.3% 40 15.2% 23 9.9% 4 3.6%
35 15.5% 53 15.7% 3 8.9% 37 14.2% 22 9.6% 32 29.5%
39 17.3% 113 33.7% 5 14.8% 130 49.9% 16 7.1% 11 10.3%
57 25.0% 113 33.9% 14 38.9% 85 32.6% 40 17.6% 59 54.3%
79 34.8% 67 20.1% 8 22.3% 35 13.3% 93 40.5% 27 24.6%
46 20.1% 36 10.7% 8 22.4% 9 3.4% 72 31.3% 9 8.2%
6 2.9% 6 1.7% 1 1.6% 2 0.8% 8 3.4% 3 2.6%
59 26.1% 52 15.7% 7 19.5% 51 19.4% 53 23.0% 16 14.4%
62 27.2% 96 28.6% 14 37.3% 73 28.2% 71 31.0% 26 24.3%
106 46.7% 186 55.7% 16 43.2% 136 52.4% 105 46.0% 67 61.4%
100 43.9% 41 12.3% 11 30.5% 58 22.5% 70 30.7% 23 21.6%
64 28.0% 207 62.0% 16 45.1% 132 50.6% 100 43.7% 56 51.0%
64 28.1% 86 25.7% 9 24.4% 70 26.9% 59 25.6% 30 27.5%
44 19.4% 183 54.7% 12 32.0% 123 47.4% 65 28.2% 51 46.7%
123 54.2% 48 14.3% 17 45.8% 61 23.5% 103 45.1% 23 21.3%
60 26.3% 104 31.0% 8 22.2% 76 29.1% 61 26.7% 35 31.9%
98 43.3% 155 46.5% 16 43.5% 117 44.8% 114 49.6% 39 36.1%
129 56.7% 179 53.5% 21 56.5% 143 55.2% 115 50.4% 70 63.9%
5 2.4% 4 1.3% 2 6.7% 4 1.5% 7 2.9% 2 1.6%
32 14.1% 44 13.2% 7 20.1% 36 13.9% 27 11.6% 21 19.2%
Page 7 of 38

SoonerPoll.com
Party Direction
Democrat Republican Independent Right direction
Wrong
direction Don't know
50-64
65 plus
Live North Tulsa
Midtown Tulsa
East Tulsa
South Tulsa
Undetermined
Label Very liberal
Somewhat liberal
Moderate
Somewhat conservative
Very conservative
Don't know
VScore <80
80-150
151-220
221-290
290 plus
85 37.6% 125 37.3% 16 44.2% 93 35.9% 93 40.7% 40 36.3%
105 46.0% 161 48.2% 11 29.0% 127 48.7% 103 44.9% 47 43.0%
35 15.5% 14 4.0% 3 8.0% 12 4.8% 31 13.6% 8 7.5%
71 31.1% 92 27.5% 7 18.4% 78 30.0% 66 28.7% 25 23.4%
38 16.7% 56 16.7% 4 10.7% 44 17.0% 38 16.5% 16 14.4%
69 30.3% 148 44.3% 16 43.4% 115 44.0% 76 33.1% 43 39.2%
14 6.4% 25 7.4% 7 19.5% 11 4.2% 19 8.1% 17 15.5%
39 17.3% 5 1.6% 2 5.8% 17 6.4% 26 11.5% 4 3.5%
53 23.3% 20 5.9% 2 6.9% 29 11.0% 35 15.3% 11 10.6%
75 33.1% 61 18.4% 11 30.3% 61 23.3% 69 30.3% 18 16.3%
28 12.2% 106 31.6% 9 25.3% 76 29.2% 36 15.6% 31 28.3%
11 4.6% 115 34.3% 2 6.6% 64 24.6% 36 15.7% 28 25.3%
22 9.6% 27 8.1% 9 25.2% 14 5.5% 27 11.6% 17 15.9%
21 9.4% 36 10.7% 5 12.9% 21 7.9% 26 11.1% 16 14.5%
55 24.3% 57 17.0% 13 34.7% 50 19.3% 59 25.9% 15 13.9%
50 22.1% 59 17.6% 11 29.3% 52 20.0% 47 20.4% 21 19.3%
40 17.5% 66 19.6% 7 19.9% 43 16.4% 43 18.7% 27 25.1%
61 26.7% 117 35.0% 1 3.2% 95 36.4% 55 23.8% 30 27.2%
Page 8 of 38
SoonerPoll.com
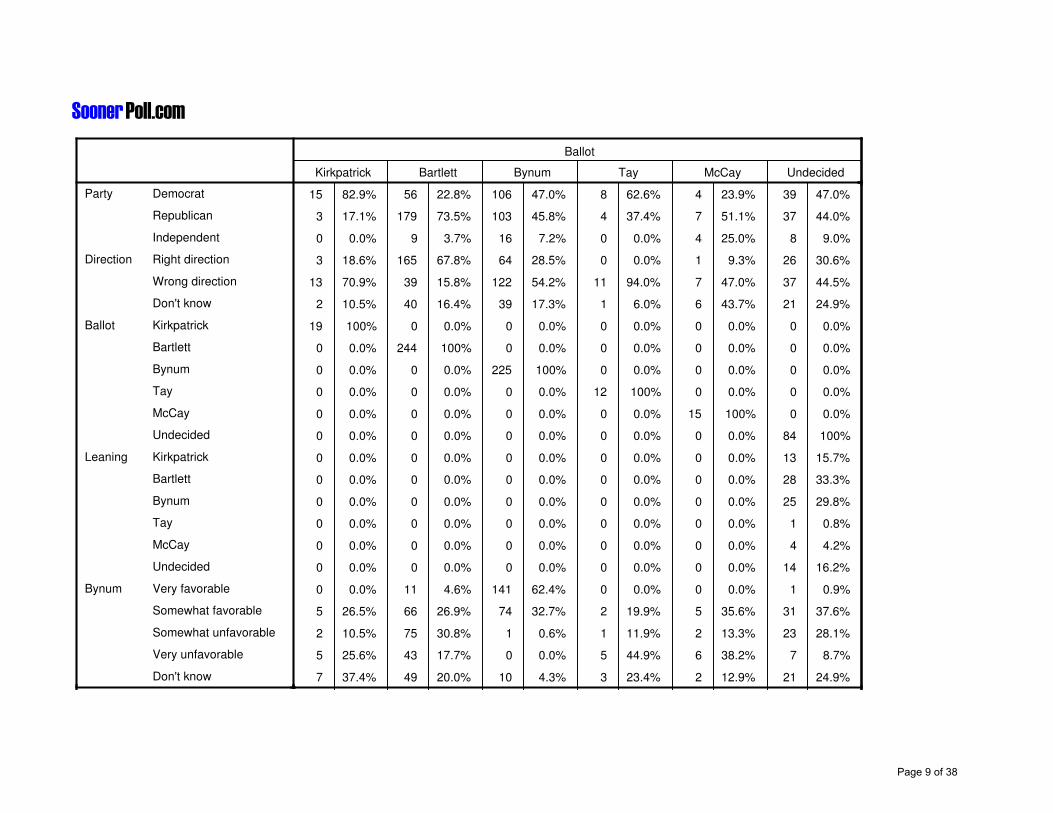
Ballot
Kirkpatrick Bartlett Bynum Tay McCay Undecided
Party Democrat
Republican
Independent
Direction Right direction
Wrong direction
Don't know
Ballot Kirkpatrick
Bartlett
Bynum
Tay
McCay
Undecided
Leaning Kirkpatrick
Bartlett
Bynum
Tay
McCay
Undecided
Bynum Very favorable
Somewhat favorable
Somewhat unfavorable
Very unfavorable
Don't know
15 82.9% 56 22.8% 106 47.0% 8 62.6% 4 23.9% 39 47.0%
3 17.1% 179 73.5% 103 45.8% 4 37.4% 7 51.1% 37 44.0%
0 0.0% 9 3.7% 16 7.2% 0 0.0% 4 25.0% 8 9.0%
3 18.6% 165 67.8% 64 28.5% 0 0.0% 1 9.3% 26 30.6%
13 70.9% 39 15.8% 122 54.2% 11 94.0% 7 47.0% 37 44.5%
2 10.5% 40 16.4% 39 17.3% 1 6.0% 6 43.7% 21 24.9%
19 100% 0 0.0% 0 0.0% 0 0.0% 0 0.0% 0 0.0%
0 0.0% 244 100% 0 0.0% 0 0.0% 0 0.0% 0 0.0%
0 0.0% 0 0.0% 225 100% 0 0.0% 0 0.0% 0 0.0%
0 0.0% 0 0.0% 0 0.0% 12 100% 0 0.0% 0 0.0%
0 0.0% 0 0.0% 0 0.0% 0 0.0% 15 100% 0 0.0%
0 0.0% 0 0.0% 0 0.0% 0 0.0% 0 0.0% 84 100%
0 0.0% 0 0.0% 0 0.0% 0 0.0% 0 0.0% 13 15.7%
0 0.0% 0 0.0% 0 0.0% 0 0.0% 0 0.0% 28 33.3%
0 0.0% 0 0.0% 0 0.0% 0 0.0% 0 0.0% 25 29.8%
0 0.0% 0 0.0% 0 0.0% 0 0.0% 0 0.0% 1 0.8%
0 0.0% 0 0.0% 0 0.0% 0 0.0% 0 0.0% 4 4.2%
0 0.0% 0 0.0% 0 0.0% 0 0.0% 0 0.0% 14 16.2%
0 0.0% 11 4.6% 141 62.4% 0 0.0% 0 0.0% 1 0.9%
5 26.5% 66 26.9% 74 32.7% 2 19.9% 5 35.6% 31 37.6%
2 10.5% 75 30.8% 1 0.6% 1 11.9% 2 13.3% 23 28.1%
5 25.6% 43 17.7% 0 0.0% 5 44.9% 6 38.2% 7 8.7%
7 37.4% 49 20.0% 10 4.3% 3 23.4% 2 12.9% 21 24.9%
Page 9 of 38
SoonerPoll.com
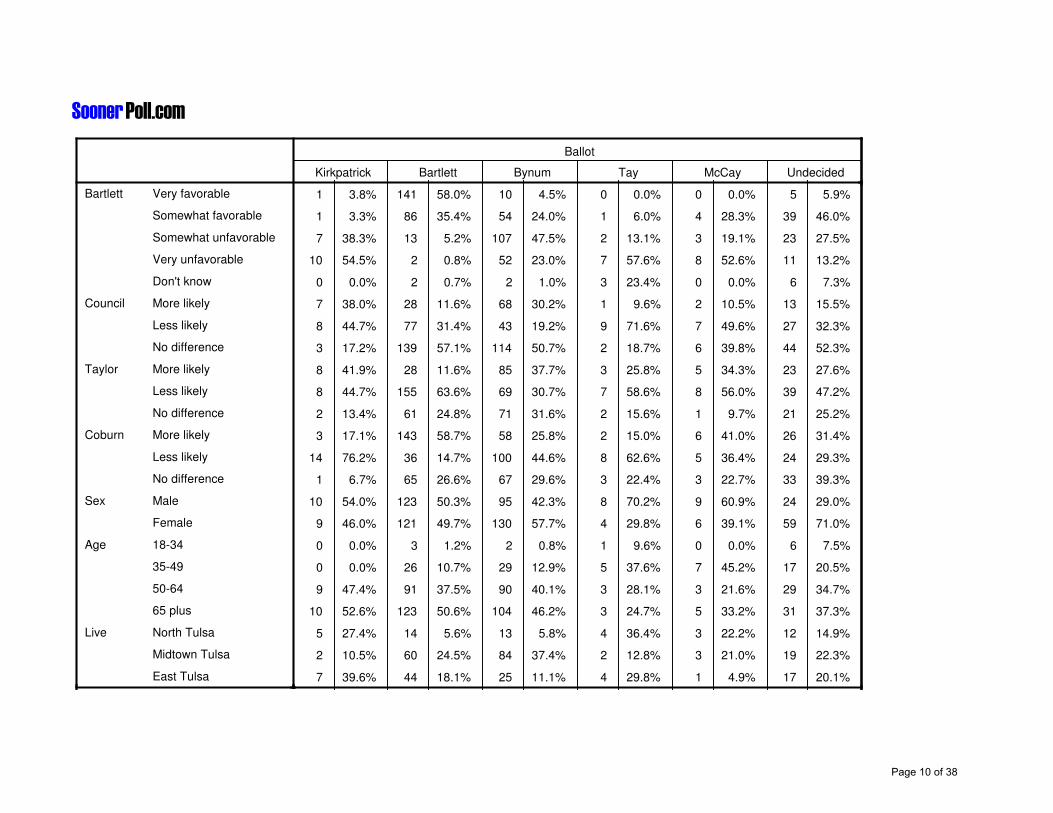
Ballot
Kirkpatrick Bartlett Bynum Tay McCay Undecided
Bartlett Very favorable
Somewhat favorable
Somewhat unfavorable
Very unfavorable
Don't know
Council More likely
Less likely
No difference
Taylor More likely
Less likely
No difference
Coburn More likely
Less likely
No difference
Sex Male
Female
Age 18-34
35-49
50-64
65 plus
Live North Tulsa
Midtown Tulsa
East Tulsa
1 3.8% 141 58.0% 10 4.5% 0 0.0% 0 0.0% 5 5.9%
1 3.3% 86 35.4% 54 24.0% 1 6.0% 4 28.3% 39 46.0%
7 38.3% 13 5.2% 107 47.5% 2 13.1% 3 19.1% 23 27.5%
10 54.5% 2 0.8% 52 23.0% 7 57.6% 8 52.6% 11 13.2%
0 0.0% 2 0.7% 2 1.0% 3 23.4% 0 0.0% 6 7.3%
7 38.0% 28 11.6% 68 30.2% 1 9.6% 2 10.5% 13 15.5%
8 44.7% 77 31.4% 43 19.2% 9 71.6% 7 49.6% 27 32.3%
3 17.2% 139 57.1% 114 50.7% 2 18.7% 6 39.8% 44 52.3%
8 41.9% 28 11.6% 85 37.7% 3 25.8% 5 34.3% 23 27.6%
8 44.7% 155 63.6% 69 30.7% 7 58.6% 8 56.0% 39 47.2%
2 13.4% 61 24.8% 71 31.6% 2 15.6% 1 9.7% 21 25.2%
3 17.1% 143 58.7% 58 25.8% 2 15.0% 6 41.0% 26 31.4%
14 76.2% 36 14.7% 100 44.6% 8 62.6% 5 36.4% 24 29.3%
1 6.7% 65 26.6% 67 29.6% 3 22.4% 3 22.7% 33 39.3%
10 54.0% 123 50.3% 95 42.3% 8 70.2% 9 60.9% 24 29.0%
9 46.0% 121 49.7% 130 57.7% 4 29.8% 6 39.1% 59 71.0%
0 0.0% 3 1.2% 2 0.8% 1 9.6% 0 0.0% 6 7.5%
0 0.0% 26 10.7% 29 12.9% 5 37.6% 7 45.2% 17 20.5%
9 47.4% 91 37.5% 90 40.1% 3 28.1% 3 21.6% 29 34.7%
10 52.6% 123 50.6% 104 46.2% 3 24.7% 5 33.2% 31 37.3%
5 27.4% 14 5.6% 13 5.8% 4 36.4% 3 22.2% 12 14.9%
2 10.5% 60 24.5% 84 37.4% 2 12.8% 3 21.0% 19 22.3%
7 39.6% 44 18.1% 25 11.1% 4 29.8% 1 4.9% 17 20.1%
Page 10 of 38

SoonerPoll.com
Ballot
Kirkpatrick Bartlett Bynum Tay McCay Undecided
South Tulsa
Undetermined
Label Very liberal
Somewhat liberal
Moderate
Somewhat conservative
Very conservative
Don't know
VScore <80
80-150
151-220
221-290
290 plus
3 18.6% 108 44.4% 91 40.2% 3 21.0% 6 39.6% 23 26.9%
1 3.9% 18 7.5% 12 5.5% 0 0.0% 2 12.3% 13 15.8%
6 29.7% 8 3.2% 20 8.8% 3 28.6% 4 29.1% 6 7.0%
5 26.5% 15 6.3% 46 20.3% 1 6.8% 1 4.0% 8 9.5%
4 19.5% 45 18.5% 73 32.6% 2 19.7% 2 10.5% 22 26.0%
0 0.0% 70 28.7% 45 20.0% 5 44.9% 5 34.4% 17 20.5%
4 20.5% 82 33.6% 24 10.7% 0 0.0% 0 0.0% 18 21.3%
1 3.8% 24 9.9% 17 7.6% 0 0.0% 3 22.0% 13 15.6%
2 12.3% 23 9.6% 18 8.2% 3 28.7% 2 12.9% 12 14.9%
2 8.4% 41 16.9% 45 19.9% 4 29.8% 6 42.6% 27 32.7%
5 25.6% 43 17.8% 56 24.8% 3 21.5% 1 4.9% 13 15.0%
1 6.7% 51 20.9% 48 21.3% 2 13.1% 1 8.8% 10 11.4%
9 47.0% 85 34.8% 58 25.8% 1 6.8% 5 30.7% 22 26.0%
Page 11 of 38
SoonerPoll.com
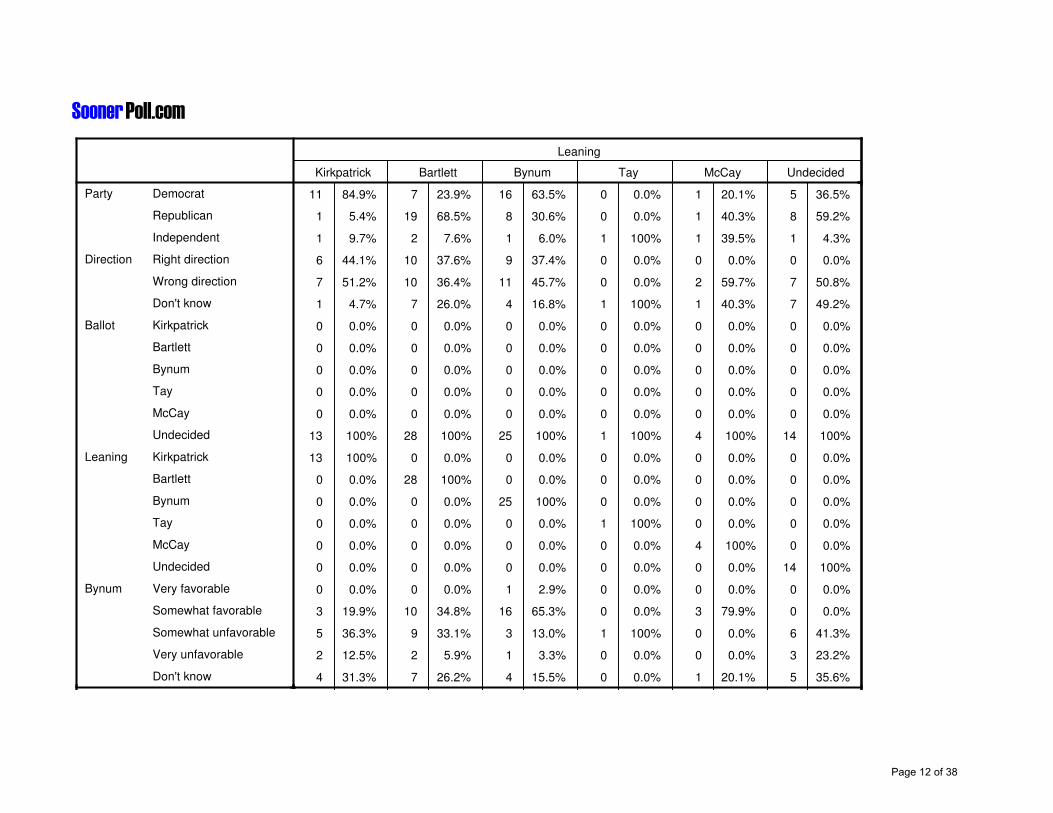
Leaning
Kirkpatrick Bartlett Bynum Tay McCay Undecided
Party Democrat
Republican
Independent
Direction Right direction
Wrong direction
Don't know
Ballot Kirkpatrick
Bartlett
Bynum
Tay
McCay
Undecided
Leaning Kirkpatrick
Bartlett
Bynum
Tay
McCay
Undecided
Bynum Very favorable
Somewhat favorable
Somewhat unfavorable
Very unfavorable
Don't know
11 84.9% 7 23.9% 16 63.5% 0 0.0% 1 20.1% 5 36.5%
1 5.4% 19 68.5% 8 30.6% 0 0.0% 1 40.3% 8 59.2%
1 9.7% 2 7.6% 1 6.0% 1 100% 1 39.5% 1 4.3%
6 44.1% 10 37.6% 9 37.4% 0 0.0% 0 0.0% 0 0.0%
7 51.2% 10 36.4% 11 45.7% 0 0.0% 2 59.7% 7 50.8%
1 4.7% 7 26.0% 4 16.8% 1 100% 1 40.3% 7 49.2%
0 0.0% 0 0.0% 0 0.0% 0 0.0% 0 0.0% 0 0.0%
0 0.0% 0 0.0% 0 0.0% 0 0.0% 0 0.0% 0 0.0%
0 0.0% 0 0.0% 0 0.0% 0 0.0% 0 0.0% 0 0.0%
0 0.0% 0 0.0% 0 0.0% 0 0.0% 0 0.0% 0 0.0%
0 0.0% 0 0.0% 0 0.0% 0 0.0% 0 0.0% 0 0.0%
13 100% 28 100% 25 100% 1 100% 4 100% 14 100%
13 100% 0 0.0% 0 0.0% 0 0.0% 0 0.0% 0 0.0%
0 0.0% 28 100% 0 0.0% 0 0.0% 0 0.0% 0 0.0%
0 0.0% 0 0.0% 25 100% 0 0.0% 0 0.0% 0 0.0%
0 0.0% 0 0.0% 0 0.0% 1 100% 0 0.0% 0 0.0%
0 0.0% 0 0.0% 0 0.0% 0 0.0% 4 100% 0 0.0%
0 0.0% 0 0.0% 0 0.0% 0 0.0% 0 0.0% 14 100%
0 0.0% 0 0.0% 1 2.9% 0 0.0% 0 0.0% 0 0.0%
3 19.9% 10 34.8% 16 65.3% 0 0.0% 3 79.9% 0 0.0%
5 36.3% 9 33.1% 3 13.0% 1 100% 0 0.0% 6 41.3%
2 12.5% 2 5.9% 1 3.3% 0 0.0% 0 0.0% 3 23.2%
4 31.3% 7 26.2% 4 15.5% 0 0.0% 1 20.1% 5 35.6%
Page 12 of 38
SoonerPoll.com
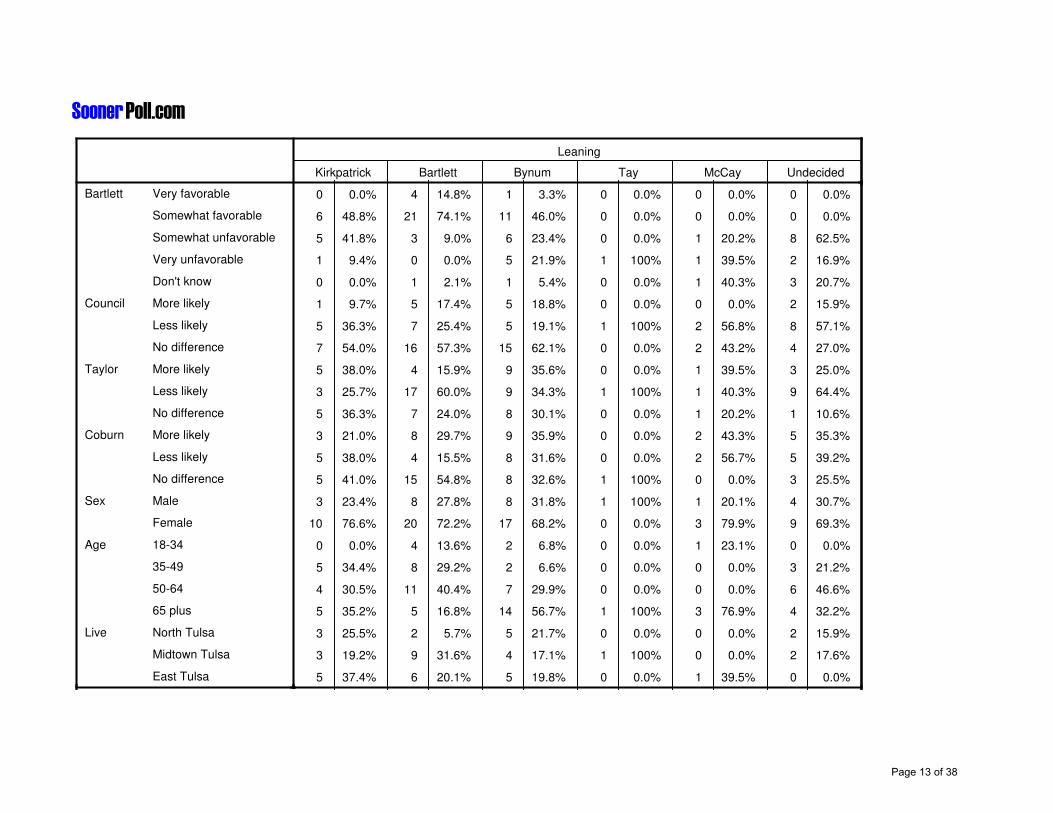
Leaning
Kirkpatrick Bartlett Bynum Tay McCay Undecided
Bartlett Very favorable
Somewhat favorable
Somewhat unfavorable
Very unfavorable
Don't know
Council More likely
Less likely
No difference
Taylor More likely
Less likely
No difference
Coburn More likely
Less likely
No difference
Sex Male
Female
Age 18-34
35-49
50-64
65 plus
Live North Tulsa
Midtown Tulsa
East Tulsa
0 0.0% 4 14.8% 1 3.3% 0 0.0% 0 0.0% 0 0.0%
6 48.8% 21 74.1% 11 46.0% 0 0.0% 0 0.0% 0 0.0%
5 41.8% 3 9.0% 6 23.4% 0 0.0% 1 20.2% 8 62.5%
1 9.4% 0 0.0% 5 21.9% 1 100% 1 39.5% 2 16.9%
0 0.0% 1 2.1% 1 5.4% 0 0.0% 1 40.3% 3 20.7%
1 9.7% 5 17.4% 5 18.8% 0 0.0% 0 0.0% 2 15.9%
5 36.3% 7 25.4% 5 19.1% 1 100% 2 56.8% 8 57.1%
7 54.0% 16 57.3% 15 62.1% 0 0.0% 2 43.2% 4 27.0%
5 38.0% 4 15.9% 9 35.6% 0 0.0% 1 39.5% 3 25.0%
3 25.7% 17 60.0% 9 34.3% 1 100% 1 40.3% 9 64.4%
5 36.3% 7 24.0% 8 30.1% 0 0.0% 1 20.2% 1 10.6%
3 21.0% 8 29.7% 9 35.9% 0 0.0% 2 43.3% 5 35.3%
5 38.0% 4 15.5% 8 31.6% 0 0.0% 2 56.7% 5 39.2%
5 41.0% 15 54.8% 8 32.6% 1 100% 0 0.0% 3 25.5%
3 23.4% 8 27.8% 8 31.8% 1 100% 1 20.1% 4 30.7%
10 76.6% 20 72.2% 17 68.2% 0 0.0% 3 79.9% 9 69.3%
0 0.0% 4 13.6% 2 6.8% 0 0.0% 1 23.1% 0 0.0%
5 34.4% 8 29.2% 2 6.6% 0 0.0% 0 0.0% 3 21.2%
4 30.5% 11 40.4% 7 29.9% 0 0.0% 0 0.0% 6 46.6%
5 35.2% 5 16.8% 14 56.7% 1 100% 3 76.9% 4 32.2%
3 25.5% 2 5.7% 5 21.7% 0 0.0% 0 0.0% 2 15.9%
3 19.2% 9 31.6% 4 17.1% 1 100% 0 0.0% 2 17.6%
5 37.4% 6 20.1% 5 19.8% 0 0.0% 1 39.5% 0 0.0%
Page 13 of 38
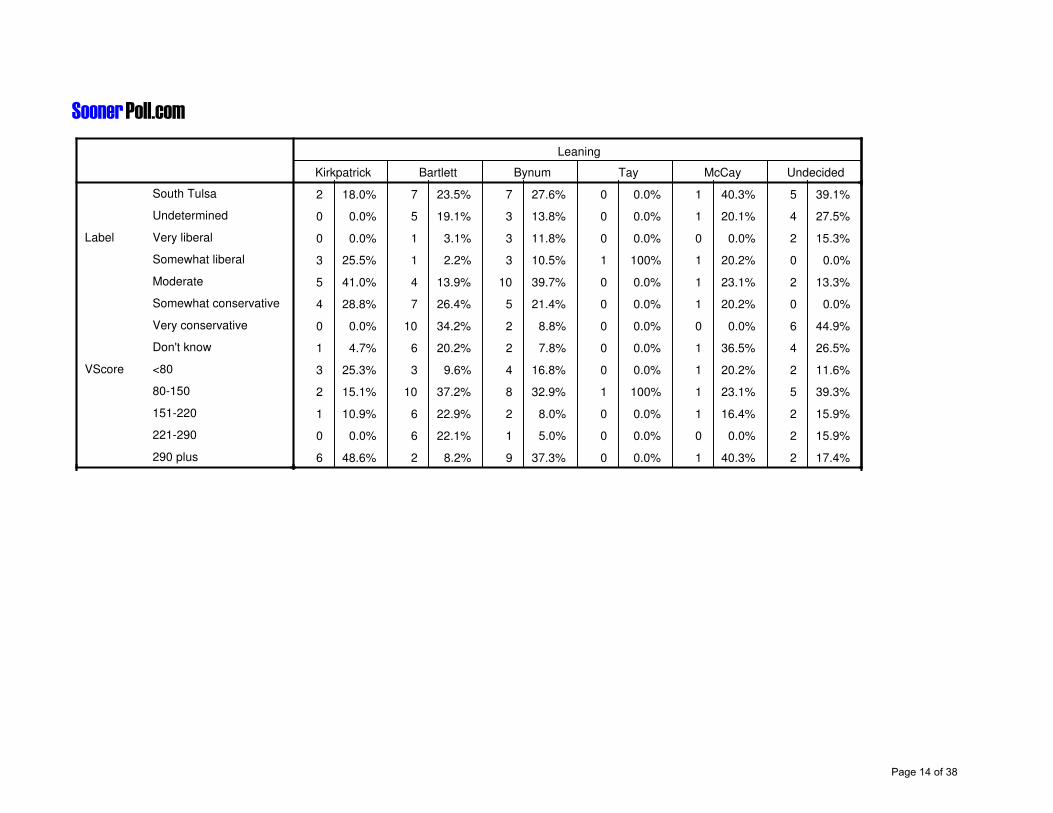
SoonerPoll.com
Leaning
Kirkpatrick Bartlett Bynum Tay McCay Undecided
South Tulsa
Undetermined
Label Very liberal
Somewhat liberal
Moderate
Somewhat conservative
Very conservative
Don't know
VScore <80
80-150
151-220
221-290
290 plus
2 18.0% 7 23.5% 7 27.6% 0 0.0% 1 40.3% 5 39.1%
0 0.0% 5 19.1% 3 13.8% 0 0.0% 1 20.1% 4 27.5%
0 0.0% 1 3.1% 3 11.8% 0 0.0% 0 0.0% 2 15.3%
3 25.5% 1 2.2% 3 10.5% 1 100% 1 20.2% 0 0.0%
5 41.0% 4 13.9% 10 39.7% 0 0.0% 1 23.1% 2 13.3%
4 28.8% 7 26.4% 5 21.4% 0 0.0% 1 20.2% 0 0.0%
0 0.0% 10 34.2% 2 8.8% 0 0.0% 0 0.0% 6 44.9%
1 4.7% 6 20.2% 2 7.8% 0 0.0% 1 36.5% 4 26.5%
3 25.3% 3 9.6% 4 16.8% 0 0.0% 1 20.2% 2 11.6%
2 15.1% 10 37.2% 8 32.9% 1 100% 1 23.1% 5 39.3%
1 10.9% 6 22.9% 2 8.0% 0 0.0% 1 16.4% 2 15.9%
0 0.0% 6 22.1% 1 5.0% 0 0.0% 0 0.0% 2 15.9%
6 48.6% 2 8.2% 9 37.3% 0 0.0% 1 40.3% 2 17.4%
Page 14 of 38

SoonerPoll.com
Bynum
Very favorable
Somewhat
favorable
Somewhat
unfavorable
Very
unfavorable Don't know
Party Democrat
Republican
Independent
Direction Right direction
Wrong direction
Don't know
Ballot Kirkpatrick
Bartlett
Bynum
Tay
McCay
Undecided
Leaning Kirkpatrick
Bartlett
Bynum
Tay
McCay
Undecided
Bynum Very favorable
Somewhat favorable
72 47.5% 75 41.2% 25 24.2% 19 28.4% 35 38.7%
68 44.5% 96 52.4% 75 71.0% 43 65.4% 53 57.8%
12 8.0% 12 6.4% 5 4.8% 4 6.2% 3 3.5%
59 38.5% 72 39.6% 53 49.8% 40 59.7% 37 40.6%
76 50.0% 73 40.0% 35 33.3% 23 34.4% 22 24.1%
18 11.5% 37 20.4% 18 16.9% 4 5.9% 32 35.3%
0 0.0% 5 2.7% 2 1.9% 5 7.2% 7 7.6%
11 7.3% 66 35.8% 75 71.3% 43 65.3% 49 53.7%
141 92.2% 74 40.2% 1 1.4% 0 0.0% 10 10.6%
0 0.0% 2 1.3% 1 1.4% 5 8.1% 3 3.1%
0 0.0% 5 2.9% 2 1.8% 6 8.4% 2 2.1%
1 0.5% 31 17.2% 23 22.3% 7 11.0% 21 22.9%
0 0.0% 3 8.3% 5 20.3% 2 22.7% 4 19.8%
0 0.0% 10 30.9% 9 39.2% 2 22.7% 7 35.1%
1 100% 16 51.8% 3 13.8% 1 11.3% 4 18.6%
0 0.0% 0 0.0% 1 2.8% 0 0.0% 0 0.0%
0 0.0% 3 9.0% 0 0.0% 0 0.0% 1 3.4%
0 0.0% 0 0.0% 6 23.8% 3 43.3% 5 23.1%
152 100% 0 0.0% 0 0.0% 0 0.0% 0 0.0%
0 0.0% 183 100% 0 0.0% 0 0.0% 0 0.0%
Page 15 of 38
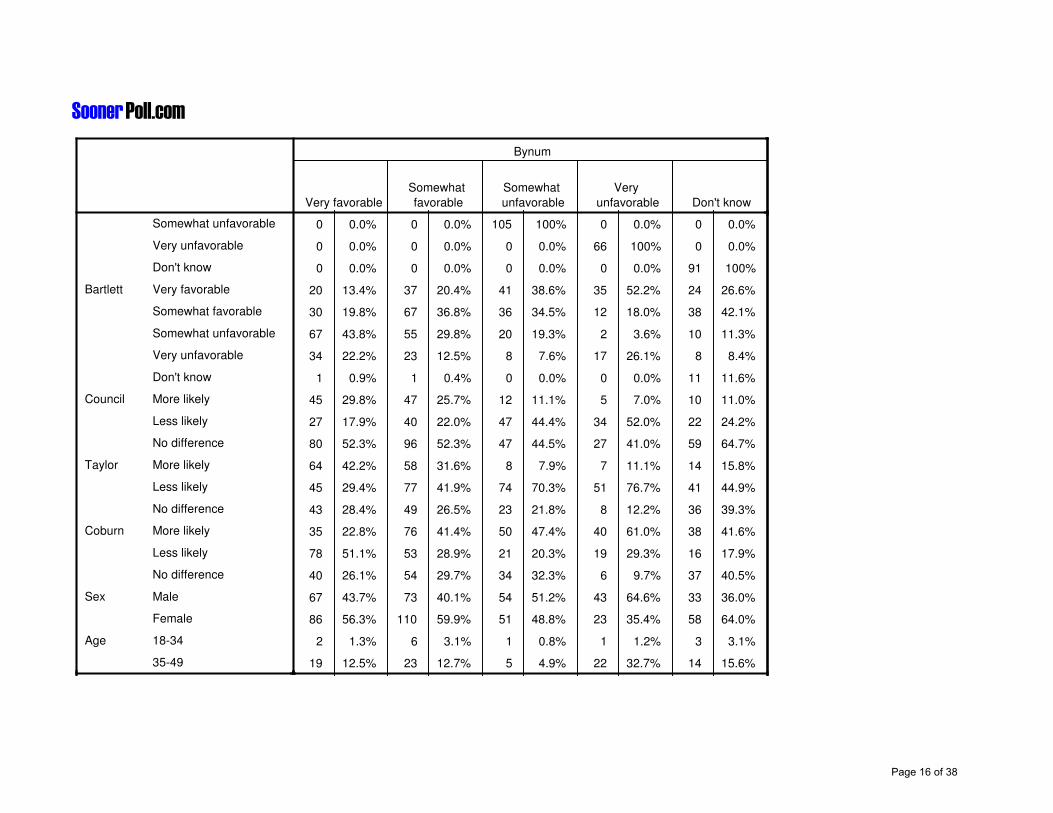
SoonerPoll.com
Bynum
Very favorable
Somewhat
favorable
Somewhat
unfavorable
Very
unfavorable Don't know
Somewhat unfavorable
Very unfavorable
Don't know
Bartlett Very favorable
Somewhat favorable
Somewhat unfavorable
Very unfavorable
Don't know
Council More likely
Less likely
No difference
Taylor More likely
Less likely
No difference
Coburn More likely
Less likely
No difference
Sex Male
Female
Age 18-34
35-49
0 0.0% 0 0.0% 105 100% 0 0.0% 0 0.0%
0 0.0% 0 0.0% 0 0.0% 66 100% 0 0.0%
0 0.0% 0 0.0% 0 0.0% 0 0.0% 91 100%
20 13.4% 37 20.4% 41 38.6% 35 52.2% 24 26.6%
30 19.8% 67 36.8% 36 34.5% 12 18.0% 38 42.1%
67 43.8% 55 29.8% 20 19.3% 2 3.6% 10 11.3%
34 22.2% 23 12.5% 8 7.6% 17 26.1% 8 8.4%
1 0.9% 1 0.4% 0 0.0% 0 0.0% 11 11.6%
45 29.8% 47 25.7% 12 11.1% 5 7.0% 10 11.0%
27 17.9% 40 22.0% 47 44.4% 34 52.0% 22 24.2%
80 52.3% 96 52.3% 47 44.5% 27 41.0% 59 64.7%
64 42.2% 58 31.6% 8 7.9% 7 11.1% 14 15.8%
45 29.4% 77 41.9% 74 70.3% 51 76.7% 41 44.9%
43 28.4% 49 26.5% 23 21.8% 8 12.2% 36 39.3%
35 22.8% 76 41.4% 50 47.4% 40 61.0% 38 41.6%
78 51.1% 53 28.9% 21 20.3% 19 29.3% 16 17.9%
40 26.1% 54 29.7% 34 32.3% 6 9.7% 37 40.5%
67 43.7% 73 40.1% 54 51.2% 43 64.6% 33 36.0%
86 56.3% 110 59.9% 51 48.8% 23 35.4% 58 64.0%
2 1.3% 6 3.1% 1 0.8% 1 1.2% 3 3.1%
19 12.5% 23 12.7% 5 4.9% 22 32.7% 14 15.6%
Page 16 of 38
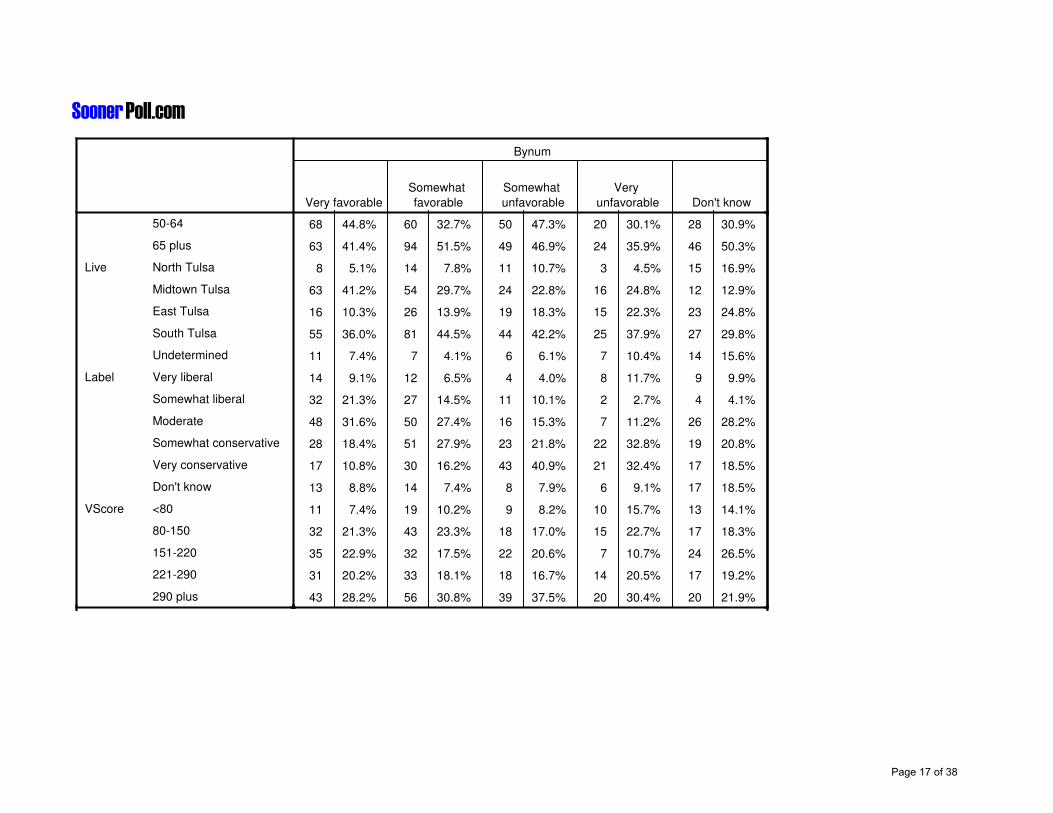
SoonerPoll.com
Bynum
Very favorable
Somewhat
favorable
Somewhat
unfavorable
Very
unfavorable Don't know
50-64
65 plus
Live North Tulsa
Midtown Tulsa
East Tulsa
South Tulsa
Undetermined
Label Very liberal
Somewhat liberal
Moderate
Somewhat conservative
Very conservative
Don't know
VScore <80
80-150
151-220
221-290
290 plus
68 44.8% 60 32.7% 50 47.3% 20 30.1% 28 30.9%
63 41.4% 94 51.5% 49 46.9% 24 35.9% 46 50.3%
8 5.1% 14 7.8% 11 10.7% 3 4.5% 15 16.9%
63 41.2% 54 29.7% 24 22.8% 16 24.8% 12 12.9%
16 10.3% 26 13.9% 19 18.3% 15 22.3% 23 24.8%
55 36.0% 81 44.5% 44 42.2% 25 37.9% 27 29.8%
11 7.4% 7 4.1% 6 6.1% 7 10.4% 14 15.6%
14 9.1% 12 6.5% 4 4.0% 8 11.7% 9 9.9%
32 21.3% 27 14.5% 11 10.1% 2 2.7% 4 4.1%
48 31.6% 50 27.4% 16 15.3% 7 11.2% 26 28.2%
28 18.4% 51 27.9% 23 21.8% 22 32.8% 19 20.8%
17 10.8% 30 16.2% 43 40.9% 21 32.4% 17 18.5%
13 8.8% 14 7.4% 8 7.9% 6 9.1% 17 18.5%
11 7.4% 19 10.2% 9 8.2% 10 15.7% 13 14.1%
32 21.3% 43 23.3% 18 17.0% 15 22.7% 17 18.3%
35 22.9% 32 17.5% 22 20.6% 7 10.7% 24 26.5%
31 20.2% 33 18.1% 18 16.7% 14 20.5% 17 19.2%
43 28.2% 56 30.8% 39 37.5% 20 30.4% 20 21.9%
Page 17 of 38
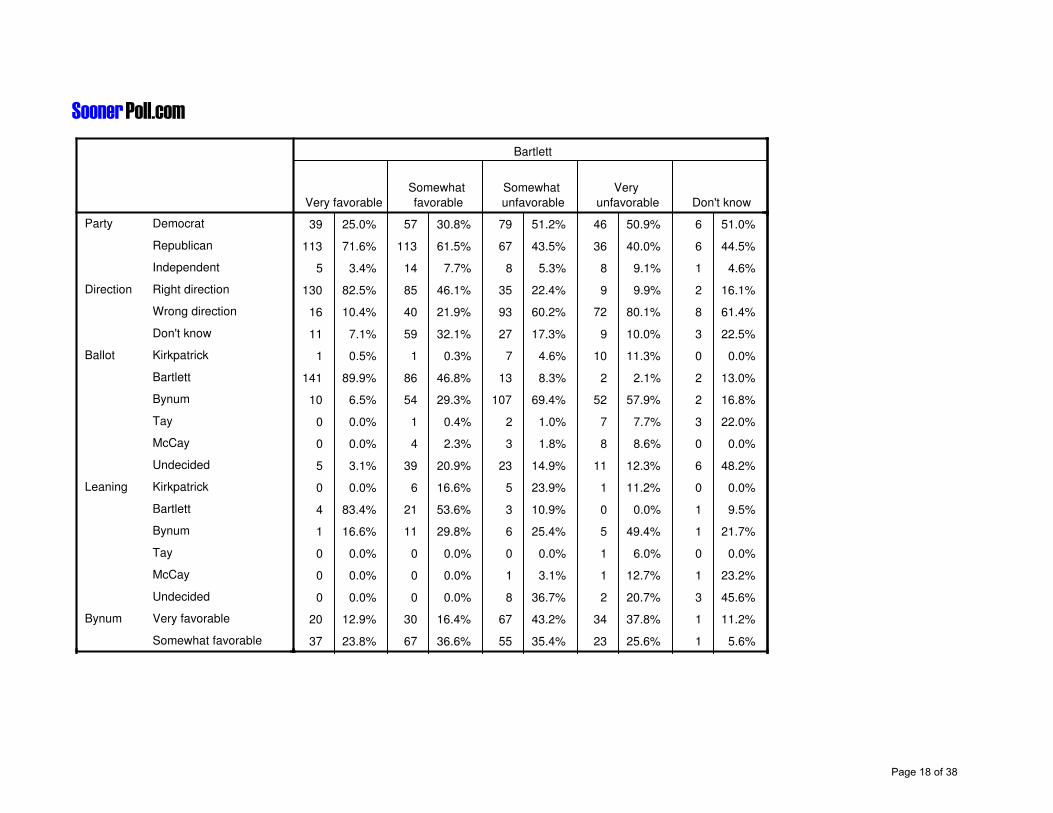
SoonerPoll.com
Bartlett
Very favorable
Somewhat
favorable
Somewhat
unfavorable
Very
unfavorable Don't know
Party Democrat
Republican
Independent
Direction Right direction
Wrong direction
Don't know
Ballot Kirkpatrick
Bartlett
Bynum
Tay
McCay
Undecided
Leaning Kirkpatrick
Bartlett
Bynum
Tay
McCay
Undecided
Bynum Very favorable
Somewhat favorable
39 25.0% 57 30.8% 79 51.2% 46 50.9% 6 51.0%
113 71.6% 113 61.5% 67 43.5% 36 40.0% 6 44.5%
5 3.4% 14 7.7% 8 5.3% 8 9.1% 1 4.6%
130 82.5% 85 46.1% 35 22.4% 9 9.9% 2 16.1%
16 10.4% 40 21.9% 93 60.2% 72 80.1% 8 61.4%
11 7.1% 59 32.1% 27 17.3% 9 10.0% 3 22.5%
1 0.5% 1 0.3% 7 4.6% 10 11.3% 0 0.0%
141 89.9% 86 46.8% 13 8.3% 2 2.1% 2 13.0%
10 6.5% 54 29.3% 107 69.4% 52 57.9% 2 16.8%
0 0.0% 1 0.4% 2 1.0% 7 7.7% 3 22.0%
0 0.0% 4 2.3% 3 1.8% 8 8.6% 0 0.0%
5 3.1% 39 20.9% 23 14.9% 11 12.3% 6 48.2%
0 0.0% 6 16.6% 5 23.9% 1 11.2% 0 0.0%
4 83.4% 21 53.6% 3 10.9% 0 0.0% 1 9.5%
1 16.6% 11 29.8% 6 25.4% 5 49.4% 1 21.7%
0 0.0% 0 0.0% 0 0.0% 1 6.0% 0 0.0%
0 0.0% 0 0.0% 1 3.1% 1 12.7% 1 23.2%
0 0.0% 0 0.0% 8 36.7% 2 20.7% 3 45.6%
20 12.9% 30 16.4% 67 43.2% 34 37.8% 1 11.2%
37 23.8% 67 36.6% 55 35.4% 23 25.6% 1 5.6%
Page 18 of 38
SoonerPoll.com
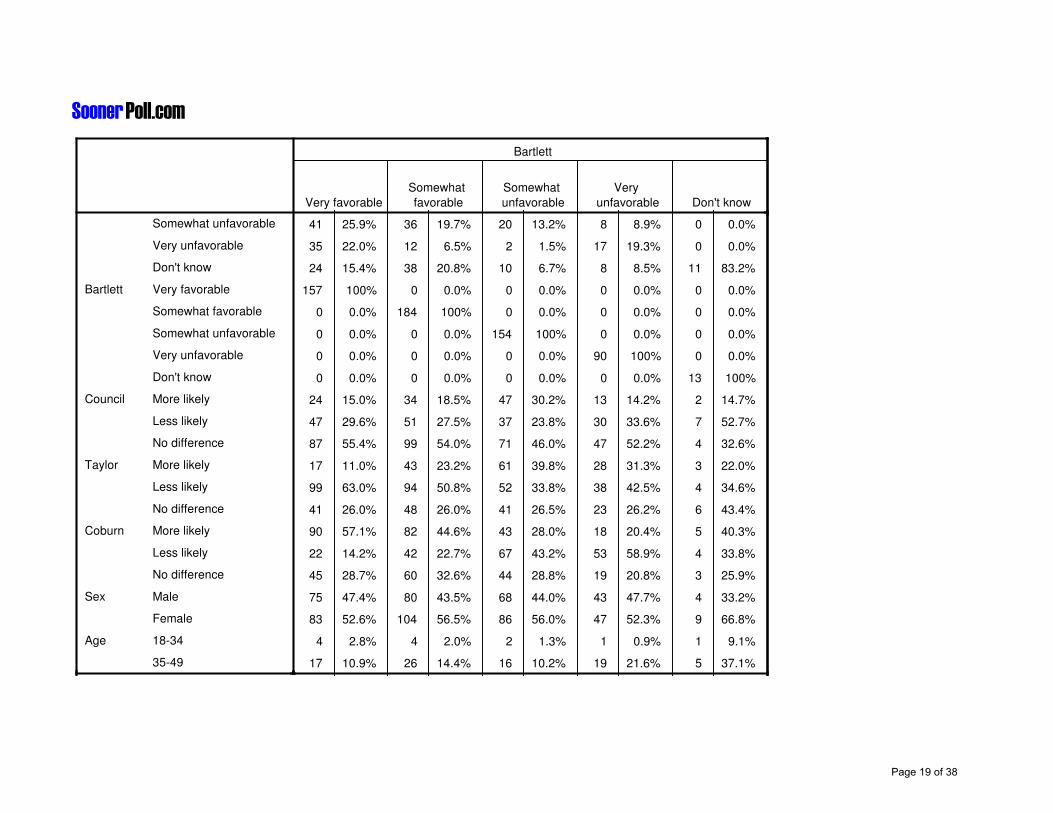
Bartlett
Very favorable
Somewhat
favorable
Somewhat
unfavorable
Very
unfavorable Don't know
Somewhat unfavorable
Very unfavorable
Don't know
Bartlett Very favorable
Somewhat favorable
Somewhat unfavorable
Very unfavorable
Don't know
Council More likely
Less likely
No difference
Taylor More likely
Less likely
No difference
Coburn More likely
Less likely
No difference
Sex Male
Female
Age 18-34
35-49
41 25.9% 36 19.7% 20 13.2% 8 8.9% 0 0.0%
35 22.0% 12 6.5% 2 1.5% 17 19.3% 0 0.0%
24 15.4% 38 20.8% 10 6.7% 8 8.5% 11 83.2%
157 100% 0 0.0% 0 0.0% 0 0.0% 0 0.0%
0 0.0% 184 100% 0 0.0% 0 0.0% 0 0.0%
0 0.0% 0 0.0% 154 100% 0 0.0% 0 0.0%
0 0.0% 0 0.0% 0 0.0% 90 100% 0 0.0%
0 0.0% 0 0.0% 0 0.0% 0 0.0% 13 100%
24 15.0% 34 18.5% 47 30.2% 13 14.2% 2 14.7%
47 29.6% 51 27.5% 37 23.8% 30 33.6% 7 52.7%
87 55.4% 99 54.0% 71 46.0% 47 52.2% 4 32.6%
17 11.0% 43 23.2% 61 39.8% 28 31.3% 3 22.0%
99 63.0% 94 50.8% 52 33.8% 38 42.5% 4 34.6%
41 26.0% 48 26.0% 41 26.5% 23 26.2% 6 43.4%
90 57.1% 82 44.6% 43 28.0% 18 20.4% 5 40.3%
22 14.2% 42 22.7% 67 43.2% 53 58.9% 4 33.8%
45 28.7% 60 32.6% 44 28.8% 19 20.8% 3 25.9%
75 47.4% 80 43.5% 68 44.0% 43 47.7% 4 33.2%
83 52.6% 104 56.5% 86 56.0% 47 52.3% 9 66.8%
4 2.8% 4 2.0% 2 1.3% 1 0.9% 1 9.1%
17 10.9% 26 14.4% 16 10.2% 19 21.6% 5 37.1%
Page 19 of 38
SoonerPoll.com
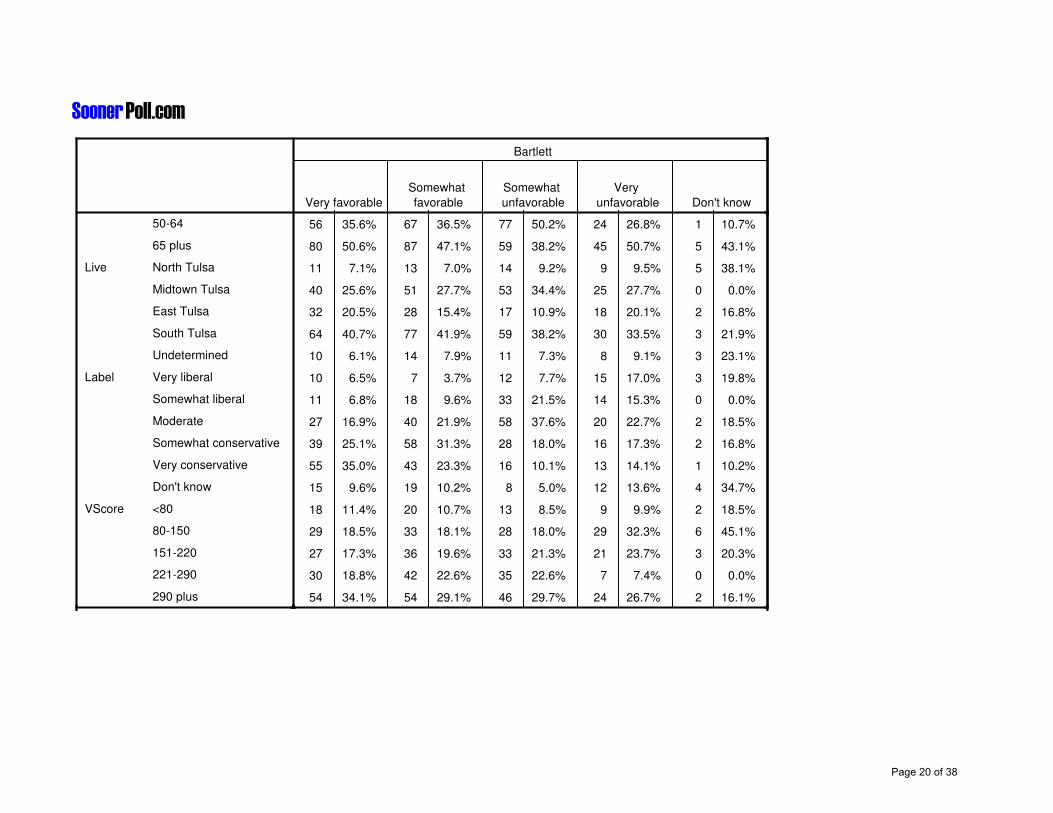
Bartlett
Very favorable
Somewhat
favorable
Somewhat
unfavorable
Very
unfavorable Don't know
50-64
65 plus
Live North Tulsa
Midtown Tulsa
East Tulsa
South Tulsa
Undetermined
Label Very liberal
Somewhat liberal
Moderate
Somewhat conservative
Very conservative
Don't know
VScore <80
80-150
151-220
221-290
290 plus
56 35.6% 67 36.5% 77 50.2% 24 26.8% 1 10.7%
80 50.6% 87 47.1% 59 38.2% 45 50.7% 5 43.1%
11 7.1% 13 7.0% 14 9.2% 9 9.5% 5 38.1%
40 25.6% 51 27.7% 53 34.4% 25 27.7% 0 0.0%
32 20.5% 28 15.4% 17 10.9% 18 20.1% 2 16.8%
64 40.7% 77 41.9% 59 38.2% 30 33.5% 3 21.9%
10 6.1% 14 7.9% 11 7.3% 8 9.1% 3 23.1%
10 6.5% 7 3.7% 12 7.7% 15 17.0% 3 19.8%
11 6.8% 18 9.6% 33 21.5% 14 15.3% 0 0.0%
27 16.9% 40 21.9% 58 37.6% 20 22.7% 2 18.5%
39 25.1% 58 31.3% 28 18.0% 16 17.3% 2 16.8%
55 35.0% 43 23.3% 16 10.1% 13 14.1% 1 10.2%
15 9.6% 19 10.2% 8 5.0% 12 13.6% 4 34.7%
18 11.4% 20 10.7% 13 8.5% 9 9.9% 2 18.5%
29 18.5% 33 18.1% 28 18.0% 29 32.3% 6 45.1%
27 17.3% 36 19.6% 33 21.3% 21 23.7% 3 20.3%
30 18.8% 42 22.6% 35 22.6% 7 7.4% 0 0.0%
54 34.1% 54 29.1% 46 29.7% 24 26.7% 2 16.1%
Page 20 of 38

SoonerPoll.com
Council Taylor
More likely Less likely No difference More likely Less likely No difference
Party Democrat
Republican
Independent
Direction Right direction
Wrong direction
Don't know
Ballot Kirkpatrick
Bartlett
Bynum
Tay
McCay
Undecided
Leaning Kirkpatrick
Bartlett
Bynum
Tay
McCay
Undecided
Bynum Very favorable
Somewhat favorable
59 49.9% 62 36.1% 106 34.4% 100 65.6% 64 22.1% 64 40.3%
52 44.1% 96 55.9% 186 60.5% 41 27.1% 207 72.2% 86 54.1%
7 6.0% 14 8.0% 16 5.1% 11 7.3% 16 5.7% 9 5.6%
51 42.5% 73 42.9% 136 44.2% 58 38.4% 132 45.8% 70 44.1%
53 44.3% 71 41.6% 105 34.2% 70 46.2% 100 34.9% 59 37.0%
16 13.2% 26 15.5% 67 21.7% 23 15.4% 56 19.3% 30 18.9%
7 5.9% 8 4.9% 3 1.0% 8 5.1% 8 2.9% 2 1.6%
28 23.7% 77 44.8% 139 45.1% 28 18.5% 155 54.0% 61 38.2%
68 57.2% 43 25.3% 114 37.0% 85 55.8% 69 24.1% 71 44.9%
1 1.0% 9 5.0% 2 0.7% 3 2.0% 7 2.4% 2 1.2%
2 1.3% 7 4.3% 6 1.9% 5 3.3% 8 2.9% 1 0.9%
13 10.9% 27 15.8% 44 14.2% 23 15.2% 39 13.7% 21 13.3%
1 9.9% 5 17.7% 7 16.2% 5 21.6% 3 8.6% 5 22.6%
5 37.4% 7 26.1% 16 36.5% 4 19.2% 17 42.4% 7 31.7%
5 36.1% 5 17.6% 15 35.4% 9 38.5% 9 21.6% 8 35.6%
0 0.0% 1 2.5% 0 0.0% 0 0.0% 1 1.7% 0 0.0%
0 0.0% 2 7.4% 2 3.5% 1 6.1% 1 3.6% 1 3.4%
2 16.6% 8 28.6% 4 8.4% 3 14.6% 9 22.1% 1 6.8%
45 38.2% 27 16.0% 80 25.9% 64 42.3% 45 15.6% 43 27.3%
47 39.6% 40 23.5% 96 31.0% 58 38.0% 77 26.7% 49 30.6%
Page 21 of 38
SoonerPoll.com
Council Taylor
More likely Less likely No difference More likely Less likely No difference
Somewhat unfavorable
Very unfavorable
Don't know
Bartlett Very favorable
Somewhat favorable
Somewhat unfavorable
Very unfavorable
Don't know
Council More likely
Less likely
No difference
Taylor More likely
Less likely
No difference
Coburn More likely
Less likely
No difference
Sex Male
Female
Age 18-34
35-49
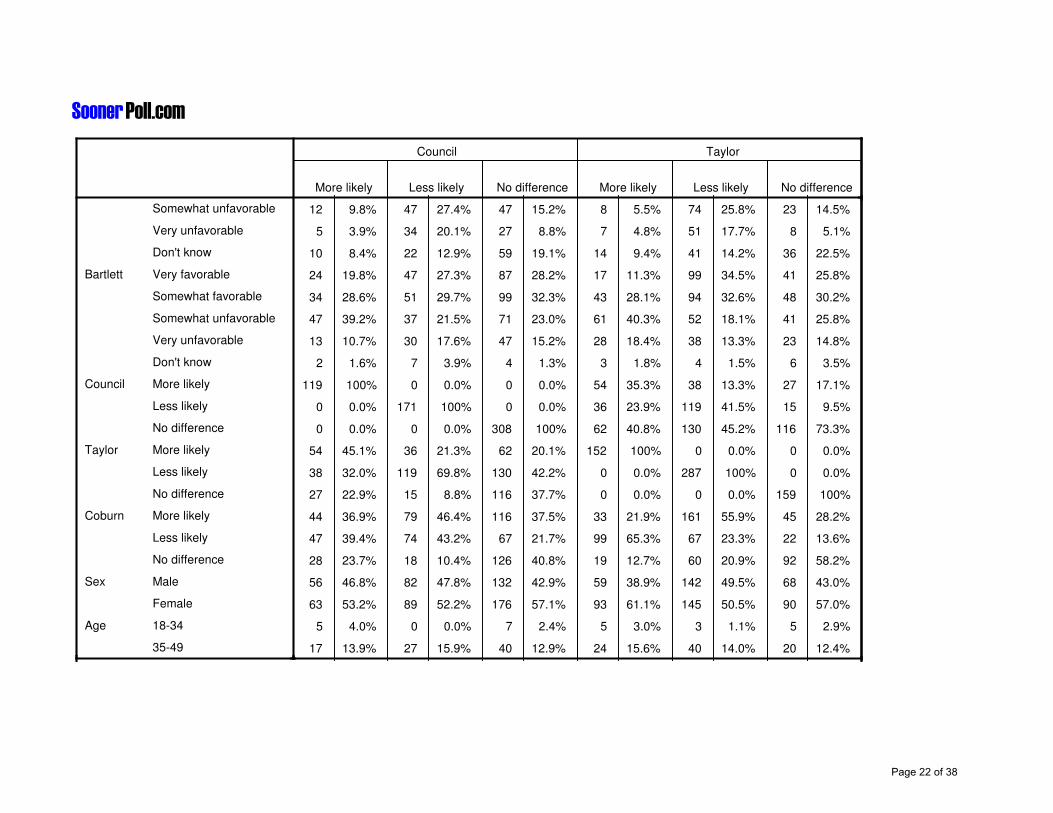
12 9.8% 47 27.4% 47 15.2% 8 5.5% 74 25.8% 23 14.5%
5 3.9% 34 20.1% 27 8.8% 7 4.8% 51 17.7% 8 5.1%
10 8.4% 22 12.9% 59 19.1% 14 9.4% 41 14.2% 36 22.5%
24 19.8% 47 27.3% 87 28.2% 17 11.3% 99 34.5% 41 25.8%
34 28.6% 51 29.7% 99 32.3% 43 28.1% 94 32.6% 48 30.2%
47 39.2% 37 21.5% 71 23.0% 61 40.3% 52 18.1% 41 25.8%
13 10.7% 30 17.6% 47 15.2% 28 18.4% 38 13.3% 23 14.8%
2 1.6% 7 3.9% 4 1.3% 3 1.8% 4 1.5% 6 3.5%
119 100% 0 0.0% 0 0.0% 54 35.3% 38 13.3% 27 17.1%
0 0.0% 171 100% 0 0.0% 36 23.9% 119 41.5% 15 9.5%
0 0.0% 0 0.0% 308 100% 62 40.8% 130 45.2% 116 73.3%
54 45.1% 36 21.3% 62 20.1% 152 100% 0 0.0% 0 0.0%
38 32.0% 119 69.8% 130 42.2% 0 0.0% 287 100% 0 0.0%
27 22.9% 15 8.8% 116 37.7% 0 0.0% 0 0.0% 159 100%
44 36.9% 79 46.4% 116 37.5% 33 21.9% 161 55.9% 45 28.2%
47 39.4% 74 43.2% 67 21.7% 99 65.3% 67 23.3% 22 13.6%
28 23.7% 18 10.4% 126 40.8% 19 12.7% 60 20.9% 92 58.2%
56 46.8% 82 47.8% 132 42.9% 59 38.9% 142 49.5% 68 43.0%
63 53.2% 89 52.2% 176 57.1% 93 61.1% 145 50.5% 90 57.0%
5 4.0% 0 0.0% 7 2.4% 5 3.0% 3 1.1% 5 2.9%
17 13.9% 27 15.9% 40 12.9% 24 15.6% 40 14.0% 20 12.4%
Page 22 of 38
SoonerPoll.com
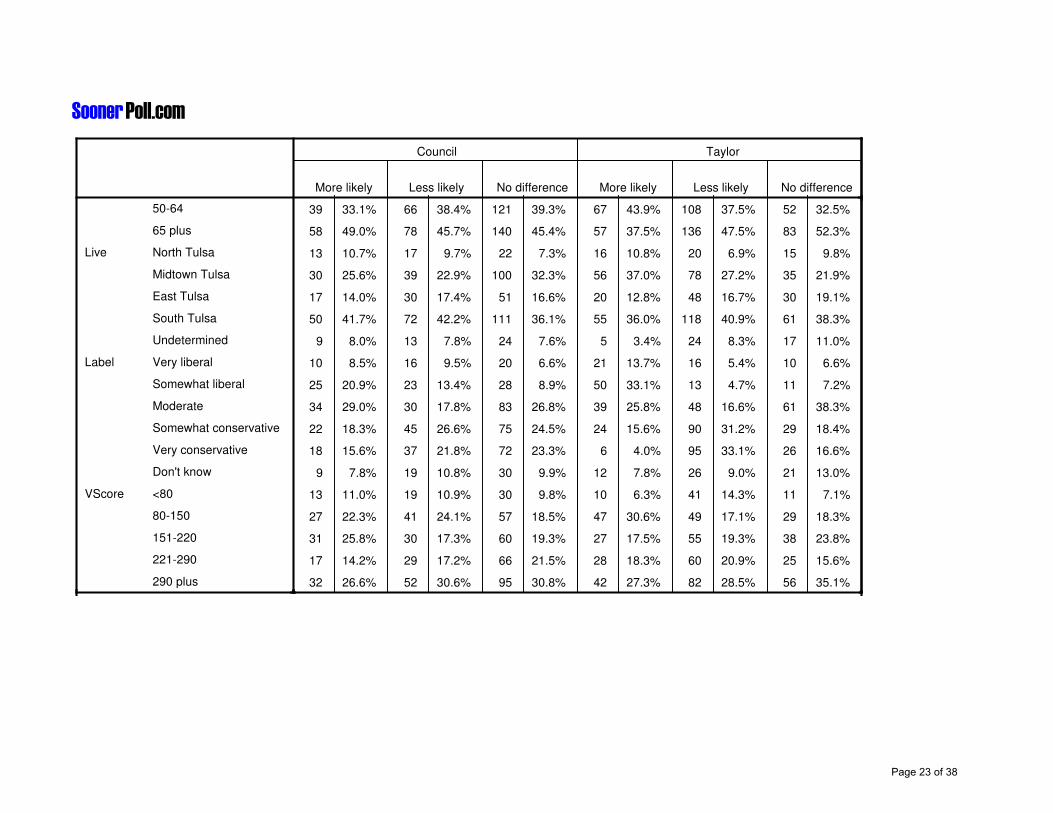
Council Taylor
More likely Less likely No difference More likely Less likely No difference
50-64
65 plus
Live North Tulsa
Midtown Tulsa
East Tulsa
South Tulsa
Undetermined
Label Very liberal
Somewhat liberal
Moderate
Somewhat conservative
Very conservative
Don't know
VScore <80
80-150
151-220
221-290
290 plus
39 33.1% 66 38.4% 121 39.3% 67 43.9% 108 37.5% 52 32.5%
58 49.0% 78 45.7% 140 45.4% 57 37.5% 136 47.5% 83 52.3%
13 10.7% 17 9.7% 22 7.3% 16 10.8% 20 6.9% 15 9.8%
30 25.6% 39 22.9% 100 32.3% 56 37.0% 78 27.2% 35 21.9%
17 14.0% 30 17.4% 51 16.6% 20 12.8% 48 16.7% 30 19.1%
50 41.7% 72 42.2% 111 36.1% 55 36.0% 118 40.9% 61 38.3%
9 8.0% 13 7.8% 24 7.6% 5 3.4% 24 8.3% 17 11.0%
10 8.5% 16 9.5% 20 6.6% 21 13.7% 16 5.4% 10 6.6%
25 20.9% 23 13.4% 28 8.9% 50 33.1% 13 4.7% 11 7.2%
34 29.0% 30 17.8% 83 26.8% 39 25.8% 48 16.6% 61 38.3%
22 18.3% 45 26.6% 75 24.5% 24 15.6% 90 31.2% 29 18.4%
18 15.6% 37 21.8% 72 23.3% 6 4.0% 95 33.1% 26 16.6%
9 7.8% 19 10.8% 30 9.9% 12 7.8% 26 9.0% 21 13.0%
13 11.0% 19 10.9% 30 9.8% 10 6.3% 41 14.3% 11 7.1%
27 22.3% 41 24.1% 57 18.5% 47 30.6% 49 17.1% 29 18.3%
31 25.8% 30 17.3% 60 19.3% 27 17.5% 55 19.3% 38 23.8%
17 14.2% 29 17.2% 66 21.5% 28 18.3% 60 20.9% 25 15.6%
32 26.6% 52 30.6% 95 30.8% 42 27.3% 82 28.5% 56 35.1%
Page 23 of 38
SoonerPoll.com
Coburn Sex
More likely Less likely No difference Male Female
Party Democrat
Republican
Independent
Direction Right direction
Wrong direction
Don't know
Ballot Kirkpatrick
Bartlett
Bynum
Tay
McCay
Undecided
Leaning Kirkpatrick
Bartlett
Bynum
Tay
McCay
Undecided
Bynum Very favorable
Somewhat favorable
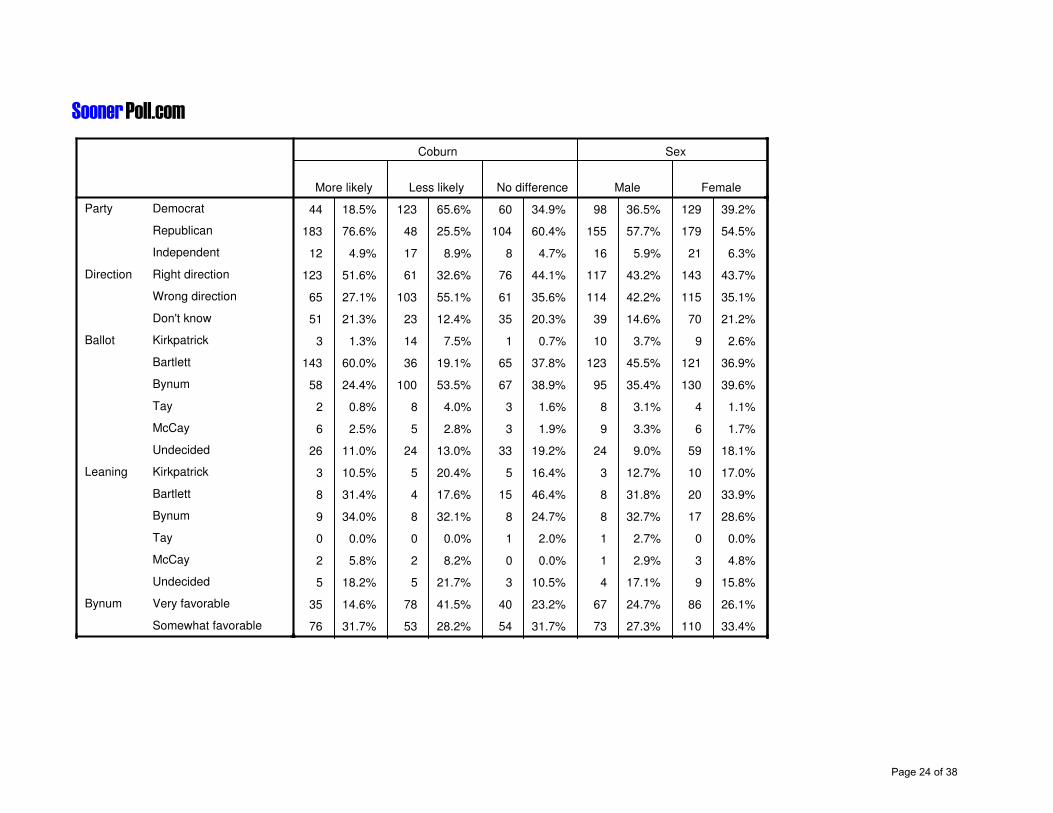
44 18.5% 123 65.6% 60 34.9% 98 36.5% 129 39.2%
183 76.6% 48 25.5% 104 60.4% 155 57.7% 179 54.5%
12 4.9% 17 8.9% 8 4.7% 16 5.9% 21 6.3%
123 51.6% 61 32.6% 76 44.1% 117 43.2% 143 43.7%
65 27.1% 103 55.1% 61 35.6% 114 42.2% 115 35.1%
51 21.3% 23 12.4% 35 20.3% 39 14.6% 70 21.2%
3 1.3% 14 7.5% 1 0.7% 10 3.7% 9 2.6%
143 60.0% 36 19.1% 65 37.8% 123 45.5% 121 36.9%
58 24.4% 100 53.5% 67 38.9% 95 35.4% 130 39.6%
2 0.8% 8 4.0% 3 1.6% 8 3.1% 4 1.1%
6 2.5% 5 2.8% 3 1.9% 9 3.3% 6 1.7%
26 11.0% 24 13.0% 33 19.2% 24 9.0% 59 18.1%
3 10.5% 5 20.4% 5 16.4% 3 12.7% 10 17.0%
8 31.4% 4 17.6% 15 46.4% 8 31.8% 20 33.9%
9 34.0% 8 32.1% 8 24.7% 8 32.7% 17 28.6%
0 0.0% 0 0.0% 1 2.0% 1 2.7% 0 0.0%
2 5.8% 2 8.2% 0 0.0% 1 2.9% 3 4.8%
5 18.2% 5 21.7% 3 10.5% 4 17.1% 9 15.8%
35 14.6% 78 41.5% 40 23.2% 67 24.7% 86 26.1%
76 31.7% 53 28.2% 54 31.7% 73 27.3% 110 33.4%
Page 24 of 38
SoonerPoll.com
Coburn Sex
More likely Less likely No difference Male Female
Somewhat unfavorable
Very unfavorable
Don't know
Bartlett Very favorable
Somewhat favorable
Somewhat unfavorable
Very unfavorable
Don't know
Council More likely
Less likely
No difference
Taylor More likely
Less likely
No difference
Coburn More likely
Less likely
No difference
Sex Male
Female
Age 18-34
35-49
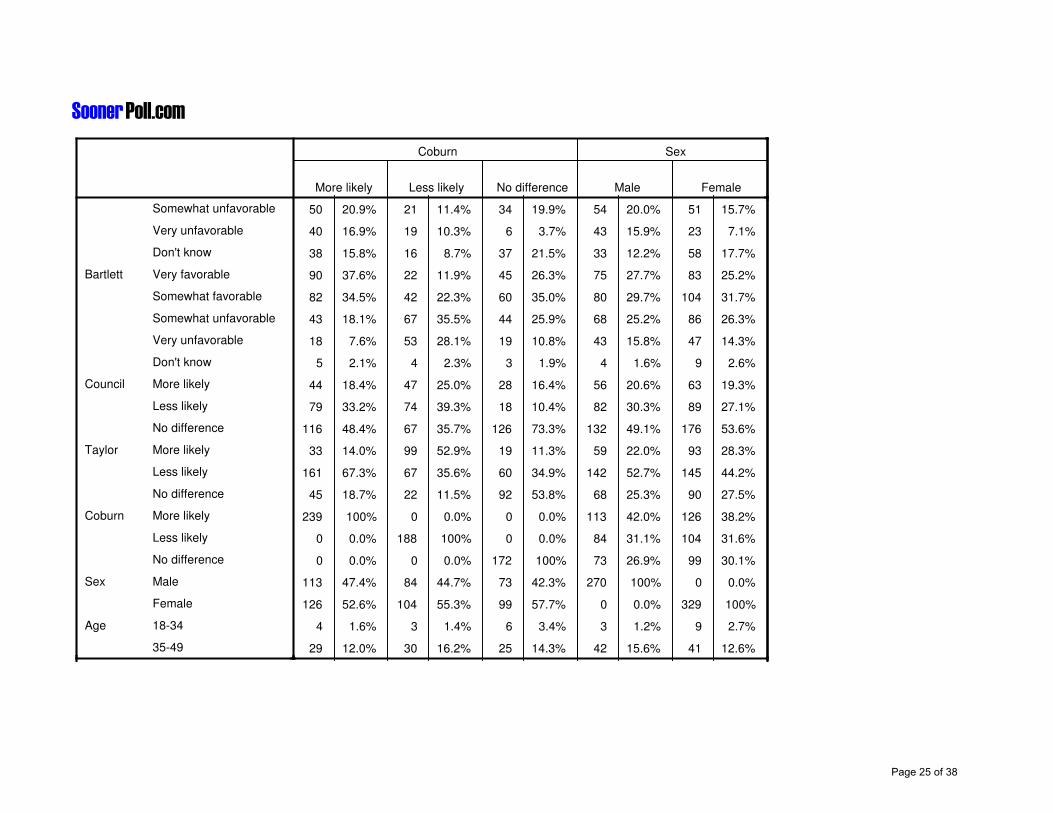
50 20.9% 21 11.4% 34 19.9% 54 20.0% 51 15.7%
40 16.9% 19 10.3% 6 3.7% 43 15.9% 23 7.1%
38 15.8% 16 8.7% 37 21.5% 33 12.2% 58 17.7%
90 37.6% 22 11.9% 45 26.3% 75 27.7% 83 25.2%
82 34.5% 42 22.3% 60 35.0% 80 29.7% 104 31.7%
43 18.1% 67 35.5% 44 25.9% 68 25.2% 86 26.3%
18 7.6% 53 28.1% 19 10.8% 43 15.8% 47 14.3%
5 2.1% 4 2.3% 3 1.9% 4 1.6% 9 2.6%
44 18.4% 47 25.0% 28 16.4% 56 20.6% 63 19.3%
79 33.2% 74 39.3% 18 10.4% 82 30.3% 89 27.1%
116 48.4% 67 35.7% 126 73.3% 132 49.1% 176 53.6%
33 14.0% 99 52.9% 19 11.3% 59 22.0% 93 28.3%
161 67.3% 67 35.6% 60 34.9% 142 52.7% 145 44.2%
45 18.7% 22 11.5% 92 53.8% 68 25.3% 90 27.5%
239 100% 0 0.0% 0 0.0% 113 42.0% 126 38.2%
0 0.0% 188 100% 0 0.0% 84 31.1% 104 31.6%
0 0.0% 0 0.0% 172 100% 73 26.9% 99 30.1%
113 47.4% 84 44.7% 73 42.3% 270 100% 0 0.0%
126 52.6% 104 55.3% 99 57.7% 0 0.0% 329 100%
4 1.6% 3 1.4% 6 3.4% 3 1.2% 9 2.7%
29 12.0% 30 16.2% 25 14.3% 42 15.6% 41 12.6%
Page 25 of 38

SoonerPoll.com
Coburn Sex
More likely Less likely No difference Male Female
50-64
65 plus
Live North Tulsa
Midtown Tulsa
East Tulsa
South Tulsa
Undetermined
Label Very liberal
Somewhat liberal
Moderate
Somewhat conservative
Very conservative
Don't know
VScore <80
80-150
151-220
221-290
290 plus
89 37.1% 76 40.7% 61 35.6% 98 36.2% 129 39.1%
118 49.4% 78 41.7% 80 46.7% 127 46.9% 150 45.6%
13 5.3% 23 12.0% 17 9.7% 22 8.0% 30 9.2%
55 23.2% 60 31.7% 54 31.6% 70 26.0% 99 30.2%
48 20.1% 22 11.8% 28 16.1% 39 14.3% 59 18.0%
101 42.4% 74 39.5% 58 33.6% 121 44.7% 112 34.2%
22 9.1% 9 4.9% 15 9.0% 19 7.0% 28 8.4%
3 1.3% 35 18.5% 9 5.2% 21 7.9% 26 7.8%
12 5.1% 53 28.4% 10 5.7% 23 8.4% 53 16.0%
38 15.8% 50 26.8% 60 34.8% 77 28.6% 71 21.5%
82 34.5% 24 12.9% 36 21.0% 66 24.4% 77 23.4%
80 33.5% 15 8.0% 33 19.0% 61 22.8% 66 20.2%
23 9.8% 10 5.4% 25 14.4% 22 8.0% 36 11.1%
25 10.7% 20 10.5% 17 9.7% 23 8.6% 39 11.8%
47 19.8% 47 25.1% 30 17.6% 58 21.6% 66 20.2%
45 18.9% 41 21.6% 34 19.9% 56 20.9% 63 19.3%
53 22.2% 28 14.7% 32 18.7% 43 16.0% 70 21.2%
68 28.4% 53 28.0% 58 34.0% 89 32.9% 90 27.5%
Page 26 of 38
SoonerPoll.com
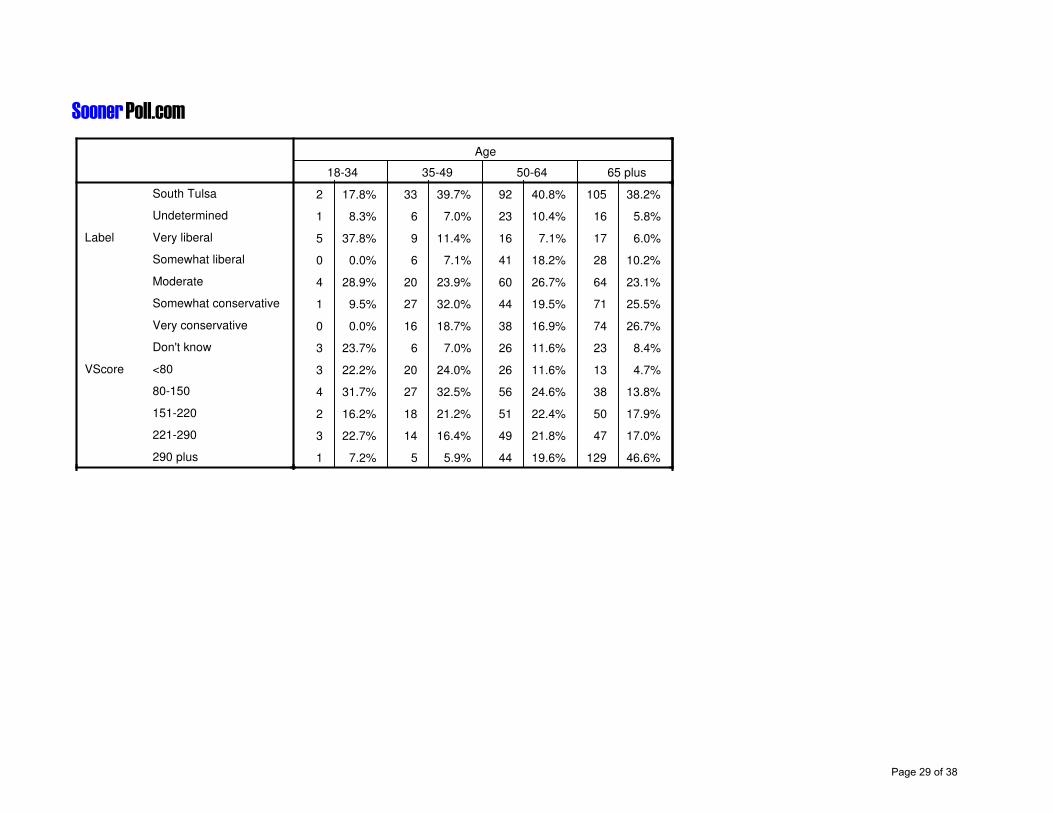
Age
18-34 35-49 50-64 65 plus
Party Democrat
Republican
Independent
Direction Right direction
Wrong direction
Don't know
Ballot Kirkpatrick
Bartlett
Bynum
Tay
McCay
Undecided
Leaning Kirkpatrick
Bartlett
Bynum
Tay
McCay
Undecided
Bynum Very favorable
Somewhat favorable
Somewhat unfavorable
Very unfavorable
Don't know
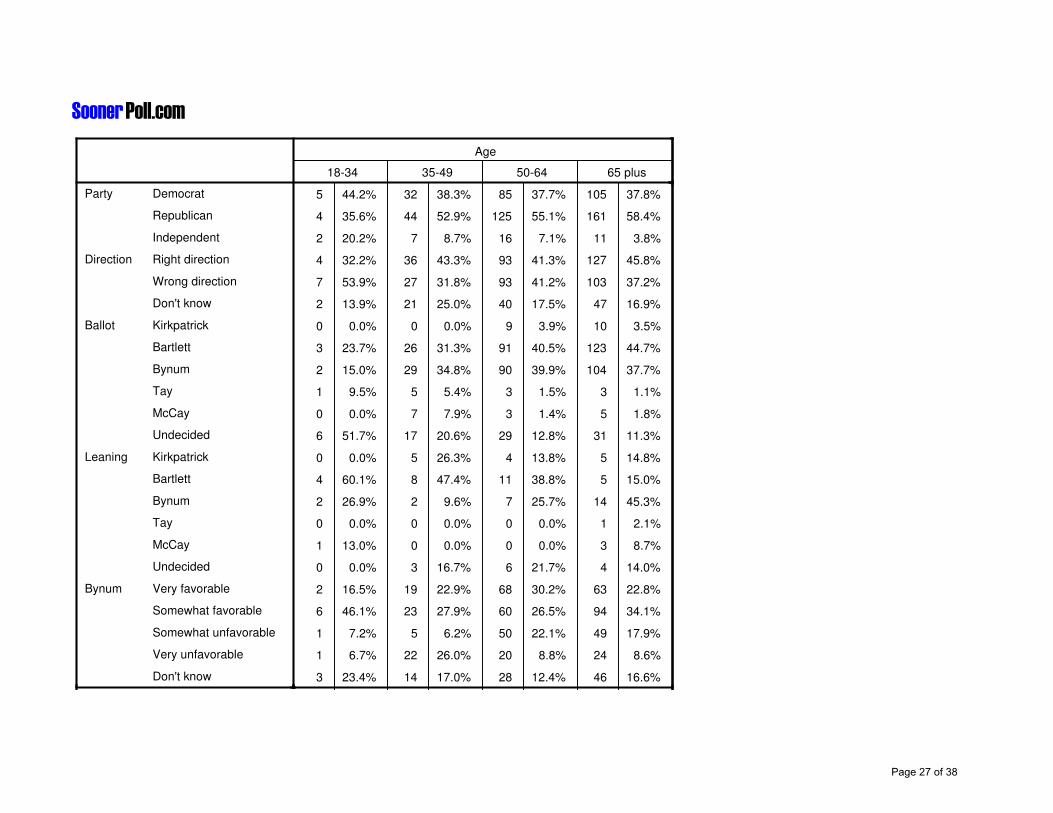
5 44.2% 32 38.3% 85 37.7% 105 37.8%
4 35.6% 44 52.9% 125 55.1% 161 58.4%
2 20.2% 7 8.7% 16 7.1% 11 3.8%
4 32.2% 36 43.3% 93 41.3% 127 45.8%
7 53.9% 27 31.8% 93 41.2% 103 37.2%
2 13.9% 21 25.0% 40 17.5% 47 16.9%
0 0.0% 0 0.0% 9 3.9% 10 3.5%
3 23.7% 26 31.3% 91 40.5% 123 44.7%
2 15.0% 29 34.8% 90 39.9% 104 37.7%
1 9.5% 5 5.4% 3 1.5% 3 1.1%
0 0.0% 7 7.9% 3 1.4% 5 1.8%
6 51.7% 17 20.6% 29 12.8% 31 11.3%
0 0.0% 5 26.3% 4 13.8% 5 14.8%
4 60.1% 8 47.4% 11 38.8% 5 15.0%
2 26.9% 2 9.6% 7 25.7% 14 45.3%
0 0.0% 0 0.0% 0 0.0% 1 2.1%
1 13.0% 0 0.0% 0 0.0% 3 8.7%
0 0.0% 3 16.7% 6 21.7% 4 14.0%
2 16.5% 19 22.9% 68 30.2% 63 22.8%
6 46.1% 23 27.9% 60 26.5% 94 34.1%
1 7.2% 5 6.2% 50 22.1% 49 17.9%
1 6.7% 22 26.0% 20 8.8% 24 8.6%
3 23.4% 14 17.0% 28 12.4% 46 16.6%
Page 27 of 38
SoonerPoll.com
Age
18-34 35-49 50-64 65 plus
Bartlett Very favorable
Somewhat favorable
Somewhat unfavorable
Very unfavorable
Don't know
Council More likely
Less likely
No difference
Taylor More likely
Less likely
No difference
Coburn More likely
Less likely
No difference
Sex Male
Female
Age 18-34
35-49
50-64
65 plus
Live North Tulsa
Midtown Tulsa
East Tulsa
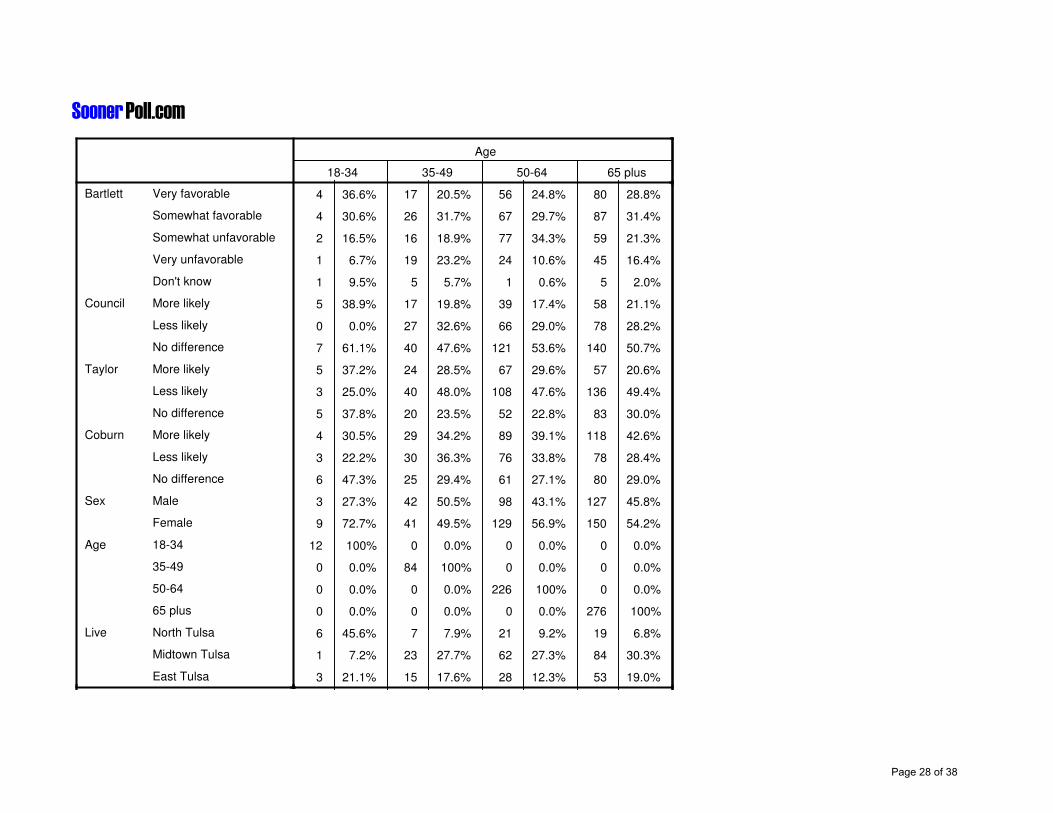
4 36.6% 17 20.5% 56 24.8% 80 28.8%
4 30.6% 26 31.7% 67 29.7% 87 31.4%
2 16.5% 16 18.9% 77 34.3% 59 21.3%
1 6.7% 19 23.2% 24 10.6% 45 16.4%
1 9.5% 5 5.7% 1 0.6% 5 2.0%
5 38.9% 17 19.8% 39 17.4% 58 21.1%
0 0.0% 27 32.6% 66 29.0% 78 28.2%
7 61.1% 40 47.6% 121 53.6% 140 50.7%
5 37.2% 24 28.5% 67 29.6% 57 20.6%
3 25.0% 40 48.0% 108 47.6% 136 49.4%
5 37.8% 20 23.5% 52 22.8% 83 30.0%
4 30.5% 29 34.2% 89 39.1% 118 42.6%
3 22.2% 30 36.3% 76 33.8% 78 28.4%
6 47.3% 25 29.4% 61 27.1% 80 29.0%
3 27.3% 42 50.5% 98 43.1% 127 45.8%
9 72.7% 41 49.5% 129 56.9% 150 54.2%
12 100% 0 0.0% 0 0.0% 0 0.0%
0 0.0% 84 100% 0 0.0% 0 0.0%
0 0.0% 0 0.0% 226 100% 0 0.0%
0 0.0% 0 0.0% 0 0.0% 276 100%
6 45.6% 7 7.9% 21 9.2% 19 6.8%
1 7.2% 23 27.7% 62 27.3% 84 30.3%
3 21.1% 15 17.6% 28 12.3% 53 19.0%
Page 28 of 38
SoonerPoll.com
Age
18-34 35-49 50-64 65 plus
South Tulsa
Undetermined
Label Very liberal
Somewhat liberal
Moderate
Somewhat conservative
Very conservative
Don't know
VScore <80
80-150
151-220
221-290
290 plus
2 17.8% 33 39.7% 92 40.8% 105 38.2%
1 8.3% 6 7.0% 23 10.4% 16 5.8%
5 37.8% 9 11.4% 16 7.1% 17 6.0%
0 0.0% 6 7.1% 41 18.2% 28 10.2%
4 28.9% 20 23.9% 60 26.7% 64 23.1%
1 9.5% 27 32.0% 44 19.5% 71 25.5%
0 0.0% 16 18.7% 38 16.9% 74 26.7%
3 23.7% 6 7.0% 26 11.6% 23 8.4%
3 22.2% 20 24.0% 26 11.6% 13 4.7%
4 31.7% 27 32.5% 56 24.6% 38 13.8%
2 16.2% 18 21.2% 51 22.4% 50 17.9%
3 22.7% 14 16.4% 49 21.8% 47 17.0%
1 7.2% 5 5.9% 44 19.6% 129 46.6%
Page 29 of 38
SoonerPoll.com
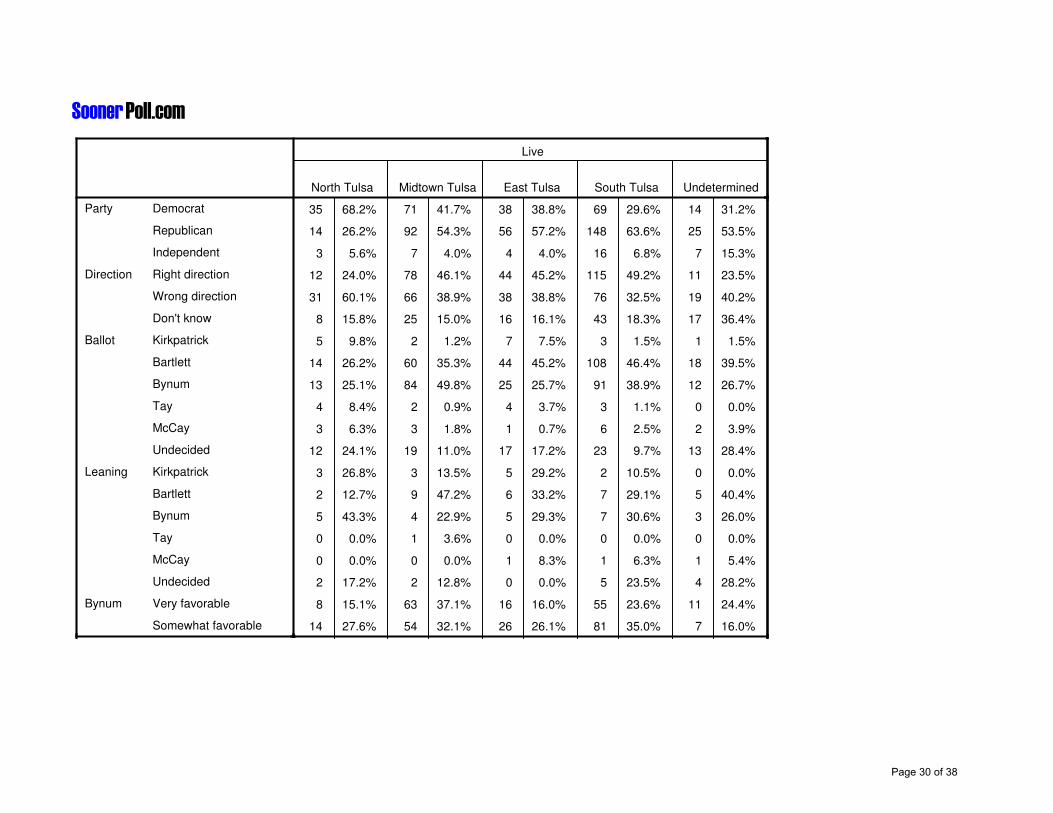
Live
North Tulsa Midtown Tulsa East Tulsa South Tulsa Undetermined
Party Democrat
Republican
Independent
Direction Right direction
Wrong direction
Don't know
Ballot Kirkpatrick
Bartlett
Bynum
Tay
McCay
Undecided
Leaning Kirkpatrick
Bartlett
Bynum
Tay
McCay
Undecided
Bynum Very favorable
Somewhat favorable
35 68.2% 71 41.7% 38 38.8% 69 29.6% 14 31.2%
14 26.2% 92 54.3% 56 57.2% 148 63.6% 25 53.5%
3 5.6% 7 4.0% 4 4.0% 16 6.8% 7 15.3%
12 24.0% 78 46.1% 44 45.2% 115 49.2% 11 23.5%
31 60.1% 66 38.9% 38 38.8% 76 32.5% 19 40.2%
8 15.8% 25 15.0% 16 16.1% 43 18.3% 17 36.4%
5 9.8% 2 1.2% 7 7.5% 3 1.5% 1 1.5%
14 26.2% 60 35.3% 44 45.2% 108 46.4% 18 39.5%
13 25.1% 84 49.8% 25 25.7% 91 38.9% 12 26.7%
4 8.4% 2 0.9% 4 3.7% 3 1.1% 0 0.0%
3 6.3% 3 1.8% 1 0.7% 6 2.5% 2 3.9%
12 24.1% 19 11.0% 17 17.2% 23 9.7% 13 28.4%
3 26.8% 3 13.5% 5 29.2% 2 10.5% 0 0.0%
2 12.7% 9 47.2% 6 33.2% 7 29.1% 5 40.4%
5 43.3% 4 22.9% 5 29.3% 7 30.6% 3 26.0%
0 0.0% 1 3.6% 0 0.0% 0 0.0% 0 0.0%
0 0.0% 0 0.0% 1 8.3% 1 6.3% 1 5.4%
2 17.2% 2 12.8% 0 0.0% 5 23.5% 4 28.2%
8 15.1% 63 37.1% 16 16.0% 55 23.6% 11 24.4%
14 27.6% 54 32.1% 26 26.1% 81 35.0% 7 16.0%
Page 30 of 38
SoonerPoll.com
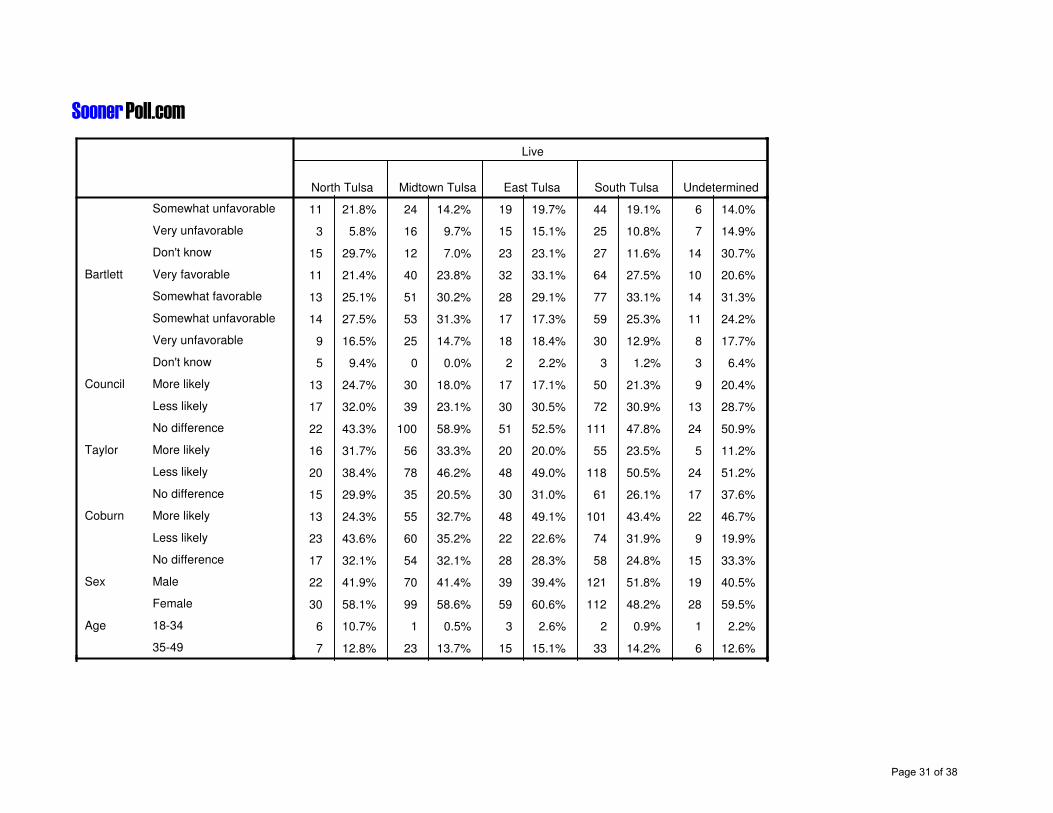
Live
North Tulsa Midtown Tulsa East Tulsa South Tulsa Undetermined
Somewhat unfavorable
Very unfavorable
Don't know
Bartlett Very favorable
Somewhat favorable
Somewhat unfavorable
Very unfavorable
Don't know
Council More likely
Less likely
No difference
Taylor More likely
Less likely
No difference
Coburn More likely
Less likely
No difference
Sex Male
Female
Age 18-34
35-49
11 21.8% 24 14.2% 19 19.7% 44 19.1% 6 14.0%
3 5.8% 16 9.7% 15 15.1% 25 10.8% 7 14.9%
15 29.7% 12 7.0% 23 23.1% 27 11.6% 14 30.7%
11 21.4% 40 23.8% 32 33.1% 64 27.5% 10 20.6%
13 25.1% 51 30.2% 28 29.1% 77 33.1% 14 31.3%
14 27.5% 53 31.3% 17 17.3% 59 25.3% 11 24.2%
9 16.5% 25 14.7% 18 18.4% 30 12.9% 8 17.7%
5 9.4% 0 0.0% 2 2.2% 3 1.2% 3 6.4%
13 24.7% 30 18.0% 17 17.1% 50 21.3% 9 20.4%
17 32.0% 39 23.1% 30 30.5% 72 30.9% 13 28.7%
22 43.3% 100 58.9% 51 52.5% 111 47.8% 24 50.9%
16 31.7% 56 33.3% 20 20.0% 55 23.5% 5 11.2%
20 38.4% 78 46.2% 48 49.0% 118 50.5% 24 51.2%
15 29.9% 35 20.5% 30 31.0% 61 26.1% 17 37.6%
13 24.3% 55 32.7% 48 49.1% 101 43.4% 22 46.7%
23 43.6% 60 35.2% 22 22.6% 74 31.9% 9 19.9%
17 32.1% 54 32.1% 28 28.3% 58 24.8% 15 33.3%
22 41.9% 70 41.4% 39 39.4% 121 51.8% 19 40.5%
30 58.1% 99 58.6% 59 60.6% 112 48.2% 28 59.5%
6 10.7% 1 0.5% 3 2.6% 2 0.9% 1 2.2%
7 12.8% 23 13.7% 15 15.1% 33 14.2% 6 12.6%
Page 31 of 38
SoonerPoll.com
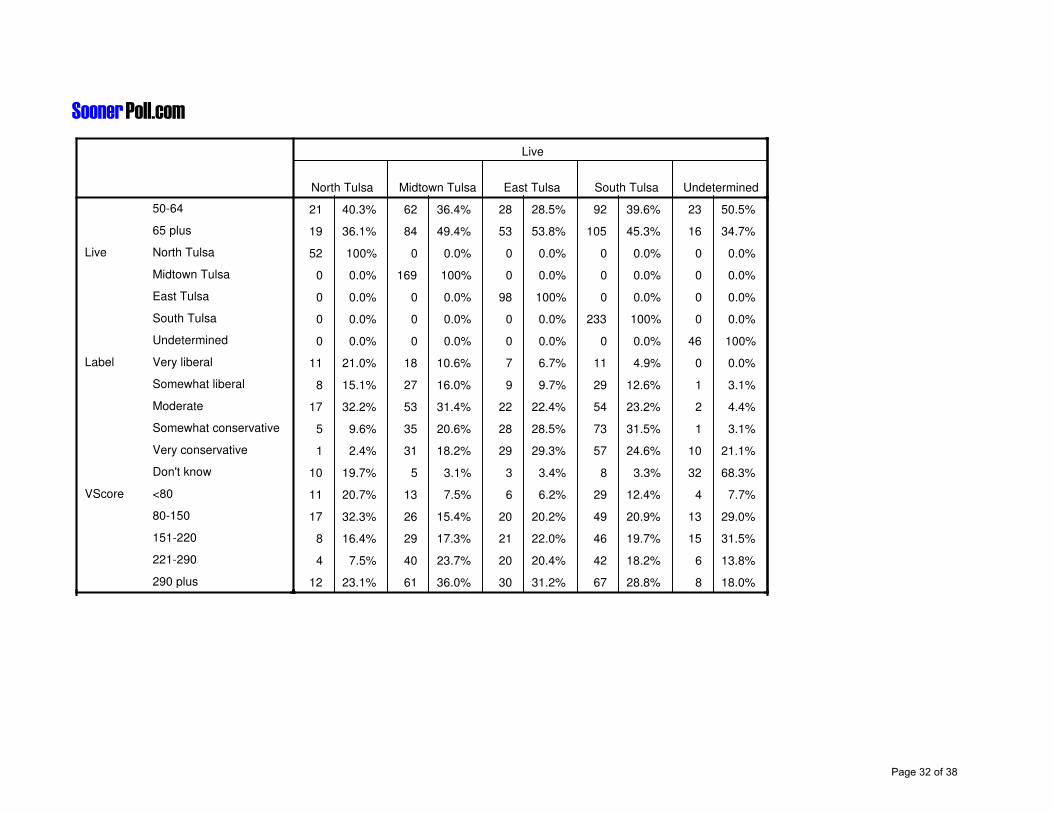
Live
North Tulsa Midtown Tulsa East Tulsa South Tulsa Undetermined
50-64
65 plus
Live North Tulsa
Midtown Tulsa
East Tulsa
South Tulsa
Undetermined
Label Very liberal
Somewhat liberal
Moderate
Somewhat conservative
Very conservative
Don't know
VScore <80
80-150
151-220
221-290
290 plus
21 40.3% 62 36.4% 28 28.5% 92 39.6% 23 50.5%
19 36.1% 84 49.4% 53 53.8% 105 45.3% 16 34.7%
52 100% 0 0.0% 0 0.0% 0 0.0% 0 0.0%
0 0.0% 169 100% 0 0.0% 0 0.0% 0 0.0%
0 0.0% 0 0.0% 98 100% 0 0.0% 0 0.0%
0 0.0% 0 0.0% 0 0.0% 233 100% 0 0.0%
0 0.0% 0 0.0% 0 0.0% 0 0.0% 46 100%
11 21.0% 18 10.6% 7 6.7% 11 4.9% 0 0.0%
8 15.1% 27 16.0% 9 9.7% 29 12.6% 1 3.1%
17 32.2% 53 31.4% 22 22.4% 54 23.2% 2 4.4%
5 9.6% 35 20.6% 28 28.5% 73 31.5% 1 3.1%
1 2.4% 31 18.2% 29 29.3% 57 24.6% 10 21.1%
10 19.7% 5 3.1% 3 3.4% 8 3.3% 32 68.3%
11 20.7% 13 7.5% 6 6.2% 29 12.4% 4 7.7%
17 32.3% 26 15.4% 20 20.2% 49 20.9% 13 29.0%
8 16.4% 29 17.3% 21 22.0% 46 19.7% 15 31.5%
4 7.5% 40 23.7% 20 20.4% 42 18.2% 6 13.8%
12 23.1% 61 36.0% 30 31.2% 67 28.8% 8 18.0%
Page 32 of 38
SoonerPoll.com
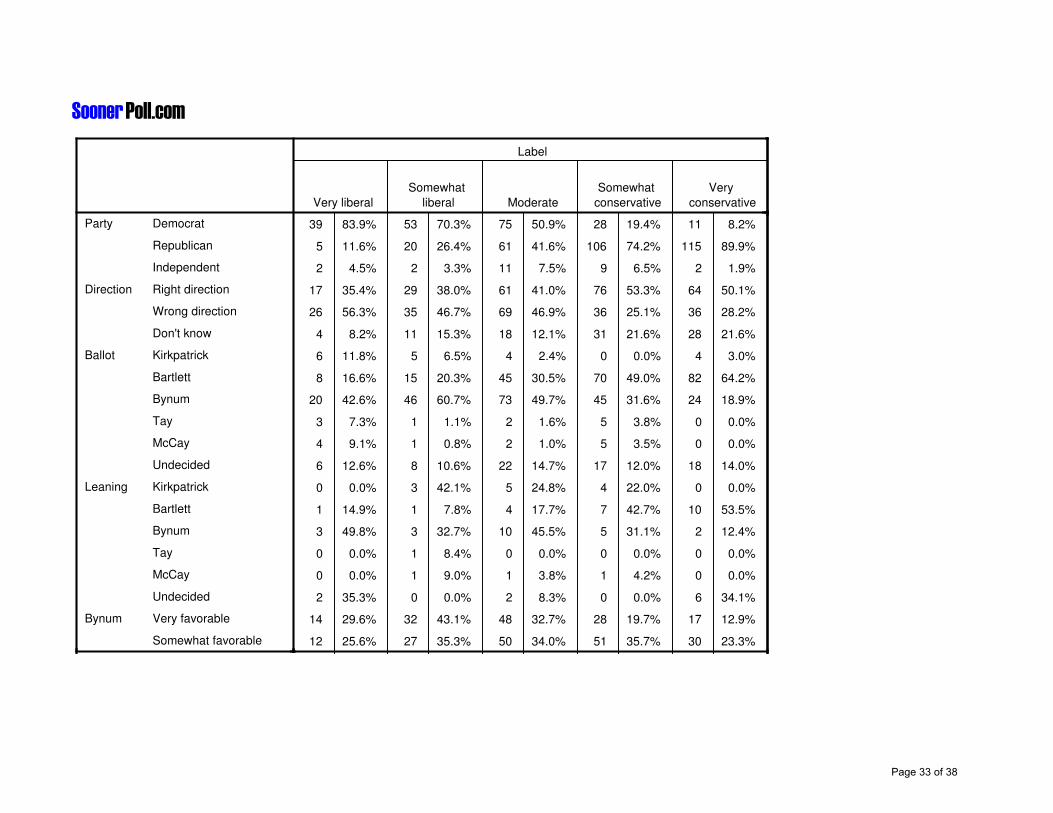
Label
Very liberal
Somewhat
liberal Moderate
Somewhat
conservative
Very
conservative
Party Democrat
Republican
Independent
Direction Right direction
Wrong direction
Don't know
Ballot Kirkpatrick
Bartlett
Bynum
Tay
McCay
Undecided
Leaning Kirkpatrick
Bartlett
Bynum
Tay
McCay
Undecided
Bynum Very favorable
Somewhat favorable
39 83.9% 53 70.3% 75 50.9% 28 19.4% 11 8.2%
5 11.6% 20 26.4% 61 41.6% 106 74.2% 115 89.9%
2 4.5% 2 3.3% 11 7.5% 9 6.5% 2 1.9%
17 35.4% 29 38.0% 61 41.0% 76 53.3% 64 50.1%
26 56.3% 35 46.7% 69 46.9% 36 25.1% 36 28.2%
4 8.2% 11 15.3% 18 12.1% 31 21.6% 28 21.6%
6 11.8% 5 6.5% 4 2.4% 0 0.0% 4 3.0%
8 16.6% 15 20.3% 45 30.5% 70 49.0% 82 64.2%
20 42.6% 46 60.7% 73 49.7% 45 31.6% 24 18.9%
3 7.3% 1 1.1% 2 1.6% 5 3.8% 0 0.0%
4 9.1% 1 0.8% 2 1.0% 5 3.5% 0 0.0%
6 12.6% 8 10.6% 22 14.7% 17 12.0% 18 14.0%
0 0.0% 3 42.1% 5 24.8% 4 22.0% 0 0.0%
1 14.9% 1 7.8% 4 17.7% 7 42.7% 10 53.5%
3 49.8% 3 32.7% 10 45.5% 5 31.1% 2 12.4%
0 0.0% 1 8.4% 0 0.0% 0 0.0% 0 0.0%
0 0.0% 1 9.0% 1 3.8% 1 4.2% 0 0.0%
2 35.3% 0 0.0% 2 8.3% 0 0.0% 6 34.1%
14 29.6% 32 43.1% 48 32.7% 28 19.7% 17 12.9%
12 25.6% 27 35.3% 50 34.0% 51 35.7% 30 23.3%
Page 33 of 38
SoonerPoll.com
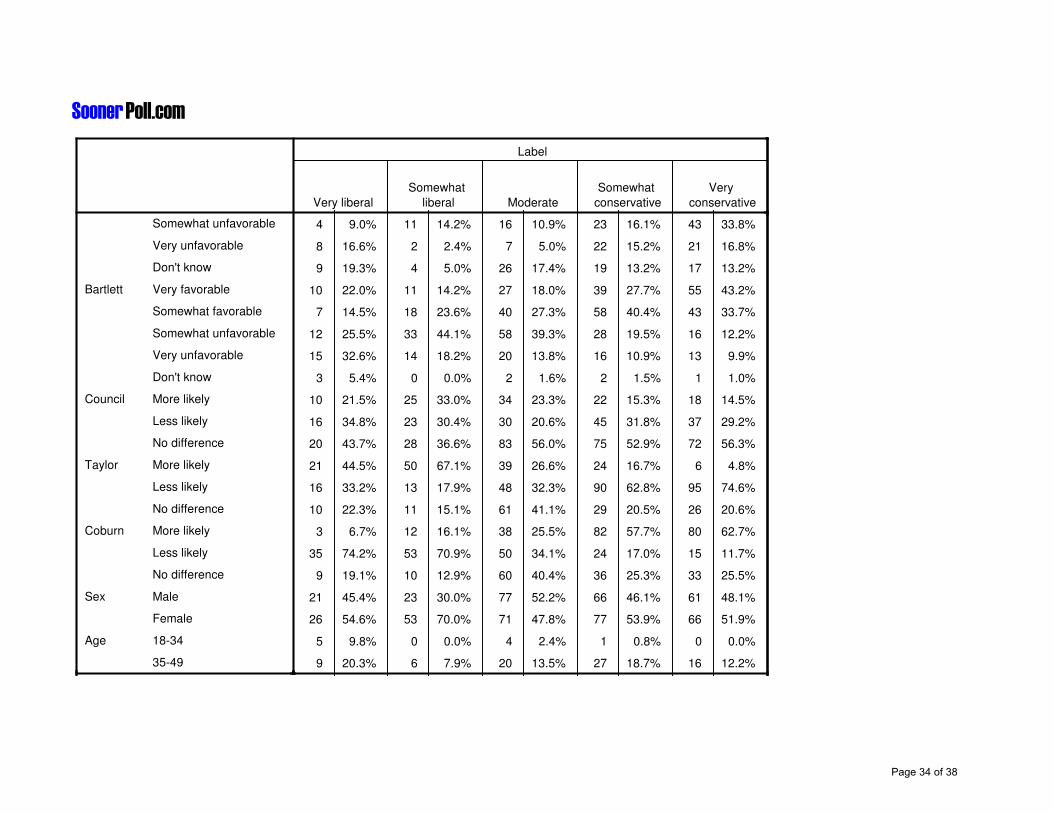
Label
Very liberal
Somewhat
liberal Moderate
Somewhat
conservative
Very
conservative
Somewhat unfavorable
Very unfavorable
Don't know
Bartlett Very favorable
Somewhat favorable
Somewhat unfavorable
Very unfavorable
Don't know
Council More likely
Less likely
No difference
Taylor More likely
Less likely
No difference
Coburn More likely
Less likely
No difference
Sex Male
Female
Age 18-34
35-49
4 9.0% 11 14.2% 16 10.9% 23 16.1% 43 33.8%
8 16.6% 2 2.4% 7 5.0% 22 15.2% 21 16.8%
9 19.3% 4 5.0% 26 17.4% 19 13.2% 17 13.2%
10 22.0% 11 14.2% 27 18.0% 39 27.7% 55 43.2%
7 14.5% 18 23.6% 40 27.3% 58 40.4% 43 33.7%
12 25.5% 33 44.1% 58 39.3% 28 19.5% 16 12.2%
15 32.6% 14 18.2% 20 13.8% 16 10.9% 13 9.9%
3 5.4% 0 0.0% 2 1.6% 2 1.5% 1 1.0%
10 21.5% 25 33.0% 34 23.3% 22 15.3% 18 14.5%
16 34.8% 23 30.4% 30 20.6% 45 31.8% 37 29.2%
20 43.7% 28 36.6% 83 56.0% 75 52.9% 72 56.3%
21 44.5% 50 67.1% 39 26.6% 24 16.7% 6 4.8%
16 33.2% 13 17.9% 48 32.3% 90 62.8% 95 74.6%
10 22.3% 11 15.1% 61 41.1% 29 20.5% 26 20.6%
3 6.7% 12 16.1% 38 25.5% 82 57.7% 80 62.7%
35 74.2% 53 70.9% 50 34.1% 24 17.0% 15 11.7%
9 19.1% 10 12.9% 60 40.4% 36 25.3% 33 25.5%
21 45.4% 23 30.0% 77 52.2% 66 46.1% 61 48.1%
26 54.6% 53 70.0% 71 47.8% 77 53.9% 66 51.9%
5 9.8% 0 0.0% 4 2.4% 1 0.8% 0 0.0%
9 20.3% 6 7.9% 20 13.5% 27 18.7% 16 12.2%
Page 34 of 38
SoonerPoll.com
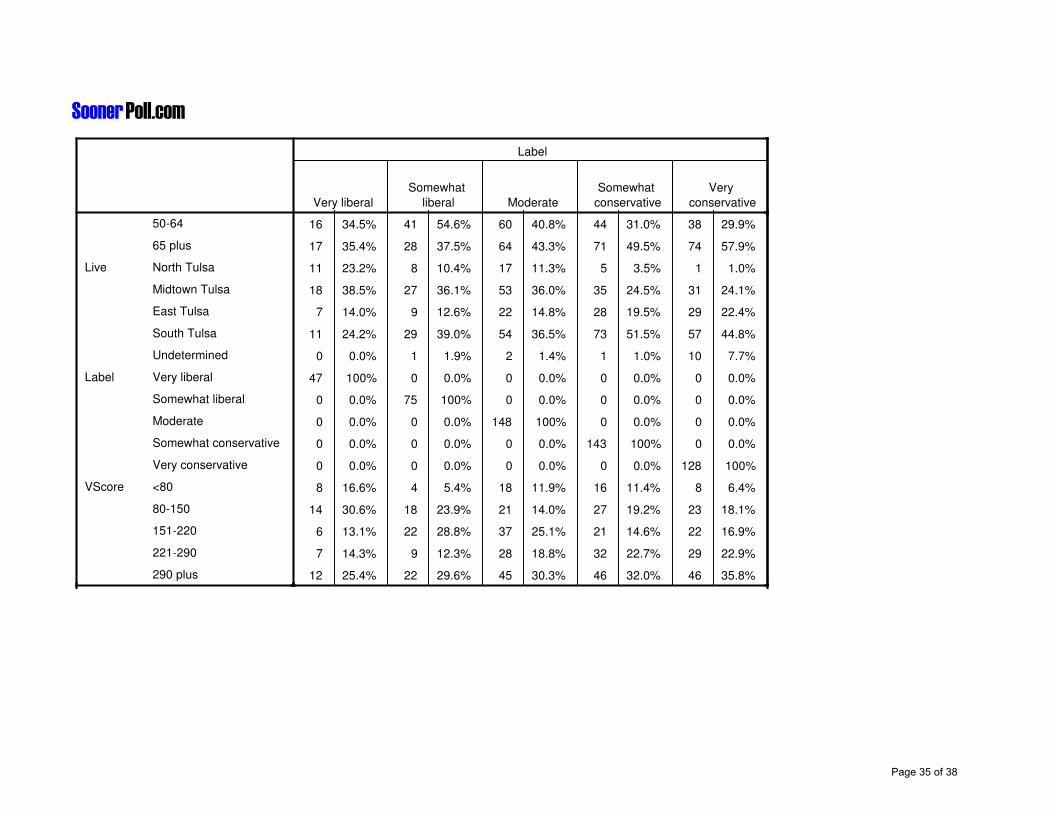
Label
Very liberal
Somewhat
liberal Moderate
Somewhat
conservative
Very
conservative
50-64
65 plus
Live North Tulsa
Midtown Tulsa
East Tulsa
South Tulsa
Undetermined
Label Very liberal
Somewhat liberal
Moderate
Somewhat conservative
Very conservative
VScore <80
80-150
151-220
221-290
290 plus
16 34.5% 41 54.6% 60 40.8% 44 31.0% 38 29.9%
17 35.4% 28 37.5% 64 43.3% 71 49.5% 74 57.9%
11 23.2% 8 10.4% 17 11.3% 5 3.5% 1 1.0%
18 38.5% 27 36.1% 53 36.0% 35 24.5% 31 24.1%
7 14.0% 9 12.6% 22 14.8% 28 19.5% 29 22.4%
11 24.2% 29 39.0% 54 36.5% 73 51.5% 57 44.8%
0 0.0% 1 1.9% 2 1.4% 1 1.0% 10 7.7%
47 100% 0 0.0% 0 0.0% 0 0.0% 0 0.0%
0 0.0% 75 100% 0 0.0% 0 0.0% 0 0.0%
0 0.0% 0 0.0% 148 100% 0 0.0% 0 0.0%
0 0.0% 0 0.0% 0 0.0% 143 100% 0 0.0%
0 0.0% 0 0.0% 0 0.0% 0 0.0% 128 100%
8 16.6% 4 5.4% 18 11.9% 16 11.4% 8 6.4%
14 30.6% 18 23.9% 21 14.0% 27 19.2% 23 18.1%
6 13.1% 22 28.8% 37 25.1% 21 14.6% 22 16.9%
7 14.3% 9 12.3% 28 18.8% 32 22.7% 29 22.9%
12 25.4% 22 29.6% 45 30.3% 46 32.0% 46 35.8%
Page 35 of 38
SoonerPoll.com
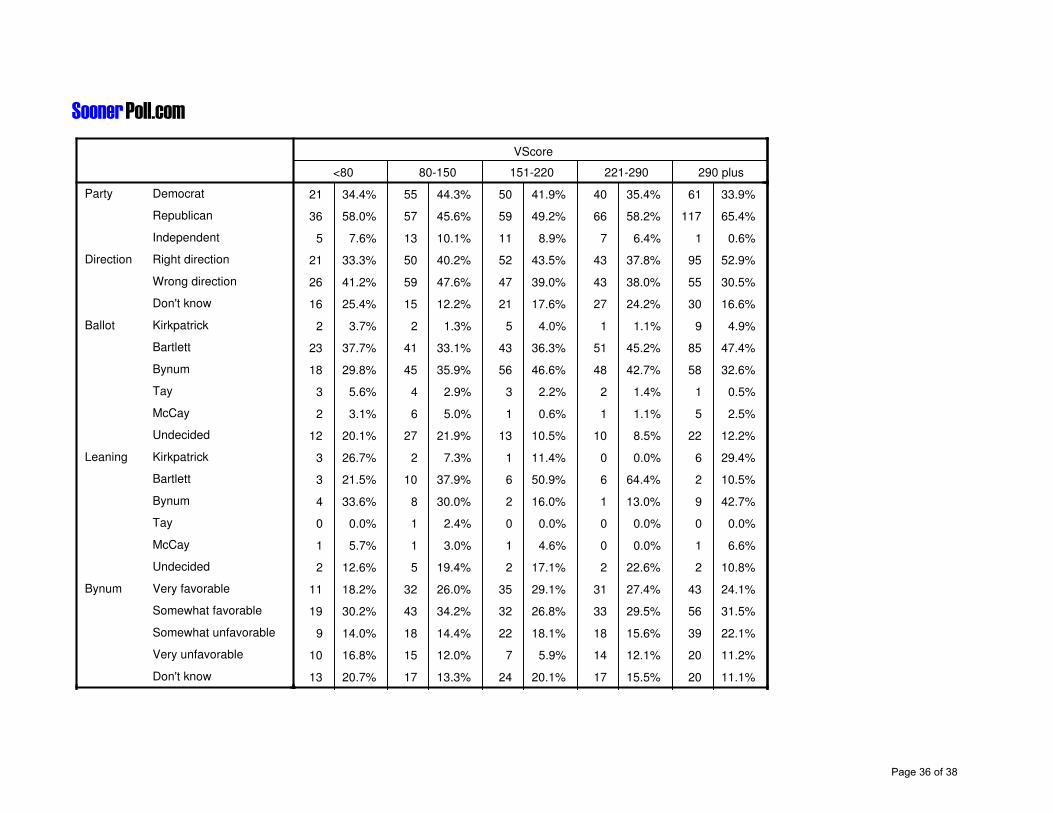
VScore
<80 80-150 151-220 221-290 290 plus
Party Democrat
Republican
Independent
Direction Right direction
Wrong direction
Don't know
Ballot Kirkpatrick
Bartlett
Bynum
Tay
McCay
Undecided
Leaning Kirkpatrick
Bartlett
Bynum
Tay
McCay
Undecided
Bynum Very favorable
Somewhat favorable
Somewhat unfavorable
Very unfavorable
Don't know
21 34.4% 55 44.3% 50 41.9% 40 35.4% 61 33.9%
36 58.0% 57 45.6% 59 49.2% 66 58.2% 117 65.4%
5 7.6% 13 10.1% 11 8.9% 7 6.4% 1 0.6%
21 33.3% 50 40.2% 52 43.5% 43 37.8% 95 52.9%
26 41.2% 59 47.6% 47 39.0% 43 38.0% 55 30.5%
16 25.4% 15 12.2% 21 17.6% 27 24.2% 30 16.6%
2 3.7% 2 1.3% 5 4.0% 1 1.1% 9 4.9%
23 37.7% 41 33.1% 43 36.3% 51 45.2% 85 47.4%
18 29.8% 45 35.9% 56 46.6% 48 42.7% 58 32.6%
3 5.6% 4 2.9% 3 2.2% 2 1.4% 1 0.5%
2 3.1% 6 5.0% 1 0.6% 1 1.1% 5 2.5%
12 20.1% 27 21.9% 13 10.5% 10 8.5% 22 12.2%
3 26.7% 2 7.3% 1 11.4% 0 0.0% 6 29.4%
3 21.5% 10 37.9% 6 50.9% 6 64.4% 2 10.5%
4 33.6% 8 30.0% 2 16.0% 1 13.0% 9 42.7%
0 0.0% 1 2.4% 0 0.0% 0 0.0% 0 0.0%
1 5.7% 1 3.0% 1 4.6% 0 0.0% 1 6.6%
2 12.6% 5 19.4% 2 17.1% 2 22.6% 2 10.8%
11 18.2% 32 26.0% 35 29.1% 31 27.4% 43 24.1%
19 30.2% 43 34.2% 32 26.8% 33 29.5% 56 31.5%
9 14.0% 18 14.4% 22 18.1% 18 15.6% 39 22.1%
10 16.8% 15 12.0% 7 5.9% 14 12.1% 20 11.2%
13 20.7% 17 13.3% 24 20.1% 17 15.5% 20 11.1%
Page 36 of 38
SoonerPoll.com
VScore
<80 80-150 151-220 221-290 290 plus
Bartlett Very favorable
Somewhat favorable
Somewhat unfavorable
Very unfavorable
Don't know
Council More likely
Less likely
No difference
Taylor More likely
Less likely
No difference
Coburn More likely
Less likely
No difference
Sex Male
Female
Age 18-34
35-49
50-64
65 plus
Live North Tulsa
Midtown Tulsa
East Tulsa
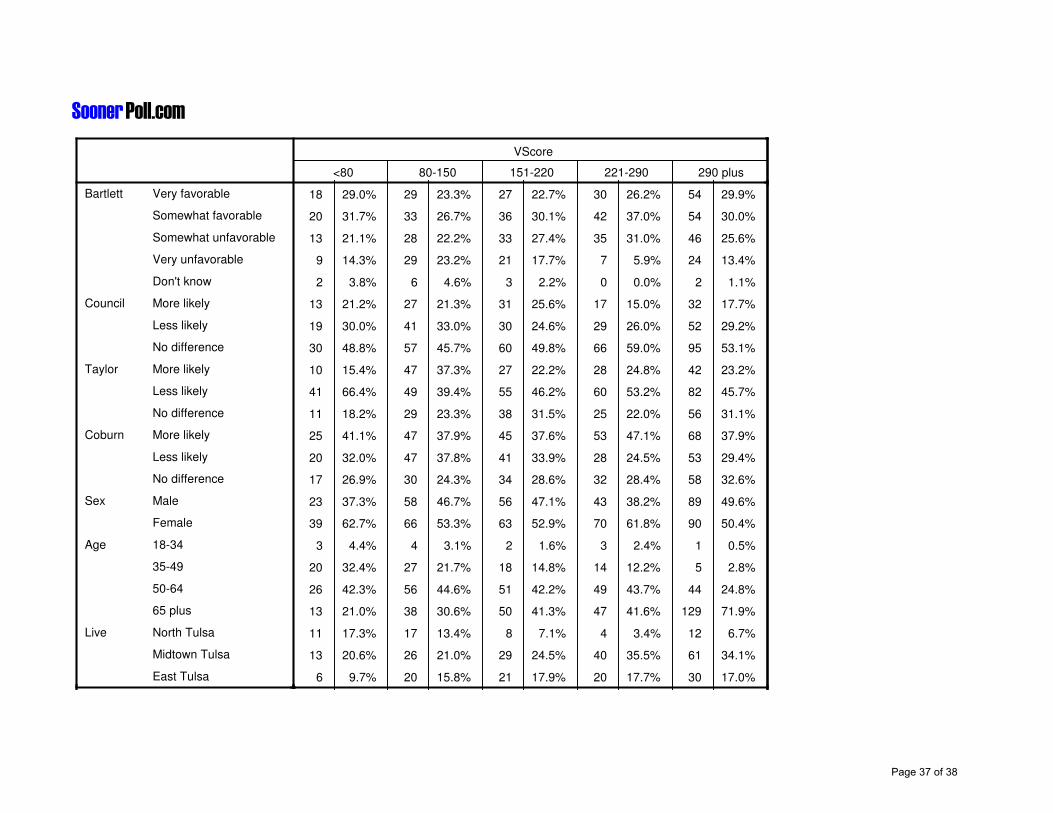
18 29.0% 29 23.3% 27 22.7% 30 26.2% 54 29.9%
20 31.7% 33 26.7% 36 30.1% 42 37.0% 54 30.0%
13 21.1% 28 22.2% 33 27.4% 35 31.0% 46 25.6%
9 14.3% 29 23.2% 21 17.7% 7 5.9% 24 13.4%
2 3.8% 6 4.6% 3 2.2% 0 0.0% 2 1.1%
13 21.2% 27 21.3% 31 25.6% 17 15.0% 32 17.7%
19 30.0% 41 33.0% 30 24.6% 29 26.0% 52 29.2%
30 48.8% 57 45.7% 60 49.8% 66 59.0% 95 53.1%
10 15.4% 47 37.3% 27 22.2% 28 24.8% 42 23.2%
41 66.4% 49 39.4% 55 46.2% 60 53.2% 82 45.7%
11 18.2% 29 23.3% 38 31.5% 25 22.0% 56 31.1%
25 41.1% 47 37.9% 45 37.6% 53 47.1% 68 37.9%
20 32.0% 47 37.8% 41 33.9% 28 24.5% 53 29.4%
17 26.9% 30 24.3% 34 28.6% 32 28.4% 58 32.6%
23 37.3% 58 46.7% 56 47.1% 43 38.2% 89 49.6%
39 62.7% 66 53.3% 63 52.9% 70 61.8% 90 50.4%
3 4.4% 4 3.1% 2 1.6% 3 2.4% 1 0.5%
20 32.4% 27 21.7% 18 14.8% 14 12.2% 5 2.8%
26 42.3% 56 44.6% 51 42.2% 49 43.7% 44 24.8%
13 21.0% 38 30.6% 50 41.3% 47 41.6% 129 71.9%
11 17.3% 17 13.4% 8 7.1% 4 3.4% 12 6.7%
13 20.6% 26 21.0% 29 24.5% 40 35.5% 61 34.1%
6 9.7% 20 15.8% 21 17.9% 20 17.7% 30 17.0%
Page 37 of 38
SoonerPoll.com
VScore
<80 80-150 151-220 221-290 290 plus
South Tulsa
Undetermined
Label Very liberal
Somewhat liberal
Moderate
Somewhat conservative
Very conservative
VScore <80
80-150
151-220
221-290
290 plus
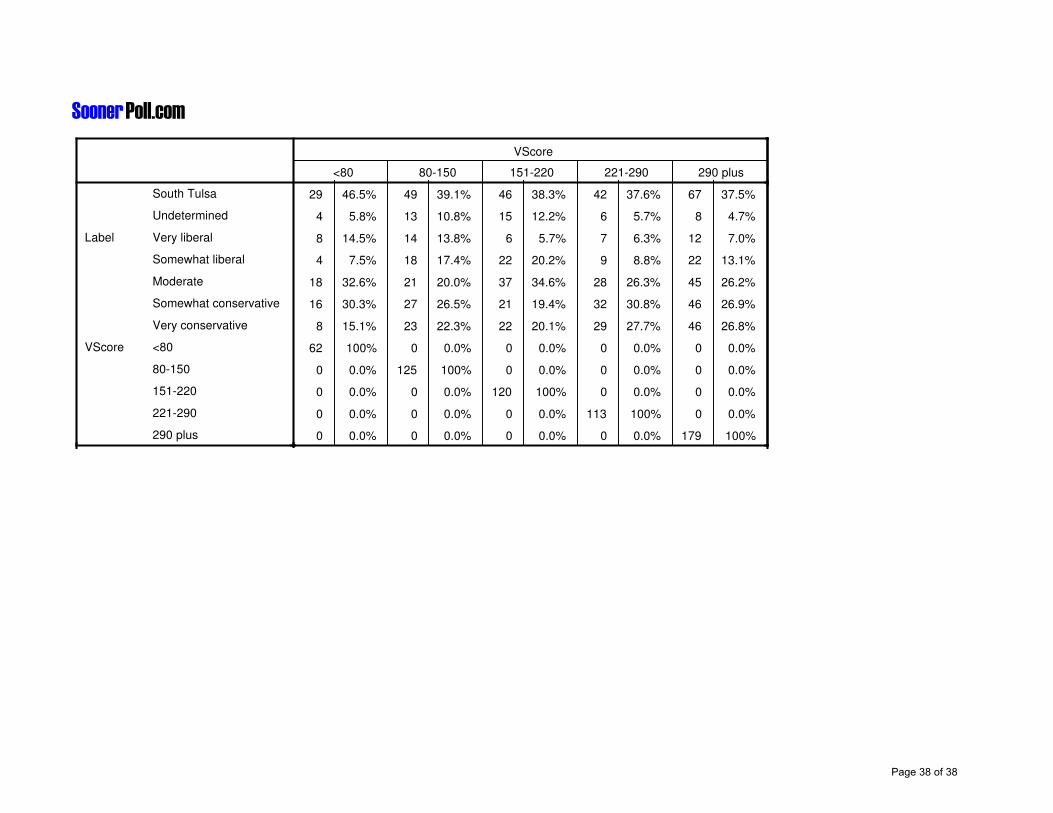
29 46.5% 49 39.1% 46 38.3% 42 37.6% 67 37.5%
4 5.8% 13 10.8% 15 12.2% 6 5.7% 8 4.7%
8 14.5% 14 13.8% 6 5.7% 7 6.3% 12 7.0%
4 7.5% 18 17.4% 22 20.2% 9 8.8% 22 13.1%
18 32.6% 21 20.0% 37 34.6% 28 26.3% 45 26.2%
16 30.3% 27 26.5% 21 19.4% 32 30.8% 46 26.9%
8 15.1% 23 22.3% 22 20.1% 29 27.7% 46 26.8%
62 100% 0 0.0% 0 0.0% 0 0.0% 0 0.0%
0 0.0% 125 100% 0 0.0% 0 0.0% 0 0.0%
0 0.0% 0 0.0% 120 100% 0 0.0% 0 0.0%
0 0.0% 0 0.0% 0 0.0% 113 100% 0 0.0%
0 0.0% 0 0.0% 0 0.0% 0 0.0% 179 100%
Page 38 of 38