Embed Size (px)
Citation preview
IEA INTERNATIONAL ENERGY AGENCY
ENERGY CONSERVATION IN BUILDINGS AND COMMUNITY SYSTEMS
Integrated Building Concepts State-of-the-Art Review Working Report Editors: Inger Andresen, SINTEF Building and Infrastructure, Trondheim, Norway Tommy Kleiven, SINTEF Building and Infrastructure, Trondheim, Norway Mary-Ann Knudstrup, Architecture and Design, Aalborg University, Denmark Per Heiselberg, Indoor Environment Engineering, Aalborg University, Denmark
July 26, 2006

2
Acknowledgements The following experts contributed to this report: Ad van der Aa Cauberg-Huygen Consulting Engineers PO Box 9222 3007 AE Rotterdam The Netherlands Phone: + 31 10 4257444; Fax: + 31 10 4254443; E-mail: [email protected] Inger Andresen SINTEF Building Research Architecture and Building Technology Alfred Getz Vei 3 7033 Trondheim Norway Phone: + 47 92207049; Fax: + 47 73 598285; E-mail: [email protected] Hideo Asada UKAJI Building Energy and Environment Research Institute Japan E-mail: [email protected] Ernst Bluemel AEE INTEC Feldgasse 19 8200 Gleisdorf Austria Phone: + 43 3112 5886 25; Fax: + 43 3112 5886 18; E-mail: [email protected] Matthias Haase Hong Kong University Pokfulam Road SAR Hong Kong China Phone: + 852 2241 5839; Fax: + 852 2559 6484; E-mail: [email protected] Hanne Tine Ring Hansen Architecture and Design Aalborg University Østeraagade 6 9000 Aalborg Denmark Phone: + 45 9635 7179; Fax: -; E-mail: [email protected]

3
Tatsuya Hayashi NIKKEN SEKKEI LTD 2-18-3 Iidabashi, Chiyoda-ku, Tokyo 102-8117 Japan Phone: + 81 (3) 52263030; Fax: + 81 (3) 52263039; E-mail: [email protected] Per Heiselberg Indoor Environmental Engineering Aalborg University Sohngaardsholmsvej 57 9000 Aalborg Denmark Phone: + 45 9635 8541; Fax: + 45 9814 8243; E-mail: [email protected] Yuji Hori Building Research Institute Department of Environmental Engineering Tachihara 1 Tsukuba, Ibaraki, 305-0802 Japan Phone:+81-29-879-0609; Fax:+81-29-864-6775; E-mail: [email protected] Shinsuke Kato Institute of Industrial Science, University of Tokyo 4-6-1 Komaba Meguro-ku Tokyo, JAPAN Phone: + 81 (0) 3-5452-6431; Fax + 81 (0) 3-5452-6432; E-mail: [email protected] Mary-Ann Knudstrup Architecture & Design Aalborg University Gl. Torv 6 9000 Aalborg Denmark Phone: + 45 9635 9910; Fax: + 45 9813 6705; E-mail: [email protected] Jakub Kolarik Int. Centre of Indoor Environment and Energy DTU Nils Koppels Allé, Building 402 2800 Kgs. Lyngby Denmark Phone: +44 2882 9959; Fax: +45 4545932166; E-mail: [email protected]

4
Maria Kolokotroni Brunel University Mechanical Engineering Uxbridge Campus Uxbridge,, UB8 3PH United Kingdom Phone: +44 1895 266688; Fax: +44 2895 256392; E-mail: [email protected] Mitsuki Miura The Kansai Electric Power Co.,Inc. Building Energy Group Civil and Architecture Department 6-16, Nakanoshima, 3-chome Kita-ku, Osaka, 530-8270 Japan Phone:+81-6-6441-8821;Fax:+81-6-6446-6464; E-mail: [email protected] Shigeki Nishizawa Building Research Institute Department of Environmental Engineering Tachihara 1 Tsukuba, Ibaraki, 305-0802 Japan Phone:+81-29-864-6683; Fax:+81-29-864-6775; E-mail: [email protected] Akira Satake Technical Institute of Maeda Corporation 1-39-16 Asahi-cho Nerima-ku, Tokyo 179-8914 Japan Phone: + 81 (0) 3-3977-2245, Fax: + 81 (0) 3-3977-2251; E-mail: [email protected] Takao Sawachi National Institute for Land and Infrastucture Management 1 Tatehara Tsukuba 305-0802 Japan Phone: + 81 298 64 4356; Fax: + 81 298 64 6774; E-mail: [email protected] Manabu Tochigi NIHON SEKKI, INC. Environment & MEP Engineering Dept 29th FL.,Shinjuku I-LAND Tower,6-5-1,Nishi-shinjuku,Shinjuku,Tokyo 163-1329 Japan Phone: + 81 (0) 3-5325-8403, Fax: + 81 (0) 3-5325-8457; E-mail: [email protected]

5
Takashi Yanai NIHON SEKKI, INC. Environment & MEP Engineering Dept 29th FL.,Shinjuku I-LAND Tower,6-5-1,Nishi-shinjuku,Shinjuku,Tokyo 163-1329 Japan Phone: + 81 (0) 3-5325-8388, Fax: + 81 (0) 3-5325-8457; E-mail: [email protected] Ryuichiro Yoshie Tokyo Polytechnic University Department of Architecture 1583 Iiyama, Atsugi, Kanagawa Atsugi/Kanagawa 243-0297 Japan Phone: + 81 (0) 46-242-9556; Fax: + 81 (0) 46-242-9556; E-mail: [email protected] Åsa Wahlström SP Swedish National Testing and Research Institute PO Box 857 501 15 Boraas Sweden Phone: + 46 33 16 55 89; Fax: + 46 33 13 19 79; E-mail: [email protected] David Warwick Buro Happold 2 Brewery Place, Brewery Wharf Leeds, LS10 1NE United Kingdom Phone: + 44 113 204 2200; Fax: -; E-mail: [email protected]

6
Contents ACKNOWLEDGEMENTS.................................................................................................................................. 2
DEFINITIONS ...................................................................................................................................................... 7
CHAPTER 1 INTRODUCTION ........................................................................................................................ 8
CHAPTER 2 STATE-OF-THE-ART REVIEW OF INTEGRATED BUILDING CONCEPTS ................. 9 INTRODUCTION ................................................................................................................................................... 9 OVERVIEW OF REFERENCE BUILDINGS ............................................................................................................... 9 BEDZED ............................................................................................................................................................ 10 COMMERZBANK HEADQUARTERS ..................................................................................................................... 13 GLEISDORF VENUE HALL.................................................................................................................................. 17 ITOMAN CITY HALL .......................................................................................................................................... 22 THE KANSAI ELECTRIC POWER BUILDING ........................................................................................................ 27 KVADRATUREN UPPER SECONDARY SCHOOL ................................................................................................... 34 KVERNHUSET LOWER SECONDARY SCHOOL..................................................................................................... 38 LONGLEY PARK ................................................................................................................................................ 44 THE LOWRY ...................................................................................................................................................... 50 MABUCHI MOTOR CORPORATION HEADQUARTERS .......................................................................................... 55 MARZAHN LOW-ENERGY BUILDING .................................................................................................................. 61 MENARA MESINIAGA........................................................................................................................................ 66 MIVA OFFICE BUILDING .................................................................................................................................. 71 M+W ZANDER .................................................................................................................................................. 76 NIKKEN SEKKEI TOKYO BUILDING ................................................................................................................... 81 PASSIV HAUPTSCHULE KLAUS-WEILER-FRAXERN ........................................................................................... 86 PHOTO-CATALYTIC MATERIAL BUILDING ........................................................................................................ 91 POROUS-TYPE RESIDENTIAL BUILDING ............................................................................................................ 95 RWS TERNEUZEN ............................................................................................................................................. 98 SAKAI GAS BUILDING ..................................................................................................................................... 102 W E I Z ........................................................................................................................................................... 106 ZUB................................................................................................................................................................ 110
CHAPTER 3 STATE-OF-THE-ART REVIEW OF INTEGRATED DESIGN PROCESS METHODS AND TOOLS ................................................................................................................................................ 115
THE INTEGRATED DESIGN PROCESS BY IEA TASK 23..................................................................................... 116 THE INTEGRATED DESIGN PROCESS (IDP) BY KNUDSTRUP ............................................................................ 121 INTEGRATED BUILDING DESIGN SYSTEM (IBDS) ........................................................................................... 126 ECO-FACTOR METHOD ................................................................................................................................... 130 TRIAS ENERGETICA......................................................................................................................................... 135 ENERGY TRIANGLE ......................................................................................................................................... 141 THE KYOTO PYRAMID..................................................................................................................................... 143
CHAPTER 4 STATE-OF-THE-ART REVIEW OF INTEGRATED DESIGN AND SIMULATION TOOLS ................................................................................................................................................ 145
E-QUARTET ..................................................................................................................................................... 146 ECO-FACADE TOOL......................................................................................................................................... 150 LEHVE TOOL................................................................................................................................................. 155 VENTSIM – VENTILATION NETWORK ANALYSIS TOOL ................................................................................... 158 COMPUTER SIMULATION TOOLS ..................................................................................................................... 162 UNCERTAINTY IN BUILDING PERFORMANCE ASSESSMENT ............................................................................. 164
CHAPTER 5 STATE-OF-THE-ART REVIEW OF TECHNICAL BARRIERS AND OPPORTUNITIES FOR INTEGRATION ...................................................................................................................................... 172
7
Definitions Reactive Building Elements Building construction elements that assist to maintain an appropriate balance between optimum interior conditions and environmental performance by reacting in a dynamic and integrated manner to changes in external or internal conditions or to occupant intervention, and by dynamically communicating with technical systems. Examples include:
• Facades systems (Double skin facades, adaptable facades, windows, shutters, shading devices, ventilation openings, green facades)
• Roof systems (Green roof systems)
• Foundations (Earth coupling systems)
• Storages (Phase change materials (PCM) active use of thermal mass, material (concrete, massive wood) core activation (cooling and heating))
• Whole room concepts
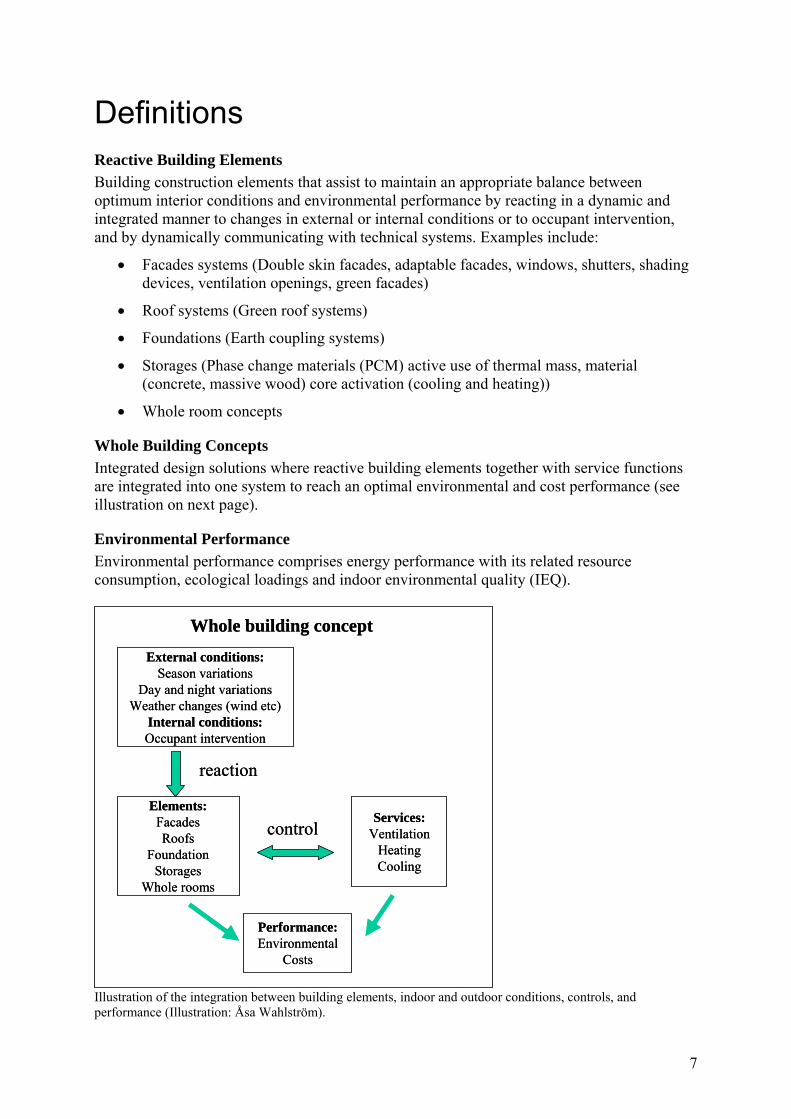
Whole Building Concepts Integrated design solutions where reactive building elements together with service functions are integrated into one system to reach an optimal environmental and cost performance (see illustration on next page).
Environmental Performance Environmental performance comprises energy performance with its related resource consumption, ecological loadings and indoor environmental quality (IEQ).
Elements:FacadesRoofs
FoundationStorages
Whole rooms
Services:Ventilation
HeatingCooling
External conditions:Season variations
Day and night variationsWeather changes (wind etc)
Internal conditions:Occupant intervention
reaction
control
Whole building concept
Performance:Environmental
Costs
Elements:FacadesRoofs
FoundationStorages
Whole rooms
Services:Ventilation
HeatingCooling
External conditions:Season variations
Day and night variationsWeather changes (wind etc)
Internal conditions:Occupant intervention
reaction
control
Whole building concept
Performance:Environmental
Costs
Illustration of the integration between building elements, indoor and outdoor conditions, controls, and performance (Illustration: Åsa Wahlström).
8
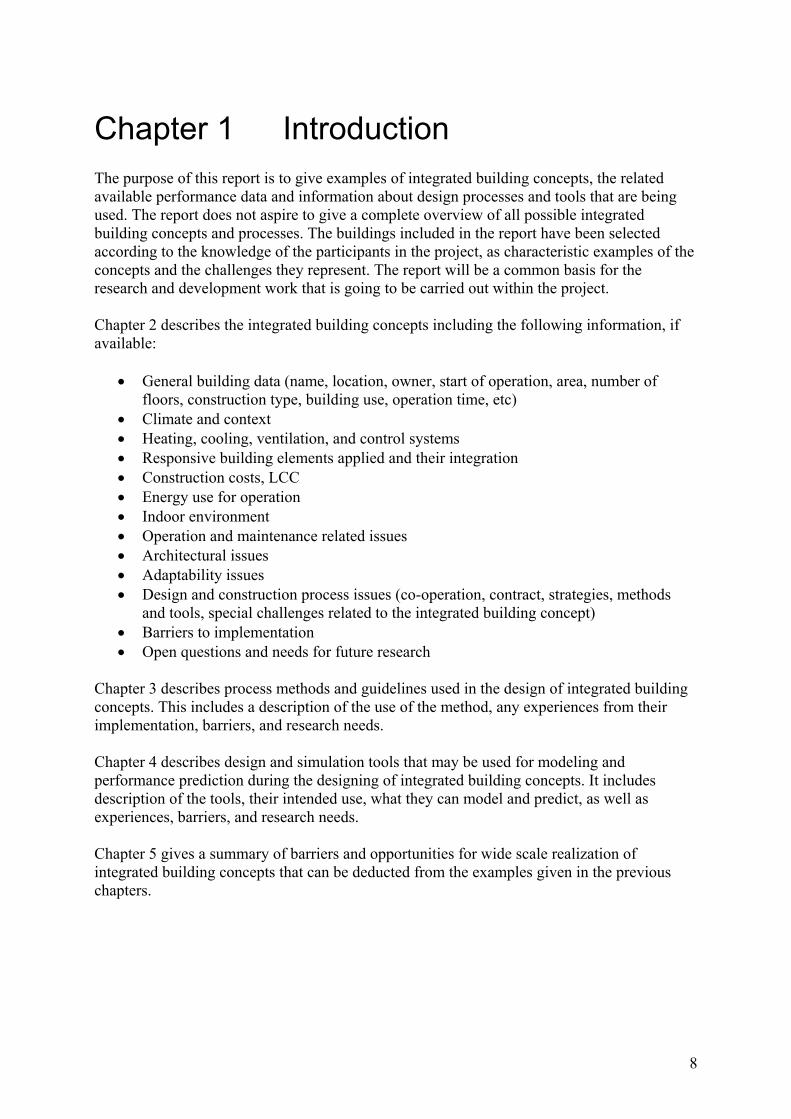
Chapter 1 Introduction The purpose of this report is to give examples of integrated building concepts, the related available performance data and information about design processes and tools that are being used. The report does not aspire to give a complete overview of all possible integrated building concepts and processes. The buildings included in the report have been selected according to the knowledge of the participants in the project, as characteristic examples of the concepts and the challenges they represent. The report will be a common basis for the research and development work that is going to be carried out within the project. Chapter 2 describes the integrated building concepts including the following information, if available:
• General building data (name, location, owner, start of operation, area, number of floors, construction type, building use, operation time, etc)
• Climate and context • Heating, cooling, ventilation, and control systems • Responsive building elements applied and their integration • Construction costs, LCC • Energy use for operation • Indoor environment • Operation and maintenance related issues • Architectural issues • Adaptability issues • Design and construction process issues (co-operation, contract, strategies, methods
and tools, special challenges related to the integrated building concept) • Barriers to implementation • Open questions and needs for future research
Chapter 3 describes process methods and guidelines used in the design of integrated building concepts. This includes a description of the use of the method, any experiences from their implementation, barriers, and research needs. Chapter 4 describes design and simulation tools that may be used for modeling and performance prediction during the designing of integrated building concepts. It includes description of the tools, their intended use, what they can model and predict, as well as experiences, barriers, and research needs. Chapter 5 gives a summary of barriers and opportunities for wide scale realization of integrated building concepts that can be deducted from the examples given in the previous chapters.
9
Chapter 2 State-of-the-art review of integrated building concepts
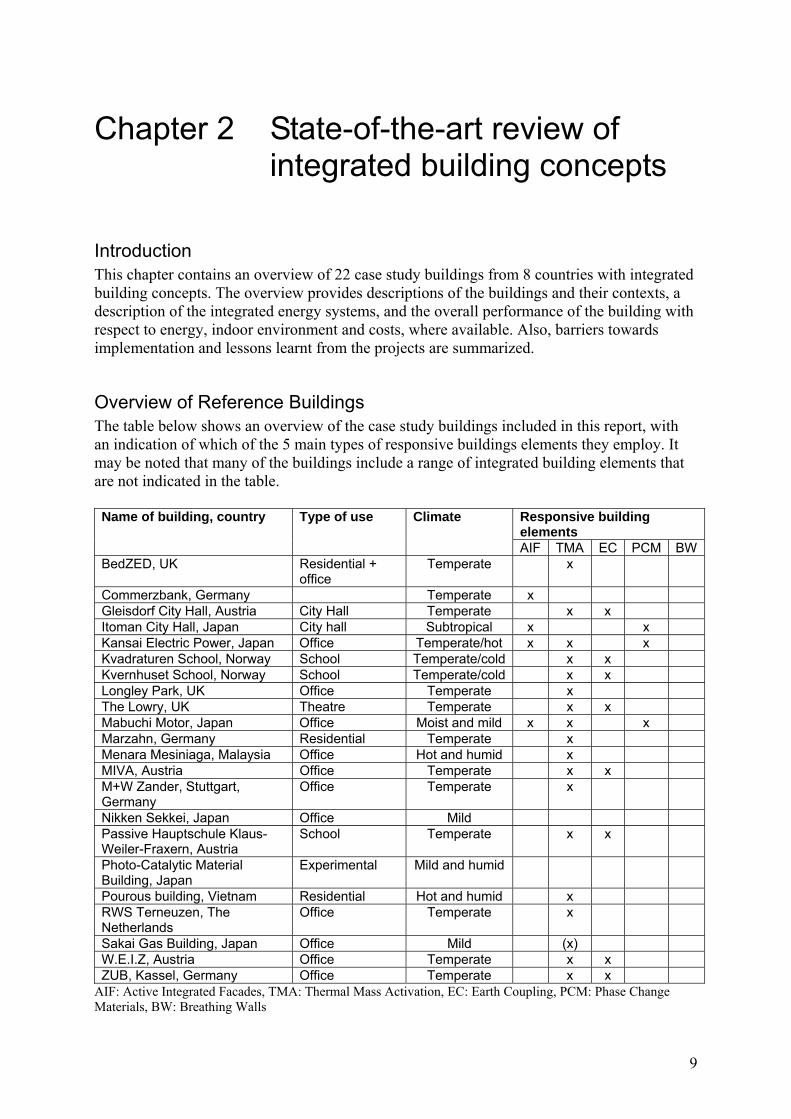
Introduction This chapter contains an overview of 22 case study buildings from 8 countries with integrated building concepts. The overview provides descriptions of the buildings and their contexts, a description of the integrated energy systems, and the overall performance of the building with respect to energy, indoor environment and costs, where available. Also, barriers towards implementation and lessons learnt from the projects are summarized.
Overview of Reference Buildings The table below shows an overview of the case study buildings included in this report, with an indication of which of the 5 main types of responsive buildings elements they employ. It may be noted that many of the buildings include a range of integrated building elements that are not indicated in the table.
Responsive building elements
Name of building, country Type of use Climate
AIF TMA EC PCM BW BedZED, UK Residential +
office Temperate x
Commerzbank, Germany Temperate x Gleisdorf City Hall, Austria City Hall Temperate x x Itoman City Hall, Japan City hall Subtropical x x Kansai Electric Power, Japan Office Temperate/hot x x x Kvadraturen School, Norway School Temperate/cold x x Kvernhuset School, Norway School Temperate/cold x x Longley Park, UK Office Temperate x The Lowry, UK Theatre Temperate x x Mabuchi Motor, Japan Office Moist and mild x x x Marzahn, Germany Residential Temperate x Menara Mesiniaga, Malaysia Office Hot and humid x MIVA, Austria Office Temperate x x M+W Zander, Stuttgart, Germany
Office Temperate x
Nikken Sekkei, Japan Office Mild Passive Hauptschule Klaus-Weiler-Fraxern, Austria
School Temperate x x
Photo-Catalytic Material Building, Japan
Experimental Mild and humid
Pourous building, Vietnam Residential Hot and humid x RWS Terneuzen, The Netherlands
Office Temperate x
Sakai Gas Building, Japan Office Mild (x) W.E.I.Z, Austria Office Temperate x x ZUB, Kassel, Germany Office Temperate x x
AIF: Active Integrated Facades, TMA: Thermal Mass Activation, EC: Earth Coupling, PCM: Phase Change Materials, BW: Breathing Walls
10
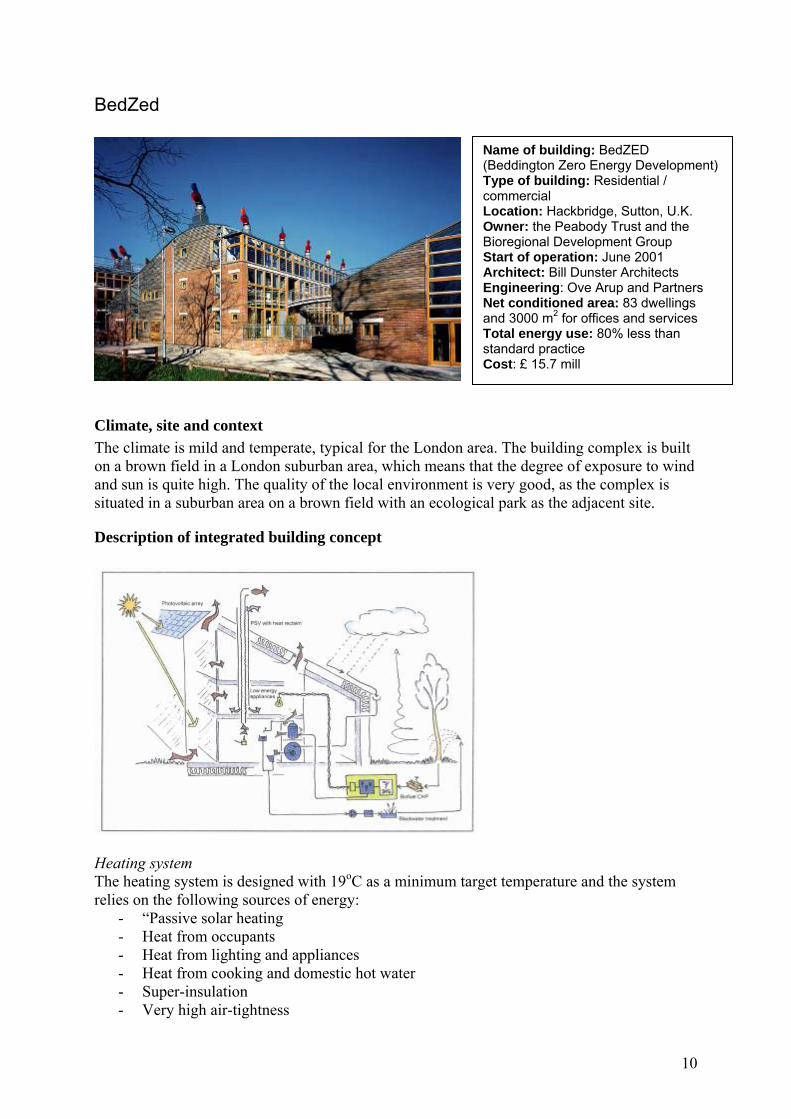
BedZed
Climate, site and context The climate is mild and temperate, typical for the London area. The building complex is built on a brown field in a London suburban area, which means that the degree of exposure to wind and sun is quite high. The quality of the local environment is very good, as the complex is situated in a suburban area on a brown field with an ecological park as the adjacent site.
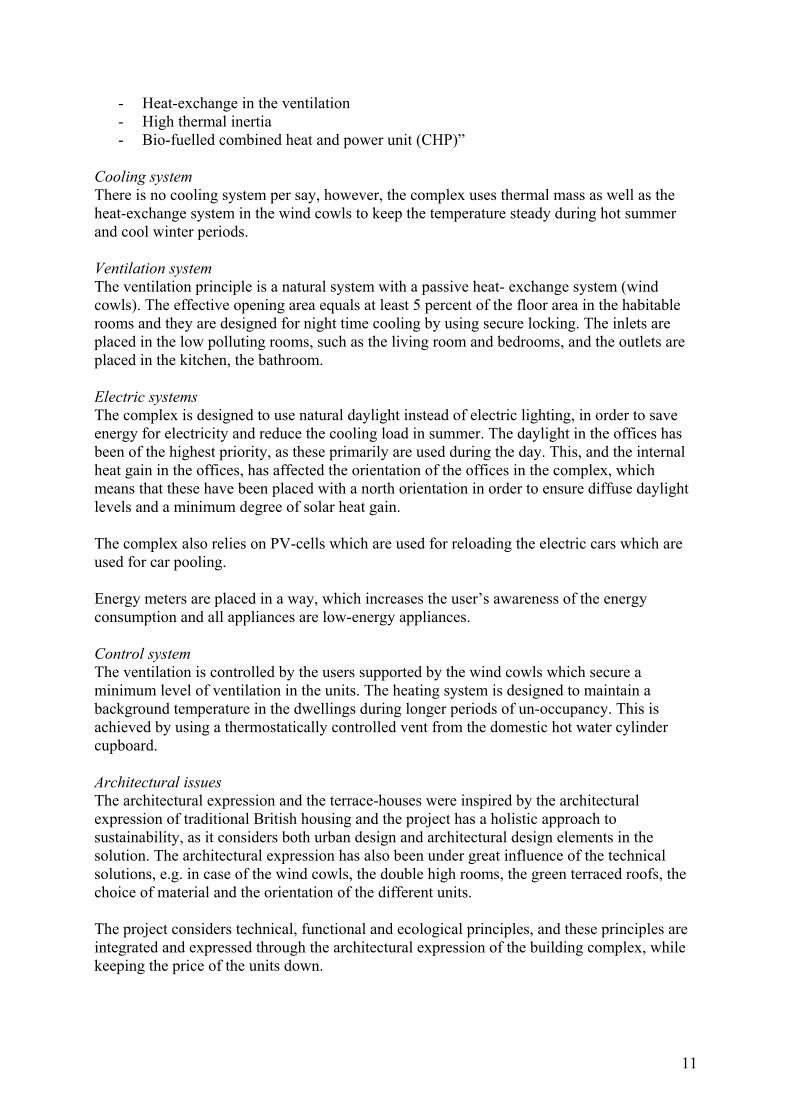
Description of integrated building concept
Heating system The heating system is designed with 19oC as a minimum target temperature and the system relies on the following sources of energy:
- “Passive solar heating - Heat from occupants - Heat from lighting and appliances - Heat from cooking and domestic hot water - Super-insulation - Very high air-tightness
Name of building: BedZED (Beddington Zero Energy Development) Type of building: Residential / commercial Location: Hackbridge, Sutton, U.K. Owner: the Peabody Trust and the Bioregional Development Group Start of operation: June 2001 Architect: Bill Dunster Architects Engineering: Ove Arup and Partners Net conditioned area: 83 dwellings and 3000 m2 for offices and services Total energy use: 80% less than standard practice Cost: £ 15.7 mill
11
- Heat-exchange in the ventilation - High thermal inertia - Bio-fuelled combined heat and power unit (CHP)”
Cooling system There is no cooling system per say, however, the complex uses thermal mass as well as the heat-exchange system in the wind cowls to keep the temperature steady during hot summer and cool winter periods. Ventilation system The ventilation principle is a natural system with a passive heat- exchange system (wind cowls). The effective opening area equals at least 5 percent of the floor area in the habitable rooms and they are designed for night time cooling by using secure locking. The inlets are placed in the low polluting rooms, such as the living room and bedrooms, and the outlets are placed in the kitchen, the bathroom. Electric systems The complex is designed to use natural daylight instead of electric lighting, in order to save energy for electricity and reduce the cooling load in summer. The daylight in the offices has been of the highest priority, as these primarily are used during the day. This, and the internal heat gain in the offices, has affected the orientation of the offices in the complex, which means that these have been placed with a north orientation in order to ensure diffuse daylight levels and a minimum degree of solar heat gain. The complex also relies on PV-cells which are used for reloading the electric cars which are used for car pooling. Energy meters are placed in a way, which increases the user’s awareness of the energy consumption and all appliances are low-energy appliances. Control system The ventilation is controlled by the users supported by the wind cowls which secure a minimum level of ventilation in the units. The heating system is designed to maintain a background temperature in the dwellings during longer periods of un-occupancy. This is achieved by using a thermostatically controlled vent from the domestic hot water cylinder cupboard. Architectural issues The architectural expression and the terrace-houses were inspired by the architectural expression of traditional British housing and the project has a holistic approach to sustainability, as it considers both urban design and architectural design elements in the solution. The architectural expression has also been under great influence of the technical solutions, e.g. in case of the wind cowls, the double high rooms, the green terraced roofs, the choice of material and the orientation of the different units. The project considers technical, functional and ecological principles, and these principles are integrated and expressed through the architectural expression of the building complex, while keeping the price of the units down.
12
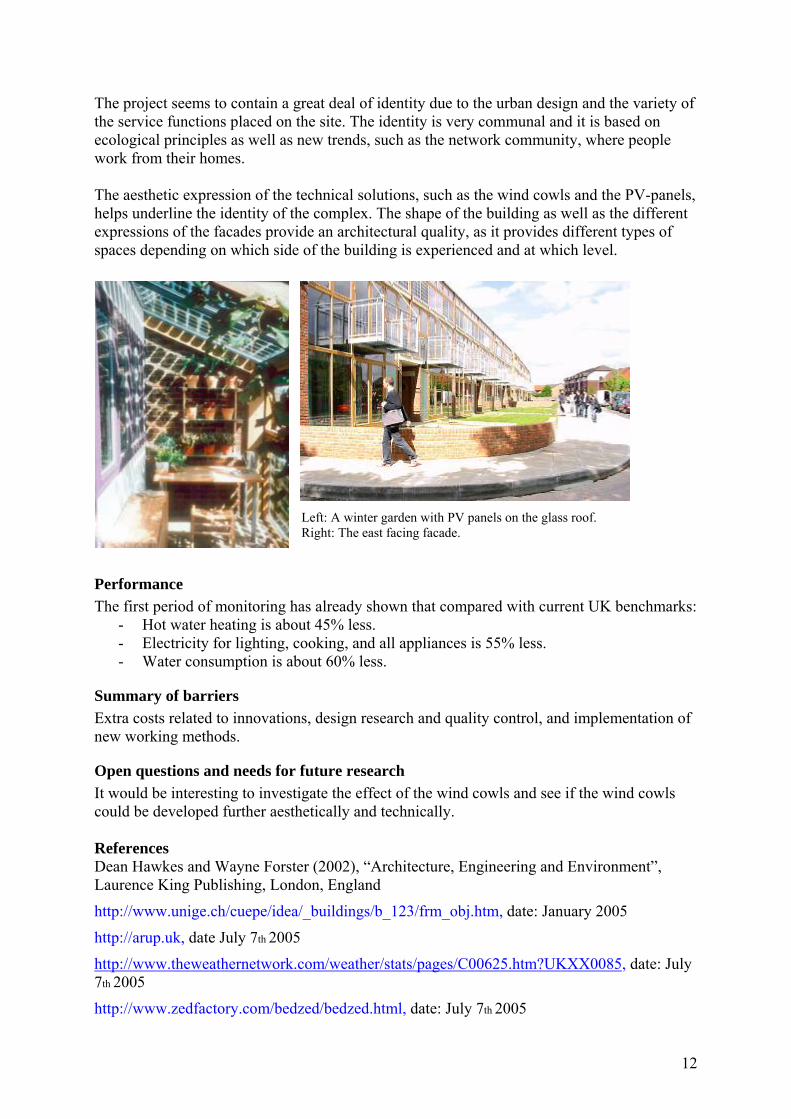
The project seems to contain a great deal of identity due to the urban design and the variety of the service functions placed on the site. The identity is very communal and it is based on ecological principles as well as new trends, such as the network community, where people work from their homes. The aesthetic expression of the technical solutions, such as the wind cowls and the PV-panels, helps underline the identity of the complex. The shape of the building as well as the different expressions of the facades provide an architectural quality, as it provides different types of spaces depending on which side of the building is experienced and at which level.
Left: A winter garden with PV panels on the glass roof. Right: The east facing facade.
Performance The first period of monitoring has already shown that compared with current UK benchmarks:
- Hot water heating is about 45% less. - Electricity for lighting, cooking, and all appliances is 55% less. - Water consumption is about 60% less.
Summary of barriers Extra costs related to innovations, design research and quality control, and implementation of new working methods.
Open questions and needs for future research It would be interesting to investigate the effect of the wind cowls and see if the wind cowls could be developed further aesthetically and technically. References Dean Hawkes and Wayne Forster (2002), “Architecture, Engineering and Environment”, Laurence King Publishing, London, England
http://www.unige.ch/cuepe/idea/_buildings/b_123/frm_obj.htm, date: January 2005
http://arup.uk, date July 7th 2005
http://www.theweathernetwork.com/weather/stats/pages/C00625.htm?UKXX0085, date: July 7th 2005
http://www.zedfactory.com/bedzed/bedzed.html, date: July 7th 2005
13
Commerzbank Headquarters
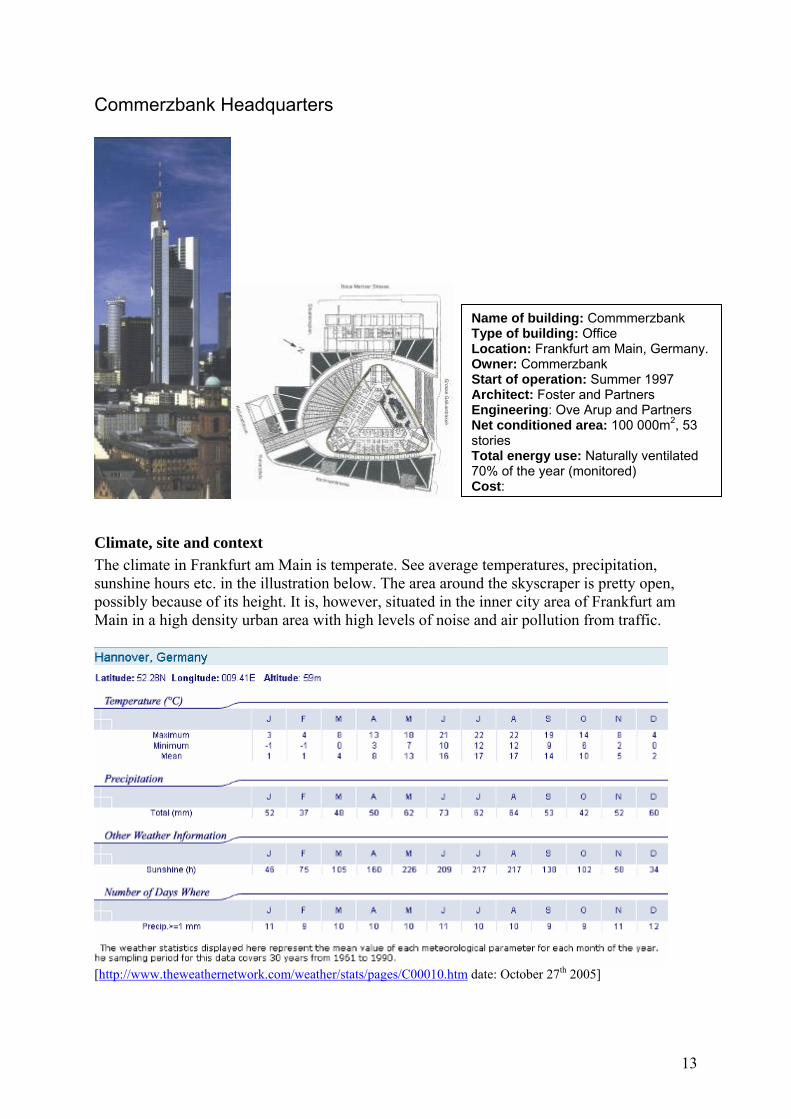
Climate, site and context The climate in Frankfurt am Main is temperate. See average temperatures, precipitation, sunshine hours etc. in the illustration below. The area around the skyscraper is pretty open, possibly because of its height. It is, however, situated in the inner city area of Frankfurt am Main in a high density urban area with high levels of noise and air pollution from traffic.
[http://www.theweathernetwork.com/weather/stats/pages/C00010.htm date: October 27th 2005]
Name of building: Commmerzbank Type of building: Office Location: Frankfurt am Main, Germany. Owner: Commerzbank Start of operation: Summer 1997 Architect: Foster and Partners Engineering: Ove Arup and Partners Net conditioned area: 100 000m2, 53 stories Total energy use: Naturally ventilated 70% of the year (monitored) Cost:

14
Description of the building and the integrated building concept
The illustration shows a typical office floor, a vertical section of the building and a segment of the vertical section. This gives an idea of how the atrium and the winter-gardens are placed in the building. The atrium is placed as a vertical core in the centre of the building, connecting the four storey winter-gardens and ensuring ventilation. “At fifty-three storeys, the Commerzbank is the world’s first ecological office tower and the tallest building in Europe. The outcome of a limited international competition, the project explores the nature of the office environment, developing new ideas for its ecology and working patterns. Central to this concept is a reliance on natural systems of lighting and ventilation. Every office in the tower is daylit and has openable windows, allowing occupants to control their own environment, and resulting in energy consumption levels equivalent to half those of conventional office towers. The plan of the building is triangular, comprising three ‘petals’ - the office floors - and a ‘stem’ formed by a full-height central atrium. Pairs of vertical masts enclose services and circulation cores in the corners of the plan and support eight-storey Vierendeel beams, which in turn support clear-span office floors. Four-storey gardens are set at different levels on each side of the tower, forming a spiral of landscaping around the building, and visually establishing a social focus for village-like offices clusters. These gardens play an ecological role, bringing daylight and fresh air into the central atrium, which acts as a natural ventilation chimney for the inward-facing offices. The gardens are also places to relax during refreshment breaks, bringing richness and humanity to the workplace, and from the outside they give the building a sense of transparency and lightness. Depending on their orientation, planting is from one of three regions: North America, Asia or the Mediterranean. The tower has a distinctive presence on the Frankfurt skyline but is also anchored into the lower-scale city fabric, with restoration and sensitive rebuilding of the perimeter structures reinforcing the original scale of the block. These developments at street level provide shops, car parking, apartments and a banking hall, and forge links between the Commerzbank and the broader community. At the heart of the scheme a public galleria with restaurants, cafés and spaces for social and cultural events forms a popular new route cutting across the site. Interestingly, on the day the Commerzbank opened, the Financial Times adopted it as the
15
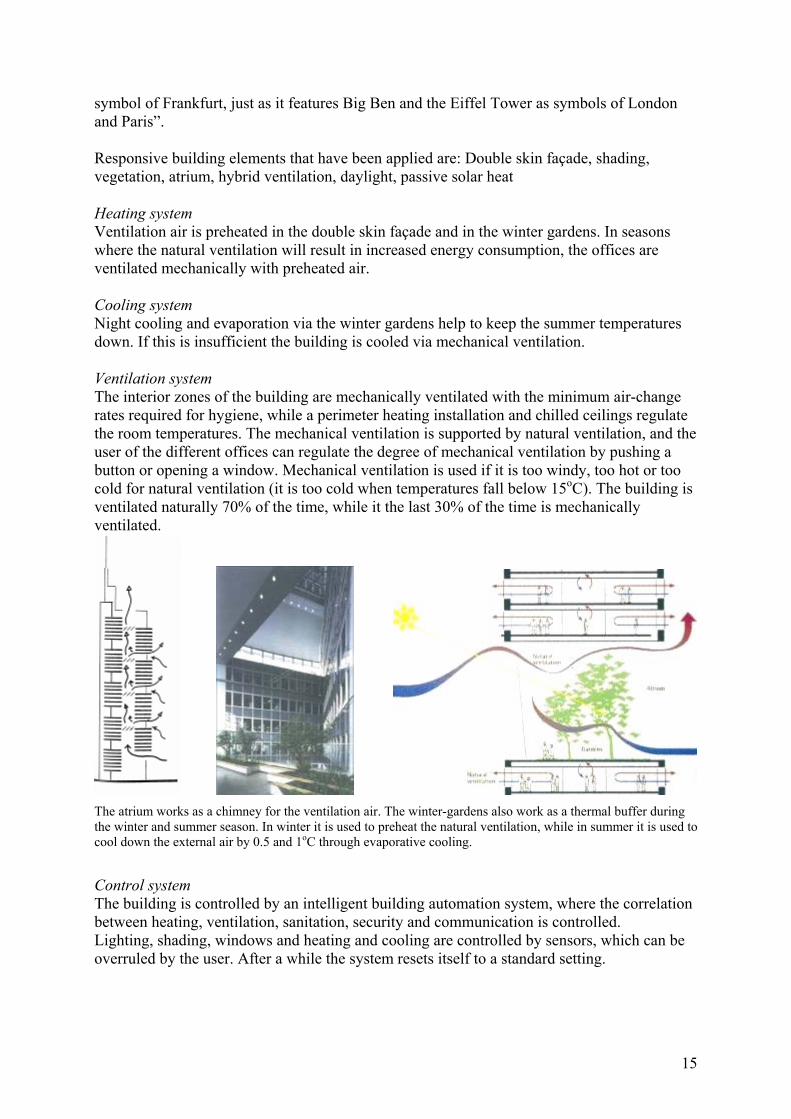
symbol of Frankfurt, just as it features Big Ben and the Eiffel Tower as symbols of London and Paris”. Responsive building elements that have been applied are: Double skin façade, shading, vegetation, atrium, hybrid ventilation, daylight, passive solar heat Heating system Ventilation air is preheated in the double skin façade and in the winter gardens. In seasons where the natural ventilation will result in increased energy consumption, the offices are ventilated mechanically with preheated air. Cooling system Night cooling and evaporation via the winter gardens help to keep the summer temperatures down. If this is insufficient the building is cooled via mechanical ventilation. Ventilation system The interior zones of the building are mechanically ventilated with the minimum air-change rates required for hygiene, while a perimeter heating installation and chilled ceilings regulate the room temperatures. The mechanical ventilation is supported by natural ventilation, and the user of the different offices can regulate the degree of mechanical ventilation by pushing a button or opening a window. Mechanical ventilation is used if it is too windy, too hot or too cold for natural ventilation (it is too cold when temperatures fall below 15oC). The building is ventilated naturally 70% of the time, while it the last 30% of the time is mechanically ventilated.
The atrium works as a chimney for the ventilation air. The winter-gardens also work as a thermal buffer during the winter and summer season. In winter it is used to preheat the natural ventilation, while in summer it is used to cool down the external air by 0.5 and 1oC through evaporative cooling. Control system The building is controlled by an intelligent building automation system, where the correlation between heating, ventilation, sanitation, security and communication is controlled. Lighting, shading, windows and heating and cooling are controlled by sensors, which can be overruled by the user. After a while the system resets itself to a standard setting.

16
Architectural issues The shape of the building, winter gardens and atrium provide visual quality in the building for the users, which is usually scarce in high rise buildings. This building has the high-tech feel to it just as most of Foster and Partners projects, thus it still looks like a skyscraper, though the rectangular shape of other high-rise has been replaced by a triangular one.
The Double skin façade enables the ventilation of the offices and at the same time it provides external shading. The system consists of a ventilated cavity between a one layer waterproof glass wall, a climatic buffer and a internal double glass wall which is insulated for thermal bridges. The shading device is placed on the inside of the waterproof glass wall. The Winter garden provides green islands in the high-rise building office landscape. The vegetation is used to produce purer air furthermore it reduces the dust in the in-let air and helps to cool down the building in summertime (ADA 1997)
Performance During the design phase the double skin façade was analyzed and it was concluded that it could provide natural ventilation about 60% of the year. Since the building has been put to use the result has been that the building is naturally ventilated 70% of the time (Daniels 1997).
Open questions and needs for future research It would be interesting to investigate the users perception of the architectural and climate in the building and the effect of the chimney and winter gardens in the building.
References http://www.fosterandpartners.com/internetsite/Flash.html, date: October 28th 2005
http://www.architektur.tu-darmstadt.de/upload/powerhouse_typepicture/481/picturehigh/project515_high.jpg date: October 28th 2005
http://www.architektur.tu-darmstadt.de/powerhouse/db/248,id_122,s_Projects.en.fb15 date: October 28th 2005
ADA 1997: ”Associerede Danske Arkitekter nr. 9 – oktober 97”, Denmark
Daniels 1997: “The Technology of the ecological building: basic principles, examples and ideas” Germany
Pawley 1999: “Norman Forster: A Global Architecture” England
17
Gleisdorf Venue Hall
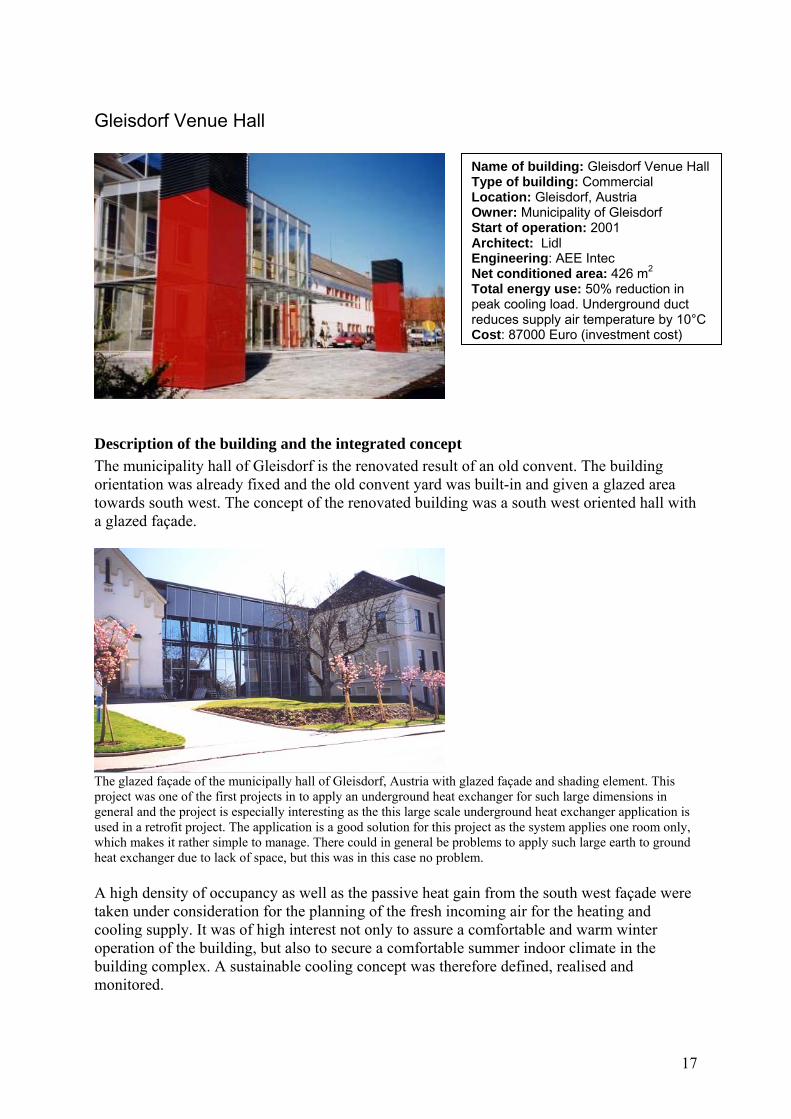
Description of the building and the integrated concept The municipality hall of Gleisdorf is the renovated result of an old convent. The building orientation was already fixed and the old convent yard was built-in and given a glazed area towards south west. The concept of the renovated building was a south west oriented hall with a glazed façade.
The glazed façade of the municipally hall of Gleisdorf, Austria with glazed façade and shading element. This project was one of the first projects in to apply an underground heat exchanger for such large dimensions in general and the project is especially interesting as the this large scale underground heat exchanger application is used in a retrofit project. The application is a good solution for this project as the system applies one room only, which makes it rather simple to manage. There could in general be problems to apply such large earth to ground heat exchanger due to lack of space, but this was in this case no problem. A high density of occupancy as well as the passive heat gain from the south west façade were taken under consideration for the planning of the fresh incoming air for the heating and cooling supply. It was of high interest not only to assure a comfortable and warm winter operation of the building, but also to secure a comfortable summer indoor climate in the building complex. A sustainable cooling concept was therefore defined, realised and monitored.
Name of building: Gleisdorf Venue Hall Type of building: Commercial Location: Gleisdorf, Austria Owner: Municipality of Gleisdorf Start of operation: 2001 Architect: LidlEngineering: AEE Intec Net conditioned area: 426 m2 Total energy use: 50% reduction in peak cooling load. Underground duct reduces supply air temperature by 10°C Cost: 87000 Euro (investment cost)
18
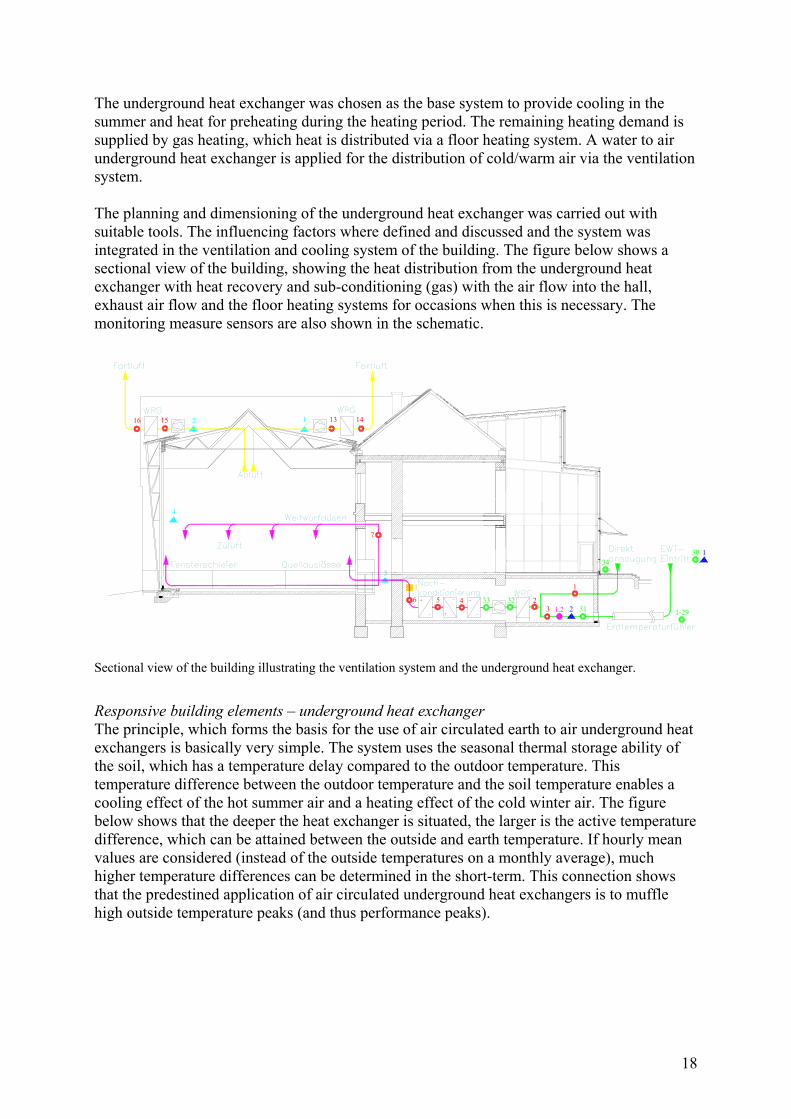
The underground heat exchanger was chosen as the base system to provide cooling in the summer and heat for preheating during the heating period. The remaining heating demand is supplied by gas heating, which heat is distributed via a floor heating system. A water to air underground heat exchanger is applied for the distribution of cold/warm air via the ventilation system. The planning and dimensioning of the underground heat exchanger was carried out with suitable tools. The influencing factors where defined and discussed and the system was integrated in the ventilation and cooling system of the building. The figure below shows a sectional view of the building, showing the heat distribution from the underground heat exchanger with heat recovery and sub-conditioning (gas) with the air flow into the hall, exhaust air flow and the floor heating systems for occasions when this is necessary. The monitoring measure sensors are also shown in the schematic.
1
3
1
4
2 141316 15
1
7
6 5 43
2
34
33
1-29
130
323121,2
Sectional view of the building illustrating the ventilation system and the underground heat exchanger. Responsive building elements – underground heat exchanger The principle, which forms the basis for the use of air circulated earth to air underground heat exchangers is basically very simple. The system uses the seasonal thermal storage ability of the soil, which has a temperature delay compared to the outdoor temperature. This temperature difference between the outdoor temperature and the soil temperature enables a cooling effect of the hot summer air and a heating effect of the cold winter air. The figure below shows that the deeper the heat exchanger is situated, the larger is the active temperature difference, which can be attained between the outside and earth temperature. If hourly mean values are considered (instead of the outside temperatures on a monthly average), much higher temperature differences can be determined in the short-term. This connection shows that the predestined application of air circulated underground heat exchangers is to muffle high outside temperature peaks (and thus performance peaks).
19
Mittlerer Jahrestemperaturverlauf im Erdreich bei unterschiedlichen Tiefen
-4
-2
0
2
4
6
8
10
12
14
16
18
20
Außenluft
Erdoberfläche
2m Tiefe
4m Tiefe
6m Tiefe
8m Tiefe
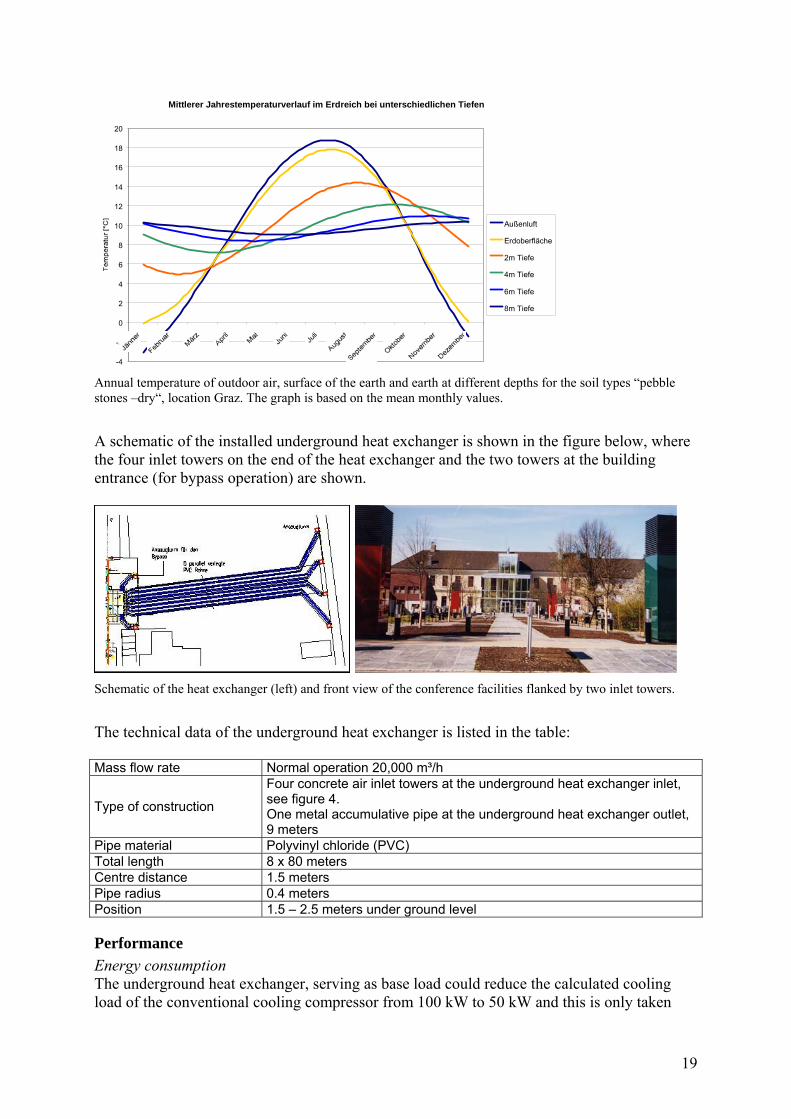
Annual temperature of outdoor air, surface of the earth and earth at different depths for the soil types “pebble stones –dry“, location Graz. The graph is based on the mean monthly values. A schematic of the installed underground heat exchanger is shown in the figure below, where the four inlet towers on the end of the heat exchanger and the two towers at the building entrance (for bypass operation) are shown.
Schematic of the heat exchanger (left) and front view of the conference facilities flanked by two inlet towers. The technical data of the underground heat exchanger is listed in the table: Mass flow rate Normal operation 20,000 m³/h
Type of construction
Four concrete air inlet towers at the underground heat exchanger inlet, see figure 4. One metal accumulative pipe at the underground heat exchanger outlet, 9 meters
Pipe material Polyvinyl chloride (PVC) Total length 8 x 80 meters Centre distance 1.5 meters Pipe radius 0.4 meters Position 1.5 – 2.5 meters under ground level
Performance Energy consumption The underground heat exchanger, serving as base load could reduce the calculated cooling load of the conventional cooling compressor from 100 kW to 50 kW and this is only taken
20
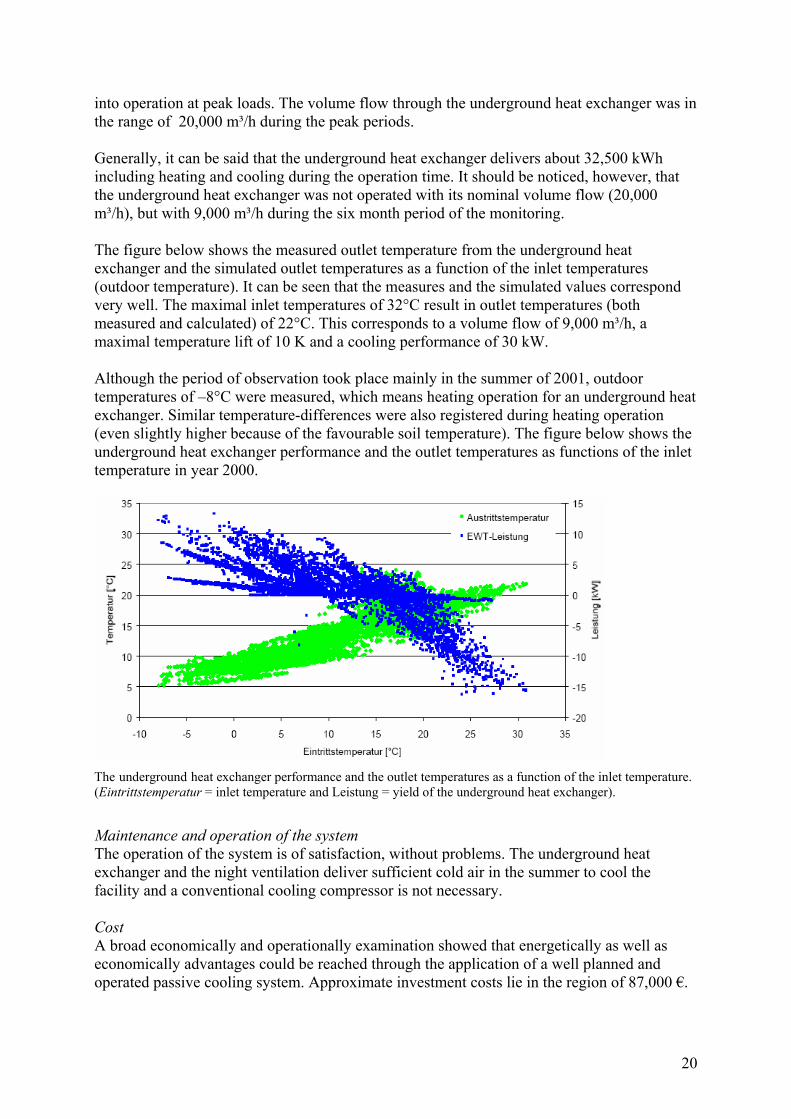
into operation at peak loads. The volume flow through the underground heat exchanger was in the range of 20,000 m³/h during the peak periods. Generally, it can be said that the underground heat exchanger delivers about 32,500 kWh including heating and cooling during the operation time. It should be noticed, however, that the underground heat exchanger was not operated with its nominal volume flow (20,000 m³/h), but with 9,000 m³/h during the six month period of the monitoring. The figure below shows the measured outlet temperature from the underground heat exchanger and the simulated outlet temperatures as a function of the inlet temperatures (outdoor temperature). It can be seen that the measures and the simulated values correspond very well. The maximal inlet temperatures of 32°C result in outlet temperatures (both measured and calculated) of 22°C. This corresponds to a volume flow of 9,000 m³/h, a maximal temperature lift of 10 K and a cooling performance of 30 kW. Although the period of observation took place mainly in the summer of 2001, outdoor temperatures of –8°C were measured, which means heating operation for an underground heat exchanger. Similar temperature-differences were also registered during heating operation (even slightly higher because of the favourable soil temperature). The figure below shows the underground heat exchanger performance and the outlet temperatures as functions of the inlet temperature in year 2000.
The underground heat exchanger performance and the outlet temperatures as a function of the inlet temperature. (Eintrittstemperatur = inlet temperature and Leistung = yield of the underground heat exchanger). Maintenance and operation of the system The operation of the system is of satisfaction, without problems. The underground heat exchanger and the night ventilation deliver sufficient cold air in the summer to cool the facility and a conventional cooling compressor is not necessary. Cost A broad economically and operationally examination showed that energetically as well as economically advantages could be reached through the application of a well planned and operated passive cooling system. Approximate investment costs lie in the region of 87,000 €.
21
It is not possible to state the value of the running costs, as these are presented as a part of the entire electricity consumption.
Description of the implementation process AEE INTEC was the initiator of implementing a sustainable energy concept for the refurbishment of the hall. A cooperation with an interested installing company and with the City of Gleisdorf, which has sustainability as is main focus, made this project successful.
Open questions and needs for future research An application of an underground heat exchanger is in this particular project a very good solution. Problems normally occur for heat exchangers of this size, since there is often a lack of space. Air to water underground heat exchangers are more and more being applied on the market, in comparison to the air to air heat exchanger. The water to air heat exchanger bring less hygienic problematic.
References Huber, Arthur (2001): „WKM_Version 2.0“ – PC Programm für Luft-Erdregister; Benutzerhandbuch. Huber Energietechnik, Zürich, 2001.
Fink et al. (2003): « Zuluftkonditionierung über einen luftdurchströmten Erdreichwärmetauscher für den Stadtsaal in Gleisdorf“.
22
Itoman City Hall
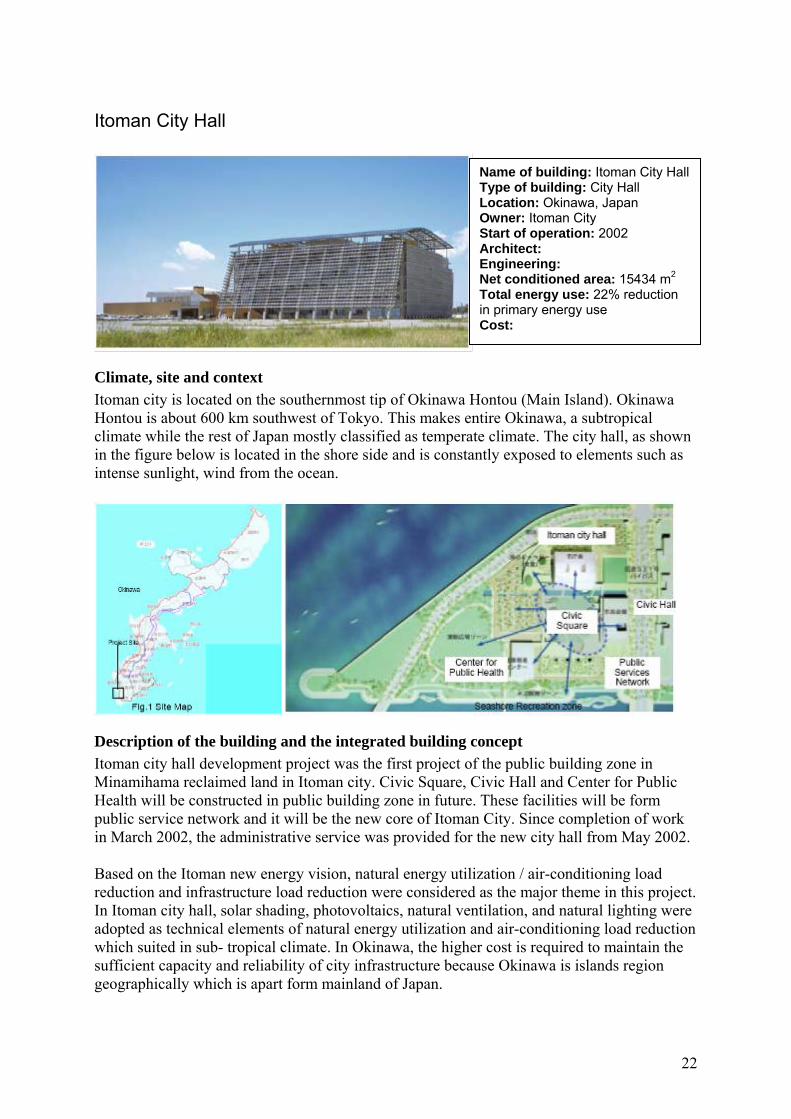
Climate, site and context Itoman city is located on the southernmost tip of Okinawa Hontou (Main Island). Okinawa Hontou is about 600 km southwest of Tokyo. This makes entire Okinawa, a subtropical climate while the rest of Japan mostly classified as temperate climate. The city hall, as shown in the figure below is located in the shore side and is constantly exposed to elements such as intense sunlight, wind from the ocean.
Description of the building and the integrated building concept Itoman city hall development project was the first project of the public building zone in Minamihama reclaimed land in Itoman city. Civic Square, Civic Hall and Center for Public Health will be constructed in public building zone in future. These facilities will be form public service network and it will be the new core of Itoman City. Since completion of work in March 2002, the administrative service was provided for the new city hall from May 2002. Based on the Itoman new energy vision, natural energy utilization / air-conditioning load reduction and infrastructure load reduction were considered as the major theme in this project. In Itoman city hall, solar shading, photovoltaics, natural ventilation, and natural lighting were adopted as technical elements of natural energy utilization and air-conditioning load reduction which suited in sub- tropical climate. In Okinawa, the higher cost is required to maintain the sufficient capacity and reliability of city infrastructure because Okinawa is islands region geographically which is apart form mainland of Japan.
Name of building: Itoman City Hall Type of building: City Hall Location: Okinawa, Japan Owner: Itoman City Start of operation: 2002 Architect: Engineering: Net conditioned area: 15434 m2 Total energy use: 22% reduction in primary energy use Cost:
23
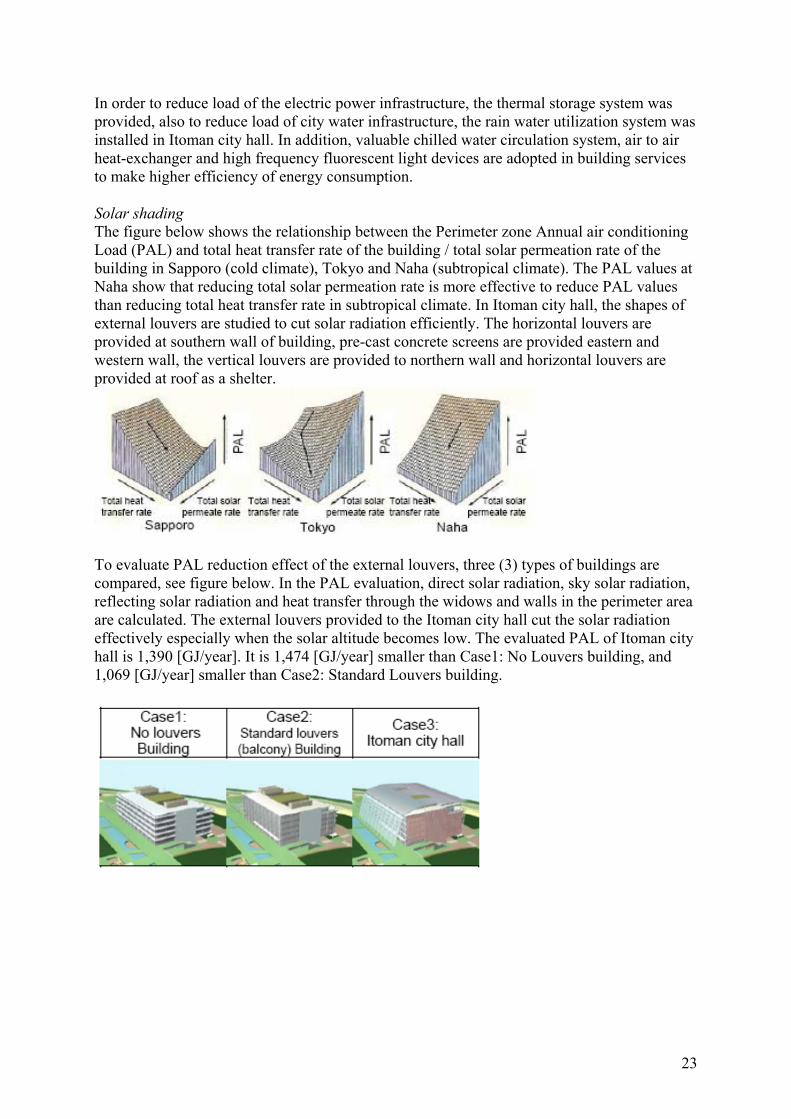
In order to reduce load of the electric power infrastructure, the thermal storage system was provided, also to reduce load of city water infrastructure, the rain water utilization system was installed in Itoman city hall. In addition, valuable chilled water circulation system, air to air heat-exchanger and high frequency fluorescent light devices are adopted in building services to make higher efficiency of energy consumption. Solar shading The figure below shows the relationship between the Perimeter zone Annual air conditioning Load (PAL) and total heat transfer rate of the building / total solar permeation rate of the building in Sapporo (cold climate), Tokyo and Naha (subtropical climate). The PAL values at Naha show that reducing total solar permeation rate is more effective to reduce PAL values than reducing total heat transfer rate in subtropical climate. In Itoman city hall, the shapes of external louvers are studied to cut solar radiation efficiently. The horizontal louvers are provided at southern wall of building, pre-cast concrete screens are provided eastern and western wall, the vertical louvers are provided to northern wall and horizontal louvers are provided at roof as a shelter.
To evaluate PAL reduction effect of the external louvers, three (3) types of buildings are compared, see figure below. In the PAL evaluation, direct solar radiation, sky solar radiation, reflecting solar radiation and heat transfer through the widows and walls in the perimeter area are calculated. The external louvers provided to the Itoman city hall cut the solar radiation effectively especially when the solar altitude becomes low. The evaluated PAL of Itoman city hall is 1,390 [GJ/year]. It is 1,474 [GJ/year] smaller than Case1: No Louvers building, and 1,069 [GJ/year] smaller than Case2: Standard Louvers building.
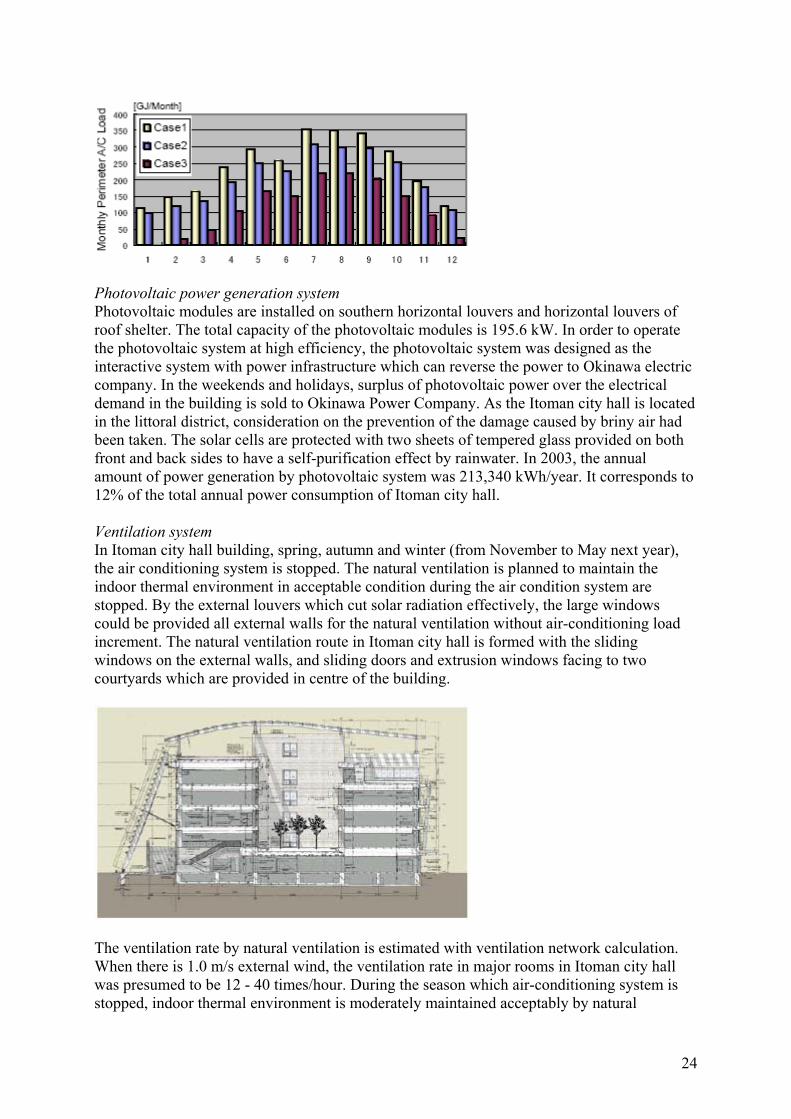
24
Photovoltaic power generation system Photovoltaic modules are installed on southern horizontal louvers and horizontal louvers of roof shelter. The total capacity of the photovoltaic modules is 195.6 kW. In order to operate the photovoltaic system at high efficiency, the photovoltaic system was designed as the interactive system with power infrastructure which can reverse the power to Okinawa electric company. In the weekends and holidays, surplus of photovoltaic power over the electrical demand in the building is sold to Okinawa Power Company. As the Itoman city hall is located in the littoral district, consideration on the prevention of the damage caused by briny air had been taken. The solar cells are protected with two sheets of tempered glass provided on both front and back sides to have a self-purification effect by rainwater. In 2003, the annual amount of power generation by photovoltaic system was 213,340 kWh/year. It corresponds to 12% of the total annual power consumption of Itoman city hall. Ventilation system In Itoman city hall building, spring, autumn and winter (from November to May next year), the air conditioning system is stopped. The natural ventilation is planned to maintain the indoor thermal environment in acceptable condition during the air condition system are stopped. By the external louvers which cut solar radiation effectively, the large windows could be provided all external walls for the natural ventilation without air-conditioning load increment. The natural ventilation route in Itoman city hall is formed with the sliding windows on the external walls, and sliding doors and extrusion windows facing to two courtyards which are provided in centre of the building.
The ventilation rate by natural ventilation is estimated with ventilation network calculation. When there is 1.0 m/s external wind, the ventilation rate in major rooms in Itoman city hall was presumed to be 12 - 40 times/hour. During the season which air-conditioning system is stopped, indoor thermal environment is moderately maintained acceptably by natural
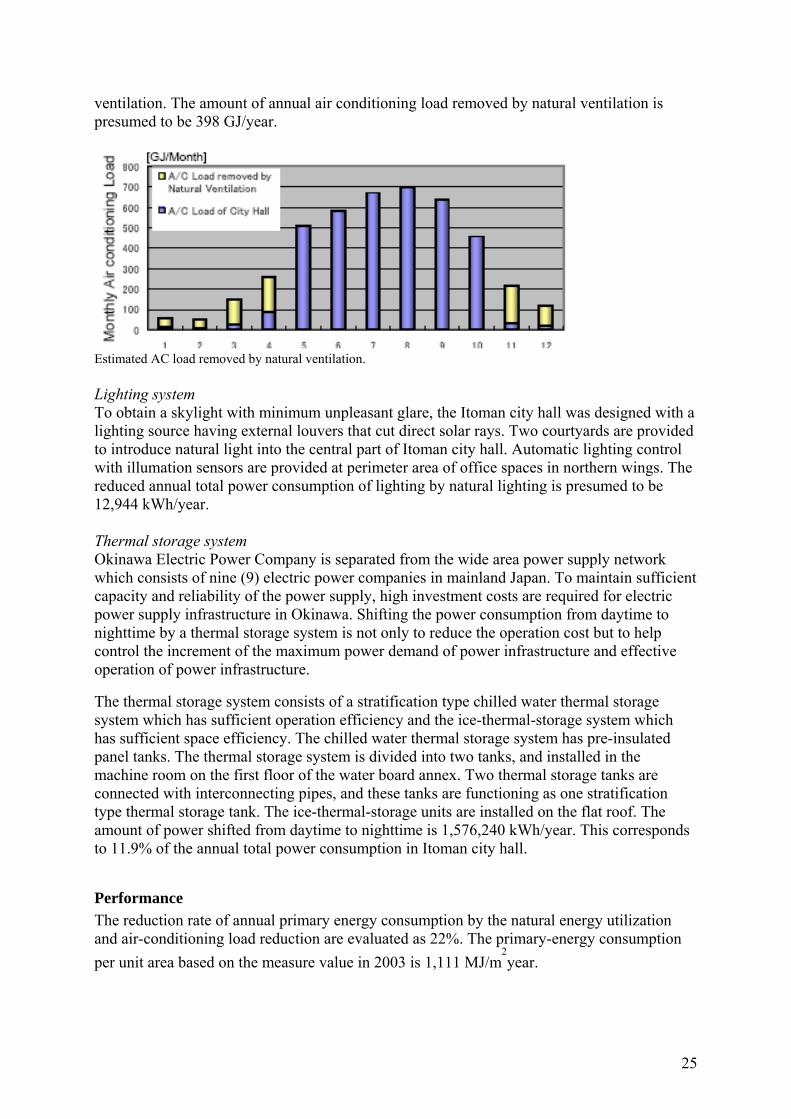
25
ventilation. The amount of annual air conditioning load removed by natural ventilation is presumed to be 398 GJ/year.
Estimated AC load removed by natural ventilation. Lighting system To obtain a skylight with minimum unpleasant glare, the Itoman city hall was designed with a lighting source having external louvers that cut direct solar rays. Two courtyards are provided to introduce natural light into the central part of Itoman city hall. Automatic lighting control with illumation sensors are provided at perimeter area of office spaces in northern wings. The reduced annual total power consumption of lighting by natural lighting is presumed to be 12,944 kWh/year. Thermal storage system Okinawa Electric Power Company is separated from the wide area power supply network which consists of nine (9) electric power companies in mainland Japan. To maintain sufficient capacity and reliability of the power supply, high investment costs are required for electric power supply infrastructure in Okinawa. Shifting the power consumption from daytime to nighttime by a thermal storage system is not only to reduce the operation cost but to help control the increment of the maximum power demand of power infrastructure and effective operation of power infrastructure. The thermal storage system consists of a stratification type chilled water thermal storage system which has sufficient operation efficiency and the ice-thermal-storage system which has sufficient space efficiency. The chilled water thermal storage system has pre-insulated panel tanks. The thermal storage system is divided into two tanks, and installed in the machine room on the first floor of the water board annex. Two thermal storage tanks are connected with interconnecting pipes, and these tanks are functioning as one stratification type thermal storage tank. The ice-thermal-storage units are installed on the flat roof. The amount of power shifted from daytime to nighttime is 1,576,240 kWh/year. This corresponds to 11.9% of the annual total power consumption in Itoman city hall.
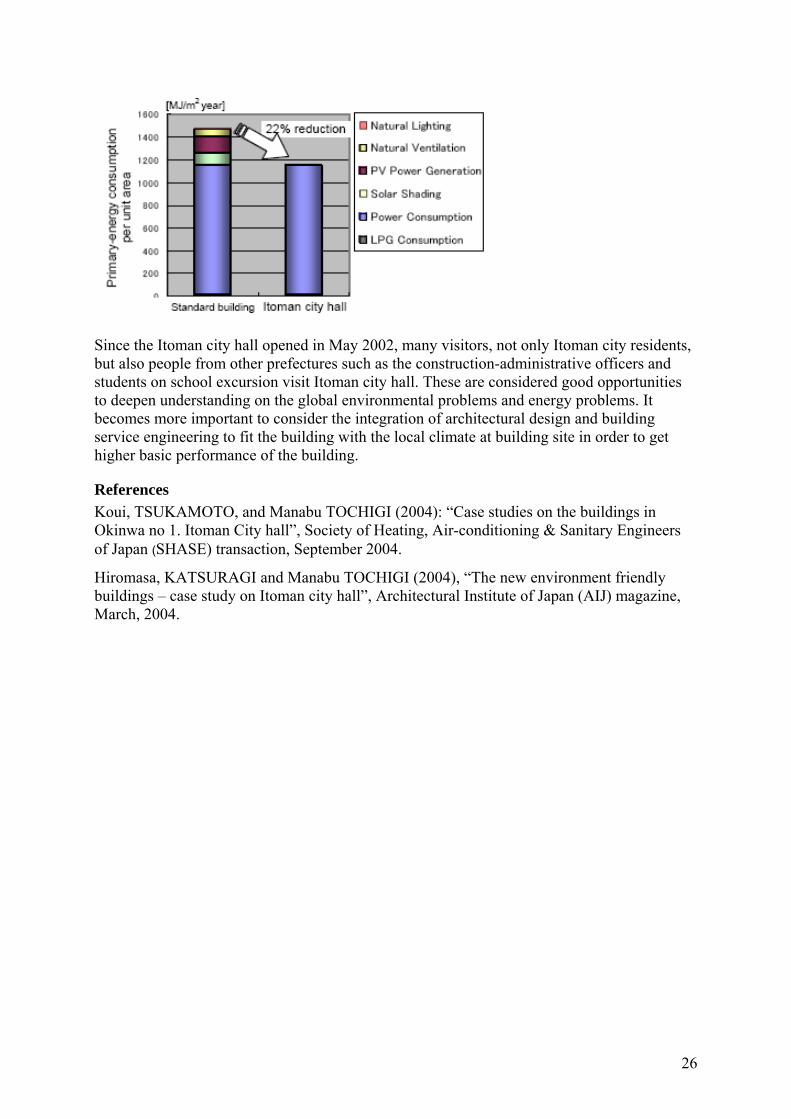
Performance The reduction rate of annual primary energy consumption by the natural energy utilization and air-conditioning load reduction are evaluated as 22%. The primary-energy consumption per unit area based on the measure value in 2003 is 1,111 MJ/m
2year.
26
Since the Itoman city hall opened in May 2002, many visitors, not only Itoman city residents, but also people from other prefectures such as the construction-administrative officers and students on school excursion visit Itoman city hall. These are considered good opportunities to deepen understanding on the global environmental problems and energy problems. It becomes more important to consider the integration of architectural design and building service engineering to fit the building with the local climate at building site in order to get higher basic performance of the building.
References Koui, TSUKAMOTO, and Manabu TOCHIGI (2004): “Case studies on the buildings in Okinwa no 1. Itoman City hall”, Society of Heating, Air-conditioning & Sanitary Engineers of Japan (SHASE) transaction, September 2004.
Hiromasa, KATSURAGI and Manabu TOCHIGI (2004), “The new environment friendly buildings – case study on Itoman city hall”, Architectural Institute of Japan (AIJ) magazine, March, 2004.
27
The Kansai Electric Power Building
Climate, site and context
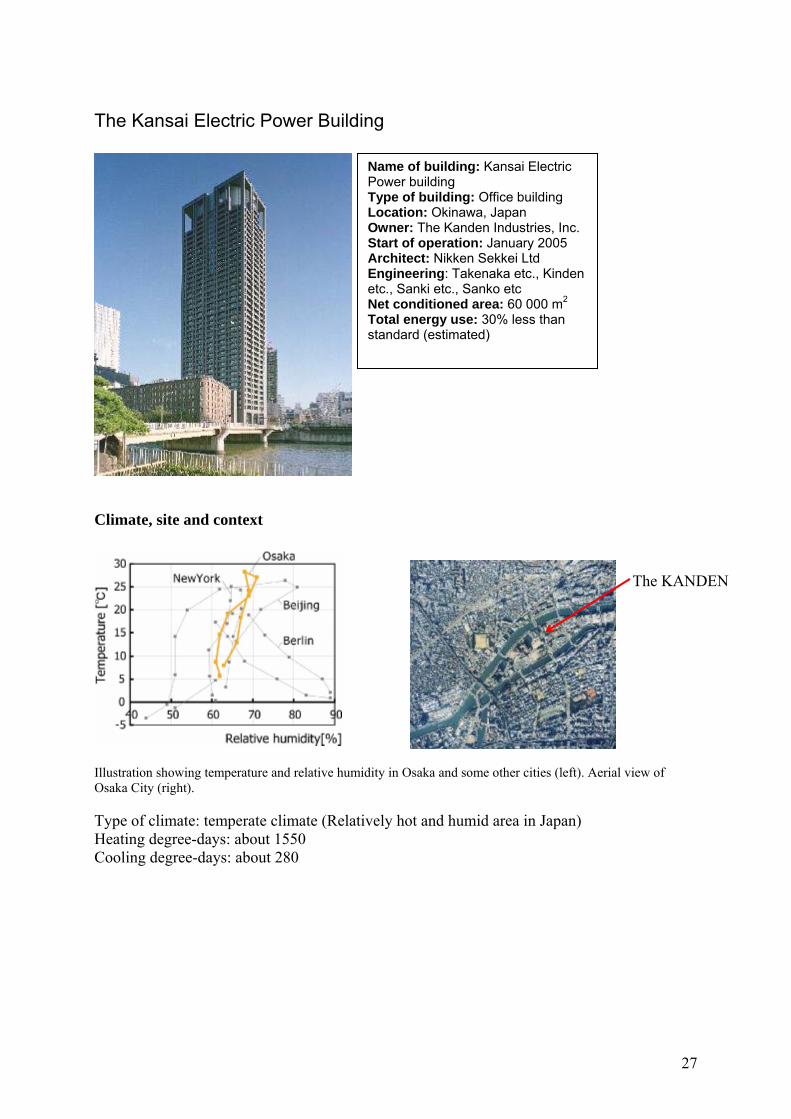
Illustration showing temperature and relative humidity in Osaka and some other cities (left). Aerial view of Osaka City (right).
Type of climate: temperate climate (Relatively hot and humid area in Japan) Heating degree-days: about 1550 Cooling degree-days: about 280
Name of building: Kansai Electric Power building Type of building: Office building Location: Okinawa, Japan Owner: The Kanden Industries, Inc. Start of operation: January 2005 Architect: Nikken Sekkei Ltd Engineering: Takenaka etc., Kinden etc., Sanki etc., Sanko etc Net conditioned area: 60 000 m2 Total energy use: 30% less than standard (estimated)
The KANDEN
28
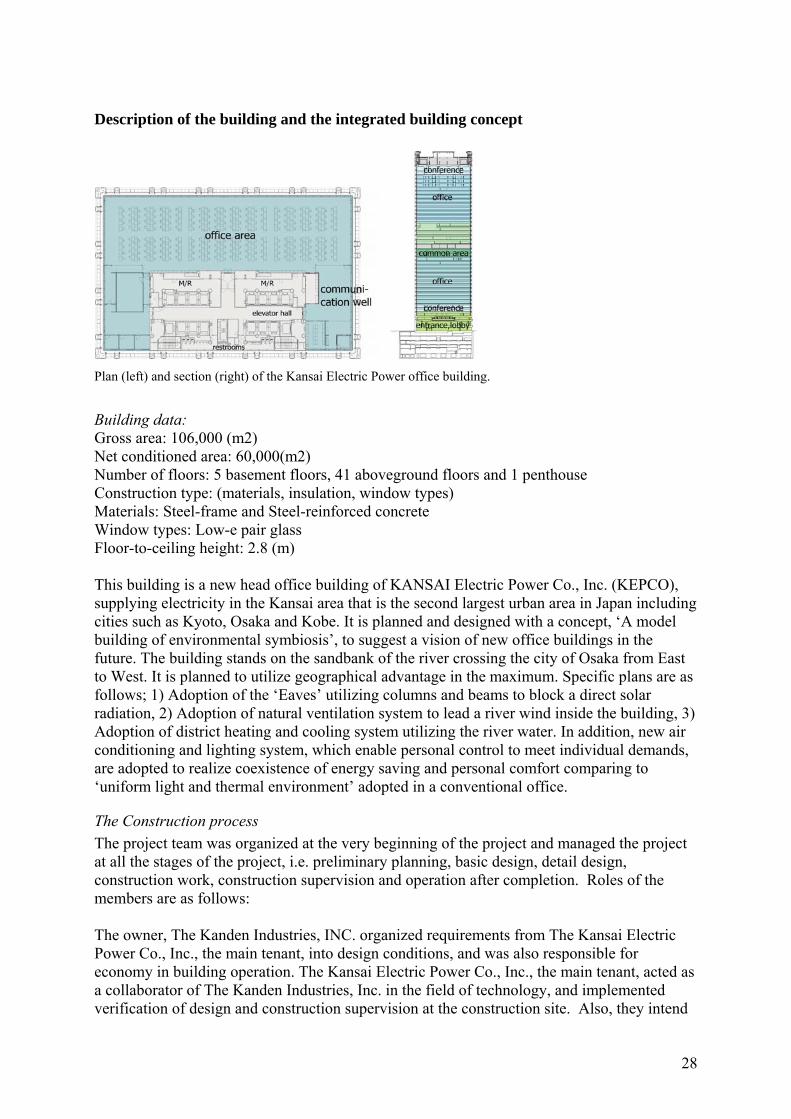
Description of the building and the integrated building concept
Plan (left) and section (right) of the Kansai Electric Power office building. Building data: Gross area: 106,000 (m2) Net conditioned area: 60,000(m2) Number of floors: 5 basement floors, 41 aboveground floors and 1 penthouse Construction type: (materials, insulation, window types) Materials: Steel-frame and Steel-reinforced concrete Window types: Low-e pair glass Floor-to-ceiling height: 2.8 (m) This building is a new head office building of KANSAI Electric Power Co., Inc. (KEPCO), supplying electricity in the Kansai area that is the second largest urban area in Japan including cities such as Kyoto, Osaka and Kobe. It is planned and designed with a concept, ‘A model building of environmental symbiosis’, to suggest a vision of new office buildings in the future. The building stands on the sandbank of the river crossing the city of Osaka from East to West. It is planned to utilize geographical advantage in the maximum. Specific plans are as follows; 1) Adoption of the ‘Eaves’ utilizing columns and beams to block a direct solar radiation, 2) Adoption of natural ventilation system to lead a river wind inside the building, 3) Adoption of district heating and cooling system utilizing the river water. In addition, new air conditioning and lighting system, which enable personal control to meet individual demands, are adopted to realize coexistence of energy saving and personal comfort comparing to ‘uniform light and thermal environment’ adopted in a conventional office.
The Construction process The project team was organized at the very beginning of the project and managed the project at all the stages of the project, i.e. preliminary planning, basic design, detail design, construction work, construction supervision and operation after completion. Roles of the members are as follows: The owner, The Kanden Industries, INC. organized requirements from The Kansai Electric Power Co., Inc., the main tenant, into design conditions, and was also responsible for economy in building operation. The Kansai Electric Power Co., Inc., the main tenant, acted as a collaborator of The Kanden Industries, Inc. in the field of technology, and implemented verification of design and construction supervision at the construction site. Also, they intend
29
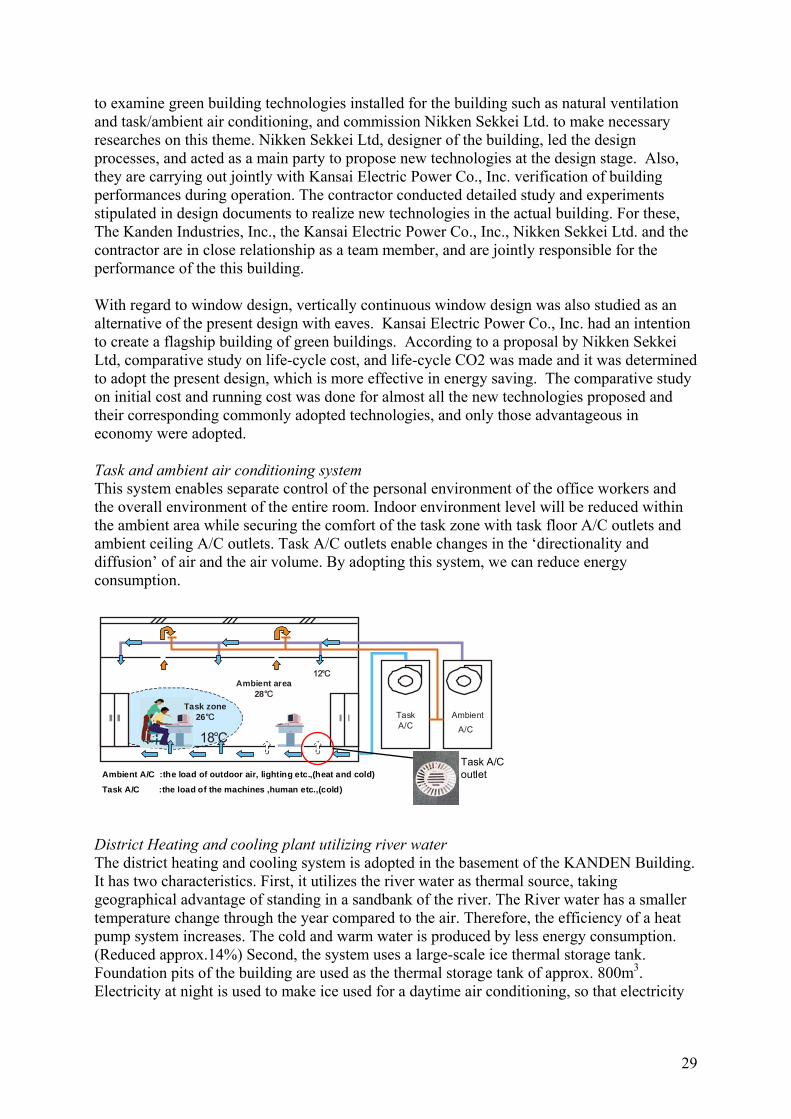
to examine green building technologies installed for the building such as natural ventilation and task/ambient air conditioning, and commission Nikken Sekkei Ltd. to make necessary researches on this theme. Nikken Sekkei Ltd, designer of the building, led the design processes, and acted as a main party to propose new technologies at the design stage. Also, they are carrying out jointly with Kansai Electric Power Co., Inc. verification of building performances during operation. The contractor conducted detailed study and experiments stipulated in design documents to realize new technologies in the actual building. For these, The Kanden Industries, Inc., the Kansai Electric Power Co., Inc., Nikken Sekkei Ltd. and the contractor are in close relationship as a team member, and are jointly responsible for the performance of the this building. With regard to window design, vertically continuous window design was also studied as an alternative of the present design with eaves. Kansai Electric Power Co., Inc. had an intention to create a flagship building of green buildings. According to a proposal by Nikken Sekkei Ltd, comparative study on life-cycle cost, and life-cycle CO2 was made and it was determined to adopt the present design, which is more effective in energy saving. The comparative study on initial cost and running cost was done for almost all the new technologies proposed and their corresponding commonly adopted technologies, and only those advantageous in economy were adopted. Task and ambient air conditioning system This system enables separate control of the personal environment of the office workers and the overall environment of the entire room. Indoor environment level will be reduced within the ambient area while securing the comfort of the task zone with task floor A/C outlets and ambient ceiling A/C outlets. Task A/C outlets enable changes in the ‘directionality and diffusion’ of air and the air volume. By adopting this system, we can reduce energy consumption.
Ambient area28℃
Task zone26℃
12℃
18℃ TaskA/C
Ambient
A/C
Ambient A/C :the load of outdoor air, lighting etc.,(heat and cold)
Task A/C :the load of the machines ,human etc.,(cold)
Task A/C outlet
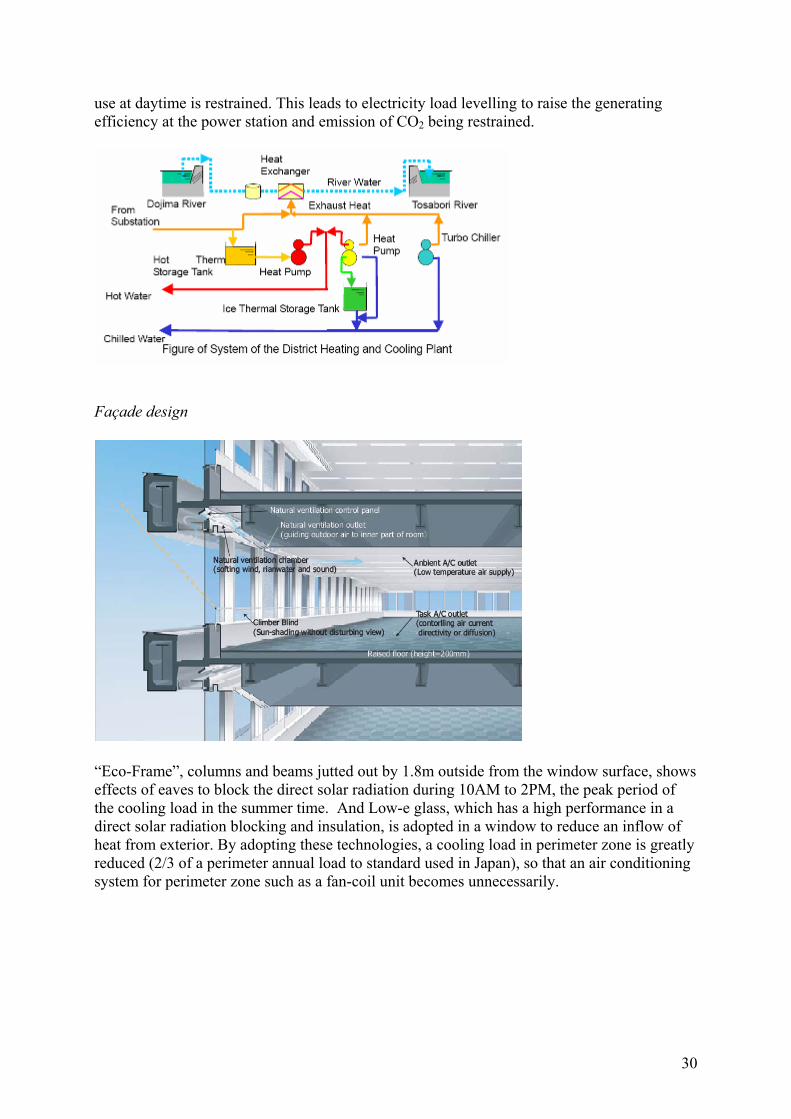
District Heating and cooling plant utilizing river water The district heating and cooling system is adopted in the basement of the KANDEN Building. It has two characteristics. First, it utilizes the river water as thermal source, taking geographical advantage of standing in a sandbank of the river. The River water has a smaller temperature change through the year compared to the air. Therefore, the efficiency of a heat pump system increases. The cold and warm water is produced by less energy consumption. (Reduced approx.14%) Second, the system uses a large-scale ice thermal storage tank. Foundation pits of the building are used as the thermal storage tank of approx. 800m3. Electricity at night is used to make ice used for a daytime air conditioning, so that electricity
30
use at daytime is restrained. This leads to electricity load levelling to raise the generating efficiency at the power station and emission of CO2 being restrained.
Façade design
“Eco-Frame”, columns and beams jutted out by 1.8m outside from the window surface, shows effects of eaves to block the direct solar radiation during 10AM to 2PM, the peak period of the cooling load in the summer time. And Low-e glass, which has a high performance in a direct solar radiation blocking and insulation, is adopted in a window to reduce an inflow of heat from exterior. By adopting these technologies, a cooling load in perimeter zone is greatly reduced (2/3 of a perimeter annual load to standard used in Japan), so that an air conditioning system for perimeter zone such as a fan-coil unit becomes unnecessarily.
31
Ventilation system
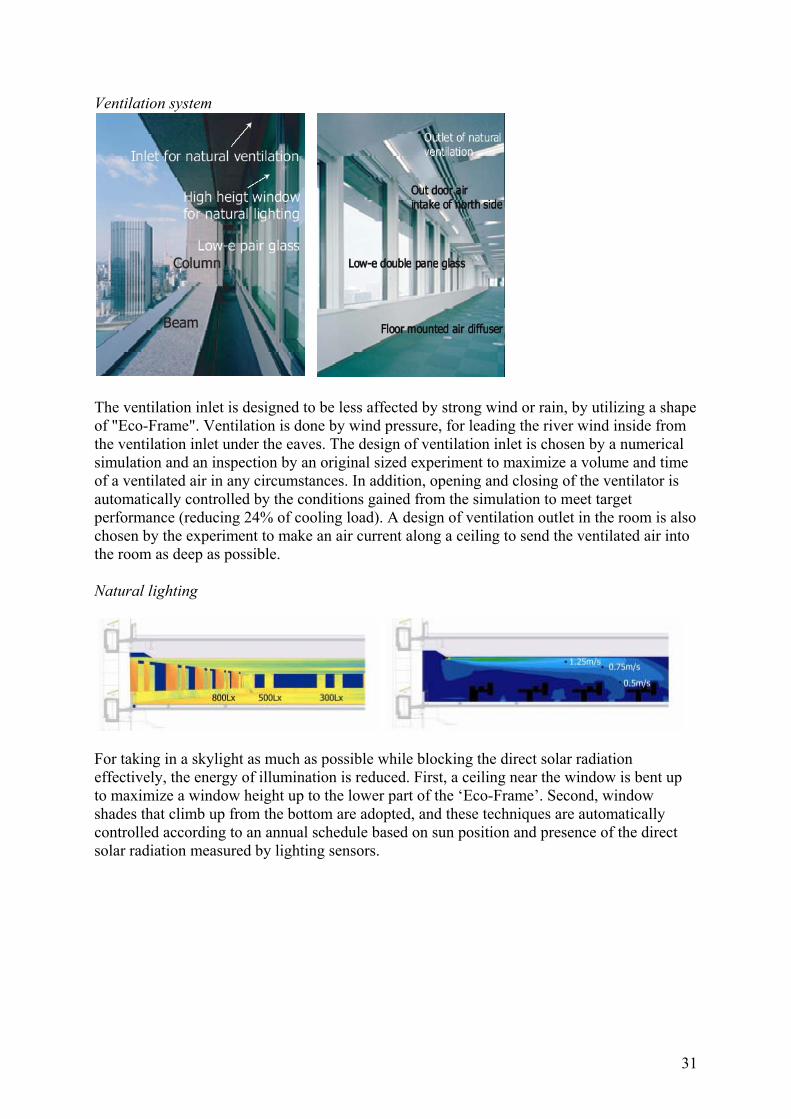
The ventilation inlet is designed to be less affected by strong wind or rain, by utilizing a shape of "Eco-Frame". Ventilation is done by wind pressure, for leading the river wind inside from the ventilation inlet under the eaves. The design of ventilation inlet is chosen by a numerical simulation and an inspection by an original sized experiment to maximize a volume and time of a ventilated air in any circumstances. In addition, opening and closing of the ventilator is automatically controlled by the conditions gained from the simulation to meet target performance (reducing 24% of cooling load). A design of ventilation outlet in the room is also chosen by the experiment to make an air current along a ceiling to send the ventilated air into the room as deep as possible. Natural lighting
For taking in a skylight as much as possible while blocking the direct solar radiation effectively, the energy of illumination is reduced. First, a ceiling near the window is bent up to maximize a window height up to the lower part of the ‘Eco-Frame’. Second, window shades that climb up from the bottom are adopted, and these techniques are automatically controlled according to an annual schedule based on sun position and presence of the direct solar radiation measured by lighting sensors.
32
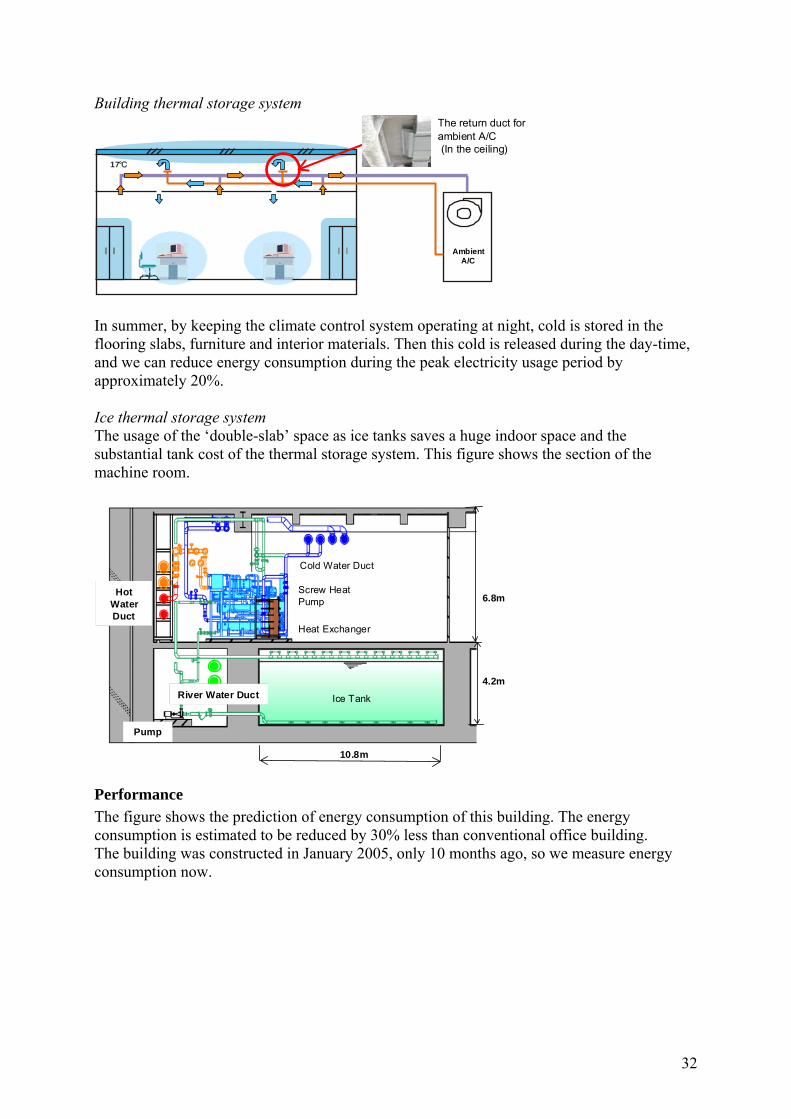
Building thermal storage system
17℃
AmbientA/C
The return duct forambient A/C (In the ceiling)
In summer, by keeping the climate control system operating at night, cold is stored in the flooring slabs, furniture and interior materials. Then this cold is released during the day-time, and we can reduce energy consumption during the peak electricity usage period by approximately 20%. Ice thermal storage system The usage of the ‘double-slab’ space as ice tanks saves a huge indoor space and the substantial tank cost of the thermal storage system. This figure shows the section of the machine room.
Pump
Ice Tank
Heat Exchanger
HotWaterDuct
Cold Water Duct
4.2m
6.8mScrew HeatPump
10.8m
River Water Duct
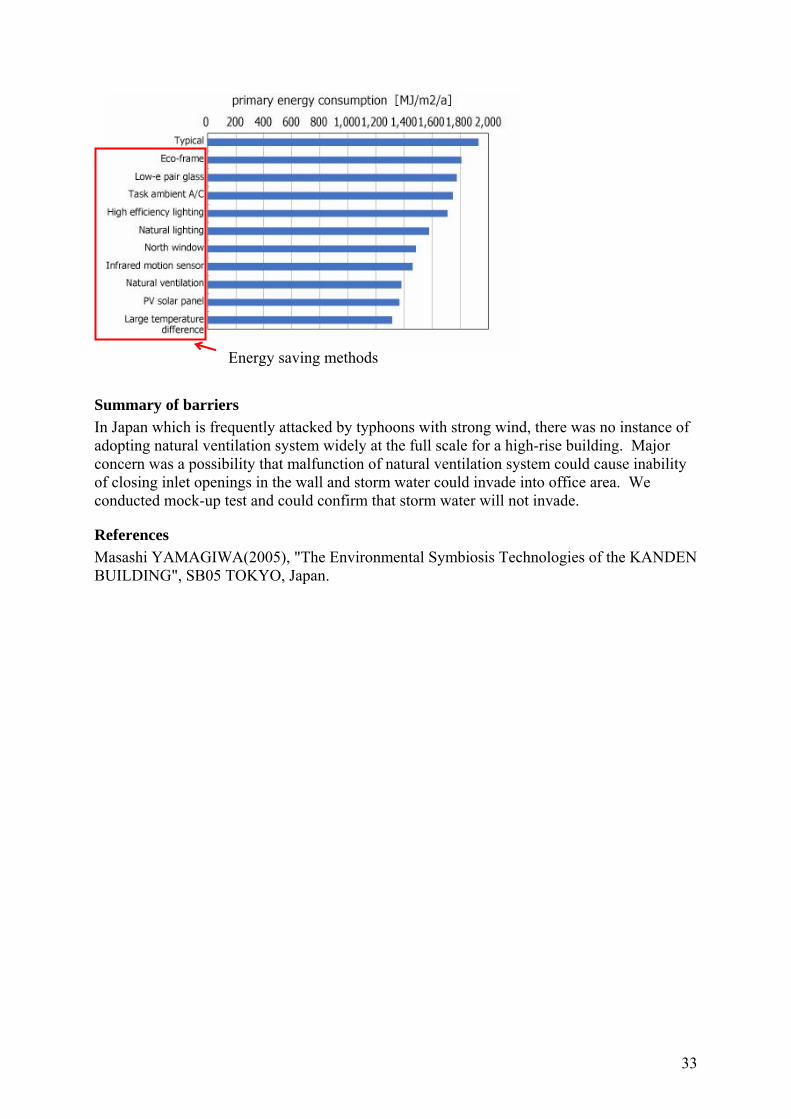
Performance The figure shows the prediction of energy consumption of this building. The energy consumption is estimated to be reduced by 30% less than conventional office building. The building was constructed in January 2005, only 10 months ago, so we measure energy consumption now.
33
Summary of barriers In Japan which is frequently attacked by typhoons with strong wind, there was no instance of adopting natural ventilation system widely at the full scale for a high-rise building. Major concern was a possibility that malfunction of natural ventilation system could cause inability of closing inlet openings in the wall and storm water could invade into office area. We conducted mock-up test and could confirm that storm water will not invade.
References Masashi YAMAGIWA(2005), "The Environmental Symbiosis Technologies of the KANDEN BUILDING", SB05 TOKYO, Japan.
Energy saving methods
34
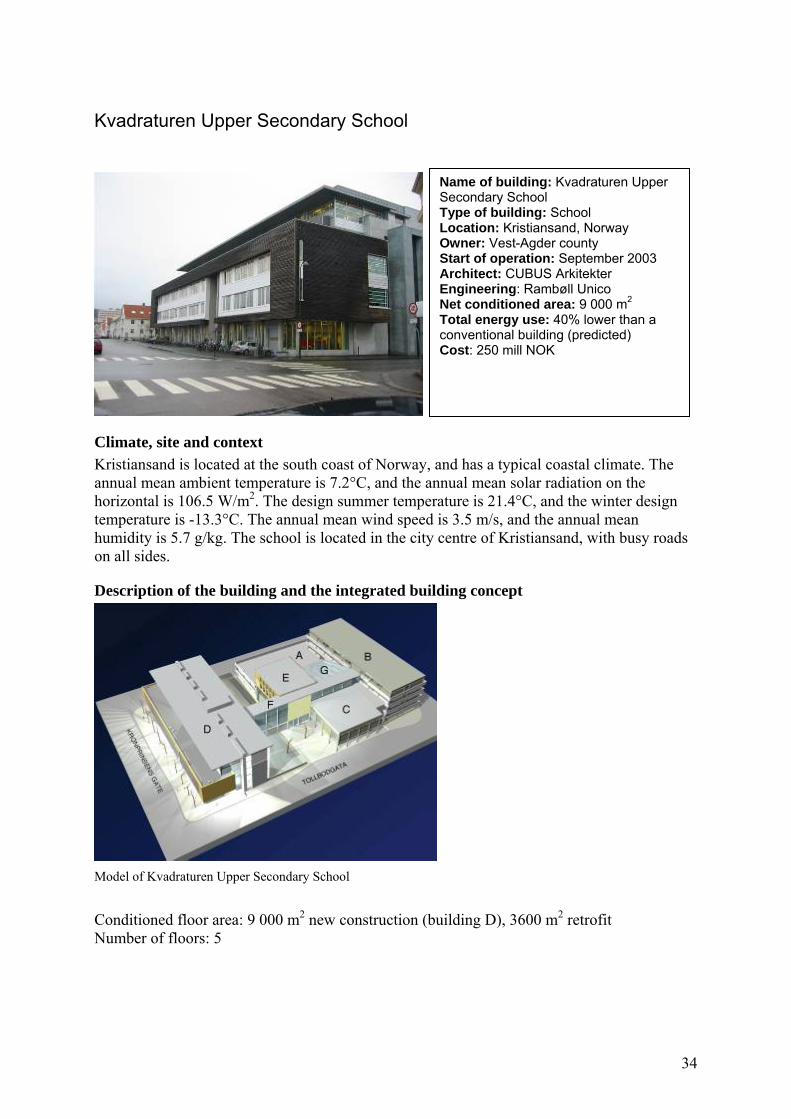
Kvadraturen Upper Secondary School
Climate, site and context Kristiansand is located at the south coast of Norway, and has a typical coastal climate. The annual mean ambient temperature is 7.2°C, and the annual mean solar radiation on the horizontal is 106.5 W/m2. The design summer temperature is 21.4°C, and the winter design temperature is -13.3°C. The annual mean wind speed is 3.5 m/s, and the annual mean humidity is 5.7 g/kg. The school is located in the city centre of Kristiansand, with busy roads on all sides.
Description of the building and the integrated building concept
Model of Kvadraturen Upper Secondary School Conditioned floor area: 9 000 m2 new construction (building D), 3600 m2 retrofit Number of floors: 5
Name of building: Kvadraturen Upper Secondary School Type of building: School Location: Kristiansand, Norway Owner: Vest-Agder county Start of operation: September 2003 Architect: CUBUS Arkitekter Engineering: Rambøll Unico Net conditioned area: 9 000 m2 Total energy use: 40% lower than a conventional building (predicted) Cost: 250 mill NOK
35
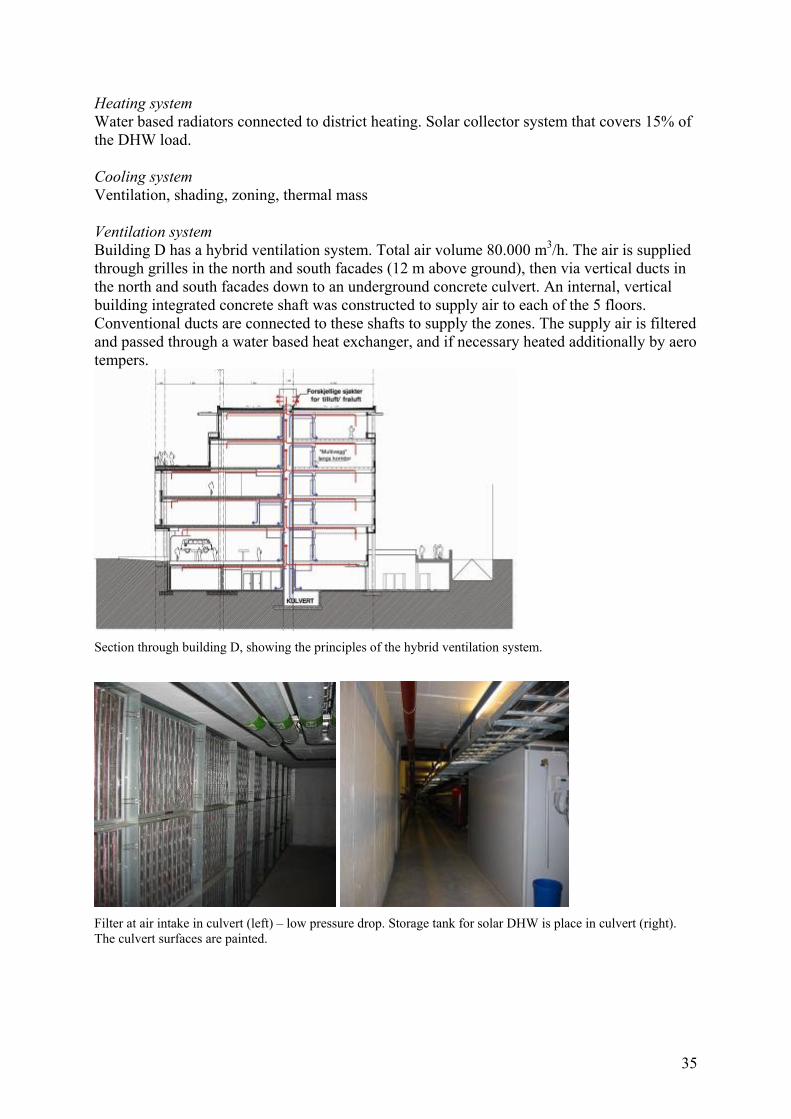
Heating system Water based radiators connected to district heating. Solar collector system that covers 15% of the DHW load. Cooling system Ventilation, shading, zoning, thermal mass Ventilation system Building D has a hybrid ventilation system. Total air volume 80.000 m3/h. The air is supplied through grilles in the north and south facades (12 m above ground), then via vertical ducts in the north and south facades down to an underground concrete culvert. An internal, vertical building integrated concrete shaft was constructed to supply air to each of the 5 floors. Conventional ducts are connected to these shafts to supply the zones. The supply air is filtered and passed through a water based heat exchanger, and if necessary heated additionally by aero tempers.
Section through building D, showing the principles of the hybrid ventilation system.
Filter at air intake in culvert (left) – low pressure drop. Storage tank for solar DHW is place in culvert (right). The culvert surfaces are painted.
36
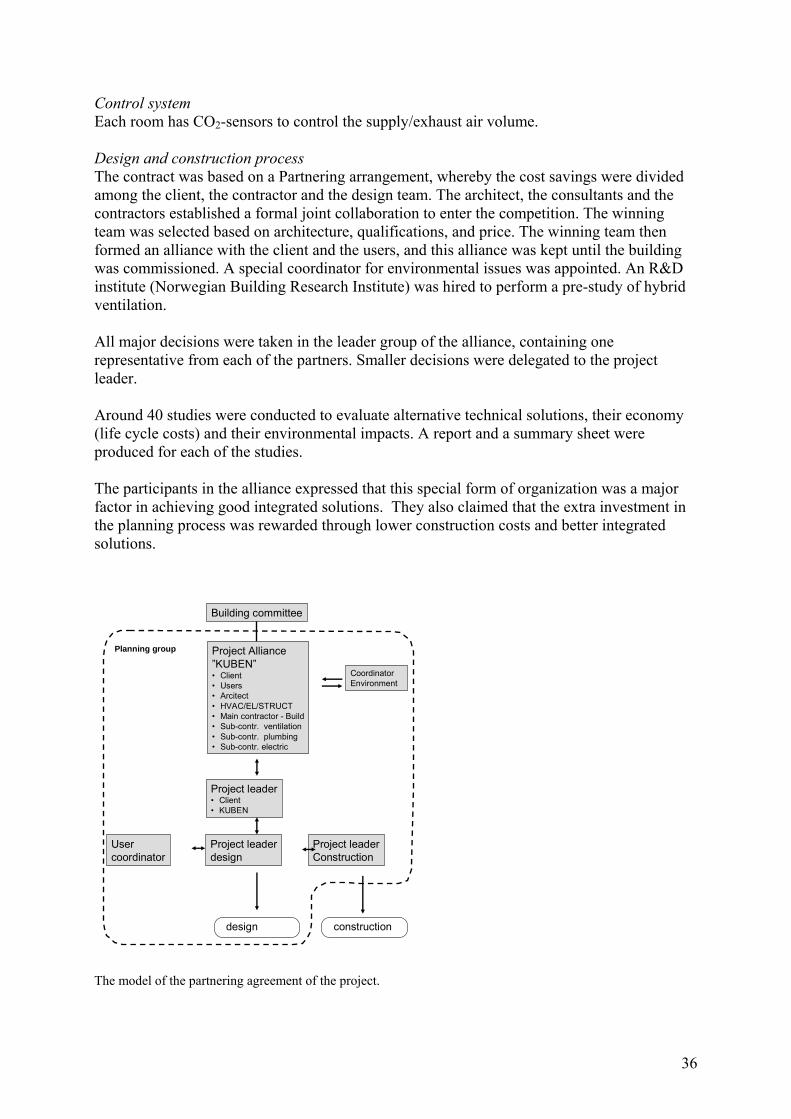
Control system Each room has CO2-sensors to control the supply/exhaust air volume. Design and construction process The contract was based on a Partnering arrangement, whereby the cost savings were divided among the client, the contractor and the design team. The architect, the consultants and the contractors established a formal joint collaboration to enter the competition. The winning team was selected based on architecture, qualifications, and price. The winning team then formed an alliance with the client and the users, and this alliance was kept until the building was commissioned. A special coordinator for environmental issues was appointed. An R&D institute (Norwegian Building Research Institute) was hired to perform a pre-study of hybrid ventilation. All major decisions were taken in the leader group of the alliance, containing one representative from each of the partners. Smaller decisions were delegated to the project leader. Around 40 studies were conducted to evaluate alternative technical solutions, their economy (life cycle costs) and their environmental impacts. A report and a summary sheet were produced for each of the studies. The participants in the alliance expressed that this special form of organization was a major factor in achieving good integrated solutions. They also claimed that the extra investment in the planning process was rewarded through lower construction costs and better integrated solutions.
Building committee
Project Alliance”KUBEN”• Client• Users• Arcitect• HVAC/EL/STRUCT• Main contractor - Build• Sub-contr. ventilation• Sub-contr. plumbing• Sub-contr. electric
Project leader• Client• KUBEN
CoordinatorEnvironment
Usercoordinator
Project leaderdesign
Project leaderConstruction
design construction
Planning group
The model of the partnering agreement of the project.
37
Performance The energy use was predicted to be 40% lower than for a conventional new school building. The project was finished ahead of schedule and at a lower cost than estimated. The estimated cost was 279 mill NOK, while the final cost was 250 mill NOK. The discounted annual costs of the hybrid ventilation system were calculated to be 7% lower than a conventional system (with an energy price of 0.50 NOK/kWh and a discount rate of 7%). The main reason to this was reduced energy use for fans.
Summary of barriers • Little knowledge and experience with hybrid ventilation systems with embedded culverts. • Little experience with this kind of partnering work.
Open questions and needs for future research • Detailed measurements and simulation of the performance of the hybrid ventilation
system.
References Buvik, K. (2003), ”Miljøvennlige skoleanlegg. 5 skoler med tilknytning til programmet Økobygg”, Læringssenteret, http://skoleanlegg.ls.no, Oslo, Norway. Wigenstad, T. (2004). “Evaluering av Kvadraturen videregående skole – energi og miljø”, SINTEF Report STF22 A04513, Trondheim, Norway.
38
Kvernhuset Lower Secondary School
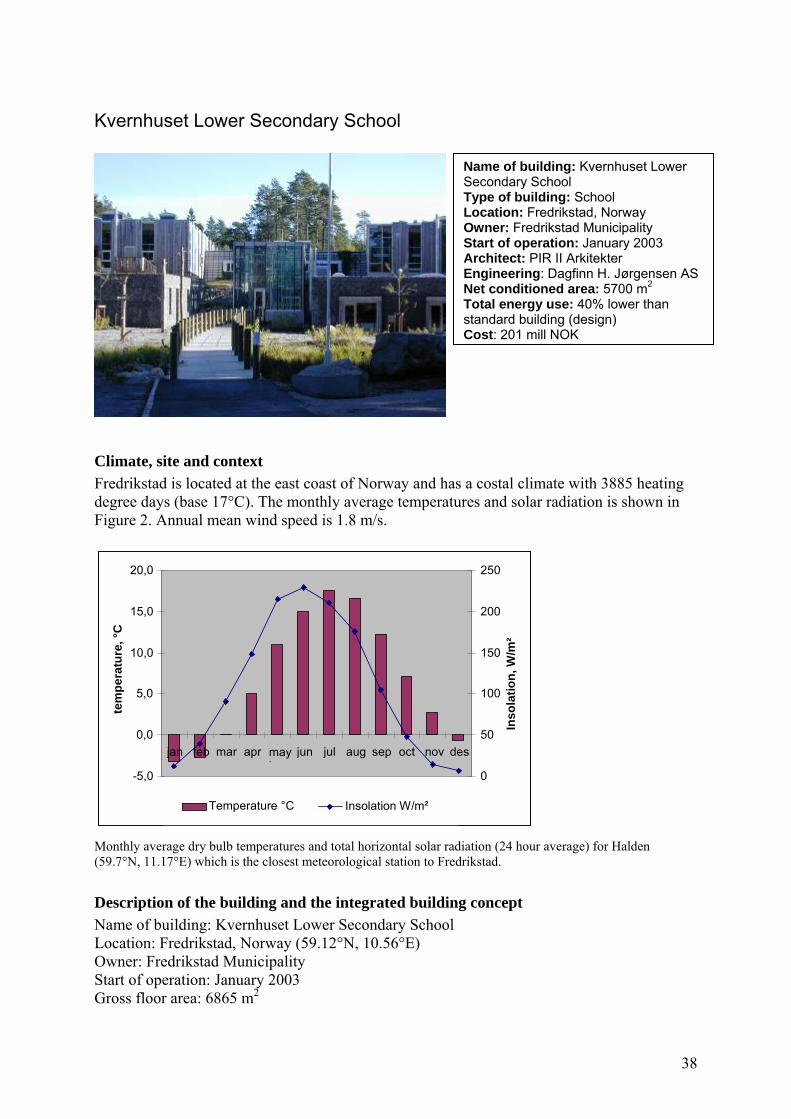
Climate, site and context Fredrikstad is located at the east coast of Norway and has a costal climate with 3885 heating degree days (base 17°C). The monthly average temperatures and solar radiation is shown in Figure 2. Annual mean wind speed is 1.8 m/s.
-5,0
0,0
5,0
10,0
15,0
20,0
jan feb mar apr mayi
jun jul aug sep oct nov des
tem
pera
ture
, °C
0
50
100
150
200
250
Inso
latio
n, W
/m²
Temperature °C Insolation W/m²
Monthly average dry bulb temperatures and total horizontal solar radiation (24 hour average) for Halden (59.7°N, 11.17°E) which is the closest meteorological station to Fredrikstad.
Description of the building and the integrated building concept Name of building: Kvernhuset Lower Secondary School Location: Fredrikstad, Norway (59.12°N, 10.56°E) Owner: Fredrikstad Municipality Start of operation: January 2003 Gross floor area: 6865 m2
Name of building: Kvernhuset Lower Secondary School Type of building: School Location: Fredrikstad, Norway Owner: Fredrikstad Municipality Start of operation: January 2003 Architect: PIR II Arkitekter Engineering: Dagfinn H. Jørgensen AS Net conditioned area: 5700 m2 Total energy use: 40% lower than standard building (design) Cost: 201 mill NOK
39
Net conditioned area: 5700 m2
Number of floors: 2 Number of pupils: 450-500 Operation time: The school is operated 5 days a week (06-22) all year around, except for 7 weeks during summer for the teaching space (2nd floor), and 4 weeks for the office space.
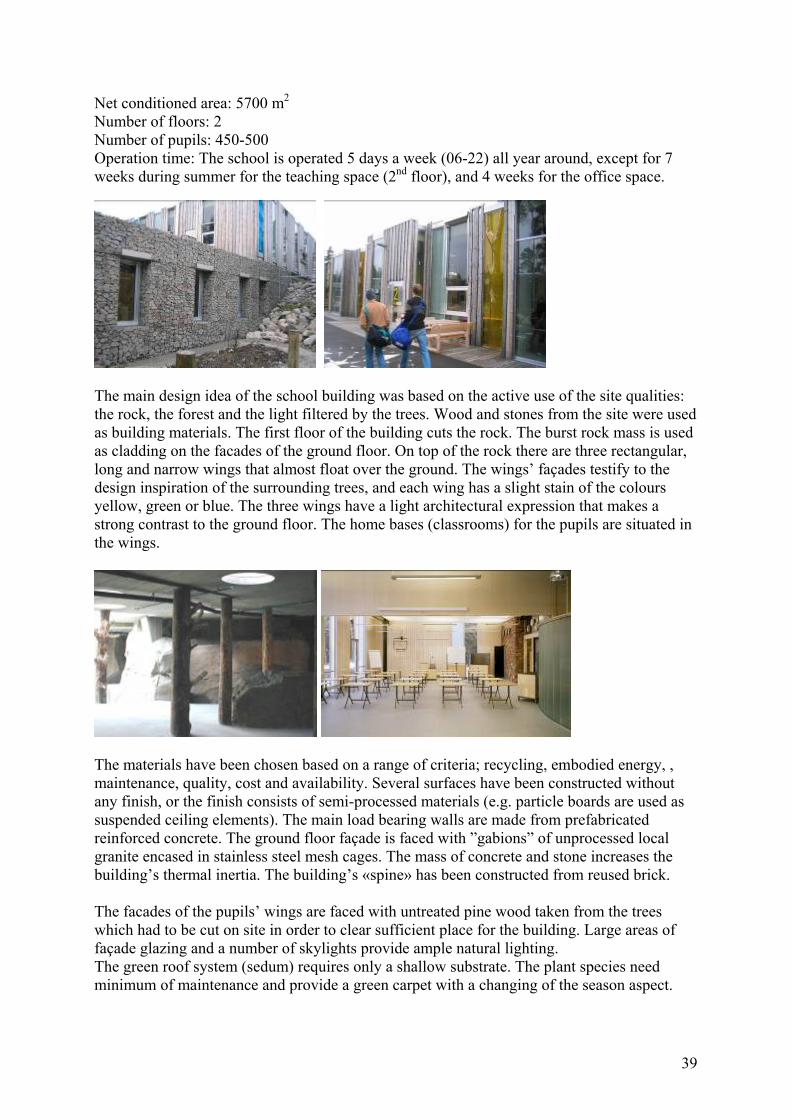
The main design idea of the school building was based on the active use of the site qualities: the rock, the forest and the light filtered by the trees. Wood and stones from the site were used as building materials. The first floor of the building cuts the rock. The burst rock mass is used as cladding on the facades of the ground floor. On top of the rock there are three rectangular, long and narrow wings that almost float over the ground. The wings’ façades testify to the design inspiration of the surrounding trees, and each wing has a slight stain of the colours yellow, green or blue. The three wings have a light architectural expression that makes a strong contrast to the ground floor. The home bases (classrooms) for the pupils are situated in the wings.
The materials have been chosen based on a range of criteria; recycling, embodied energy, , maintenance, quality, cost and availability. Several surfaces have been constructed without any finish, or the finish consists of semi-processed materials (e.g. particle boards are used as suspended ceiling elements). The main load bearing walls are made from prefabricated reinforced concrete. The ground floor façade is faced with ”gabions” of unprocessed local granite encased in stainless steel mesh cages. The mass of concrete and stone increases the building’s thermal inertia. The building’s «spine» has been constructed from reused brick. The facades of the pupils’ wings are faced with untreated pine wood taken from the trees which had to be cut on site in order to clear sufficient place for the building. Large areas of façade glazing and a number of skylights provide ample natural lighting. The green roof system (sedum) requires only a shallow substrate. The plant species need minimum of maintenance and provide a green carpet with a changing of the season aspect.
40
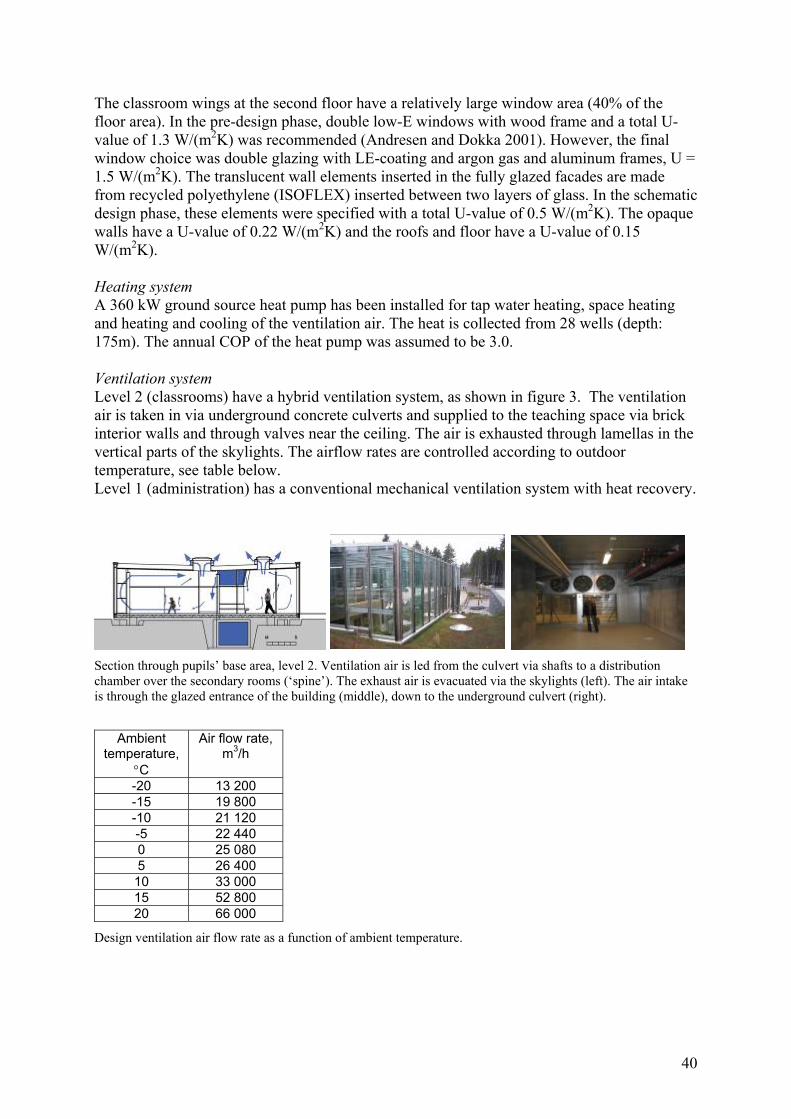
The classroom wings at the second floor have a relatively large window area (40% of the floor area). In the pre-design phase, double low-E windows with wood frame and a total U-value of 1.3 W/(m2K) was recommended (Andresen and Dokka 2001). However, the final window choice was double glazing with LE-coating and argon gas and aluminum frames, U = 1.5 W/(m2K). The translucent wall elements inserted in the fully glazed facades are made from recycled polyethylene (ISOFLEX) inserted between two layers of glass. In the schematic design phase, these elements were specified with a total U-value of 0.5 W/(m2K). The opaque walls have a U-value of 0.22 W/(m2K) and the roofs and floor have a U-value of 0.15 W/(m2K). Heating system A 360 kW ground source heat pump has been installed for tap water heating, space heating and heating and cooling of the ventilation air. The heat is collected from 28 wells (depth: 175m). The annual COP of the heat pump was assumed to be 3.0. Ventilation system Level 2 (classrooms) have a hybrid ventilation system, as shown in figure 3. The ventilation air is taken in via underground concrete culverts and supplied to the teaching space via brick interior walls and through valves near the ceiling. The air is exhausted through lamellas in the vertical parts of the skylights. The airflow rates are controlled according to outdoor temperature, see table below. Level 1 (administration) has a conventional mechanical ventilation system with heat recovery.
Section through pupils’ base area, level 2. Ventilation air is led from the culvert via shafts to a distribution chamber over the secondary rooms (‘spine’). The exhaust air is evacuated via the skylights (left). The air intake is through the glazed entrance of the building (middle), down to the underground culvert (right).
Ambient
temperature, °C
Air flow rate, m3/h
-20 13 200 -15 19 800 -10 21 120 -5 22 440 0 25 080 5 26 400 10 33 000 15 52 800 20 66 000
Design ventilation air flow rate as a function of ambient temperature.
41
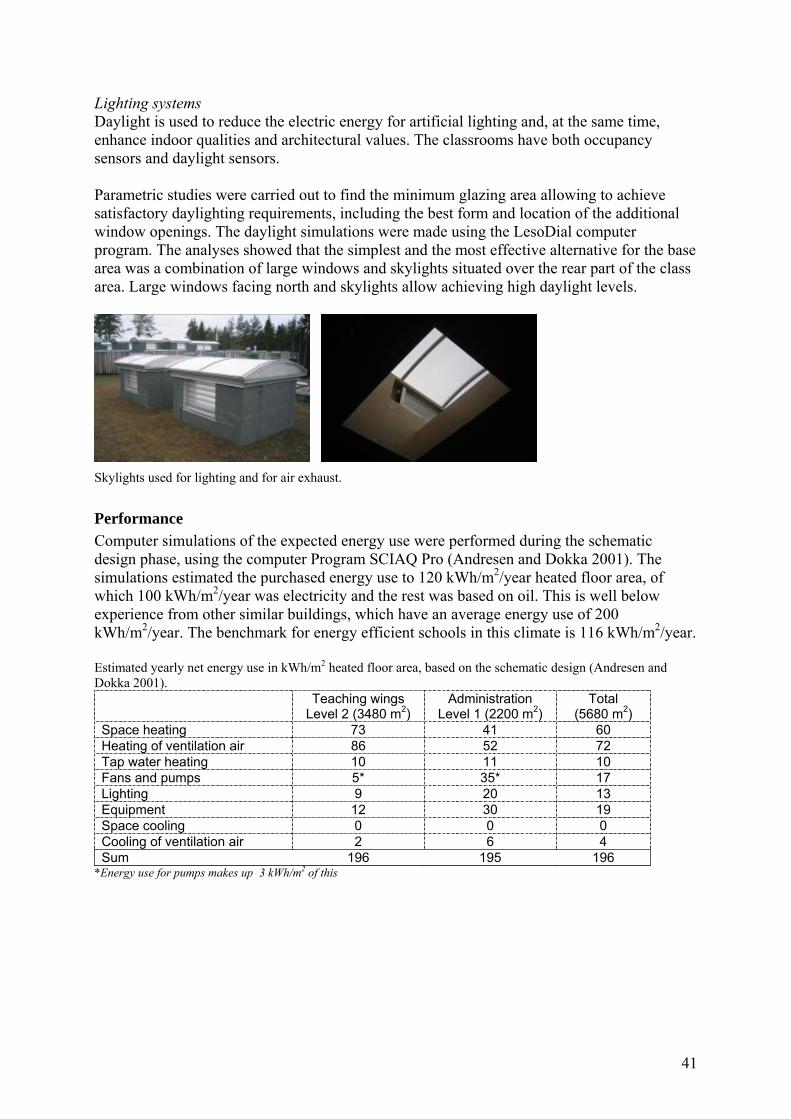
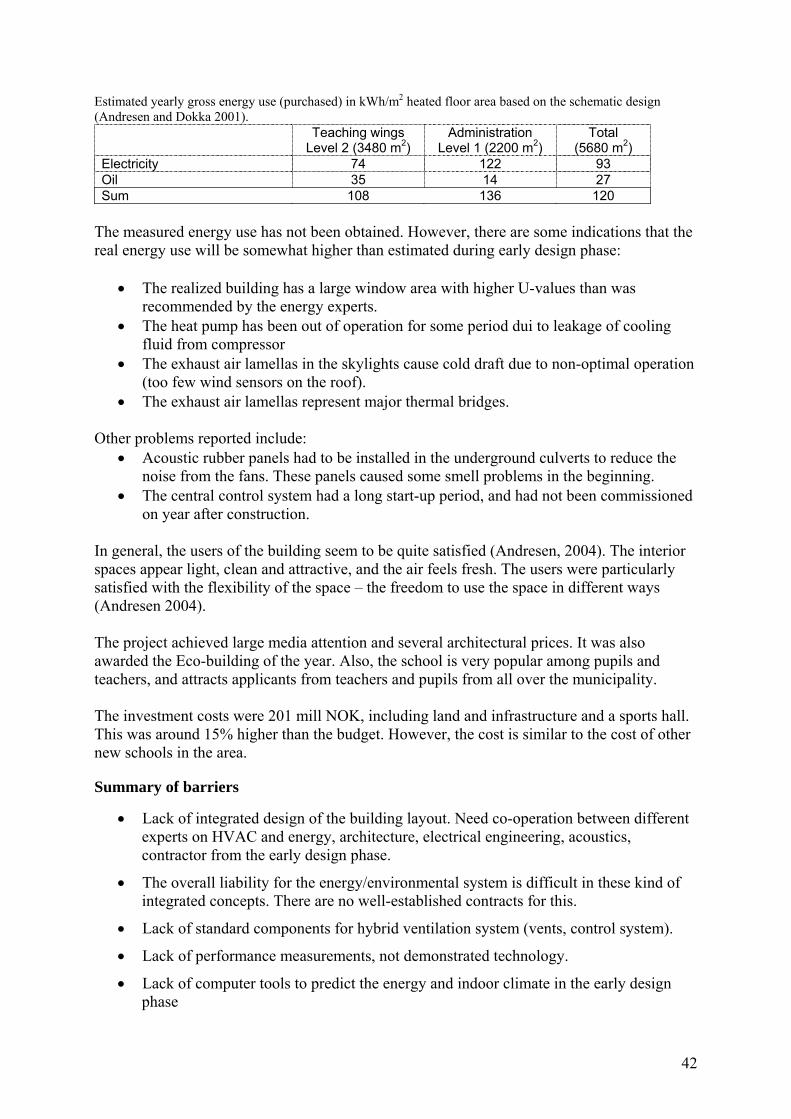
Lighting systems Daylight is used to reduce the electric energy for artificial lighting and, at the same time, enhance indoor qualities and architectural values. The classrooms have both occupancy sensors and daylight sensors. Parametric studies were carried out to find the minimum glazing area allowing to achieve satisfactory daylighting requirements, including the best form and location of the additional window openings. The daylight simulations were made using the LesoDial computer program. The analyses showed that the simplest and the most effective alternative for the base area was a combination of large windows and skylights situated over the rear part of the class area. Large windows facing north and skylights allow achieving high daylight levels.
Skylights used for lighting and for air exhaust.
Performance Computer simulations of the expected energy use were performed during the schematic design phase, using the computer Program SCIAQ Pro (Andresen and Dokka 2001). The simulations estimated the purchased energy use to 120 kWh/m2/year heated floor area, of which 100 kWh/m2/year was electricity and the rest was based on oil. This is well below experience from other similar buildings, which have an average energy use of 200 kWh/m2/year. The benchmark for energy efficient schools in this climate is 116 kWh/m2/year. Estimated yearly net energy use in kWh/m2 heated floor area, based on the schematic design (Andresen and Dokka 2001).
Teaching wings Level 2 (3480 m2)
Administration Level 1 (2200 m2)
Total (5680 m2)
Space heating 73 41 60 Heating of ventilation air 86 52 72 Tap water heating 10 11 10 Fans and pumps 5* 35* 17 Lighting 9 20 13 Equipment 12 30 19 Space cooling 0 0 0 Cooling of ventilation air 2 6 4 Sum 196 195 196
*Energy use for pumps makes up 3 kWh/m2 of this
42
Estimated yearly gross energy use (purchased) in kWh/m2 heated floor area based on the schematic design (Andresen and Dokka 2001). Teaching wings
Level 2 (3480 m2) Administration
Level 1 (2200 m2) Total
(5680 m2) Electricity 74 122 93 Oil 35 14 27 Sum 108 136 120
The measured energy use has not been obtained. However, there are some indications that the real energy use will be somewhat higher than estimated during early design phase:
• The realized building has a large window area with higher U-values than was recommended by the energy experts.
• The heat pump has been out of operation for some period dui to leakage of cooling fluid from compressor
• The exhaust air lamellas in the skylights cause cold draft due to non-optimal operation (too few wind sensors on the roof).
• The exhaust air lamellas represent major thermal bridges. Other problems reported include:
• Acoustic rubber panels had to be installed in the underground culverts to reduce the noise from the fans. These panels caused some smell problems in the beginning.
• The central control system had a long start-up period, and had not been commissioned on year after construction.
In general, the users of the building seem to be quite satisfied (Andresen, 2004). The interior spaces appear light, clean and attractive, and the air feels fresh. The users were particularly satisfied with the flexibility of the space – the freedom to use the space in different ways (Andresen 2004). The project achieved large media attention and several architectural prices. It was also awarded the Eco-building of the year. Also, the school is very popular among pupils and teachers, and attracts applicants from teachers and pupils from all over the municipality. The investment costs were 201 mill NOK, including land and infrastructure and a sports hall. This was around 15% higher than the budget. However, the cost is similar to the cost of other new schools in the area.
Summary of barriers
• Lack of integrated design of the building layout. Need co-operation between different experts on HVAC and energy, architecture, electrical engineering, acoustics, contractor from the early design phase.
• The overall liability for the energy/environmental system is difficult in these kind of integrated concepts. There are no well-established contracts for this.
• Lack of standard components for hybrid ventilation system (vents, control system).
• Lack of performance measurements, not demonstrated technology.
• Lack of computer tools to predict the energy and indoor climate in the early design phase
43
Open questions and needs for future research
• Detailed calculations and measurements of the heating and cooling effect of the underground concrete culvert.
• The development of cheap and reliable exhaust valves in skylights
• Fomalised method for integrated design and environmental design and performance control. Process and liability related.
• User-friendly tools for performance prediction of hybrid ventilation systems
References Andresen, I. (2001), ”Miljøvurdering av Kvernhuset Ungdomsskole”, SINTEF Rapport STF22 A01502, 12.01.01, Trondheim.
Andresen, I. og T.H. Dokka (2001), ”Energianalyse av Kvernhuset Ungdomsskole”, SINTEF Rapport STF22 A01504, 26.02.01, Trondheim.
Andresen, I. (2004), ”Evaluering av Kvernhuset ungdomsskole – energi og miljø”, SINTEF Report STF22 A04509, Trondheim, Norway.
Buvik, K, I. Andresen, and B. Matusiak (2002), ”LA 21 Applied to Kvernhuset Secondary School in Fredrikstad, Norway”, Paper at the International Conference Sustainable Building 2002, 22-25 September, 2002, Oslo, Norway.
Matusiak, B. (2000), “Daylighting in the Kvernhuset Lower Secondary School, Fredrikstad, Norway”, Paper at the 17th International Conference on Passive and Low Energy Architecture, July 3-5 2000, Cambridge, UK.
44
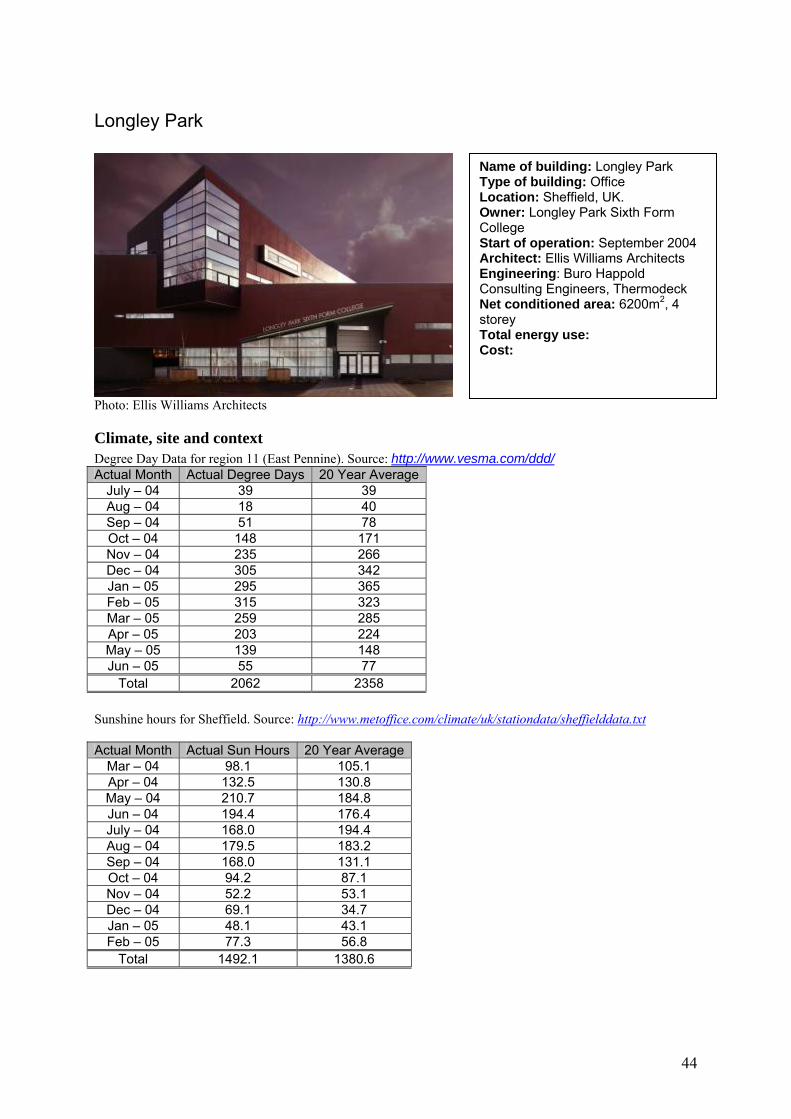
Longley Park
Photo: Ellis Williams Architects
Climate, site and context Degree Day Data for region 11 (East Pennine). Source: http://www.vesma.com/ddd/ Actual Month Actual Degree Days 20 Year Average
July – 04 39 39 Aug – 04 18 40 Sep – 04 51 78 Oct – 04 148 171 Nov – 04 235 266 Dec – 04 305 342 Jan – 05 295 365 Feb – 05 315 323 Mar – 05 259 285 Apr – 05 203 224 May – 05 139 148 Jun – 05 55 77
Total 2062 2358 Sunshine hours for Sheffield. Source: http://www.metoffice.com/climate/uk/stationdata/sheffielddata.txt Actual Month Actual Sun Hours 20 Year Average
Mar – 04 98.1 105.1 Apr – 04 132.5 130.8 May – 04 210.7 184.8 Jun – 04 194.4 176.4 July – 04 168.0 194.4 Aug – 04 179.5 183.2 Sep – 04 168.0 131.1 Oct – 04 94.2 87.1 Nov – 04 52.2 53.1 Dec – 04 69.1 34.7 Jan – 05 48.1 43.1 Feb – 05 77.3 56.8
Total 1492.1 1380.6
Name of building: Longley Park Type of building: Office Location: Sheffield, UK. Owner: Longley Park Sixth Form College Start of operation: September 2004 Architect: Ellis Williams Architects Engineering: Buro Happold Consulting Engineers, Thermodeck Net conditioned area: 6200m2, 4 storey Total energy use: Cost:
45
The building is located adjacent to a main road (A6135) so pollution and noise is a key problem due to the required noise level of 40LAeq,1hr (dB) within the general classrooms etc. Derived from DfES Building Bulletin 87.
Description of the building and the integrated building concept New build college incorporating; classrooms, laboratories, technology rooms, staff offices, meeting rooms, Learning Resource Centre and canteen. Number of occupants: 800 approx. Operation time: 0900hrs to 1700hrs. The structure of the building utilises a steel column and beam frame. Pre caste concrete planks and insitu screed provides the structural floors. The ground floor slab consists of an insitu construction. Walls comprise of metal studs with infill insulation, behind and insulated board behind a rainscreen. Windows are double glazed and utilise solar controlled glass in specific areas. The roof construction, consisting of a single ply membrane, on tapered insulation, on the structural slab. Pitched roof elements (above the 3rd floor clerestorey) utilize a metal standing seam construction. The floor-to-ceiling height is 3.1 m. Heating system The heating to the building is provided by a gas fired stand-alone boiler system. Two high efficiency, low NOx boilers serve the low pressure hot water circuits to: • Variable temperature radiator circuit • Constant temperature circuit to the air handling units and HWS cylinders. The boilers are provided with a primary shunt pumps and secondary circuits to the heat emitters. All heating pumps are direct drive pumps offering ‘duty/standby’ facility. Secondary pumps are inverter driven and controlled to provide constant pressure in relation to the modulating 2 port control valves on all heat emitters. The heating system utilizes a package pressurization unit to maintain system pressure. Radiator heating is provided throughout the naturally ventilated occupied spaces to offset fabric heat losses and glazing down-draughts. In student/public areas radiators are provided with tamper proof thermostatic radiator valves. In staff areas radiators are provided with manual controls. All radiators therefore rely on occupant control. Over door ‘air curtains’ are provided to the entrances to minimize draughts. Heating to the toilet areas is provided via the make up supply air from adjacent spaces. Approx 40% of the building is provided with mechanical via a TermoDeck principle. The supply air is temperature controlled to provide necessary heating to the spaces served. Cooling system The building is not air conditioned. The TermoDeck system and the introduction of night-time air into the building via the air handling plant shall assist the thermal comfort in the summer. Supply air from air handling unit 2/4 is cooled when required so as to further assist the cooling of rooms with high internal loads.
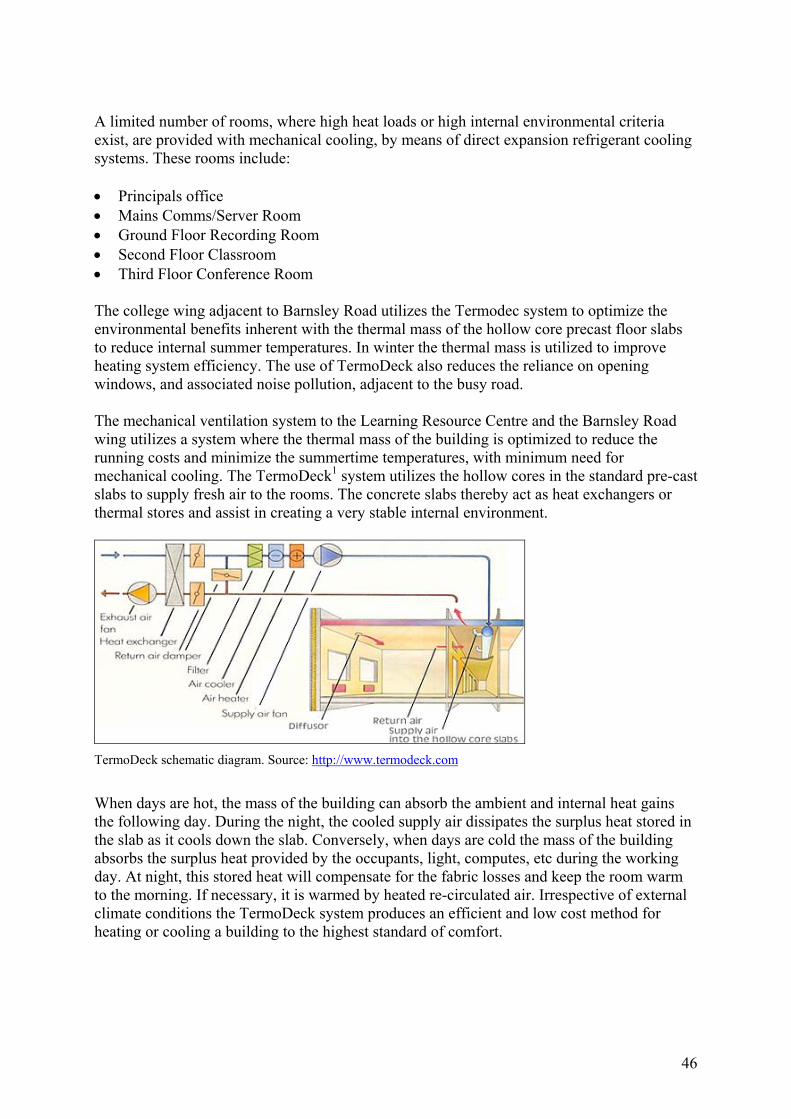
46
A limited number of rooms, where high heat loads or high internal environmental criteria exist, are provided with mechanical cooling, by means of direct expansion refrigerant cooling systems. These rooms include: • Principals office • Mains Comms/Server Room • Ground Floor Recording Room • Second Floor Classroom • Third Floor Conference Room The college wing adjacent to Barnsley Road utilizes the Termodec system to optimize the environmental benefits inherent with the thermal mass of the hollow core precast floor slabs to reduce internal summer temperatures. In winter the thermal mass is utilized to improve heating system efficiency. The use of TermoDeck also reduces the reliance on opening windows, and associated noise pollution, adjacent to the busy road. The mechanical ventilation system to the Learning Resource Centre and the Barnsley Road wing utilizes a system where the thermal mass of the building is optimized to reduce the running costs and minimize the summertime temperatures, with minimum need for mechanical cooling. The TermoDeck1 system utilizes the hollow cores in the standard pre-cast slabs to supply fresh air to the rooms. The concrete slabs thereby act as heat exchangers or thermal stores and assist in creating a very stable internal environment.
TermoDeck schematic diagram. Source: http://www.termodeck.com When days are hot, the mass of the building can absorb the ambient and internal heat gains the following day. During the night, the cooled supply air dissipates the surplus heat stored in the slab as it cools down the slab. Conversely, when days are cold the mass of the building absorbs the surplus heat provided by the occupants, light, computes, etc during the working day. At night, this stored heat will compensate for the fabric losses and keep the room warm to the morning. If necessary, it is warmed by heated re-circulated air. Irrespective of external climate conditions the TermoDeck system produces an efficient and low cost method for heating or cooling a building to the highest standard of comfort.
47
Ventilation system In general Mechanical ventilation is provided to all areas within the Barnsley Road wing and the Learning Resource Centre. These areas are served by external air handling units (AHUs), each of which incorporate supply and extract fans, filtration, heating coils and heat recovery. Air handling plant operates on a “full fresh air basis” to provide fresh air requirements for design occupancies and suitable air change rates. These AHUs supply air to the building via a ‘TermoDeck’ ventilation strategy. All AHUs are provided with inverter driven fans for variable volume control. Thermal wheel heat recovery achieves a thermal efficiency of up to 75% (when heating is required). The AHUs are controlled to provide pre-heating and pre-cooling (night cooling). The supply air from AHU 2/4, serving IT rooms, may also be automatically cooled by means of a refrigerant cooling coil, so warm outside temperatures do not cause internal discomfort. Supply air is provided from ceiling/soffit mounted circular grilles, via the TermoDeck system and extracted at high level from central locations. Mechanically ventilated rooms are also provided with façade openings. These windows are not necessary for ventilation purposes, but can add occupant comfort by allowing their local control of their space and connectivity to the external environment. Control system A Building Energy Management System is employed to control and monitor the mechanical services, internal environment and energy usage of the building. There is also the facility for remote monitoring of the BMS by TermoDeck and Buro Happold. The main functions of the automatic controls: Air Handling Plant • Plant on/off, night cooling and pre-heat control • Fan operation, speed control and monitoring • Filter status (pressure) monitoring • Energy management and heat recovery plant operation • Heating and cooling coil operation for temperature control • AHU isolating damper operation • Supply air and room condition monitoring • Motorized smoke/fire damper control TermoDeck • AHU control as indicated above • Room and concrete slab temperature measurement Heating Plant • Plant on/off, frost protection and boiler sequencing • External temperature and humidity monitoring • Boiler operation and status monitoring • LPHW temperature flow and return control/monitoring
48
• Primary and secondary pump operation, boiler interlock, status monitoring and auto-changeover
• Pump speed control, via differential pressure sensors • Heat emitter and heating coil control via 2 port valves • Pressurisation unit status monitoring • Space/zone temperature control/monitoring Metering • Gas consumption metering to the boiler plant and main incoming supply • Water consumption metering to the building (not via BMS) • Electricity metering to each inverter driven fan (AHUs) • Logging of internal and external conditions, for historical information • Heat metering to the AHUs Additional Functions • Gas solenoid emergency isolation • Fire alarm interface TermoDeck Controls Description The building is not permitted to fall below 20oC at any time. Plant start optimization is therefore not employed. Heat enable Heating on at 20oC Heating off at 21oC Cooling enable The requirements for night time cooling with ambient air are determined on an individual room by room basis. Only the rooms meeting the criteria below are pre-cooled at night. All other rooms have the relevant motorized dampers closed and the supply fan speed reduced via the inverters. • Zone temp > 23.5oC • External air temp is at least 7oC and is less than the average extract air temperature or
average zone temperature if the fans not running • External air temperature < 17oC • The time clock reads later than 22:00hrs Zone 2/4 has supplementary mechanical cooling. If cooling is required, but the criteria for night cooling with ambient air are not met, then the mechanical cooling is used provided all the criteria below are satisfied. • Zone temp > 24oC • External temp > 17oC • The time clock reads later than 04:00hrs Architectural issues It would be good to speak to Pablo Iglesias the project architect on this one. The log book contains the building u values etc.

49
Performance The only predicted performance utilized the SEAM method (refer to BB87) which provides a crude assessment method. Refer to building log book for calculation details. I think it would be interesting to, at some stage, summarise the issues which arose within the commissioning period and first year of operation eg • Handover prior to complete commissioning and validation • Client perception and aspirations • Contractors opinions (we could solicit these) • Obvious faults experienced during the validation (up to Sept 05) • Lessons learnt • External environmental conditions (summer)
Open questions and needs for future research • Suitability (energy benefits) of Termodeck for areas with high external temperatures • Client aspirations issues are very interesting to explore
References http://www.longleypark.ac.uk/html/homepage.html
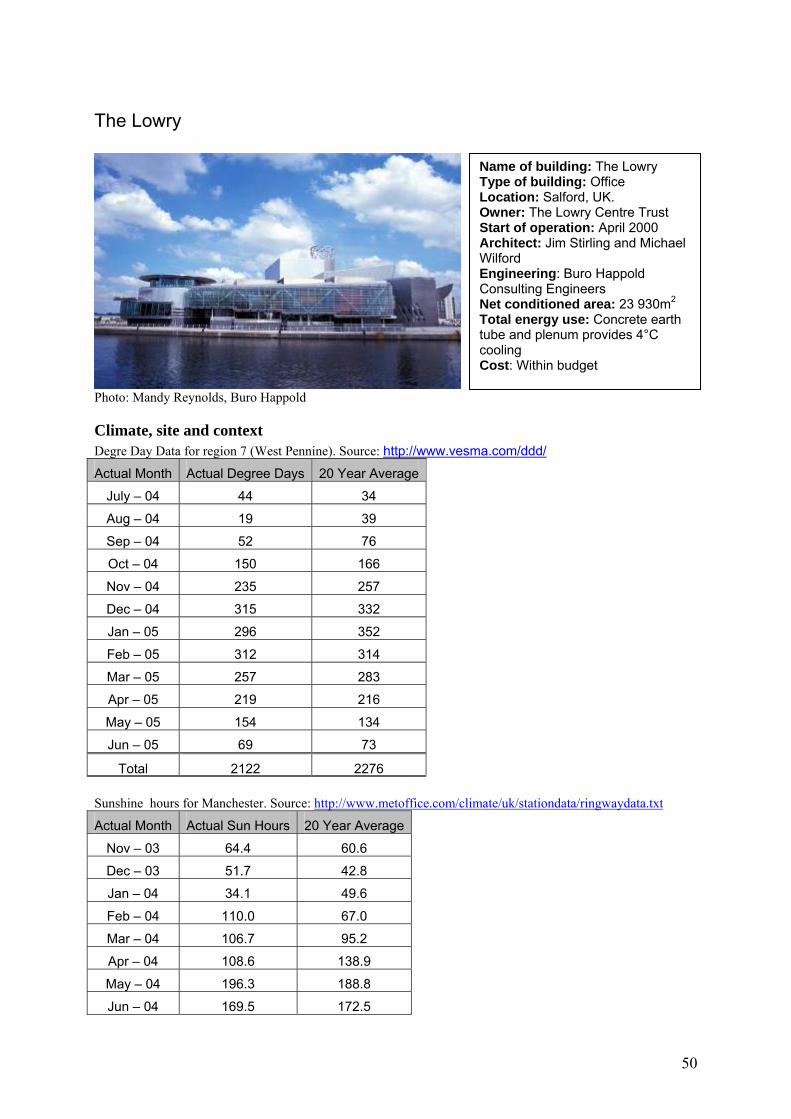
50
The Lowry
Photo: Mandy Reynolds, Buro Happold
Climate, site and context Degre Day Data for region 7 (West Pennine). Source: http://www.vesma.com/ddd/ Actual Month Actual Degree Days 20 Year Average
July – 04 44 34
Aug – 04 19 39
Sep – 04 52 76
Oct – 04 150 166
Nov – 04 235 257
Dec – 04 315 332
Jan – 05 296 352
Feb – 05 312 314
Mar – 05 257 283
Apr – 05 219 216
May – 05 154 134
Jun – 05 69 73
Total 2122 2276 Sunshine hours for Manchester. Source: http://www.metoffice.com/climate/uk/stationdata/ringwaydata.txt
Actual Month Actual Sun Hours 20 Year Average
Nov – 03 64.4 60.6
Dec – 03 51.7 42.8
Jan – 04 34.1 49.6
Feb – 04 110.0 67.0
Mar – 04 106.7 95.2
Apr – 04 108.6 138.9
May – 04 196.3 188.8
Jun – 04 169.5 172.5
Name of building: The Lowry Type of building: Office Location: Salford, UK. Owner: The Lowry Centre Trust Start of operation: April 2000 Architect: Jim Stirling and Michael Wilford Engineering: Buro Happold Consulting Engineers Net conditioned area: 23 930m2 Total energy use: Concrete earth tube and plenum provides 4°C cooling Cost: Within budget
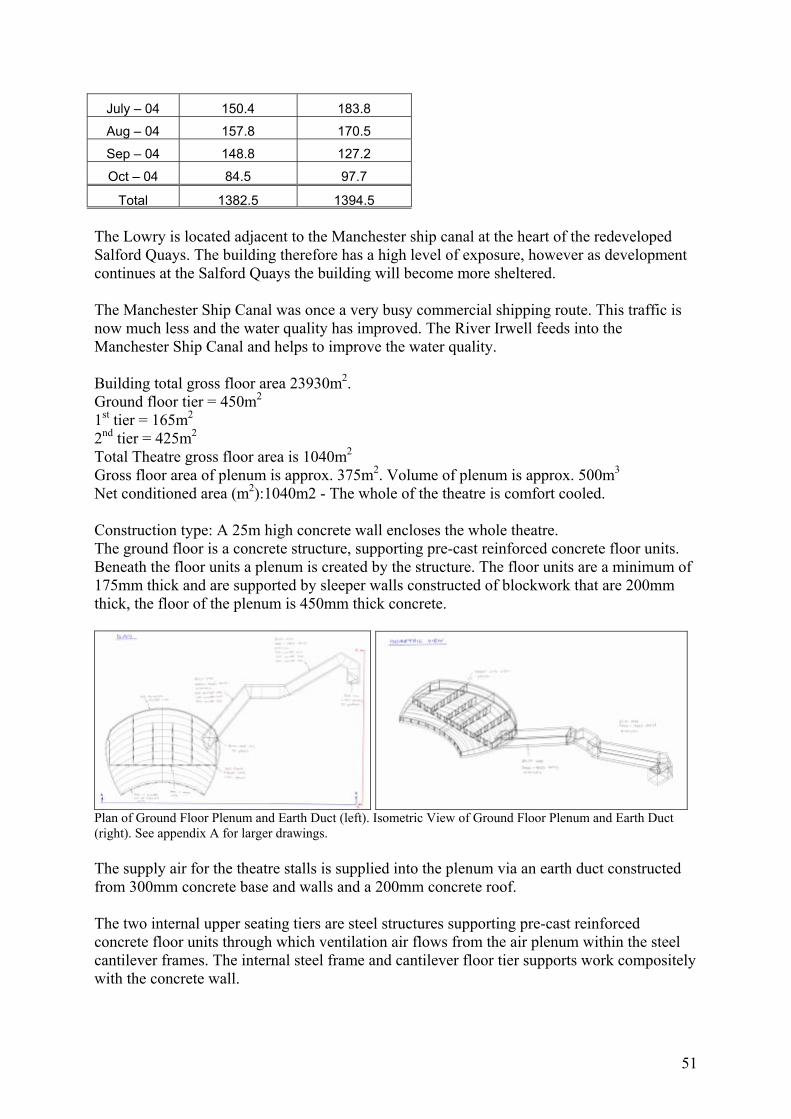
51
July – 04 150.4 183.8
Aug – 04 157.8 170.5
Sep – 04 148.8 127.2
Oct – 04 84.5 97.7
Total 1382.5 1394.5 The Lowry is located adjacent to the Manchester ship canal at the heart of the redeveloped Salford Quays. The building therefore has a high level of exposure, however as development continues at the Salford Quays the building will become more sheltered. The Manchester Ship Canal was once a very busy commercial shipping route. This traffic is now much less and the water quality has improved. The River Irwell feeds into the Manchester Ship Canal and helps to improve the water quality. Building total gross floor area 23930m2. Ground floor tier = 450m2 1st tier = 165m2 2nd tier = 425m2 Total Theatre gross floor area is 1040m2 Gross floor area of plenum is approx. 375m2. Volume of plenum is approx. 500m3
Net conditioned area (m2):1040m2 - The whole of the theatre is comfort cooled. Construction type: A 25m high concrete wall encloses the whole theatre. The ground floor is a concrete structure, supporting pre-cast reinforced concrete floor units. Beneath the floor units a plenum is created by the structure. The floor units are a minimum of 175mm thick and are supported by sleeper walls constructed of blockwork that are 200mm thick, the floor of the plenum is 450mm thick concrete.
Plan of Ground Floor Plenum and Earth Duct (left). Isometric View of Ground Floor Plenum and Earth Duct (right). See appendix A for larger drawings. The supply air for the theatre stalls is supplied into the plenum via an earth duct constructed from 300mm concrete base and walls and a 200mm concrete roof. The two internal upper seating tiers are steel structures supporting pre-cast reinforced concrete floor units through which ventilation air flows from the air plenum within the steel cantilever frames. The internal steel frame and cantilever floor tier supports work compositely with the concrete wall.
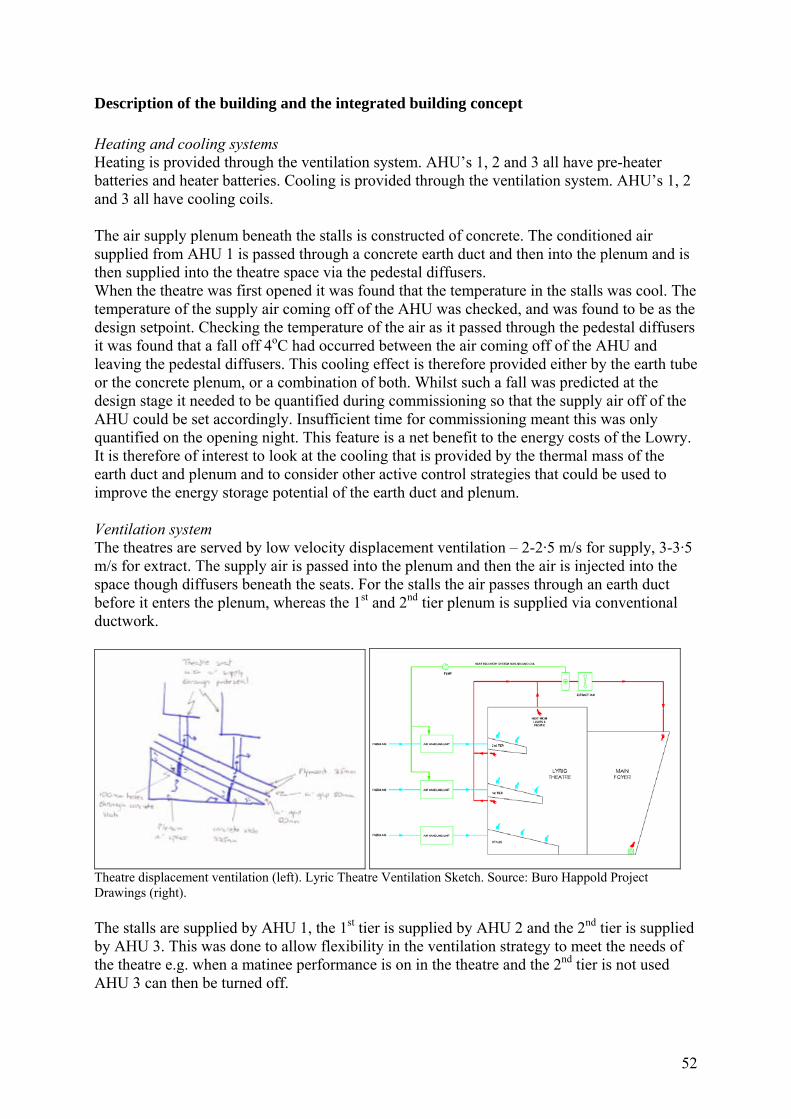
52
Description of the building and the integrated building concept Heating and cooling systems Heating is provided through the ventilation system. AHU’s 1, 2 and 3 all have pre-heater batteries and heater batteries. Cooling is provided through the ventilation system. AHU’s 1, 2 and 3 all have cooling coils. The air supply plenum beneath the stalls is constructed of concrete. The conditioned air supplied from AHU 1 is passed through a concrete earth duct and then into the plenum and is then supplied into the theatre space via the pedestal diffusers. When the theatre was first opened it was found that the temperature in the stalls was cool. The temperature of the supply air coming off of the AHU was checked, and was found to be as the design setpoint. Checking the temperature of the air as it passed through the pedestal diffusers it was found that a fall off 4oC had occurred between the air coming off of the AHU and leaving the pedestal diffusers. This cooling effect is therefore provided either by the earth tube or the concrete plenum, or a combination of both. Whilst such a fall was predicted at the design stage it needed to be quantified during commissioning so that the supply air off of the AHU could be set accordingly. Insufficient time for commissioning meant this was only quantified on the opening night. This feature is a net benefit to the energy costs of the Lowry. It is therefore of interest to look at the cooling that is provided by the thermal mass of the earth duct and plenum and to consider other active control strategies that could be used to improve the energy storage potential of the earth duct and plenum. Ventilation system The theatres are served by low velocity displacement ventilation – 2-2·5 m/s for supply, 3-3·5 m/s for extract. The supply air is passed into the plenum and then the air is injected into the space though diffusers beneath the seats. For the stalls the air passes through an earth duct before it enters the plenum, whereas the 1st and 2nd tier plenum is supplied via conventional ductwork.
Theatre displacement ventilation (left). Lyric Theatre Ventilation Sketch. Source: Buro Happold Project Drawings (right). The stalls are supplied by AHU 1, the 1st tier is supplied by AHU 2 and the 2nd tier is supplied by AHU 3. This was done to allow flexibility in the ventilation strategy to meet the needs of the theatre e.g. when a matinee performance is on in the theatre and the 2nd tier is not used AHU 3 can then be turned off.
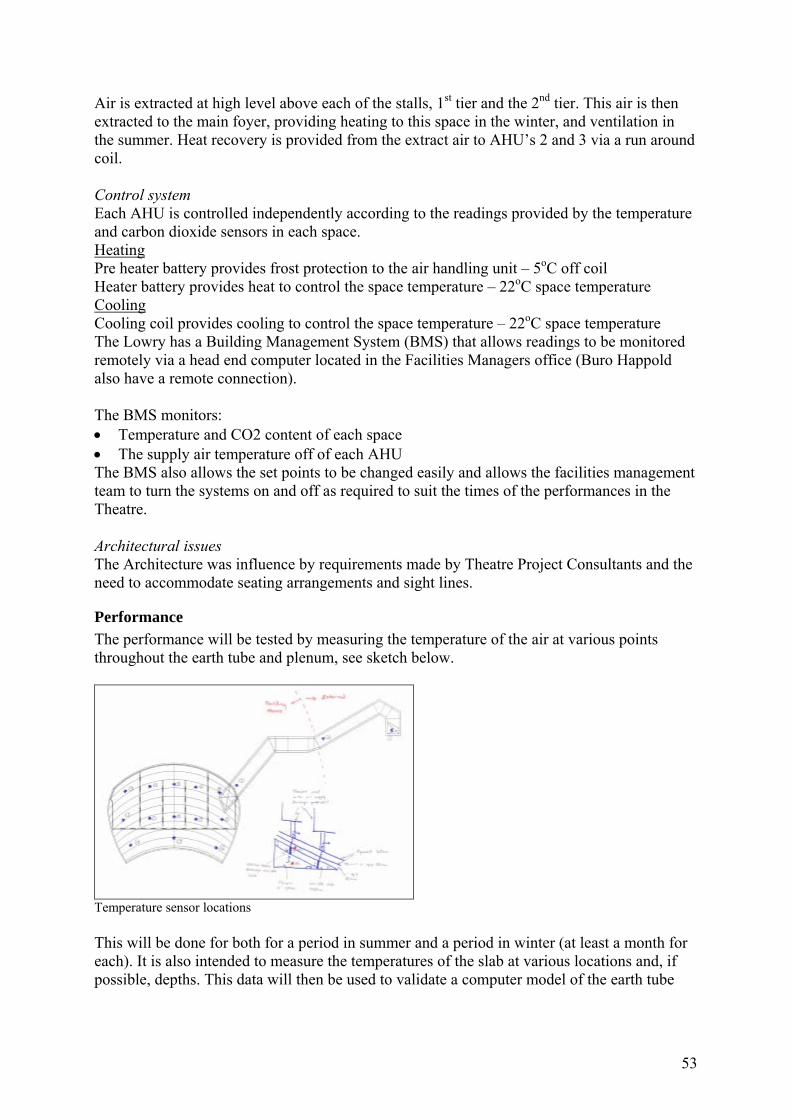
53
Air is extracted at high level above each of the stalls, 1st tier and the 2nd tier. This air is then extracted to the main foyer, providing heating to this space in the winter, and ventilation in the summer. Heat recovery is provided from the extract air to AHU’s 2 and 3 via a run around coil. Control system Each AHU is controlled independently according to the readings provided by the temperature and carbon dioxide sensors in each space. Heating Pre heater battery provides frost protection to the air handling unit – 5oC off coil Heater battery provides heat to control the space temperature – 22oC space temperature Cooling Cooling coil provides cooling to control the space temperature – 22oC space temperature The Lowry has a Building Management System (BMS) that allows readings to be monitored remotely via a head end computer located in the Facilities Managers office (Buro Happold also have a remote connection). The BMS monitors: • Temperature and CO2 content of each space • The supply air temperature off of each AHU The BMS also allows the set points to be changed easily and allows the facilities management team to turn the systems on and off as required to suit the times of the performances in the Theatre. Architectural issues The Architecture was influence by requirements made by Theatre Project Consultants and the need to accommodate seating arrangements and sight lines.
Performance The performance will be tested by measuring the temperature of the air at various points throughout the earth tube and plenum, see sketch below.
Temperature sensor locations This will be done for both for a period in summer and a period in winter (at least a month for each). It is also intended to measure the temperatures of the slab at various locations and, if possible, depths. This data will then be used to validate a computer model of the earth tube

54
and plenum constructed using IES Virtual Environment and simulated using the dynamic thermal modeling element of the software.
Summary of barriers Cost could potentially have been a barrier. The project was within budget, but due to the use of the space as a theatre the budget was larger than that for other more standard projects.
Open questions and needs for future research To determine the cooling provided by the thermal mass of the earth duct and the concrete plenum beneath the theatre. This will be done by monitoring the conditions within the earth duct and the plenum. Control strategies that can be adopted to improve the cooling potential of the thermal mass of the earth duct and concrete plenum beneath the theatre. This will be done through computer modelling of the earth duct and plenum using IES software.
References POWELL, K., (2000) “Affairs of the art” The Architect’s Journal, 06/07/2000, pp. 29-41. BUILDING SERVICES REPORTS, 2000. Picture this, Building Services Journal, May 2000. http://www.thelowry.com
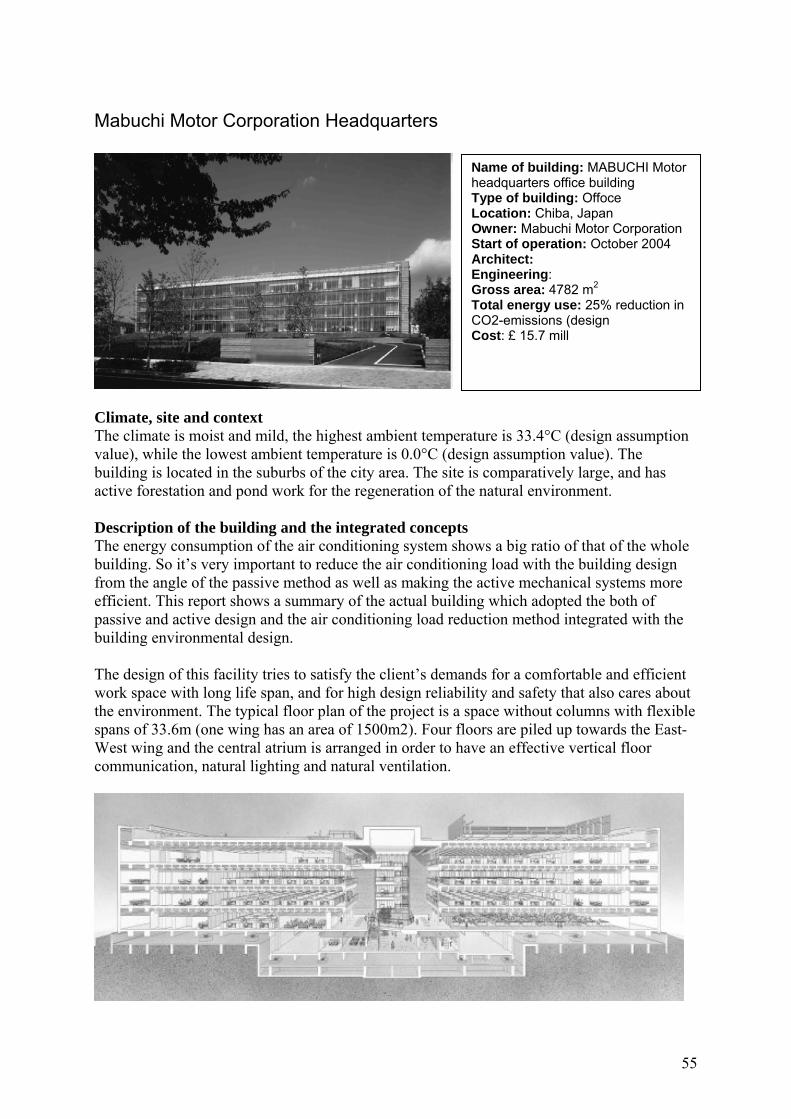
55
Mabuchi Motor Corporation Headquarters
Climate, site and context The climate is moist and mild, the highest ambient temperature is 33.4°C (design assumption value), while the lowest ambient temperature is 0.0°C (design assumption value). The building is located in the suburbs of the city area. The site is comparatively large, and has active forestation and pond work for the regeneration of the natural environment. Description of the building and the integrated concepts The energy consumption of the air conditioning system shows a big ratio of that of the whole building. So it’s very important to reduce the air conditioning load with the building design from the angle of the passive method as well as making the active mechanical systems more efficient. This report shows a summary of the actual building which adopted the both of passive and active design and the air conditioning load reduction method integrated with the building environmental design. The design of this facility tries to satisfy the client’s demands for a comfortable and efficient work space with long life span, and for high design reliability and safety that also cares about the environment. The typical floor plan of the project is a space without columns with flexible spans of 33.6m (one wing has an area of 1500m2). Four floors are piled up towards the East-West wing and the central atrium is arranged in order to have an effective vertical floor communication, natural lighting and natural ventilation.
Name of building: MABUCHI Motor headquarters office building Type of building: Offoce Location: Chiba, Japan Owner: Mabuchi Motor Corporation Start of operation: October 2004 Architect: Engineering: Gross area: 4782 m2 Total energy use: 25% reduction in CO2-emissions (design Cost: £ 15.7 mill

56
Double glass skin on the outer walls The double glass skin has many functions which is necessary for outer wall in Japanese climate, like the heat insulation in winter, the exhaust heated air in summer, the natural ventilation in spring and autumn. These functions are realized by the automatic controlling ventilation dumpers at double glass skin (dampers installed at top, bottom and each floor).
Partition panel air conditioning system. The task and ambient air conditioning system which has supply openings for under floor air supply on the frequently-used partition panels was adopted to create the efficient air-conditioning system in the large scale and high ceiling office. The system outline is shown in the figure below. Productivity and amenity of occupants gain by using this panel air conditioning system that the volume and direction of supply air are adjustable by an individual. On the assumption that it is a combination system with under floor air-conditioning system of pressure type, the goals for the design of the panel air conditioner were: 1) The air-condition capacity (the amount of air conditioner volume) in the task zone and
ambient zone in total becomes less than plan capacity value (75CMH/person). 2) Using the pressure difference control (pressure difference between underfloor and room,
∆P=15Pa) with under floor air-conditioning system. 3) Using supply temperature set point ( 19-20 degrees) of underfloor air-conditioning
system.
Thermal storage on the building frame with the void slab Air flow switching system: In this system, the void slab which becomes the structure of the building is used for a function as an air conditioning duct. At the usual air conditioning time

57
(at the daytime),the cooled air is supplied by under floor air conditioning system, and warmed return air passes through this void slab from the ceiling side. And the other way round, the void slab is used for air supply route at night. The void slab is cooled with supply air from AHU at night, and this thermal storage is recovered with warmed return air from the room at the daytime. In summer, the peak load of electric power can be shifted by using both this thermal storage and the ice storage system installed as a heat source of this building. Furthermore, in middle term, the cooling air conditioning load in the daytime can be decreased with this thermal storage system using out air cooling at night instead of using chilled water from heat source.
The void slab used as an air conditioning route consists of two kinds of forms. One is the form that ten circle ducts were installed in the slab which is close to perimeter zone. These circle ducts are used as an air conditioning supply and return route, and these aim for thermal storage and radiation mainly. This form is arranged on northern and southern 4 zones per floor of the building. And the other is that has big midair layer in the slab installed in the interior zone. And the openings for an airflow connected with the midair layer are installed on the bottom side of a slab to face the inside. At day air conditioning time, the air from AHU passes through this midair layer first, and then it passes through the zone where circle ducts are installed. And finally it goes back to the AHU. Performance Double glass skin on the outer walls It is very difficult to figure out the effect of the passive-design techniques like this double skin quantitatively with the existing heat load calculation. Because it depends on many parameters such as the weather condition, the buildings form, air conditioning systems and these operations. And there are few study cases about the relativity between the heat transfer model and the air ventilation model and about state change in the airflow and dumpers by temperature and pressure condition for whole building. In consideration of these backgrounds, it’s possible to figure out the effect with the thermal and air flow network model. PMV distribution The PMV distribution in perimeter zone was predicted by the rustles of simulation (using the dates of room and surface temperatures). In summer during air conditioning time, inside glass surface temperature is 30.2 degrees on the 1st floor, and 31.4 degrees on the 4th floor. The differences of the temperature and that of PMV are small. A similar tendency is shown even at the middle term. In winter air conditioning time, the PMV of the middle floor is 0 and it becomes a little low on the 1st floor and 4th floor which faces the out air. Thermal load distribution In summer, the thermal load distribution of every floor with double glass skin shows lower tendency than the low-E glass and reflective glass. But on the north skin with low solar radiation, it shows lower effect than the south skin though it is expected to show the big effect
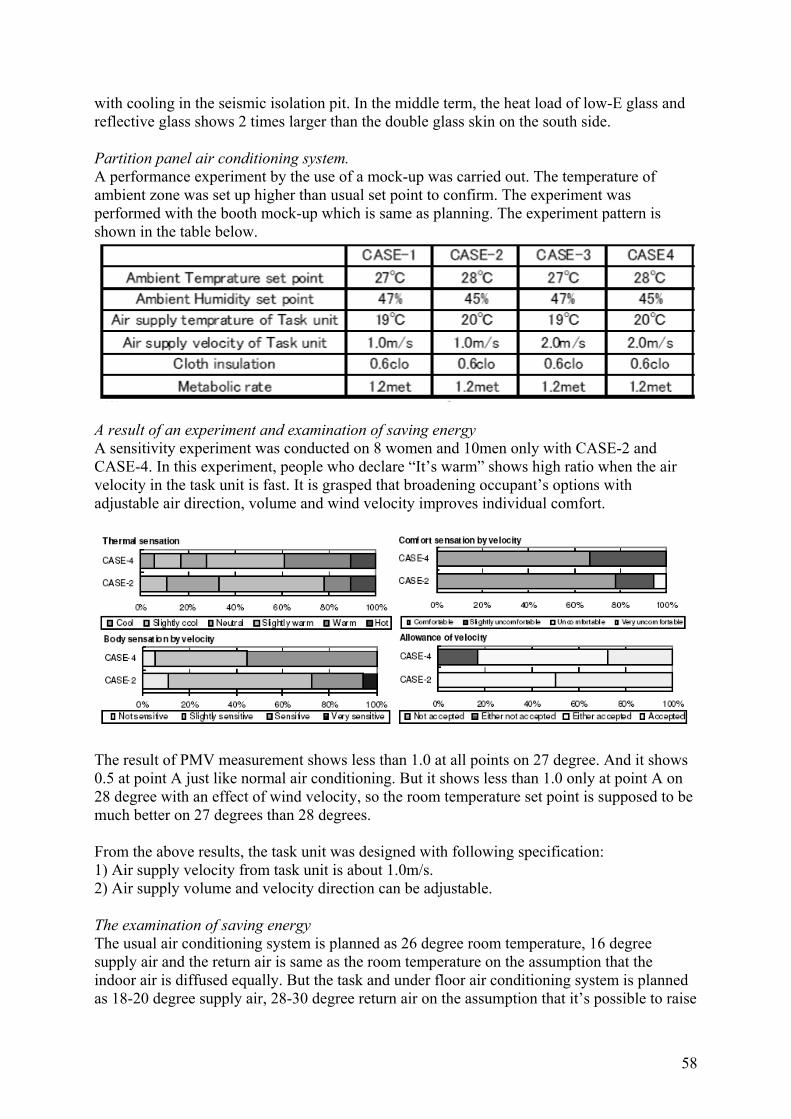
58
with cooling in the seismic isolation pit. In the middle term, the heat load of low-E glass and reflective glass shows 2 times larger than the double glass skin on the south side. Partition panel air conditioning system. A performance experiment by the use of a mock-up was carried out. The temperature of ambient zone was set up higher than usual set point to confirm. The experiment was performed with the booth mock-up which is same as planning. The experiment pattern is shown in the table below.
A result of an experiment and examination of saving energy A sensitivity experiment was conducted on 8 women and 10men only with CASE-2 and CASE-4. In this experiment, people who declare “It’s warm” shows high ratio when the air velocity in the task unit is fast. It is grasped that broadening occupant’s options with adjustable air direction, volume and wind velocity improves individual comfort.
The result of PMV measurement shows less than 1.0 at all points on 27 degree. And it shows 0.5 at point A just like normal air conditioning. But it shows less than 1.0 only at point A on 28 degree with an effect of wind velocity, so the room temperature set point is supposed to be much better on 27 degrees than 28 degrees. From the above results, the task unit was designed with following specification: 1) Air supply velocity from task unit is about 1.0m/s. 2) Air supply volume and velocity direction can be adjustable. The examination of saving energy The usual air conditioning system is planned as 26 degree room temperature, 16 degree supply air and the return air is same as the room temperature on the assumption that the indoor air is diffused equally. But the task and under floor air conditioning system is planned as 18-20 degree supply air, 28-30 degree return air on the assumption that it’s possible to raise
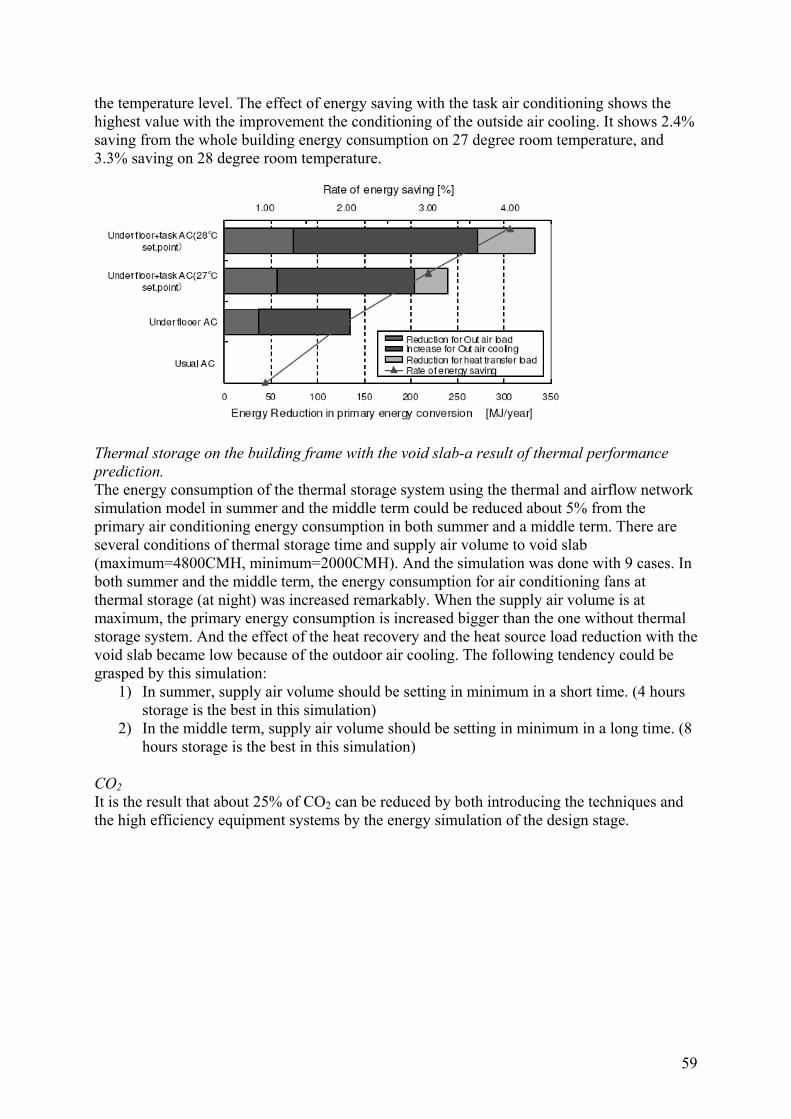
59
the temperature level. The effect of energy saving with the task air conditioning shows the highest value with the improvement the conditioning of the outside air cooling. It shows 2.4% saving from the whole building energy consumption on 27 degree room temperature, and 3.3% saving on 28 degree room temperature.
Thermal storage on the building frame with the void slab-a result of thermal performance prediction. The energy consumption of the thermal storage system using the thermal and airflow network simulation model in summer and the middle term could be reduced about 5% from the primary air conditioning energy consumption in both summer and a middle term. There are several conditions of thermal storage time and supply air volume to void slab (maximum=4800CMH, minimum=2000CMH). And the simulation was done with 9 cases. In both summer and the middle term, the energy consumption for air conditioning fans at thermal storage (at night) was increased remarkably. When the supply air volume is at maximum, the primary energy consumption is increased bigger than the one without thermal storage system. And the effect of the heat recovery and the heat source load reduction with the void slab became low because of the outdoor air cooling. The following tendency could be grasped by this simulation:
1) In summer, supply air volume should be setting in minimum in a short time. (4 hours storage is the best in this simulation)
2) In the middle term, supply air volume should be setting in minimum in a long time. (8 hours storage is the best in this simulation)
CO2 It is the result that about 25% of CO2 can be reduced by both introducing the techniques and the high efficiency equipment systems by the energy simulation of the design stage.
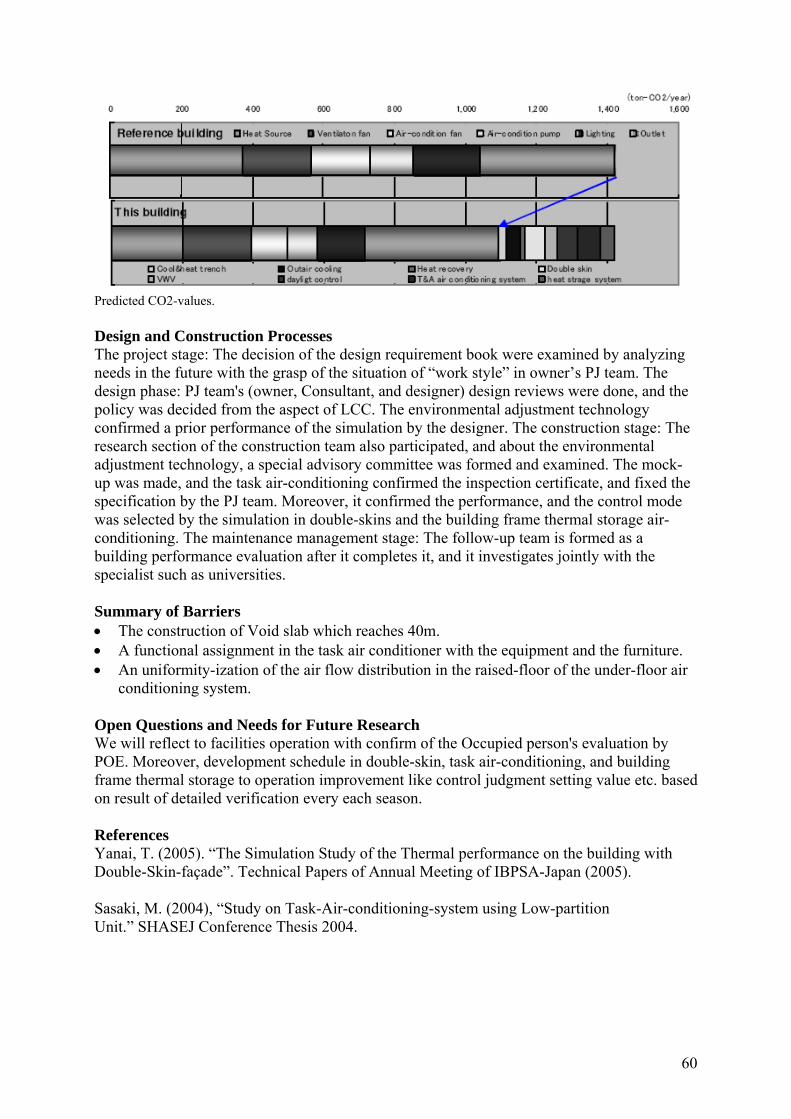
60
Predicted CO2-values. Design and Construction Processes The project stage: The decision of the design requirement book were examined by analyzing needs in the future with the grasp of the situation of “work style” in owner’s PJ team. The design phase: PJ team's (owner, Consultant, and designer) design reviews were done, and the policy was decided from the aspect of LCC. The environmental adjustment technology confirmed a prior performance of the simulation by the designer. The construction stage: The research section of the construction team also participated, and about the environmental adjustment technology, a special advisory committee was formed and examined. The mock-up was made, and the task air-conditioning confirmed the inspection certificate, and fixed the specification by the PJ team. Moreover, it confirmed the performance, and the control mode was selected by the simulation in double-skins and the building frame thermal storage air-conditioning. The maintenance management stage: The follow-up team is formed as a building performance evaluation after it completes it, and it investigates jointly with the specialist such as universities. Summary of Barriers • The construction of Void slab which reaches 40m. • A functional assignment in the task air conditioner with the equipment and the furniture. • An uniformity-ization of the air flow distribution in the raised-floor of the under-floor air
conditioning system. Open Questions and Needs for Future Research We will reflect to facilities operation with confirm of the Occupied person's evaluation by POE. Moreover, development schedule in double-skin, task air-conditioning, and building frame thermal storage to operation improvement like control judgment setting value etc. based on result of detailed verification every each season. References Yanai, T. (2005). “The Simulation Study of the Thermal performance on the building with Double-Skin-façade”. Technical Papers of Annual Meeting of IBPSA-Japan (2005). Sasaki, M. (2004), “Study on Task-Air-conditioning-system using Low-partition Unit.” SHASEJ Conference Thesis 2004.
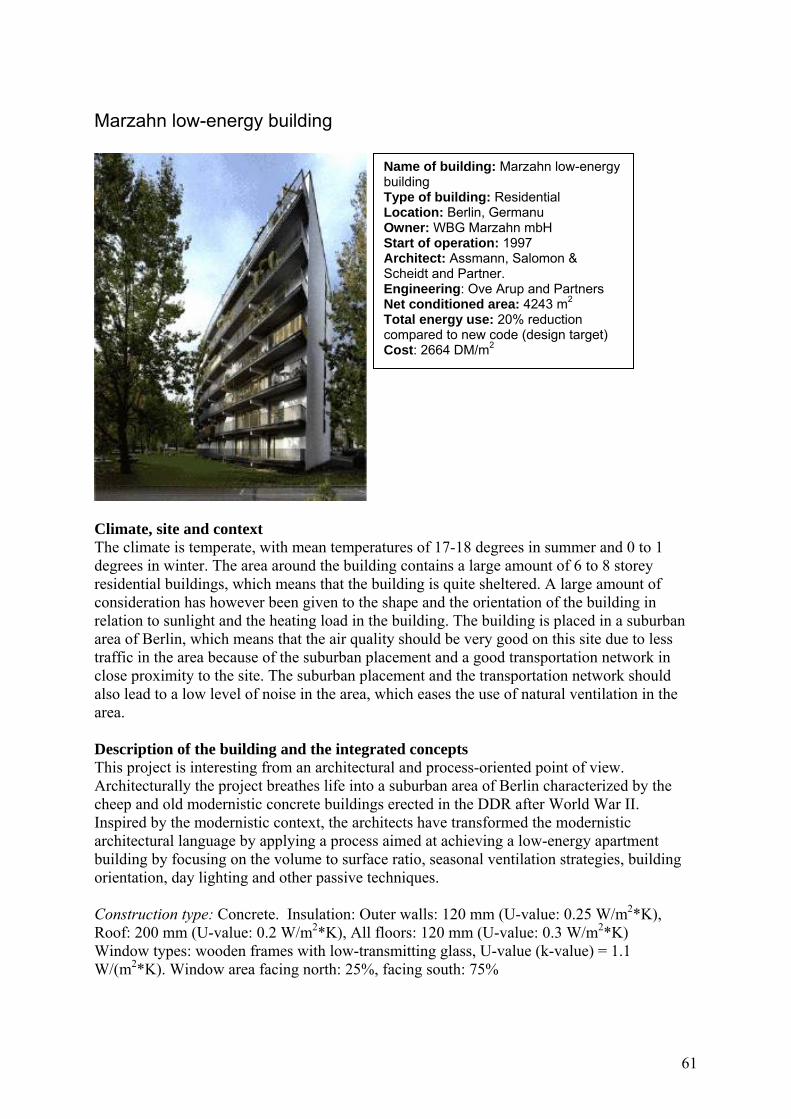
61
Marzahn low-energy building
Climate, site and context The climate is temperate, with mean temperatures of 17-18 degrees in summer and 0 to 1 degrees in winter. The area around the building contains a large amount of 6 to 8 storey residential buildings, which means that the building is quite sheltered. A large amount of consideration has however been given to the shape and the orientation of the building in relation to sunlight and the heating load in the building. The building is placed in a suburban area of Berlin, which means that the air quality should be very good on this site due to less traffic in the area because of the suburban placement and a good transportation network in close proximity to the site. The suburban placement and the transportation network should also lead to a low level of noise in the area, which eases the use of natural ventilation in the area. Description of the building and the integrated concepts This project is interesting from an architectural and process-oriented point of view. Architecturally the project breathes life into a suburban area of Berlin characterized by the cheep and old modernistic concrete buildings erected in the DDR after World War II. Inspired by the modernistic context, the architects have transformed the modernistic architectural language by applying a process aimed at achieving a low-energy apartment building by focusing on the volume to surface ratio, seasonal ventilation strategies, building orientation, day lighting and other passive techniques. Construction type: Concrete. Insulation: Outer walls: 120 mm (U-value: 0.25 W/m2*K), Roof: 200 mm (U-value: 0.2 W/m2*K), All floors: 120 mm (U-value: 0.3 W/m2*K) Window types: wooden frames with low-transmitting glass, U-value (k-value) = 1.1 W/(m2*K). Window area facing north: 25%, facing south: 75%
Name of building: Marzahn low-energy building Type of building: Residential Location: Berlin, Germanu Owner: WBG Marzahn mbH Start of operation: 1997 Architect: Assmann, Salomon & Scheidt and Partner. Engineering: Ove Arup and Partners Net conditioned area: 4243 m2 Total energy use: 20% reduction compared to new code (design target) Cost: 2664 DM/m2
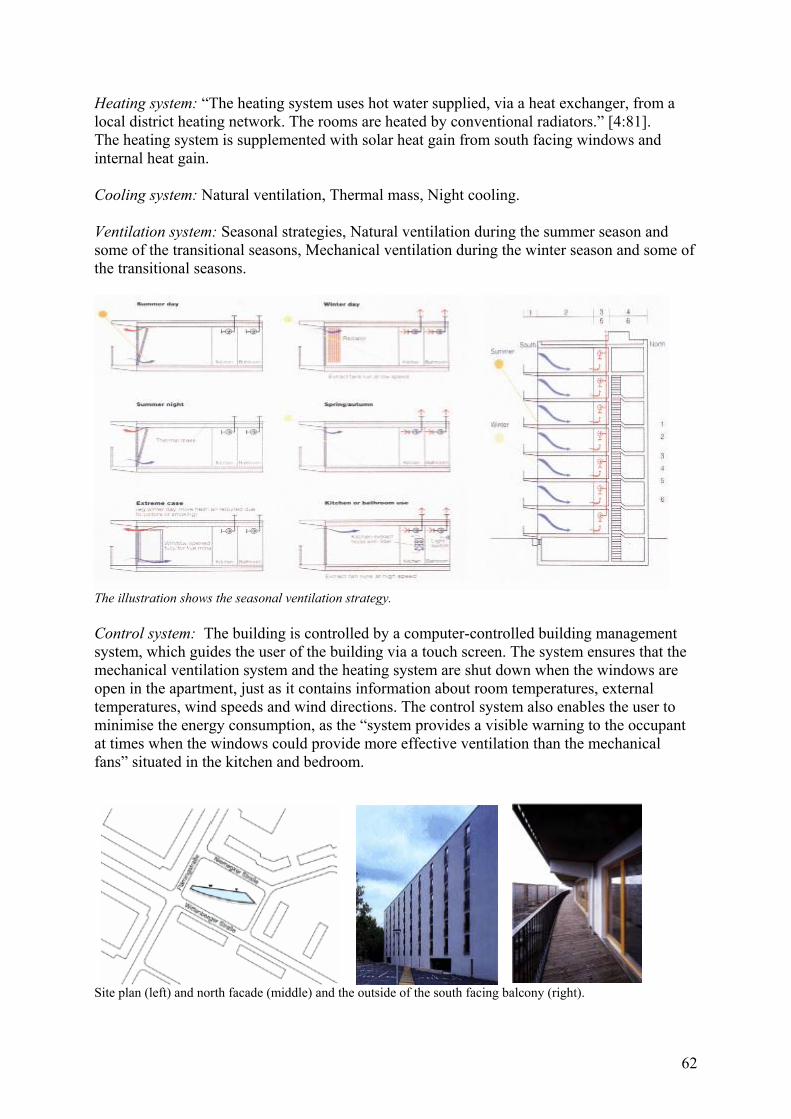
62
Heating system: “The heating system uses hot water supplied, via a heat exchanger, from a local district heating network. The rooms are heated by conventional radiators.” [4:81]. The heating system is supplemented with solar heat gain from south facing windows and internal heat gain. Cooling system: Natural ventilation, Thermal mass, Night cooling. Ventilation system: Seasonal strategies, Natural ventilation during the summer season and some of the transitional seasons, Mechanical ventilation during the winter season and some of the transitional seasons.
The illustration shows the seasonal ventilation strategy. Control system: The building is controlled by a computer-controlled building management system, which guides the user of the building via a touch screen. The system ensures that the mechanical ventilation system and the heating system are shut down when the windows are open in the apartment, just as it contains information about room temperatures, external temperatures, wind speeds and wind directions. The control system also enables the user to minimise the energy consumption, as the “system provides a visible warning to the occupant at times when the windows could provide more effective ventilation than the mechanical fans” situated in the kitchen and bedroom. Site plan (left) and north facade (middle) and the outside of the south facing balcony (right).
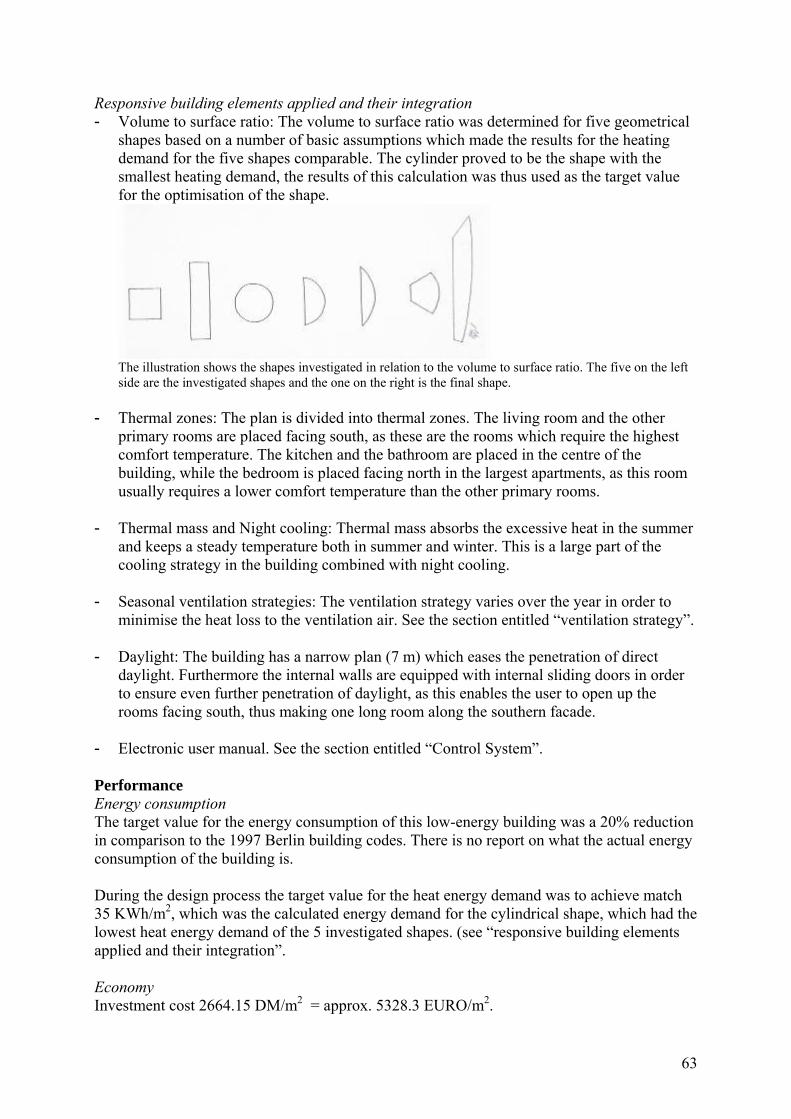
63
Responsive building elements applied and their integration - Volume to surface ratio: The volume to surface ratio was determined for five geometrical
shapes based on a number of basic assumptions which made the results for the heating demand for the five shapes comparable. The cylinder proved to be the shape with the smallest heating demand, the results of this calculation was thus used as the target value for the optimisation of the shape.
The illustration shows the shapes investigated in relation to the volume to surface ratio. The five on the left side are the investigated shapes and the one on the right is the final shape.
- Thermal zones: The plan is divided into thermal zones. The living room and the other primary rooms are placed facing south, as these are the rooms which require the highest comfort temperature. The kitchen and the bathroom are placed in the centre of the building, while the bedroom is placed facing north in the largest apartments, as this room usually requires a lower comfort temperature than the other primary rooms.
- Thermal mass and Night cooling: Thermal mass absorbs the excessive heat in the summer and keeps a steady temperature both in summer and winter. This is a large part of the cooling strategy in the building combined with night cooling.
- Seasonal ventilation strategies: The ventilation strategy varies over the year in order to minimise the heat loss to the ventilation air. See the section entitled “ventilation strategy”.
- Daylight: The building has a narrow plan (7 m) which eases the penetration of direct daylight. Furthermore the internal walls are equipped with internal sliding doors in order to ensure even further penetration of daylight, as this enables the user to open up the rooms facing south, thus making one long room along the southern facade.
- Electronic user manual. See the section entitled “Control System”. Performance Energy consumption The target value for the energy consumption of this low-energy building was a 20% reduction in comparison to the 1997 Berlin building codes. There is no report on what the actual energy consumption of the building is. During the design process the target value for the heat energy demand was to achieve match 35 KWh/m2, which was the calculated energy demand for the cylindrical shape, which had the lowest heat energy demand of the 5 investigated shapes. (see “responsive building elements applied and their integration”. Economy Investment cost 2664.15 DM/m2 = approx. 5328.3 EURO/m2.
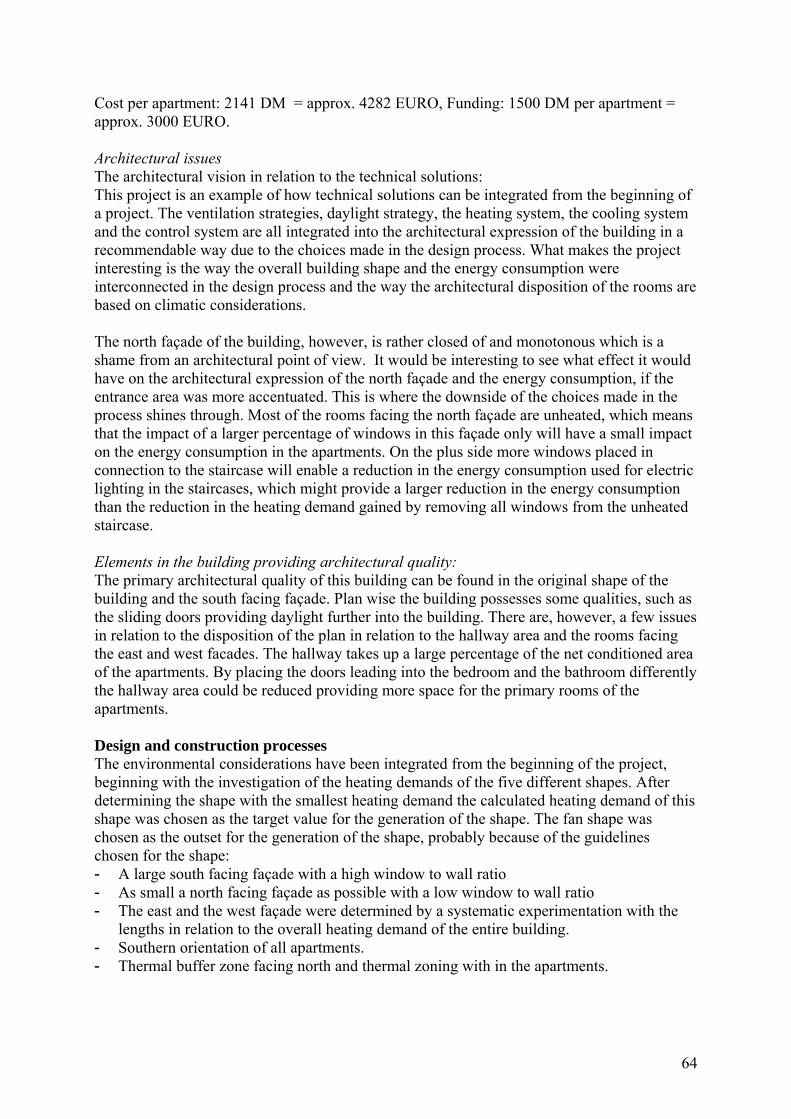
64
Cost per apartment: 2141 DM = approx. 4282 EURO, Funding: 1500 DM per apartment = approx. 3000 EURO. Architectural issues The architectural vision in relation to the technical solutions: This project is an example of how technical solutions can be integrated from the beginning of a project. The ventilation strategies, daylight strategy, the heating system, the cooling system and the control system are all integrated into the architectural expression of the building in a recommendable way due to the choices made in the design process. What makes the project interesting is the way the overall building shape and the energy consumption were interconnected in the design process and the way the architectural disposition of the rooms are based on climatic considerations. The north façade of the building, however, is rather closed of and monotonous which is a shame from an architectural point of view. It would be interesting to see what effect it would have on the architectural expression of the north façade and the energy consumption, if the entrance area was more accentuated. This is where the downside of the choices made in the process shines through. Most of the rooms facing the north façade are unheated, which means that the impact of a larger percentage of windows in this façade only will have a small impact on the energy consumption in the apartments. On the plus side more windows placed in connection to the staircase will enable a reduction in the energy consumption used for electric lighting in the staircases, which might provide a larger reduction in the energy consumption than the reduction in the heating demand gained by removing all windows from the unheated staircase. Elements in the building providing architectural quality: The primary architectural quality of this building can be found in the original shape of the building and the south facing façade. Plan wise the building possesses some qualities, such as the sliding doors providing daylight further into the building. There are, however, a few issues in relation to the disposition of the plan in relation to the hallway area and the rooms facing the east and west facades. The hallway takes up a large percentage of the net conditioned area of the apartments. By placing the doors leading into the bedroom and the bathroom differently the hallway area could be reduced providing more space for the primary rooms of the apartments. Design and construction processes The environmental considerations have been integrated from the beginning of the project, beginning with the investigation of the heating demands of the five different shapes. After determining the shape with the smallest heating demand the calculated heating demand of this shape was chosen as the target value for the generation of the shape. The fan shape was chosen as the outset for the generation of the shape, probably because of the guidelines chosen for the shape: - A large south facing façade with a high window to wall ratio - As small a north facing façade as possible with a low window to wall ratio - The east and the west façade were determined by a systematic experimentation with the
lengths in relation to the overall heating demand of the entire building. - Southern orientation of all apartments. - Thermal buffer zone facing north and thermal zoning with in the apartments.
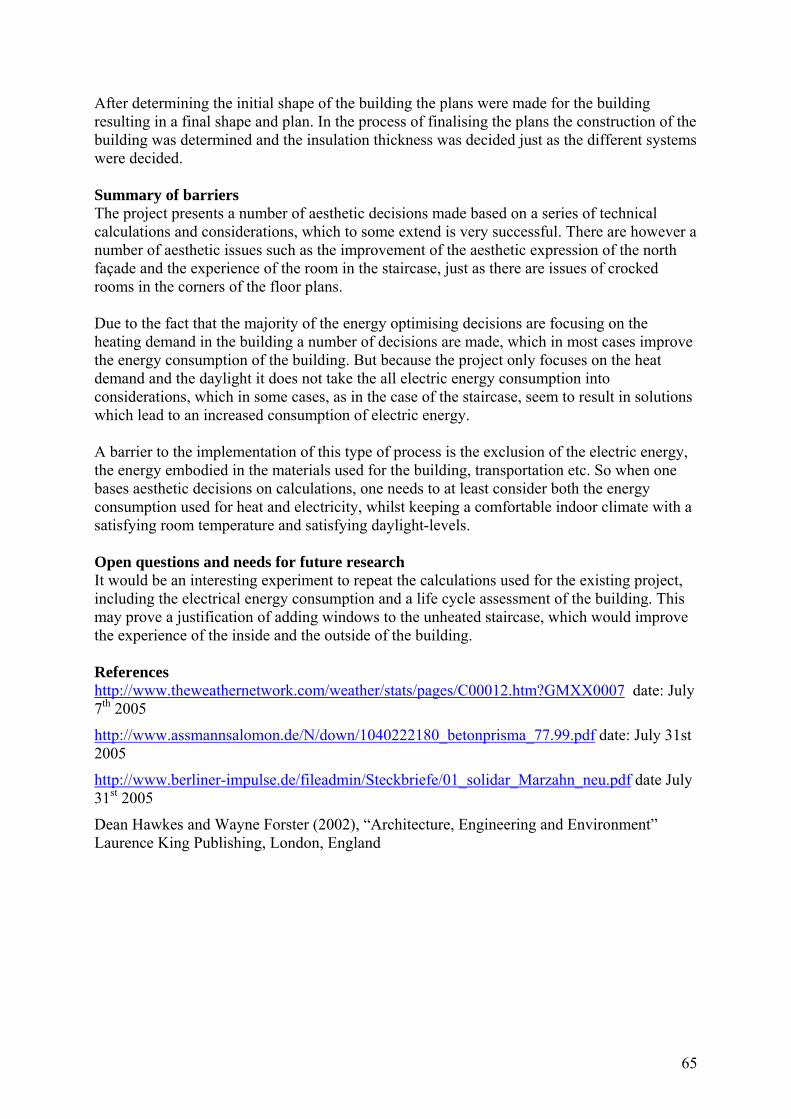
65
After determining the initial shape of the building the plans were made for the building resulting in a final shape and plan. In the process of finalising the plans the construction of the building was determined and the insulation thickness was decided just as the different systems were decided. Summary of barriers The project presents a number of aesthetic decisions made based on a series of technical calculations and considerations, which to some extend is very successful. There are however a number of aesthetic issues such as the improvement of the aesthetic expression of the north façade and the experience of the room in the staircase, just as there are issues of crocked rooms in the corners of the floor plans. Due to the fact that the majority of the energy optimising decisions are focusing on the heating demand in the building a number of decisions are made, which in most cases improve the energy consumption of the building. But because the project only focuses on the heat demand and the daylight it does not take the all electric energy consumption into considerations, which in some cases, as in the case of the staircase, seem to result in solutions which lead to an increased consumption of electric energy. A barrier to the implementation of this type of process is the exclusion of the electric energy, the energy embodied in the materials used for the building, transportation etc. So when one bases aesthetic decisions on calculations, one needs to at least consider both the energy consumption used for heat and electricity, whilst keeping a comfortable indoor climate with a satisfying room temperature and satisfying daylight-levels. Open questions and needs for future research It would be an interesting experiment to repeat the calculations used for the existing project, including the electrical energy consumption and a life cycle assessment of the building. This may prove a justification of adding windows to the unheated staircase, which would improve the experience of the inside and the outside of the building. References http://www.theweathernetwork.com/weather/stats/pages/C00012.htm?GMXX0007 date: July 7th 2005
http://www.assmannsalomon.de/N/down/1040222180_betonprisma_77.99.pdf date: July 31st 2005
http://www.berliner-impulse.de/fileadmin/Steckbriefe/01_solidar_Marzahn_neu.pdf date July 31st 2005
Dean Hawkes and Wayne Forster (2002), “Architecture, Engineering and Environment” Laurence King Publishing, London, England
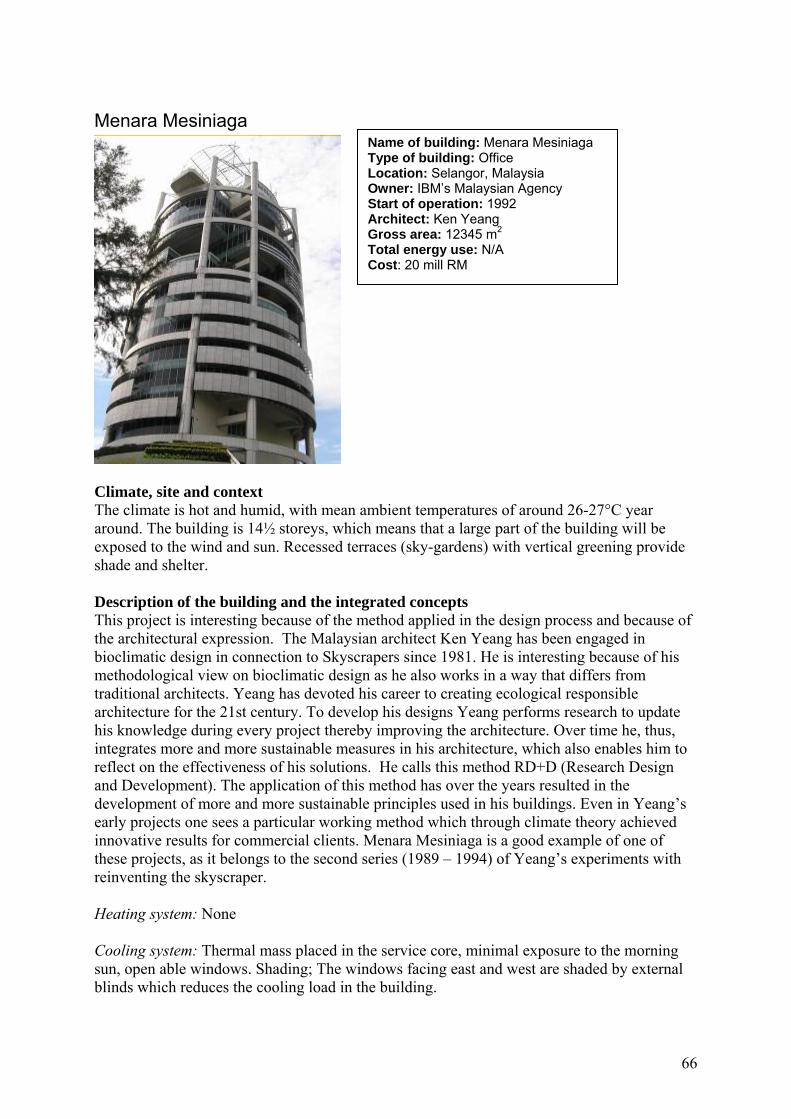
66
Menara Mesiniaga
Climate, site and context The climate is hot and humid, with mean ambient temperatures of around 26-27°C year around. The building is 14½ storeys, which means that a large part of the building will be exposed to the wind and sun. Recessed terraces (sky-gardens) with vertical greening provide shade and shelter. Description of the building and the integrated concepts This project is interesting because of the method applied in the design process and because of the architectural expression. The Malaysian architect Ken Yeang has been engaged in bioclimatic design in connection to Skyscrapers since 1981. He is interesting because of his methodological view on bioclimatic design as he also works in a way that differs from traditional architects. Yeang has devoted his career to creating ecological responsible architecture for the 21st century. To develop his designs Yeang performs research to update his knowledge during every project thereby improving the architecture. Over time he, thus, integrates more and more sustainable measures in his architecture, which also enables him to reflect on the effectiveness of his solutions. He calls this method RD+D (Research Design and Development). The application of this method has over the years resulted in the development of more and more sustainable principles used in his buildings. Even in Yeang’s early projects one sees a particular working method which through climate theory achieved innovative results for commercial clients. Menara Mesiniaga is a good example of one of these projects, as it belongs to the second series (1989 – 1994) of Yeang’s experiments with reinventing the skyscraper. Heating system: None Cooling system: Thermal mass placed in the service core, minimal exposure to the morning sun, open able windows. Shading; The windows facing east and west are shaded by external blinds which reduces the cooling load in the building.
Name of building: Menara Mesiniaga Type of building: Office Location: Selangor, Malaysia Owner: IBM’s Malaysian Agency Start of operation: 1992 Architect: Ken Yeang Gross area: 12345 m2 Total energy use: N/A Cost: 20 mill RM
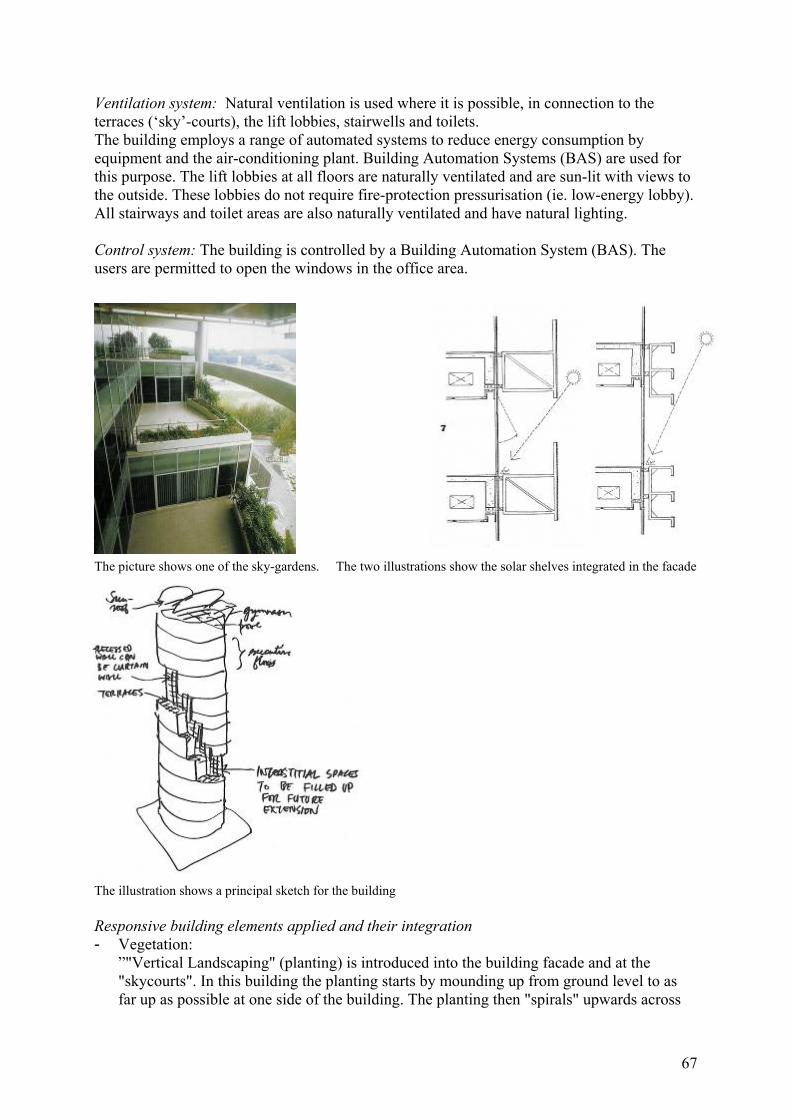
67
Ventilation system: Natural ventilation is used where it is possible, in connection to the terraces (‘sky’-courts), the lift lobbies, stairwells and toilets. The building employs a range of automated systems to reduce energy consumption by equipment and the air-conditioning plant. Building Automation Systems (BAS) are used for this purpose. The lift lobbies at all floors are naturally ventilated and are sun-lit with views to the outside. These lobbies do not require fire-protection pressurisation (ie. low-energy lobby). All stairways and toilet areas are also naturally ventilated and have natural lighting. Control system: The building is controlled by a Building Automation System (BAS). The users are permitted to open the windows in the office area.
The picture shows one of the sky-gardens. The two illustrations show the solar shelves integrated in the facade
The illustration shows a principal sketch for the building Responsive building elements applied and their integration - Vegetation:
”"Vertical Landscaping" (planting) is introduced into the building facade and at the "skycourts". In this building the planting starts by mounding up from ground level to as far up as possible at one side of the building. The planting then "spirals" upwards across
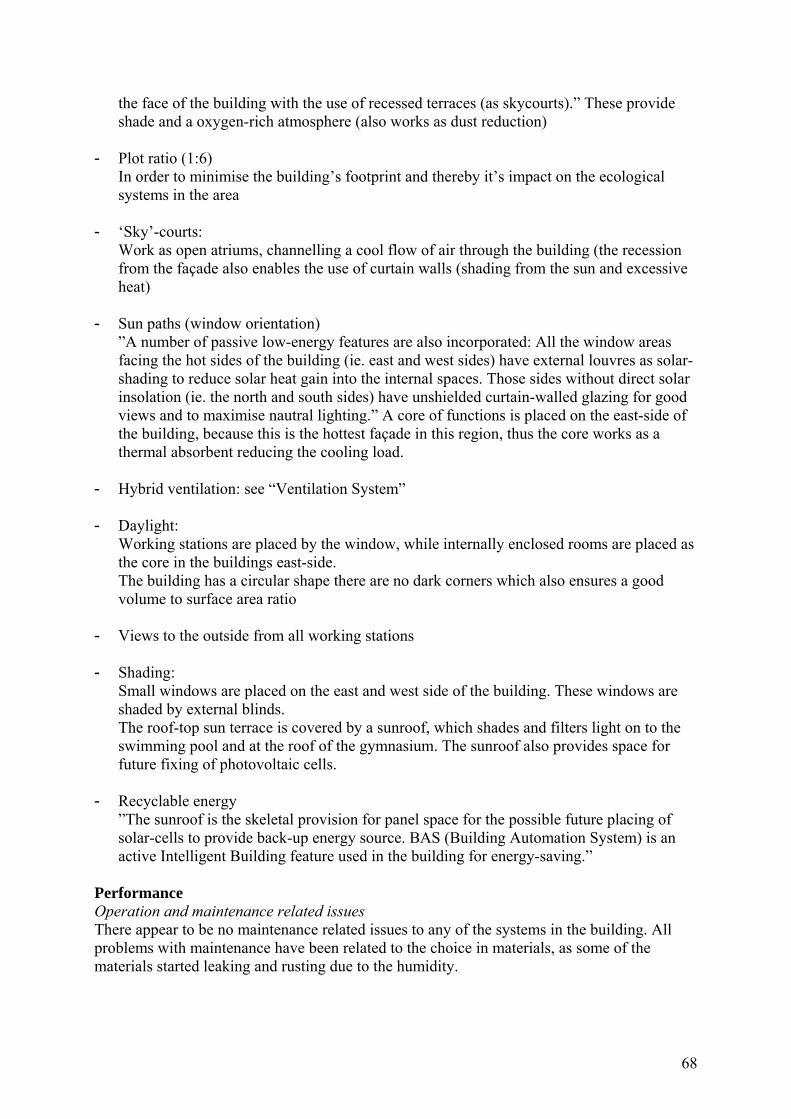
68
the face of the building with the use of recessed terraces (as skycourts).” These provide shade and a oxygen-rich atmosphere (also works as dust reduction)
- Plot ratio (1:6) In order to minimise the building’s footprint and thereby it’s impact on the ecological systems in the area
- ‘Sky’-courts: Work as open atriums, channelling a cool flow of air through the building (the recession from the façade also enables the use of curtain walls (shading from the sun and excessive heat)
- Sun paths (window orientation) ”A number of passive low-energy features are also incorporated: All the window areas facing the hot sides of the building (ie. east and west sides) have external louvres as solar-shading to reduce solar heat gain into the internal spaces. Those sides without direct solar insolation (ie. the north and south sides) have unshielded curtain-walled glazing for good views and to maximise nautral lighting.” A core of functions is placed on the east-side of the building, because this is the hottest façade in this region, thus the core works as a thermal absorbent reducing the cooling load.
- Hybrid ventilation: see “Ventilation System”
- Daylight: Working stations are placed by the window, while internally enclosed rooms are placed as the core in the buildings east-side. The building has a circular shape there are no dark corners which also ensures a good volume to surface area ratio
- Views to the outside from all working stations
- Shading: Small windows are placed on the east and west side of the building. These windows are shaded by external blinds. The roof-top sun terrace is covered by a sunroof, which shades and filters light on to the swimming pool and at the roof of the gymnasium. The sunroof also provides space for future fixing of photovoltaic cells.
- Recyclable energy ”The sunroof is the skeletal provision for panel space for the possible future placing of solar-cells to provide back-up energy source. BAS (Building Automation System) is an active Intelligent Building feature used in the building for energy-saving.”
Performance Operation and maintenance related issues There appear to be no maintenance related issues to any of the systems in the building. All problems with maintenance have been related to the choice in materials, as some of the materials started leaking and rusting due to the humidity.

69
Economy Investment cost: Total cost: 20,000,000 RM, Interior Design 3,000,000 RM Euro, Grand Total 23,000,000 RM Architectural issues The architectural vision in relation to the technical solutions: The building has a high-tech feel to it, which is correspondent with the image of the client (IBM). The technical solutions were integrated into the aesthetic solutions in the building, such as the service core, thermal mass, natural ventilation, sky-gardens, construction etc. Elements in the building providing architectural quality: - Flexible and open plan - The sky-gardens; provide green areas close to the work station, while clearing up the air
and enabling the ventilation strategy and the vertical greening. - The concept for the building is very much in the spirit with the image of the client. - The service functions in the building, such as the swimming pool on the roof and the
gymnasium provide a quality for the employees. Design and construction processes The general objectives for the project were: - “Control of fresh air and air movement - Access to operable windows - Potential for natural ventilation - A good view - Access to green space - Access to transitorial spaces - Receiving natural sunlight. - Control of lighting level - Greater comfort in furnishings - Ability to move furniture - Provision of interior and exterior area for relaxation - A greater feeling of spaciousness - Better heating and cooling - Adjustable temperatures - Less noise and distraction - Better amenities - Provision of recreational facilities - Awareness of place - Awareness of seasons of the year - Recreation of ground condition in the sky through elevated gardens - Bioclimatic functioning of the building - Interaction with nature, sunlight and shadow” Open questions and needs for future research It would be interesting to see if the principles Yeang has developed since 1979 will work in a different climate or to develop similar principles to fit other types of climate. References http://www.theweathernetwork.com/weather/stats/pages/C01184.htm?MYXX0008 date July 7th 2005

70
http://www.trhamzahyeang.com/project/skyscrapers/mesiniaga01.html date July 30th 2005
Ken Yeang (1994), “Bioclimatic Skyscrapers”, Artemis, London, England.
http://archnet.org/library/sites/one-site.tcl?site_id=1231 date July 30th 2005
http://www.mesiniaga.com.my/web/mbsite.nsf/public/newsroom7.html date July 30th 2005
Robert Powell (1999), “Rethinking the Skyscraper – The complete architecture of Ken Yeang”, London, England
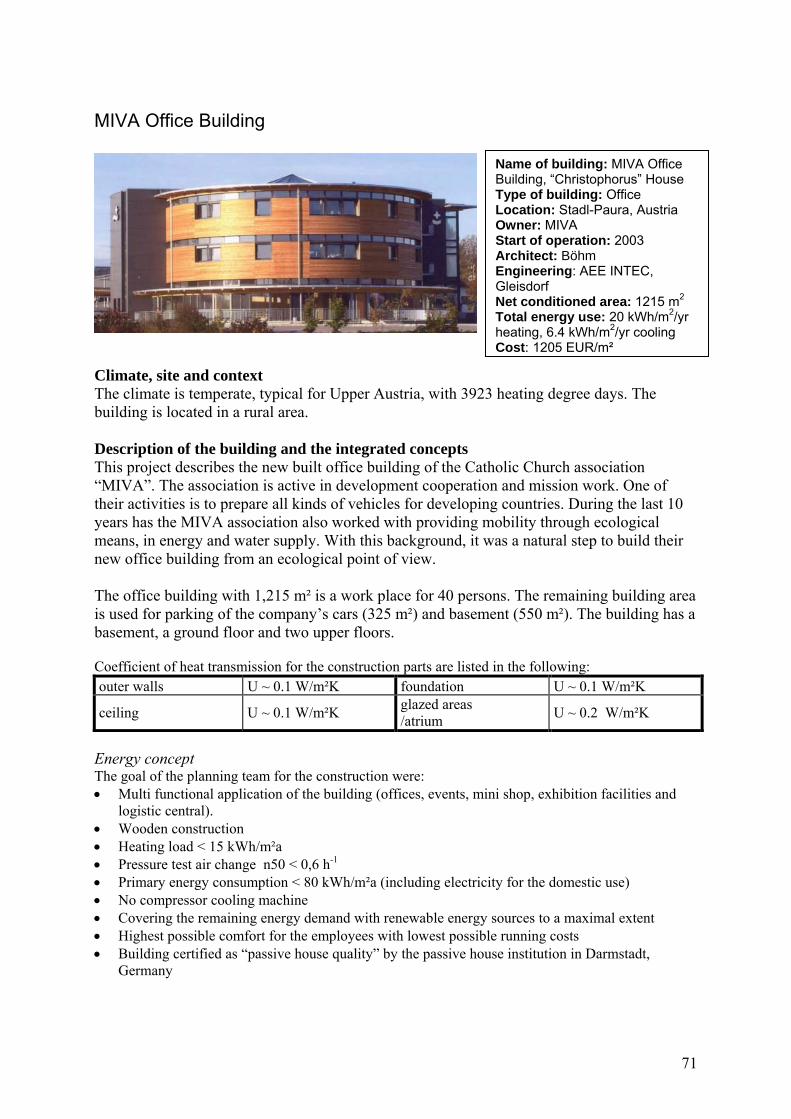
71
MIVA Office Building
Climate, site and context The climate is temperate, typical for Upper Austria, with 3923 heating degree days. The building is located in a rural area. Description of the building and the integrated concepts This project describes the new built office building of the Catholic Church association “MIVA”. The association is active in development cooperation and mission work. One of their activities is to prepare all kinds of vehicles for developing countries. During the last 10 years has the MIVA association also worked with providing mobility through ecological means, in energy and water supply. With this background, it was a natural step to build their new office building from an ecological point of view. The office building with 1,215 m² is a work place for 40 persons. The remaining building area is used for parking of the company’s cars (325 m²) and basement (550 m²). The building has a basement, a ground floor and two upper floors. Coefficient of heat transmission for the construction parts are listed in the following: outer walls U ~ 0.1 W/m²K foundation U ~ 0.1 W/m²K
ceiling U ~ 0.1 W/m²K glazed areas /atrium U ~ 0.2 W/m²K
Energy concept The goal of the planning team for the construction were: • Multi functional application of the building (offices, events, mini shop, exhibition facilities and
logistic central). • Wooden construction • Heating load < 15 kWh/m²a • Pressure test air change n50 < 0,6 h-1 • Primary energy consumption < 80 kWh/m²a (including electricity for the domestic use) • No compressor cooling machine • Covering the remaining energy demand with renewable energy sources to a maximal extent • Highest possible comfort for the employees with lowest possible running costs • Building certified as “passive house quality” by the passive house institution in Darmstadt,
Germany
Name of building: MIVA Office Building, “Christophorus” House Type of building: Office Location: Stadl-Paura, Austria Owner: MIVA Start of operation: 2003 Architect: Böhm Engineering: AEE INTEC, Gleisdorf Net conditioned area: 1215 m2 Total energy use: 20 kWh/m2/yr heating, 6.4 kWh/m2/yr cooling Cost: 1205 EUR/m²
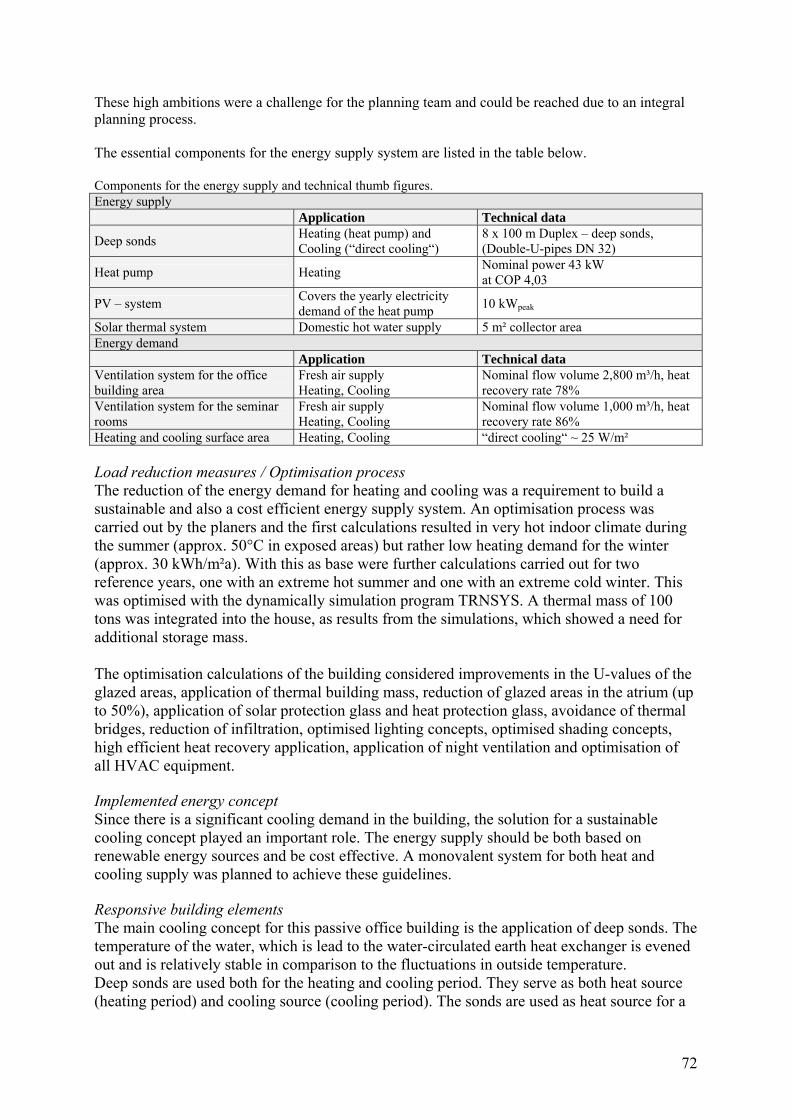
72
These high ambitions were a challenge for the planning team and could be reached due to an integral planning process. The essential components for the energy supply system are listed in the table below. Components for the energy supply and technical thumb figures. Energy supply Application Technical data
Deep sonds Heating (heat pump) and Cooling (“direct cooling“)
8 x 100 m Duplex – deep sonds, (Double-U-pipes DN 32)
Heat pump Heating Nominal power 43 kW at COP 4,03
PV – system Covers the yearly electricity demand of the heat pump 10 kWpeak
Solar thermal system Domestic hot water supply 5 m² collector area Energy demand Application Technical data Ventilation system for the office building area
Fresh air supply Heating, Cooling
Nominal flow volume 2,800 m³/h, heat recovery rate 78%
Ventilation system for the seminar rooms
Fresh air supply Heating, Cooling
Nominal flow volume 1,000 m³/h, heat recovery rate 86%
Heating and cooling surface area Heating, Cooling “direct cooling“ ~ 25 W/m² Load reduction measures / Optimisation process The reduction of the energy demand for heating and cooling was a requirement to build a sustainable and also a cost efficient energy supply system. An optimisation process was carried out by the planers and the first calculations resulted in very hot indoor climate during the summer (approx. 50°C in exposed areas) but rather low heating demand for the winter (approx. 30 kWh/m²a). With this as base were further calculations carried out for two reference years, one with an extreme hot summer and one with an extreme cold winter. This was optimised with the dynamically simulation program TRNSYS. A thermal mass of 100 tons was integrated into the house, as results from the simulations, which showed a need for additional storage mass. The optimisation calculations of the building considered improvements in the U-values of the glazed areas, application of thermal building mass, reduction of glazed areas in the atrium (up to 50%), application of solar protection glass and heat protection glass, avoidance of thermal bridges, reduction of infiltration, optimised lighting concepts, optimised shading concepts, high efficient heat recovery application, application of night ventilation and optimisation of all HVAC equipment. Implemented energy concept Since there is a significant cooling demand in the building, the solution for a sustainable cooling concept played an important role. The energy supply should be both based on renewable energy sources and be cost effective. A monovalent system for both heat and cooling supply was planned to achieve these guidelines. Responsive building elements The main cooling concept for this passive office building is the application of deep sonds. The temperature of the water, which is lead to the water-circulated earth heat exchanger is evened out and is relatively stable in comparison to the fluctuations in outside temperature. Deep sonds are used both for the heating and cooling period. They serve as both heat source (heating period) and cooling source (cooling period). The sonds are used as heat source for a
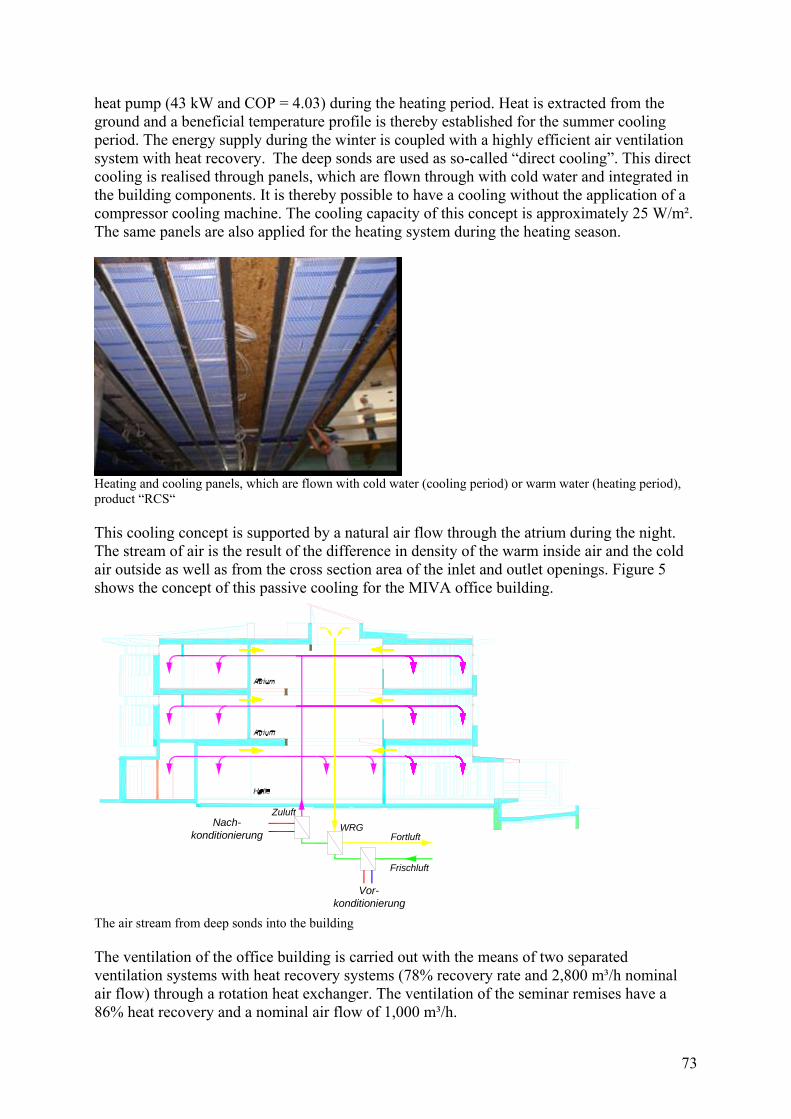
73
heat pump (43 kW and COP = 4.03) during the heating period. Heat is extracted from the ground and a beneficial temperature profile is thereby established for the summer cooling period. The energy supply during the winter is coupled with a highly efficient air ventilation system with heat recovery. The deep sonds are used as so-called “direct cooling”. This direct cooling is realised through panels, which are flown through with cold water and integrated in the building components. It is thereby possible to have a cooling without the application of a compressor cooling machine. The cooling capacity of this concept is approximately 25 W/m². The same panels are also applied for the heating system during the heating season.
Heating and cooling panels, which are flown with cold water (cooling period) or warm water (heating period), product “RCS“ This cooling concept is supported by a natural air flow through the atrium during the night. The stream of air is the result of the difference in density of the warm inside air and the cold air outside as well as from the cross section area of the inlet and outlet openings. Figure 5 shows the concept of this passive cooling for the MIVA office building.
Nach-konditionierung
WRG
Vor-konditionierung
Frischluft
Zuluft
Fortluft
The air stream from deep sonds into the building The ventilation of the office building is carried out with the means of two separated ventilation systems with heat recovery systems (78% recovery rate and 2,800 m³/h nominal air flow) through a rotation heat exchanger. The ventilation of the seminar remises have a 86% heat recovery and a nominal air flow of 1,000 m³/h.
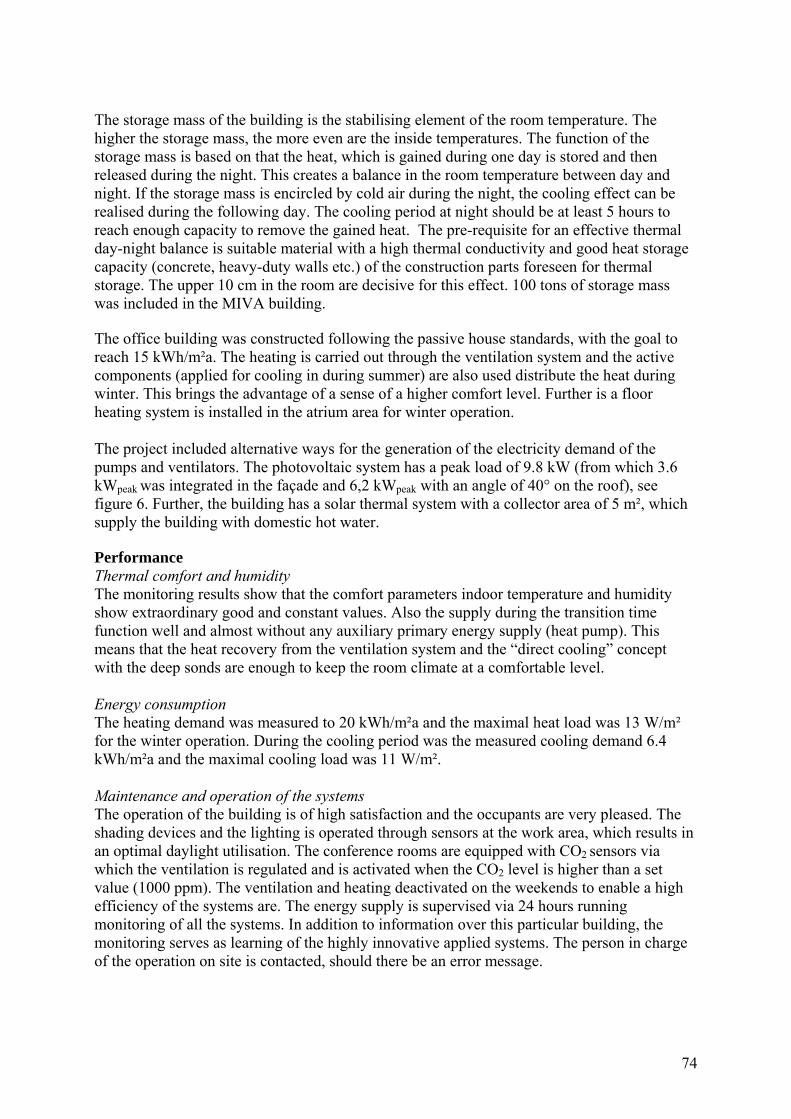
74
The storage mass of the building is the stabilising element of the room temperature. The higher the storage mass, the more even are the inside temperatures. The function of the storage mass is based on that the heat, which is gained during one day is stored and then released during the night. This creates a balance in the room temperature between day and night. If the storage mass is encircled by cold air during the night, the cooling effect can be realised during the following day. The cooling period at night should be at least 5 hours to reach enough capacity to remove the gained heat. The pre-requisite for an effective thermal day-night balance is suitable material with a high thermal conductivity and good heat storage capacity (concrete, heavy-duty walls etc.) of the construction parts foreseen for thermal storage. The upper 10 cm in the room are decisive for this effect. 100 tons of storage mass was included in the MIVA building. The office building was constructed following the passive house standards, with the goal to reach 15 kWh/m²a. The heating is carried out through the ventilation system and the active components (applied for cooling in during summer) are also used distribute the heat during winter. This brings the advantage of a sense of a higher comfort level. Further is a floor heating system is installed in the atrium area for winter operation. The project included alternative ways for the generation of the electricity demand of the pumps and ventilators. The photovoltaic system has a peak load of 9.8 kW (from which 3.6 kWpeak was integrated in the façade and 6,2 kWpeak with an angle of 40° on the roof), see figure 6. Further, the building has a solar thermal system with a collector area of 5 m², which supply the building with domestic hot water. Performance Thermal comfort and humidity The monitoring results show that the comfort parameters indoor temperature and humidity show extraordinary good and constant values. Also the supply during the transition time function well and almost without any auxiliary primary energy supply (heat pump). This means that the heat recovery from the ventilation system and the “direct cooling” concept with the deep sonds are enough to keep the room climate at a comfortable level. Energy consumption The heating demand was measured to 20 kWh/m²a and the maximal heat load was 13 W/m² for the winter operation. During the cooling period was the measured cooling demand 6.4 kWh/m²a and the maximal cooling load was 11 W/m². Maintenance and operation of the systems The operation of the building is of high satisfaction and the occupants are very pleased. The shading devices and the lighting is operated through sensors at the work area, which results in an optimal daylight utilisation. The conference rooms are equipped with CO2 sensors via which the ventilation is regulated and is activated when the CO2 level is higher than a set value (1000 ppm). The ventilation and heating deactivated on the weekends to enable a high efficiency of the systems are. The energy supply is supervised via 24 hours running monitoring of all the systems. In addition to information over this particular building, the monitoring serves as learning of the highly innovative applied systems. The person in charge of the operation on site is contacted, should there be an error message.

75
Costs The establishing costs for the entire building complex were 1,205 EUR/m², without royalties. The running costs for the heat pump (7,5 kWh/m²a) and for the HVAC equipment operation (42 kWh/m²a) can be calculated in total with an electricity price of 0,14 €/kWh (+20% sales tax) and a total yearly electricity consumption of 108,742 kWh. This results in running electricity cost of 15,224 € (+20% sales tax). Design and construction processes This project is of best practice character because of the very early integrated planning process with the planning team (architectures, energy engineers, civil engineers). With this expertise working team could lower running costs be achieved and the CO2 emissions are 80% lower than those for a conventional office building. The energy systems and the application of the building have worked in an optimal way ever since it was taken into operation in 2003. The initiative of the project was the building owner, who contacted AEE INTEC and asked for an expertise consultation before the project was started. AEE INTEC coordinated the entire planning process and carried out the energetic calculations and optimisations. It was shown that such coordination with one partner acting as “energy party in charge” was of great importance of such innovative construction project. This coordinator not only dealt with the conventional energy processes, but also keep the overview of the energy relevant areas and acted as the link between the project partners (building owner, architecture, planner, engineers engaged in static calculations, constructional physicist etc.). It is of high importance that the planning of the building operation coincides with the use of the building as far as possible to get good operational results, i.e. the planed use of the building has to be as realistic as possible. The financial planning of the project was done by the building owner, who’s wish was to apply sustainable energy technology and reach a passive house standard References Ernst Blümel, AEE Intec, Gleisdorf, Austria.

76
M+W Zander
Climate, site and context The climate is temperate (middle Europe), with 3390 heating degree days 3390. The building is situated in an urban area, with light industry, surrounded by buildings of approximately same height, place close to the green area. Description of the building and the integrated building concepts The global concept utilize the passive solar energy using a winter garden, the light stream architecture, the Thermo Active Building System (TABS) is used in one of the buildings in the complex (further described in detail) in the association with the supply of the fresh air. The energy supply concept consists of the following elements: • Thermal Solar collectors • Photovoltaic (shading elements) • Free night cooling • Rain water buffer tank • TABS with Fresh Air Conditioning The complex of M+W Zander includes four buildings. They are called as follows: Production Hall, round shaped building with offices - “Tower”, Link Building which connects old and new part of the complex, newly built Annex Building. Time of the occupancy is from 8am to 5pm, from Monday to Friday. Gross complex area: 10.000 m2, Net conditioned area: 10.000 m2 (6.500 m2 heated/cooled by TABS - annex building). Number of floors: ground floor + 5 floors (6-storey building) Construction type: The load bearing skeleton in reinforced concrete consists of pillars (columns) with a distance of 15 m and flat concrete ceiling slabs of 300mm (Figure 5).
Name of building: M+W Zander Type of building: Office Location: Stuttgart, Germany Owner: M+W Zander Start of operation: 1998 Architect: Engineering: Net conditioned area: 10 000 m2 Total energy use: Cost:
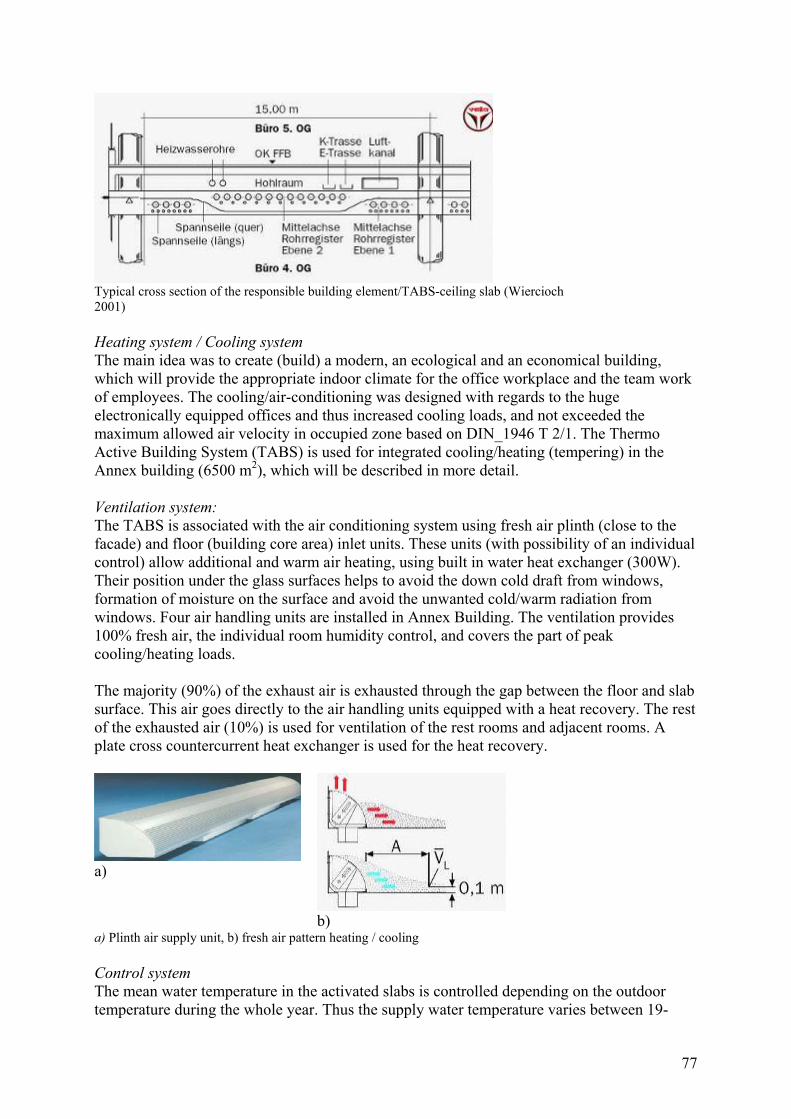
77
Typical cross section of the responsible building element/TABS-ceiling slab (Wiercioch 2001) Heating system / Cooling system The main idea was to create (build) a modern, an ecological and an economical building, which will provide the appropriate indoor climate for the office workplace and the team work of employees. The cooling/air-conditioning was designed with regards to the huge electronically equipped offices and thus increased cooling loads, and not exceeded the maximum allowed air velocity in occupied zone based on DIN_1946 T 2/1. The Thermo Active Building System (TABS) is used for integrated cooling/heating (tempering) in the Annex building (6500 m2), which will be described in more detail. Ventilation system: The TABS is associated with the air conditioning system using fresh air plinth (close to the facade) and floor (building core area) inlet units. These units (with possibility of an individual control) allow additional and warm air heating, using built in water heat exchanger (300W). Their position under the glass surfaces helps to avoid the down cold draft from windows, formation of moisture on the surface and avoid the unwanted cold/warm radiation from windows. Four air handling units are installed in Annex Building. The ventilation provides 100% fresh air, the individual room humidity control, and covers the part of peak cooling/heating loads. The majority (90%) of the exhaust air is exhausted through the gap between the floor and slab surface. This air goes directly to the air handling units equipped with a heat recovery. The rest of the exhausted air (10%) is used for ventilation of the rest rooms and adjacent rooms. A plate cross countercurrent heat exchanger is used for the heat recovery.
a)
b) a) Plinth air supply unit, b) fresh air pattern heating / cooling Control system The mean water temperature in the activated slabs is controlled depending on the outdoor temperature during the whole year. Thus the supply water temperature varies between 19-
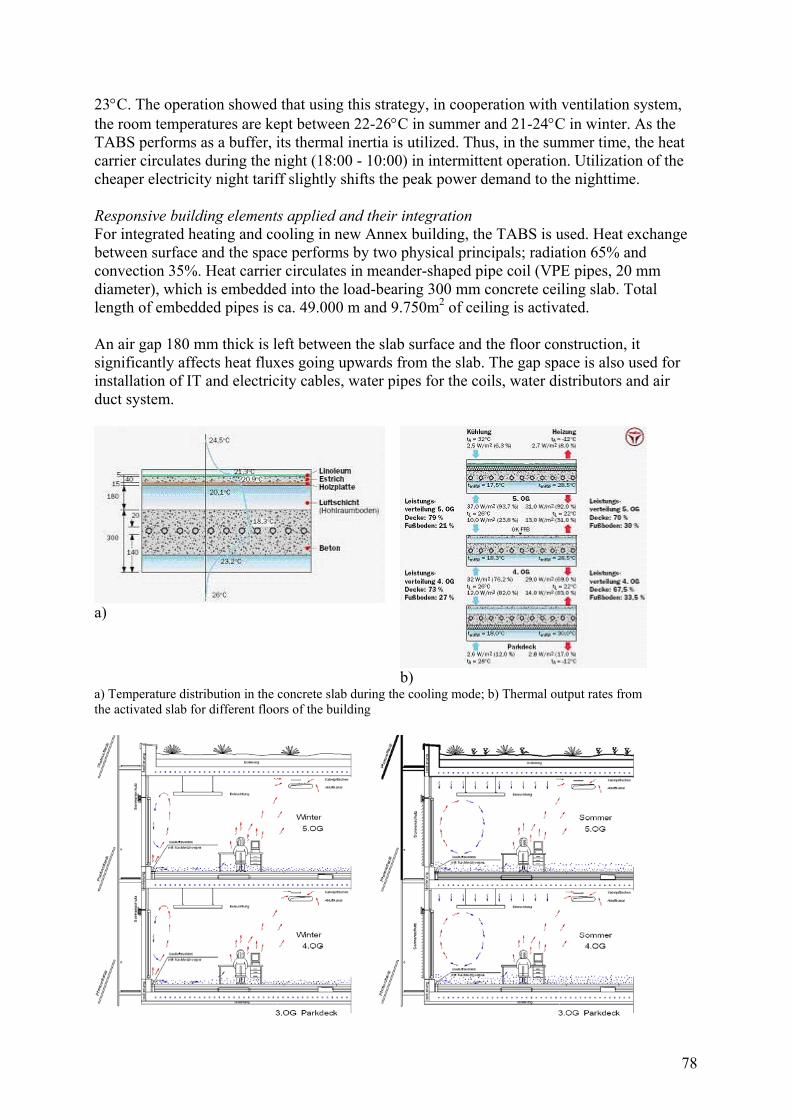
78
23°C. The operation showed that using this strategy, in cooperation with ventilation system, the room temperatures are kept between 22-26°C in summer and 21-24°C in winter. As the TABS performs as a buffer, its thermal inertia is utilized. Thus, in the summer time, the heat carrier circulates during the night (18:00 - 10:00) in intermittent operation. Utilization of the cheaper electricity night tariff slightly shifts the peak power demand to the nighttime. Responsive building elements applied and their integration For integrated heating and cooling in new Annex building, the TABS is used. Heat exchange between surface and the space performs by two physical principals; radiation 65% and convection 35%. Heat carrier circulates in meander-shaped pipe coil (VPE pipes, 20 mm diameter), which is embedded into the load-bearing 300 mm concrete ceiling slab. Total length of embedded pipes is ca. 49.000 m and 9.750m2 of ceiling is activated. An air gap 180 mm thick is left between the slab surface and the floor construction, it significantly affects heat fluxes going upwards from the slab. The gap space is also used for installation of IT and electricity cables, water pipes for the coils, water distributors and air duct system.
a)
b) a) Temperature distribution in the concrete slab during the cooling mode; b) Thermal output rates from the activated slab for different floors of the building
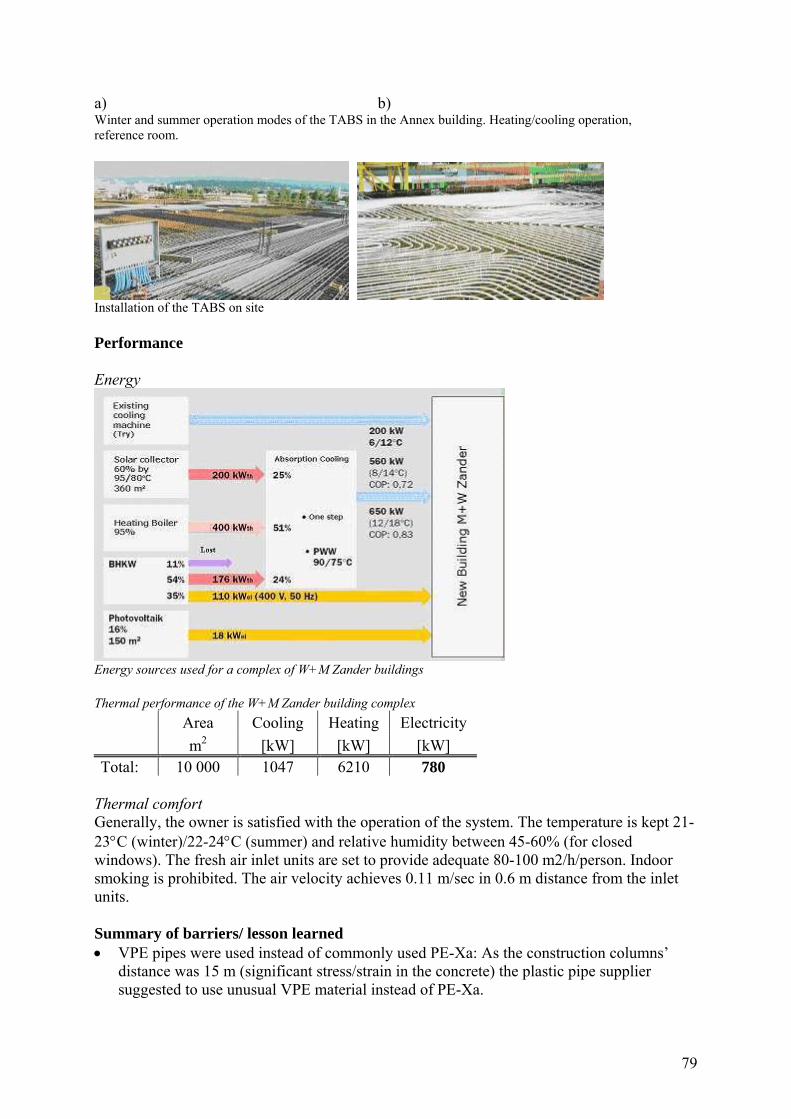
79
a) b) Winter and summer operation modes of the TABS in the Annex building. Heating/cooling operation, reference room.
Installation of the TABS on site Performance Energy
Energy sources used for a complex of W+M Zander buildings Thermal performance of the W+M Zander building complex
Area Cooling Heating Electricity m2 [kW] [kW] [kW]
Total: 10 000 1047 6210 780 Thermal comfort Generally, the owner is satisfied with the operation of the system. The temperature is kept 21-23°C (winter)/22-24°C (summer) and relative humidity between 45-60% (for closed windows). The fresh air inlet units are set to provide adequate 80-100 m2/h/person. Indoor smoking is prohibited. The air velocity achieves 0.11 m/sec in 0.6 m distance from the inlet units. Summary of barriers/ lesson learned • VPE pipes were used instead of commonly used PE-Xa: As the construction columns’
distance was 15 m (significant stress/strain in the concrete) the plastic pipe supplier suggested to use unusual VPE material instead of PE-Xa.

80
• After starting the operation it appeared, that the design value of the inlet temperature gave the system higher capacity than need. Next optimization showed the supply water temperature range of 19 – 23 °C was sufficient, while it is controlled in dependence on the outdoor temperature during whole year.
• The system was not designed to cover 100% of the thermal loads. Installation showed that using TABS is suitable to provide specific thermal output of 45-50 W/m2. If this is insufficient to provide thermal comfort, additional heating/cooling by plinth air supply units is used.
• The temperature difference supply/return was 3K, however according to the experience from the system operation it can be shifted to the 4-5 K
• Summer night operation utilizes thermal inertia of concrete slab as the thermal buffer, and thus save expensive electrical energy (day tariff). The results of the measurements show that this operation does not affect (impair) the thermal comfort. The measured daytime temperature drift on the lower surface of the ceiling was 1.5K (21-22.5°C).
References Jan Babiak, DTU Lyngby, Denmark/STU Bratislava, Slovakia
Jakub Kolarik, DTU Lyngby, Denmark
Olesen, B. W. 2001 Messungen und Bewertung der Betonkernaktivierung in drei Gebaeuden, In proc: 23.Velta kongress 2001, Wirsbo-Velta, Nordestedt, Germany
Wiercioch, H. 2001 Betriebserfahrung mit Betonkernaktivierung, BV M+W Zander Stuttgart, In proc: 23.Velta kongress 2001, Wirsbo-Velta, Nordestedt, Germany
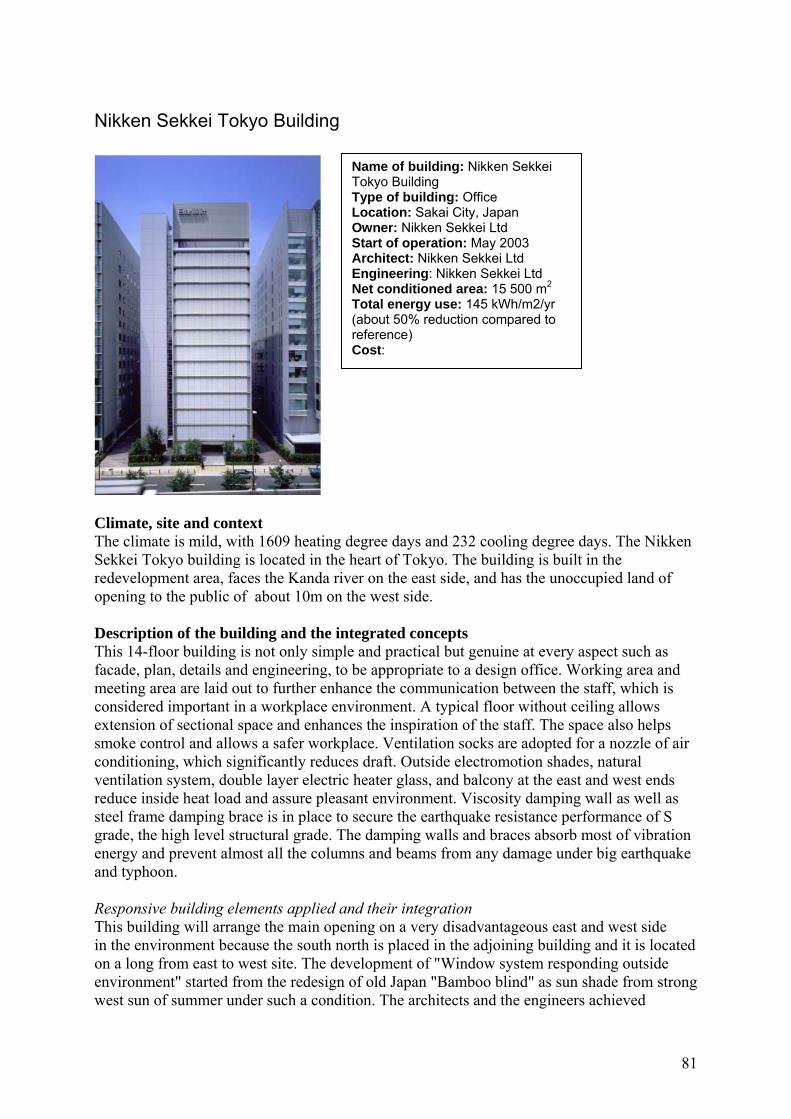
81
Nikken Sekkei Tokyo Building
Climate, site and context The climate is mild, with 1609 heating degree days and 232 cooling degree days. The Nikken Sekkei Tokyo building is located in the heart of Tokyo. The building is built in the redevelopment area, faces the Kanda river on the east side, and has the unoccupied land of opening to the public of about 10m on the west side. Description of the building and the integrated concepts This 14-floor building is not only simple and practical but genuine at every aspect such as facade, plan, details and engineering, to be appropriate to a design office. Working area and meeting area are laid out to further enhance the communication between the staff, which is considered important in a workplace environment. A typical floor without ceiling allows extension of sectional space and enhances the inspiration of the staff. The space also helps smoke control and allows a safer workplace. Ventilation socks are adopted for a nozzle of air conditioning, which significantly reduces draft. Outside electromotion shades, natural ventilation system, double layer electric heater glass, and balcony at the east and west ends reduce inside heat load and assure pleasant environment. Viscosity damping wall as well as steel frame damping brace is in place to secure the earthquake resistance performance of S grade, the high level structural grade. The damping walls and braces absorb most of vibration energy and prevent almost all the columns and beams from any damage under big earthquake and typhoon. Responsive building elements applied and their integration This building will arrange the main opening on a very disadvantageous east and west side in the environment because the south north is placed in the adjoining building and it is located on a long from east to west site. The development of "Window system responding outside environment" started from the redesign of old Japan "Bamboo blind" as sun shade from strong west sun of summer under such a condition. The architects and the engineers achieved
Name of building: Nikken Sekkei Tokyo Building Type of building: Office Location: Sakai City, Japan Owner: Nikken Sekkei Ltd Start of operation: May 2003 Architect: Nikken Sekkei Ltd Engineering: Nikken Sekkei Ltd Net conditioned area: 15 500 m2 Total energy use: 145 kWh/m2/yr (about 50% reduction compared to reference) Cost:
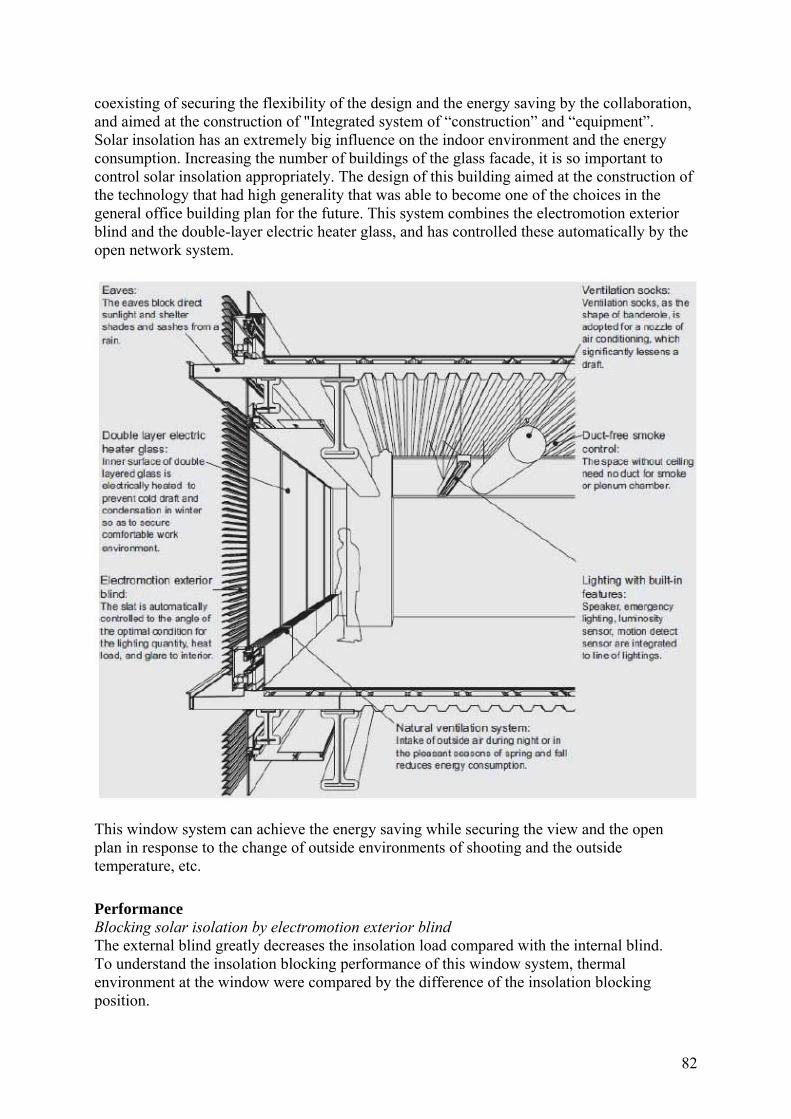
82
coexisting of securing the flexibility of the design and the energy saving by the collaboration, and aimed at the construction of "Integrated system of “construction” and “equipment”. Solar insolation has an extremely big influence on the indoor environment and the energy consumption. Increasing the number of buildings of the glass facade, it is so important to control solar insolation appropriately. The design of this building aimed at the construction of the technology that had high generality that was able to become one of the choices in the general office building plan for the future. This system combines the electromotion exterior blind and the double-layer electric heater glass, and has controlled these automatically by the open network system.
This window system can achieve the energy saving while securing the view and the open plan in response to the change of outside environments of shooting and the outside temperature, etc. Performance Blocking solar isolation by electromotion exterior blind The external blind greatly decreases the insolation load compared with the internal blind. To understand the insolation blocking performance of this window system, thermal environment at the window were compared by the difference of the insolation blocking position.
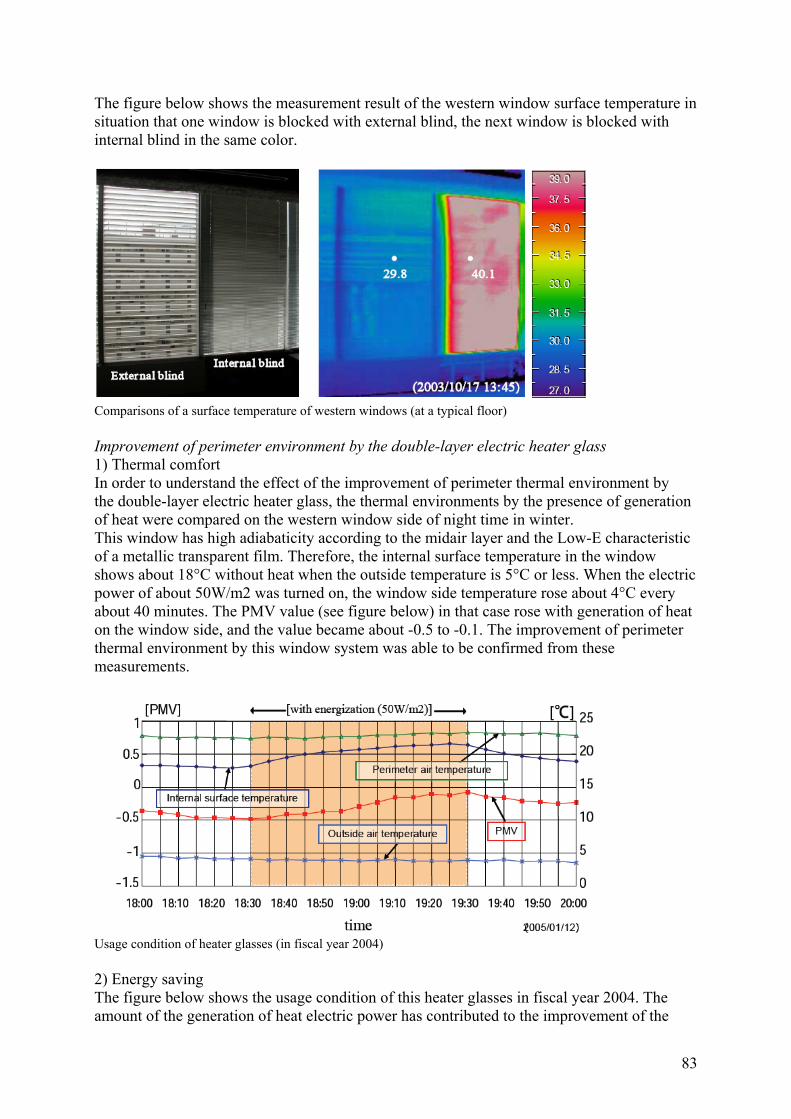
83
The figure below shows the measurement result of the western window surface temperature in situation that one window is blocked with external blind, the next window is blocked with internal blind in the same color.
2 Comparisons of a surface temperature of western windows (at a typical floor) 9.8 40.1External blind Improvement of perimeter environment by the double-layer electric heater glass 1) Thermal comfort In order to understand the effect of the improvement of perimeter thermal environment by the double-layer electric heater glass, the thermal environments by the presence of generation of heat were compared on the western window side of night time in winter. This window has high adiabaticity according to the midair layer and the Low-E characteristic of a metallic transparent film. Therefore, the internal surface temperature in the window shows about 18°C without heat when the outside temperature is 5°C or less. When the electric power of about 50W/m2 was turned on, the window side temperature rose about 4°C every about 40 minutes. The PMV value (see figure below) in that case rose with generation of heat on the window side, and the value became about -0.5 to -0.1. The improvement of perimeter thermal environment by this window system was able to be confirmed from these measurements.
Usage condition of heater glasses (in fiscal year 2004) 2) Energy saving The figure below shows the usage condition of this heater glasses in fiscal year 2004. The amount of the generation of heat electric power has contributed to the improvement of the
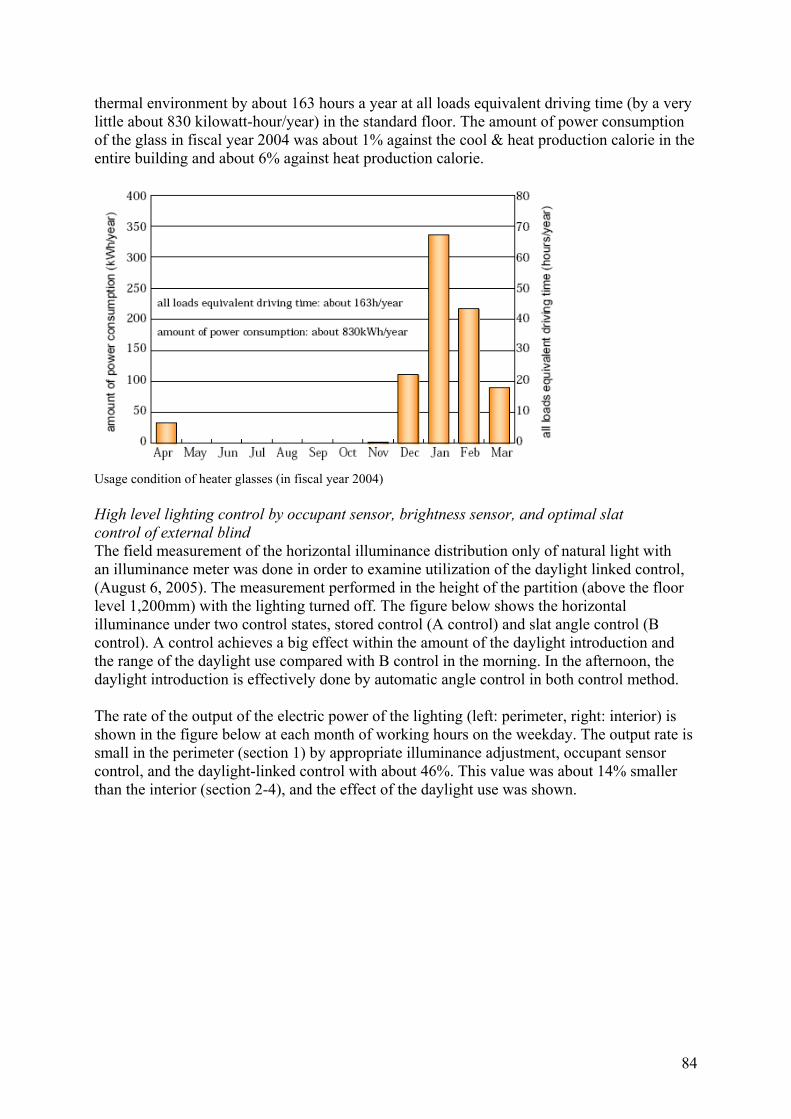
84
thermal environment by about 163 hours a year at all loads equivalent driving time (by a very little about 830 kilowatt-hour/year) in the standard floor. The amount of power consumption of the glass in fiscal year 2004 was about 1% against the cool & heat production calorie in the entire building and about 6% against heat production calorie.
Usage condition of heater glasses (in fiscal year 2004) High level lighting control by occupant sensor, brightness sensor, and optimal slat control of external blind The field measurement of the horizontal illuminance distribution only of natural light with an illuminance meter was done in order to examine utilization of the daylight linked control, (August 6, 2005). The measurement performed in the height of the partition (above the floor level 1,200mm) with the lighting turned off. The figure below shows the horizontal illuminance under two control states, stored control (A control) and slat angle control (B control). A control achieves a big effect within the amount of the daylight introduction and the range of the daylight use compared with B control in the morning. In the afternoon, the daylight introduction is effectively done by automatic angle control in both control method. The rate of the output of the electric power of the lighting (left: perimeter, right: interior) is shown in the figure below at each month of working hours on the weekday. The output rate is small in the perimeter (section 1) by appropriate illuminance adjustment, occupant sensor control, and the daylight-linked control with about 46%. This value was about 14% smaller than the interior (section 2-4), and the effect of the daylight use was shown.
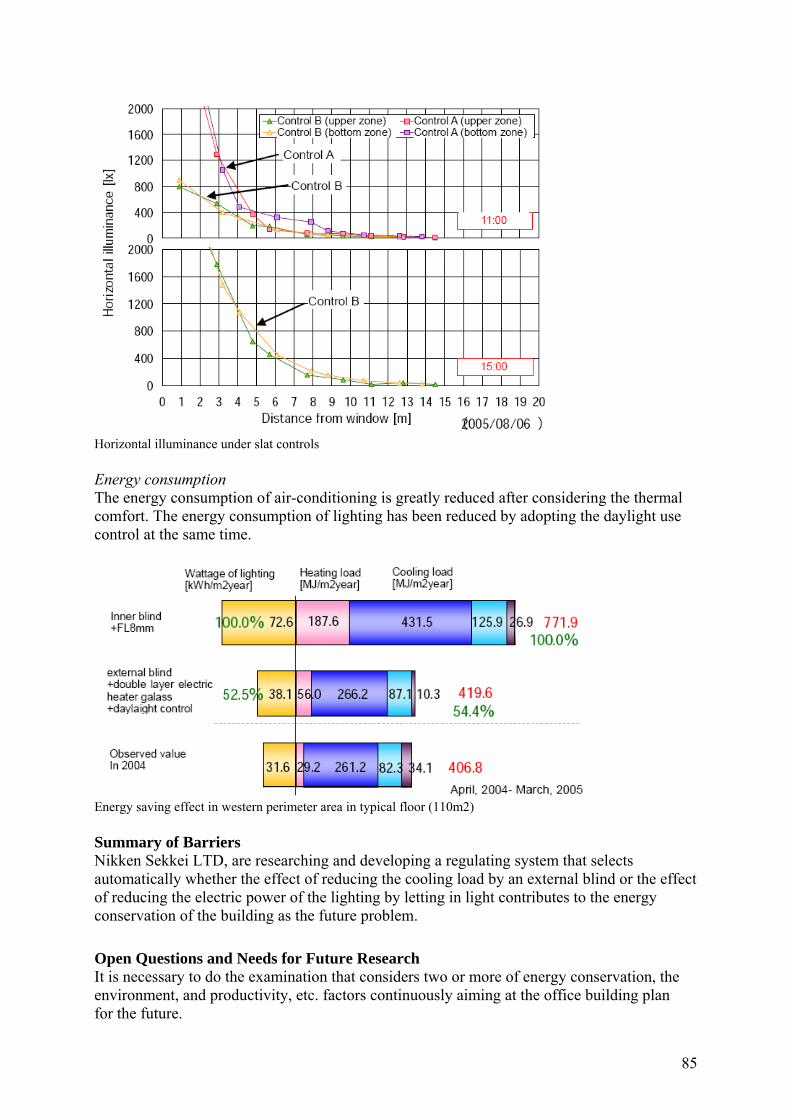
85
Horizontal illuminance under slat controls Energy consumption The energy consumption of air-conditioning is greatly reduced after considering the thermal comfort. The energy consumption of lighting has been reduced by adopting the daylight use control at the same time.
Energy saving effect in western perimeter area in typical floor (110m2) Summary of Barriers Nikken Sekkei LTD, are researching and developing a regulating system that selects automatically whether the effect of reducing the cooling load by an external blind or the effect of reducing the electric power of the lighting by letting in light contributes to the energy conservation of the building as the future problem. Open Questions and Needs for Future Research It is necessary to do the examination that considers two or more of energy conservation, the environment, and productivity, etc. factors continuously aiming at the office building plan for the future.
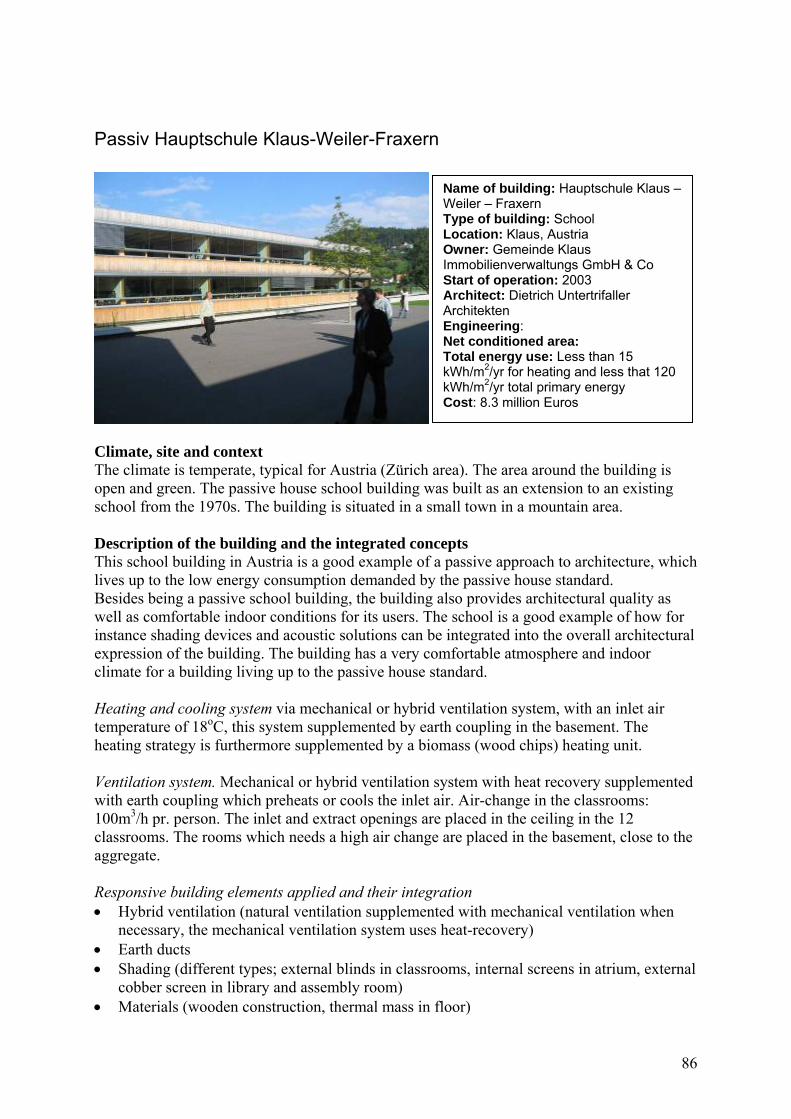
86
Passiv Hauptschule Klaus-Weiler-Fraxern
Climate, site and context The climate is temperate, typical for Austria (Zürich area). The area around the building is open and green. The passive house school building was built as an extension to an existing school from the 1970s. The building is situated in a small town in a mountain area. Description of the building and the integrated concepts This school building in Austria is a good example of a passive approach to architecture, which lives up to the low energy consumption demanded by the passive house standard. Besides being a passive school building, the building also provides architectural quality as well as comfortable indoor conditions for its users. The school is a good example of how for instance shading devices and acoustic solutions can be integrated into the overall architectural expression of the building. The building has a very comfortable atmosphere and indoor climate for a building living up to the passive house standard. Heating and cooling system via mechanical or hybrid ventilation system, with an inlet air temperature of 18oC, this system supplemented by earth coupling in the basement. The heating strategy is furthermore supplemented by a biomass (wood chips) heating unit. Ventilation system. Mechanical or hybrid ventilation system with heat recovery supplemented with earth coupling which preheats or cools the inlet air. Air-change in the classrooms: 100m3/h pr. person. The inlet and extract openings are placed in the ceiling in the 12 classrooms. The rooms which needs a high air change are placed in the basement, close to the aggregate. Responsive building elements applied and their integration • Hybrid ventilation (natural ventilation supplemented with mechanical ventilation when
necessary, the mechanical ventilation system uses heat-recovery) • Earth ducts • Shading (different types; external blinds in classrooms, internal screens in atrium, external
cobber screen in library and assembly room) • Materials (wooden construction, thermal mass in floor)
Name of building: Hauptschule Klaus – Weiler – Fraxern Type of building: School Location: Klaus, Austria Owner: Gemeinde Klaus Immobilienverwaltungs GmbH & Co Start of operation: 2003 Architect: Dietrich Untertrifaller Architekten Engineering: Net conditioned area: Total energy use: Less than 15 kWh/m2/yr for heating and less that 120 kWh/m2/yr total primary energy Cost: 8.3 million Euros
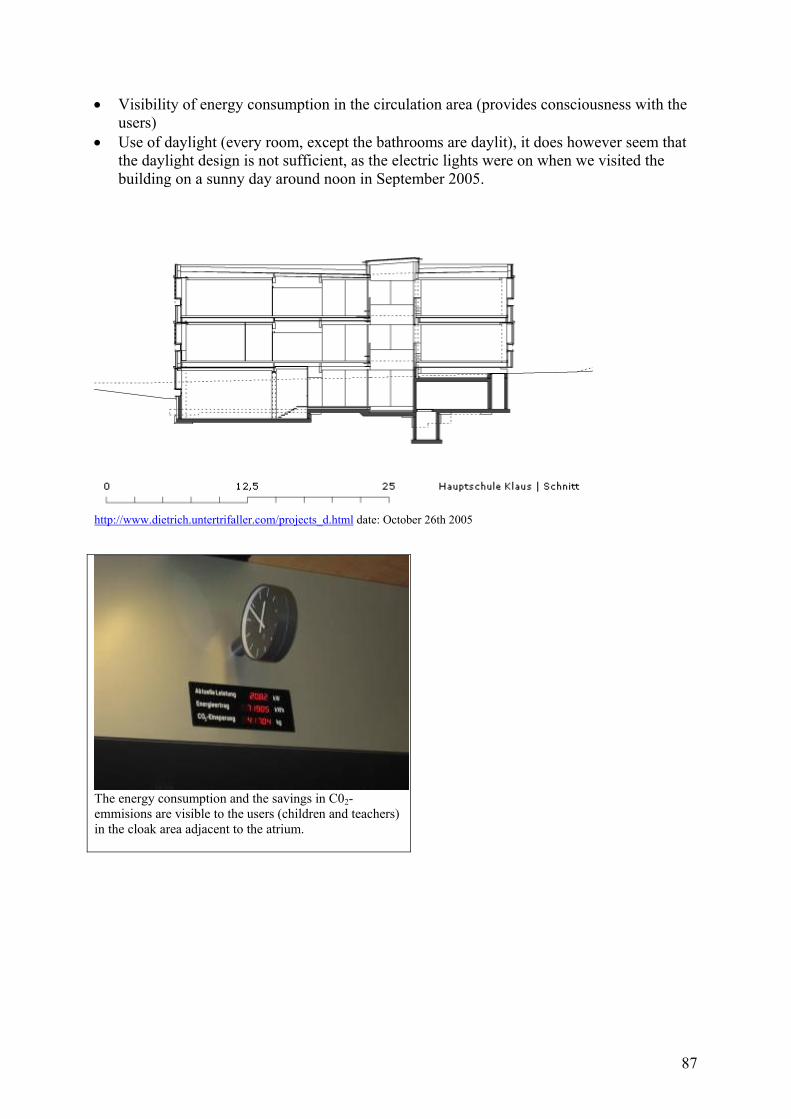
87
• Visibility of energy consumption in the circulation area (provides consciousness with the users)
• Use of daylight (every room, except the bathrooms are daylit), it does however seem that the daylight design is not sufficient, as the electric lights were on when we visited the building on a sunny day around noon in September 2005.
http://www.dietrich.untertrifaller.com/projects_d.html date: October 26th 2005
The energy consumption and the savings in C02-emmisions are visible to the users (children and teachers) in the cloak area adjacent to the atrium.
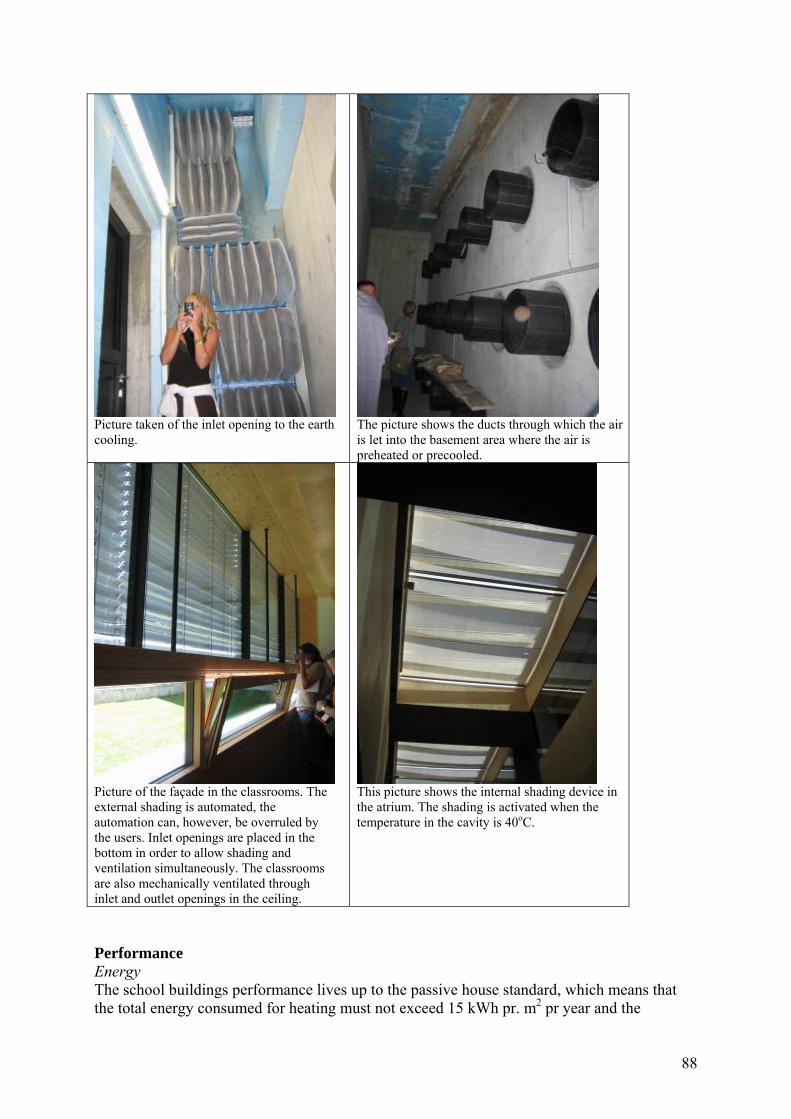
88
Picture taken of the inlet opening to the earth cooling.
The picture shows the ducts through which the air is let into the basement area where the air is preheated or precooled.
Picture of the façade in the classrooms. The external shading is automated, the automation can, however, be overruled by the users. Inlet openings are placed in the bottom in order to allow shading and ventilation simultaneously. The classrooms are also mechanically ventilated through inlet and outlet openings in the ceiling.
This picture shows the internal shading device in the atrium. The shading is activated when the temperature in the cavity is 40oC.
Performance Energy The school buildings performance lives up to the passive house standard, which means that the total energy consumed for heating must not exceed 15 kWh pr. m2 pr year and the
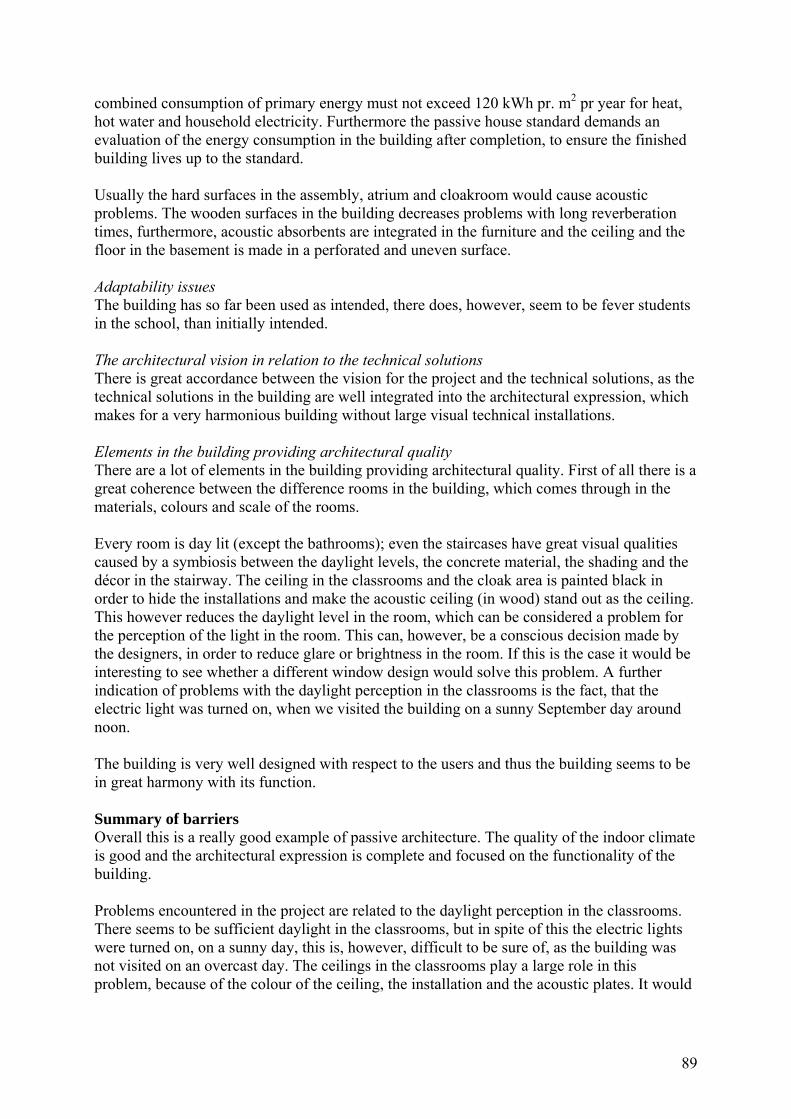
89
combined consumption of primary energy must not exceed 120 kWh pr. m2 pr year for heat, hot water and household electricity. Furthermore the passive house standard demands an evaluation of the energy consumption in the building after completion, to ensure the finished building lives up to the standard. Usually the hard surfaces in the assembly, atrium and cloakroom would cause acoustic problems. The wooden surfaces in the building decreases problems with long reverberation times, furthermore, acoustic absorbents are integrated in the furniture and the ceiling and the floor in the basement is made in a perforated and uneven surface. Adaptability issues The building has so far been used as intended, there does, however, seem to be fever students in the school, than initially intended. The architectural vision in relation to the technical solutions There is great accordance between the vision for the project and the technical solutions, as the technical solutions in the building are well integrated into the architectural expression, which makes for a very harmonious building without large visual technical installations. Elements in the building providing architectural quality There are a lot of elements in the building providing architectural quality. First of all there is a great coherence between the difference rooms in the building, which comes through in the materials, colours and scale of the rooms. Every room is day lit (except the bathrooms); even the staircases have great visual qualities caused by a symbiosis between the daylight levels, the concrete material, the shading and the décor in the stairway. The ceiling in the classrooms and the cloak area is painted black in order to hide the installations and make the acoustic ceiling (in wood) stand out as the ceiling. This however reduces the daylight level in the room, which can be considered a problem for the perception of the light in the room. This can, however, be a conscious decision made by the designers, in order to reduce glare or brightness in the room. If this is the case it would be interesting to see whether a different window design would solve this problem. A further indication of problems with the daylight perception in the classrooms is the fact, that the electric light was turned on, when we visited the building on a sunny September day around noon. The building is very well designed with respect to the users and thus the building seems to be in great harmony with its function. Summary of barriers Overall this is a really good example of passive architecture. The quality of the indoor climate is good and the architectural expression is complete and focused on the functionality of the building. Problems encountered in the project are related to the daylight perception in the classrooms. There seems to be sufficient daylight in the classrooms, but in spite of this the electric lights were turned on, on a sunny day, this is, however, difficult to be sure of, as the building was not visited on an overcast day. The ceilings in the classrooms play a large role in this problem, because of the colour of the ceiling, the installation and the acoustic plates. It would

90
be interesting to see a simulation of the daylight conditions in the building compared to the actual daylight conditions. Barriers in relation to the passive house standard, which are not present in this project, have to do with the air quality and the comfort conditions in the buildings, as designers or users are tempted not to ventilate as much as they should or not to heat the building as much as they should in order to save energy. Open questions and needs for future research In relation to this project there seems to be a need for research in the area of the relationship between the daylight solution and the energy consumption in the building, but in fields of research relating to the perception of the light in the rooms compared to the daylight levels. This will reveal that the daylight levels do not necessarily ensure a good evaluation of the daylight conditions in a room. References http://www.nextroom.at/building_article.php?building_id=3843&article_id=7263
http://www.theweathernetwork.com/weather/stats/pages/C01592.htm?SZXX0033 date October 27th 2005
http://www.vobs.at/hs-klaus//Texte/Klassen-Überblick.htm date: November 10th 2006
http://www.nextroom.at/building_image.php?building_id=3843&article_id=&kind_id=2&index=0 , date: October 26th 2005
http://www.nextroom.at/building_image.php?building_id=3843&article_id=&kind_id=2&index=0 , date: October 26th 2005
http://www.dietrich.untertrifaller.com/projects_d.html date: October 26th 2005
http://www.passivhaus-institut.de November 9th 2005
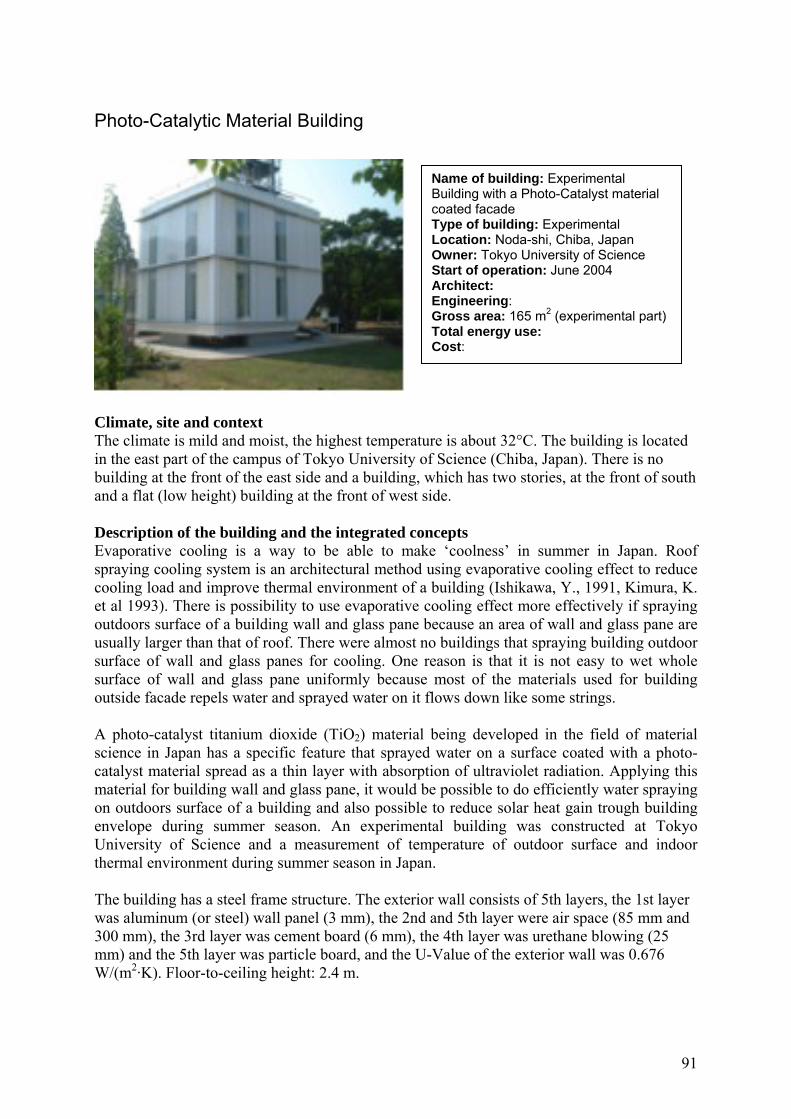
91
Photo-Catalytic Material Building
Climate, site and context The climate is mild and moist, the highest temperature is about 32°C. The building is located in the east part of the campus of Tokyo University of Science (Chiba, Japan). There is no building at the front of the east side and a building, which has two stories, at the front of south and a flat (low height) building at the front of west side. Description of the building and the integrated concepts Evaporative cooling is a way to be able to make ‘coolness’ in summer in Japan. Roof spraying cooling system is an architectural method using evaporative cooling effect to reduce cooling load and improve thermal environment of a building (Ishikawa, Y., 1991, Kimura, K. et al 1993). There is possibility to use evaporative cooling effect more effectively if spraying outdoors surface of a building wall and glass pane because an area of wall and glass pane are usually larger than that of roof. There were almost no buildings that spraying building outdoor surface of wall and glass panes for cooling. One reason is that it is not easy to wet whole surface of wall and glass pane uniformly because most of the materials used for building outside facade repels water and sprayed water on it flows down like some strings. A photo-catalyst titanium dioxide (TiO2) material being developed in the field of material science in Japan has a specific feature that sprayed water on a surface coated with a photo-catalyst material spread as a thin layer with absorption of ultraviolet radiation. Applying this material for building wall and glass pane, it would be possible to do efficiently water spraying on outdoors surface of a building and also possible to reduce solar heat gain trough building envelope during summer season. An experimental building was constructed at Tokyo University of Science and a measurement of temperature of outdoor surface and indoor thermal environment during summer season in Japan. The building has a steel frame structure. The exterior wall consists of 5th layers, the 1st layer was aluminum (or steel) wall panel (3 mm), the 2nd and 5th layer were air space (85 mm and 300 mm), the 3rd layer was cement board (6 mm), the 4th layer was urethane blowing (25 mm) and the 5th layer was particle board, and the U-Value of the exterior wall was 0.676 W/(m2·K). Floor-to-ceiling height: 2.4 m.
Name of building: Experimental Building with a Photo-Catalyst material coated facade Type of building: Experimental Location: Noda-shi, Chiba, Japan Owner: Tokyo University of Science Start of operation: June 2004 Architect: Engineering: Gross area: 165 m2 (experimental part) Total energy use: Cost:
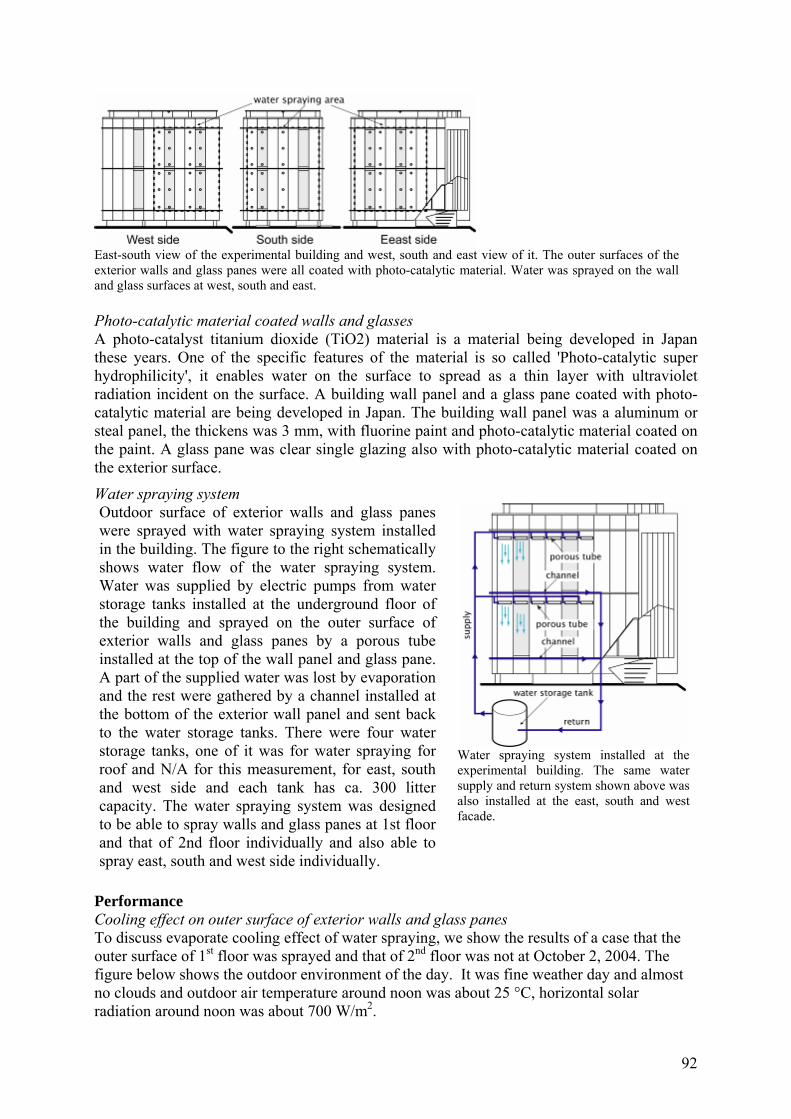
92
East-south view of the experimental building and west, south and east view of it. The outer surfaces of the exterior walls and glass panes were all coated with photo-catalytic material. Water was sprayed on the wall and glass surfaces at west, south and east. Photo-catalytic material coated walls and glasses A photo-catalyst titanium dioxide (TiO2) material is a material being developed in Japan these years. One of the specific features of the material is so called 'Photo-catalytic super hydrophilicity', it enables water on the surface to spread as a thin layer with ultraviolet radiation incident on the surface. A building wall panel and a glass pane coated with photo-catalytic material are being developed in Japan. The building wall panel was a aluminum or steal panel, the thickens was 3 mm, with fluorine paint and photo-catalytic material coated on the paint. A glass pane was clear single glazing also with photo-catalytic material coated on the exterior surface.
Water spraying system
Performance Cooling effect on outer surface of exterior walls and glass panes To discuss evaporate cooling effect of water spraying, we show the results of a case that the outer surface of 1st floor was sprayed and that of 2nd floor was not at October 2, 2004. The figure below shows the outdoor environment of the day. It was fine weather day and almost no clouds and outdoor air temperature around noon was about 25 °C, horizontal solar radiation around noon was about 700 W/m2.
Outdoor surface of exterior walls and glass panes were sprayed with water spraying system installed in the building. The figure to the right schematically shows water flow of the water spraying system. Water was supplied by electric pumps from water storage tanks installed at the underground floor of the building and sprayed on the outer surface of exterior walls and glass panes by a porous tube installed at the top of the wall panel and glass pane. A part of the supplied water was lost by evaporation and the rest were gathered by a channel installed at the bottom of the exterior wall panel and sent back to the water storage tanks. There were four water storage tanks, one of it was for water spraying for roof and N/A for this measurement, for east, south and west side and each tank has ca. 300 litter capacity. The water spraying system was designed to be able to spray walls and glass panes at 1st floor and that of 2nd floor individually and also able to spray east, south and west side individually.
Water spraying system installed at the experimental building. The same water supply and return system shown above was also installed at the east, south and west facade.
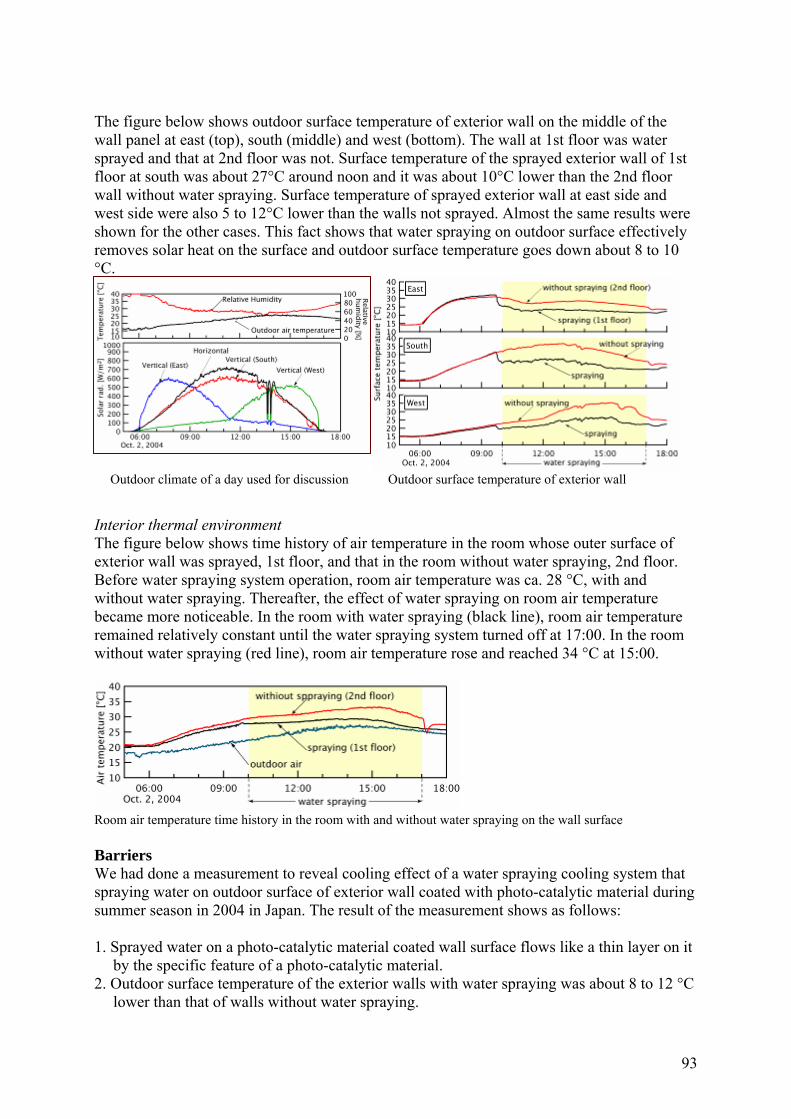
93
The figure below shows outdoor surface temperature of exterior wall on the middle of the wall panel at east (top), south (middle) and west (bottom). The wall at 1st floor was water sprayed and that at 2nd floor was not. Surface temperature of the sprayed exterior wall of 1st floor at south was about 27°C around noon and it was about 10°C lower than the 2nd floor wall without water spraying. Surface temperature of sprayed exterior wall at east side and west side were also 5 to 12°C lower than the walls not sprayed. Almost the same results were shown for the other cases. This fact shows that water spraying on outdoor surface effectively removes solar heat on the surface and outdoor surface temperature goes down about 8 to 10 °C.
Outdoor climate of a day used for discussion Outdoor surface temperature of exterior wall
Interior thermal environment The figure below shows time history of air temperature in the room whose outer surface of exterior wall was sprayed, 1st floor, and that in the room without water spraying, 2nd floor. Before water spraying system operation, room air temperature was ca. 28 °C, with and without water spraying. Thereafter, the effect of water spraying on room air temperature became more noticeable. In the room with water spraying (black line), room air temperature remained relatively constant until the water spraying system turned off at 17:00. In the room without water spraying (red line), room air temperature rose and reached 34 °C at 15:00.
Room air temperature time history in the room with and without water spraying on the wall surface Barriers We had done a measurement to reveal cooling effect of a water spraying cooling system that spraying water on outdoor surface of exterior wall coated with photo-catalytic material during summer season in 2004 in Japan. The result of the measurement shows as follows: 1. Sprayed water on a photo-catalytic material coated wall surface flows like a thin layer on it
by the specific feature of a photo-catalytic material. 2. Outdoor surface temperature of the exterior walls with water spraying was about 8 to 12 °C
lower than that of walls without water spraying.
94
3. Air temperature of the room at the floor whose exterior wall was water sprayed was about 2 to 4 °C lower than that of the room at the floor not water sprayed.
Open Questions and Needs for Future Research • Spraying water on the outer surface of a building effectively reduce solar heat gain from
outdoor surface but contribution for reduction of cooling load and for energy conservation effect for HVAC system were very small. There, so, needs to develop a method for efficiently removing heat from room interior.
• Water spraying system consumes about 200 litters in a day for when whole of the facade were sprayed. We are discussing to use rainwater for the system.
References H. Asada, H. Takeda (2005), “Measurement on evaporate cooling effect of a water spraying system with a photo-catalytic material coated wall”, The 2005 World Sustainable Building Conference, Tokyo, pp. 27-29 September 2005 (SB05Tokyo).
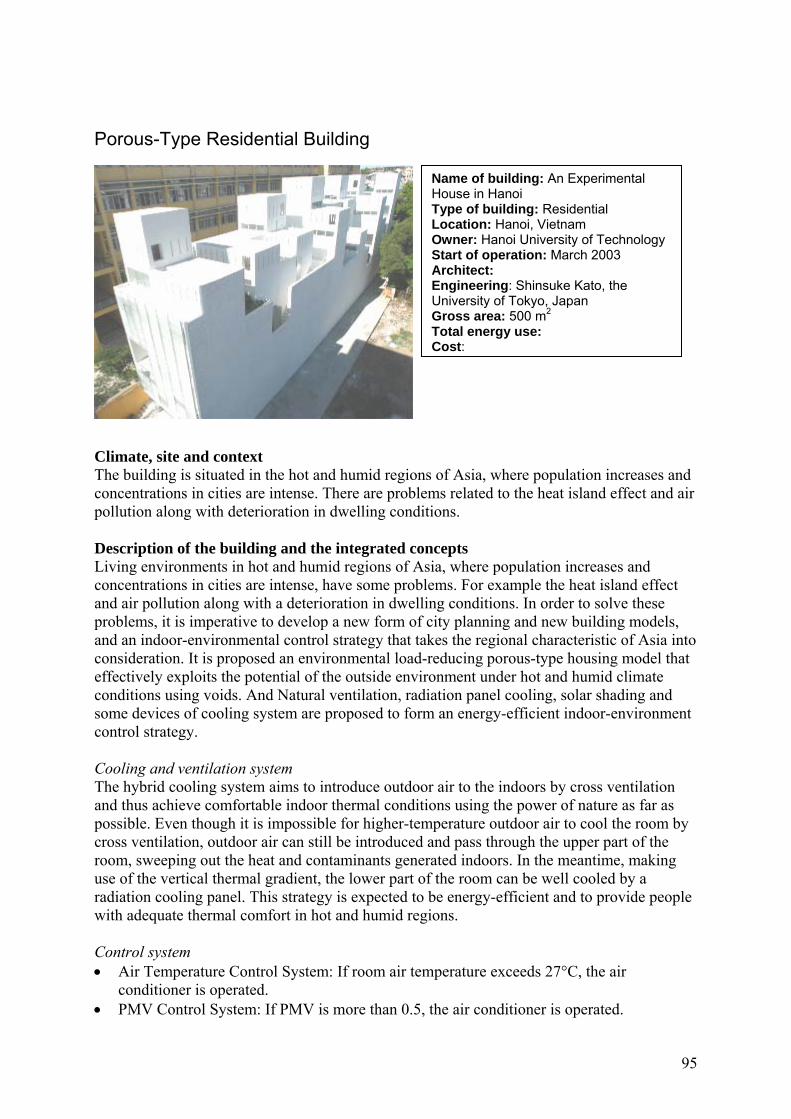
95
Porous-Type Residential Building Climate, site and context The building is situated in the hot and humid regions of Asia, where population increases and concentrations in cities are intense. There are problems related to the heat island effect and air pollution along with deterioration in dwelling conditions. Description of the building and the integrated concepts Living environments in hot and humid regions of Asia, where population increases and concentrations in cities are intense, have some problems. For example the heat island effect and air pollution along with a deterioration in dwelling conditions. In order to solve these problems, it is imperative to develop a new form of city planning and new building models, and an indoor-environmental control strategy that takes the regional characteristic of Asia into consideration. It is proposed an environmental load-reducing porous-type housing model that effectively exploits the potential of the outside environment under hot and humid climate conditions using voids. And Natural ventilation, radiation panel cooling, solar shading and some devices of cooling system are proposed to form an energy-efficient indoor-environment control strategy. Cooling and ventilation system The hybrid cooling system aims to introduce outdoor air to the indoors by cross ventilation and thus achieve comfortable indoor thermal conditions using the power of nature as far as possible. Even though it is impossible for higher-temperature outdoor air to cool the room by cross ventilation, outdoor air can still be introduced and pass through the upper part of the room, sweeping out the heat and contaminants generated indoors. In the meantime, making use of the vertical thermal gradient, the lower part of the room can be well cooled by a radiation cooling panel. This strategy is expected to be energy-efficient and to provide people with adequate thermal comfort in hot and humid regions. Control system • Air Temperature Control System: If room air temperature exceeds 27°C, the air
conditioner is operated. • PMV Control System: If PMV is more than 0.5, the air conditioner is operated.
Name of building: An Experimental House in Hanoi Type of building: Residential Location: Hanoi, Vietnam Owner: Hanoi University of Technology Start of operation: March 2003 Architect: Engineering: Shinsuke Kato, the University of Tokyo, Japan Gross area: 500 m2 Total energy use: Cost:
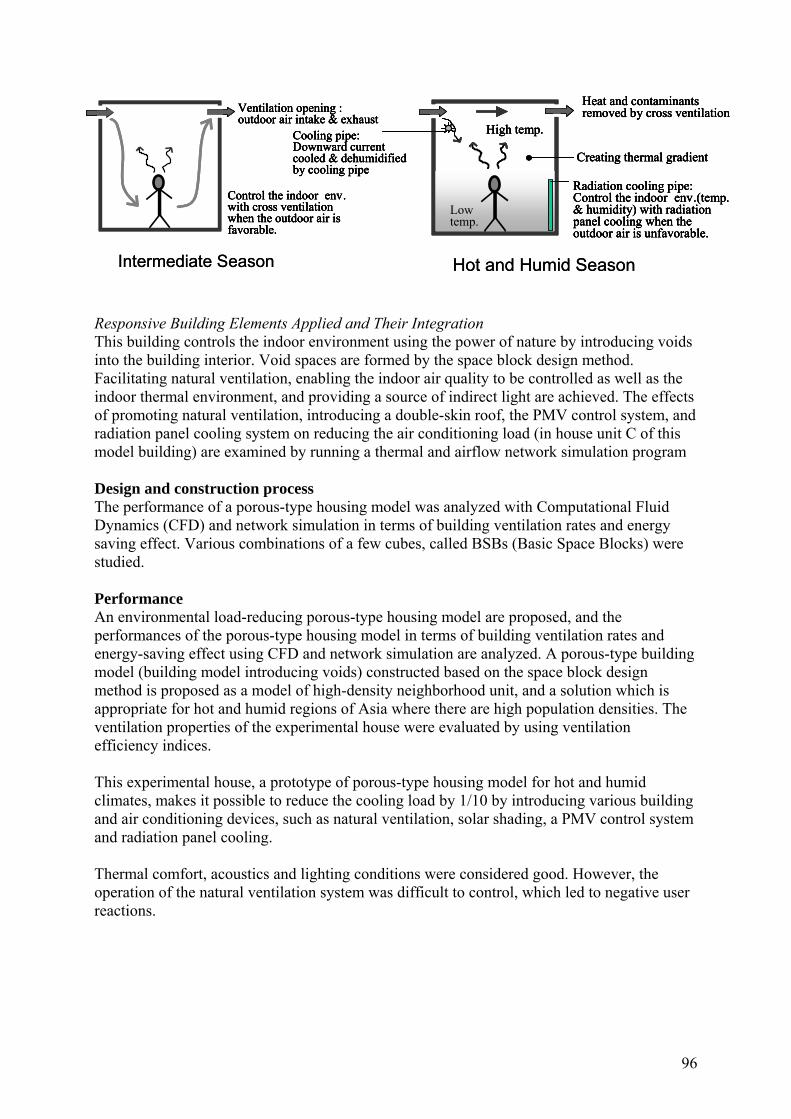
96
Hot and Humid Season
Heat and contaminants removed by cross ventilation
Radiation cooling pipe: Control the indoor env.(temp. & humidity) with radiation panel cooling when the outdoor air is unfavorable.
High temp.
Lowtemp.
Creating thermal gradient
Heat and contaminants removed by cross ventilation
Radiation cooling pipe: Control the indoor env.(temp. & humidity) with radiation panel cooling when the outdoor air is unfavorable.
High temp.
Lowtemp.
Creating thermal gradient
Responsive Building Elements Applied and Their Integration This building controls the indoor environment using the power of nature by introducing voids into the building interior. Void spaces are formed by the space block design method. Facilitating natural ventilation, enabling the indoor air quality to be controlled as well as the indoor thermal environment, and providing a source of indirect light are achieved. The effects of promoting natural ventilation, introducing a double-skin roof, the PMV control system, and radiation panel cooling system on reducing the air conditioning load (in house unit C of this model building) are examined by running a thermal and airflow network simulation program Design and construction process The performance of a porous-type housing model was analyzed with Computational Fluid Dynamics (CFD) and network simulation in terms of building ventilation rates and energy saving effect. Various combinations of a few cubes, called BSBs (Basic Space Blocks) were studied. Performance An environmental load-reducing porous-type housing model are proposed, and the performances of the porous-type housing model in terms of building ventilation rates and energy-saving effect using CFD and network simulation are analyzed. A porous-type building model (building model introducing voids) constructed based on the space block design method is proposed as a model of high-density neighborhood unit, and a solution which is appropriate for hot and humid regions of Asia where there are high population densities. The ventilation properties of the experimental house were evaluated by using ventilation efficiency indices. This experimental house, a prototype of porous-type housing model for hot and humid climates, makes it possible to reduce the cooling load by 1/10 by introducing various building and air conditioning devices, such as natural ventilation, solar shading, a PMV control system and radiation panel cooling. Thermal comfort, acoustics and lighting conditions were considered good. However, the operation of the natural ventilation system was difficult to control, which led to negative user reactions.
Intermediate Season
Cooling pipe: Downward current cooled & dehumidified by cooling pipe
Control the indoor env. with cross ventilation when the outdoor air is favorable.
Ventilation opening : outdoor air intake & exhaust
Cooling pipe: Downward current cooled & dehumidified by cooling pipe
Control the indoor env. with cross ventilation when the outdoor air is favorable.
Ventilation opening : outdoor air intake & exhaust
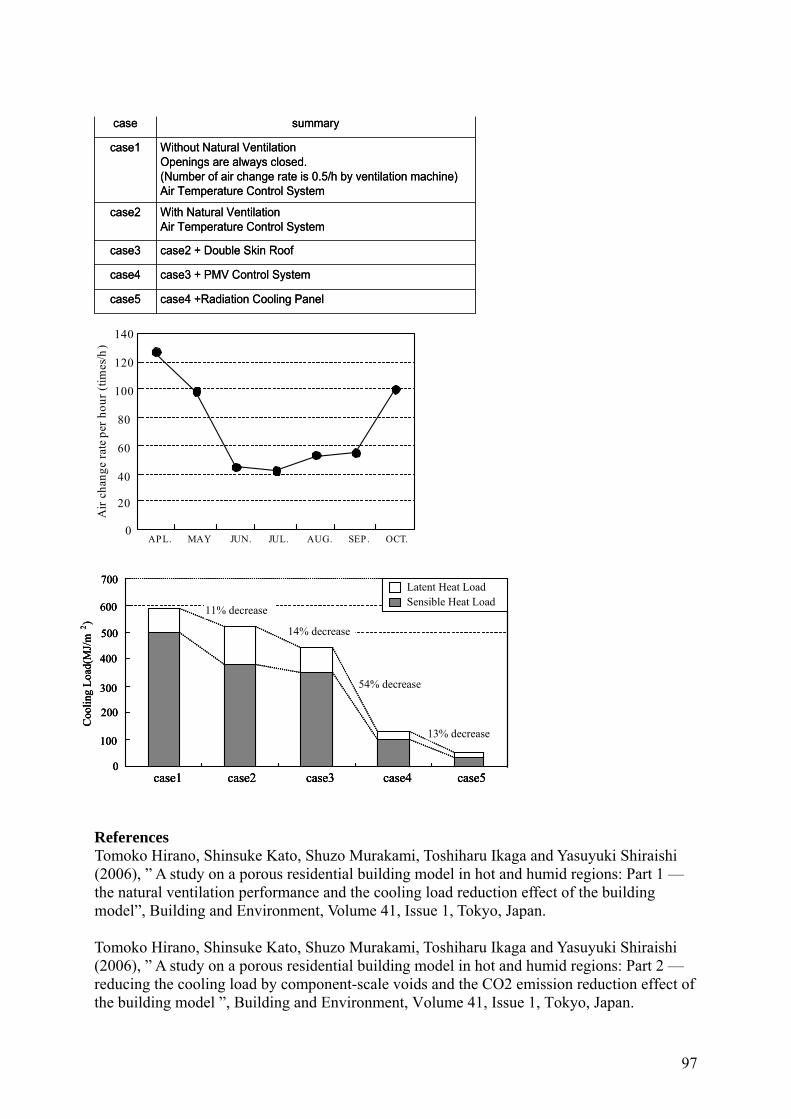
97
case4 +Radiation Cooling Panelcase5
case3 + PMV Control Systemcase4
case2 + Double Skin Roofcase3
With Natural VentilationAir Temperature Control System
case2
Without Natural VentilationOpenings are always closed.(Number of air change rate is 0.5/h by ventilation machine)Air Temperature Control System
case1
summarycase
case4 +Radiation Cooling Panelcase5
case3 + PMV Control Systemcase4
case2 + Double Skin Roofcase3
With Natural VentilationAir Temperature Control System
case2
Without Natural VentilationOpenings are always closed.(Number of air change rate is 0.5/h by ventilation machine)Air Temperature Control System
case1
summarycase References Tomoko Hirano, Shinsuke Kato, Shuzo Murakami, Toshiharu Ikaga and Yasuyuki Shiraishi (2006), ” A study on a porous residential building model in hot and humid regions: Part 1 —the natural ventilation performance and the cooling load reduction effect of the building model”, Building and Environment, Volume 41, Issue 1, Tokyo, Japan. Tomoko Hirano, Shinsuke Kato, Shuzo Murakami, Toshiharu Ikaga and Yasuyuki Shiraishi (2006), ” A study on a porous residential building model in hot and humid regions: Part 2 —reducing the cooling load by component-scale voids and the CO2 emission reduction effect of the building model ”, Building and Environment, Volume 41, Issue 1, Tokyo, Japan.
0
20
40
60
80
100
120
140
APL. OCT.SEP.AUG.JUL.JUN.MAY
Air
chan
ge ra
te p
er h
our (
times
/h)
0
100
200
300
400
500
600
700
Coo
ling
Load
(MJ/
m2 )
Latent Heat LoadSensible Heat Load
11% decrease
case1 case2 case3 case4 case5
14% decrease
54% decrease
13% decrease
0
100
200
300
400
500
600
700
Coo
ling
Load
(MJ/
m2 )
Latent Heat LoadSensible Heat Load
11% decrease
case1 case2 case3 case4 case5
14% decrease
54% decrease
13% decrease
0
100
200
300
400
500
600
700
Coo
ling
Load
(MJ/
m2 )
Latent Heat LoadSensible Heat Load
11% decrease
case1 case2 case3 case4 case5
14% decrease
54% decrease
13% decrease
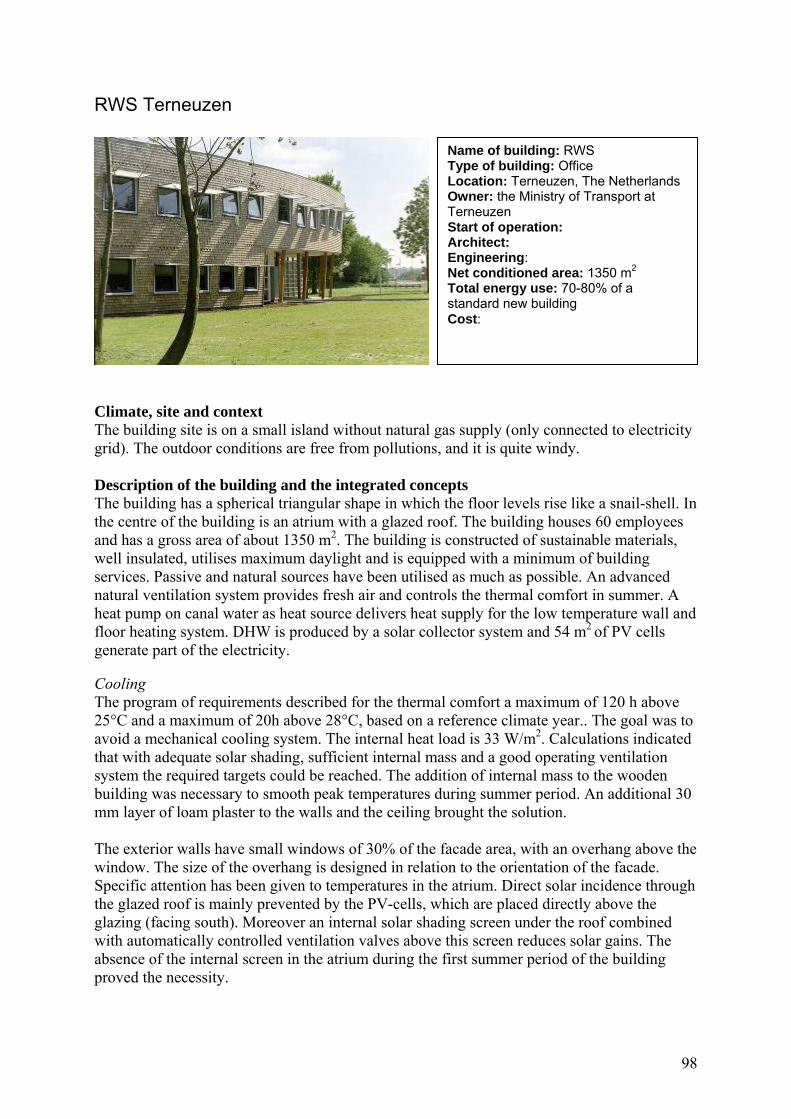
98
RWS Terneuzen
Climate, site and context The building site is on a small island without natural gas supply (only connected to electricity grid). The outdoor conditions are free from pollutions, and it is quite windy. Description of the building and the integrated concepts The building has a spherical triangular shape in which the floor levels rise like a snail-shell. In the centre of the building is an atrium with a glazed roof. The building houses 60 employees and has a gross area of about 1350 m2. The building is constructed of sustainable materials, well insulated, utilises maximum daylight and is equipped with a minimum of building services. Passive and natural sources have been utilised as much as possible. An advanced natural ventilation system provides fresh air and controls the thermal comfort in summer. A heat pump on canal water as heat source delivers heat supply for the low temperature wall and floor heating system. DHW is produced by a solar collector system and 54 m2
of PV cells generate part of the electricity. Cooling The program of requirements described for the thermal comfort a maximum of 120 h above 25°C and a maximum of 20h above 28°C, based on a reference climate year.. The goal was to avoid a mechanical cooling system. The internal heat load is 33 W/m2. Calculations indicated that with adequate solar shading, sufficient internal mass and a good operating ventilation system the required targets could be reached. The addition of internal mass to the wooden building was necessary to smooth peak temperatures during summer period. An additional 30 mm layer of loam plaster to the walls and the ceiling brought the solution. The exterior walls have small windows of 30% of the facade area, with an overhang above the window. The size of the overhang is designed in relation to the orientation of the facade. Specific attention has been given to temperatures in the atrium. Direct solar incidence through the glazed roof is mainly prevented by the PV-cells, which are placed directly above the glazing (facing south). Moreover an internal solar shading screen under the roof combined with automatically controlled ventilation valves above this screen reduces solar gains. The absence of the internal screen in the atrium during the first summer period of the building proved the necessity.
Name of building: RWS Type of building: Office Location: Terneuzen, The Netherlands Owner: the Ministry of Transport at Terneuzen Start of operation: Architect: Engineering: Net conditioned area: 1350 m2 Total energy use: 70-80% of a standard new building Cost:

99
Design calculations indicated that the ventilation system is important for controlling overheating during summer. Fresh air supply needs a ventilation rate of n=1.5 h-1. The assumption is that above an interior temperature of 23 °C occupants open the windows. In that case the ventilation rate is estimated to increase to n=6 h-1, which is necessary for effectively avoidance of overheating. Conditional night ventilation must be applied. Ventilation A natural ventilation system involves the risk of insufficient performance in case of no wind or no thermal stratification. Using a multi-zone ventilation model various scenarios such as winter/summer, with and without wind was examined. The results showed that, due to a good wind profile on the site at the Dutch coast, during approx. 95% of the time the ventilation would function in a proper way. The calculations also showed that normal inlet grills result in cross ventilation and an unequal distribution of airflow's throughout the building. The application of electronically controlled constant flow inlet grills improved this effect significantly. The opening of the grills is constantly adjusted as function of the air velocity through the opening. This also prevents an overshoot of airflow. During winter the grills, controlled by the BEMS, are closed after working hours. The occupants also have the possibility to manually overrule the system. From the office rooms the airflow is led to the central atrium via overflow openings in the internal separation walls. These overflows were custom-made. Acoustical absorption in the opening provides a good sound insulation. The polluted air is extracted from the atrium by a large chimney with a 1 m diameter. The 7 m height of the chimney was needed to discharge in a suitable under-pressure area. The chimney is opened and closed by a controlled grill at the inlet side. Climate room measurements showed that the incoming air in the office rooms during wintertime could cause thermal comfort problems, due to a fall of cold air just behind the facade. The flow of cold air at floor level would cause draught complaints. Based on extensive tests the addition of a perforated shelf with 100 mm borders under the inlets was added to the design. Daylighting The reduction of energy consumption by artificial lighting and a good visual comfort were the driving forces to create a good daylight situation. For energy conservation during winter and avoidance of solar gains during summer the glazed area in the facades was limited to 30%. Via the atrium additional daylight is provided through the glazed roof and large windows in the separating walls. First calculations with a simple design tool showed a daylight factor of 3% on the working surfaces and 1% in the middle of the room. Detailed daylight calculations with the ray-tracing model Radiance confirmed the expected outcome. Performance Within the framework of the EU Thermie program extensive measurements have been carried out to the performance of the building and its services. Shortly after the housing at the end of
100
January 2000 commissioning measurements have been carried out (air tightness, capacity of ventilation system, infrared photography and inertia of the heating system). During the summer of 2000 and the winter of 2001 a monitoring program was conducted. Air tightness The air tightness of a single office room, determined by a blower door test, showed a significantly bad performance. Extra losses from infiltration have to be expected in the order of 200 - 300 % above the design starting point. In-between measures have been carried out to improve the air tightness. Thermal insulation Infrared photo's showed a good thermal performance of the building envelope in general. The heating system performed very well and showed a quick regeneration of set point temperatures after a 2 hour cooling down period from open window venting. Overheating during wintertime occurred due to the control of interior temperatures with air-temperature based thermostats. Users can individually control their room temperatures (+/- 3 °C) but need Indoor Air Quality CO2-levels were measured on six locations (3 offices, 2 positions in the Atrium, exhaust air and outdoor air) during 4 weeks in the winter of 2001. The indoor air quality was found to be satisfying Thermal comfort Thermal comfort measurements have been carried out in 3 office rooms, the entrance desk and three locations in the atrium. During summer, due to the moderate conditions (Te = 10-15 °C, clouded sky) no overheating was found. Under low activity and light summer clothing, discomfort occurred in one room. In general for higher activities and warmer clothing all PMV's were found in the range of -0.5 < PMV < +0.5 such resulting in an ideal thermal comfort situation. From the middle term temperature measurements overheating was found in the south orientated office rooms during the afternoon. This occurred only in a restricted period of time while the shading device in the atrium was not installed. During winter under medium activity and average winter clothing all office room and the atrium show PMV values between -0.23 and +0.02 (except one office room PMV=-0.99). At lower activity, all office rooms exceed PMV=-0.50. These values seem quite low, asking for special attention. An explanation for these values is that most employees are outdoor workers, who spent only part of their time in the office. Due to their outdoor tasks most workers are warmly dressed and turn their thermostat on a low value. Some complaints have been about the inertia, indicating that the heating up period should start earlier on the day. Humidity The Relative Humidity levels showed a good performance in summer. During winter it varies from 20 to 50 %. The lower values could cause discomfort. On the long term plants in the Atrium are planned to regulate the humidity. User inquiry The perception of the users was interviewed by setting out an inquiry under all employees. The questions in the inquiry were similar to earlier conducted inquires in a large stock of office buildings (reference stock). During winter draught and temperature fluctuations need special attention. Additional measurements were planned to tackle the background of these complaints.

101
Energy consumption The energy consumption appears to be in the order of 70 to 80 % of a reference new office building. This is a good result for a regular building concept but far from the expected savings on primary energy of about 50 %. References Eijdems H. 2002-03-06. Final Technical Report, Thermie project BU-247-97-NL-DE, Cauberg Huygen RI bv, Amsterdam, Netherlands
Voit Peter. 2002-03-01. Daylighting - Design study and Monitoring Results, Thermie project, BU-247-97-NL-DE, Transsolar Energietechnik GMBH, Stuttgart, Germany
Boman C.A. 2001-05-23. Ventilation measurements in an office building using Passive tracer gas technique. Pent-IAQ , Gavle, Sweden
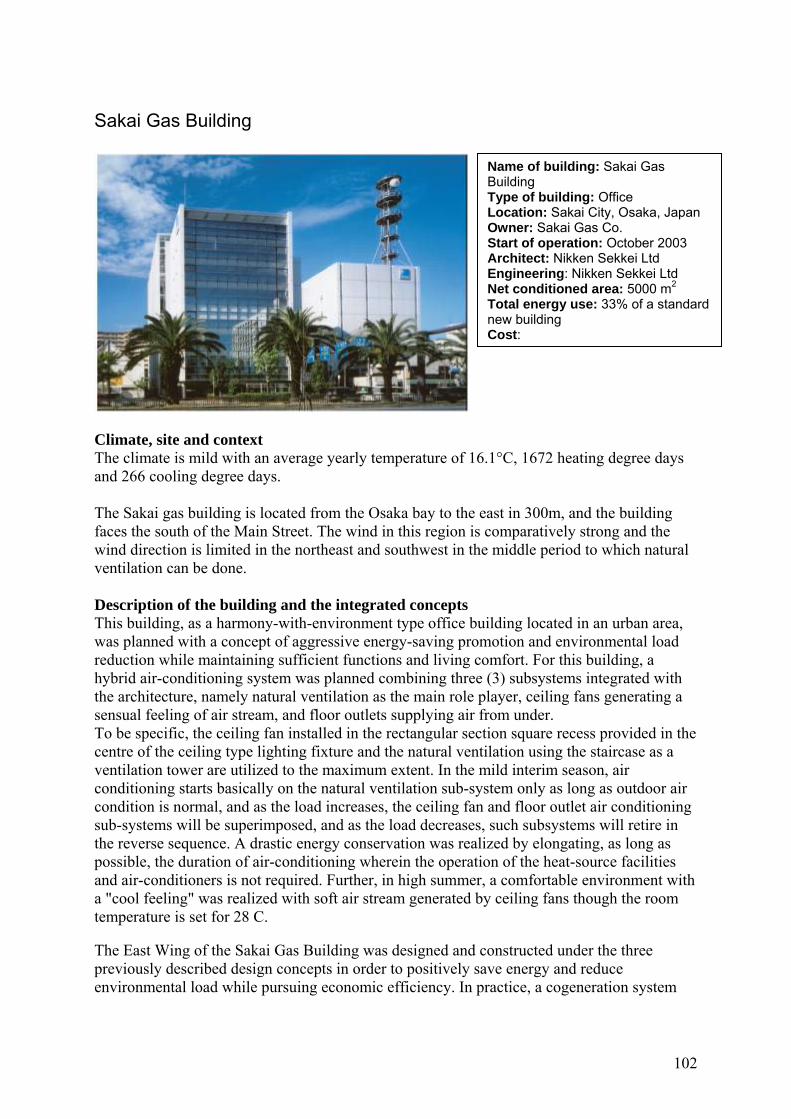
102
Sakai Gas Building
Climate, site and context The climate is mild with an average yearly temperature of 16.1°C, 1672 heating degree days and 266 cooling degree days. The Sakai gas building is located from the Osaka bay to the east in 300m, and the building faces the south of the Main Street. The wind in this region is comparatively strong and the wind direction is limited in the northeast and southwest in the middle period to which natural ventilation can be done. Description of the building and the integrated concepts This building, as a harmony-with-environment type office building located in an urban area, was planned with a concept of aggressive energy-saving promotion and environmental load reduction while maintaining sufficient functions and living comfort. For this building, a hybrid air-conditioning system was planned combining three (3) subsystems integrated with the architecture, namely natural ventilation as the main role player, ceiling fans generating a sensual feeling of air stream, and floor outlets supplying air from under. To be specific, the ceiling fan installed in the rectangular section square recess provided in the centre of the ceiling type lighting fixture and the natural ventilation using the staircase as a ventilation tower are utilized to the maximum extent. In the mild interim season, air conditioning starts basically on the natural ventilation sub-system only as long as outdoor air condition is normal, and as the load increases, the ceiling fan and floor outlet air conditioning sub-systems will be superimposed, and as the load decreases, such subsystems will retire in the reverse sequence. A drastic energy conservation was realized by elongating, as long as possible, the duration of air-conditioning wherein the operation of the heat-source facilities and air-conditioners is not required. Further, in high summer, a comfortable environment with a "cool feeling" was realized with soft air stream generated by ceiling fans though the room temperature is set for 28 C. The East Wing of the Sakai Gas Building was designed and constructed under the three previously described design concepts in order to positively save energy and reduce environmental load while pursuing economic efficiency. In practice, a cogeneration system
Name of building: Sakai Gas Building Type of building: Office Location: Sakai City, Osaka, Japan Owner: Sakai Gas Co. Start of operation: October 2003 Architect: Nikken Sekkei Ltd Engineering: Nikken Sekkei Ltd Net conditioned area: 5000 m2 Total energy use: 33% of a standard new building Cost:
103
was installed as the base machine for efficient use of energy, with a supplemental means for effectively using natural energy sources such as wind, sunlight and rainwater. The BEMS optimizes the building facility operations to create comfortable office room conditions at 28°C in summer while minimizing total energy consumption. The following energy-saving systems were installed in the Sakai Gas Building: A cogeneration system consisting of two micro gas turbines (50 kW each) generates electricity to cover part of the electrical needs of the building. Most of the high-temperature exhaust gas of the turbines is sent to absorption chillers/heaters (two sets with 100 RT each) to cover part of the energy demand. The remaining exhaust gas is supplied to heat exchangers (which transfer heat from high-temperature exhaust gas to water) to produce hot water. Part of the hot water produced in the heat exchangers is supplied to a desiccant dehumidifier (in summer) to dehumidify the outside air introduced into the building, while the remaining hot water is used as a heat source for hot water supply. In winter, except during the coldest periods, exhaust gas bypasses the absorption chillers/heaters to the heat exchangers to enhance energy-saving efficiency. Hot water produced in the heat exchangers is used for room heating. The Sakai Gas Building introduces exterior sunlight into the building to save lighting energy, uses a natural ventilation system to save air-conditioning energy, and stores and reuses rainwater to protect water resources. Among these energy-saving measures, the natural ventilation system is described here in more detail. In office buildings, each room generates a large amount of heat even in spring and autumn. As a consequence, each room needs to be cooled in response to the heat load even though the outside air temperature is lower than the room temperature. It was expected that taking outside air into the building would help reduce the air-conditioning load. We installed natural ventilation passages in the building to establish an open-air cooling system that controls the air intake rate automatically in response to the enthalpy inside and outside the office rooms. The open-air cooling system works as follows:
(a) Outdoor fresh air is directed into the building through air dampers installed on the north and south sides of each standard floor.
(b) The fresh air is fed into each office room through an air chamber located under the floor.
(c) After the heat load is reduced in each room, the fresh air passes through an automatic transom window located above the entrance door. The air then passes through the corridor and enters the always-open staircase.
(d) The staircase is a tower with a stairwell in the centre. The daylight opening provided in the tower’s ceiling accumulates solar heat and creates a stack effect, helping the air to move upward along the stairwell. The air is then released from the building through the exhaust port on top of the tower. This system is also used for night-purge ventilation in summer, spring, and autumn.
The Sakai Gas Building is equipped with an air-conditioning system designed to create comfortable office room conditions at 28°C in summer, and thereby save energy during work hours without enforcing any undue burden on employees. Human feeling of heat or chill is influenced not only by the temperature but also by heat radiation, humidity and air current, as well as by clothing and each person's individual metabolism. In the Sakai Gas Building in summer, three factors (heat radiation, humidity, and air current) are controlled to assure
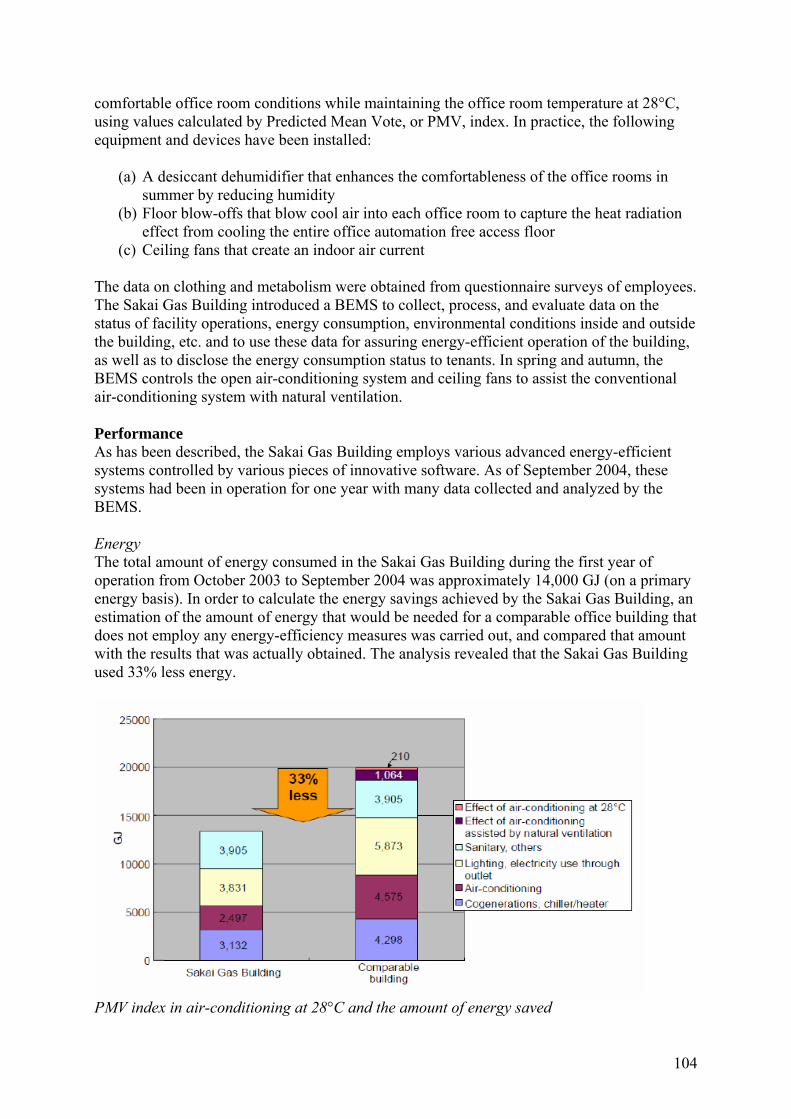
104
comfortable office room conditions while maintaining the office room temperature at 28°C, using values calculated by Predicted Mean Vote, or PMV, index. In practice, the following equipment and devices have been installed:
(a) A desiccant dehumidifier that enhances the comfortableness of the office rooms in summer by reducing humidity
(b) Floor blow-offs that blow cool air into each office room to capture the heat radiation effect from cooling the entire office automation free access floor
(c) Ceiling fans that create an indoor air current The data on clothing and metabolism were obtained from questionnaire surveys of employees. The Sakai Gas Building introduced a BEMS to collect, process, and evaluate data on the status of facility operations, energy consumption, environmental conditions inside and outside the building, etc. and to use these data for assuring energy-efficient operation of the building, as well as to disclose the energy consumption status to tenants. In spring and autumn, the BEMS controls the open air-conditioning system and ceiling fans to assist the conventional air-conditioning system with natural ventilation. Performance As has been described, the Sakai Gas Building employs various advanced energy-efficient systems controlled by various pieces of innovative software. As of September 2004, these systems had been in operation for one year with many data collected and analyzed by the BEMS. Energy The total amount of energy consumed in the Sakai Gas Building during the first year of operation from October 2003 to September 2004 was approximately 14,000 GJ (on a primary energy basis). In order to calculate the energy savings achieved by the Sakai Gas Building, an estimation of the amount of energy that would be needed for a comparable office building that does not employ any energy-efficiency measures was carried out, and compared that amount with the results that was actually obtained. The analysis revealed that the Sakai Gas Building used 33% less energy.
PMV index in air-conditioning at 28°C and the amount of energy saved
105
Osaka Gas has drawn up a company-wide policy to control the temperature of all offices at 28°C from the middle of July till the middle of September. In the Sakai Gas Building, the air-conditioning system is set at 28°C during the above period. Each office room in the building is mounted with a thermometer, hygrometer, radiometer, and air velocity meter. Using the data obtained from these instruments, as well as data on clothing and metabolism obtained through questionnaire surveys, the PMV indexes were calculated. The figure below shows the relationship between the temperature and humidity inside and outside office rooms and the PMV index for one day in the middle of August. As can be seen from the figure, the PMV index gradually decreased with time after the air conditioning system and ceiling fans were turned on. The index finally stayed in a range of +0.7 to +0.8, indicating that the room temperature was slightly higher than the level at which people would generally feel comfortable. As already discussed, these data were acquired when the office room temperature was controlled at 28°C. Another method for assuring comfortable office room conditions is to control the air-conditioning system so that it assures a preset PMV index. To make the room conditions more comfortable, employees’ opinions and suggestions will be implemented into the air-conditioning system control conditions in and after the next fiscal year. During the period from the middle of July till the middle of September 2004, the savings were approximately 200 GJ. Barriers BEMS Review Meetings were held once a month to analyze the data obtained from the BEMS. Employee representatives, the building operation staff, design engineers, and principal contractors attended the meetings. In the course of the meetings, the facility control conditions were improved in cooperation with related personnel. Also, the various valuable data useful for further improvement of the systems, were collected. The improvement items that were performed according to the results of the meetings are listed below. Improvements already completed:
• Night purge in response to indoor and outdoor conditions in room-heating period • Intermittent operation of secondary pump of air-conditioning system for anti-freezing • purposes • Modification of wintertime starting logic of heater • Review of outside air temperature conditions for starting up natural ventilation • Control of cafeteria ventilation fans by inverter • Reconsideration of cafeteria air-conditioning zones and time • Stoppage of air-conditioning in the entrance hall on 1st floor in spring and autumn in • response to outdoor conditions • Change in night purge control scheme
Open questions and needs for further research
• Monitoring indoor PMV index, temperature and humidity to control heater startup in spring and autumn
• Adding intermittent operation and start/stop conditions to air-conditioning system controller for spring and autumn
• Reviewing heat exchangers and desiccant dehumidifier operating conditions to further enhance efficiency of waste heat recovery.
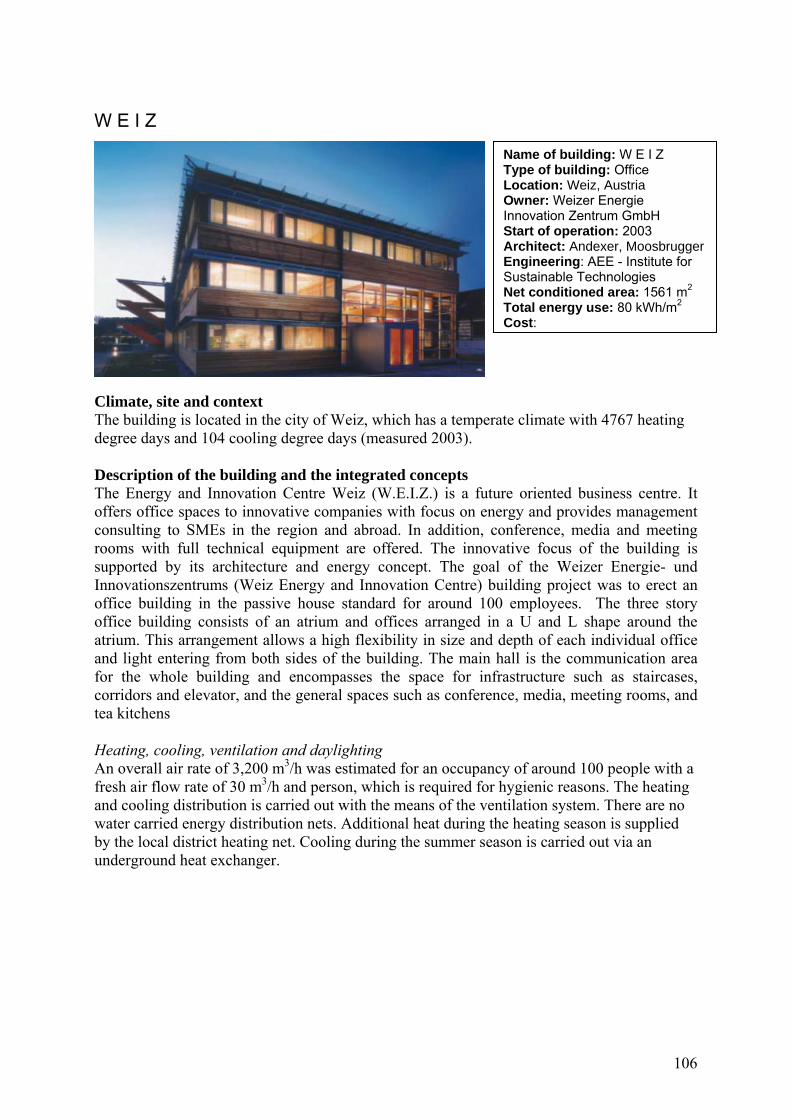
106
W E I Z
Climate, site and context The building is located in the city of Weiz, which has a temperate climate with 4767 heating degree days and 104 cooling degree days (measured 2003). Description of the building and the integrated concepts The Energy and Innovation Centre Weiz (W.E.I.Z.) is a future oriented business centre. It offers office spaces to innovative companies with focus on energy and provides management consulting to SMEs in the region and abroad. In addition, conference, media and meeting rooms with full technical equipment are offered. The innovative focus of the building is supported by its architecture and energy concept. The goal of the Weizer Energie- und Innovationszentrums (Weiz Energy and Innovation Centre) building project was to erect an office building in the passive house standard for around 100 employees. The three story office building consists of an atrium and offices arranged in a U and L shape around the atrium. This arrangement allows a high flexibility in size and depth of each individual office and light entering from both sides of the building. The main hall is the communication area for the whole building and encompasses the space for infrastructure such as staircases, corridors and elevator, and the general spaces such as conference, media, meeting rooms, and tea kitchens Heating, cooling, ventilation and daylighting An overall air rate of 3,200 m3/h was estimated for an occupancy of around 100 people with a fresh air flow rate of 30 m3/h and person, which is required for hygienic reasons. The heating and cooling distribution is carried out with the means of the ventilation system. There are no water carried energy distribution nets. Additional heat during the heating season is supplied by the local district heating net. Cooling during the summer season is carried out via an underground heat exchanger.
Name of building: W E I Z Type of building: Office Location: Weiz, Austria Owner: Weizer Energie Innovation Zentrum GmbH Start of operation: 2003 Architect: Andexer, Moosbrugger Engineering: AEE - Institute for Sustainable Technologies Net conditioned area: 1561 m2 Total energy use: 80 kWh/m2 Cost:
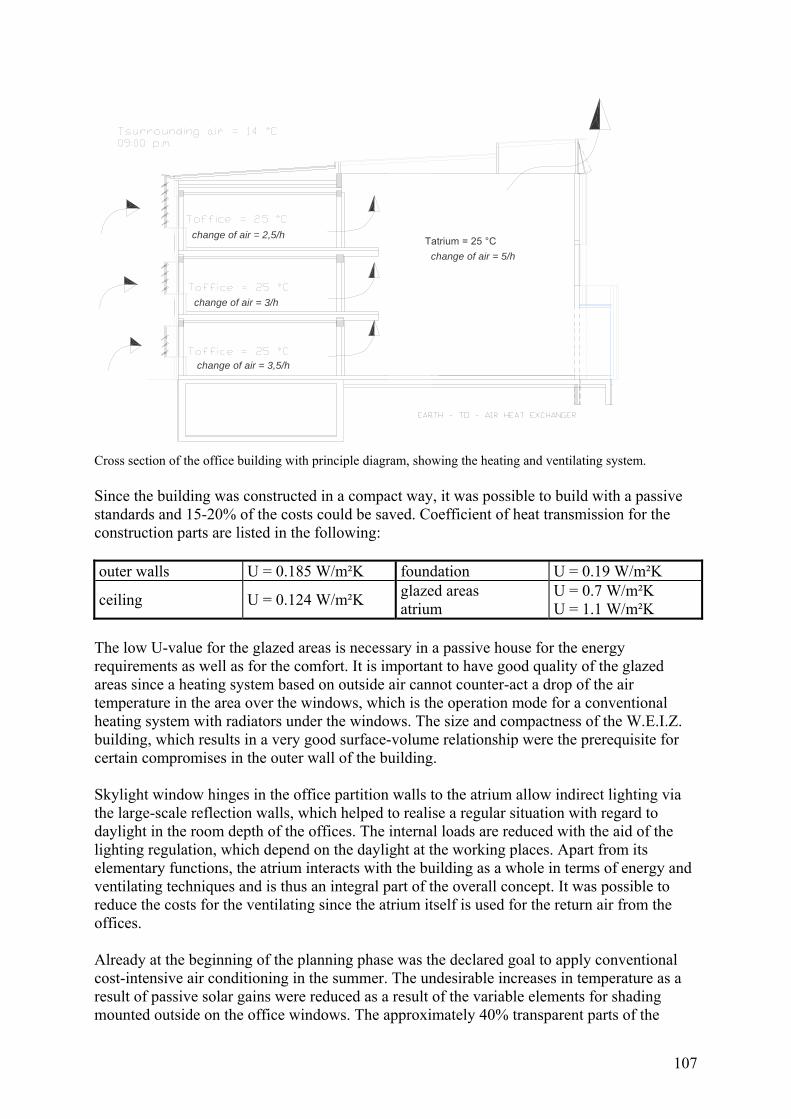
107
change of air = 3,5/h
change of air = 3/h
change of air = 2,5/h Tatrium = 25 °Cchange of air = 5/h
Cross section of the office building with principle diagram, showing the heating and ventilating system. Since the building was constructed in a compact way, it was possible to build with a passive standards and 15-20% of the costs could be saved. Coefficient of heat transmission for the construction parts are listed in the following: outer walls U = 0.185 W/m²K foundation U = 0.19 W/m²K
ceiling U = 0.124 W/m²K glazed areas atrium
U = 0.7 W/m²K U = 1.1 W/m²K
The low U-value for the glazed areas is necessary in a passive house for the energy requirements as well as for the comfort. It is important to have good quality of the glazed areas since a heating system based on outside air cannot counter-act a drop of the air temperature in the area over the windows, which is the operation mode for a conventional heating system with radiators under the windows. The size and compactness of the W.E.I.Z. building, which results in a very good surface-volume relationship were the prerequisite for certain compromises in the outer wall of the building. Skylight window hinges in the office partition walls to the atrium allow indirect lighting via the large-scale reflection walls, which helped to realise a regular situation with regard to daylight in the room depth of the offices. The internal loads are reduced with the aid of the lighting regulation, which depend on the daylight at the working places. Apart from its elementary functions, the atrium interacts with the building as a whole in terms of energy and ventilating techniques and is thus an integral part of the overall concept. It was possible to reduce the costs for the ventilating since the atrium itself is used for the return air from the offices. Already at the beginning of the planning phase was the declared goal to apply conventional cost-intensive air conditioning in the summer. The undesirable increases in temperature as a result of passive solar gains were reduced as a result of the variable elements for shading mounted outside on the office windows. The approximately 40% transparent parts of the
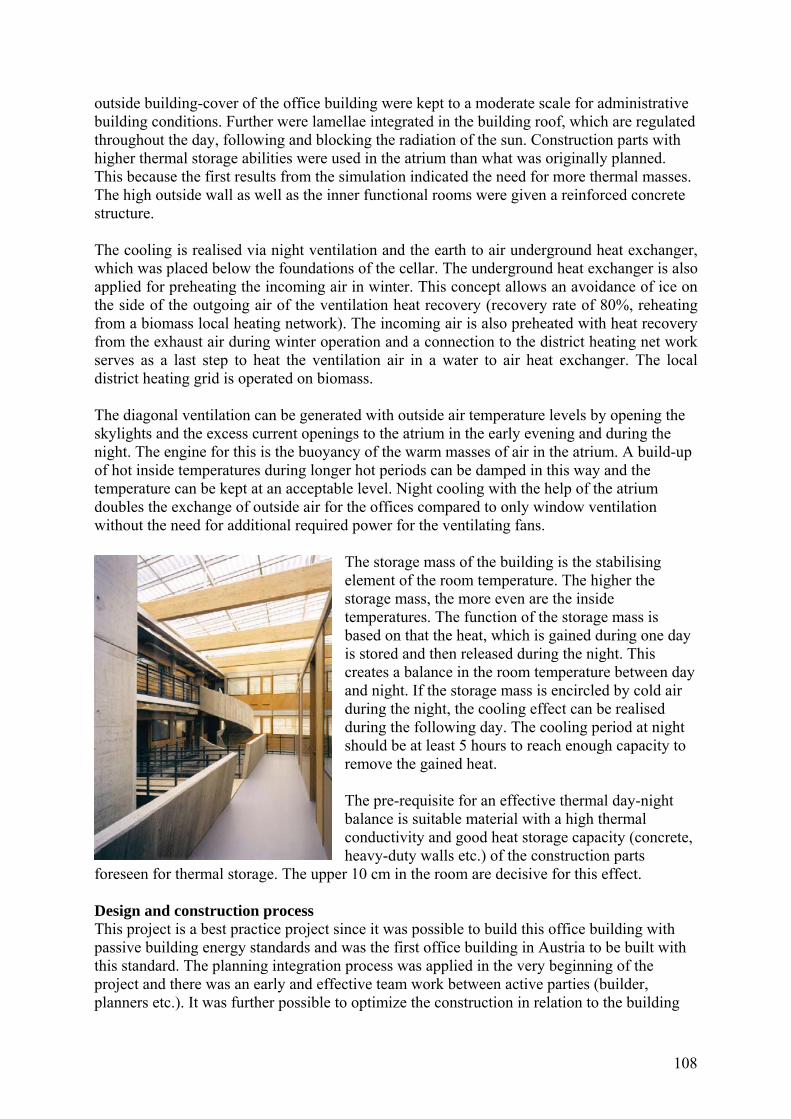
108
outside building-cover of the office building were kept to a moderate scale for administrative building conditions. Further were lamellae integrated in the building roof, which are regulated throughout the day, following and blocking the radiation of the sun. Construction parts with higher thermal storage abilities were used in the atrium than what was originally planned. This because the first results from the simulation indicated the need for more thermal masses. The high outside wall as well as the inner functional rooms were given a reinforced concrete structure. The cooling is realised via night ventilation and the earth to air underground heat exchanger, which was placed below the foundations of the cellar. The underground heat exchanger is also applied for preheating the incoming air in winter. This concept allows an avoidance of ice on the side of the outgoing air of the ventilation heat recovery (recovery rate of 80%, reheating from a biomass local heating network). The incoming air is also preheated with heat recovery from the exhaust air during winter operation and a connection to the district heating net work serves as a last step to heat the ventilation air in a water to air heat exchanger. The local district heating grid is operated on biomass. The diagonal ventilation can be generated with outside air temperature levels by opening the skylights and the excess current openings to the atrium in the early evening and during the night. The engine for this is the buoyancy of the warm masses of air in the atrium. A build-up of hot inside temperatures during longer hot periods can be damped in this way and the temperature can be kept at an acceptable level. Night cooling with the help of the atrium doubles the exchange of outside air for the offices compared to only window ventilation without the need for additional required power for the ventilating fans.
The storage mass of the building is the stabilising element of the room temperature. The higher the storage mass, the more even are the inside temperatures. The function of the storage mass is based on that the heat, which is gained during one day is stored and then released during the night. This creates a balance in the room temperature between day and night. If the storage mass is encircled by cold air during the night, the cooling effect can be realised during the following day. The cooling period at night should be at least 5 hours to reach enough capacity to remove the gained heat. The pre-requisite for an effective thermal day-night balance is suitable material with a high thermal conductivity and good heat storage capacity (concrete, heavy-duty walls etc.) of the construction parts
foreseen for thermal storage. The upper 10 cm in the room are decisive for this effect.
Design and construction process This project is a best practice project since it was possible to build this office building with passive building energy standards and was the first office building in Austria to be built with this standard. The planning integration process was applied in the very beginning of the project and there was an early and effective team work between active parties (builder, planners etc.). It was further possible to optimize the construction in relation to the building
109
site and thereby reach optimal heating and cooling loads. The energy concept was simulated at an early stage with the planning program TRNSYS. What also makes this project a good example is that the energy, which is needed for heating is covered by environmental energy (heat stored in the ground and biomass from the local district heating supply). Performance Heating The heating consumption was measured for 2000 and 2001, divided in the office facilities on the ground, first and second floor and the conference room. The underground heat exchanger supplied 12,300 kWh heat during the year 2000, leaving the district heating demand to 19,100 kWh. The total heat demand for 2000 was 31,400 kWh and 43,200 kWh for 2001. Cooling The monitoring results from the period 2000 to 2001 show a cooling yield from the underground heat exchanger of 18 kW. This yield in combination with the utilisation of the night cooling (night flush with cold outdoor air) cover the entire cooling demand for the summer of 2000. Calculations of the office building (“massive“ construction mode and specific cooling load of 50 W/m²) show that the cooling energy demand can be reduced by up to 60% with a 3.5 times night ventilation air change. Further, the window ventilation show a reduction of more than 50%. Electricity The electricity consumption during year 2000 was 88,500 kWh (=57 kWh/m² office area), the electricity for the ventilation systems excluded (which was 6,000 kWh/a). Lessons learnt Lessons learnt from this project regard the planning of activities and the occupancy of the building. The rate of occupancy was planed much lower and one company with their offices in this building have much different working hours as what was calculated with. This has lead to unexpected high internal loads. Further was a layout temperature of 20°C used in the calculations and 23°C is applied in reality. The norm DIN 1946 is applied for definition of the comfort criteria. But since the tolerance temperature level tend to increase with the outdoor temperature, can this only be used limited as an estimation standard. References Herkel S. (2003), “Thermische Komfort im Sommer in Bürogebäuden mit passiver Kühlung“, Fraunhofer Institute for Solar Energy Systems, Freiburg, Germany.
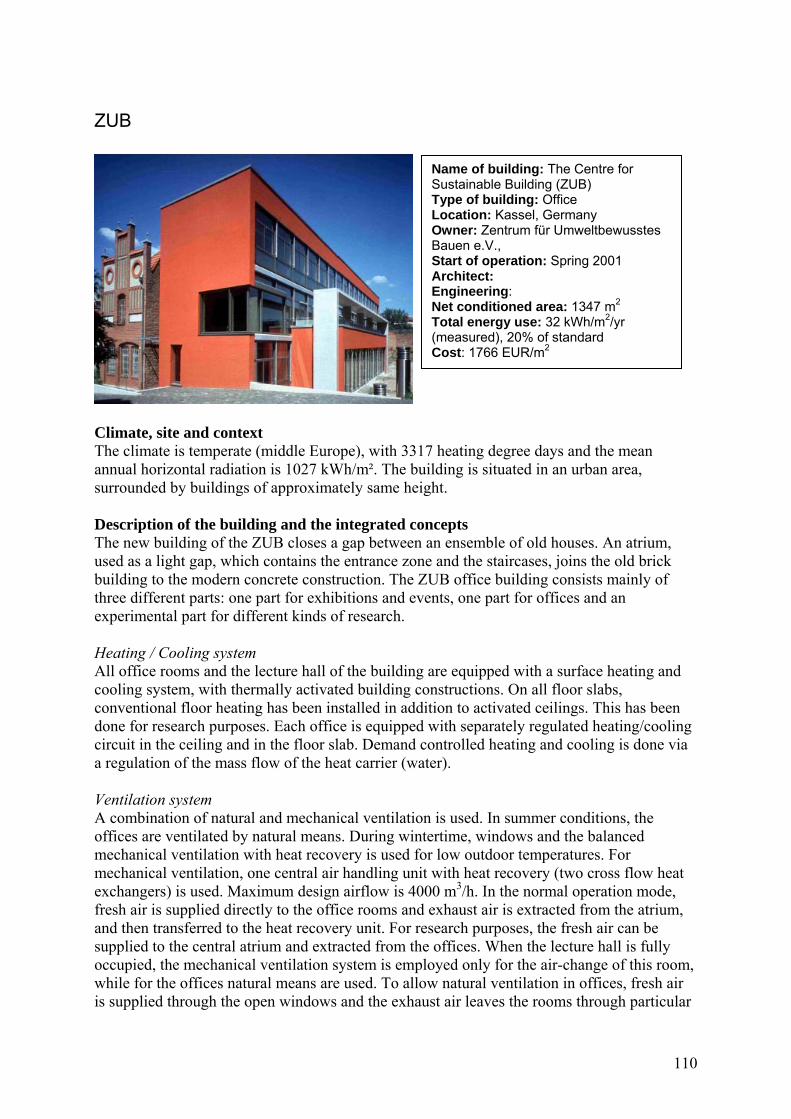
110
ZUB
Climate, site and context The climate is temperate (middle Europe), with 3317 heating degree days and the mean annual horizontal radiation is 1027 kWh/m². The building is situated in an urban area, surrounded by buildings of approximately same height. Description of the building and the integrated concepts The new building of the ZUB closes a gap between an ensemble of old houses. An atrium, used as a light gap, which contains the entrance zone and the staircases, joins the old brick building to the modern concrete construction. The ZUB office building consists mainly of three different parts: one part for exhibitions and events, one part for offices and an experimental part for different kinds of research. Heating / Cooling system All office rooms and the lecture hall of the building are equipped with a surface heating and cooling system, with thermally activated building constructions. On all floor slabs, conventional floor heating has been installed in addition to activated ceilings. This has been done for research purposes. Each office is equipped with separately regulated heating/cooling circuit in the ceiling and in the floor slab. Demand controlled heating and cooling is done via a regulation of the mass flow of the heat carrier (water). Ventilation system A combination of natural and mechanical ventilation is used. In summer conditions, the offices are ventilated by natural means. During wintertime, windows and the balanced mechanical ventilation with heat recovery is used for low outdoor temperatures. For mechanical ventilation, one central air handling unit with heat recovery (two cross flow heat exchangers) is used. Maximum design airflow is 4000 m3/h. In the normal operation mode, fresh air is supplied directly to the office rooms and exhaust air is extracted from the atrium, and then transferred to the heat recovery unit. For research purposes, the fresh air can be supplied to the central atrium and extracted from the offices. When the lecture hall is fully occupied, the mechanical ventilation system is employed only for the air-change of this room, while for the offices natural means are used. To allow natural ventilation in offices, fresh air is supplied through the open windows and the exhaust air leaves the rooms through particular
Name of building: The Centre for Sustainable Building (ZUB) Type of building: Office Location: Kassel, Germany Owner: Zentrum für Umweltbewusstes Bauen e.V., Start of operation: Spring 2001 Architect: Engineering: Net conditioned area: 1347 m2 Total energy use: 32 kWh/m2/yr (measured), 20% of standard Cost: 1766 EUR/m2
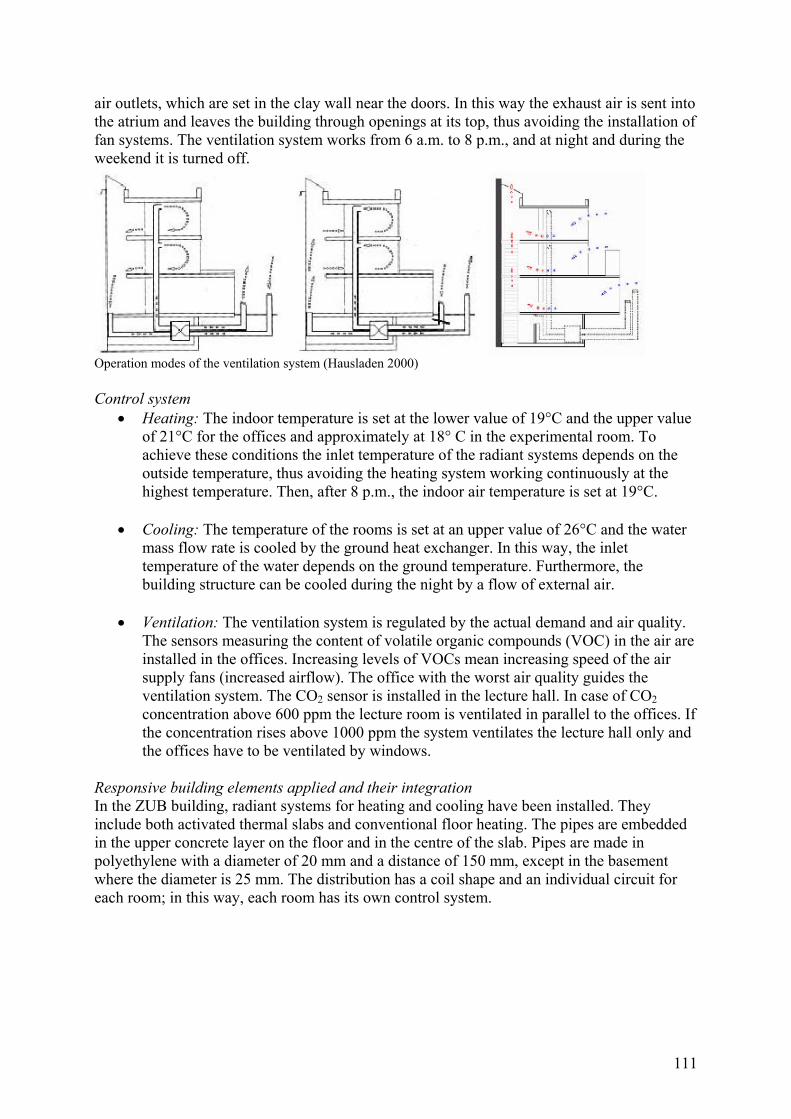
111
air outlets, which are set in the clay wall near the doors. In this way the exhaust air is sent into the atrium and leaves the building through openings at its top, thus avoiding the installation of fan systems. The ventilation system works from 6 a.m. to 8 p.m., and at night and during the weekend it is turned off.
Operation modes of the ventilation system (Hausladen 2000) Control system
• Heating: The indoor temperature is set at the lower value of 19°C and the upper value of 21°C for the offices and approximately at 18° C in the experimental room. To achieve these conditions the inlet temperature of the radiant systems depends on the outside temperature, thus avoiding the heating system working continuously at the highest temperature. Then, after 8 p.m., the indoor air temperature is set at 19°C.
• Cooling: The temperature of the rooms is set at an upper value of 26°C and the water
mass flow rate is cooled by the ground heat exchanger. In this way, the inlet temperature of the water depends on the ground temperature. Furthermore, the building structure can be cooled during the night by a flow of external air.
• Ventilation: The ventilation system is regulated by the actual demand and air quality.
The sensors measuring the content of volatile organic compounds (VOC) in the air are installed in the offices. Increasing levels of VOCs mean increasing speed of the air supply fans (increased airflow). The office with the worst air quality guides the ventilation system. The CO2 sensor is installed in the lecture hall. In case of CO2 concentration above 600 ppm the lecture room is ventilated in parallel to the offices. If the concentration rises above 1000 ppm the system ventilates the lecture hall only and the offices have to be ventilated by windows.
Responsive building elements applied and their integration In the ZUB building, radiant systems for heating and cooling have been installed. They include both activated thermal slabs and conventional floor heating. The pipes are embedded in the upper concrete layer on the floor and in the centre of the slab. Pipes are made in polyethylene with a diameter of 20 mm and a distance of 150 mm, except in the basement where the diameter is 25 mm. The distribution has a coil shape and an individual circuit for each room; in this way, each room has its own control system.
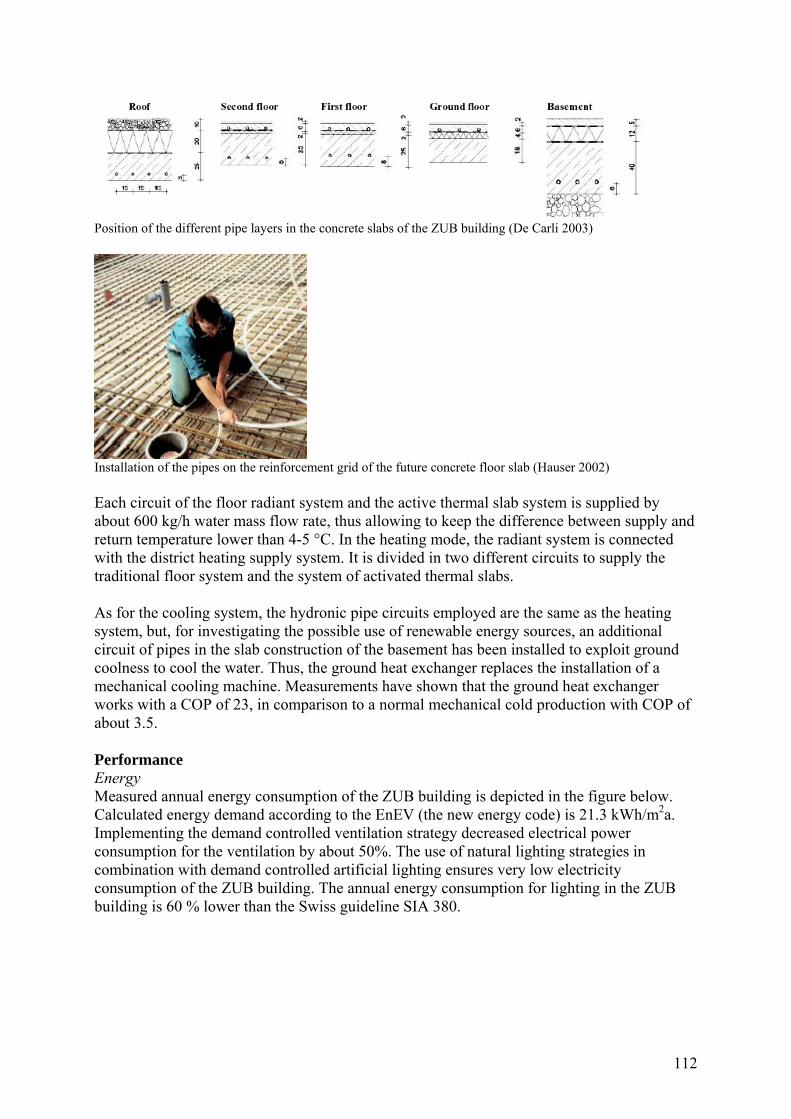
112
Position of the different pipe layers in the concrete slabs of the ZUB building (De Carli 2003)
Installation of the pipes on the reinforcement grid of the future concrete floor slab (Hauser 2002) Each circuit of the floor radiant system and the active thermal slab system is supplied by about 600 kg/h water mass flow rate, thus allowing to keep the difference between supply and return temperature lower than 4-5 °C. In the heating mode, the radiant system is connected with the district heating supply system. It is divided in two different circuits to supply the traditional floor system and the system of activated thermal slabs. As for the cooling system, the hydronic pipe circuits employed are the same as the heating system, but, for investigating the possible use of renewable energy sources, an additional circuit of pipes in the slab construction of the basement has been installed to exploit ground coolness to cool the water. Thus, the ground heat exchanger replaces the installation of a mechanical cooling machine. Measurements have shown that the ground heat exchanger works with a COP of 23, in comparison to a normal mechanical cold production with COP of about 3.5. Performance Energy Measured annual energy consumption of the ZUB building is depicted in the figure below. Calculated energy demand according to the EnEV (the new energy code) is 21.3 kWh/m2a. Implementing the demand controlled ventilation strategy decreased electrical power consumption for the ventilation by about 50%. The use of natural lighting strategies in combination with demand controlled artificial lighting ensures very low electricity consumption of the ZUB building. The annual energy consumption for lighting in the ZUB building is 60 % lower than the Swiss guideline SIA 380.
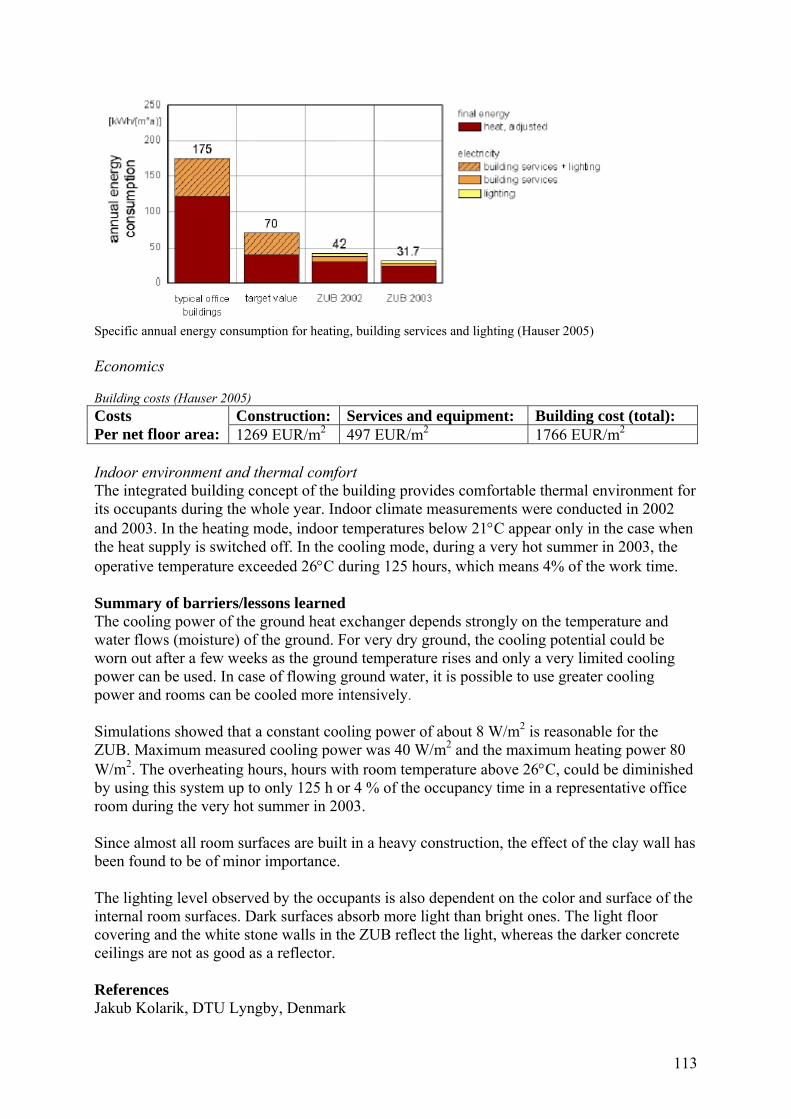
113
Specific annual energy consumption for heating, building services and lighting (Hauser 2005) Economics Building costs (Hauser 2005)
Construction: Services and equipment: Building cost (total): Costs Per net floor area: 1269 EUR/m2 497 EUR/m2 1766 EUR/m2 Indoor environment and thermal comfort The integrated building concept of the building provides comfortable thermal environment for its occupants during the whole year. Indoor climate measurements were conducted in 2002 and 2003. In the heating mode, indoor temperatures below 21°C appear only in the case when the heat supply is switched off. In the cooling mode, during a very hot summer in 2003, the operative temperature exceeded 26°C during 125 hours, which means 4% of the work time. Summary of barriers/lessons learned The cooling power of the ground heat exchanger depends strongly on the temperature and water flows (moisture) of the ground. For very dry ground, the cooling potential could be worn out after a few weeks as the ground temperature rises and only a very limited cooling power can be used. In case of flowing ground water, it is possible to use greater cooling power and rooms can be cooled more intensively. Simulations showed that a constant cooling power of about 8 W/m2 is reasonable for the ZUB. Maximum measured cooling power was 40 W/m2 and the maximum heating power 80 W/m2. The overheating hours, hours with room temperature above 26°C, could be diminished by using this system up to only 125 h or 4 % of the occupancy time in a representative office room during the very hot summer in 2003. Since almost all room surfaces are built in a heavy construction, the effect of the clay wall has been found to be of minor importance. The lighting level observed by the occupants is also dependent on the color and surface of the internal room surfaces. Dark surfaces absorb more light than bright ones. The light floor covering and the white stone walls in the ZUB reflect the light, whereas the darker concrete ceilings are not as good as a reflector. References Jakub Kolarik, DTU Lyngby, Denmark
114
Dietrich Schmidt, Fraunhofer-Institute for Building Physics, Kassel, Germany
De Carli, M., Hauser, G., Schmidt, D., Zecchin, P., Zecchin, R. 2003, An Innovative Building Based On Active Thermal Slab Systems, 58th ATI National Conference, San Martino di Castrozza, Italy
Hauser, G., Hausladen, G., de Saldanha, M., Sager C. 2002, Projektteilbericht "Solaroptimiertes Bauen (Teilkonzept 3)", Phase 1, "Forscher drin, Forschung dran - Konzept, Planung, Bau", Universität Kassel, Fachgebiete Bauphysik und Technische Gebäudeausrüstung, Kassel Germany
Hauser, G., Kaiser, J., Rösler, M., Schmidt, D. 2004, Energetische Optimierung, Vermessung und Dokumentation für das Demonstrationsgebäude des Zentrum für Umweltbewusstes Bauen, Final report of the BMWA research project, University of Kassel, Kassel, Germany
Hausladen, G. 2000, Innovative Gebäude, Technik und Energiekonzepte, Oldenburg Industrieverlag, Munich
Meyer, C. 2001, Photos of ZUB, Meyer Architekturphotographie, Cologne
Seddig, I. 2000, Architectural drawings and planning of ZUB, Jourdan & Müller PAS, Seddig Architekten, Kassel, Germany
Schmidt, D. 2002, The Centre of Sustainable Building (ZUB)- A Case Study, In: Proceedings of the 3rd International Sustainable Building Conference, September 23-25 2002, Oslo, Norway
Hauser, G. Kaiser, J., Schmidt, D. 2005 Energy Optimised in Theory and Practice – The Centre for Sustainable Building, Submitted and accepted: Proceedings to the Sustainable Building Conference 2005, September 27-29, 2005, Tokyo, Japan
Related website: www.bpy.uni-kassel.de/solaropt
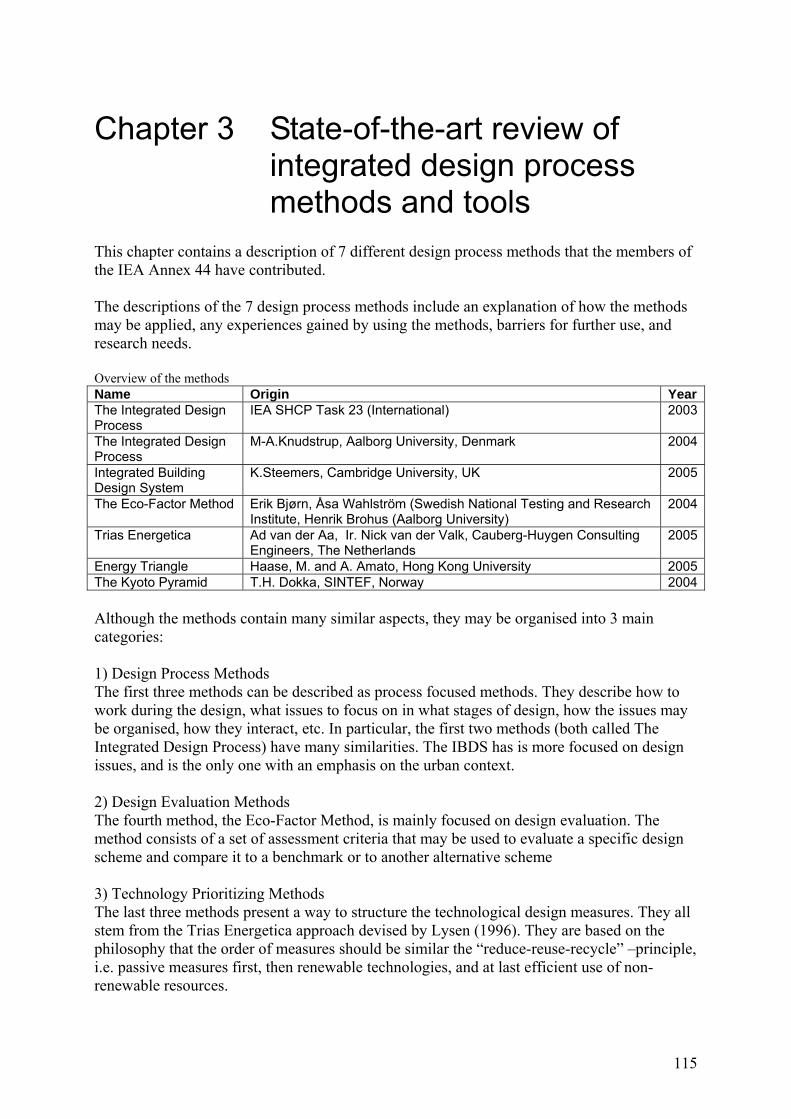
115
Chapter 3 State-of-the-art review of integrated design process methods and tools
This chapter contains a description of 7 different design process methods that the members of the IEA Annex 44 have contributed. The descriptions of the 7 design process methods include an explanation of how the methods may be applied, any experiences gained by using the methods, barriers for further use, and research needs. Overview of the methods Name Origin Year The Integrated Design Process
IEA SHCP Task 23 (International) 2003
The Integrated Design Process
M-A.Knudstrup, Aalborg University, Denmark 2004
Integrated Building Design System
K.Steemers, Cambridge University, UK 2005
The Eco-Factor Method Erik Bjørn, Åsa Wahlström (Swedish National Testing and Research Institute, Henrik Brohus (Aalborg University)
2004
Trias Energetica Ad van der Aa, Ir. Nick van der Valk, Cauberg-Huygen Consulting Engineers, The Netherlands
2005
Energy Triangle Haase, M. and A. Amato, Hong Kong University 2005The Kyoto Pyramid T.H. Dokka, SINTEF, Norway 2004 Although the methods contain many similar aspects, they may be organised into 3 main categories: 1) Design Process Methods The first three methods can be described as process focused methods. They describe how to work during the design, what issues to focus on in what stages of design, how the issues may be organised, how they interact, etc. In particular, the first two methods (both called The Integrated Design Process) have many similarities. The IBDS has is more focused on design issues, and is the only one with an emphasis on the urban context. 2) Design Evaluation Methods The fourth method, the Eco-Factor Method, is mainly focused on design evaluation. The method consists of a set of assessment criteria that may be used to evaluate a specific design scheme and compare it to a benchmark or to another alternative scheme 3) Technology Prioritizing Methods The last three methods present a way to structure the technological design measures. They all stem from the Trias Energetica approach devised by Lysen (1996). They are based on the philosophy that the order of measures should be similar the “reduce-reuse-recycle” –principle, i.e. passive measures first, then renewable technologies, and at last efficient use of non-renewable resources.
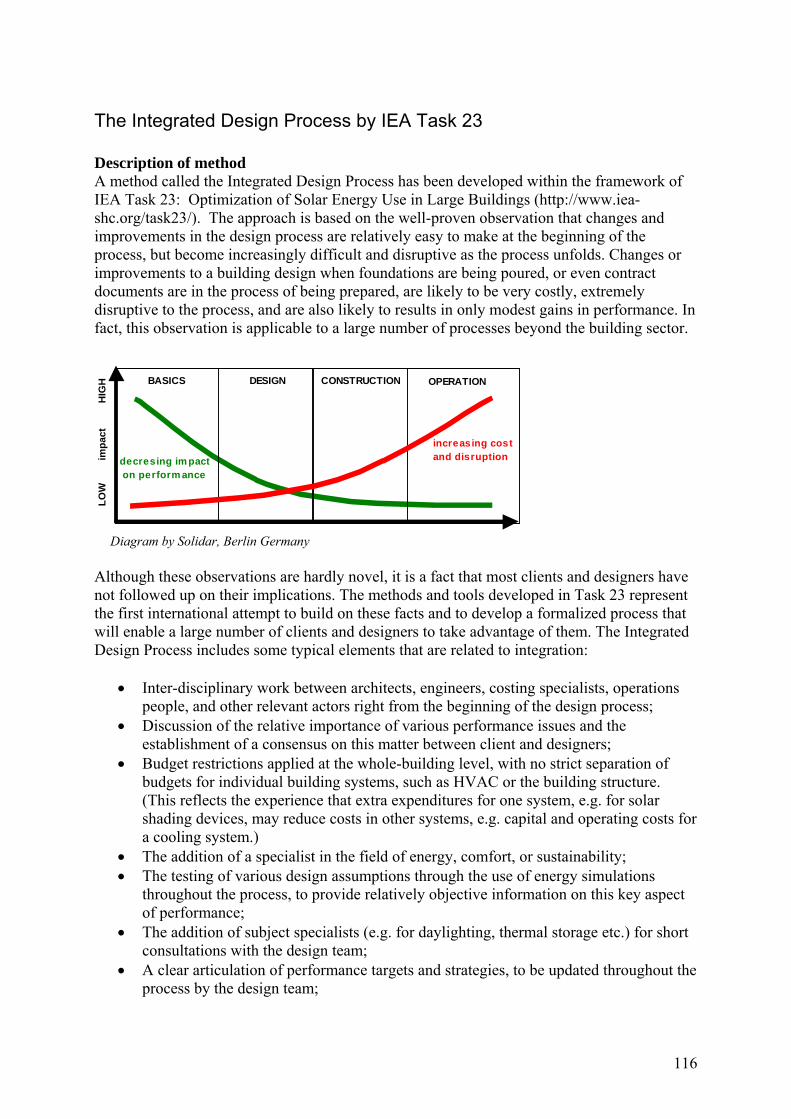
116
The Integrated Design Process by IEA Task 23 Description of method A method called the Integrated Design Process has been developed within the framework of IEA Task 23: Optimization of Solar Energy Use in Large Buildings (http://www.iea-shc.org/task23/). The approach is based on the well-proven observation that changes and improvements in the design process are relatively easy to make at the beginning of the process, but become increasingly difficult and disruptive as the process unfolds. Changes or improvements to a building design when foundations are being poured, or even contract documents are in the process of being prepared, are likely to be very costly, extremely disruptive to the process, and are also likely to results in only modest gains in performance. In fact, this observation is applicable to a large number of processes beyond the building sector.
Diagram by Solidar, Berlin Germany Although these observations are hardly novel, it is a fact that most clients and designers have not followed up on their implications. The methods and tools developed in Task 23 represent the first international attempt to build on these facts and to develop a formalized process that will enable a large number of clients and designers to take advantage of them. The Integrated Design Process includes some typical elements that are related to integration:
• Inter-disciplinary work between architects, engineers, costing specialists, operations people, and other relevant actors right from the beginning of the design process;
• Discussion of the relative importance of various performance issues and the establishment of a consensus on this matter between client and designers;
• Budget restrictions applied at the whole-building level, with no strict separation of budgets for individual building systems, such as HVAC or the building structure. (This reflects the experience that extra expenditures for one system, e.g. for solar shading devices, may reduce costs in other systems, e.g. capital and operating costs for a cooling system.)
• The addition of a specialist in the field of energy, comfort, or sustainability; • The testing of various design assumptions through the use of energy simulations
throughout the process, to provide relatively objective information on this key aspect of performance;
• The addition of subject specialists (e.g. for daylighting, thermal storage etc.) for short consultations with the design team;
• A clear articulation of performance targets and strategies, to be updated throughout the process by the design team;
BASICS DESIGN CONSTRUCTION OPERATION
LOW
im
pact
H
IGH
increasing cost and disruptiondecresing im pact
on perform ance
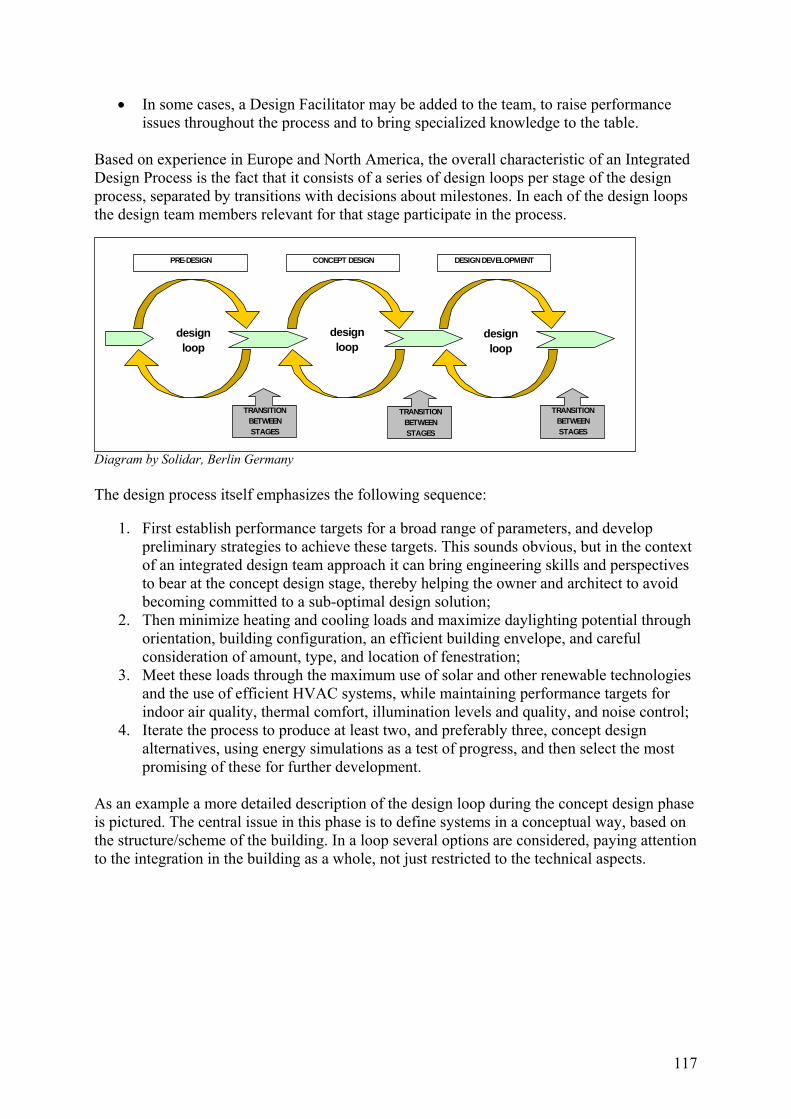
117
• In some cases, a Design Facilitator may be added to the team, to raise performance issues throughout the process and to bring specialized knowledge to the table.
Based on experience in Europe and North America, the overall characteristic of an Integrated Design Process is the fact that it consists of a series of design loops per stage of the design process, separated by transitions with decisions about milestones. In each of the design loops the design team members relevant for that stage participate in the process.
Diagram by Solidar, Berlin Germany The design process itself emphasizes the following sequence:
1. First establish performance targets for a broad range of parameters, and develop preliminary strategies to achieve these targets. This sounds obvious, but in the context of an integrated design team approach it can bring engineering skills and perspectives to bear at the concept design stage, thereby helping the owner and architect to avoid becoming committed to a sub-optimal design solution;
2. Then minimize heating and cooling loads and maximize daylighting potential through orientation, building configuration, an efficient building envelope, and careful consideration of amount, type, and location of fenestration;
3. Meet these loads through the maximum use of solar and other renewable technologies and the use of efficient HVAC systems, while maintaining performance targets for indoor air quality, thermal comfort, illumination levels and quality, and noise control;
4. Iterate the process to produce at least two, and preferably three, concept design alternatives, using energy simulations as a test of progress, and then select the most promising of these for further development.
As an example a more detailed description of the design loop during the concept design phase is pictured. The central issue in this phase is to define systems in a conceptual way, based on the structure/scheme of the building. In a loop several options are considered, paying attention to the integration in the building as a whole, not just restricted to the technical aspects.
PRE-DESIGN DESIGN DEVELOPMENTCONCEPT DESIGN
TRANSITION BETWEEN STAGES
TRANSITION BETWEEN STAGES
TRANSITION BETWEEN STAGES
design loop
design loop
design loop
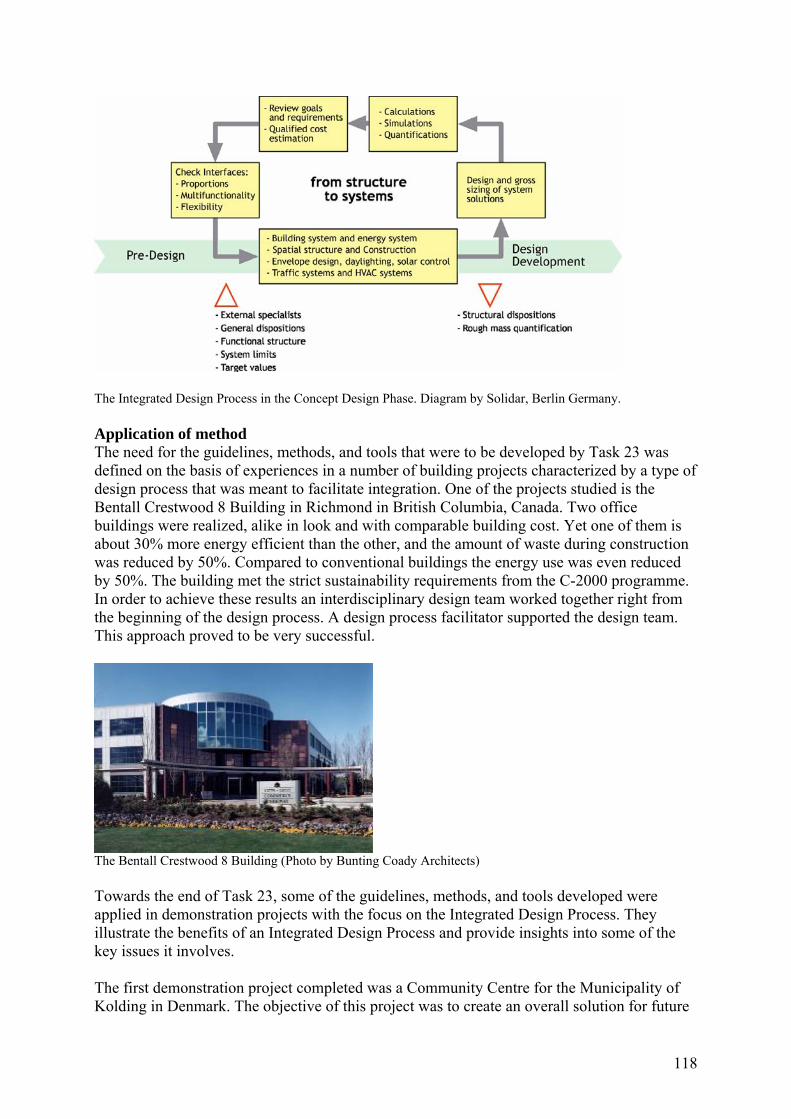
118
The Integrated Design Process in the Concept Design Phase. Diagram by Solidar, Berlin Germany. Application of method The need for the guidelines, methods, and tools that were to be developed by Task 23 was defined on the basis of experiences in a number of building projects characterized by a type of design process that was meant to facilitate integration. One of the projects studied is the Bentall Crestwood 8 Building in Richmond in British Columbia, Canada. Two office buildings were realized, alike in look and with comparable building cost. Yet one of them is about 30% more energy efficient than the other, and the amount of waste during construction was reduced by 50%. Compared to conventional buildings the energy use was even reduced by 50%. The building met the strict sustainability requirements from the C-2000 programme. In order to achieve these results an interdisciplinary design team worked together right from the beginning of the design process. A design process facilitator supported the design team. This approach proved to be very successful.
The Bentall Crestwood 8 Building (Photo by Bunting Coady Architects) Towards the end of Task 23, some of the guidelines, methods, and tools developed were applied in demonstration projects with the focus on the Integrated Design Process. They illustrate the benefits of an Integrated Design Process and provide insights into some of the key issues it involves. The first demonstration project completed was a Community Centre for the Municipality of Kolding in Denmark. The objective of this project was to create an overall solution for future
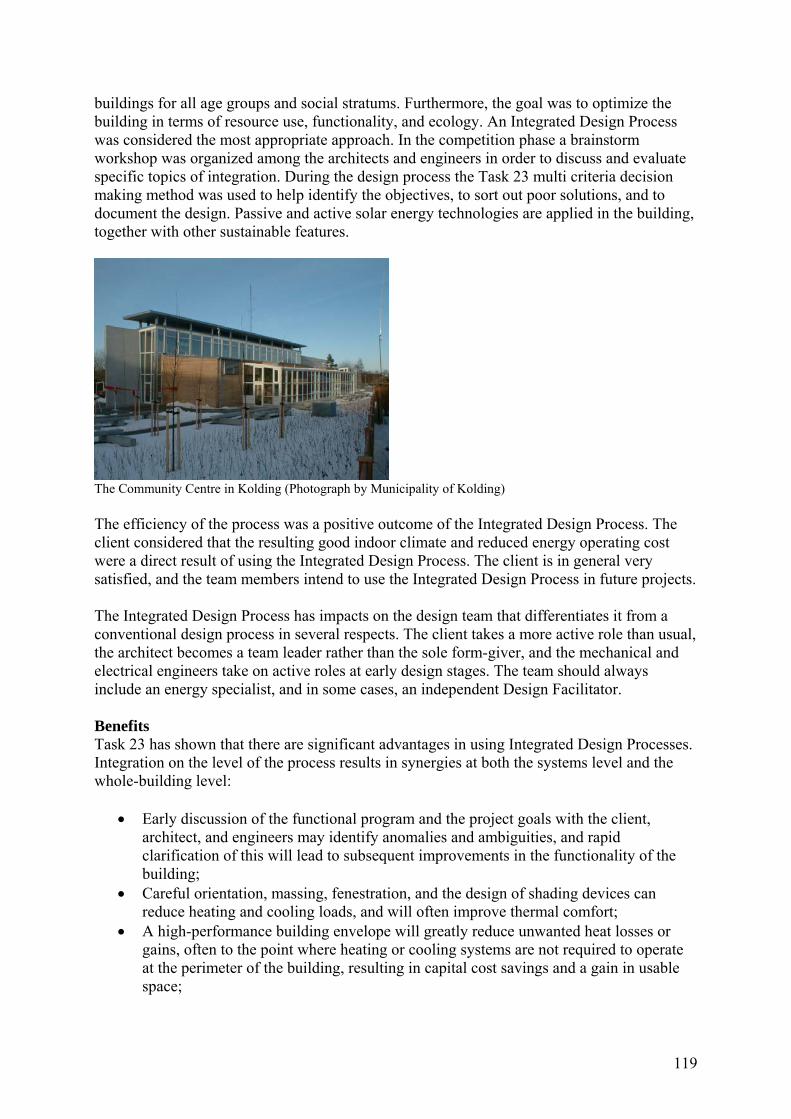
119
buildings for all age groups and social stratums. Furthermore, the goal was to optimize the building in terms of resource use, functionality, and ecology. An Integrated Design Process was considered the most appropriate approach. In the competition phase a brainstorm workshop was organized among the architects and engineers in order to discuss and evaluate specific topics of integration. During the design process the Task 23 multi criteria decision making method was used to help identify the objectives, to sort out poor solutions, and to document the design. Passive and active solar energy technologies are applied in the building, together with other sustainable features.
The Community Centre in Kolding (Photograph by Municipality of Kolding) The efficiency of the process was a positive outcome of the Integrated Design Process. The client considered that the resulting good indoor climate and reduced energy operating cost were a direct result of using the Integrated Design Process. The client is in general very satisfied, and the team members intend to use the Integrated Design Process in future projects. The Integrated Design Process has impacts on the design team that differentiates it from a conventional design process in several respects. The client takes a more active role than usual, the architect becomes a team leader rather than the sole form-giver, and the mechanical and electrical engineers take on active roles at early design stages. The team should always include an energy specialist, and in some cases, an independent Design Facilitator. Benefits Task 23 has shown that there are significant advantages in using Integrated Design Processes. Integration on the level of the process results in synergies at both the systems level and the whole-building level:
• Early discussion of the functional program and the project goals with the client, architect, and engineers may identify anomalies and ambiguities, and rapid clarification of this will lead to subsequent improvements in the functionality of the building;
• Careful orientation, massing, fenestration, and the design of shading devices can reduce heating and cooling loads, and will often improve thermal comfort;
• A high-performance building envelope will greatly reduce unwanted heat losses or gains, often to the point where heating or cooling systems are not required to operate at the perimeter of the building, resulting in capital cost savings and a gain in usable space;

120
• An emphasis on daylighting will reduce cooling loads, because of reduced lighting requirements, and may also improve illumination quality;
• These factors will permit a reduction in floor-to-floor heights (or improved daylighting because of higher net floor height), and will also permit a reduction in HVAC plant and system capacity and size requirements. Significant load reductions also open the way for use of alternative and simpler systems, such as radiant heating and cooling and natural or hybrid ventilation;
• Reductions in boiler, chiller, AHU, and ducting sizes will, in turn, reduce capital, operating, maintenance, and replacement costs;
• A deeper understanding of the nature and inter-relationships of all the issues described above, will lead to the possibility of a higher level of architectural expression.
Barriers
• Extra time and resources are needed in the early design stage. • The different members of the design team needs to have an understanding and of the
integration aspects. This requires that they have some knowledge/understanding of the whole range of professional fields.
Need for further research
• Developments of design tools that facilitates and Integrated Design Process References Larsson, N. and B. Poel (2003) “Solar Low Energy Buildings and the Integrated Design Process – An Introduction”, http://www.iea-shc.org/task23/.
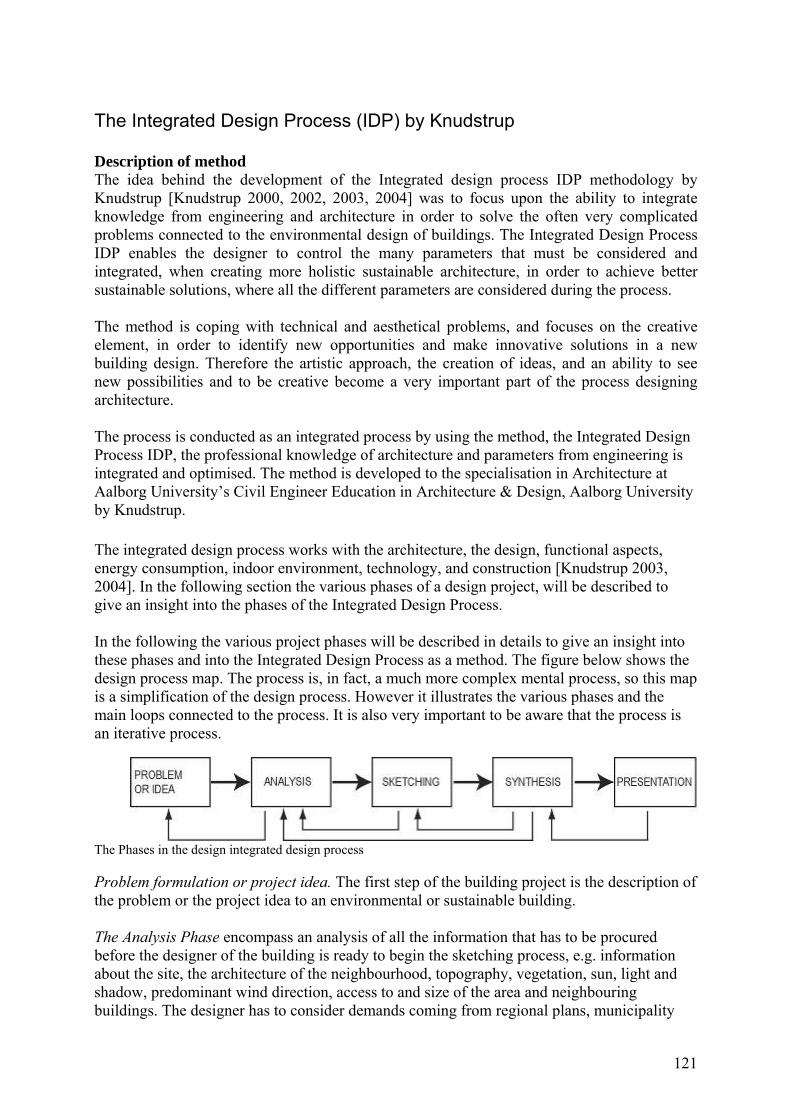
121
The Integrated Design Process (IDP) by Knudstrup Description of method The idea behind the development of the Integrated design process IDP methodology by Knudstrup [Knudstrup 2000, 2002, 2003, 2004] was to focus upon the ability to integrate knowledge from engineering and architecture in order to solve the often very complicated problems connected to the environmental design of buildings. The Integrated Design Process IDP enables the designer to control the many parameters that must be considered and integrated, when creating more holistic sustainable architecture, in order to achieve better sustainable solutions, where all the different parameters are considered during the process. The method is coping with technical and aesthetical problems, and focuses on the creative element, in order to identify new opportunities and make innovative solutions in a new building design. Therefore the artistic approach, the creation of ideas, and an ability to see new possibilities and to be creative become a very important part of the process designing architecture. The process is conducted as an integrated process by using the method, the Integrated Design Process IDP, the professional knowledge of architecture and parameters from engineering is integrated and optimised. The method is developed to the specialisation in Architecture at Aalborg University’s Civil Engineer Education in Architecture & Design, Aalborg University by Knudstrup. The integrated design process works with the architecture, the design, functional aspects, energy consumption, indoor environment, technology, and construction [Knudstrup 2003, 2004]. In the following section the various phases of a design project, will be described to give an insight into the phases of the Integrated Design Process. In the following the various project phases will be described in details to give an insight into these phases and into the Integrated Design Process as a method. The figure below shows the design process map. The process is, in fact, a much more complex mental process, so this map is a simplification of the design process. However it illustrates the various phases and the main loops connected to the process. It is also very important to be aware that the process is an iterative process.
The Phases in the design integrated design process Problem formulation or project idea. The first step of the building project is the description of the problem or the project idea to an environmental or sustainable building. The Analysis Phase encompass an analysis of all the information that has to be procured before the designer of the building is ready to begin the sketching process, e.g. information about the site, the architecture of the neighbourhood, topography, vegetation, sun, light and shadow, predominant wind direction, access to and size of the area and neighbouring buildings. The designer has to consider demands coming from regional plans, municipality
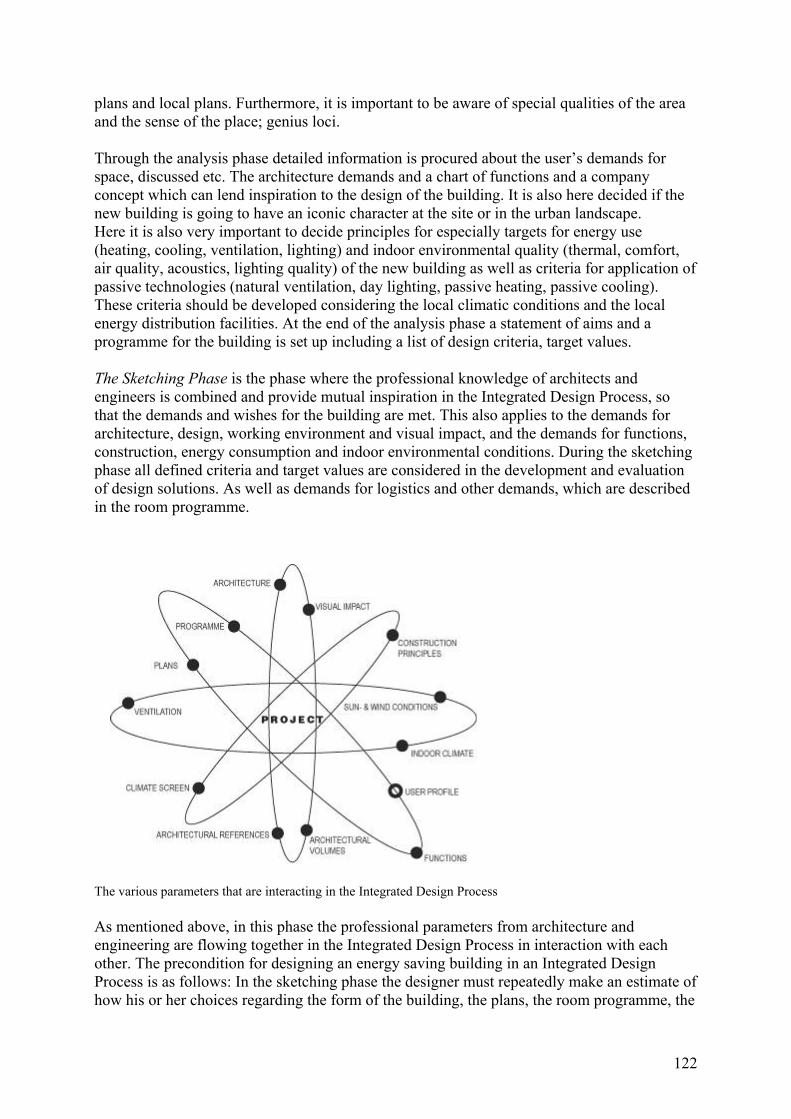
122
plans and local plans. Furthermore, it is important to be aware of special qualities of the area and the sense of the place; genius loci. Through the analysis phase detailed information is procured about the user’s demands for space, discussed etc. The architecture demands and a chart of functions and a company concept which can lend inspiration to the design of the building. It is also here decided if the new building is going to have an iconic character at the site or in the urban landscape. Here it is also very important to decide principles for especially targets for energy use (heating, cooling, ventilation, lighting) and indoor environmental quality (thermal, comfort, air quality, acoustics, lighting quality) of the new building as well as criteria for application of passive technologies (natural ventilation, day lighting, passive heating, passive cooling). These criteria should be developed considering the local climatic conditions and the local energy distribution facilities. At the end of the analysis phase a statement of aims and a programme for the building is set up including a list of design criteria, target values. The Sketching Phase is the phase where the professional knowledge of architects and engineers is combined and provide mutual inspiration in the Integrated Design Process, so that the demands and wishes for the building are met. This also applies to the demands for architecture, design, working environment and visual impact, and the demands for functions, construction, energy consumption and indoor environmental conditions. During the sketching phase all defined criteria and target values are considered in the development and evaluation of design solutions. As well as demands for logistics and other demands, which are described in the room programme.
The various parameters that are interacting in the Integrated Design Process As mentioned above, in this phase the professional parameters from architecture and engineering are flowing together in the Integrated Design Process in interaction with each other. The precondition for designing an energy saving building in an Integrated Design Process is as follows: In the sketching phase the designer must repeatedly make an estimate of how his or her choices regarding the form of the building, the plans, the room programme, the
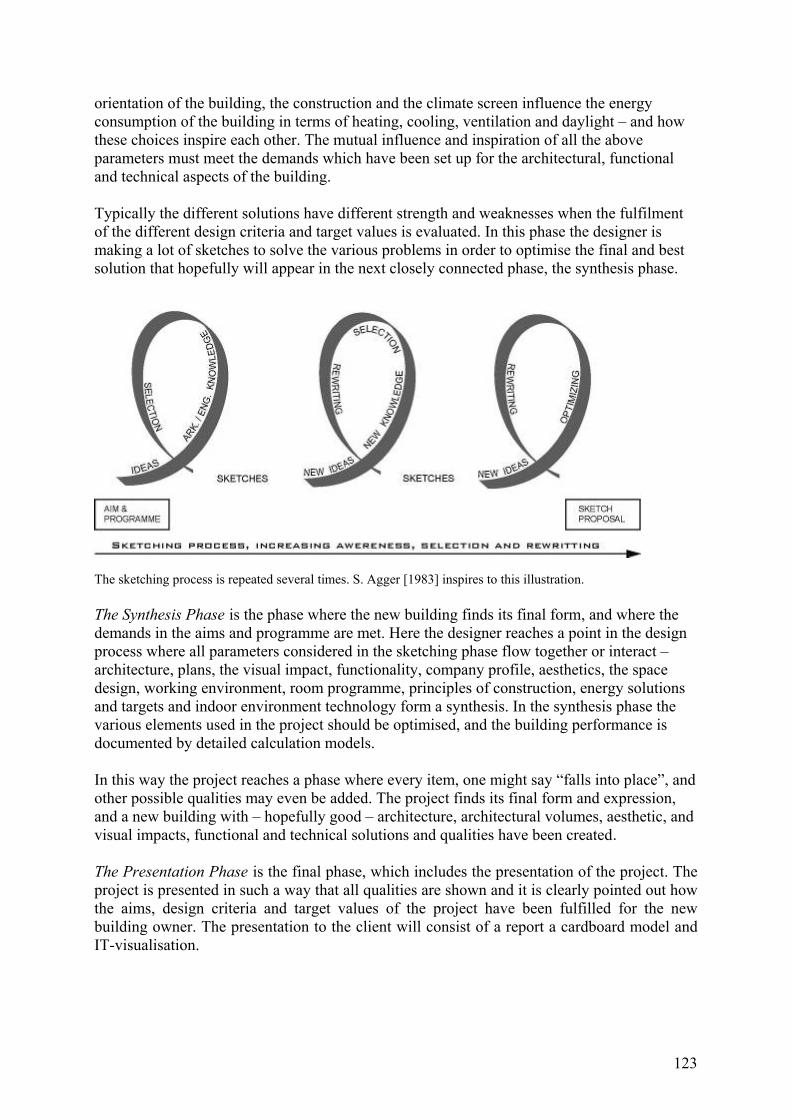
123
orientation of the building, the construction and the climate screen influence the energy consumption of the building in terms of heating, cooling, ventilation and daylight – and how these choices inspire each other. The mutual influence and inspiration of all the above parameters must meet the demands which have been set up for the architectural, functional and technical aspects of the building. Typically the different solutions have different strength and weaknesses when the fulfilment of the different design criteria and target values is evaluated. In this phase the designer is making a lot of sketches to solve the various problems in order to optimise the final and best solution that hopefully will appear in the next closely connected phase, the synthesis phase.
The sketching process is repeated several times. S. Agger [1983] inspires to this illustration. The Synthesis Phase is the phase where the new building finds its final form, and where the demands in the aims and programme are met. Here the designer reaches a point in the design process where all parameters considered in the sketching phase flow together or interact – architecture, plans, the visual impact, functionality, company profile, aesthetics, the space design, working environment, room programme, principles of construction, energy solutions and targets and indoor environment technology form a synthesis. In the synthesis phase the various elements used in the project should be optimised, and the building performance is documented by detailed calculation models. In this way the project reaches a phase where every item, one might say “falls into place”, and other possible qualities may even be added. The project finds its final form and expression, and a new building with – hopefully good – architecture, architectural volumes, aesthetic, and visual impacts, functional and technical solutions and qualities have been created. The Presentation Phase is the final phase, which includes the presentation of the project. The project is presented in such a way that all qualities are shown and it is clearly pointed out how the aims, design criteria and target values of the project have been fulfilled for the new building owner. The presentation to the client will consist of a report a cardboard model and IT-visualisation.
124
Application of method The IDP can be used for environmental or sustainable projects. But there is still a need more specific methods, e.g. related to a particular function in a specified climate. By looking at the development of methods in environmental and sustainable architecture in general one can conclude that others have reached the similar conclusions that methods in sustainable architecture are important, as most methods focus on subsections of sustainable design. These are important but a more holistic method is also needed which embraces all the subsections and completes the sustainability of architecture. The IDP enables the designer to control the many parameters that must be considered and integrated in the project when creating more holistic sustainable architecture in order to achieve better sustainable solutions, because all the different parameters are considered already from the annals phase and during the process. The method is first of all used at the master level of the Architecture curriculum when the students produce energy and climate optimised buildings. The objective is described in the study guide for the semester [Knudstrup 2000, 2002]. The approach by developing the methodology, Knudstrup drew upon here professional education and background as an architect as well as methods used entrenched as an active or passive knowledge in here profession [Lawson 2000] as well as knowledge about technical parameters from engineering. IDP is based on group work, but it can also be done by traditionally educated architects and engineers as well. If the method is used in practice it would be easier to overcome the many aspects in a team consisting of people with different competencies, especially if it is a larger project and if they are not educated in the Integrated Design Process IDP, because of the many parameters and the trans-disciplinary approach. Benefits The students’ project shows, that it is possible to integrate the engineer skills with the architect skills in the projects, and they are learning a method, which enable them to combine other parameters than the traditional architect parameters in the process. The students are, in fact, creating very interesting buildings with high qualities, where the architecture language is integrated with and inspired by engineering parameters, so that the architectural and technical solutions are optimised. The point is that the students have to integrate the engineer parameters from the very beginning, already in the analysis phase, and further in the process when the sketching of the building is taking place, so that they can make a synthesis of the architectural and engineering parameters. • If the indoor environmental conditions and the energy frame of the building become
clarified, we in this way can avoid frustrating problems when e.g. ventilation does not fit into the design of the building.
• From an economic point of view, the operating costs can be kept at a low level when the climate shield of the building is optimised saving energy for cooling and heating, and the passive ventilation principles are employed, which also reduces energy expenses.
• There is no tradition talking the same language so architects and engineers sometimes come from “different planets”. The architect belongs to a humanistic tradition where as the engineer belongs to a positivistic tradition. This creates problems when working as a team, as the communication between the different parties relies on a common language and in this case the languages are very different.

125
Need for future research • The more parameters you integrate the more time pressure you got, that’s a problem! So
witch is the most important? • The designers have to take good care of the architectural demands and qualities in the
project so it will not disappear in all the technical calculations. • Interdisciplinary research between architecture and engineering should be encouraged. • I see it also as a huge challenge to develop programmes which can be used for co-
optimising a wide number of parameters at the sketching level - both architectural parameters (design, climate shield, facades, plans arrangements, functions, logistics, materials) and engineering parameters (natural ventilation, climate shield, needs for heating and cooling, and construction).
• How can we implement this method to mainstream architects or designers? References Steen Agger (1983), “Compendium for course in programming and sketching methods”, School of Architecture in Aarhus. Denmark. Knudstrup Mary-Ann (2004), “Integrated Design Process in PBL”, article in The Aalborg PBL model red. Anette Kolmoes, Flemming K Fink and Lone Krogh. Aalborg University Press 2004. Denmark. Knudstrup Mary-Ann (January 2000 & 2002), “Study guide for 6th semester, Architecture. Architecture and Ecology – Energy and environment in Architecture”, Department of Architecture & Design, Aalborg University. Denmark. Lawson, Bryan (2000), “How Designers Think. The design process demystified”, Architectural Press, UK.
126
Integrated Building Design System (IBDS) Description of method A method called Integrated Building Design System (IBDS) has been developed at Cambridge Architectural Research Limited and The Martin Centre for Architectural and Urban Studies, Department of Architecture, University of Cambridge by Koen Steemers. The approach to the integrated building design system, the IBDS methodology provides a flexible system for assessing the interrelationships and levels of integration of design parameters for low energy design in an urban context. The method is flexible in that additional and alternative parameters can be included in the analysis. Thus if the emphasis of a project shifts to include for example interior planning issues (such as interior finishes, visual and thermal comfort, etc.) or wider urban issues (such as the microclimate, transport, green space, etc.) these can be incorporated by the design team in the IBDS method. However, the variables presented here are considered to be the primary ones. This is a methodology for an integrated building design system (IBDS) in an urban context. It sets out to provide a framework of working which demonstrates and reminds the design team of the range of issues and interactions through the design process. It should not be considered as a rigid process but rather as a way of raising awareness of the integration implications of a range of environmental and design parameters. The IBDS proposed here can be broken down into four main sections as follows:
1. Principles of low energy design 2. Pre-design context 3. Building design 4. Building services
1. Principles of low energy design This part of the IDBS considers the roles of the key environmental design principles and the associated building physics that will impact on the design. The focus here is on those factors that determine the energy performance of the building form and fabric, and the related comfort issues, and thus includes:
• Passive solar design • Daylighting • Natural ventilation • Comfort
This brief list is by no means exclusive and additional or alternative aspects could be included that are of particular relevance to the project in hand. However, it is proposed that the above factors are central in the context of energy efficient urban design. Each aspect – which can be further broken done in to sub categories – will have an impact on strategies adopted for the building design and services, and provides the necessary principles upon which to base decisions. The purpose of including these principles is that they are central to explaining the physical mechanisms that link design decisions with performance consequences. 2. Pre-design context Any project will have a number of pre-determined design constraints. These are determined by the site, the client and the planning authorities and thus include the following:
127
• Site climate and context • The building brief • Local building and planning regulations
Again, additional pre-design aspects could be included if this is desired. Each of the above key factors will have a significant impact on the design from the outset and are largely fixed, although some manipulation and negotiation is occasionally possible under each category. Thus for example, the urban context is largely a given, but changes to the site boundary may be negotiated. Similarly the client may change the building brief as a result of site analysis, and some negotiation may be possible with planning authorities to obtain exemption from certain regulations. 3. Building design At the core of the IBDS lie the building design considerations. The primary parameters can broadly be defined as follows:
• Urban planning • Building form • Façade design • Building fabric
Not only will these variables be influenced by the ‘Principles’ and ‘Pre-design’ issues already outlined but there will be strong interdependencies within this group of design concerns. For example, the building form – whether terraced or courtyard or deep plan, etc. – will impact on the overall layout, but will also influence the decisions related to the façade design and building fabric. These considerations will furthermore have a bearing on the appropriate choice of building services, outlined below. 4. Building services The above sections on ‘Building design’ and ‘Principles of low energy design’ focus primarily on the passive design strategies. However, in any given context it is more than likely that buildings will need to rely to a certain extent on mechanical systems to ensure comfort conditions are maintained. Here we consider such systems as auxiliary – i.e. the aim is to minimise reliance on them and thus reduce the energy demand. The following four categories are considered:
• Heating • Cooling • Mechanical ventilation • Artificial lighting
It is clear that ‘Building design’ decisions should determine the appropriate ‘Building services’ strategies. At a simple level: if a deep plan is adopted then increased mechanical ventilation – possibly even cooling – as well as artificial lighting is necessary. This may be offset against reduced solar gains or heat loss, and requires the ‘Principles of low energy design’ to be rigorously applied. The aim of IBDS methodology is to demonstrate how the various factors described above interact and – more importantly – how they can be integrated successfully and holistically to achieve low energy urban building design.
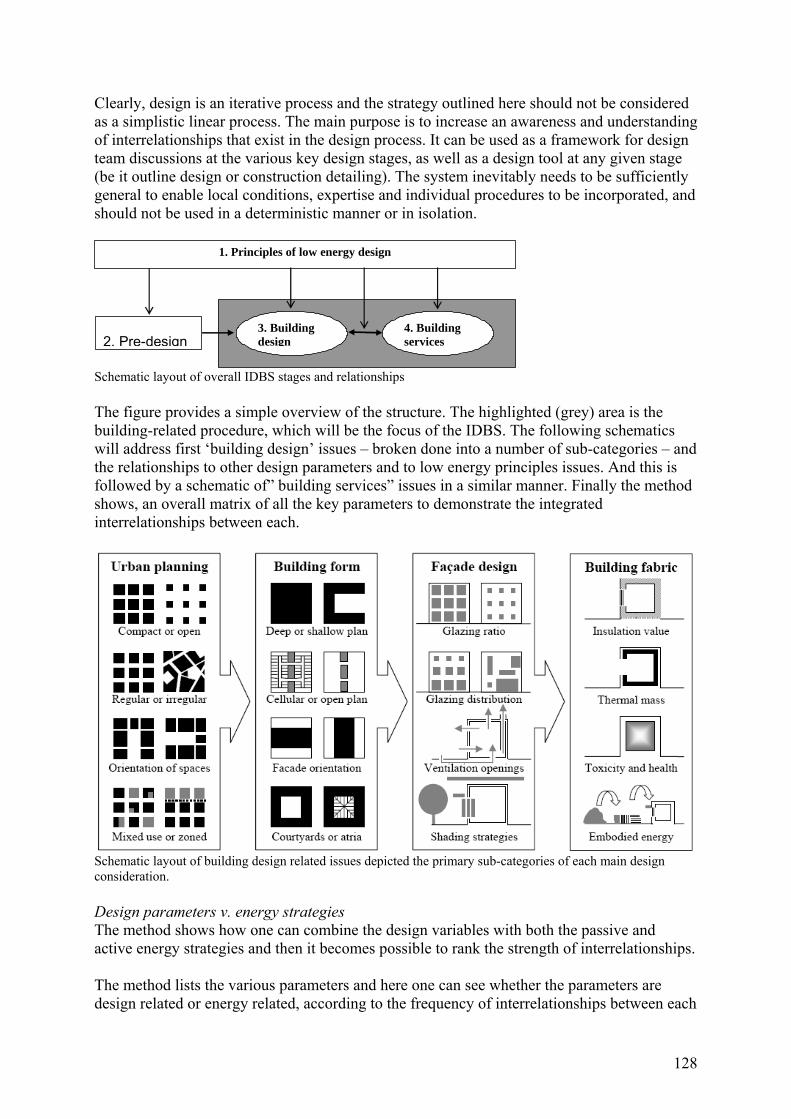
128
Clearly, design is an iterative process and the strategy outlined here should not be considered as a simplistic linear process. The main purpose is to increase an awareness and understanding of interrelationships that exist in the design process. It can be used as a framework for design team discussions at the various key design stages, as well as a design tool at any given stage (be it outline design or construction detailing). The system inevitably needs to be sufficiently general to enable local conditions, expertise and individual procedures to be incorporated, and should not be used in a deterministic manner or in isolation. Schematic layout of overall IDBS stages and relationships The figure provides a simple overview of the structure. The highlighted (grey) area is the building-related procedure, which will be the focus of the IDBS. The following schematics will address first ‘building design’ issues – broken done into a number of sub-categories – and the relationships to other design parameters and to low energy principles issues. And this is followed by a schematic of” building services” issues in a similar manner. Finally the method shows, an overall matrix of all the key parameters to demonstrate the integrated interrelationships between each.
Schematic layout of building design related issues depicted the primary sub-categories of each main design consideration. Design parameters v. energy strategies The method shows how one can combine the design variables with both the passive and active energy strategies and then it becomes possible to rank the strength of interrelationships. The method lists the various parameters and here one can see whether the parameters are design related or energy related, according to the frequency of interrelationships between each
2. Pre-design3. Building design
4. Building services
1. Principles of low energy design
129
category. This methodology can be applied to any key set of parameters as set by the design team. For this matrix, at the top of the design list, in terms of the variables that have the greatest links and implications for energy and services strategies are the following:
• Deep or shallow plan • Cellular or open plan • Ventilation design • Courts or atria • Orientation
The primary environmental issues are as follows:
• The need for air conditioning v. natural ventilation • Mechanical versus natural ventilation • Solar gains • Daylight • Distribution of solar gains
Application of method It is proposed here to argue that for the successful performance of buildings it is essential to consider all the aspects that impact on energy use – from planning to detailed materials specifications. The integrated design implies and requires an understanding of the relative impacts of each parameter – both those determined by design and those that can be described as technical – to achieve a balanced and holistic strategy. One strategic aim of the integrated approach is to avoid conflicts between the architecture and technology. This requires a close collaboration between architect and engineer from the beginning of the design process. This is contrary to the common approach where an architect designs a building first and then an engineer is expected to make it work through the application of services (and the use of energy to ‘correct’ poor design decisions). If the energy considerations are not integral to the design solution it becomes difficult to improve the energy saving potential through the application of technology alone. Thus, if a design does not integrate natural ventilation strategies for example, then more energy-intensive mechanical systems may be the only recourse without fundamentally changing the building design. Benefits At a most fundamental level, an example of integrated design is one in which the use of passive strategies is exploited to reduce the reliance on conventional mechanical services. Thus, for example, shading devices reduce the reliance on mechanical cooling, or natural lighting strategies can limit the need for artificial lighting energy demand. Barriers It has been argued that design integration is critical, and that the means to achieve it is though the early and effective collaboration of the design team. References Koen Steemers at Cambridge Architectural Research Limited and the Martin Centre for Architectural and Urban Studies. Department of Architecture, University of Cambridge. 2005.
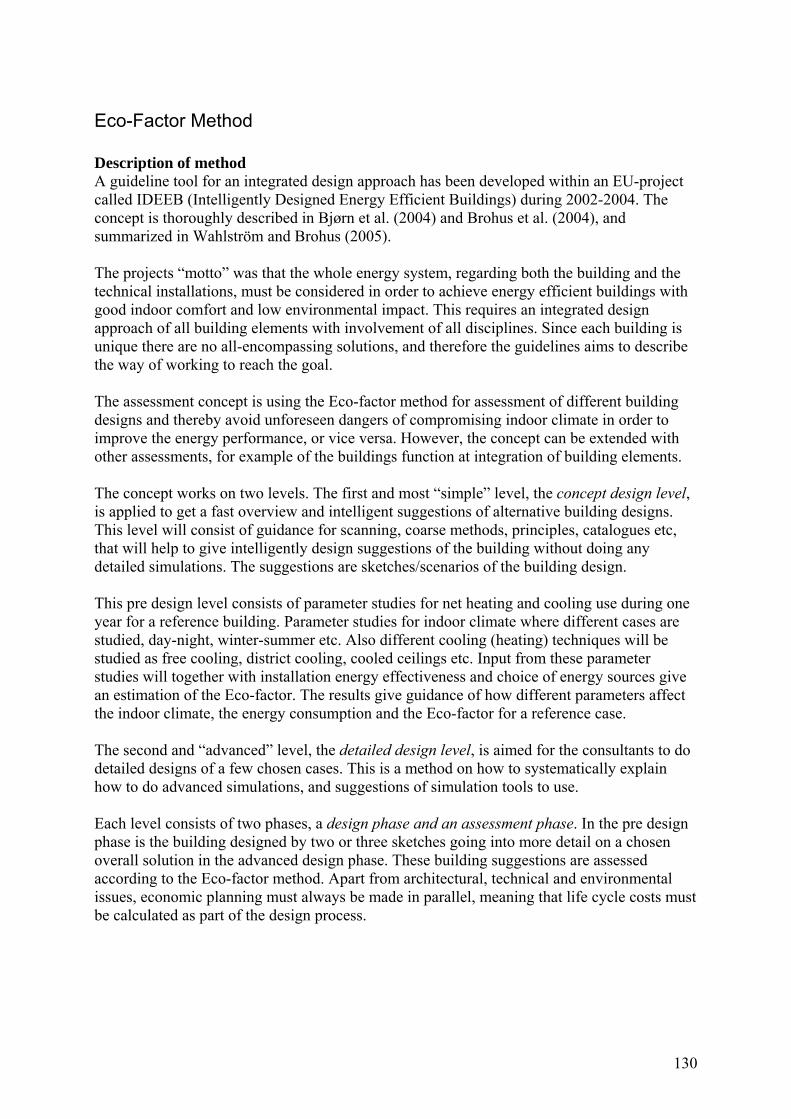
130
Eco-Factor Method Description of method A guideline tool for an integrated design approach has been developed within an EU-project called IDEEB (Intelligently Designed Energy Efficient Buildings) during 2002-2004. The concept is thoroughly described in Bjørn et al. (2004) and Brohus et al. (2004), and summarized in Wahlström and Brohus (2005). The projects “motto” was that the whole energy system, regarding both the building and the technical installations, must be considered in order to achieve energy efficient buildings with good indoor comfort and low environmental impact. This requires an integrated design approach of all building elements with involvement of all disciplines. Since each building is unique there are no all-encompassing solutions, and therefore the guidelines aims to describe the way of working to reach the goal. The assessment concept is using the Eco-factor method for assessment of different building designs and thereby avoid unforeseen dangers of compromising indoor climate in order to improve the energy performance, or vice versa. However, the concept can be extended with other assessments, for example of the buildings function at integration of building elements. The concept works on two levels. The first and most “simple” level, the concept design level, is applied to get a fast overview and intelligent suggestions of alternative building designs. This level will consist of guidance for scanning, coarse methods, principles, catalogues etc, that will help to give intelligently design suggestions of the building without doing any detailed simulations. The suggestions are sketches/scenarios of the building design. This pre design level consists of parameter studies for net heating and cooling use during one year for a reference building. Parameter studies for indoor climate where different cases are studied, day-night, winter-summer etc. Also different cooling (heating) techniques will be studied as free cooling, district cooling, cooled ceilings etc. Input from these parameter studies will together with installation energy effectiveness and choice of energy sources give an estimation of the Eco-factor. The results give guidance of how different parameters affect the indoor climate, the energy consumption and the Eco-factor for a reference case. The second and “advanced” level, the detailed design level, is aimed for the consultants to do detailed designs of a few chosen cases. This is a method on how to systematically explain how to do advanced simulations, and suggestions of simulation tools to use. Each level consists of two phases, a design phase and an assessment phase. In the pre design phase is the building designed by two or three sketches going into more detail on a chosen overall solution in the advanced design phase. These building suggestions are assessed according to the Eco-factor method. Apart from architectural, technical and environmental issues, economic planning must always be made in parallel, meaning that life cycle costs must be calculated as part of the design process.
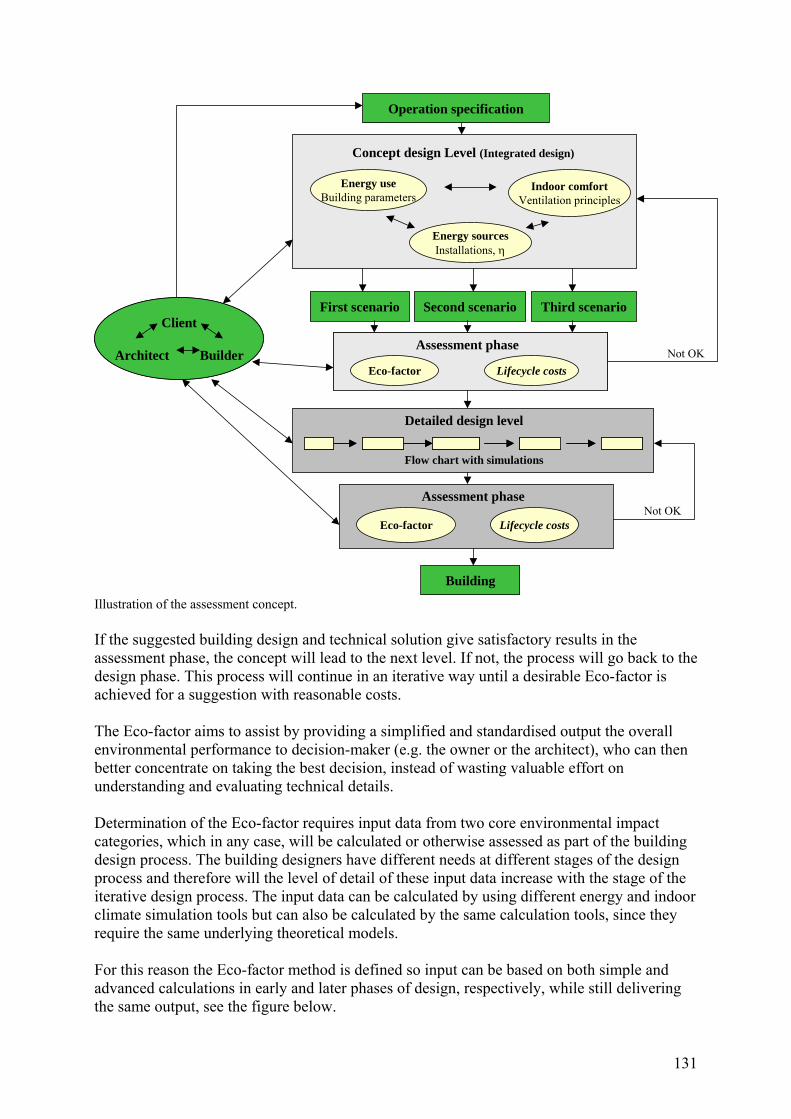
131
Client
Architect Builder
Client
Architect Builder
Operation specification
Assessment phase
Eco-factor Lifecycle costs
Assessment phase
Eco-factor Lifecycle costs
First scenario Second scenario Third scenario
Detailed design level
Flow chart with simulations
Assessment phase
Eco-factor Lifecycle costs
Building
Energy useBuilding parameters
Indoor comfortVentilation principles
Energy sourcesInstallations, η
Concept design Level (Integrated design)
Not OK
Not OK
Illustration of the assessment concept. If the suggested building design and technical solution give satisfactory results in the assessment phase, the concept will lead to the next level. If not, the process will go back to the design phase. This process will continue in an iterative way until a desirable Eco-factor is achieved for a suggestion with reasonable costs. The Eco-factor aims to assist by providing a simplified and standardised output the overall environmental performance to decision-maker (e.g. the owner or the architect), who can then better concentrate on taking the best decision, instead of wasting valuable effort on understanding and evaluating technical details. Determination of the Eco-factor requires input data from two core environmental impact categories, which in any case, will be calculated or otherwise assessed as part of the building design process. The building designers have different needs at different stages of the design process and therefore will the level of detail of these input data increase with the stage of the iterative design process. The input data can be calculated by using different energy and indoor climate simulation tools but can also be calculated by the same calculation tools, since they require the same underlying theoretical models. For this reason the Eco-factor method is defined so input can be based on both simple and advanced calculations in early and later phases of design, respectively, while still delivering the same output, see the figure below.
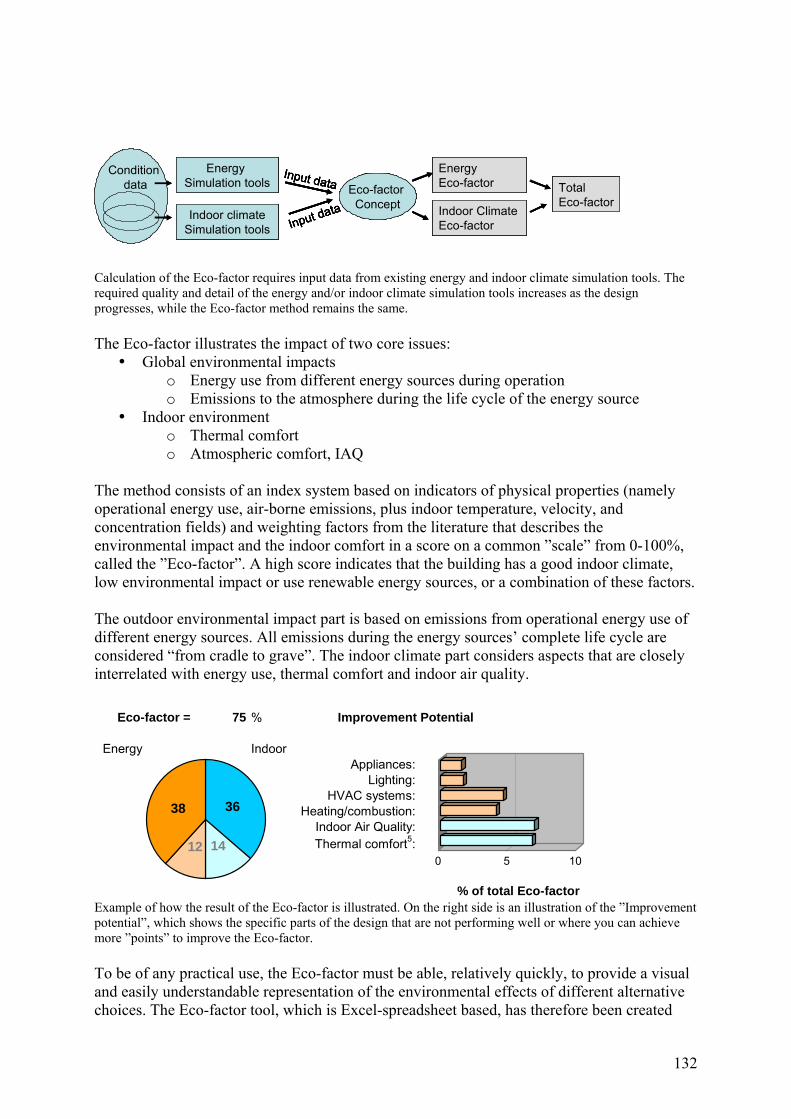
132
Calculation of the Eco-factor requires input data from existing energy and indoor climate simulation tools. The required quality and detail of the energy and/or indoor climate simulation tools increases as the design progresses, while the Eco-factor method remains the same. The Eco-factor illustrates the impact of two core issues:
Global environmental impacts o Energy use from different energy sources during operation o Emissions to the atmosphere during the life cycle of the energy source
Indoor environment o Thermal comfort o Atmospheric comfort, IAQ
The method consists of an index system based on indicators of physical properties (namely operational energy use, air-borne emissions, plus indoor temperature, velocity, and concentration fields) and weighting factors from the literature that describes the environmental impact and the indoor comfort in a score on a common ”scale” from 0-100%, called the ”Eco-factor”. A high score indicates that the building has a good indoor climate, low environmental impact or use renewable energy sources, or a combination of these factors. The outdoor environmental impact part is based on emissions from operational energy use of different energy sources. All emissions during the energy sources’ complete life cycle are considered “from cradle to grave”. The indoor climate part considers aspects that are closely interrelated with energy use, thermal comfort and indoor air quality.
Example of how the result of the Eco-factor is illustrated. On the right side is an illustration of the ”Improvement potential”, which shows the specific parts of the design that are not performing well or where you can achieve more ”points” to improve the Eco-factor. To be of any practical use, the Eco-factor must be able, relatively quickly, to provide a visual and easily understandable representation of the environmental effects of different alternative choices. The Eco-factor tool, which is Excel-spreadsheet based, has therefore been created
Energy Simulation tools
Indoor climateSimulation tools
Energy Eco-factor
Indoor ClimateEco-factor
TotalEco-factor
Eco-factor Concept
Input data
Input dataCondition
dataEnergy
Simulation tools
Indoor climateSimulation tools
Energy Eco-factor
Indoor ClimateEco-factor
TotalEco-factor
Eco-factor Concept
Input data
Input dataEnergy
Simulation tools
Indoor climateSimulation tools
Energy Eco-factor
Indoor ClimateEco-factor
TotalEco-factor
Eco-factor Concept
Input data
Input data
Input data
Input dataCondition
data
Eco-factor = 75 % Improvement Potential
Energy IndoorAppliances:
Lighting:HVAC systems:
Heating/combustion:Indoor Air Quality:Thermal comfort5:
% of total Eco-factor
0 5 10
3638
1412
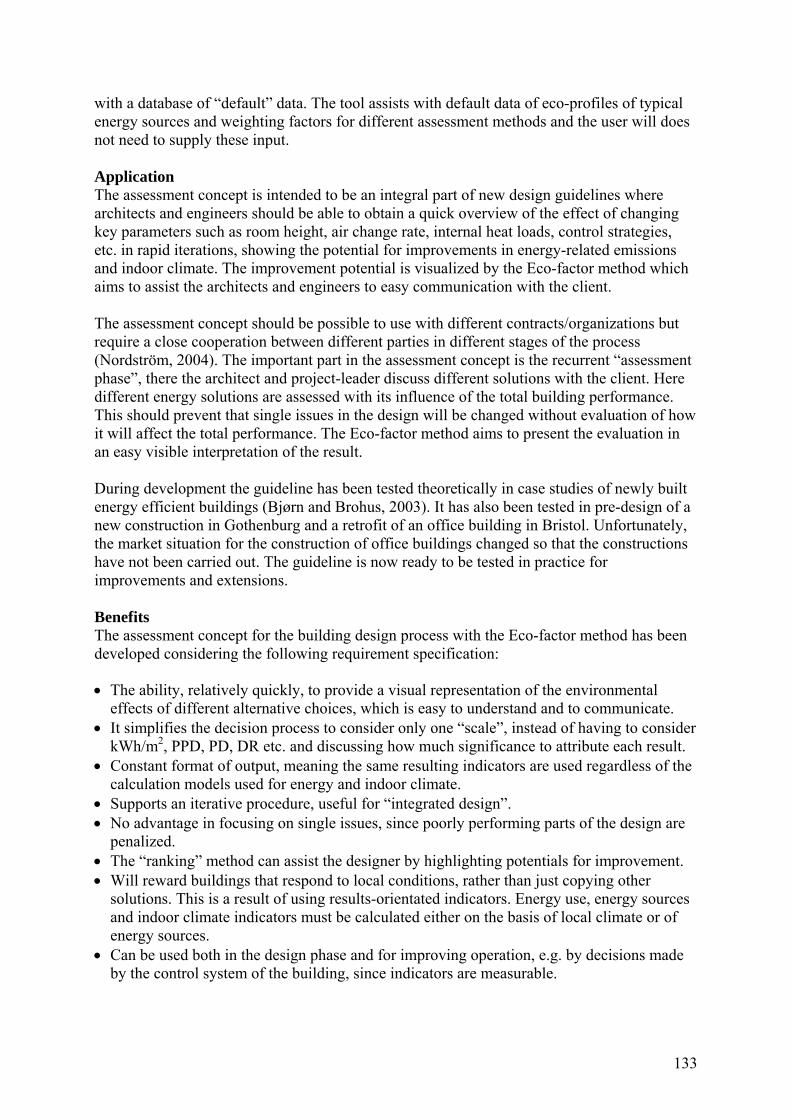
133
with a database of “default” data. The tool assists with default data of eco-profiles of typical energy sources and weighting factors for different assessment methods and the user will does not need to supply these input. Application The assessment concept is intended to be an integral part of new design guidelines where architects and engineers should be able to obtain a quick overview of the effect of changing key parameters such as room height, air change rate, internal heat loads, control strategies, etc. in rapid iterations, showing the potential for improvements in energy-related emissions and indoor climate. The improvement potential is visualized by the Eco-factor method which aims to assist the architects and engineers to easy communication with the client. The assessment concept should be possible to use with different contracts/organizations but require a close cooperation between different parties in different stages of the process (Nordström, 2004). The important part in the assessment concept is the recurrent “assessment phase”, there the architect and project-leader discuss different solutions with the client. Here different energy solutions are assessed with its influence of the total building performance. This should prevent that single issues in the design will be changed without evaluation of how it will affect the total performance. The Eco-factor method aims to present the evaluation in an easy visible interpretation of the result. During development the guideline has been tested theoretically in case studies of newly built energy efficient buildings (Bjørn and Brohus, 2003). It has also been tested in pre-design of a new construction in Gothenburg and a retrofit of an office building in Bristol. Unfortunately, the market situation for the construction of office buildings changed so that the constructions have not been carried out. The guideline is now ready to be tested in practice for improvements and extensions. Benefits The assessment concept for the building design process with the Eco-factor method has been developed considering the following requirement specification: • The ability, relatively quickly, to provide a visual representation of the environmental
effects of different alternative choices, which is easy to understand and to communicate. • It simplifies the decision process to consider only one “scale”, instead of having to consider
kWh/m2, PPD, PD, DR etc. and discussing how much significance to attribute each result. • Constant format of output, meaning the same resulting indicators are used regardless of the
calculation models used for energy and indoor climate. • Supports an iterative procedure, useful for “integrated design”. • No advantage in focusing on single issues, since poorly performing parts of the design are
penalized. • The “ranking” method can assist the designer by highlighting potentials for improvement. • Will reward buildings that respond to local conditions, rather than just copying other
solutions. This is a result of using results-orientated indicators. Energy use, energy sources and indoor climate indicators must be calculated either on the basis of local climate or of energy sources.
• Can be used both in the design phase and for improving operation, e.g. by decisions made by the control system of the building, since indicators are measurable.
134
Need for further research The guideline is developed by primarily considering design of European office buildings and should cover warm, moderate and cold European climates. With small adjustment it should be possible to use it at design of any kind of building. The assessment concept is using an integrated approach with involvement of all disciplines. This makes the guideline very suitable for integration of responsive building elements and it is now ready to be tested in practice. References Erik Bjørn, Åsa Wahlström, Henrik Brohus (2004). ”Eco-factor Method”, Report of the EU-Energie project "IDEEB". IDEEB Report No. 02, ISBN 91-7848-974-1, SP Swedish National Testing and Research Institute.
Henrik Brohus, Erik Bjørn, Anker Nielsen, Åsa Wahlström (2004): “Assessment concept for the building design process”, Report of the EU-Energie project "IDEEB". IDEEB Report No. 03, ISBN 91-85303-24-0, SP Swedish National Testing and Research Institute.
Åsa Wahlström, Henrik Brohus (2005): “An Eco-factor method for assessment of building performance”, Proceeding of the 7th Symposium on Building Physics in the Nordic Countries, page 1110-1117, Reykjavik, June 13-15, 2005.
Erik Bjørn, Henrik Brohus (2003): ”Case Studies - Existing Buildings”. Report of the EU-Energie project "IDEEB". IDEEB Report No. 01, ISBN 91-7848-929-6, SP Swedish National Testing and Research Institute.
Christer Nordström (2004): “Coordination in the planning and building process”. Report of the EU-Energie project "IDEEB". IDEEB Report No. 05, ISBN 91-85303-26-7, SP Swedish National Testing and Research Institute.
All reports are freely available on www.ideeb.org
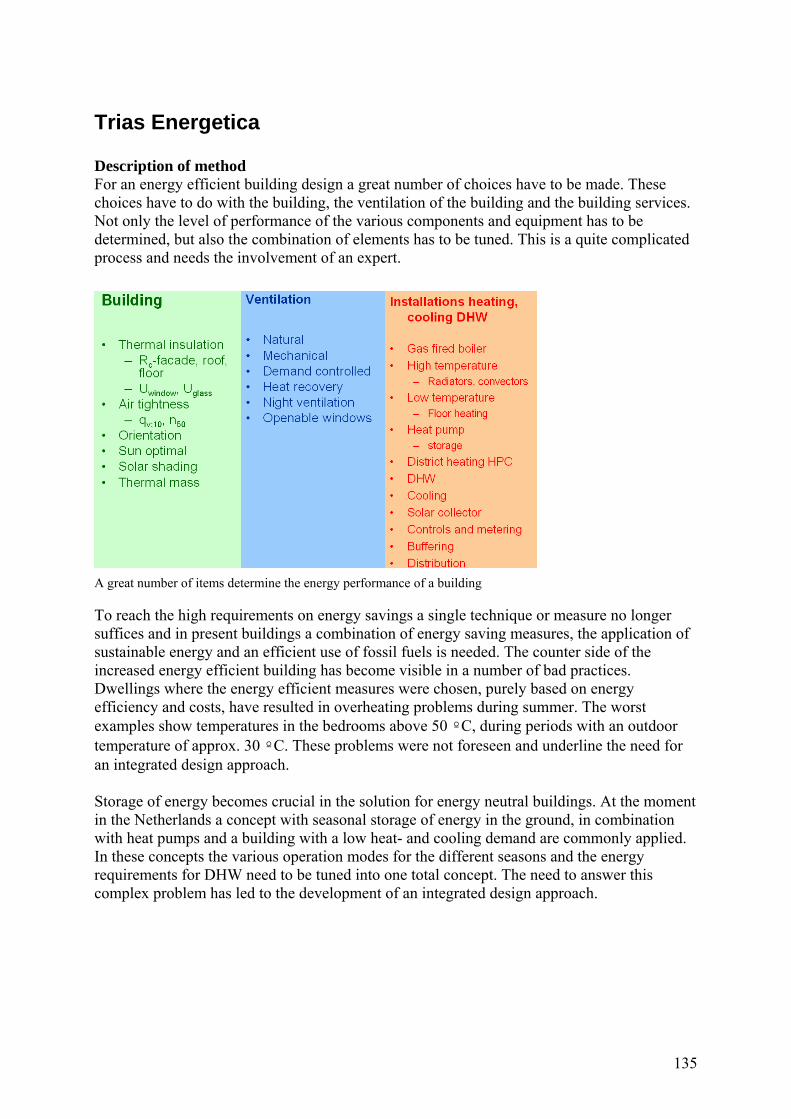
135
Trias Energetica Description of method For an energy efficient building design a great number of choices have to be made. These choices have to do with the building, the ventilation of the building and the building services. Not only the level of performance of the various components and equipment has to be determined, but also the combination of elements has to be tuned. This is a quite complicated process and needs the involvement of an expert.
A great number of items determine the energy performance of a building To reach the high requirements on energy savings a single technique or measure no longer suffices and in present buildings a combination of energy saving measures, the application of sustainable energy and an efficient use of fossil fuels is needed. The counter side of the increased energy efficient building has become visible in a number of bad practices. Dwellings where the energy efficient measures were chosen, purely based on energy efficiency and costs, have resulted in overheating problems during summer. The worst examples show temperatures in the bedrooms above 50 ºC, during periods with an outdoor temperature of approx. 30 ºC. These problems were not foreseen and underline the need for an integrated design approach. Storage of energy becomes crucial in the solution for energy neutral buildings. At the moment in the Netherlands a concept with seasonal storage of energy in the ground, in combination with heat pumps and a building with a low heat- and cooling demand are commonly applied. In these concepts the various operation modes for the different seasons and the energy requirements for DHW need to be tuned into one total concept. The need to answer this complex problem has led to the development of an integrated design approach.
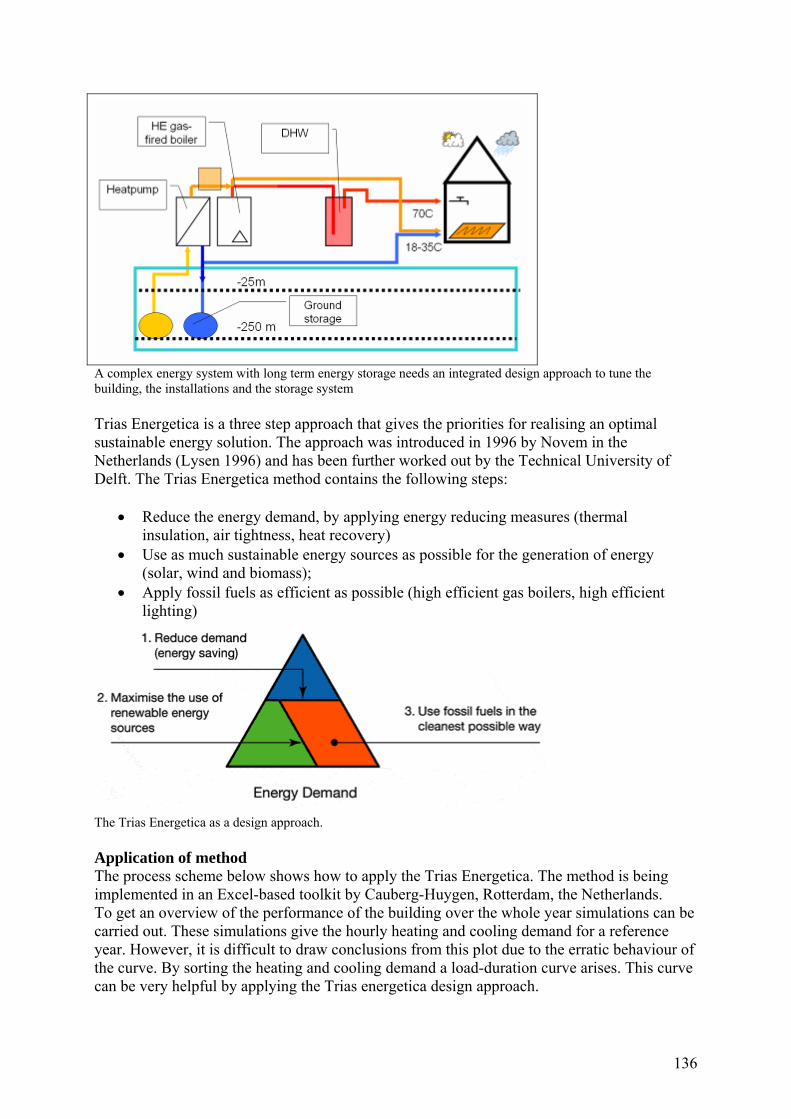
136
A complex energy system with long term energy storage needs an integrated design approach to tune the building, the installations and the storage system Trias Energetica is a three step approach that gives the priorities for realising an optimal sustainable energy solution. The approach was introduced in 1996 by Novem in the Netherlands (Lysen 1996) and has been further worked out by the Technical University of Delft. The Trias Energetica method contains the following steps:
• Reduce the energy demand, by applying energy reducing measures (thermal insulation, air tightness, heat recovery)
• Use as much sustainable energy sources as possible for the generation of energy (solar, wind and biomass);
• Apply fossil fuels as efficient as possible (high efficient gas boilers, high efficient lighting)
The Trias Energetica as a design approach. Application of method The process scheme below shows how to apply the Trias Energetica. The method is being implemented in an Excel-based toolkit by Cauberg-Huygen, Rotterdam, the Netherlands. To get an overview of the performance of the building over the whole year simulations can be carried out. These simulations give the hourly heating and cooling demand for a reference year. However, it is difficult to draw conclusions from this plot due to the erratic behaviour of the curve. By sorting the heating and cooling demand a load-duration curve arises. This curve can be very helpful by applying the Trias energetica design approach.
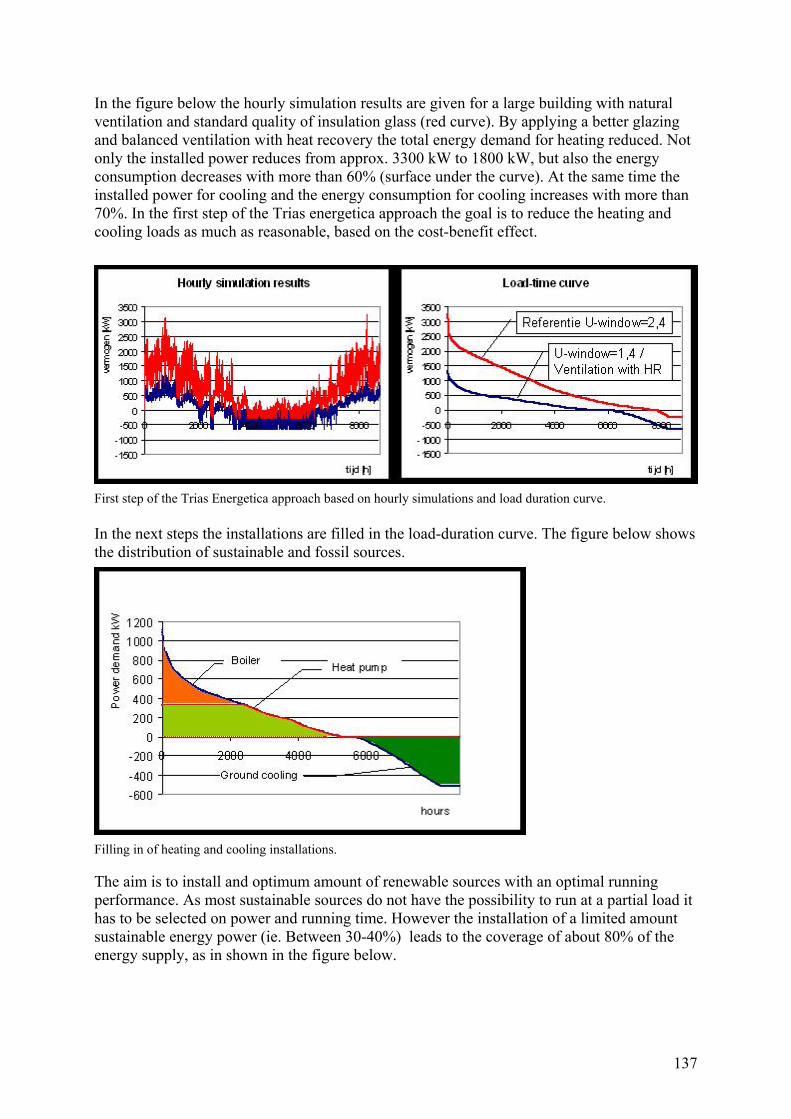
137
In the figure below the hourly simulation results are given for a large building with natural ventilation and standard quality of insulation glass (red curve). By applying a better glazing and balanced ventilation with heat recovery the total energy demand for heating reduced. Not only the installed power reduces from approx. 3300 kW to 1800 kW, but also the energy consumption decreases with more than 60% (surface under the curve). At the same time the installed power for cooling and the energy consumption for cooling increases with more than 70%. In the first step of the Trias energetica approach the goal is to reduce the heating and cooling loads as much as reasonable, based on the cost-benefit effect.
First step of the Trias Energetica approach based on hourly simulations and load duration curve. In the next steps the installations are filled in the load-duration curve. The figure below shows the distribution of sustainable and fossil sources.
Filling in of heating and cooling installations. The aim is to install and optimum amount of renewable sources with an optimal running performance. As most sustainable sources do not have the possibility to run at a partial load it has to be selected on power and running time. However the installation of a limited amount sustainable energy power (ie. Between 30-40%) leads to the coverage of about 80% of the energy supply, as in shown in the figure below.
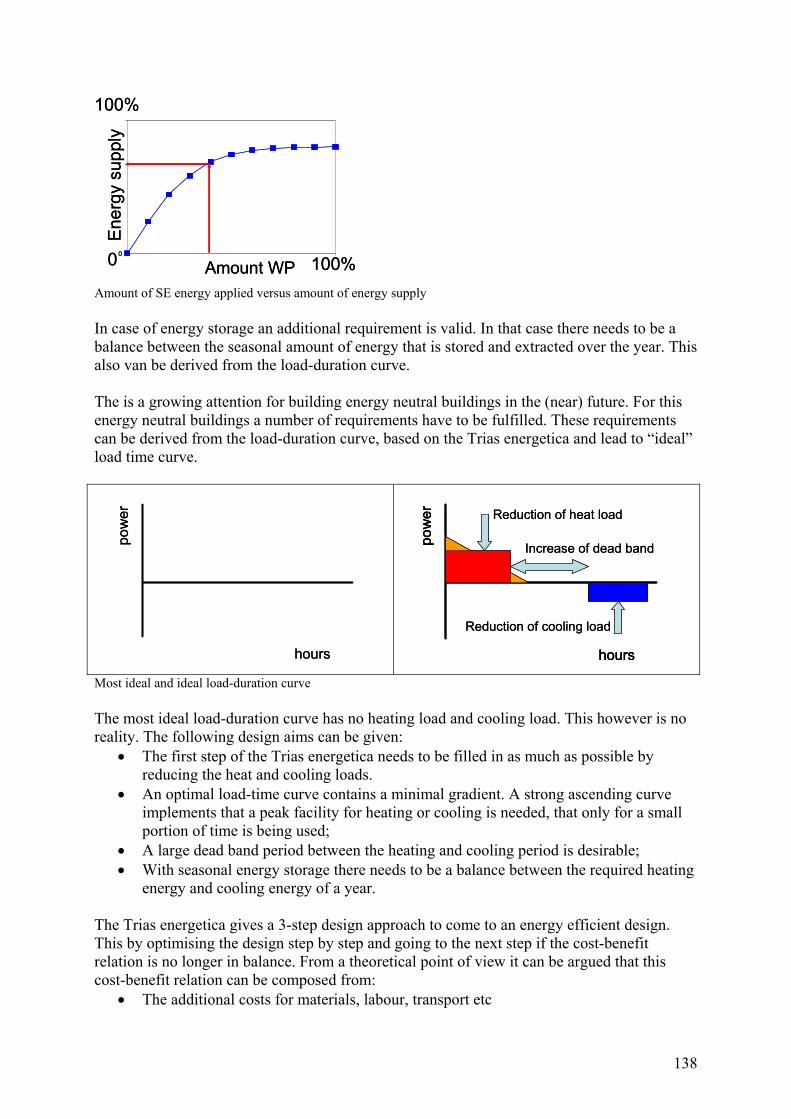
138
0
100%
0 100%
Ener
gysu
pply
Amount WP0
100%
0 100%
Ener
gysu
pply
Amount WP Amount of SE energy applied versus amount of energy supply In case of energy storage an additional requirement is valid. In that case there needs to be a balance between the seasonal amount of energy that is stored and extracted over the year. This also van be derived from the load-duration curve. The is a growing attention for building energy neutral buildings in the (near) future. For this energy neutral buildings a number of requirements have to be fulfilled. These requirements can be derived from the load-duration curve, based on the Trias energetica and lead to “ideal” load time curve.
Most ideal and ideal load-duration curve The most ideal load-duration curve has no heating load and cooling load. This however is no reality. The following design aims can be given:
• The first step of the Trias energetica needs to be filled in as much as possible by reducing the heat and cooling loads.
• An optimal load-time curve contains a minimal gradient. A strong ascending curve implements that a peak facility for heating or cooling is needed, that only for a small portion of time is being used;
• A large dead band period between the heating and cooling period is desirable; • With seasonal energy storage there needs to be a balance between the required heating
energy and cooling energy of a year. The Trias energetica gives a 3-step design approach to come to an energy efficient design. This by optimising the design step by step and going to the next step if the cost-benefit relation is no longer in balance. From a theoretical point of view it can be argued that this cost-benefit relation can be composed from:
• The additional costs for materials, labour, transport etc
hours
pow
er
hours
pow
er
hours
pow
er Reduction of heat load
Reduction of cooling load
Increase of dead band
hours
pow
er
hours
pow
er Reduction of heat load
Reduction of cooling load
Increase of dead band
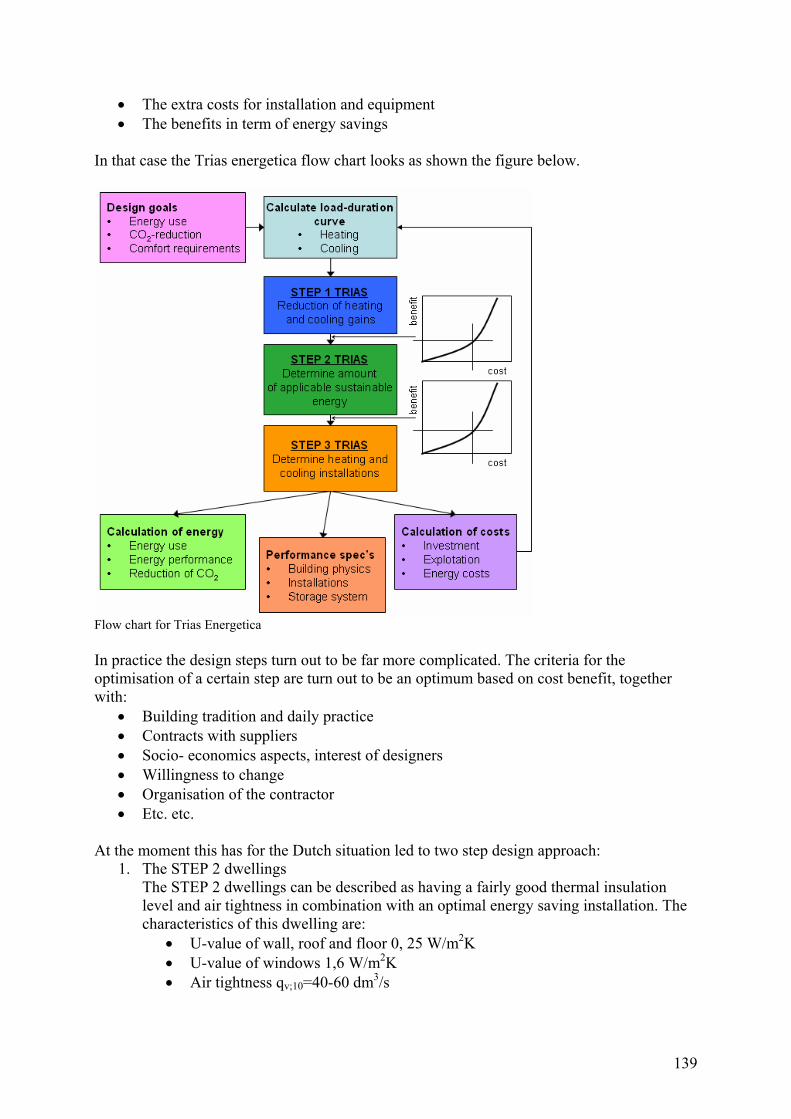
139
• The extra costs for installation and equipment • The benefits in term of energy savings
In that case the Trias energetica flow chart looks as shown the figure below.
Flow chart for Trias Energetica In practice the design steps turn out to be far more complicated. The criteria for the optimisation of a certain step are turn out to be an optimum based on cost benefit, together with:
• Building tradition and daily practice • Contracts with suppliers • Socio- economics aspects, interest of designers • Willingness to change • Organisation of the contractor • Etc. etc.
At the moment this has for the Dutch situation led to two step design approach:
1. The STEP 2 dwellings The STEP 2 dwellings can be described as having a fairly good thermal insulation level and air tightness in combination with an optimal energy saving installation. The characteristics of this dwelling are:
• U-value of wall, roof and floor 0, 25 W/m2K • U-value of windows 1,6 W/m2K • Air tightness qv;10=40-60 dm3/s
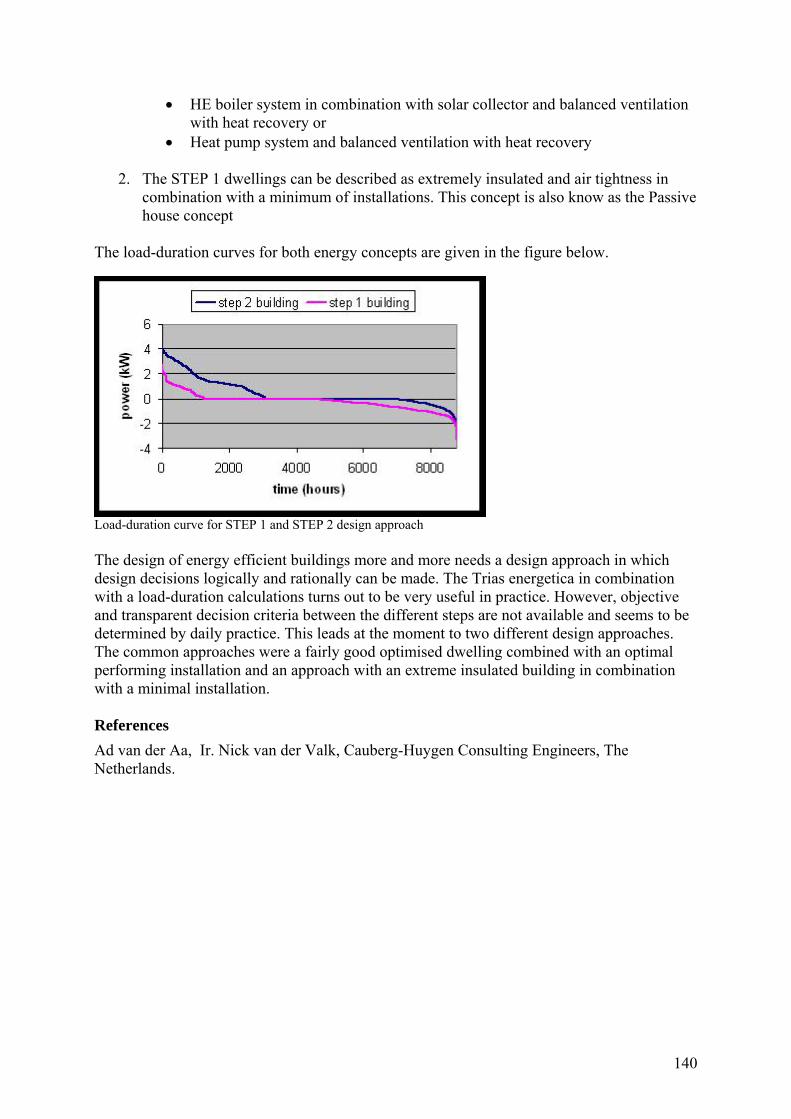
140
• HE boiler system in combination with solar collector and balanced ventilation with heat recovery or
• Heat pump system and balanced ventilation with heat recovery
2. The STEP 1 dwellings can be described as extremely insulated and air tightness in combination with a minimum of installations. This concept is also know as the Passive house concept
The load-duration curves for both energy concepts are given in the figure below.
Load-duration curve for STEP 1 and STEP 2 design approach The design of energy efficient buildings more and more needs a design approach in which design decisions logically and rationally can be made. The Trias energetica in combination with a load-duration calculations turns out to be very useful in practice. However, objective and transparent decision criteria between the different steps are not available and seems to be determined by daily practice. This leads at the moment to two different design approaches. The common approaches were a fairly good optimised dwelling combined with an optimal performing installation and an approach with an extreme insulated building in combination with a minimal installation. References Ad van der Aa, Ir. Nick van der Valk, Cauberg-Huygen Consulting Engineers, The Netherlands.
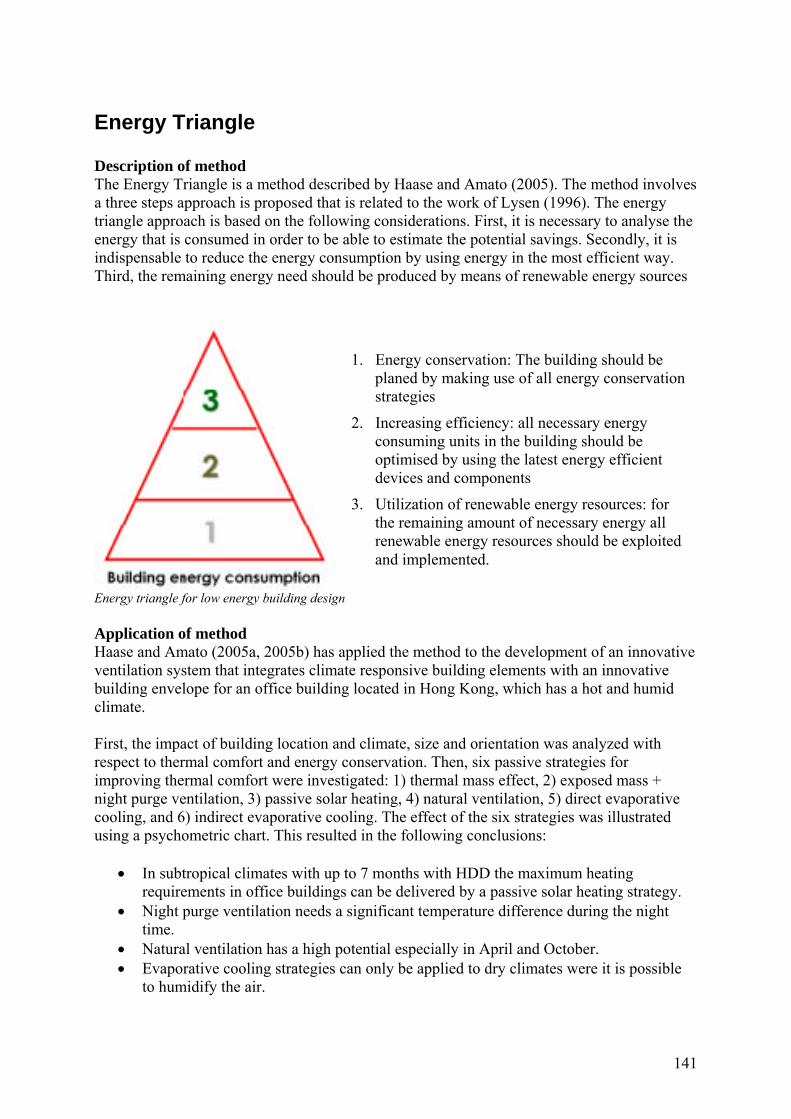
141
Energy Triangle Description of method The Energy Triangle is a method described by Haase and Amato (2005). The method involves a three steps approach is proposed that is related to the work of Lysen (1996). The energy triangle approach is based on the following considerations. First, it is necessary to analyse the energy that is consumed in order to be able to estimate the potential savings. Secondly, it is indispensable to reduce the energy consumption by using energy in the most efficient way. Third, the remaining energy need should be produced by means of renewable energy sources
Energy triangle for low energy building design Application of method Haase and Amato (2005a, 2005b) has applied the method to the development of an innovative ventilation system that integrates climate responsive building elements with an innovative building envelope for an office building located in Hong Kong, which has a hot and humid climate. First, the impact of building location and climate, size and orientation was analyzed with respect to thermal comfort and energy conservation. Then, six passive strategies for improving thermal comfort were investigated: 1) thermal mass effect, 2) exposed mass + night purge ventilation, 3) passive solar heating, 4) natural ventilation, 5) direct evaporative cooling, and 6) indirect evaporative cooling. The effect of the six strategies was illustrated using a psychometric chart. This resulted in the following conclusions:
• In subtropical climates with up to 7 months with HDD the maximum heating requirements in office buildings can be delivered by a passive solar heating strategy.
• Night purge ventilation needs a significant temperature difference during the night time.
• Natural ventilation has a high potential especially in April and October. • Evaporative cooling strategies can only be applied to dry climates were it is possible
to humidify the air.
1. Energy conservation: The building should be planed by making use of all energy conservation strategies
2. Increasing efficiency: all necessary energy consuming units in the building should be optimised by using the latest energy efficient devices and components
3. Utilization of renewable energy resources: for the remaining amount of necessary energy all renewable energy resources should be exploited and implemented.
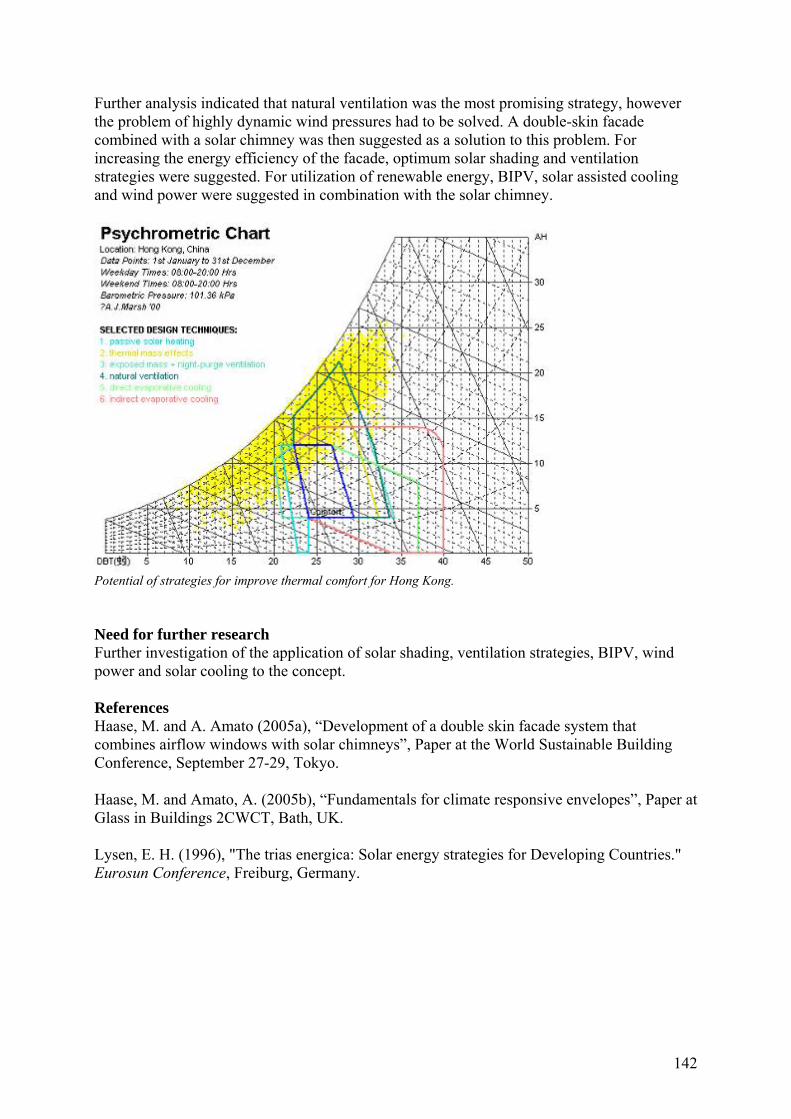
142
Further analysis indicated that natural ventilation was the most promising strategy, however the problem of highly dynamic wind pressures had to be solved. A double-skin facade combined with a solar chimney was then suggested as a solution to this problem. For increasing the energy efficiency of the facade, optimum solar shading and ventilation strategies were suggested. For utilization of renewable energy, BIPV, solar assisted cooling and wind power were suggested in combination with the solar chimney.
Potential of strategies for improve thermal comfort for Hong Kong. Need for further research Further investigation of the application of solar shading, ventilation strategies, BIPV, wind power and solar cooling to the concept. References Haase, M. and A. Amato (2005a), “Development of a double skin facade system that combines airflow windows with solar chimneys”, Paper at the World Sustainable Building Conference, September 27-29, Tokyo. Haase, M. and Amato, A. (2005b), “Fundamentals for climate responsive envelopes”, Paper at Glass in Buildings 2CWCT, Bath, UK. Lysen, E. H. (1996), "The trias energica: Solar energy strategies for Developing Countries." Eurosun Conference, Freiburg, Germany.
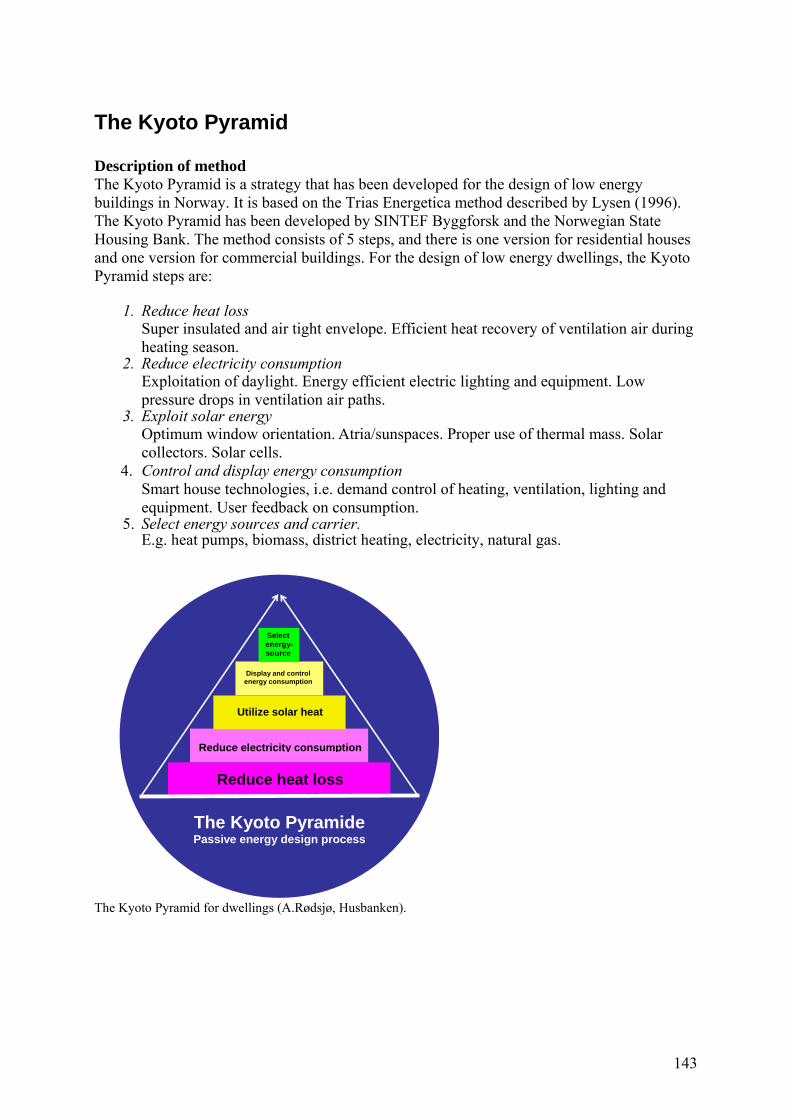
143
The Kyoto Pyramid Description of method The Kyoto Pyramid is a strategy that has been developed for the design of low energy buildings in Norway. It is based on the Trias Energetica method described by Lysen (1996). The Kyoto Pyramid has been developed by SINTEF Byggforsk and the Norwegian State Housing Bank. The method consists of 5 steps, and there is one version for residential houses and one version for commercial buildings. For the design of low energy dwellings, the Kyoto Pyramid steps are:
1. Reduce heat loss Super insulated and air tight envelope. Efficient heat recovery of ventilation air during heating season.
2. Reduce electricity consumption Exploitation of daylight. Energy efficient electric lighting and equipment. Low pressure drops in ventilation air paths.
3. Exploit solar energy Optimum window orientation. Atria/sunspaces. Proper use of thermal mass. Solar collectors. Solar cells.
4. Control and display energy consumption Smart house technologies, i.e. demand control of heating, ventilation, lighting and equipment. User feedback on consumption.
5. Select energy sources and carrier. E.g. heat pumps, biomass, district heating, electricity, natural gas.
The Kyoto Pyramid for dwellings (A.Rødsjø, Husbanken).
The Kyoto Pyramide Passive energy design process
Reduce heat loss
Select energy- source
Display and control energy consumption
Utilize solar heat
Reduce electricity consumption
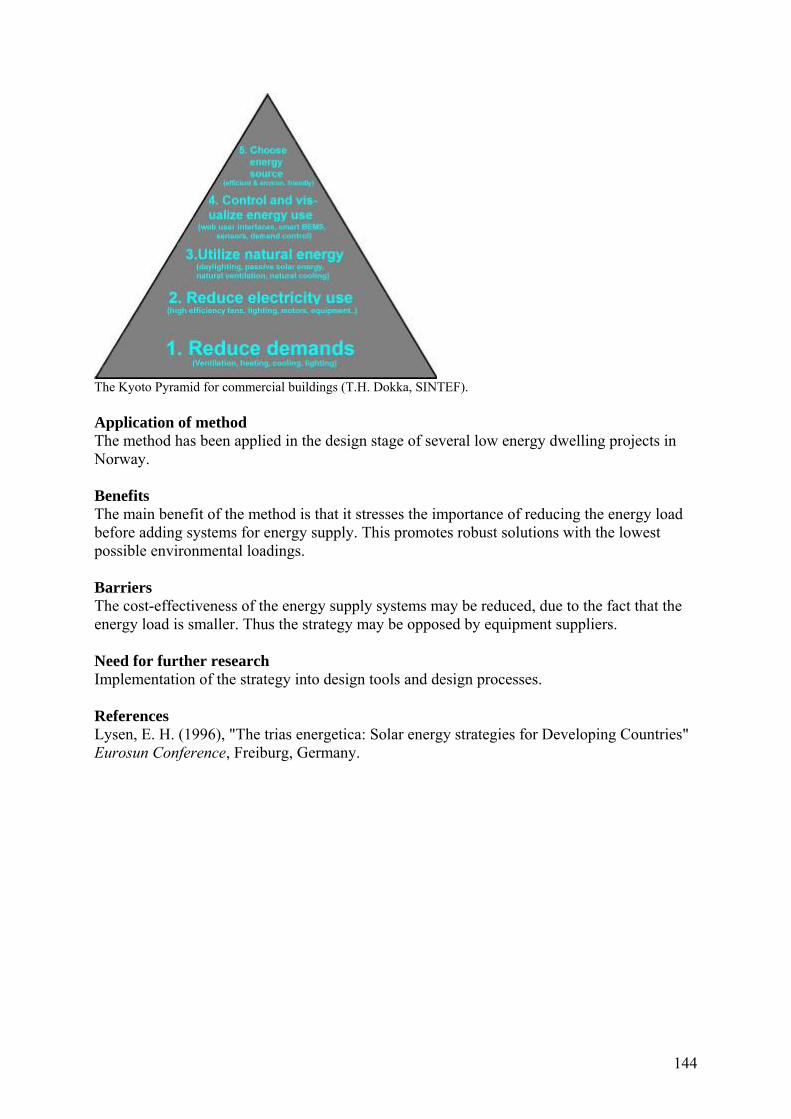
144
The Kyoto Pyramid for commercial buildings (T.H. Dokka, SINTEF). Application of method The method has been applied in the design stage of several low energy dwelling projects in Norway. Benefits The main benefit of the method is that it stresses the importance of reducing the energy load before adding systems for energy supply. This promotes robust solutions with the lowest possible environmental loadings. Barriers The cost-effectiveness of the energy supply systems may be reduced, due to the fact that the energy load is smaller. Thus the strategy may be opposed by equipment suppliers. Need for further research Implementation of the strategy into design tools and design processes. References Lysen, E. H. (1996), "The trias energetica: Solar energy strategies for Developing Countries" Eurosun Conference, Freiburg, Germany.
145
Chapter 4 State-of-the-art review of integrated design and simulation tools
This chapter gives descriptions of 5 different computer based tools that members of the IEA Annex 44 have been involved in developing. In addition, the chapter gives a short overview of computer simulation tools that may be used to predict the performance of integrated building concepts and responsive building elements. At last, the chapter gives a description of uncertainty modelling in building performance assessment. The 5 design tools included in this chapter are summarised in the table below. The methods may be organised into 2 main categories: design support tools and design evaluation tools. Name Origin Year E-Quartet A. Satake, Maeda Corporation, Japan Eco-Facade M. Kolokotroni (et al), Brunel University, UK 2004LEHVE T. Sawachi, NILIM, Japan 2005VentSim S. Nishizawa, Building Research Institute, Japan The design support tools are typically used in the early stages of the design to get an idea of what approaches and design schemes are the most promising for the given project. The E-Quartet, the Eco-Façade, and the LEHVE tools fall into this group. The design evaluation tools are typically used later in the design process to check the performance of a given design concept. The VentSim tool falls into this category. There is no sharp border between the two types of tools. The design support tools may in some case also be used as design evaluation tools, and vice versa. The available computer simulation tools for predicting energy use and indoor climate are typically used as design evaluation tools, but may also be used as design support tools. In fact, in order to succeed in creating effective integrated building concept, it is very useful to apply advanced computer simulation tools in the early design stages.
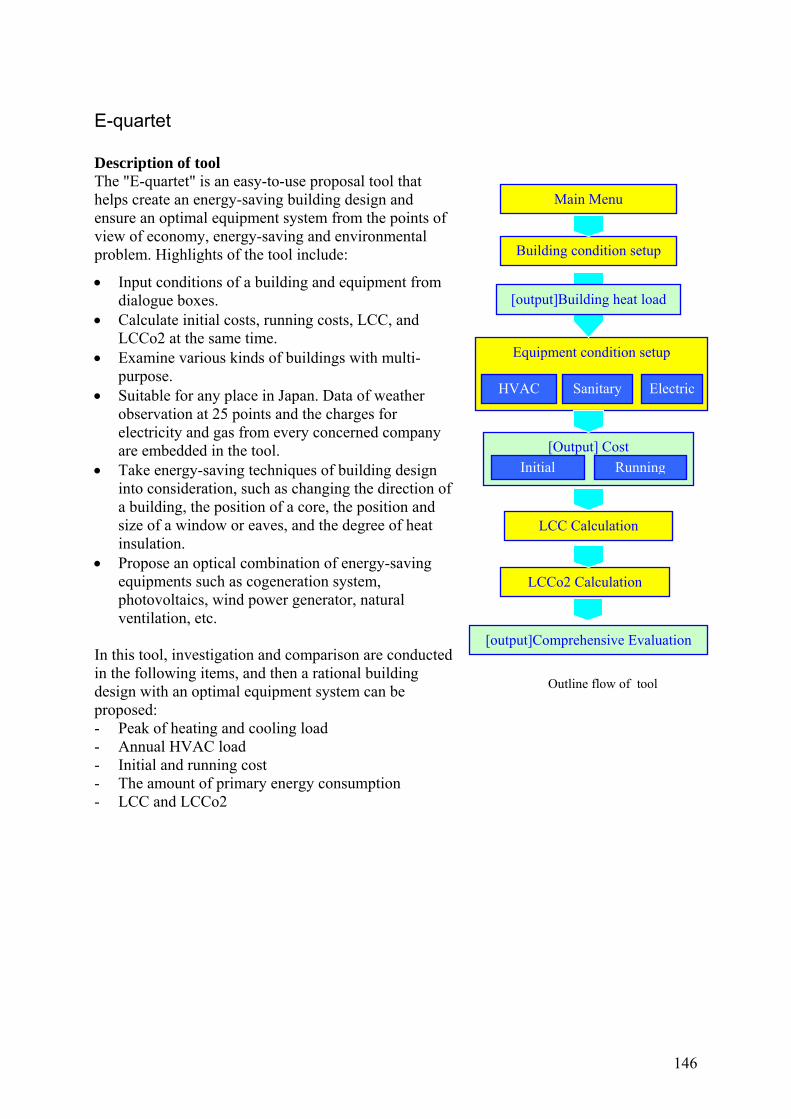
146
E-quartet Description of tool The "E-quartet" is an easy-to-use proposal tool that helps create an energy-saving building design and ensure an optimal equipment system from the points of view of economy, energy-saving and environmental problem. Highlights of the tool include:
• Input conditions of a building and equipment from dialogue boxes.
• Calculate initial costs, running costs, LCC, and LCCo2 at the same time.
• Examine various kinds of buildings with multi-purpose.
• Suitable for any place in Japan. Data of weather observation at 25 points and the charges for electricity and gas from every concerned company are embedded in the tool.
• Take energy-saving techniques of building design into consideration, such as changing the direction of a building, the position of a core, the position and size of a window or eaves, and the degree of heat insulation.
• Propose an optical combination of energy-saving equipments such as cogeneration system, photovoltaics, wind power generator, natural ventilation, etc.
In this tool, investigation and comparison are conducted in the following items, and then a rational building design with an optimal equipment system can be proposed: - Peak of heating and cooling load - Annual HVAC load - Initial and running cost - The amount of primary energy consumption - LCC and LCCo2
Main Menu
Building condition setup
Equipment condition setup
HVAC Sanitary Electric
[output]Building heat load
LCC Calculation
LCCo2 Calculation
[output]Comprehensive Evaluation
[Output] Cost Initial Running
Outline flow of tool

147
Various kinds of buildings can be examined
Application of tool The figure below shows the examination flow of this tool. First, we can input the general conditions of a building and its indoor thermal condition at a maximum pattern of 6. After calculation, we select one pattern by considering of air-conditioning peak load and annual load. Next, we input conditions of equipments such as air-conditioning system and sanitary fittings etc, and then calculate the initial cost and running cost of them. The combinations of the equipment are allowed to be 8 at maximum. Then we can select 4 types of combination at maximum from those results. At last, we also calculate the life cycle cost and life cycle Co2 discharge of them. The figure below shows an example of output. An optimal design of the building can be decided by the peak load of HVAC. In addition, results of annual load of HVAC will be also considered (upper figures). Overall performance of 4 types selected is outputted, and these results will provide us with a decision of optimal building with comprehensive survey (lower figures). References SATAKE Akira, at MAEDA Corporation, Japan.
Office Store Hospital Hotel School
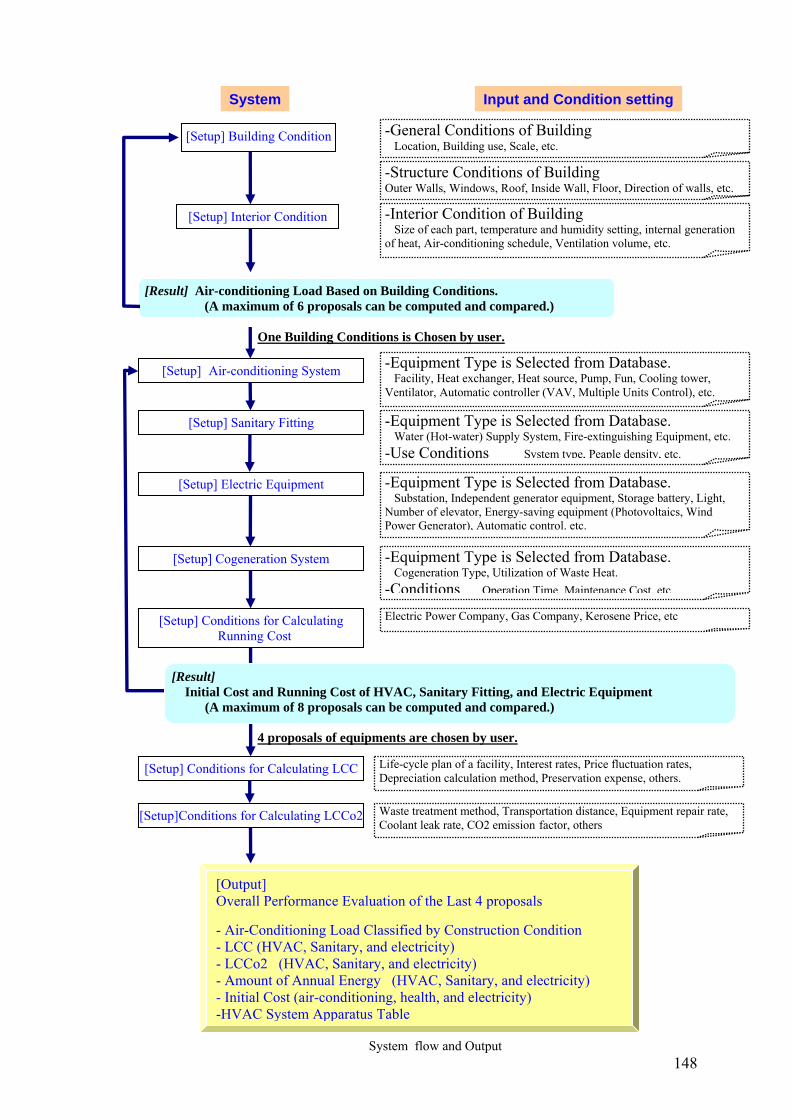
148
System Input and Condition setting
-General Conditions of Building Location, Building use, Scale, etc.
[Result] Air-conditioning Load Based on Building Conditions. (A maximum of 6 proposals can be computed and compared.)
One Building Conditions is Chosen by user.
[Setup] Building Condition
-Structure Conditions of Building Outer Walls, Windows, Roof, Inside Wall, Floor, Direction of walls, etc.
-Interior Condition of Building Size of each part, temperature and humidity setting, internal generation of heat, Air-conditioning schedule, Ventilation volume, etc.
[Setup] Interior Condition
[Setup] Air-conditioning System -Equipment Type is Selected from Database. Facility, Heat exchanger, Heat source, Pump, Fun, Cooling tower, Ventilator, Automatic controller (VAV, Multiple Units Control), etc.
[Setup] Sanitary Fitting -Equipment Type is Selected from Database. Water (Hot-water) Supply System, Fire-extinguishing Equipment, etc. -Use Conditions System type, Peaple density, etc.
[Setup] Electric Equipment -Equipment Type is Selected from Database. Substation, Independent generator equipment, Storage battery, Light, Number of elevator, Energy-saving equipment (Photovoltaics, Wind Power Generator), Automatic control. etc.
[Setup] Cogeneration System -Equipment Type is Selected from Database. Cogeneration Type, Utilization of Waste Heat. -Conditions Operation Time, Maintenance Cost, etc
[Setup] Conditions for Calculating Running Cost
Electric Power Company, Gas Company, Kerosene Price, etc
[Result] Initial Cost and Running Cost of HVAC, Sanitary Fitting, and Electric Equipment
(A maximum of 8 proposals can be computed and compared.)
4 proposals of equipments are chosen by user.
[Setup] Conditions for Calculating LCC Life-cycle plan of a facility, Interest rates, Price fluctuation rates, Depreciation calculation method, Preservation expense, others.
[Setup]Conditions for Calculating LCCo2 Waste treatment method, Transportation distance, Equipment repair rate, Coolant leak rate, CO2 emission factor, others
(Next page)
[Output] Overall Performance Evaluation of the Last 4 proposals - Air-Conditioning Load Classified by Construction Condition - LCC (HVAC, Sanitary, and electricity) - LCCo2 (HVAC, Sanitary, and electricity) - Amount of Annual Energy (HVAC, Sanitary, and electricity) - Initial Cost (air-conditioning, health, and electricity) -HVAC System Apparatus Table
System flow and Output
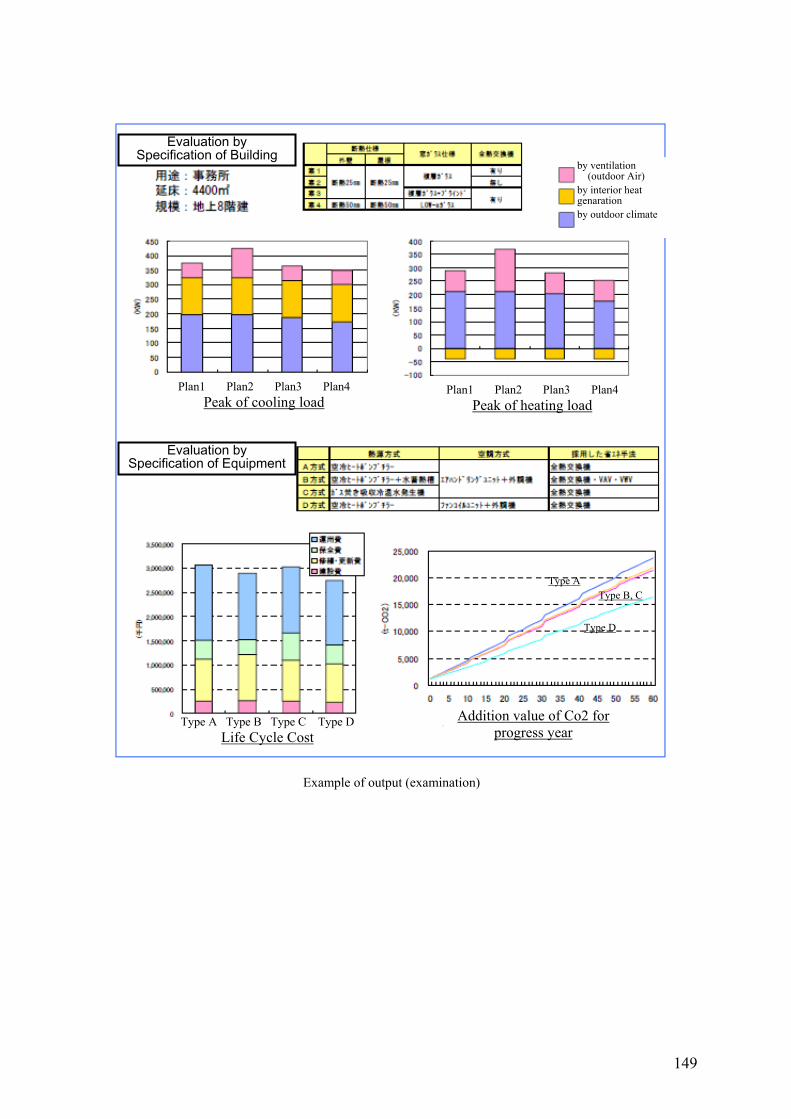
149
Plan1 Plan2 Plan3 Plan4 Peak of heating load
Plan1 Plan2 Plan3 Plan4 Peak of cooling load
Evaluation by Specification of Building
Evaluation by Specification of Equipment
Type A Type B Type C Type DLife Cycle Cost
Addition value of Co2 for progress year
Type D
Type A Type B, C
by ventilation (outdoor Air)
by interior heat genaration by outdoor climate
Example of output (examination)
150
Eco-Facade Tool Description of tool The Eco-Facade Tool is a concept design tool for evaluating environmental impacts of façade designs. The design of a building facade influences internal thermal and lighting conditions and energy use associated with the provision of these conditions. Key decisions about the building façade are usually taken during the concept design stage of a building while decisions about the method of providing the environmental conditions are often taken later in the design process. This dilemma is addressed by the concept design tool, which allows the design team to investigate the effect of façade design on the resulting internal environmental conditions, energy use and environmental impact. The concept design tool has been developed by performing detailed thermal, lighting and environmental modelling for a number of generic office building façade designs and a range of parameters which directly affect the environmental performance of an office building. The results are presented in a user-friendly interface requiring a minimum number of inputs. Key parameter outputs (such as temperature, lighting levels, heating/cooling energy demand, embodied energy and ecopoints) can then be viewed while a more detailed analysis can also be created for specified façade designs. The tool was developed by using three simulation models: • A dynamic thermal simulation model provided energy demand and internal thermal
conditions data. • A steady state lighting simulation model calculated the lighting environment based on the
optical properties associated with the facade. The lighting model shared a common model format with the dynamic thermal modelling tool.
• A Life Cycle Analysis (LCA) accounting tool, calculated the impacts associated with the construction and use of the building based on information about the construction and energy use in the building over a fixed time.
Two levels of information are contained within the output parameters. Key performance criteria have been chosen for the first level (summary results) while more detailed information is provided at a second level. The first level of results is described in this section and an example of the detailed results is presented in the form of a case-study in the following section. The detailed results include thermal comfort indicators (average hourly comfort internal temperature and relative humidity), daylight distribution diagrams, heating and cooling energy demand (for each month of the year and by category such as heating, cooling, humidification and dehumidification) and environmental impact indicators (eco-points arranged by sub-system of Manufacture, In Use Phase and Disposal of the materials to landfill and by the sphere in which those impacts occur such as Human Health, Eco System Damage and Resource Depletion).
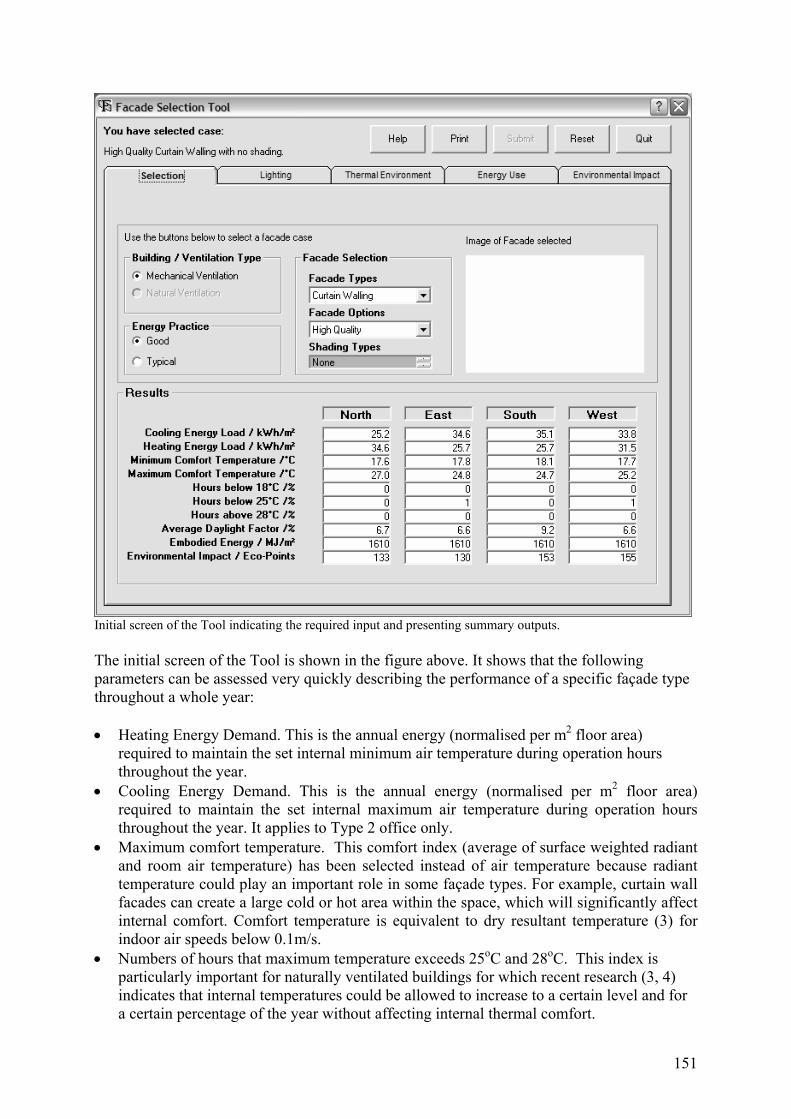
151
Initial screen of the Tool indicating the required input and presenting summary outputs. The initial screen of the Tool is shown in the figure above. It shows that the following parameters can be assessed very quickly describing the performance of a specific façade type throughout a whole year: • Heating Energy Demand. This is the annual energy (normalised per m2 floor area)
required to maintain the set internal minimum air temperature during operation hours throughout the year.
• Cooling Energy Demand. This is the annual energy (normalised per m2 floor area) required to maintain the set internal maximum air temperature during operation hours throughout the year. It applies to Type 2 office only.
• Maximum comfort temperature. This comfort index (average of surface weighted radiant and room air temperature) has been selected instead of air temperature because radiant temperature could play an important role in some façade types. For example, curtain wall facades can create a large cold or hot area within the space, which will significantly affect internal comfort. Comfort temperature is equivalent to dry resultant temperature (3) for indoor air speeds below 0.1m/s.
• Numbers of hours that maximum temperature exceeds 25oC and 28oC. This index is particularly important for naturally ventilated buildings for which recent research (3, 4) indicates that internal temperatures could be allowed to increase to a certain level and for a certain percentage of the year without affecting internal thermal comfort.
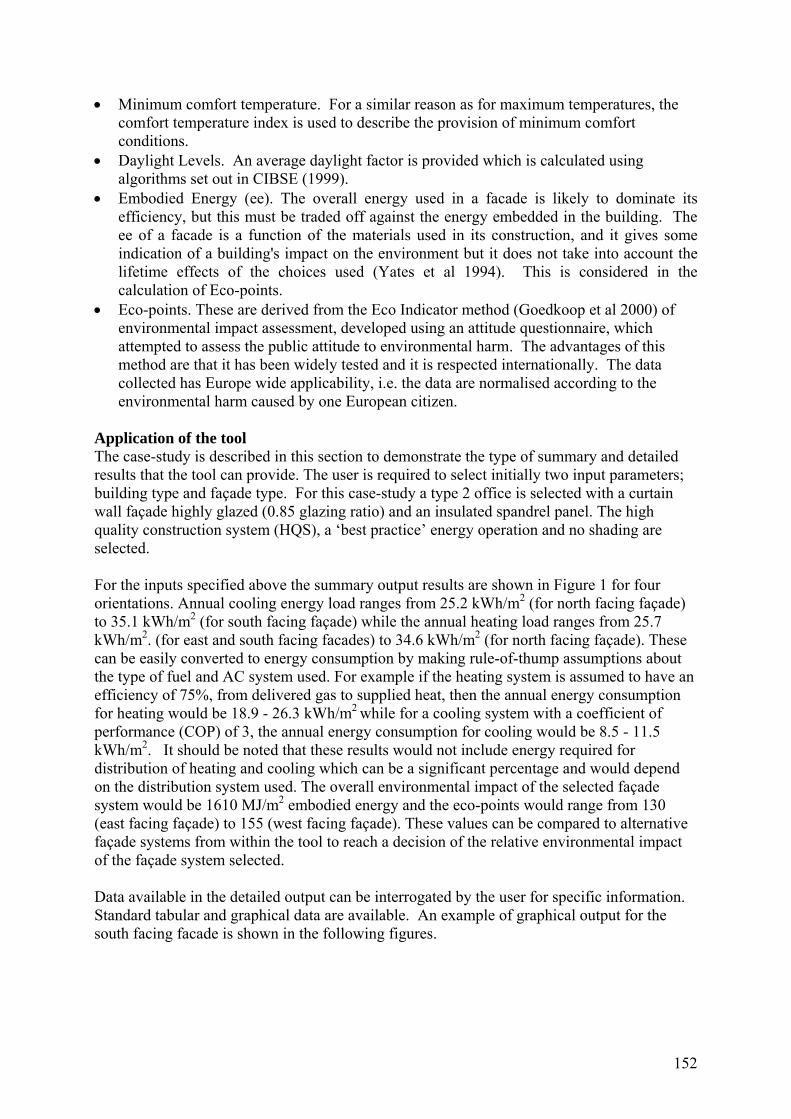
152
• Minimum comfort temperature. For a similar reason as for maximum temperatures, the comfort temperature index is used to describe the provision of minimum comfort conditions.
• Daylight Levels. An average daylight factor is provided which is calculated using algorithms set out in CIBSE (1999).
• Embodied Energy (ee). The overall energy used in a facade is likely to dominate its efficiency, but this must be traded off against the energy embedded in the building. The ee of a facade is a function of the materials used in its construction, and it gives some indication of a building's impact on the environment but it does not take into account the lifetime effects of the choices used (Yates et al 1994). This is considered in the calculation of Eco-points.
• Eco-points. These are derived from the Eco Indicator method (Goedkoop et al 2000) of environmental impact assessment, developed using an attitude questionnaire, which attempted to assess the public attitude to environmental harm. The advantages of this method are that it has been widely tested and it is respected internationally. The data collected has Europe wide applicability, i.e. the data are normalised according to the environmental harm caused by one European citizen.
Application of the tool The case-study is described in this section to demonstrate the type of summary and detailed results that the tool can provide. The user is required to select initially two input parameters; building type and façade type. For this case-study a type 2 office is selected with a curtain wall façade highly glazed (0.85 glazing ratio) and an insulated spandrel panel. The high quality construction system (HQS), a ‘best practice’ energy operation and no shading are selected. For the inputs specified above the summary output results are shown in Figure 1 for four orientations. Annual cooling energy load ranges from 25.2 kWh/m2 (for north facing façade) to 35.1 kWh/m2 (for south facing façade) while the annual heating load ranges from 25.7 kWh/m2. (for east and south facing facades) to 34.6 kWh/m2 (for north facing façade). These can be easily converted to energy consumption by making rule-of-thump assumptions about the type of fuel and AC system used. For example if the heating system is assumed to have an efficiency of 75%, from delivered gas to supplied heat, then the annual energy consumption for heating would be 18.9 - 26.3 kWh/m2 while for a cooling system with a coefficient of performance (COP) of 3, the annual energy consumption for cooling would be 8.5 - 11.5 kWh/m2. It should be noted that these results would not include energy required for distribution of heating and cooling which can be a significant percentage and would depend on the distribution system used. The overall environmental impact of the selected façade system would be 1610 MJ/m2 embodied energy and the eco-points would range from 130 (east facing façade) to 155 (west facing façade). These values can be compared to alternative façade systems from within the tool to reach a decision of the relative environmental impact of the façade system selected. Data available in the detailed output can be interrogated by the user for specific information. Standard tabular and graphical data are available. An example of graphical output for the south facing facade is shown in the following figures.
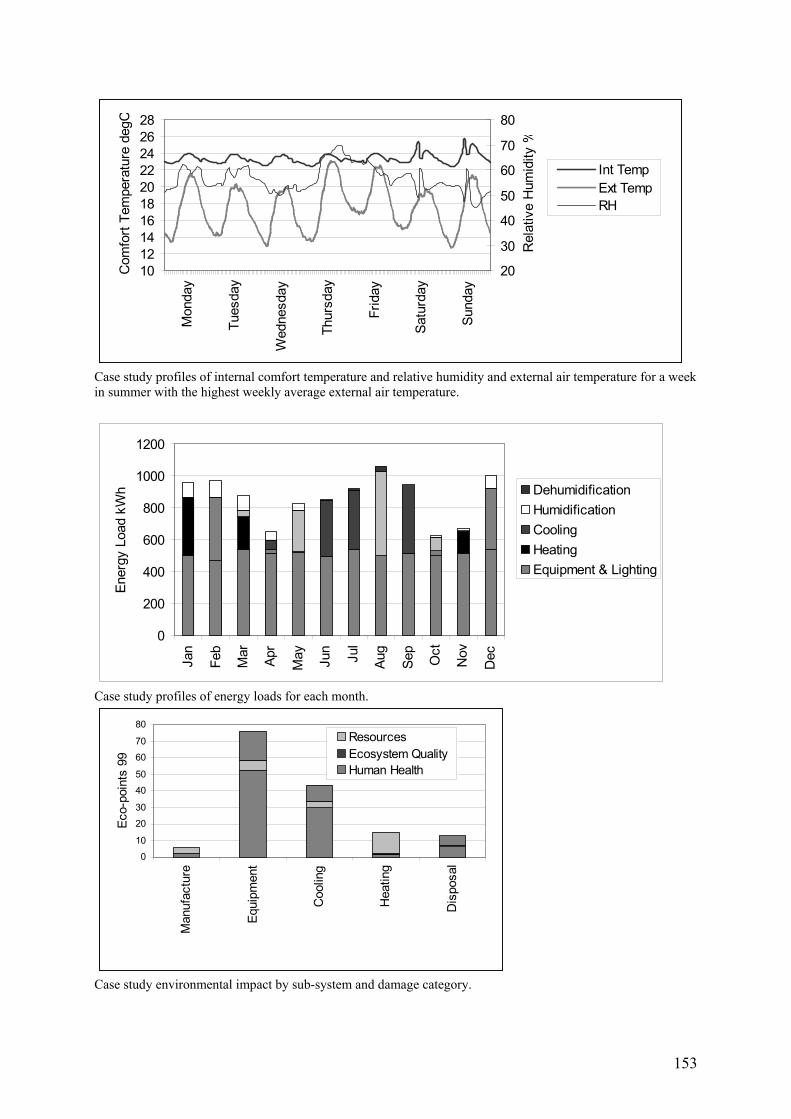
153
10121416182022242628
Mon
day
Tues
day
Wed
nesd
ay
Thur
sday
Frid
ay
Satu
rday
Sund
ay
Com
fort
Tem
pera
ture
deg
C
20
30
40
50
60
70
80
Rel
ativ
e H
umid
ity %
Int TempExt TempRH
Case study profiles of internal comfort temperature and relative humidity and external air temperature for a week in summer with the highest weekly average external air temperature.
0
200
400
600
800
1000
1200
Jan
Feb
Mar
Apr
May Jun
Jul
Aug
Sep
Oct
Nov
Dec
Ener
gy L
oad
kWh Dehumidification
HumidificationCoolingHeatingEquipment & Lighting
Case study profiles of energy loads for each month.
0
10
20
30
40
50
60
70
80
Man
ufac
ture
Equi
pmen
t
Coo
ling
Hea
ting
Dis
posa
l
Eco-
poin
ts 9
9
ResourcesEcosystem QualityHuman Health
Case study environmental impact by sub-system and damage category.
154
Benefits The tool has been discussed with designers within the authors' organisations who have commented positively on its educational value in promoting better understanding of the complex interaction between façade, building services and internal environment using a fast response interface. Need for further research Through discussions with designers the following topics were raised which merit further development:
• Financial implications of the façade options in particular the impact of the selection on the whole life cost in particular for the high quality facades which have a higher initial outlay but may result in lower whole life costs.
• Internal shading has not been considered in this study, as this requires user-behaviour scheduling of its use. However, such shading devices under user control would have a significant impact on energy consumption.
• Consideration of more complex variations of façade and building type; for example the retail sector.
References Kolokotroni M, Robinson-Gayle S, Tanno S, and Cripps A, (2004). Environmental impact analysis for typical office facades, Building Research and Information, Vol 32, No 1, pp2-16.
Robinson-Gayle S (2003), Environmental impact and performance of transparent building envelope materials and systems, EngD thesis, Brunel University.
CIBSE Guide A, (1999). Environmental design, CIBSE.
Brager G S, de Dear E, (2000). A Standard for Natural Ventilation, ASHRAE Journal, pp21-28, ASHRAE.
CIBSE LG10 (1999). Daylighting and window design, Applications Manual, CIBSE.
Yates, A., Bartlett, P. and Baldwin, R. (1994). Assessing the Environmental Impact of Buildings in the UK. Paper presented at the conference of Buildings and Environment, BRE, Garston, England (BRE report EP223).
Goedkoop, M, Effting S. and Collignon M. (2000). Eco-indicator 99: A damage oriented method for life cycle impact assessment. PRé Consultants B.V., Amersfoort.
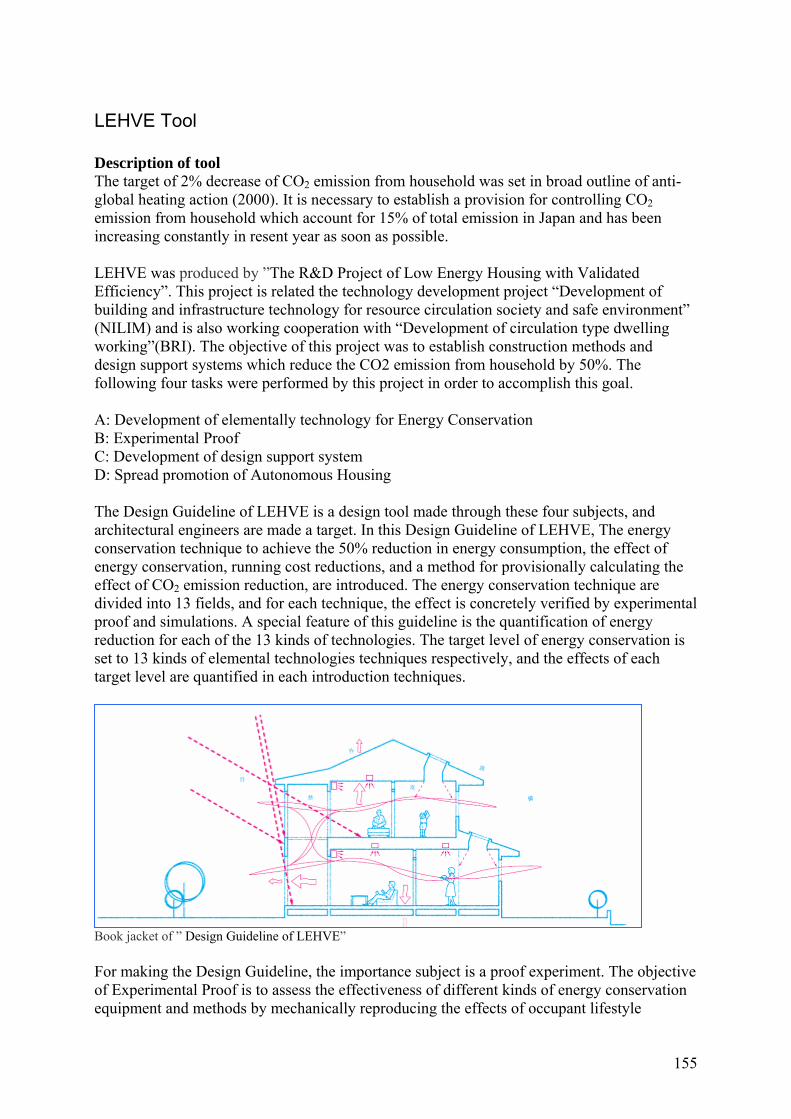
155
LEHVE Tool Description of tool The target of 2% decrease of CO2 emission from household was set in broad outline of anti-global heating action (2000). It is necessary to establish a provision for controlling CO2 emission from household which account for 15% of total emission in Japan and has been increasing constantly in resent year as soon as possible. LEHVE was produced by ”The R&D Project of Low Energy Housing with Validated Efficiency”. This project is related the technology development project “Development of building and infrastructure technology for resource circulation society and safe environment” (NILIM) and is also working cooperation with “Development of circulation type dwelling working”(BRI). The objective of this project was to establish construction methods and design support systems which reduce the CO2 emission from household by 50%. The following four tasks were performed by this project in order to accomplish this goal.
A: Development of elementally technology for Energy Conservation B: Experimental Proof C: Development of design support system D: Spread promotion of Autonomous Housing
The Design Guideline of LEHVE is a design tool made through these four subjects, and architectural engineers are made a target. In this Design Guideline of LEHVE, The energy conservation technique to achieve the 50% reduction in energy consumption, the effect of energy conservation, running cost reductions, and a method for provisionally calculating the effect of CO2 emission reduction, are introduced. The energy conservation technique are divided into 13 fields, and for each technique, the effect is concretely verified by experimental proof and simulations. A special feature of this guideline is the quantification of energy reduction for each of the 13 kinds of technologies. The target level of energy conservation is set to 13 kinds of elemental technologies techniques respectively, and the effects of each target level are quantified in each introduction techniques.
Book jacket of ” Design Guideline of LEHVE”
For making the Design Guideline, the importance subject is a proof experiment. The objective of Experimental Proof is to assess the effectiveness of different kinds of energy conservation equipment and methods by mechanically reproducing the effects of occupant lifestyle
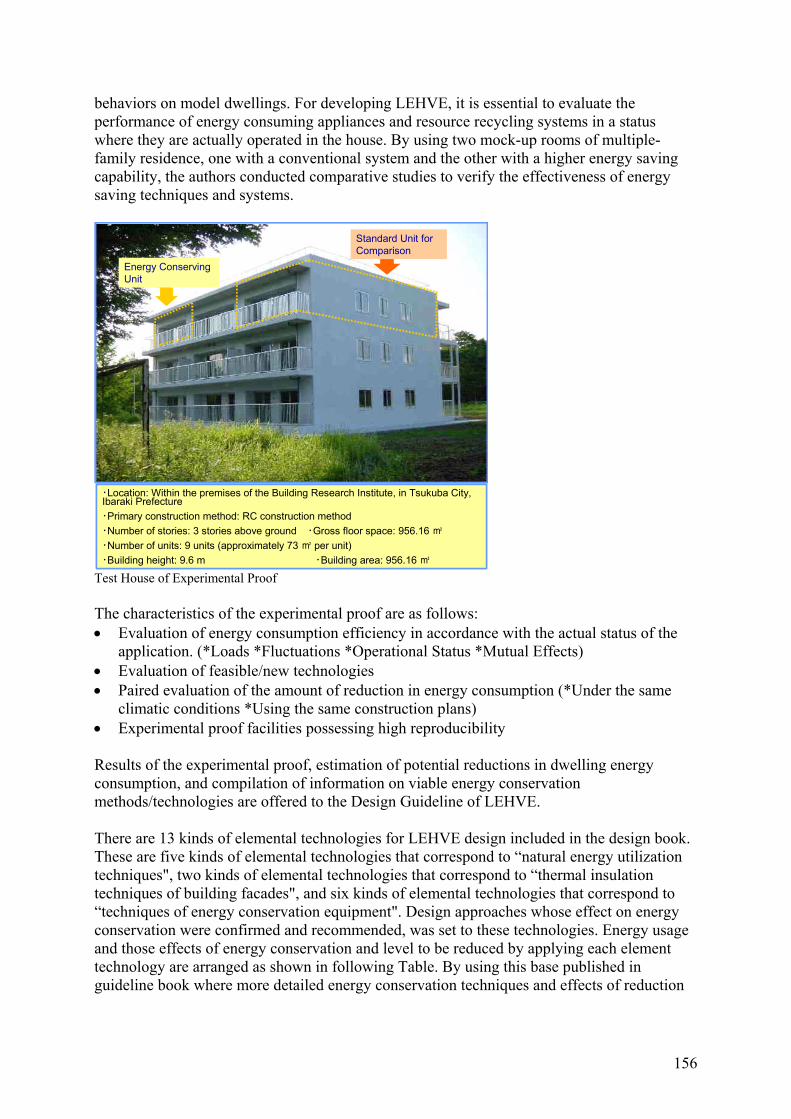
156
behaviors on model dwellings. For developing LEHVE, it is essential to evaluate the performance of energy consuming appliances and resource recycling systems in a status where they are actually operated in the house. By using two mock-up rooms of multiple-family residence, one with a conventional system and the other with a higher energy saving capability, the authors conducted comparative studies to verify the effectiveness of energy saving techniques and systems.
・Location: Within the premises of the Building Research Institute, in Tsukuba City, Ibaraki Prefecture・Primary construction method: RC construction method・Number of stories: 3 stories above ground ・Gross floor space: 956.16 ㎡・Number of units: 9 units (approximately 73 ㎡ per unit)・Building height: 9.6 m ・Building area: 956.16 ㎡
Standard Unit for Comparison
Energy Conserving Unit
Test House of Experimental Proof
The characteristics of the experimental proof are as follows: • Evaluation of energy consumption efficiency in accordance with the actual status of the
application. (*Loads *Fluctuations *Operational Status *Mutual Effects) • Evaluation of feasible/new technologies • Paired evaluation of the amount of reduction in energy consumption (*Under the same
climatic conditions *Using the same construction plans) • Experimental proof facilities possessing high reproducibility Results of the experimental proof, estimation of potential reductions in dwelling energy consumption, and compilation of information on viable energy conservation methods/technologies are offered to the Design Guideline of LEHVE. There are 13 kinds of elemental technologies for LEHVE design included in the design book. These are five kinds of elemental technologies that correspond to “natural energy utilization techniques", two kinds of elemental technologies that correspond to “thermal insulation techniques of building facades", and six kinds of elemental technologies that correspond to “techniques of energy conservation equipment". Design approaches whose effect on energy conservation were confirmed and recommended, was set to these technologies. Energy usage and those effects of energy conservation and level to be reduced by applying each element technology are arranged as shown in following Table. By using this base published in guideline book where more detailed energy conservation techniques and effects of reduction
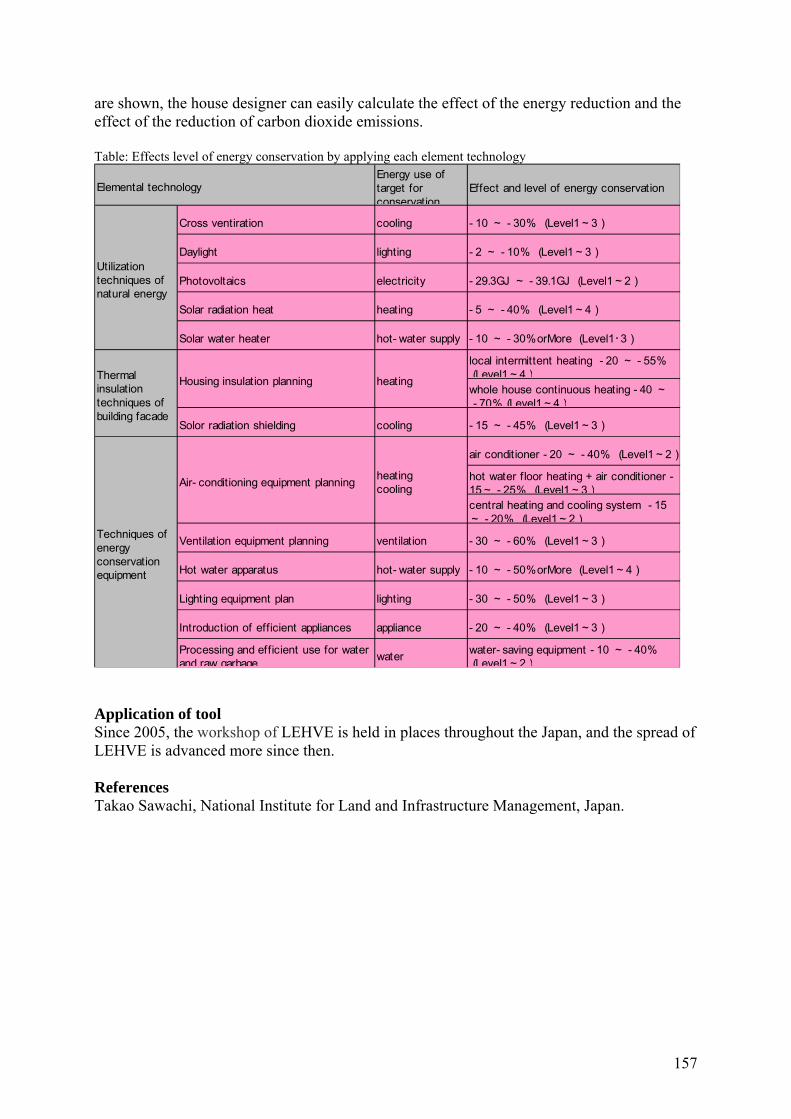
157
are shown, the house designer can easily calculate the effect of the energy reduction and the effect of the reduction of carbon dioxide emissions. Table: Effects level of energy conservation by applying each element technology Energy use of
target forconservation
Effect and level of energy conservation
Cross ventiration cooling - 10 ~ - 30% (Level1~3)
Daylight lighting - 2 ~ - 10% (Level1~3)
Photovoltaics electricity - 29.3GJ ~ - 39.1GJ (Level1~2)
Solar radiation heat heating - 5 ~ - 40% (Level1~4)
Solar water heater hot- water supply - 10 ~ - 30%orMore (Level1・3)
local intermittent heating - 20 ~ - 55%(Level1~4)whole house continuous heating - 40 ~- 70%(Level1~4)
Solor radiation shielding cooling - 15 ~ - 45% (Level1~3)
air conditioner - 20 ~ - 40% (Level1~2)
hot water floor heating + air conditioner -15~ - 25% (Level1~3)central heating and cooling system - 15~ - 20% (Level1~2)
Ventilation equipment planning ventilation - 30 ~ - 60% (Level1~3)
Hot water apparatus hot- water supply - 10 ~ - 50%orMore (Level1~4)
Lighting equipment plan lighting - 30 ~ - 50% (Level1~3)
Introduction of efficient appliances appliance - 20 ~ - 40% (Level1~3)
Processing and efficient use for waterand raw garbage water water- saving equipment - 10 ~ - 40%
(Level1~2)
Elemental technology
Housing insulation planning heating
Air- conditioning equipment planning heatingcooling
Utilizationtechniques ofnatural energy
Thermalinsulationtechniques ofbuilding facade
Techniques ofenergyconservationequipment
Application of tool Since 2005, the workshop of LEHVE is held in places throughout the Japan, and the spread of LEHVE is advanced more since then. References Takao Sawachi, National Institute for Land and Infrastructure Management, Japan.
158
VentSim – Ventilation Network Analysis Tool Description of tool "VentSim" is a tool to calculate the airflow rate among multi zones based on the ventilation network analysis. The pre-processor "VentPre" is attached to "VentSim", and all data for "VentSim" is able to be input easily by using "VentPre". "VentSim" is used to the ventilation design by evaluating the ventilation performance (airflow rate, Supply Rate Fulfilment Index (SRF), contaminant concentration, and so on). "VentPre" is pre-processor using Microsoft® Excel® worksheet with VBA. • All data for "VentSim" is input easily by using "VentPre". • Climate data for HASP (Heating, Air-conditioning, and Sanitary engineering Program) in
6 cities is available, and Expanded AMeDAS (Automated Meteorological Data Acquisition System) Weather Data at 842 points in Japan can be used.
• The properties of each room and airflow path are input on Excel® sheet easily. Simple opening, fan, infiltration and duct system can be set as airflow path.
• The parameters are input to calculate Supply Rate Fulfilment Index (SRF) and the contaminant concentration.
"VentSys" is the program to calculate the airflow rate among multi zones based on the ventilation network analysis. "VentSys" can calculate Supply Rate Fulfilment Index (SRF) and the contaminant concentration as well as the airflow rate. SRF is used to evaluate ventilation performance, and is based on the theory of conservation law of fresh air rate. The index is given by Eqn.1 and defined as the ratio of the effective supply rate Si (Eqn.3) to the substantial required fresh air supply rate Pi'. The SRF value ranges from 0 to 1 and SRF=1 means the referenced room has sufficient effective fresh supply air rate compared to Pi'. Si and Pi' are calculated by using αi (surplus fresh air supply rate of the zone i, which is obtained by solving Eqn.2). αi can be calculated when all airflow rates among zones in a building are known. The maximum value of αi, 1.0 represents purely fresh air like outside air, and a negative value means there is no fresh air.
'PS
)Q,0min(P
SSRFi
in
1jijji
ii =
α−=
∑=
(1)
i
n
1jjii
n
1jijjii
i P-BQQAVdt
d⎟⎟⎠
⎞⎜⎜⎝
⎛+α⋅α+=
α ∑∑==
(2)
)B,0max()Q,0max()Q,0max(AS iijii
n
1jijj
n
1jii ⋅α−⋅α−⋅α+= ∑∑
==
(3)
where Ai direct fresh air supply rate, the rate of air that is supplied directly from outside to room i [m3/h] Bi rate of air exhausted directly to the outside from room i [m3/h] M number of rooms for which the required fresh air supply rate is specified Pi required fresh air supply rate for room i [m3/h] Pi' substantial required fresh air supply rate of room i [m3/h] Qij transferred airflow rate, rate of air flowing from room j to room i [m3/h] Si effective fresh air supply rate of room i [m3/h] Vi air volume of room i [m3] n number of rooms αi surplus fresh air supply rate contained in the air exhausted from room i
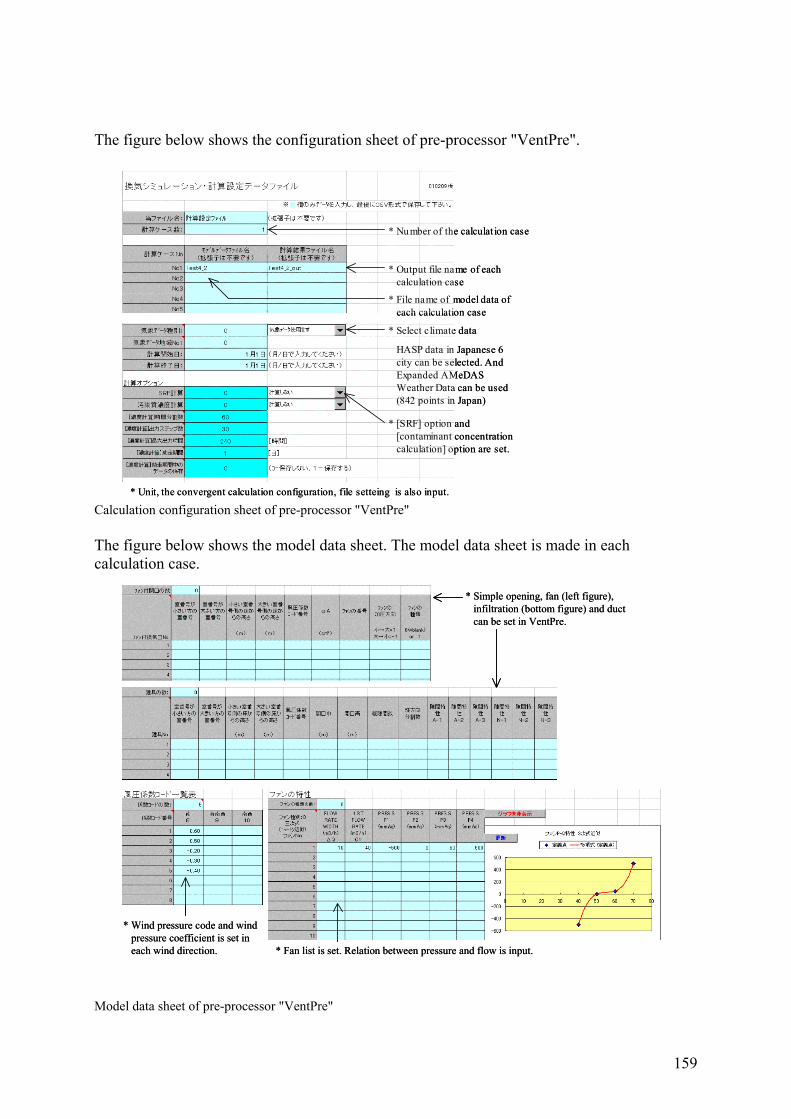
159
The figure below shows the configuration sheet of pre-processor "VentPre".
Calculation configuration sheet of pre-processor "VentPre" The figure below shows the model data sheet. The model data sheet is made in each calculation case.
Model data sheet of pre-processor "VentPre"
* Number of the calculat ion case
* Output file name of each calculation case
* Select climate data
HASP data in Japanese 6 city can be selected. And Expanded AMeDASWeather Data can be used (842 points in Japan)
* File name of model data of each calculation case
* [SRF] option and [contaminant concentration calculation] option are set.
* Unit, the convergent calculation configuration, file setteing is also input.
* Simple opening, fan (left figure), infiltration (bottom figure) and duct can be set in VentPre.
* Wind pressure code and wind pressure coefficient is set in each wind direction. * Fan list is set. Relation between pressure and flow is input.
* Simple opening, fan (left figure), infiltration (bottom figure) and duct can be set in VentPre.
* Wind pressure code and wind pressure coefficient is set in each wind direction. * Fan list is set. Relation between pressure and flow is input.
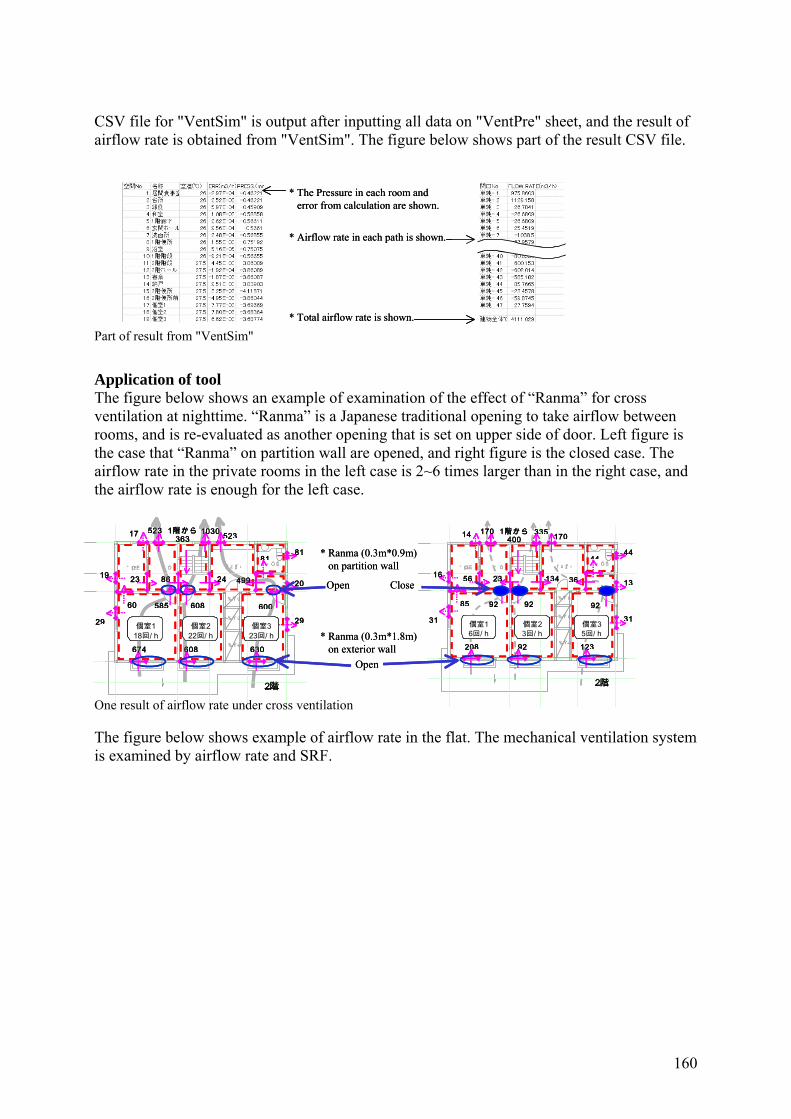
160
CSV file for "VentSim" is output after inputting all data on "VentPre" sheet, and the result of airflow rate is obtained from "VentSim". The figure below shows part of the result CSV file.
Part of result from "VentSim"
Application of tool The figure below shows an example of examination of the effect of “Ranma” for cross ventilation at nighttime. “Ranma” is a Japanese traditional opening to take airflow between rooms, and is re-evaluated as another opening that is set on upper side of door. Left figure is the case that “Ranma” on partition wall are opened, and right figure is the closed case. The airflow rate in the private rooms in the left case is 2~6 times larger than in the right case, and the airflow rate is enough for the left case.
ƒ z� [ƒ ‹
ŒÂŽ º� E‚ P
” [ŒË
ŒÂŽ º� E‚ Q ŒÂŽ º� E‚ R
� ‘� Ö
‰Ÿ“ ü
‰Ÿ“ ü
• Ö� Š
‰Ÿ“ ü
630608674
29
19
17 523 1030 523
81
20
29
24 499
81
600608585
8623
60
3631階から
個室118回/ h
個室222回/ h
個室323回/ h
2階
ƒ z� [ƒ ‹
ŒÂŽ º� E‚ P
” [ŒË
ŒÂŽ º� E‚ Q ŒÂŽ º� E‚ R
� ‘� Ö
‰Ÿ“ ü
‰Ÿ“ ü
• Ö� Š
‰Ÿ“ ü
12392208
31
16
14 170 335 170
44
13
31
134 36
44
929292
2356
85
4001階から
個室16回/ h
個室23回/ h
個室35回/ h
2階
* Ranma (0.3m*0.9m) on partition wall
Open Close
* Ranma (0.3m*1.8m) on exterior wall
Open
ƒ z� [ƒ ‹
ŒÂŽ º� E‚ P
” [ŒË
ŒÂŽ º� E‚ Q ŒÂŽ º� E‚ R
� ‘� Ö
‰Ÿ“ ü
‰Ÿ“ ü
• Ö� Š
‰Ÿ“ ü
630608674
29
19
17 523 1030 523
81
20
29
24 499
81
600608585
8623
60
3631階から
個室118回/ h
個室222回/ h
個室323回/ h
2階
ƒ z� [ƒ ‹
ŒÂŽ º� E‚ P
” [ŒË
ŒÂŽ º� E‚ Q ŒÂŽ º� E‚ R
� ‘� Ö
‰Ÿ“ ü
‰Ÿ“ ü
• Ö� Š
‰Ÿ“ ü
12392208
31
16
14 170 335 170
44
13
31
134 36
44
929292
2356
85
4001階から
個室16回/ h
個室23回/ h
個室35回/ h
2階
* Ranma (0.3m*0.9m) on partition wall
Open Close
* Ranma (0.3m*1.8m) on exterior wall
Open
One result of airflow rate under cross ventilation The figure below shows example of airflow rate in the flat. The mechanical ventilation system is examined by airflow rate and SRF.
* Airflow rate in each path is shown.
* The Pressure in each room and error from calculation are shown.
* Total airflow rate is shown.
* Airflow rate in each path is shown.
* The Pressure in each room and error from calculation are shown.
* Total airflow rate is shown.
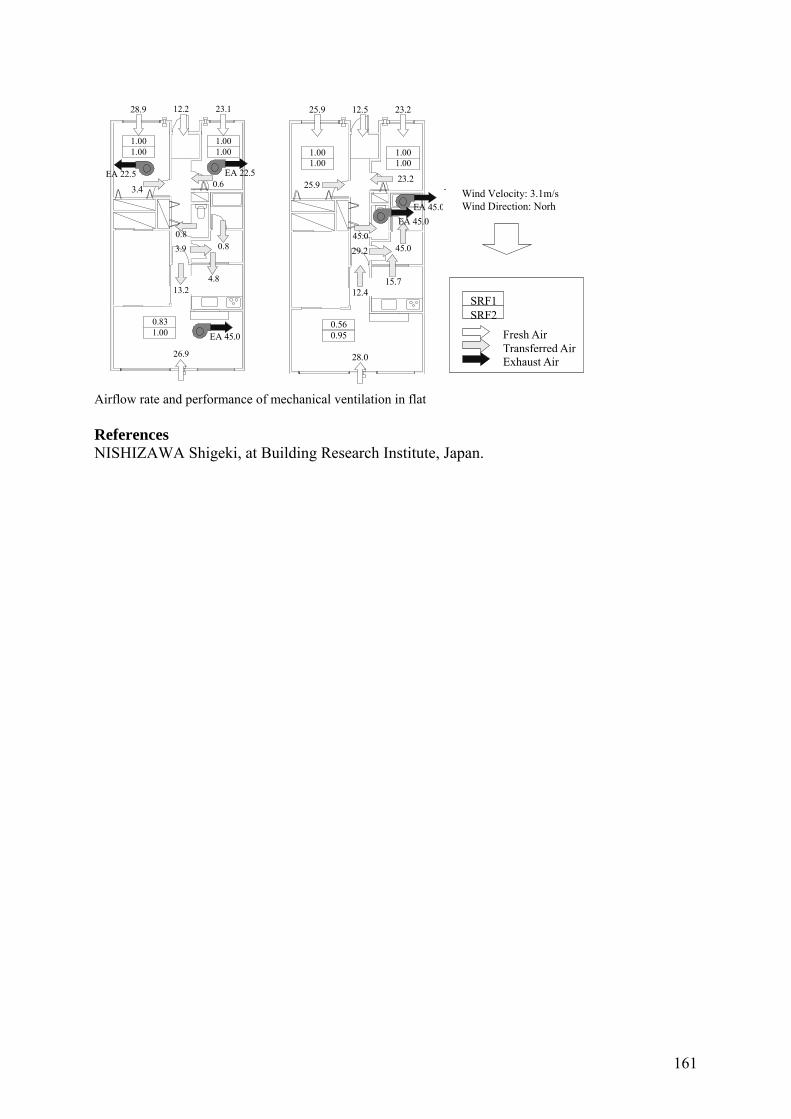
161
3.4
28.9 12.2 23.1
0.6
0.80.83.9
4.813.2
26.9
0.831.00
1.001.00
1.001.00
EA 22.5EA 22.5
EA 45.0
25.9
25.9 12.5 23.2
23.2
45.045.029.2
15.712.4
28.0
0.560.95
1.001.00
1.001.00
EA 45.0EA 45.0
SRF1SRF2
Transferred Air Fresh Air
Exhaust Air
Wind Velocity: 3.1m/sWind Direction: Norh
Airflow rate and performance of mechanical ventilation in flat References NISHIZAWA Shigeki, at Building Research Institute, Japan.
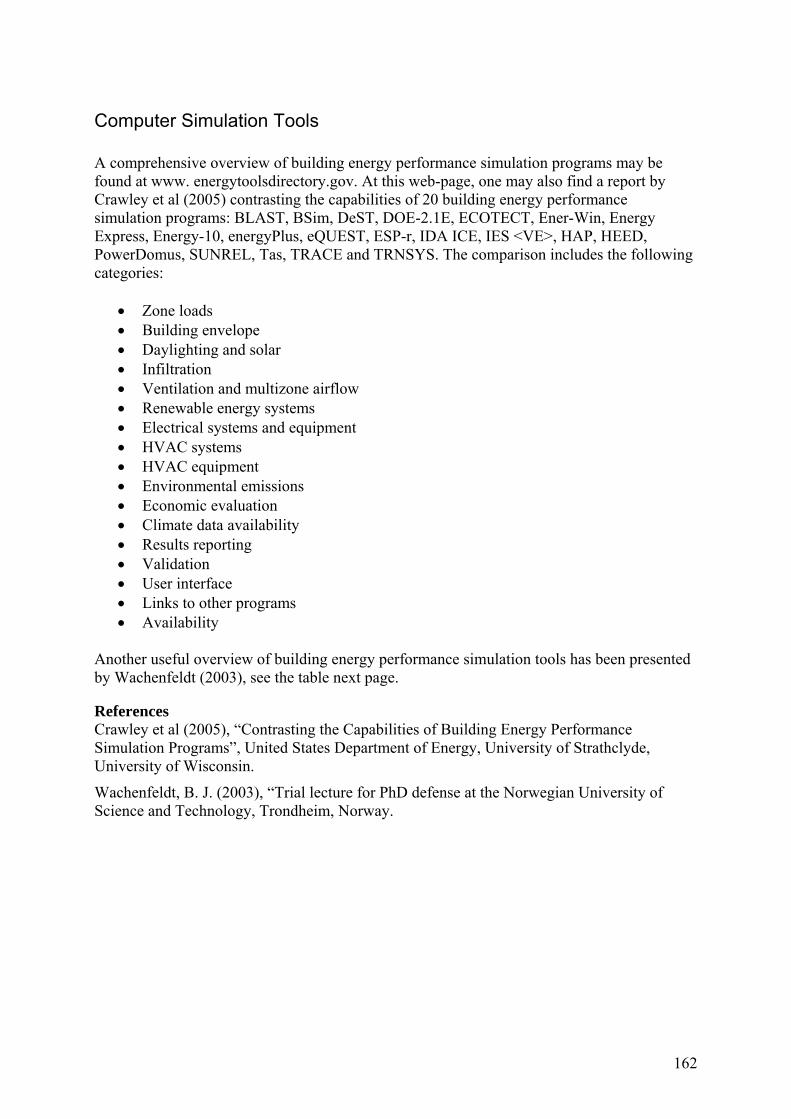
162
Computer Simulation Tools A comprehensive overview of building energy performance simulation programs may be found at www. energytoolsdirectory.gov. At this web-page, one may also find a report by Crawley et al (2005) contrasting the capabilities of 20 building energy performance simulation programs: BLAST, BSim, DeST, DOE-2.1E, ECOTECT, Ener-Win, Energy Express, Energy-10, energyPlus, eQUEST, ESP-r, IDA ICE, IES <VE>, HAP, HEED, PowerDomus, SUNREL, Tas, TRACE and TRNSYS. The comparison includes the following categories:
• Zone loads • Building envelope • Daylighting and solar • Infiltration • Ventilation and multizone airflow • Renewable energy systems • Electrical systems and equipment • HVAC systems • HVAC equipment • Environmental emissions • Economic evaluation • Climate data availability • Results reporting • Validation • User interface • Links to other programs • Availability
Another useful overview of building energy performance simulation tools has been presented by Wachenfeldt (2003), see the table next page. References Crawley et al (2005), “Contrasting the Capabilities of Building Energy Performance Simulation Programs”, United States Department of Energy, University of Strathclyde, University of Wisconsin.
Wachenfeldt, B. J. (2003), “Trial lecture for PhD defense at the Norwegian University of Science and Technology, Trondheim, Norway.
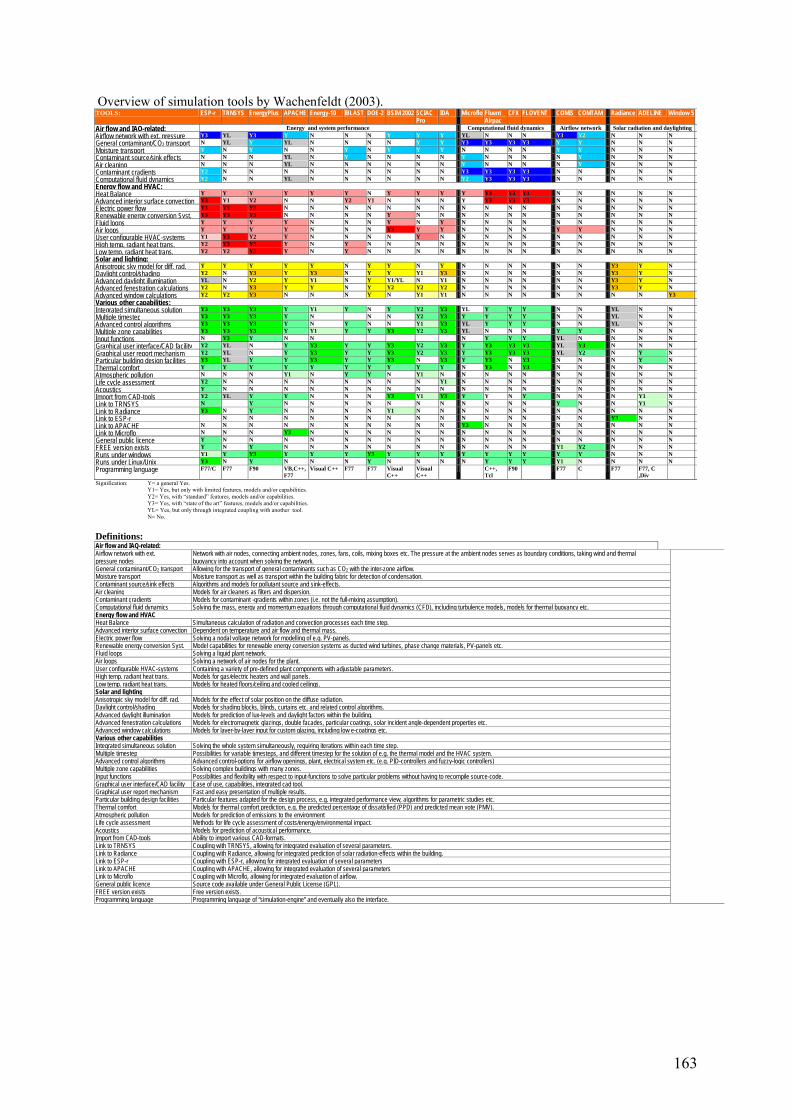
163
Overview of simulation tools by Wachenfeldt (2003). TOOLS: ESP-r TRNSYS EnergyPlus APACHE Energy-10 IBLAST DOE-2 BSIM 2002 SCIAC
Pro IDA Microflo Fluent
Airpac CFX FLOVENT COMIS COMTAM Radiance ADELINE Window 5
Air flow and IAQ-related: Energy and system performance Computational fluid dynamics Airflow network Solar radiation and daylighting Airflow network with ext. pressure Y3 YL Y3 Y N N N Y Y Y YL N N N Y3 Y2 N N N General contaminant/CO2 transport N YL Y YL N N N N Y Y Y3 Y3 Y3 Y3 Y Y N N N Moisture transport Y N Y N N Y N Y Y Y N N N N Y Y N N N Contaminant source/sink effects N N N YL N Y N N N N Y N N N N Y N N N Air cleaning N N N YL N N N N N N Y N N N N Y N N N Contaminant gradients Y2 N N N N N N N N N Y3 Y3 Y3 Y3 N N N N N Computational fluid dynamics Y2 N N YL N N N N N N Y2 Y3 Y3 Y3 N N N N N Energy flow and HVAC: Heat Balance Y Y Y Y Y Y N Y Y Y Y Y3 Y3 Y3 N N N N N Advanced interior surface convection Y3 Y1 Y2 N N Y2 Y1 N N N Y Y3 Y3 Y3 N N N N N Electric power flow Y3 Y3 Y3 N N N N N N N N N N N N N N N N Renewable energy conversion Syst. Y3 Y3 Y3 N N N N Y N N N N N N N N N N N Fluid loops Y Y Y Y N N N Y N Y N N N N N N N N N Air loops Y Y Y Y N N N Y3 Y Y N N N N Y Y N N N User configurable HVAC-systems Y1 Y3 Y2 Y N N N N Y N N N N N N N N N N High temp. radiant heat trans. Y2 Y3 Y3 Y N Y N N N N N N N N N N N N N Low temp. radiant heat trans. Y2 Y2 Y3 Y N Y N N N N N N N N N N N N N Solar and lighting: Anisotropic sky model for diff. rad. Y Y Y Y Y N Y Y N Y N N N N N N Y3 Y N Daylight control/shading Y2 N Y3 Y Y3 N Y Y Y1 Y3 N N N N N N Y3 Y N Advanced daylight illumination YL N Y2 Y Y1 N Y Y1/YL N Y1 N N N N N N Y3 Y N Advanced fenestration calculations Y2 N Y3 Y Y N Y Y2 Y2 Y2 N N N N N N Y3 Y N Advanced window calculations Y2 Y2 Y3 N N N Y N Y1 Y1 N N N N N N N N Y3 Various other capabilities: Integrated simultaneous solution Y3 Y3 Y3 Y Y1 Y N Y Y2 Y3 YL Y Y Y N N YL N N Multiple timestep Y3 Y3 Y3 Y N N N Y2 Y3 Y Y Y Y N N YL N N Advanced control algorithms Y3 Y3 Y3 Y N Y N N Y1 Y3 YL Y Y Y N N YL N N Multiple zone capabilities Y3 Y3 Y3 Y Y1 Y Y Y3 Y2 Y3 YL N N N Y Y N N N Input functions N Y3 Y N N N Y Y Y YL N N N N Graphical user interface/CAD facility Y2 YL N Y Y3 Y Y Y3 Y2 Y3 Y Y3 Y3 Y3 YL Y3 N N N Graphical user report mechanism Y2 YL N Y Y3 Y Y Y3 Y2 Y3 Y Y3 Y3 Y3 YL Y2 N Y N Particular building design facilities Y3 YL Y Y Y3 Y Y Y3 N Y3 Y Y3 N Y3 N N N Y N Thermal comfort Y Y Y Y Y Y Y Y Y Y N Y3 N Y3 N N N N N Atmospheric pollution N N N Y1 N Y Y N Y1 N N N N N N N N N N Life cycle assessment Y2 N N N N N N N N Y1 N N N N N N N N N Acoustics Y N N N N N N N N N N N N N N N N N N Import from CAD-tools Y2 YL Y Y N N N Y3 Y1 Y3 Y Y N Y N N N Y1 N Link to TRNSYS N Y N N N N N N N N N N N Y N N Y1 N Link to Radiance Y3 N Y N N N N Y1 N N N N N N N N N N N Link to ESP-r N N N N N N N N N N N N N N N Y3 N N Link to APACHE N N N N N N N N N N Y3 N N N N N N N N Link to Microflo N N N Y3 N N N N N N N N N N N N N N N General public licence Y N N N N N N N N N N N N N N N N N N FREE version exists Y N Y N N N N N N N N N N N Y1 Y2 N N N Runs under windows Y1 Y Y3 Y Y Y Y3 Y Y Y YY Y Y Y Y Y N N N Runs under Linux/Unix Y3 N Y N N N Y N N N N Y Y Y Y1 N N N N Programming language F77/C
F77 F90 VB,C++,
F77 Visual C++ F77 F77 Visual
C++ Visual C++
C++, Tcl
F90 F77 C F77 F77, C ,Div
Signification: Y= a general Yes.
Y1= Yes, but only with limited features, models and/or capabilities. Y2= Yes, with “standard” features, models and/or capabilities. Y3= Yes, with “state of the art” features, models and/or capabilities. YL= Yes, but only through integrated coupling with another tool. N= No.
Definitions: Air flow and IAQ-related: Airflow network with ext. pressure nodes
Network with air nodes, connecting ambient nodes, zones, fans, coils, mixing boxes etc. The pressure at the ambient nodes serves as boundary conditions, taking wind and thermal buoyancy into account when solving the network.
General contaminant/CO2 transport Allowing for the transport of general contaminants such as CO2 with the inter-zone airflow.Moisture transport Moisture transport as well as transport within the building fabric for detection of condensation.Contaminant source/sink effects Algorithms and models for pollutant source and sink-effects. Air cleaning Models for air cleaners as filters and dispersion. Contaminant gradients Models for contaminant -gradients within zones (i.e. not the full-mixing assumption).Computational fluid dynamics Solving the mass, energy and momentum equations through computational fluid dynamics (CFD), including turbulence models, models for thermal buoyancy etc. Energy flow and HVAC Heat Balance Simultaneous calculation of radiation and convection processes each time step.Advanced interior surface convection Dependent on temperature and air flow and thermal mass.Electric power flow Solving a nodal voltage network for modelling of e.g. PV-panels.Renewable energy conversion Syst. Model capabilities for renewable energy conversion systems as ducted wind turbines, phase change materials, PV-panels etc.Fluid loops Solving a liquid plant network. Air loops Solving a network of air nodes for the plant. User configurable HVAC-systems Containing a variety of pre-defined plant components with adjustable parameters.High temp. radiant heat trans. Models for gas/electric heaters and wall panels. Low temp. radiant heat trans. Models for heated floors/ceiling and cooled ceilings. Solar and lighting Anisotropic sky model for diff. rad. Models for the effect of solar position on the diffuse radiation.Daylight control/shading Models for shading blocks, blinds, curtains etc. and related control algorithms.Advanced daylight illumination Models for prediction of lux-levels and daylight factors within the building.Advanced fenestration calculations Models for electromagnetic glazings, double facades, particular coatings, solar incident angle-dependent properties etc.Advanced window calculations Models for layer-by-layer input for custom glazing, including low e-coatings etc.Various other capabilities Integrated simultaneous solution Solving the whole system simultaneously, requiring iterations within each time step.Multiple timestep Possibilities for variable timesteps, and different timestep for the solution of e.g. the thermal model and the HVAC system.Advanced control algorithms Advanced control-options for airflow openings, plant, electrical system etc. (e.g. PID-controllers and fuzzy-logic controllers)Multiple zone capabilities Solving complex buildings with many zones. Input functions Possibilities and flexibility with respect to input-functions to solve particular problems without having to recompile source-code. Graphical user interface/CAD facility Ease of use, capabilities, integrated cad tool. Graphical user report mechanism Fast and easy presentation of multiple results. Particular building design facilities Particular features adapted for the design process, e.g. integrated performance view, algorithms for parametric studies etc.Thermal comfort Models for thermal comfort prediction, e.g. the predicted percentage of dissatisfied (PPD) and predicted mean vote (PMV). Atmospheric pollution Models for prediction of emissions to the environment Life cycle assessment Methods for life cycle assessment of costs/energy/environmental impact.Acoustics Models for prediction of acoustical performance. Import from CAD-tools Ability to import various CAD-formats. Link to TRNSYS Coupling with TRNSYS, allowing for integrated evaluation of several parameters.Link to Radiance Coupling with Radiance, allowing for integrated prediction of solar radiation-effects within the building. Link to ESP-r Coupling with ESP-r, allowing for integrated evaluation of several parametersLink to APACHE Coupling with APACHE, allowing for integrated evaluation of several parametersLink to Microflo Coupling with Microflo, allowing for integrated evaluation of airflow.General public licence Source code available under General Public License (GPL).FREE version exists Free version exists.Programming language Programming language of “simulation-engine” and eventually also the interface.
164
Uncertainty in Building Performance Assessment Introduction In the design of integrated building concepts it is crucial to be able to predict the building performance with a satisfactory accuracy, especially, when selection between alternative design solutions is needed or if the aim is to perform an optimization of the building performance. When expressed in suitable indicators as primary energy use, environmental load and/or the indoor environmental quality, the building performance simulation provide the decision maker with a quantitative measure of the extent to which the design solution satisfies the design requirements and objectives. It is essential that the simulation result reflects the characteristics of the building and its technical systems and is able to simulate the building performance with a satisfactory accuracy - that the results are reliable and comparable. Traditionally, building performance simulation is based on a deterministic approach, which implies that the spread of input parameters is zero. However, to be able to compare different design alternatives against each other it is necessary also to estimate how reliable a design is, i.e. to quantify the uncertainty that is affiliated to the simulated result of each design alternative. This can contribute to more rational design decisions. At the same time it may lead to a more robust design due to the fact that the influence of variation in important design parameters has been considered. The different sources for uncertainties can be divided into four different categories:
o Uncertainties in the psychical model of the building and its technical systems. o Algorithms used in the software are simplifications/models of the physical
system o Models for different parts of the system have typically not the same level of
detail
o Uncertainties in the software and the numerical solution of equations. o Programming errors will always exist in detailed software tools. o Numerical solution of the governing equations is an approximation of the real
solution.
o Uncertainties introduced by the operator of the software o The real system is very complex, which requires that approximations and
simplifications are made. Different operators make different decisions on this o Operators make mistakes when running the software
o Uncertainties in selection of scenarios and parameter estimation o Different scenarios can be selected for simulation, as it is very difficult to
predict future use of a building o Modeling requires a huge number of different input parameters which are not
well defined o Lack of information may lead to the use of “educated guesses”. o Imprecision in the construction process and natural variability in properties of
building components and materials will also occur. The first two categories of uncertainties are dealt with and minimized in the development and validation of the simulation models and software tools, while the two last are dominating in the application phase. The following focuses on the application phase and especially on the
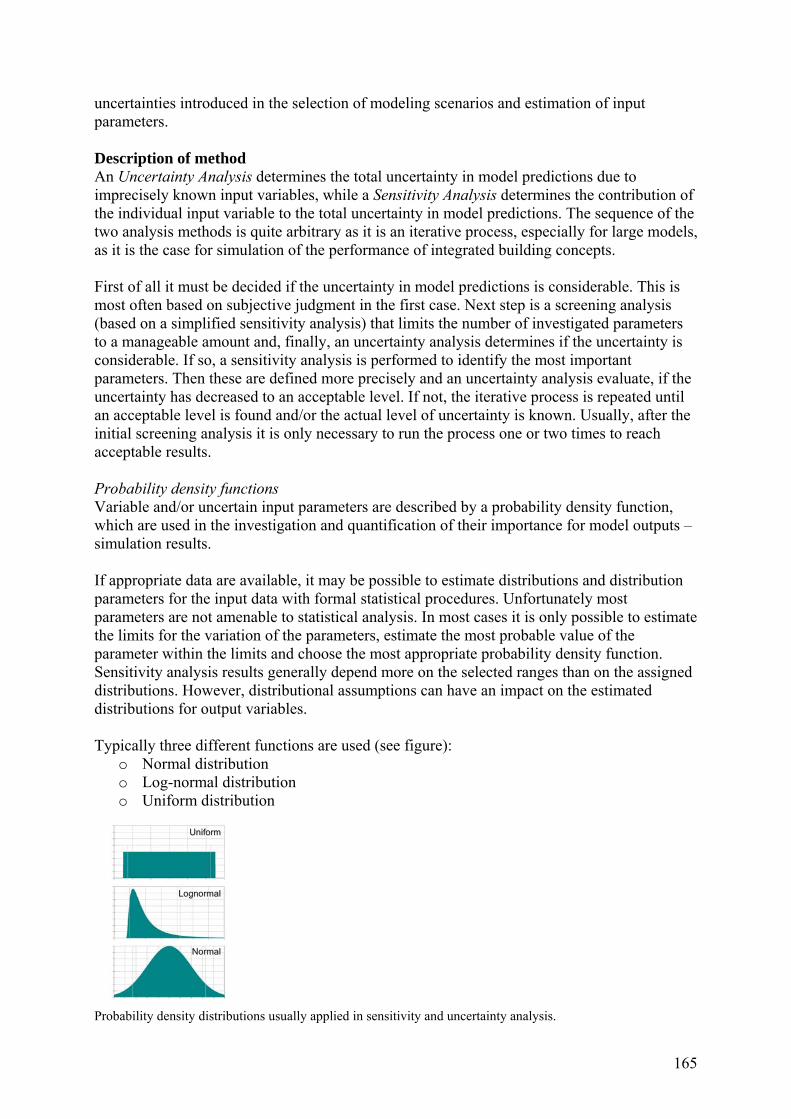
165
uncertainties introduced in the selection of modeling scenarios and estimation of input parameters. Description of method An Uncertainty Analysis determines the total uncertainty in model predictions due to imprecisely known input variables, while a Sensitivity Analysis determines the contribution of the individual input variable to the total uncertainty in model predictions. The sequence of the two analysis methods is quite arbitrary as it is an iterative process, especially for large models, as it is the case for simulation of the performance of integrated building concepts. First of all it must be decided if the uncertainty in model predictions is considerable. This is most often based on subjective judgment in the first case. Next step is a screening analysis (based on a simplified sensitivity analysis) that limits the number of investigated parameters to a manageable amount and, finally, an uncertainty analysis determines if the uncertainty is considerable. If so, a sensitivity analysis is performed to identify the most important parameters. Then these are defined more precisely and an uncertainty analysis evaluate, if the uncertainty has decreased to an acceptable level. If not, the iterative process is repeated until an acceptable level is found and/or the actual level of uncertainty is known. Usually, after the initial screening analysis it is only necessary to run the process one or two times to reach acceptable results. Probability density functions Variable and/or uncertain input parameters are described by a probability density function, which are used in the investigation and quantification of their importance for model outputs – simulation results. If appropriate data are available, it may be possible to estimate distributions and distribution parameters for the input data with formal statistical procedures. Unfortunately most parameters are not amenable to statistical analysis. In most cases it is only possible to estimate the limits for the variation of the parameters, estimate the most probable value of the parameter within the limits and choose the most appropriate probability density function. Sensitivity analysis results generally depend more on the selected ranges than on the assigned distributions. However, distributional assumptions can have an impact on the estimated distributions for output variables. Typically three different functions are used (see figure):
o Normal distribution o Log-normal distribution o Uniform distribution
Probability density distributions usually applied in sensitivity and uncertainty analysis.
UniformUniform
LognormalLognormal
NormalNormal
UniformUniform
LognormalLognormal
NormalNormal

166
A parameter is considered to be sensitive, if its value can vary considerably. These parameters are the ones selected for sensitivity analysis. If variation of the parameter results in considerable variation in model output – simulation results, the parameter is considered to be important. The result of the sensitivity analysis is a list of important parameters, which are the ones selected for the uncertainty analysis. Uncertainty analysis (UA) and sensitivity analysis (SA) Sensitivity analysis can be grouped into three classes:
o Screening methods. Are used for complex models which are computational expensive to evaluate and have a large number of input parameters. An economical method that can identify and rank qualitatively the parameters that control most of the output variability. Are often so-called OAT-methods (One-parameter-At-a-Time) in which the impact of changing the values of each parameter is evaluated in turn (partial analysis). A calculation using “standard values” is used as control. For each parameter, usually two extreme values are selected on both sides of the standard value. The differences between the result obtained by using the standard value and using the extreme values are compared to evaluate, which parameters the model is significantly sensitive to.
o Local sensitivity methods. Is an OAT approach, where evaluation of output variability is based on the variation of one parameter, while all other parameters are held constant. Useful for comparison of the relative uncertainty of various parameters. The input-output relationship is assumed to be linear and correlation between parameters is not taken into account.
o Global sensitivity methods. Is an approach, where output variability due to one parameter is evaluated by varying all other parameters as well, and where the effect of range and shape of their probability density function is incorporated.
The basic steps in a sensitivity analysis, see figure below, include:
1. Identification of questions to be answered by the analysis, define output variable(s)
2. Determine input parameters to be included by an initial screening analysis
3. Assign probability density functions to each parameter
4. Generate an input vector/matrix (maybe considering correlation)
5. Create an output distribution and evaluate the model uncertainty
6. Assess the influence of each input parameter on the output variable(s)
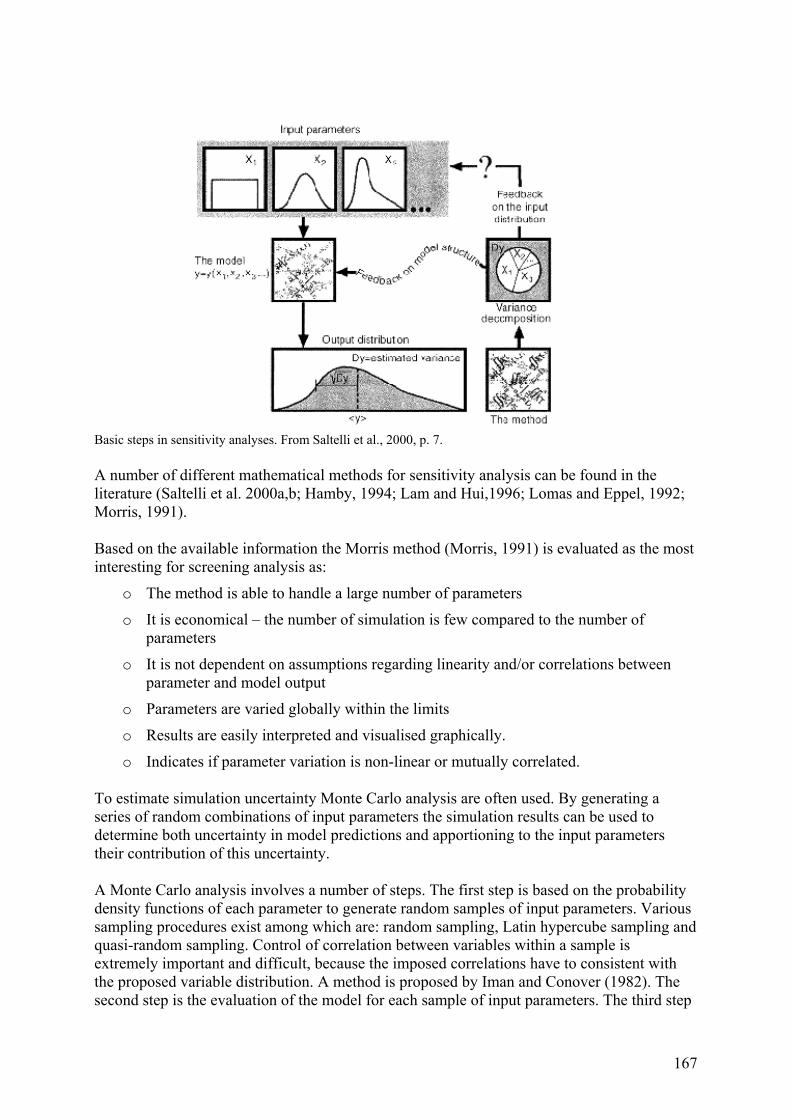
167
Basic steps in sensitivity analyses. From Saltelli et al., 2000, p. 7. A number of different mathematical methods for sensitivity analysis can be found in the literature (Saltelli et al. 2000a,b; Hamby, 1994; Lam and Hui,1996; Lomas and Eppel, 1992; Morris, 1991). Based on the available information the Morris method (Morris, 1991) is evaluated as the most interesting for screening analysis as:
o The method is able to handle a large number of parameters
o It is economical – the number of simulation is few compared to the number of parameters
o It is not dependent on assumptions regarding linearity and/or correlations between parameter and model output
o Parameters are varied globally within the limits
o Results are easily interpreted and visualised graphically.
o Indicates if parameter variation is non-linear or mutually correlated. To estimate simulation uncertainty Monte Carlo analysis are often used. By generating a series of random combinations of input parameters the simulation results can be used to determine both uncertainty in model predictions and apportioning to the input parameters their contribution of this uncertainty. A Monte Carlo analysis involves a number of steps. The first step is based on the probability density functions of each parameter to generate random samples of input parameters. Various sampling procedures exist among which are: random sampling, Latin hypercube sampling and quasi-random sampling. Control of correlation between variables within a sample is extremely important and difficult, because the imposed correlations have to consistent with the proposed variable distribution. A method is proposed by Iman and Conover (1982). The second step is the evaluation of the model for each sample of input parameters. The third step
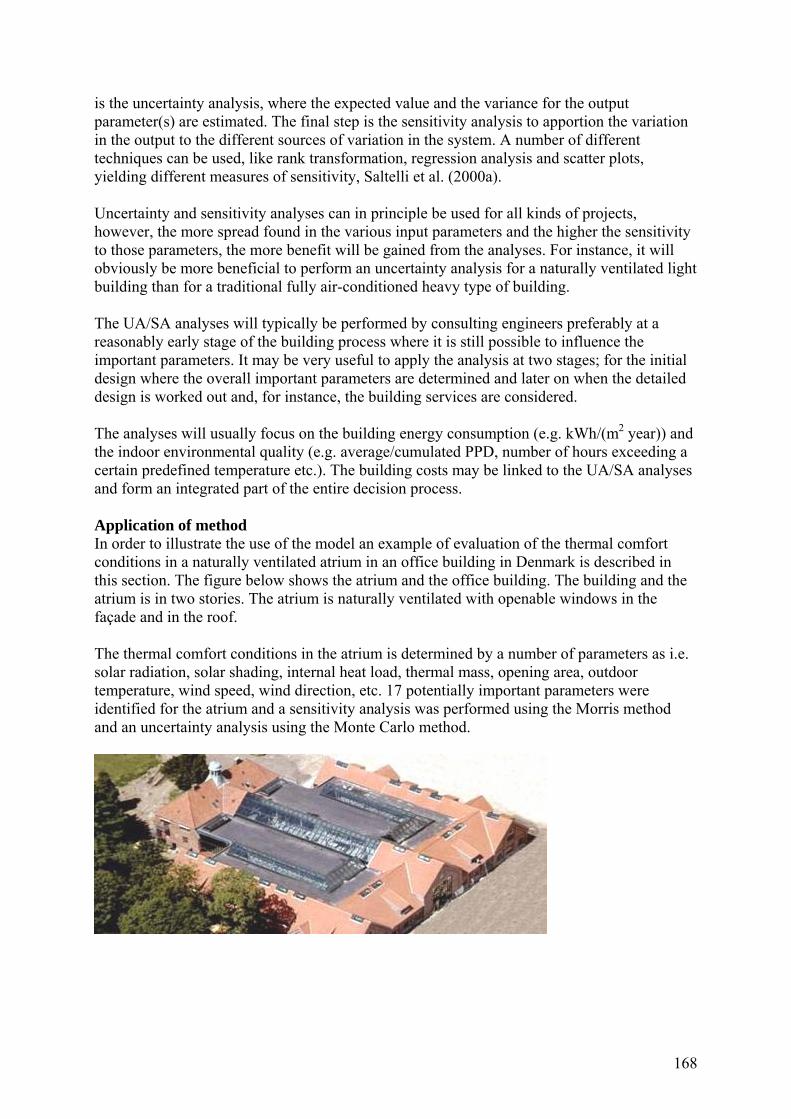
168
is the uncertainty analysis, where the expected value and the variance for the output parameter(s) are estimated. The final step is the sensitivity analysis to apportion the variation in the output to the different sources of variation in the system. A number of different techniques can be used, like rank transformation, regression analysis and scatter plots, yielding different measures of sensitivity, Saltelli et al. (2000a). Uncertainty and sensitivity analyses can in principle be used for all kinds of projects, however, the more spread found in the various input parameters and the higher the sensitivity to those parameters, the more benefit will be gained from the analyses. For instance, it will obviously be more beneficial to perform an uncertainty analysis for a naturally ventilated light building than for a traditional fully air-conditioned heavy type of building. The UA/SA analyses will typically be performed by consulting engineers preferably at a reasonably early stage of the building process where it is still possible to influence the important parameters. It may be very useful to apply the analysis at two stages; for the initial design where the overall important parameters are determined and later on when the detailed design is worked out and, for instance, the building services are considered. The analyses will usually focus on the building energy consumption (e.g. kWh/(m2 year)) and the indoor environmental quality (e.g. average/cumulated PPD, number of hours exceeding a certain predefined temperature etc.). The building costs may be linked to the UA/SA analyses and form an integrated part of the entire decision process. Application of method In order to illustrate the use of the model an example of evaluation of the thermal comfort conditions in a naturally ventilated atrium in an office building in Denmark is described in this section. The figure below shows the atrium and the office building. The building and the atrium is in two stories. The atrium is naturally ventilated with openable windows in the façade and in the roof. The thermal comfort conditions in the atrium is determined by a number of parameters as i.e. solar radiation, solar shading, internal heat load, thermal mass, opening area, outdoor temperature, wind speed, wind direction, etc. 17 potentially important parameters were identified for the atrium and a sensitivity analysis was performed using the Morris method and an uncertainty analysis using the Monte Carlo method.
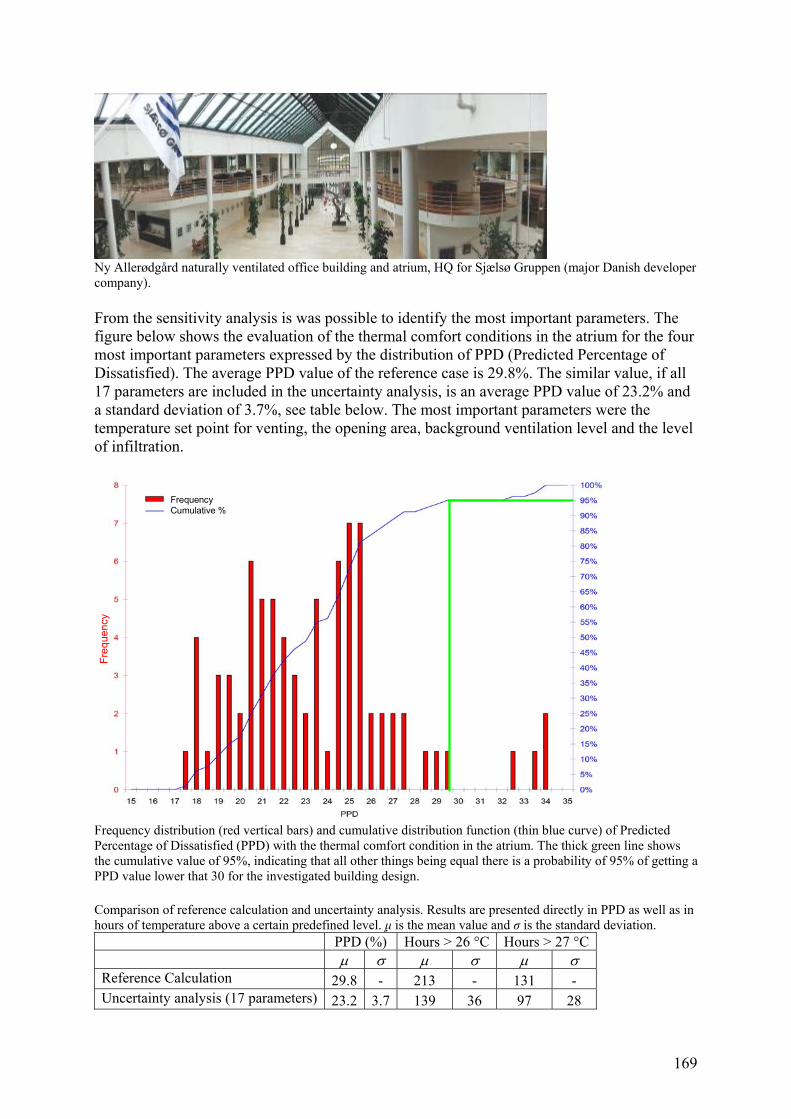
169
Ny Allerødgård naturally ventilated office building and atrium, HQ for Sjælsø Gruppen (major Danish developer company). From the sensitivity analysis is was possible to identify the most important parameters. The figure below shows the evaluation of the thermal comfort conditions in the atrium for the four most important parameters expressed by the distribution of PPD (Predicted Percentage of Dissatisfied). The average PPD value of the reference case is 29.8%. The similar value, if all 17 parameters are included in the uncertainty analysis, is an average PPD value of 23.2% and a standard deviation of 3.7%, see table below. The most important parameters were the temperature set point for venting, the opening area, background ventilation level and the level of infiltration. Frequency distribution (red vertical bars) and cumulative distribution function (thin blue curve) of Predicted Percentage of Dissatisfied (PPD) with the thermal comfort condition in the atrium. The thick green line shows the cumulative value of 95%, indicating that all other things being equal there is a probability of 95% of getting a PPD value lower that 30 for the investigated building design. Comparison of reference calculation and uncertainty analysis. Results are presented directly in PPD as well as in hours of temperature above a certain predefined level. µ is the mean value and σ is the standard deviation.
PPD (%) Hours > 26 °C Hours > 27 °C µ σ µ σ µ σ
Reference Calculation 29.8 - 213 - 131 - Uncertainty analysis (17 parameters) 23.2 3.7 139 36 97 28
FrequencyCumulative %
Freq
uenc
y
FrequencyCumulative %FrequencyCumulative %
Freq
uenc
y
170
Benefits The uncertainty analysis makes it possible to identify the most important parameters for building performance assessment and to focus the building design and optimization on these fewer parameters. The results give a much better background for evaluation of the design than a single value (uncertainty quantified), which often is based on cautious selection of input parameters and therefore tends to underpredict the potential of passive technologies. In many cases evaluation of a design solution is based on a calculation of the thermal comfort expressed by a performance indicator like PPD and/or the number of hours the temperature is higher than a certain value. Due to complexity of modelling of buildings and technical systems and the variation of boundary conditions and possible user scenarios, it is actually irresponsible to base decisions on a single calculation using a single sample of input parameters. An uncertainty analysis gives much more information about the performance and a much better background to make decisions. Barriers The main barrier for application of uncertainty analysis in building performance assessment is the increase in calculation time and complexity. Even if the Morris method is relative effective for screening analyses about 500 calculations are needed for an investigation of 50 variable input parameters. Monte Carlo simulation is attractive for the uncertainty analysis, as the only requirement is that it is possible to describe the probability density function of the important input parameters. The disadvantage of the method is the high number of simulations. Even if an appropriate sampling procedure is selected the number of simulations to investigate the uncertainty is 2 – 5 times the number of parameters investigated with a total number of realizations not lower than 80 - 100. Need for further research Uncertainty analysis is far from being a central issue in consultancy. Explicit appraisal of uncertainty is the exception rather than the rule and most decisions are based on single valued estimates for performance indicators. At the moment experiences from practical design cases are almost nonexistent. These are needed to demonstrate the benefits and transform the methods to practice, i.e. include uncertainty analysis in commercially available building simulation tools. Uncertainty analyses have a potential to be used to assess the robustness of different solutions to changes in boundary conditions and different user scenarios to avoid the design of very sensitive solutions. Methods and procedures for this purpose have to be developed. The knowledge of typical variations of many input parameters is very limited. Material properties and characteristic parameter values of building components can only be estimated from tabular data and theoretical calculations. It is necessary to establish knowledge about the natural variability in properties of building components and materials as constructed in the built environment to improve the quality of the uncertainty analysis.
171
References Breesch, H. and Janssens, A. (2004). Uncertainty and Sensitivity Analysis of the Performances of Natural Night Ventilation, Proceedings of Roomvent 2004, 9th International Conference on Air Distribution in Rooms, Coimbra, Portugal, 5 – 8 September.
Brohus, H. (2004). Performance Assessment of a Naturally Ventilated Multizone Building, Proceedings of CIB2004, CIB World Building Congress 2004, Toronto, Ontario, Canada, 1 – 7 May.
Brohus, H. (2005). Uncertainty of IAQ Performance Assessment of a Naturally Ventilated Building, Proceedings of the 10th International Conference on Indoor Air Quality and Climate Indoor Air 2005, pp. 2854 – 2859, Beijing, China, September 4 – 9.
Brohus H., Frier, C. and Heiselberg, P. (2002a). Stochastic Load Models based on Weather Data, Annex 35 Technical Report TR17, Department of Building Technology and Structural Engineering, Aalborg University, Aalborg, Denmark.
Brohus H., Frier, C. and Heiselberg, P. (2002b). Stochastic Single Zone and Multizone Models of a Hybrid Ventilated Building – A Monte Carlo Simulation Approach, Annex 35 Technical Report TR19, Department of Building Technology and Structural Engineering, Aalborg University, Aalborg, Denmark.
Hamby, D.M. (1994). A Review of Techniques for Parameter Sensitivity Analysis of Environmental Models, Environmental Monitoring and Assessment, Vol. 32, pp. 135 – 154.
Iman, R.L. and Conover, W. J. (1982). A Distribution-Free Approach to Introducing Rank Correlation Among Input Variables. Commun. Statist. Simul. Comput. B 11, 311-334.
Lam, J.C. and Hui, S.C.M. (1996). Sensitivity Analysis of Energy Performance of Office Buildings, Building and Environment, Vol. 31, No. 1, pp. 27 – 39.
Lomas, K.J. and Eppel, H. (1992). Sensitivity Analysis Techniques for Building Thermal Simulation Programs, Energy and Buildings, Vol. 19, No. 1, pp. 21 – 44.
Morris, M.D. (1991). Factorial Sampling Plans for Preliminary Computational Experiments, Technometrics, Vol. 33, No. 2, pp. 161 – 174.
Saltelli, A., Chan, K., Scott, E. M. (2000a). Sensitivity Analysis. John Wiley & Sons. ISBN 047 1998 923.
Saltelli, A., Tarantola, S. and Campolongo, F. (2000b). Sensitivity Analysis as an Ingredient of Modeling, Statistical Science, Vol. 15, No. 4, pp. 377-395.
De Wit, M.S. (1997). Identification of the Important Parameters in Thermal Building Simulation Models, J. Statist. Comput. Simul., Vol. 57, pp. 305 – 320.
172
Chapter 5 State-of-the-art review of technical barriers and opportunities for integration
This chapter summarizes the barriers and opportunities for implementation of integrated building concepts that have been reported in the previous chapters. The issues reported may be categorized into the following main groups: 1) Process related issues: - Lack of integrated design - Lack of holistic design (sub-optimizing) - Difficult liability issues - No well established contracts - Lack of appropriate performance prediction tools - Lack of knowledge/guidelines - Difficulties in communication between architects and engineers - Difficulties in planning for future occupancy changes 2) Technology related issues: - Lack of standard components - Lack of performance measurements - Lack of experience, lack of demonstrated technologies and concepts for different climates - Concerns about risks and failures - Lack of integration between different technologies and building components - Lack of appropriate/optimised controls 3) Costs related issues - The case studies demonstrates that the investment costs of Integrated Building Concepts
may be both lower and higher than standard buildings. - Running costs are usually lower than for standard buildings - Extra time and resources needed in early design phase 4) User related issues - Lack of user satisfaction surveys