Embed Size (px)
Citation preview
SOURCE MONITORINGEstimating Measurement Uncertainty for Particulate
Emissions from Stationary Sources
Presented by
Gerald Woollatt
LEVEGO
Overview
Introduction
Main objectives of the study
Literature review / overview
Key findings of Dutch study (1999)
Data and Methodology
Sampling Suitability Matrix
Discussion
Summary and conclusions
Introduction
Stack emission monitoring currently regulated
under NEMA:AQA Act 39:2004 – officially
gazetted in 2010.
Particulate matter is a requirement for almost
every listed process or category under the
section 21 regulations
A relatively recent requirement is not only to
report a measured result for compliance
purposes but a reported uncertainty of the
result needs to be reported with the result
Introduction contd.
The total uncertainty of the final reported
emission result is difficult to quantify due to the
physical properties of particulate matter
Tends to be inhomogeneous in the off-gas
stream
Isokinetic sampling therefore required utilizing
an internationally recognized validated method
such as ISO 9096:2003 or US EPA Method 5
etc.
Good quality data are essential in the decision
making process for both the plant operator and
regulator
Introduction contd.
Decisions made on questionable data may lead
to costly mistakes leading to wasteful
expenditure and non action from the regulatory
authorities
Main Objectives of the Study Air quality still in its relative infancy in South
Africa
This project aims to coincide with the demands
of the new legislation to ensure better data
quality and reliability of reported emission
results
Ascertain the validity of source emission data
through applying standardized statistical
methods as described in the GUM 1995.
To allow for a standardized method of
assessment of data quality to be carried out by
the regulator and plant operator.
Literature Review/Overview
Limited studies and literature in the field of
stack emission sampling have been conducted
Assumption that the greatest components
contributing to the uncertainty of the final
measurement result are those factors /
variables outside the control of the
measurement technician namely:
– Environmental conditions
– Plant operating conditions
– Sampling location
Literature Review/Overview Contd.
From the assumptions above several questions
can be asked;
– Do the above variables have the greatest influence
on the accuracy of the results obtained?
– Can the overall uncertainty of the measurement
result be determined statistically?
– Can a suitable method of evaluating the
acceptability of final emission data be developed?
Literature Review / Overview Contd.
In an attempt to answer these questions two
sampling campaigns were conducted;
First sampling campaign was conducted on a
plant were all the minimum requirements of the
sampling method were complied with.
Second sampling campaign was conducted
were all the minimum requirements were met
except for the sampling location and process
operating conditions.
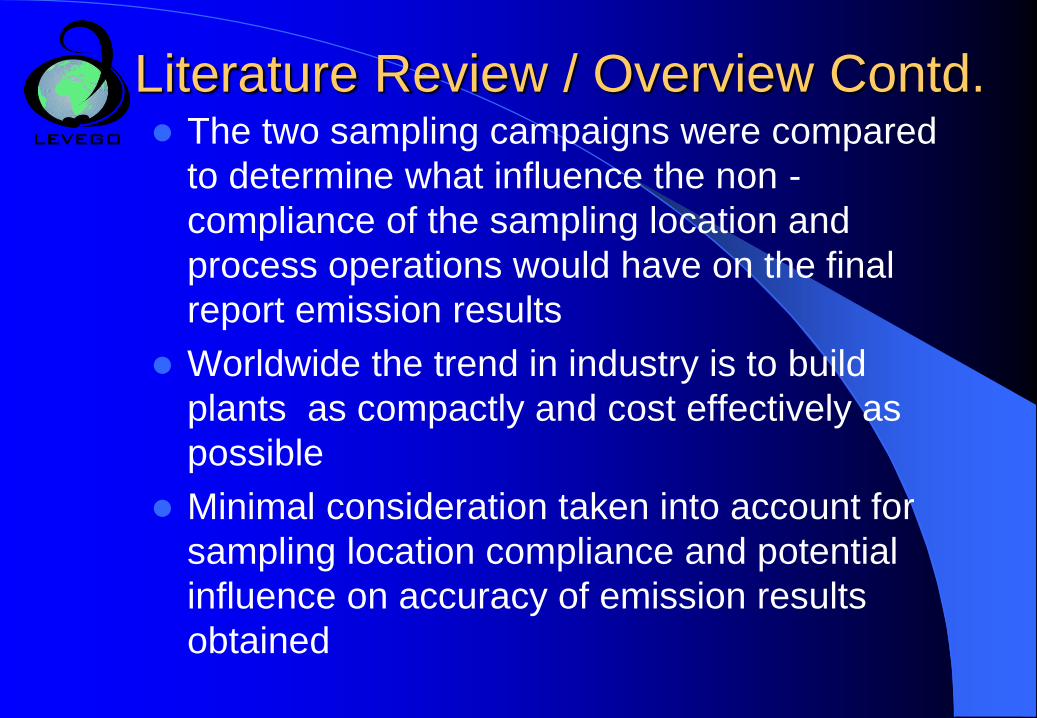
Literature Review / Overview Contd. The two sampling campaigns were compared
to determine what influence the non -
compliance of the sampling location and
process operations would have on the final
report emission results
Worldwide the trend in industry is to build
plants as compactly and cost effectively as
possible
Minimal consideration taken into account for
sampling location compliance and potential
influence on accuracy of emission results
obtained
Literature Review / Overview Contd.
Key findings of Dutch Study (1999) According to the study the results for the
reproducibility were disappointing
Study found that off gas characteristics such as
high water vapour content has a significant
influence on the accuracy of the results
obtained, led to classification or distinction to
be made between “simple” and “difficult”
sources
The reproducibility was estimated at
approximately 44% RSD and a similar order of
magnitude for all of the various concentration
ranges measured.
Key findings of Dutch Study Contd. Errors and uncertainties with regards to
temporal and spatial variations are too great to
allow much value to be derived from an in
depth statistical analysis of the results obtained
Large uncertainties are present when trying to
reproduce results utilizing current Isokinetic
sampling methods
Data and Methodology. Two isokinetic sampling campaigns were
conducted for particulate matter in accordance
with ISO9096
– Campaign 1 (Source A): 12 one hour tests were
conducted over two days on a fully compliant plant
typical of a large industrial coal fired boiler power
plant
– Campaign 2 (Source B): 3 one hour tests were
conducted over an 8 hour shift on a typical cement
kiln where the sampling location was not in
compliance with the method requirements.
Data and Methodology contd. A critical element of a quality system and
ensuring quality data is obtained is to ensure
that the systems of calibration and
measurement are traceable to national
standards of measurement and that confidence
can be placed in the quality of measurements
carried out at all steps in the traceability chain
(Clarke et al.,1998)
ISO9096 is a validated, internationally
recognized isokinetic sampling method
Data and Methodology contd.
Most methods have been developed for steady
state conditions and as such it is not unusual to
have a 100 fold difference in emissions over
time periods of 10 days to 10
months(Environment Agency Technical
guidance note M2, 1993).
Therefore it is important to gain as much
information about the process as possible
Data and Methodology contd.
A representative sample is obtained by
withdrawing a sample isokinetically at several
predetermined equal area points from the
waste gas stream
Sampling periods for each point should be of
equal duration resulting in a composite sample
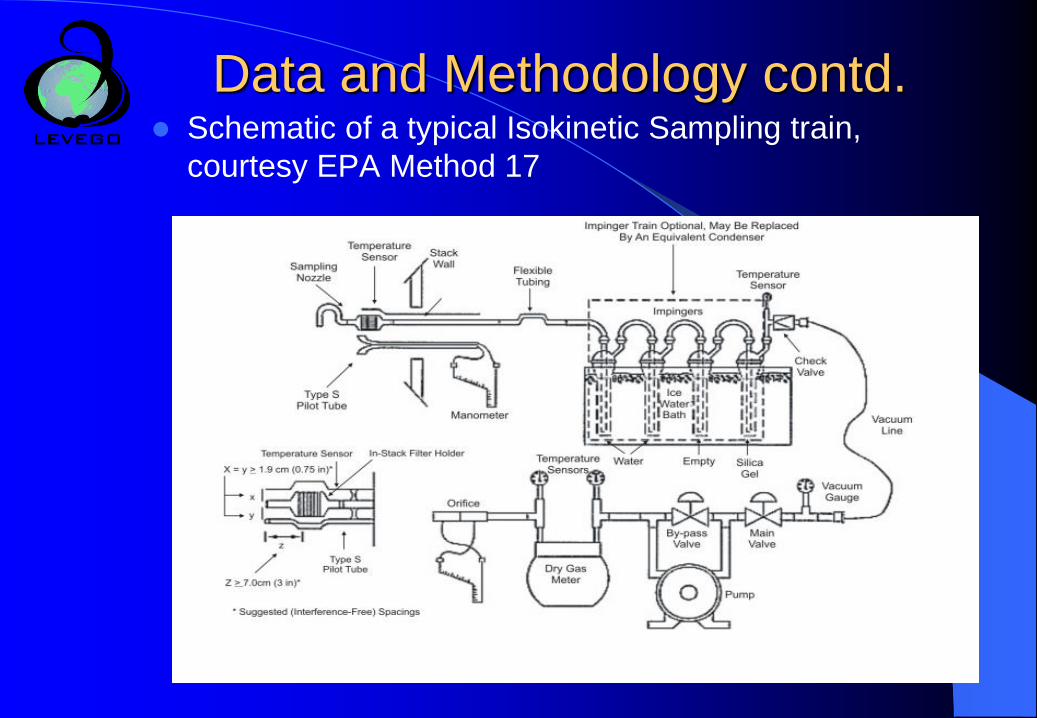
Data and Methodology contd. Schematic of a typical Isokinetic Sampling train,
courtesy EPA Method 17
Data and Methodology contd. Statistical approach -
The overall statistical approach utilised to
estimate the method uncertainty - based on the
Guide to the Expression of Uncertainty in
Measurement” (generally known as GUM,
1995)
Important concepts of repeatability and
reproducibility need to be understood
This project aimed to determine the
reproducibility of the method under various
operating times and conditions in the field.
Data and Methodology contd. Statistical approach –
If testing was conducted at an unsuitable
location, or was carried out under fluctuating
plant operating conditions, the validity of the
sample may be questioned and the
measurement results uncertain(ISO9096:2003)
Data and Methodology contd. Statistical approach –
An assessment of the stability and uniformity of
the flow in the flue will determine the
suitability/compliance of the sampling location.
For this reason the velocity flow profiles for
Source A and B have been included to assess
the quality and validity of emission results
obtained
Data and Methodology contd. Statistical approach –
Series 1, 2 and 3 in the figures are
representative of the flow profiles for each
sampling port utilized for each sample
conducted
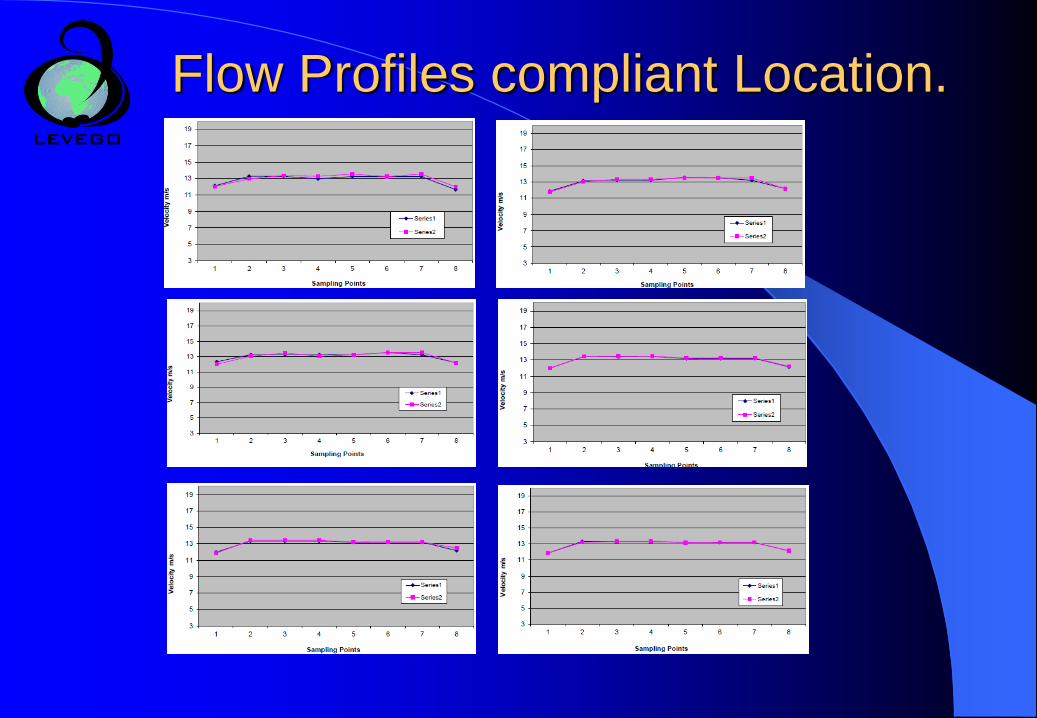
Flow Profiles compliant Location.
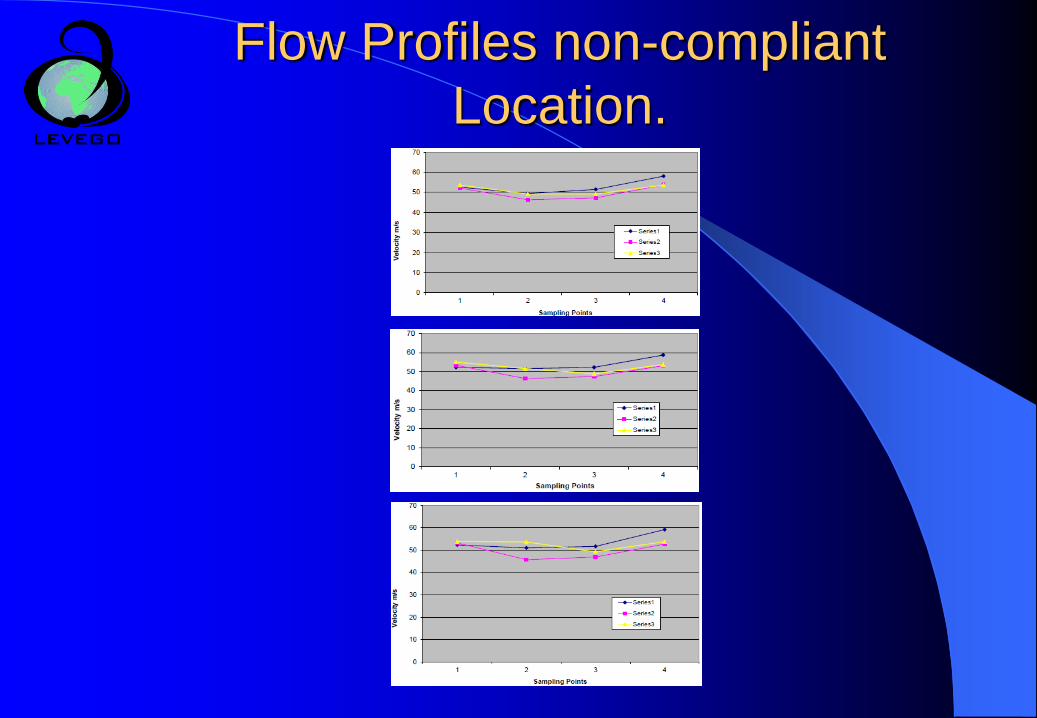
Flow Profiles non-compliant
Location.
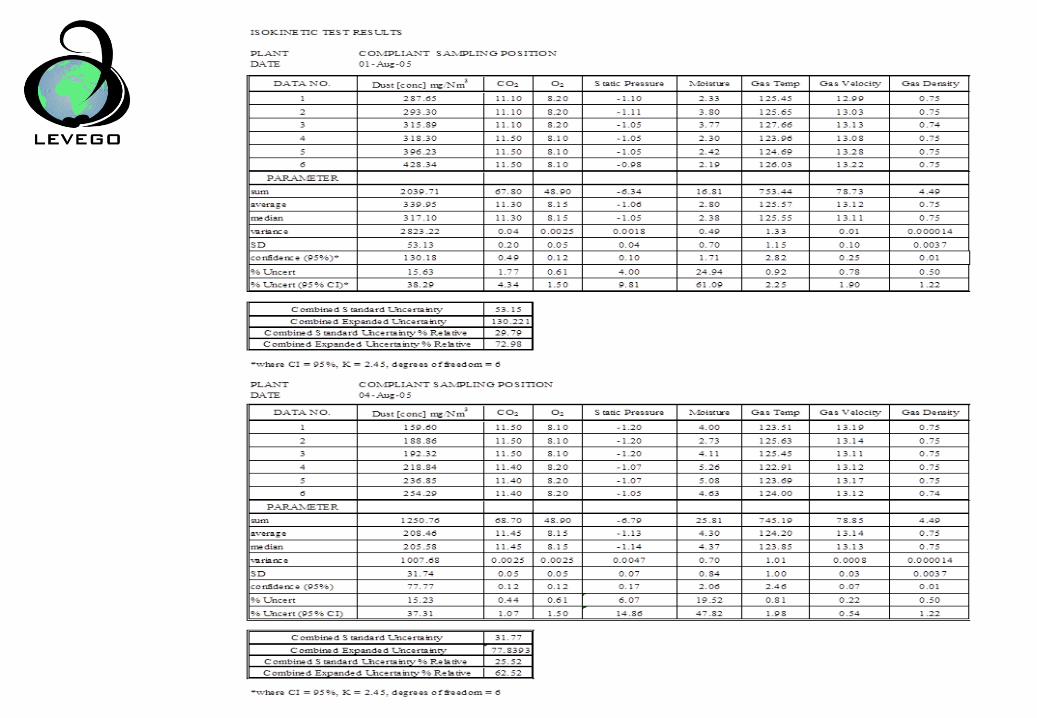
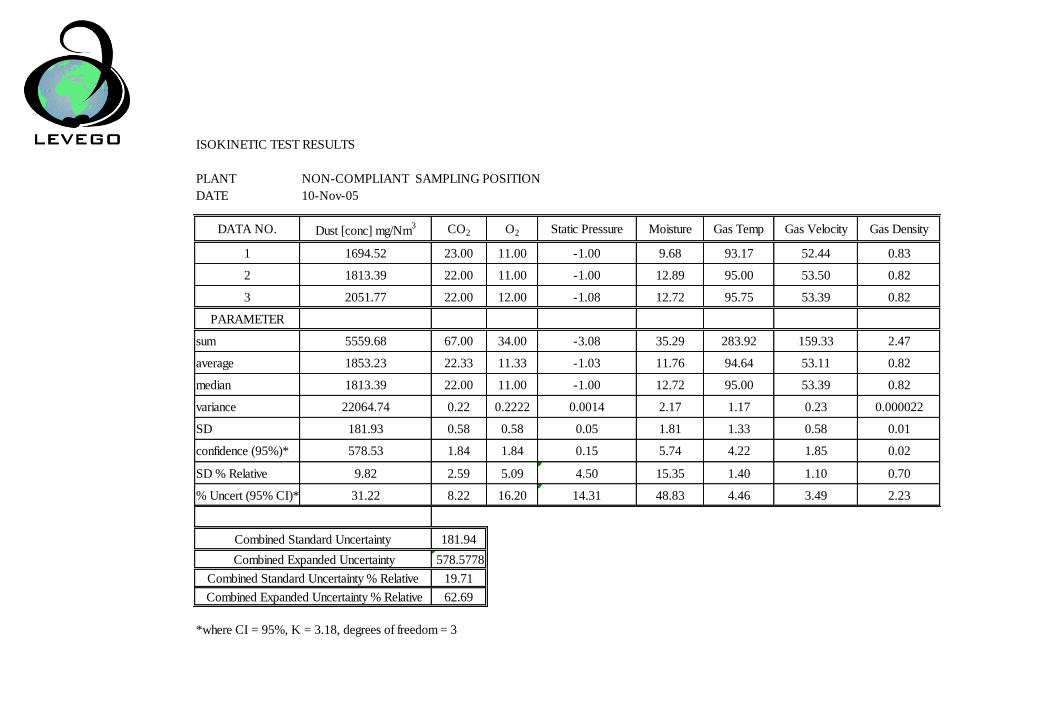
ISOKINETIC TEST RESULTS
PLANT NON-COMPLIANT SAMPLING POSITION
DATE 10-Nov-05
DATA NO. Dust [conc] mg/Nm3 CO2 O2 Static Pressure Moisture Gas Temp Gas Velocity Gas Density
1 1694.52 23.00 11.00 -1.00 9.68 93.17 52.44 0.83
2 1813.39 22.00 11.00 -1.00 12.89 95.00 53.50 0.82
3 2051.77 22.00 12.00 -1.08 12.72 95.75 53.39 0.82
PARAMETER
sum 5559.68 67.00 34.00 -3.08 35.29 283.92 159.33 2.47
average 1853.23 22.33 11.33 -1.03 11.76 94.64 53.11 0.82
median 1813.39 22.00 11.00 -1.00 12.72 95.00 53.39 0.82
variance 22064.74 0.22 0.2222 0.0014 2.17 1.17 0.23 0.000022
SD 181.93 0.58 0.58 0.05 1.81 1.33 0.58 0.01
confidence (95%)* 578.53 1.84 1.84 0.15 5.74 4.22 1.85 0.02
SD % Relative 9.82 2.59 5.09 4.50 15.35 1.40 1.10 0.70
% Uncert (95% CI)* 31.22 8.22 16.20 14.31 48.83 4.46 3.49 2.23
Combined Standard Uncertainty 181.94
Combined Expanded Uncertainty 578.5778
Combined Standard Uncertainty % Relative 19.71
Combined Expanded Uncertainty % Relative 62.69
*where CI = 95%, K = 3.18, degrees of freedom = 3
Combined / expanded
uncertainty
If one compares the calculated overall
uncertainties for the Tables, one would
notice that the non-compliant data set
returns a similar overall uncertainty (62.69%
RSD @ 95% LOC) when compared to the
compliant stack (62.52-72.98% RSD @ 95%
LOC).
Combined / expanded
uncertainty
The data were deemed to be of a normal
distribution. Due to a lack of sufficient data,
this is assumed to be the case and could
not be statistically verified.
Combined / expanded
uncertainty
The overall uncertainty is also much higher
than anticipated; this once again is mainly
attributed to the small data sets utilized and
the number of external/random variables
that cannot be accounted for (i.e.
fluctuating process operating conditions,
changes in environmental conditions etc.)
Combined / expanded
uncertainty
An estimate of the overall uncertainty was
attempted but the results were not
conclusive as not enough data were
obtained to enable any valid statistical
inferences to be made.
Sampling Suitability Matrix
Alternative tool developed to assess data
quality
Developed due to lack of data and high
uncertainties
Based on adherence to the requirements of
the method
Qualitative in nature but allows regulator
and process operator to assess how
reliable reported data is.
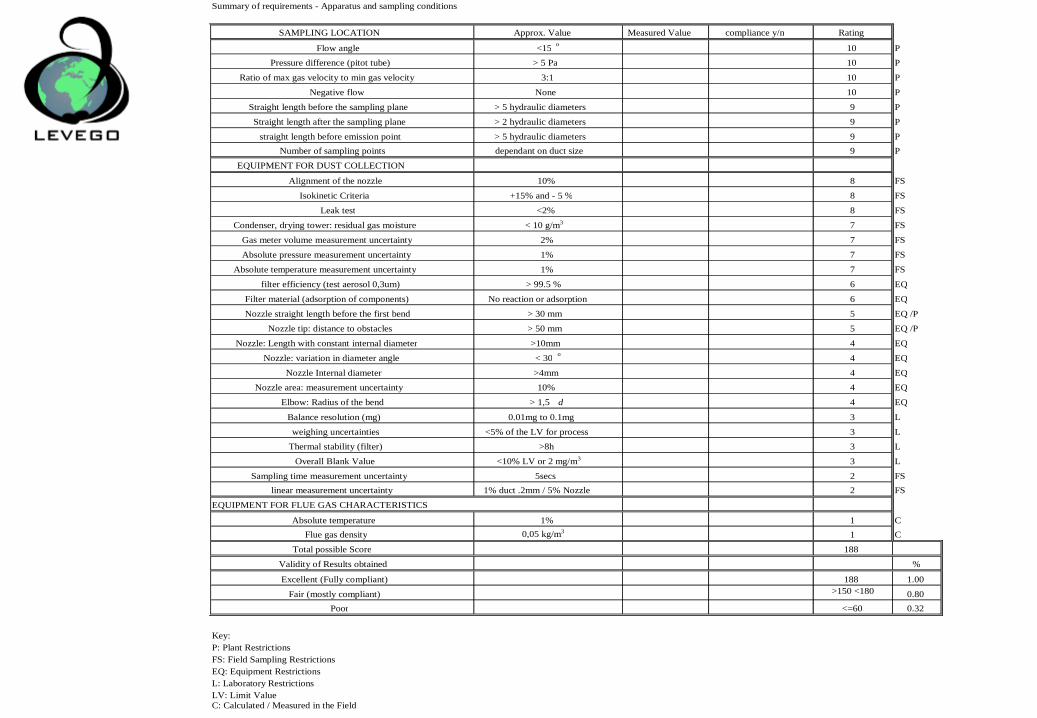
Summary of requirements - Apparatus and sampling conditions
SAMPLING LOCATION Approx. Value Measured Value compliance y/n Rating Flow angle <15 o
10 P Pressure difference (pitot tube) > 5 Pa 10 P
Ratio of max gas velocity to min gas velocity 3:1 10 P Negative flow None 10 P
Straight length before the sampling plane > 5 hydraulic diameters 9 P Straight length after the sampling plane > 2 hydraulic diameters 9 P
straight length before emission point > 5 hydraulic diameters 9 P Number of sampling points dependant on duct size 9 P
EQUIPMENT FOR DUST COLLECTION Alignment of the nozzle 10% 8 FS
Isokinetic Criteria +15% and - 5 % 8 FS Leak test <2% 8 FS
Condenser, drying tower: residual gas moisture < 10 g/m3 7 FS Gas meter volume measurement uncertainty 2% 7 FS Absolute pressure measurement uncertainty 1% 7 FS
Absolute temperature measurement uncertainty 1% 7 FS filter efficiency (test aerosol 0,3um) > 99.5 % 6 EQ
Filter material (adsorption of components) No reaction or adsorption 6 EQ Nozzle straight length before the first bend > 30 mm 5 EQ /P
Nozzle tip: distance to obstacles > 50 mm 5 EQ /P Nozzle: Length with constant internal diameter >10mm 4 EQ
Nozzle: variation in diameter angle < 30 o 4 EQ
Nozzle Internal diameter >4mm 4 EQ Nozzle area: measurement uncertainty 10% 4 EQ
Elbow: Radius of the bend > 1,5 d 4 EQ Balance resolution (mg) 0.01mg to 0.1mg 3 L weighing uncertainties <5% of the LV for process 3 L
Thermal stability (filter) >8h 3 L Overall Blank Value <10% LV or 2 mg/m3 3 L
Sampling time measurement uncertainty 5secs 2 FS linear measurement uncertainty 1% duct .2mm / 5% Nozzle 2 FS
EQUIPMENT FOR FLUE GAS CHARACTERISTICS Absolute temperature 1% 1 C
Flue gas density 0,05 kg/m3 1 C Total possible Score 188
Validity of Results obtained % Excellent (Fully compliant) 188 1.00
Fair (mostly compliant) >150 <180 0.80 Poor <=60 0.32
Key: P: Plant Restrictions FS: Field Sampling Restrictions EQ: Equipment Restrictions L: Laboratory Restrictions LV: Limit Value
C: Calculated / Measured in the Field
Discussion
Tabulated data is divided broadly into three
groups namely:
– Plant restrictions
– Field sampling restrictions
– Equipment restrictions
– Laboratory restrictions
Discussion
Divided into groups as per the rating that
corresponds with the control or lack thereof of the
sampling technician to control these variables
The less direct control the higher the rating and
therefore the more if not complied with the more
potentially unreliable the reported results would be
Summary and Conclusions
Although subjective and semi-quantitative in
nature the matrix will provide invaluable
supplementary information in lieu of
comprehensive uncertainty data
The matrix will allow the regulator and the plant
operator to make more informed decisions about
the reliability of the emission results reported.