Embed Size (px)
Citation preview

American Journal of Economics 2014, 4(1): 34-51 DOI: 10.5923/j.economics.20140401.04
An Empirical Analysis on the Influence of Economic and Non-Economic Factors in Assessment of Land Value
Hemalatha Ramakrishnan
Management, Christ University Institute of Management, Christ University, Bangalore, 560 060, India
Abstract A cross investigation was carried out to find the value of land and source of possession of land. Empirical investigation was carried out to find the extent of economic and non-economic factors that has influenced for possession of land. Ownership and possession of land by sample investigation have revealed that samples are prudent in estimating the value of land in comparison with cost of possession. In this sequence the study felt the need to find what is the awareness level of the development authority among samples, number of attempts made to acquire plot of land of various dimensions. Which are main sources that the land has been gained and how do the respondents assess the land value. Information from study location reveals that there is outstanding appreciation of land value with decades of variation in land value.
Keywords Source of land, Economic factors, Non-economic factors, Land value
1. Introduction In continuation from Part I on land acquisition by the
development authority the researcher has attempted to cross examine the awareness and value of land associated with possession. Again based on the selected economic and non-economic factors influence of the location has been analyzed. This paper will present the study area namely Banaswadi that has been selected on random basis for enquiry. This location is chosen in order to examine the Bangalore Development Authority as an quasi government undertaking in supplying land for settlement purposes. Banaswadi is identified in the Bangalore city as a separate district for planned development. It is located in the Eastern region of Bangalore. Although it is a residential colony but the place is famous for Veeranjanaya temple. Almost all family group in this area are well settled with mix of various cultures. Majority of the population is telugu speaking as well other linguist mixed like kannada, Tamil, Hindi and Marwadi. There are two post offices and 8 banks mostly nationalized functioning in this locality with aeasy access of ATM facility. Many hospitals like Gensis, Satya Sai Hospital, Narayana maternity Hospital, Banaswadi Hospital. are working 24/7 and help the emergence patients. Many choultry’s and clubs are there l ike HRBR club, KodandaRana and Ramanjaneya, SSR kalyana Mantapa, Many schools and colleges have come up in order to facilitate attractive centre of education .Health care centre
* Corresponding author: [email protected] (Hemalatha Ramakrishnan) Published online at http://journal.sapub.org/economics Copyright © 2014 Scientific & Academic Publishing. All Rights Reserved
like VLCC and gyms have also been started. Good parks and play grounds have been designed and built in order to motivate games for children and for recreation and easy walk exercises. Banaswadi has three adjustacent local railway stations connecting to city as well to other cities from KRPuram, Cantonment and Byapanahalli about 20km from city railway station and there is a main or central bus stand called Banaswadi bus station. The airport is located at the distance of about 12kms from Banaswadi. The area has three major concentrated locations like HRBR layout, Kammanahalli, Ramamurthy Nagar and main developing areas like Heenur, Hebbal, Doddabanaswadi, chikkabanaswadi, Kasthuri Nagar, ITC. For convenience and for easy cross interaction and to know the progress of the area the study has been conducted selecting 150 samples. In order to collect the information about the price of land and various other non-economic factors that has influenced the localities to settle. There are few selected issues taken into account in order to make the analysis of the study pertaining to Bangalore Development Authority. The issues taken into account are like general profile of the samples have been taken into consideration, year of purchase of land, value at which the site was purchased, in the built site whether only owner occupies or is the house rented out or whether the owner and tenant are occupying. Reason for not renting out the building, and source through which site was gained and familiarity of the Bangalore Development Authority among the samples.
2. Methodology The methodology adopted in the study is systematically
planned in identifying the wards listed based on the

American Journal of Economics 2014, 4(1): 34-51 35
Bangalore Mahanagara Palike administrative set up officially recorded and published. Out of 100 wards research decided to locate Banaswadi location and decided for convenience sampling based on random selection of sample households those who have acquired land from BDA. With drafted structured questionnaire a pilot survey was conducted to collect the sample response. Subsequently, study had administered the structured questions with a sample size of 150 out of 300 households. In order to calculate the mean value of land under different directions in comparison with the study location two way ANOVA method was applied. This statistical tool was used to find the extent of rise in land value among various directions and study location. Based on the information gathered with clear demarcated sections of questionnaire analysis is discussed as follows:
3. General Profile of the Sample Households
Table 1 reveals the details about the age wise distribution of sample. As shown by the table we have found maximum and minimum age groups from 80 years to 40 years. The study found very interesting to gather maximum information from age group of middle age level all those who are working as businessman, contractors, retired employees, employees from private enterprises and still many others. It can be inferred from the table that maximum number of respondents are in the age group of 50 to 60 years contributing 46% of information. While in the age groups of 40-50 years there were 40% samples have contributed to the schedule information. In the third group nearly 10.6% constitute where 16 sample fall into this category of age while in the last age group 70-80 nearly 3.3% of the information has been shared to the total sample household.
Table 1. Age wise distribution of Households
S.No Age No. of respondents Percentage
1 40-50 60 40.0 2 50-60 69 46.0 3 60-70 16 10.6 4 70-80 5 3.3 Total 150 100.0
Source: Primary data collected from the structured schedule
Table 2 explains the educational qualification of the sample households. The qualification level of the households exhibits variation in the degree level. The entire sample group has been grouped into four level of education degree. Starting from below graduation, graduation, post graduation and Professional degree gained. From the above table it can be inferred that maximum respondents are graduates that is 69% responses constituting 46% to the total sample of the study. While below graduation there are 35 respondents contributing 23% of their information. In the Post graduate and Professional degree there were 31 respondents and 15 responses accounting 20.67% and 10% to the total. Each of the above grouped sample have been unique in their information.
Table 2. Details of Educational Qualification of Sample Households
S.No Degree No. of respondents Percentage 1 Below graduate 35 23.33 2 Graduate 69 46 3 Post Graduate 31 20.67 4 Professional 15 10 Total 150 100
Source: Primary data collected from structured schedule
Table 3 expalins the occupational details of sample Households. During the interview we found a mix of various people of different designation and occupation. For better understanding the responses were classified and grouped in to different categories. Maximum respondents were businessman running catering at samll scale, flower merchants, builders, contractors, pharmacy. Based on the qualification and preofession main variety of employees that was found were mainly services like teachers, doctors, auyrvedic doctors, safety officers, police, driver, government employee like bankers, railway employees,accountants and semi government employees like HAL employee, ITI employee, BEML employee, supervisors. Manufactureers are like sweets manufactureres, plastics, oil and medicines In the others category we have all retired employees from government and ex-service man and VRS employees. When we look into businessman some are tiles business, mobile business, personal finance, real estate, provision shops and supermarket. From the table it shows that maximum number of respondents were businessman with 67 in number
60 6916 5
40 4610.6 3.3
40-50 50-60 60-70 70-80
Age wise distributionNo. of respondents Percentage
3569
31 1523.33 4620.67 10
Below graduate Graduate Post GraduateProfessional
Educational qualification of Sample Households
No. of respondents Percentage

36 Hemalatha Ramakrishnan: An Empirical Analysis on the Influence of Economic and Non-Economic Factors in Assessment of Land Value
accounting to 44.67%. Secondly, under services there were 2 respondents that is 21.33%. Numbe of government employees were 22 in number that is 14.67% to the a total sample size and in manufacturing there were about 2.67% and lastly in the others category we have about 9.33%.
Table 3. Occupational details of Sample Households
S.No. Designation No. of respondents Percentage
1 Business 67 44.67 2 Professional 11 7.33 3 Services 32 21.33 4 Government employee 22 14.67 5 Manufacturing 4 2.67 6 Others 14 9.33 Total 150 100
Source: Primary data collected from structured schedule
Table 4 shows the family type of household. Out of total sample data collected through questionnaire the study has found that nearly 90 responses were living in joint family system with members of more than 7 and there is minimum of 2 members of 25 years of age and this adds more to income for the family and with minimum of two grand children, on the other side 60 responses were living of nucleus family type making 40% to the total. Out of these two type of family set up even though the head of family are combination of retired employees and mix of business this has helped the group to accumulate wealth in terms of land holdings. as well in sites in different areas of Bangalore .
Table 4. Family type of Sample Households
S.No. Type No.of respondents Percentage 1 Nucleus 60 40 2 Joint 90 60 3 Total 150 100
Source: Primary data collected from structured schedule
Table 5 reveals that nearly 89% of the respondents were holding land of various dimensions other than the land being possessed during the current study period. And about 61% of the respondents were not possessing any land in Bangalore. In this most of them were owning other than land of development authority in their respective home towns. These samples were getting produce from their field of cultivation and have not much depending on the local supply of provisions like coconuts and greeny vegetables.
Table 5. Holdings of land by Sample Households
S.No. Land Holdings No. of respondents Percentage
1 Not owning any holdings 61 40.67 2 Holds land 89 59.33 Total 150 100
Source: primary data collected from structured schedule
4. Economic Factors that has Influenced the Sample Households
Table 6 reveals out of the total 150 respondents 89 of them do possess land. 6 of them possess 10 acres and above. This sample have inherited from ancestors but had put them for agricultural use Although it has been inferred from the previous table that nearly 89% of the respondents are holding land. In this we can say that maximum of 30 respondents
67
11
3222
414
44.67
7.33
21.3314.67
2.679.33
Occupation of Sample Household
No. of respondents Percentage
6040
9060
No.of respondents Percentage
Family type of sample Households
Nucleus Joint
6140.67
8959.33
No. of respondents Percentage
Holdings of land by Sample Households
Not owning any holdings Holds land

American Journal of Economics 2014, 4(1): 34-51 37
come under the large group of well of family as per the study. When we take samples holding land to the range of 1 to 2 acres 30 samples do own in their homeland. Most of the respondents do possess in their homeland as well own farm house. Secondly nearly 25 respondents do own 2 to 3 acres of land accounting to 28% to the total sample size. Between 4 to
7 acres 3 respondents and 15 of them do own 7 to 8 acres of land that leads to 16% to the total. Hence it can be inferred that these samples have been well informative knew the procedures and could predict the value system very well. When we say value the market forecasts on growth of value of land.
Table 6. Land possessed by Sample Households
S.No. Range in acres No. of respondents Percentage
1 <1 8 8.99
2 1 to 2 30 33.71
3 2 to 3 25 28.09
4 3 to 4 2 2.25
5 4 to 5 1 1.12
6 5 to 6 1 1.12
7 6 to 7 1 1.12
8 7 to 8 15 16.85
9 8 to 9 0 0.00
10 9 to 10 0 0.00
11 10 and above 6 6.74
Total 89 100
Source: Primary data collected from structured schedule
Table 7 reveals the range of income of the sample. It was found that minimum and maximum income range varies from less than Rs.1lakh to more than Rs.5lakhs.Out of this 6% group fall below Rs.1lakh. A high sample of 52 of them fall in the income range of Rs.1 to Rs.2lakhs. Secondly 43 samples fall in the income bracket of Rs.2lakhs to Rs.3 lakhs. Within income range of Rs.3lakhs to Rs.4lakhs nearly 23 sample have been earning the third highest group. Here we can observe that as income range increases there is fall in the number of samples based on the profession of the sample. However on the two extremes of the income group of less than Rs.1lakh and greater than Rs.5lakh has been the same One is extreme high income group and on the other side there are households earning low income.
8
30
25
2 1 1 1
15
68.99
33.71
28.09
2.25 1.12 1.12 1.12
16.85
6.74
<1 1 to 2 2 to 3 3 to 4 4 to 5 5 to 6 6 to 7 7 to 8 10 and above
Land Possessed by Sample HouseholdsNo. of respondents Percentage

38 Hemalatha Ramakrishnan: An Empirical Analysis on the Influence of Economic and Non-Economic Factors in Assessment of Land Value
Table 7. Annual Income of the Sample Households
S.No Range of Income No of respondents Percentage
1 < 1,00,000 9 6 2 1,00,000 – 2,00,000 52 35 3 2,00,000 – 3,10,000 43 29 4 3,00,000 – 4,00,000 23 15 5 4,00,000 – 5,00,000 14 9 6 >5,00,000 9 6 Total 150 100
Source: Primary data collected from the structured schedule
Table 8 explains the general details of owning a site either within the city or outside the city. For this the study has found that 93 samples do have a site while 57 of them do not own a site. This goes to say that maximum of older residents have been able to acquire when there was good opportunity. Whereas rest of the sample those who do not own site were of the view that due to non-avaialbaility of excess income and delay in allocation was the cause and most of them never knew the procedure to appraoch and ultimately they have not been able to own a piece of site neither from revenue the local land department nor from the recognized agent like Bangalore. Development Authority.
Table 8. Details about the site owned by the sample
S.No Site No.of respondents Percentage
1 Owns 93 62 2 Does not own 57 38 3 Total 150 100
Source: Primary data collected from structured schedule
Table 9 explains about the preference about constructing a house from the site that has been gained. When asked the sample whether they would utilize the site for their own purpose of building a house or speculate for a high return. To this 12 respondents said that they would like to dispose for a good return while others were of the view that they would like build to raise house that would fetch in extra income
Until the siblings and their children grew up and could avail credit facility. Thus the sample of varied views have been known look at various ways expecting a higher returns. Majority of them feel that even with available site, they have an option of earning income through construction either for a commercial purpose or even build multi storey residences that is of high demand in this vicinity.
Table 9. Preference to own House
S.No Choice No. of respondents Percentage
1 Preference to own 81 87
2 Not preferred 12 13 Total 93 100
Source: Primary data collected from structured schedule
9
5243
2314
96
3529
159 6
< 1,00,000 1,00,000 –2,00,000
2,00,000 –3,10,000
3,00,000 –4,00,000
4,00,000 –5,00,000
>5,00,000
Range of Income No of respondents Percentage
81 8712 13
No. of respondents Percentage
Preference to own House
Preference to own Not preferred

American Journal of Economics 2014, 4(1): 34-51 39
Table 10 explains about the awareness of Bangalore Development Authority among sample Households. When enquired about the awareness of the Bangalore Development Authority out of total sample size the response from both the sides were equal to the level of 77 to 73 in number. But here when we analyze we may not come to conclusion that 77 totally are not aware about the government agency it is all the delay process and the gap in allocating the site that made them to turn a negative response. However except who were unable to acquire any property were responding as not aware. And they were of the view about the gap and allocation with respect to non-dependency of such an agency It takes long time to go and allotment could be in a far of boundary of city periphery that take many years together to be recognized within the city limit. either as corporation or within Municipal limit.
Table 10. Awareness of Sample Household about Bangalore Development Authority
S.No. Awareness No. of respondents Percentage
1 Aware 73 48.67
2 Not aware 77 51.33
Total 150 100
Source: Primary data collected from structured schedule
Table 11 reveals the number of samples owning site from the Bangalore Development Authority. It was found that nearly 101 samples have purchased sites from BDA during various years (can be referred in the table 5:14 below with land value added) that accounts to 67% while rest of the 49% of respondents do not own any site but however do possess a marginal land minimum of 0.5 acres not in city but in their home place as well in undeveloped areas. And the general dependence on the part of these respondents is the desire to own land but with sharp rise in land prices does not afford them at the current period and also do rely on the Bangalore Development Authority the only constraint is delay and
waiting time and also in spite of paying the first allotment they have not been able to gain any site.
Table 11. Details of Number of Samples owning site from BDA
S.No Site No. of respondents Percentage
1 Owns 101 67.33 2 Does not own 49 32.67 Total 150 100
Source: Primary data collected from structured schedule
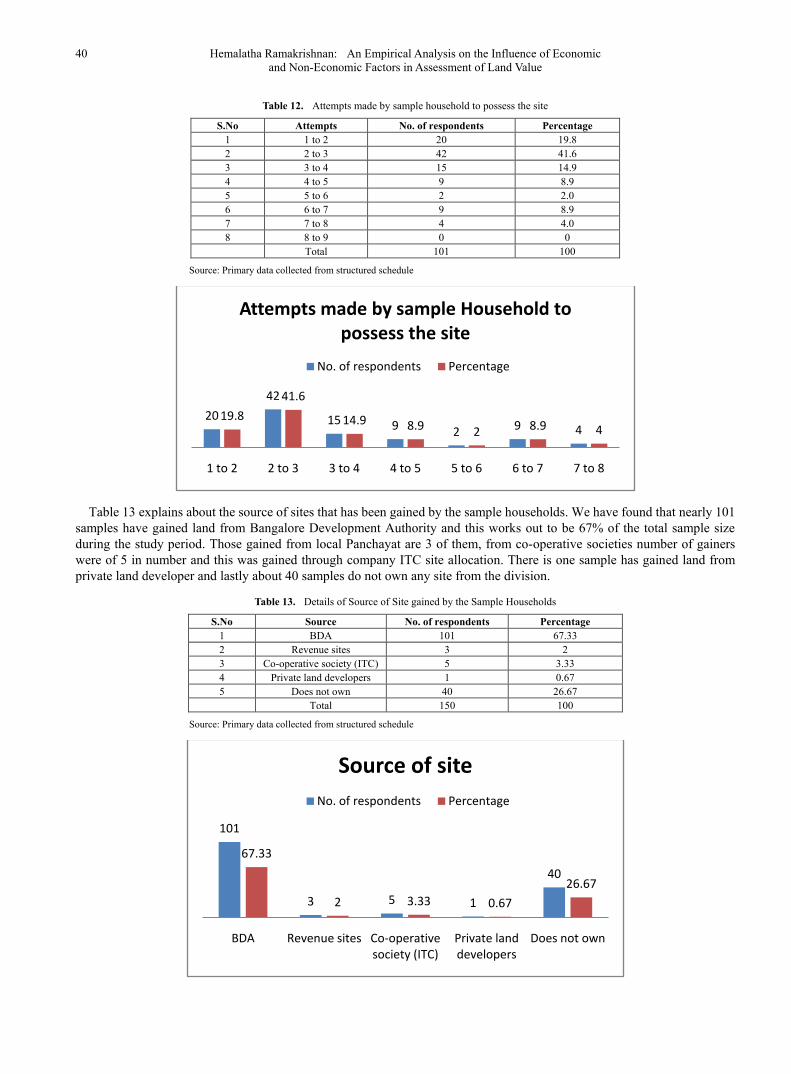
Table 12 explains the details of sample households the number of attempts made to possess the site. Now let us analyze the delays and number of attempts each of the grouped samples have undergone in the formal procedures. Out of 101 samples we have investigated the attempts range and delays that they have faced ranges from minimum of 1 to 2 and 7 to 8. The reason that was shared while collecting data through questionnaire is red tapism, registration procedures, no proper guidance, bank formalities, increase in problem of hidden cost, commission charges, finance problem increase in price of sq ft, title verification, brokers demand and formalities. These were all the causes and obstacles experienced in the process of gaining a site. Out of 101 samples nearly 20 samples have been able to gain within 1-2 attempts that is 19.8%, Maximum number of samples that is 42 samples that is accounting to 41.6% had to face with lot of difficulties while with 3-4 attempts there were 15 samples, and in 4-5 attempts 9 samples, in 5-6 attempts there were 2 samples, 6-7 attempts there were 9 samples and finally in 7-8 attempts there were 4 samples had to wait long in order to gain a site from the Bangalore Development Authority. The latter part of sample household had to struggle because they had not fulfilled the criteria of citizenship even as an Indian. Reason they were from neighboring states and from Northern part of India who had not completed the citizenship in Karnataka.
7348.67
7751.33
No. of respondents Percentage
Awareness about Bangalore Development Authority
among sample Households
Aware Not aware
101
67.3349
32.67
No. of respondents %
Number of samples owning site from Bangalore
Development Authority
Owns Does not own
40 Hemalatha Ramakrishnan: An Empirical Analysis on the Influence of Economic and Non-Economic Factors in Assessment of Land Value
Table 12. Attempts made by sample household to possess the site
S.No Attempts No. of respondents Percentage 1 1 to 2 20 19.8 2 2 to 3 42 41.6 3 3 to 4 15 14.9 4 4 to 5 9 8.9 5 5 to 6 2 2.0 6 6 to 7 9 8.9 7 7 to 8 4 4.0 8 8 to 9 0 0 Total 101 100
Source: Primary data collected from structured schedule
Table 13 explains about the source of sites that has been gained by the sample households. We have found that nearly 101 samples have gained land from Bangalore Development Authority and this works out to be 67% of the total sample size during the study period. Those gained from local Panchayat are 3 of them, from co-operative societies number of gainers were of 5 in number and this was gained through company ITC site allocation. There is one sample has gained land from private land developer and lastly about 40 samples do not own any site from the division.
Table 13. Details of Source of Site gained by the Sample Households
S.No Source No. of respondents Percentage 1 BDA 101 67.33 2 Revenue sites 3 2 3 Co-operative society (ITC) 5 3.33 4 Private land developers 1 0.67 5 Does not own 40 26.67 Total 150 100
Source: Primary data collected from structured schedule
20
42
15 9 2 9 419.8
41.6
14.9 8.9 2 8.9 4
1 to 2 2 to 3 3 to 4 4 to 5 5 to 6 6 to 7 7 to 8
Attempts made by sample Household to possess the site
No. of respondents Percentage
101
3 5 1
40
67.33
2 3.33 0.67
26.67
BDA Revenue sites Co-operative society (ITC)
Private land developers
Does not own
Source of site No. of respondents Percentage

American Journal of Economics 2014, 4(1): 34-51 41
Table 14 shows the details about the site purchased by the sample household from Bangalore Development Authority. This table reveals that the sample Household were settled during various years. Most of the land were purchased through local development authority and the sequence of owning land starts from 1963 onwards and correspondingly the value is also mentioned. It can be inferred that the average percentage to total sample of land purchased is showing a slow rise of 1% in the 1970, 5% in 1980 and in 1983 there is a rise of 10% in the year 1986 and in 1988 has come down to 9% and in 1989 further has come down to 5%. During the year 1991 there has been a sharp rise of 15% with 17 samples have purchased land at a higher rate. In the year 1992 there has been fall of 10 samples with 9% ownership of
gaining the land thereafter the steadyness in the purchase of land has come down even though during successive years the respondents have purchased the land but ultimate settlement has become lesser .The reason to be noted is the residents have gained the land earlier but in terms of settlement they have built up and conveniently settled up to the year 2004 and the rest of the owners those who have purchased from other agents other than the Bangalore Development Authority have also settled during 1998 and 2003. Hence we can say there a high awareness on the part of the samples interacted and based on the allocation done during the earlier years that they feel they have been able to benefit from the Bangalore Development Authority.
Table 14. Details about the site purchased by the sample Households and cost per square foot
S.No Purchased No. of respondents Percentage Cost/Sq ft Percentage
1 1963 1 0.9 5 - 2 1970 2 1.8 100 95 3 1980 6 5.5 120 36.7 4 1983 10 9.1 200 140 5 1985 2 1.8 200 100 6 1986 12 10.9 650 619.2 7 1988 9 8.2 1200 1145.8 8 1989 6 5.5 1300 1207.7 9 1991 17 15.5 1600 1518.8 10 1992 10 9.1 1800 1711.1 11 1993 9 8.2 1200 1050 12 1997 5 4.5 1200 1100 13 1999 8 7.3 1500 1420 14 2000 9 8.2 1600 1506.3 15 2003 3 2.7 1900 1815.8 16 2004 1 0.9 2300 2217.4
Total 110 100
Source: Primary data collected from structured schedule
1 2
6
10
2
129
6
17
10 9
58 9
31
1 2 3 4 5 6 7 8 9 10 11 12 13 14 15 16
No. of samples purchased site during different years
No. of respondents Percentage

42 Hemalatha Ramakrishnan: An Empirical Analysis on the Influence of Economic and Non-Economic Factors in Assessment of Land Value
In value terms we can infer from the table that there has been a spectacular rise in the cost of land paid during various years. There is a rise of more than 2000% the cost that was paid in the year 1963 was only Rs.5 whereas in the successive years with lot of awareness and as well the interference of middlemen that the land market has become very costlier. The view of the respondent is that due to gap in allotment and supply gets crunched and delayed and as well there was impatience on the part of the citizens to follow the regulated market. Otherwise due to industrial dominance and payment of high bonus paid for overtime more than the regulated time has also influenced the people to procure and sell on first come basis. Moreover the area was well recognized and got the approval of City Municipal corporation, City Improvement Trust Board and division conversion and Bangalore Development Authority of latest. These factors have influenced the people of this locality to settle very quickly. So we can say that the value has been shooting up with not less than 100%. Every successive year minimum of 120% to 325 % there is appreciation of land value. Also the areas is dominant by inherited rich classes community who have been well dominant in bargaining and affordability in acquiring the land. So when we come across and examined the regular price is a rational price while the potential price is always higher than the regulated price. The variation can be seen from the table that actual price is during the initial period let us assume the actual price is Rs.300 and from this deviation is almost very high. When we see the table we can find the percentage growth in the value price for land is Rs. 650 from 1988 onwards. Thereafter every successive years there is growth percentage of Rs.2217 per sq ft. So, there is a manifold increase of two thousand percentage in the value of land of more from 95% in the year 1965 to 2217% in the year 2004.
Table 15. Source of Finance details of the sample Households
S.No Finance to own land
No. of respondents Percentage
1 Family income 44 40 2 Savings 25 22.7 3 Private finance 19 17.3 4 Mortgage 21 19.1 5 credit card 1 0.9 Total 110 100
Source: Primary data collected from structured schedule
Table 15 explains about the details of the source of finance of the sample Households. To purchase site the flow of finance from various sources were from family income, savings , private finance, mortgage and credit card. Majority of the samples have been comfortable in possessing the site. Nearly 44 plus 25 of the samples have been able to purchase with their family income plus savings that have been accumulated. This accounts to 40% and 22.7% respectively. Nearly 19 households have taken loan from private financiers and banker at the interest rate of 10% that accounts
95 36.7 140 100
619.2
1145.81207.7
1518.81711.1
1050 1100
1420 1506.3
1815.8
2217.4
1 2 3 4 5 6 7 8 9 10 11 12 13 14 15
Value of site during various yearsCost/Sq ft 5 Percentage -
4425 19 21
1
4022.7 17.3 19.1
0.9
Family income
Savings Private finance
Mortgage credit card
Source of finance of sample Household No. of respondents Percentage
American Journal of Economics 2014, 4(1): 34-51 43
to 17% of the borrowers. Pledging and mortgaging their assets like gold and bonds with banks and other co-operative banks could borrow at the interest rate of 5%. Some of them have taken finance assistance from family friends, society loan like partially borrowed at varied interest rate defined for every Rs.100. Also a single respondent has borrowed on credit card from a MNC bank at a cumulative interest rate. Hence we can say that the respondents have been putting hard effort in order to gain a site in flourishing city, all goes without saying that the sample household have been positive enough that with a hope they have been able to estimate the potential value and as well expect good appreciation.
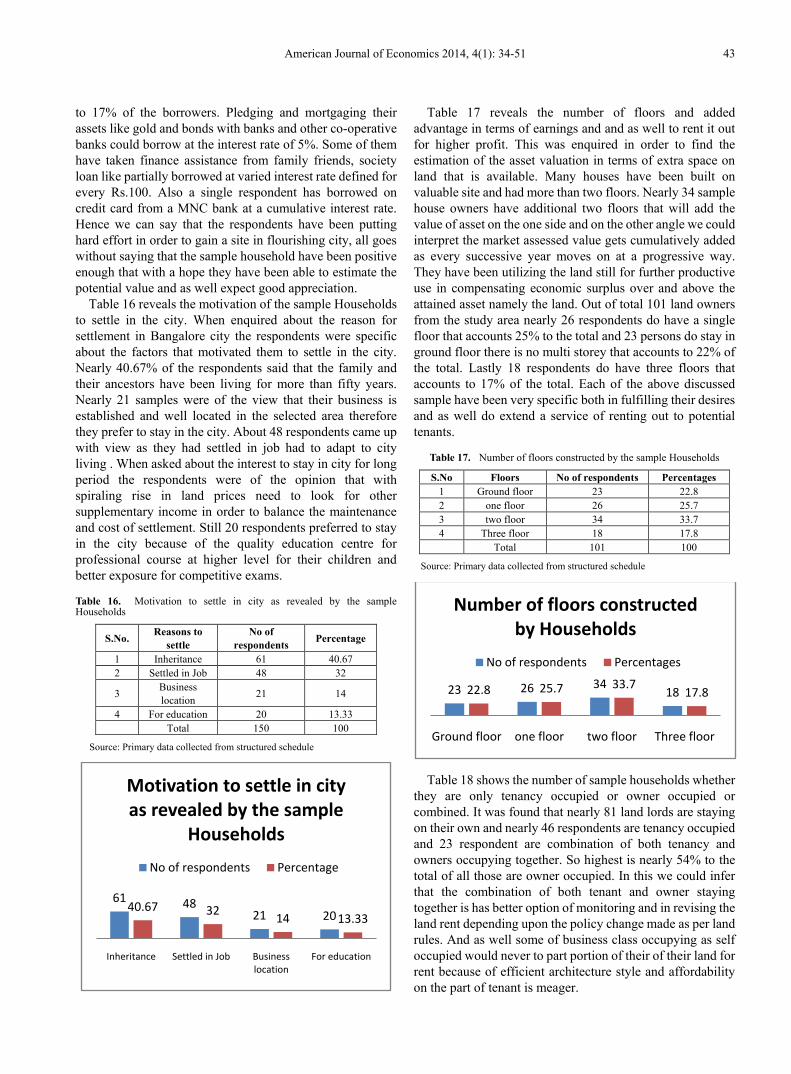
Table 16 reveals the motivation of the sample Households to settle in the city. When enquired about the reason for settlement in Bangalore city the respondents were specific about the factors that motivated them to settle in the city. Nearly 40.67% of the respondents said that the family and their ancestors have been living for more than fifty years. Nearly 21 samples were of the view that their business is established and well located in the selected area therefore they prefer to stay in the city. About 48 respondents came up with view as they had settled in job had to adapt to city living . When asked about the interest to stay in city for long period the respondents were of the opinion that with spiraling rise in land prices need to look for other supplementary income in order to balance the maintenance and cost of settlement. Still 20 respondents preferred to stay in the city because of the quality education centre for professional course at higher level for their children and better exposure for competitive exams.
Table 16. Motivation to settle in city as revealed by the sample Households
S.No. Reasons to settle
No of respondents Percentage
1 Inheritance 61 40.67 2 Settled in Job 48 32
3 Business location 21 14
4 For education 20 13.33 Total 150 100
Source: Primary data collected from structured schedule
Table 17 reveals the number of floors and added advantage in terms of earnings and and as well to rent it out for higher profit. This was enquired in order to find the estimation of the asset valuation in terms of extra space on land that is available. Many houses have been built on valuable site and had more than two floors. Nearly 34 sample house owners have additional two floors that will add the value of asset on the one side and on the other angle we could interpret the market assessed value gets cumulatively added as every successive year moves on at a progressive way. They have been utilizing the land still for further productive use in compensating economic surplus over and above the attained asset namely the land. Out of total 101 land owners from the study area nearly 26 respondents do have a single floor that accounts 25% to the total and 23 persons do stay in ground floor there is no multi storey that accounts to 22% of the total. Lastly 18 respondents do have three floors that accounts to 17% of the total. Each of the above discussed sample have been very specific both in fulfilling their desires and as well do extend a service of renting out to potential tenants.
Table 17. Number of floors constructed by the sample Households
S.No Floors No of respondents Percentages 1 Ground floor 23 22.8 2 one floor 26 25.7 3 two floor 34 33.7 4 Three floor 18 17.8 Total 101 100
Source: Primary data collected from structured schedule
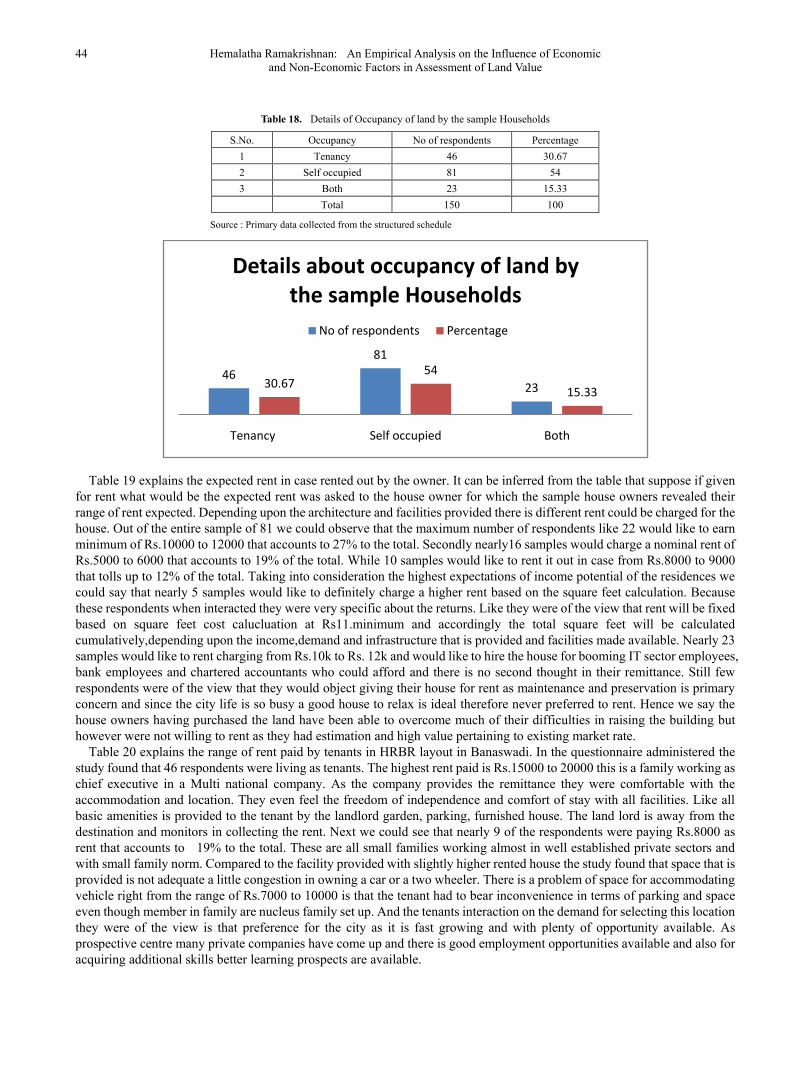
Table 18 shows the number of sample households whether they are only tenancy occupied or owner occupied or combined. It was found that nearly 81 land lords are staying on their own and nearly 46 respondents are tenancy occupied and 23 respondent are combination of both tenancy and owners occupying together. So highest is nearly 54% to the total of all those are owner occupied. In this we could infer that the combination of both tenant and owner staying together is has better option of monitoring and in revising the land rent depending upon the policy change made as per land rules. And as well some of business class occupying as self occupied would never to part portion of their of their land for rent because of efficient architecture style and affordability on the part of tenant is meager.
61 4821 20
40.67 3214 13.33
Inheritance Settled in Job Business location
For education
Motivation to settle in city as revealed by the sample
Households
No of respondents Percentage
23 26 341822.8 25.7 33.7
17.8
Ground floor one floor two floor Three floor
Number of floors constructed by Households
No of respondents Percentages
44 Hemalatha Ramakrishnan: An Empirical Analysis on the Influence of Economic and Non-Economic Factors in Assessment of Land Value
Table 18. Details of Occupancy of land by the sample Households
S.No. Occupancy No of respondents Percentage 1 Tenancy 46 30.67 2 Self occupied 81 54 3 Both 23 15.33 Total 150 100
Source : Primary data collected from the structured schedule
Table 19 explains the expected rent in case rented out by the owner. It can be inferred from the table that suppose if given for rent what would be the expected rent was asked to the house owner for which the sample house owners revealed their range of rent expected. Depending upon the architecture and facilities provided there is different rent could be charged for the house. Out of the entire sample of 81 we could observe that the maximum number of respondents like 22 would like to earn minimum of Rs.10000 to 12000 that accounts to 27% to the total. Secondly nearly16 samples would charge a nominal rent of Rs.5000 to 6000 that accounts to 19% of the total. While 10 samples would like to rent it out in case from Rs.8000 to 9000 that tolls up to 12% of the total. Taking into consideration the highest expectations of income potential of the residences we could say that nearly 5 samples would like to definitely charge a higher rent based on the square feet calculation. Because these respondents when interacted they were very specific about the returns. Like they were of the view that rent will be fixed based on square feet cost calucluation at Rs11.minimum and accordingly the total square feet will be calculated cumulatively,depending upon the income,demand and infrastructure that is provided and facilities made available. Nearly 23 samples would like to rent charging from Rs.10k to Rs. 12k and would like to hire the house for booming IT sector employees, bank employees and chartered accountants who could afford and there is no second thought in their remittance. Still few respondents were of the view that they would object giving their house for rent as maintenance and preservation is primary concern and since the city life is so busy a good house to relax is ideal therefore never preferred to rent. Hence we say the house owners having purchased the land have been able to overcome much of their difficulties in raising the building but however were not willing to rent as they had estimation and high value pertaining to existing market rate.
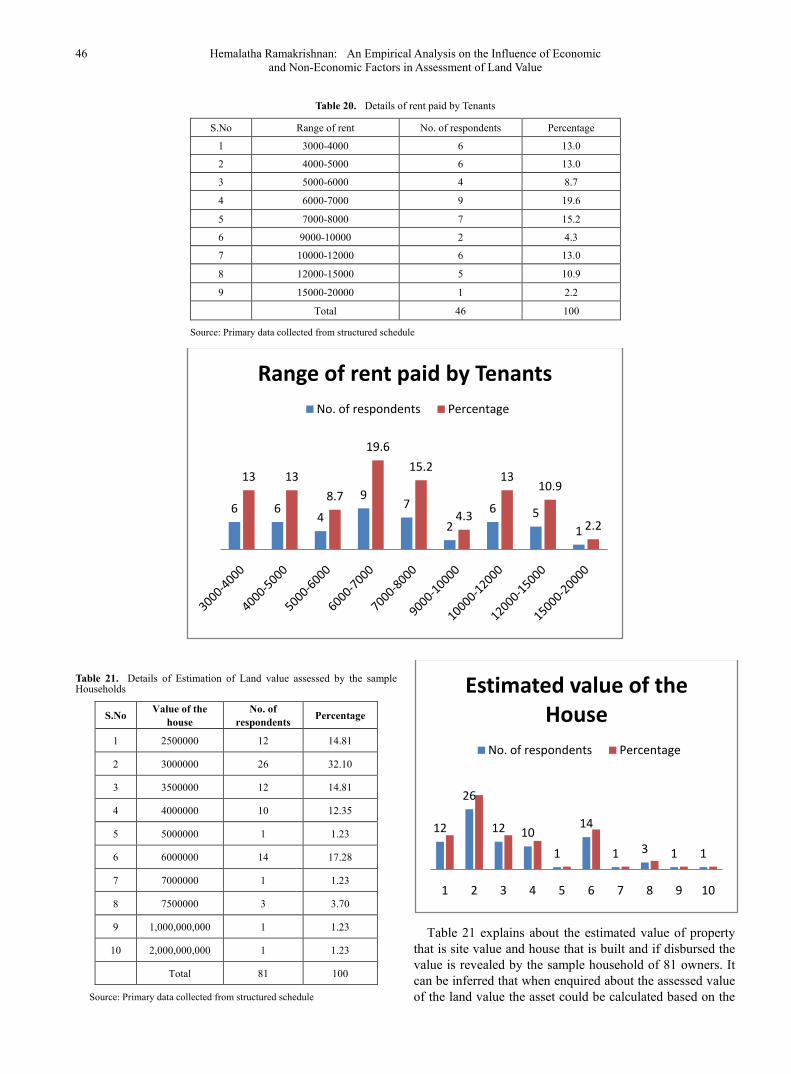
Table 20 explains the range of rent paid by tenants in HRBR layout in Banaswadi. In the questionnaire administered the study found that 46 respondents were living as tenants. The highest rent paid is Rs.15000 to 20000 this is a family working as chief executive in a Multi national company. As the company provides the remittance they were comfortable with the accommodation and location. They even feel the freedom of independence and comfort of stay with all facilities. Like all basic amenities is provided to the tenant by the landlord garden, parking, furnished house. The land lord is away from the destination and monitors in collecting the rent. Next we could see that nearly 9 of the respondents were paying Rs.8000 as rent that accounts to 19% to the total. These are all small families working almost in well established private sectors and with small family norm. Compared to the facility provided with slightly higher rented house the study found that space that is provided is not adequate a little congestion in owning a car or a two wheeler. There is a problem of space for accommodating vehicle right from the range of Rs.7000 to 10000 is that the tenant had to bear inconvenience in terms of parking and space even though member in family are nucleus family set up. And the tenants interaction on the demand for selecting this location they were of the view is that preference for the city as it is fast growing and with plenty of opportunity available. As prospective centre many private companies have come up and there is good employment opportunities available and also for acquiring additional skills better learning prospects are available.
46
81
2330.6754
15.33
Tenancy Self occupied Both
Details about occupancy of land by the sample Households
No of respondents Percentage

American Journal of Economics 2014, 4(1): 34-51 45
Table 19. Details of owners expectation on renting the House to the tenants
S.No. Range of rent No of respondents Percentages
1 3000-4000 2 2.47
2 4000-5000 8 9.88
3 5000-6000 16 19.75
4 6000-7000 7 8.64
5 7000-8000 5 6.17
6 8000-9000 10 12.35
7 9000-10000 2 2.47
8 10000-12000 22 27.16
9 12000-15000 4 4.94
10 15000-17000 1 1.23
11 17000-20000 1 1.23
12 20000-25000 1 1.23
13 25000-30000 1 1.23
14 30000-35000 1 1.23
Total 81 100
Source: Primary data collected from structured schedule
2
8
16
75
10
2
22
41 1 1 1 1
Expected rent in case rented out by the house owners
No of respondents Percentages
46 Hemalatha Ramakrishnan: An Empirical Analysis on the Influence of Economic and Non-Economic Factors in Assessment of Land Value
Table 20. Details of rent paid by Tenants
S.No Range of rent No. of respondents Percentage
1 3000-4000 6 13.0
2 4000-5000 6 13.0
3 5000-6000 4 8.7
4 6000-7000 9 19.6
5 7000-8000 7 15.2
6 9000-10000 2 4.3
7 10000-12000 6 13.0
8 12000-15000 5 10.9
9 15000-20000 1 2.2
Total 46 100
Source: Primary data collected from structured schedule
Table 21. Details of Estimation of Land value assessed by the sample Households
S.No Value of the house
No. of respondents Percentage
1 2500000 12 14.81
2 3000000 26 32.10
3 3500000 12 14.81
4 4000000 10 12.35
5 5000000 1 1.23
6 6000000 14 17.28
7 7000000 1 1.23
8 7500000 3 3.70
9 1,000,000,000 1 1.23
10 2,000,000,000 1 1.23
Total 81 100
Source: Primary data collected from structured schedule
Table 21 explains about the estimated value of property that is site value and house that is built and if disbursed the value is revealed by the sample household of 81 owners. It can be inferred that when enquired about the assessed value of the land value the asset could be calculated based on the
6 64
97
26 5
1
13 13
8.7
19.6
15.2
4.3
1310.9
2.2
Range of rent paid by TenantsNo. of respondents Percentage
12
26
12 10
1
14
1 3 1 1
1 2 3 4 5 6 7 8 9 10
Estimated value of the House
No. of respondents Percentage

American Journal of Economics 2014, 4(1): 34-51 47
year of purchase and assessment in the prevailing market and also over and above the materials cost used in the construction. There is tremendous increase in value of land and building. For example Suppose in the year 1963 when the land price was purchased at Rs.5 per square feet with total 1200 square feet for a over a period of time we can conclude that there is a growth of nearly 4066 times that the land value has grown to such an extent. This indicates that with basic investment of Rs.60000 the number of years and market value indicates the rate at which the value can be a useful possession. Some of the samples have said they have foregone their savings because with such estimation on value of land with building construction architecture and as well if rented it out they are having a comfortable life. Also civic amenities available adds and with others we could find that with the growth or increase of the city in the successive years there is manifold increase in land value that varies every once in three month depending upon the market demand ability seeking for property and best identified location of the city.
Table 22 reveals the view of the respondents and the cause for the rise in land value almost all the respondents 150 gave equal opinion for all the option put forward while collecting data. First they were hesitant and said all four are equally
important and many more could be the cause like better investment location, good cosmopolitan city for standard of living style, inflation, could earn potential income other than regular income, good opportunities. However apart from the reasons mentioned by them the respondents did agree the above said causes. Migration and IT go hand in hand, nearly 52% and 47% of the respondents felt that migration is high due to more investment in Information Technology and many from different parts in the nation migrate to the city. Also few samples were of learned and informative regarding the track of changes made by different government policy. With changes in political environment there was more favoritism for development of booming sector of IT and BPOs. Government policy goes well with their more volume of generating income and the development process is not equally distributed. Hence the resource is more concentrated in the city for more congestion of value to rise.
So far the study have been discussing various economic factors relating to the sample interaction regarding the land utilization, ownership, source of land purchased and year of variation in value and as well estimation of value of land. Moving on to the non-economic factors that is made available like electricity regularity, regular water source , transport and health care centreEach of these are discussed.
Table 22. Samples opinion on rise in value of land
S.No Causes No of respondents Percentage
1 Investment in city 35 23.33
2 Migration 47 31.33
3 IT industry 52 34.67
4 Government policy 16 10.67
Total 150 100
Source: Primary data collected from structured schedule
35
4752
16
23.33
31.3334.67
10.67
Investment in city Migration IT industry Government policy
Samples opinion on rise in land valueNo of respondents Percentage

48 Hemalatha Ramakrishnan: An Empirical Analysis on the Influence of Economic and Non-Economic Factors in Assessment of Land Value
5. Non-Economic Factors that Influence for Settlement
Table 23. Regularity of power supply
S.No Power supply No.of respondents Percentage
1 Regular 113 75.33
2 Irregular 37 24.67
Total 150 100
Source: Primary data collected from structured schedule
Table 23 reveals the regularity of power supply civic amenities that has been provided by the development authority in order to form layouts. This is the initial factor for purchasing the land and as well identifies the prosperity of the division. From the above table we can infer that supply of power has not been of much problem. Nearly out of 150 responses including owners and tenants have said that there has been better provision of power supply that accounts to 75.33% of the total. Whereas 24% of the responses were of
the view there has been frequent power cut during specific hours either in the morning , during exams time and once in fortnight. However this was severe during earlier times ten years back subsequently much disturbance has not been there. When enquired about the availability of power supply during ten years there was regular supply and consistent, however for the past two years there is constant power cut down mostly during summer and as well during holidays. Overall there has been a regular supply and maintenance and response is done immediately in case if there is any problem. This is evident that regular service of Bangalore Electricity supply department.
Table 24 reveals the availability of water supply. With reference to the study area Banaswadi and HRBR layout there is good availability of all sources of water like city Municipal corporation, tankers and also bore well. Almost 119 samples were only using Municipal water that is supplied alternative days including cauvery water. This accounts to 79% of the total. While the new residences still depend on tankers when time does not permit or whenever there is any occasions need to be organized. About 9 of the respondents use tank water once in alternative days based on the capacity of the tank built that can store for a day and per day utilization and consumption of water. Nearly 22 respondents do have borewell as well as the Municipal water that works out to be 14% of the entire sample. However when we consider the per day consumption as underlined by the international standard as per the international standard measurement in a large city litres per day consumption should be 200, but when we see the interpretation it is meager and does not fulfill the criteria of consumption of 200 litres per day.
Table 24. Source of regular water supply
S.No Source of Water No. of respondents Percentage 1 CMC/Cauvery 119 79.3 2 Tanker 9 6 3 Bore well 22 14.7 Total 150 100
Source: Primary data collected from structured schedule
11375.33
37 24.67
No.of respondents Percentage
Supply of powerRegular Irregular
119
922
79.3
6 14.7
CMC Tanker Bore well
Source of water SupplyNo. of respondents Percentage

American Journal of Economics 2014, 4(1): 34-51 49
Table 25 explains the types of transport and dependence on the part of the sample Households. When enquired about the transport frequency before ten years and after now in recent years the samples revealed that comparatively the mode of public transport has improved and there is bus terminals moving destinations of Central Business District. However the frequency is very less where in which need to change more then two buses. Most of the samples said that relying on such transport s very less due to time consumption in signal and traffic instead owing a two wheeler as well a four wheeler is comfortable in travelling to distant places. Hence the study has found that nearly 52 samples rely partially on public transport while rest of 98 respondents do use their own transport of either hired or owned.
Table 25. Transportation availability and dependence by sample Households
S.No Type of transport No. of respondents Percentage 1 Public 52 34.67 2 Private 98 65.33 Total 150 100
Source: Primary data collected from structured schedule
Table 26 explains the details of availability of health care centres and dependence on the same. Previously when enquired about the availability of health care location they said they use to visit to ITI hospitals or Ulsoor or Government hospitals located at shivajinagar. But with span of five years the area has developed with many clinics and nursing homes. They have come up that has facility of all kinds. However few senior citizens that is nearly 3.3% do avail the facility of government hospitals based on membership subscription paid annually. Here the study has found that nearly 54% of the sample do depend on the clinics and there are maternity hospitals that has come up nearly 42.7% do depend for emergency.
Table 26. Facility of Health care centres
S.No. Hospitals No. of respondents Percentage 1 Clinic 81 54 2 Nursing home 64 42.7 3 Government 5 3.3 Total 150 100
Source: Primary data collected from structured schedule
52 34.6798 65.33
No. of respondents Percentage
Transportation avaialbilty and dependence by sample Household
Public Private
8164
5
5442.7
3.3
Clinic Nursing home Government
Availability of Health care centresNo. of respondents Percentage
50 Hemalatha Ramakrishnan: An Empirical Analysis on the Influence of Economic and Non-Economic Factors in Assessment of Land Value
6. Application of Statistical Tools To begin our proof of analysis here let us begin to frame a
statement that to find whether the mean value of land value is same for the different directions. And secondly, let us also find that whether areas differ with respect to mean value of land. For better understanding we have uniformly coded the data that were showing less variation, whereas all those areas as per direction that has shown larger variation we have randomly selected the areas and proceeded to calculate the Fisher’s test. F’ test is applied when there are two or more variables are studied and is capable of fruitful application to a diversity of practical problems. Here in our study we have applied this technique to study the impact of areas and land value on directions, and could determine whether the mean values of in all directions and as well areas differ significantly or not.
Areas that has been selected are from the North direction are Jalahalli, Yeshwanthpur, Sanjaynagar, Hebbal, RMV extension, Sadashivnagar, Jayamahal, Benson town, new BEL road. From the south side we have taken lalbagh road, KH road, Jayanagar, Banashankari I&II stage, JPNagar, Kanakapura road, Bannerghatta road, Koramangala. From the east side we have taken int account the areas are Hennur road, HBR layout,frazer town, spencer road, airport road, whitefield, krishnarajapuram, cox town. And from the west we have areas like vijayanagar, kengeri,Chandra layout, agrahara etc.,
These are the allocations that intend to exhibit a wider variation between 2005 to 2007. Having seen the entire list of areas as per directions now let us formulate the table and name the areas with different alphabetical order and directions will remain the same. The statement of supposition goes like this to find whether the mean value of land is same for the different directions and secondly, to test whether areas differ with respect to mean land values. Steps involved are;
• Firstly to frame the supposition • Secondly, to calculate the correction factor • Thirdly, to find the sum of squares between directions
that is between rows with v= (c-1) as degrees of freedom • Fourthly, to find the sum of squares between areas
within columns that is v=(r-1) degrees of freedom • Fifthly to find the sum of squares • Sixthly, to find the residual or remainder that is total
sum of squares between directions and between areas. The following table shows the land value per square feet and with the help of this information we are applying the analysis of variance. The coding data selected is 5000.
6.1. Calculation of Two Way Test Using ANOVA and the Corresponding Results
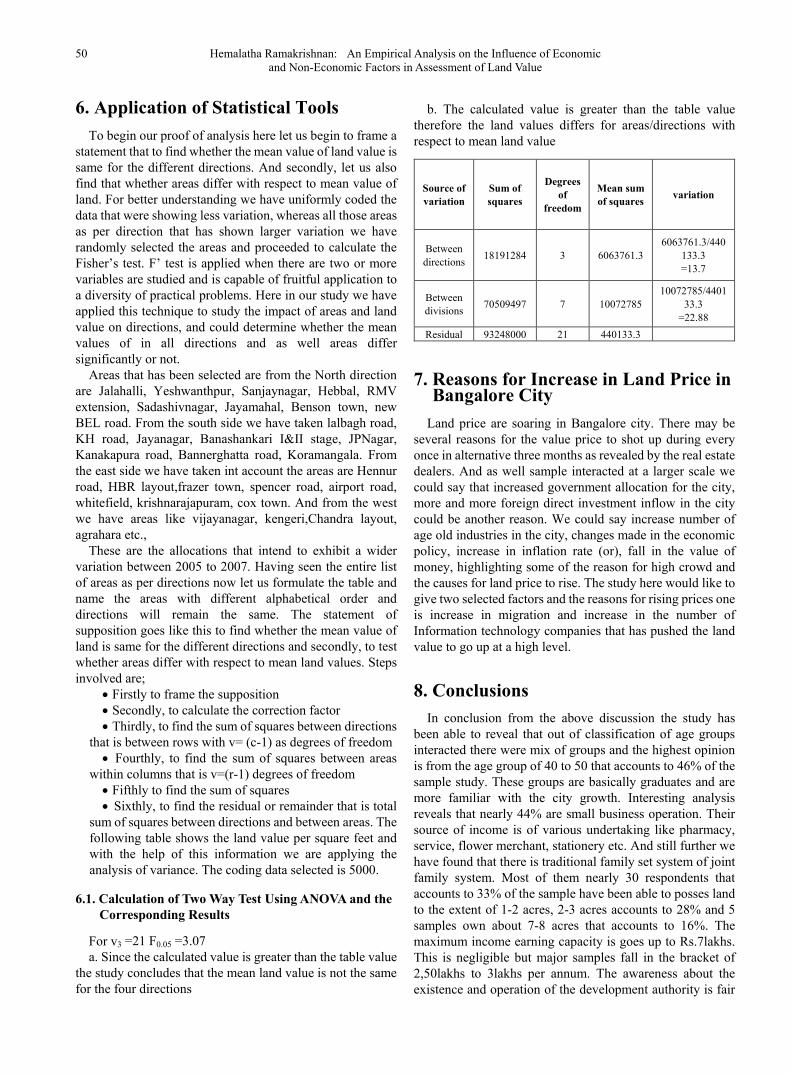
For v3 =21 F0.05 =3.07 a. Since the calculated value is greater than the table value
the study concludes that the mean land value is not the same for the four directions
b. The calculated value is greater than the table value therefore the land values differs for areas/directions with respect to mean land value
Source of variation
Sum of squares
Degrees of
freedom
Mean sum of squares variation
Between directions 18191284 3 6063761.3
6063761.3/440133.3 =13.7
Between divisions 70509497 7 10072785
10072785/440133.3
=22.88 Residual 93248000 21 440133.3
7. Reasons for Increase in Land Price in Bangalore City
Land price are soaring in Bangalore city. There may be several reasons for the value price to shot up during every once in alternative three months as revealed by the real estate dealers. And as well sample interacted at a larger scale we could say that increased government allocation for the city, more and more foreign direct investment inflow in the city could be another reason. We could say increase number of age old industries in the city, changes made in the economic policy, increase in inflation rate (or), fall in the value of money, highlighting some of the reason for high crowd and the causes for land price to rise. The study here would like to give two selected factors and the reasons for rising prices one is increase in migration and increase in the number of Information technology companies that has pushed the land value to go up at a high level.
8. Conclusions In conclusion from the above discussion the study has
been able to reveal that out of classification of age groups interacted there were mix of groups and the highest opinion is from the age group of 40 to 50 that accounts to 46% of the sample study. These groups are basically graduates and are more familiar with the city growth. Interesting analysis reveals that nearly 44% are small business operation. Their source of income is of various undertaking like pharmacy, service, flower merchant, stationery etc. And still further we have found that there is traditional family set system of joint family system. Most of them nearly 30 respondents that accounts to 33% of the sample have been able to posses land to the extent of 1-2 acres, 2-3 acres accounts to 28% and 5 samples own about 7-8 acres that accounts to 16%. The maximum income earning capacity is goes up to Rs.7lakhs. This is negligible but major samples fall in the bracket of 2,50lakhs to 3lakhs per annum. The awareness about the existence and operation of the development authority is fair

American Journal of Economics 2014, 4(1): 34-51 51
enough that nearly 77% have got to know. And from this accounted that 67% have possessed land from the Development Authority. The maximum attempts made out of which land gained is during 1991 and the cause is rapid industrialization and with overtime facility and additional income earned has motivated the samples to own land. Simultaneously we have calculated the value of land gained at varied rate with every rise of more than 2000% and for the same square feet of thirty by forty land. As most of the samples are affordable groups they could easily gain land out of their own savings and as well from bankers and the motivation level to settle down in such a busy growing city is mostly due to education, business and are inherited in the locality for a long term. The study also reveals in terms of occupancy they have been able to earn additional income in order to supplement their income. In this out of total sample of 150, nearly 46 samples have occupied as tenants. This accounts to 36% while combination of both the land lord and tenants living together is 15% and that of 81 samples have purely self occupied that is 54%. The sample balance of only owners occupying the land with built house have been able to specify the estimated income that they would receive if rented out , it is maximum of Rs. 10 to 12 thousand that is 27%, while those all rented the land is earning a minimum of Rs. 6 to 7 thousand and this accounts to 19% of the sample. The overall opinion on the part of the samples is due to investment of IT and growth of IT industry there has been a speedy development and as well the cause for the rise in value of land. Finally, about the potential value of land with built up household there were different estimation. Out of 81 samples of owners they have an expectation of minimum of Rs. 25 lakhs to maximum of Rs.2 crores of value asset.
ACKNOWLEDGEMENTS Thankful to student assistants for their dedicated field
work in collecting the data and grateful to all those sample households for sharing their valuable time in furnishing the information.
I also thank the land department of development authority for furnishing the survey sheet and as well details of layout development and master plan report.
REFERENCES [1] Alan A Walters Value of Urban Land, A prologue, The rise in
the Value of land, Urban projects department, World Bank Washington, Times Research foundation 1982 page 24-79 [(1-2)]. Ibid page 37.
[2] Archarya G.S Some thoughts on urbanization century second most serious problems” Yojana September 13, 1964, volume-VIII, No.18, page-11.
[3] Edwin Mills “ The Value of urban Land” in Harvey perioff the Quality of the Urban Environment for Resources for the Future Inc., (Baltimore Johns Hopkins 1969) pp 231-253. Homer Hoyt One Hundred Year of Land Values in Chicago ( Chicago University of Chicago Press 1933.
[4] Louis A Rose and summer J La Croix, Urban Land price, the extraordinary case of Honolulu, Hawai Urban Studies, vol, 26 (1989) Pg.301.
[5] Muttur Renganathan Narayana ,Globalisation and urban Growth evidence for Bangalore, Faculty of Economics , University of Tokyo and Institute of Social and Economic change, Bangalore 2008.
[6] Peter Colwell and C F Sirman Area time , centrality and the value of land Journal of land economics 1978 pg 514-519.
[7] Parry Rent of land for warehousing and industry are similarly determined. Based on location and base period Land rents, values, prices and use page 151.
[8] Annexure Data classified by investigator - Town and Country Planning department, Bangalore Development Authority.
[9] All tables - Classified table developed by investigator - Land in hectares data- Acquisition of Land Department Bangalore Development Authority.
[10] Source of data information –Primary data through Structured questionnaire designed by the investigator.