Embed Size (px)
Citation preview
RESEARCH Open Access
Sources and dynamics of sedimentaryorganic matter in Sundarban mangroveestuary from Indo-Gangetic deltaM. Bala Krishna Prasad1*, Alok Kumar2, A.L. Ramanathan2 and Dilip Kumar Datta3
Abstract
Introduction: Mangrove forests are highly productive ecosystems distributed along the tropical coast line. Nutrientbiogeochemistry of mangroves are primarly driven by both allochthonous and autochthonous sources.Characterization of organic matter in coastal ecosystems enables to understand the biogeochemical transformationof organic matter and its influence on ecosystem productivity in response to various changing environmentalconditions. Therefore, the elemental and stable carbon and nitrogen levels were employed to understand theorganic matter (OM) dynamics in the Sundarban mangrove ecosystem (India-Bangladesh).
Results: Differences in stable isotope values indicate that variable sources influence the OM dynamics in Sundarbansediments. The progressive enrichment in δ 13C levels along the land-coastal continuum indicates that theterrestrial and marine inputs are dominant at the landward and seaward ends, respectively. The CuO oxidation-derived lignin phenol monomers describe significant levels of total lignin are preserved in Sundarban mangrovesediments during diagenesis. The phenol monomer ratios are lower than the plant litter explaining that aromaticring cleavage is the dominant mechanism for the lignin degradation. Furthermore, the Ad/Al ratios were higherthan the plant litter explaining the oxidation of propyl side chain of vascular OM influencing the carbon cycling inSundarban sediments. Largely, the Ad/Al ratios describe the vascular OM degradation is through the oxidation ofpropyl side chain.
Conclusions: The regional variability in land-use regulates the spatial variability in C, N, OC/TN ratio, δ 13C and δ15N between the Indian and the Bangladesh Sundarban mangroves and indicates that in the upstream terrestrialorganic matter and/or mangrove plant litter contribute significant amount of organic matter, whereas the marinePOC influences the organic matter dynamics in downstream. The three end-member mixing model applyingterrestrial plant litter, seston, and marine POC as end-members explains the relative contribution of OM fromvarious sources, and marine inputs were dominant in Sundarban sediments.
Keywords: Sundarban mangrove, Organic carbon, Stable isotopes, Lignin phenols, Three end-member mixing model
IntroductionBeing situated in a transboundary position between landand ocean, mangroves generally act as a bioreactor thatalters the chemistry of terrestrial organic matter andsupplies large amounts of organic matter to the adjacentcoastal ocean and influencing the ocean biogeochemistry(Dittmar et al. 2006). A substantial amount of carbon andnutrients is also accumulated in sediments and this has
becomes an unaccounted portion in the global carbon andnutrient budgeting; therefore, assessment of sedimentarycarbon and nutrient pools is highly important to fill thegaps in the global dataset (Kristensen et al. 2008).Both allochthonous (e.g., riverine loadings) and autoch-
thonous sources (e.g., coastal wetlands and seagrass eco-systems, mangrove litter, benthic vegetation, freshwater,and marine particulate organic matter) supply organicmatter to coastal ecosystems (Kristensen et al. 2008;Jennerjahn 2012). Characterization of organic matter incoastal ecosystems enables to understand the biogeo-chemical transformation of organic matter and its
* Correspondence: [email protected] Shining Harness Street, Clarksburg, MD 20871, USAFull list of author information is available at the end of the article
© The Author(s). 2017 Open Access This article is distributed under the terms of the Creative Commons Attribution 4.0International License (http://creativecommons.org/licenses/by/4.0/), which permits unrestricted use, distribution, andreproduction in any medium, provided you give appropriate credit to the original author(s) and the source, provide a link tothe Creative Commons license, and indicate if changes were made.
Prasad et al. Ecological Processes (2017) 6:8 DOI 10.1186/s13717-017-0076-6
influence on ecosystem productivity in response to variouschanging environmental conditions. The C/N ratios havebeen extensively used as a proxy to identify organic mattersources, and stable C (δ13C) and N (δ15N) isotopes havealso been extensively applied to characterize the originand fate of organic matter in estuarine mangrove ecosys-tems (Kristensen et al. 2008; Prasad and Ramanathan2009). The physiological differences in the CO2 fixationduring photosynthesis resulted in differences in the δ13Clevels in C3 and C4 plants, which are used as a proxy to dif-ferentiate plant-derived organic matter sources in coastalecosystems (Lamb et al. 2006). Largely, terrestrial plantscontain δ15N levels ~0‰ (Thornton and McManus 1994),whereas mangrove plant δ15N levels ranges from –1.5‰ to3.2‰ (Muzuka and Shunula 2006) and anthropogenicsources contain >8‰ (Prasad and Ramanathan 2009), andthese can be used in distinguishing nitrogen sources incoastal ecosystems.The origin and fate of organic matter in the Indian
subcontinent mangrove ecosystems are rarely studiedin detail. This is a critical issue in understanding theglobal carbon cycle and to develop the carbon budgetfor mangrove ecosystems. Especially, the various or-ganic matter sources along the land-coast continuumare largely influenced by both natural and anthropo-genic perturbations (Prasad et al. 2013). Hence, it iscrucial to understand the biogeochemical cycling of or-ganic matter in mangroves. The Sundarban mangroveecosystem in the Gangetic delta in India and Bangladeshis very important coastal ecosystem and is also highlyvulnerable to climate change (Mitra et al. 2009). It hasbeen estimated that the Indian Sundarban inputs13.8 kg C ha−1 of CO2 to the atmosphere which is largely(60%) derived from the biological degradation of organicmatter (Biswas et al. 2004). This clearly indicates thatorganic matter in Sundarban is highly labile in nature andmay be derived from various sources. It is extremelyimportant to understand the variability in sources anddynamics of organic matter along the land and seacontinuum of Sundarban. Therefore, this research study isintended to delineate the origin and fate of organic matterand to apply the three end-member mixing model to esti-mate the relative contributions of organic matter fromvarious sources in the Sundarban mangrove sedimentsfrom both India and Bangladesh. This study is also ex-pected to deliver a better understanding of the ongoingbiogeochemical processes in the vertical sediment profilesfrom the Sundarban mangrove.
MethodsStudy areaSundarban is the largest single-block mangrove ecosys-tem in the world and is distributed in the Gangetic deltawith an area of 10,200 km2 of which 60% is distributed
in Bangladesh and the rest 40% in India (Fig. 1). The cli-mate is humid tropical to sub-tropical and is influencedby the Bay of Bengal. The mean annual maxima andminima temperatures recorded at the Jhingakhalli me-teorological station were 34 and 20 °C, respectively.Similarly, the mean annual rainfall varies between 1800and 1920 mm and tides are semidiurnal tides (2–4 m).The dominant plant species in the Bangladesh Sundar-ban are Heritiera fomes, Excoecaria agallocha, Ceriopsdecandra, and Sonneratia apetala. In addition to thesespecies, Rhizophora mangle, R. mucronata, R. apiculata,Bruguiera gymnorrhiza, and Avicennia officinalis aredominant. H. fomes (sundari) is the dominant species inthe freshwater-dominant tidal zones, especially in thenortheast, and forms 60% of the commercially usefultimber. In addition to the above species, Bruguiera gym-norrhiza, A. marina, R. mucronata, Acanthus ilicifolias,Lumnitzera racemosa, Cynometra ramiflora, Excoecariaagallocha, etc. are also dominant plant species in the In-dian Sundarbans (Mandal et al. 2012).Like other mangrove ecosystems, Sundarban is also
highly degraded by anthropogenic activities, like industrial,domestic, and shipping activities (Baneerjee et al. 2012,Banerjee et al. 2012). Sundarban is rich in biodiversity andis a favorable habitat for the Royal Bengal Tigers. However,rapid changes in land use pattern/management, dischargesof agriculture and aquaculture effluents, and reduction infreshwater from the upstream due to the construction ofdams have seriously affected the biodiversity and biogeo-chemical processes in Sundarban (Erwin 2009). Further-more, climate change induced sea level rise could inundateabout 1000 km2 of the mangrove area (Bose 2006). Thiscreates a wide range of ecological and socio-economicproblems in the region, leading to crisis in the livelihoodsof the poor and marginalized people. Mangrove forestswhich are considered to be the lifeline of this region aredeclining at an alarming rate due to land use change, sealevel rise, soil texture, tidal actions as well as ecologicalfactors arising out of increasing biotic pressure (Gopal andChauhan 2006).
Sampling and analysisThe core sediments, 4 core sediments from BangladeshSundarban and 3 core sediment samples from IndianSundarban, were collected (Fig. 1) along the land andcoast continuum using a 1.5-m-long plexiglass corer(7 cm i.d.) in February 2012. The collected core sampleswere immediately transported to the field laboratory andsectioned into 1-cm interval. The core sections werepacked in a precleaned polythene bags and stored at 4 °C until analysis. In the laboratory, air dried samplescrushed and sieved through a 250 μM mesh to removecoarse sand and large plant debris. The crushed
Prasad et al. Ecological Processes (2017) 6:8 Page 2 of 15
sediment was sieved through the ASTM standard sieves,and only fractions <32 μM were analyzed for organiccarbon (OC), total nitrogen (TN), and δ13C and δ15Nisotopes. Samples were decarbonized using 1 N HCl,rinsed with distilled water to remove salt components,and then again air dried.About 50 mg of dried sediment weighed in a tin cap-
sules was analyzed using automated continuous-flowisotope ratio mass spectrometry (Preston and Owens1983). The samples are combusted in a EuroVector CNelemental analyzer. The combustion gases (N2 and CO2)were separated on a GC column, passed through a GVI(GV Instruments) diluter and reference gas box, andfinally introduced into the GVI IsoPrime isotope ratiomass spectrometer. Ratios of 13C/12C and 15N/14N wereexpressed as the relative per mil (‰) difference between
the samples and international standards (Vienna PDBcarbonate and N2 in air, respectively):
δX ‰ð Þ ¼ Rsample
Rstandard
� �−1
� �� 1000
where X = 13C or 15N and R = 13C/12C or 15N/14N. Theprecision for C and N isotope analyses was ±0.15 and±0.05‰, respectively. The sample isotope ratios werecompared to a secondary gas standard. For 13CV-PDB, thegas was calibrated against NBS 20 (Solenhofen Limestone).For 15Nair, the gas was calibrated against atmospheric N2
and IAEA standards (N-1, N-2, and N-3). All internationalstandards were obtained from the National Bureau ofStandards in Gaithersburg (MD, USA).
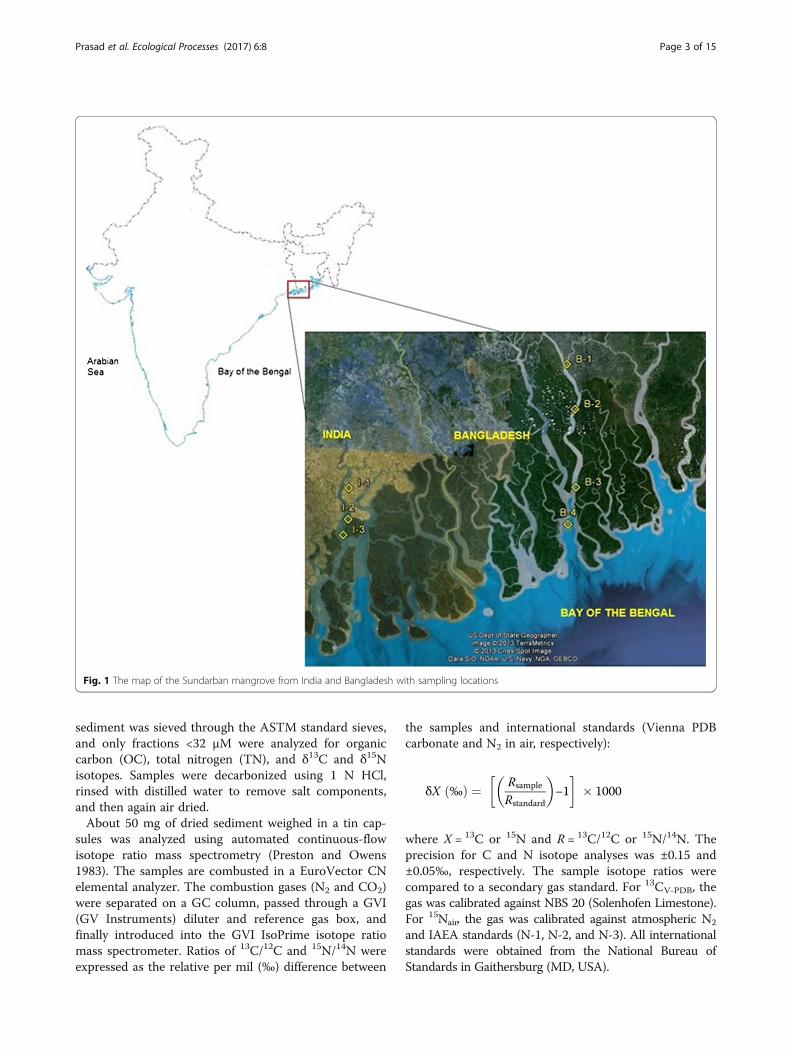
Fig. 1 The map of the Sundarban mangrove from India and Bangladesh with sampling locations
Prasad et al. Ecological Processes (2017) 6:8 Page 3 of 15
Lignin was analyzed by disrupting its macromolecularstructure by alkaline CuO oxidation (Hedges and Ertel1982; Lobbes et al. 1999). A suite of phenolic monomersderived by this method was analyzed by a high perform-ance liquid chromatography. The analysis was conductedon a Merck-Hitachi HPLC system with diode arraydetection using a reverse phase column (Lichrosphere100 RP 18, 5 mm particle diameter, 250 mm length,4 mm inner diameter) and a multi-step solvent gradientsystem for separation. The phenols were identified bytheir retention times and UV absorption spectra between230 and 370 nm, recorded continuously by the diodearray detection detector, and the extinction at 280 nmwas used for quantification. External standards of the 11phenols (Fluka, Switzerland; Aldrich, USA; Sigma, USA)were used for calibration. The detection limit for the in-dividual phenols ranged from 15 to 40 pmol (p = 0.05).All samples were analyzed in duplicate, including CuOoxidation, extraction, and quantification. The coefficientof variation (CV) was 15% on average that agrees wellwith data reported elsewhere (Lobbes et al. 1999). TheCV of the HPLC quantification was <3%.
Three end-member mixing modelGenerally, in the river-dominated intertidal mangrove eco-systems, OM dynamics are largely regulated by sourcesfrom terrestrial plant litter, seston, and marine particulateorganic carbon (POC) (Prasad et al. 2010). Using thesethree end-members, a ternary mixing model can beemployed to estimate OM sources and the end-memberorganic matter source occupies a corner of the triangle(Dittmar et al. 2001). Samples within the triangle definedby end-members A, B, and C; these are terrestrial plant lit-ter, seston, and marine particulate organic carbon (POC),respectively. Samples that fall along any of the linesconnecting two end-members are a mixture of only thosetwo organic matter types. Samples that fall outside of thetriangle indicate the presence of additional sources or dia-genetic modifications of the original signal and cannot becharacterized by this model. Using the example describedby Dittmar et al. (2001), it is possible to expand the
usability of this three end-member mixing model bycreating a tolerance interval (τ) as
τ ¼ a′
a� 100% ¼ b′
b� 100% ¼ c′
c� 100%
where τ is the tolerance level (%) which determines therange of values that still be considered as defined bythree end-member mixing model; a, b, and c characteriz-ing the strict validity of the model, and a′, b′, and c′characterizing the expanded validity of the model. A10% tolerance level was applied in this study. Samplesfall outside the validity line but within the expanded area(tolerance level) are treated as the same samples that fallon the tie lines and are a mixture of only two sources.Samples that fall outside of the triangle at the verticesbut within the expanded triangle are ascribed completelyto the sources at the vertex.
ResultsStatistically significant spatial variability (tstat = 1.87, tcrit =2.05, p < 0.05) in OC, TN, OC/TN ratio, δ13C, and δ15Nwas observed between the Indian Sundarban (IS) and theBangladesh Sundarban (BS) mangrove sediments (Table 1).High levels of OC were observed in IS (0.76–5.22%) thanin those in BS (0.92–2.41%; Table 1). Similarly, high TN(0.043–0.15%) values were observed in IS, whereas TNranges between 0.045 and 0.105% in BS (Table 1). Thespatial variations in OC and TN are clearly imprinted inthe OC/TN ratios in both IS and BS. Highly variable δ13Csignatures (−26.80 to −10.96‰) were observed in ISsediments, whereas δ13C value in BS sediments rangesfrom −23.54 to −13.14‰. And δ15N values were rangedbetween 0.09–12.24‰ in IS sediments and 0.05–17.54‰in BS sediments (Table 1).
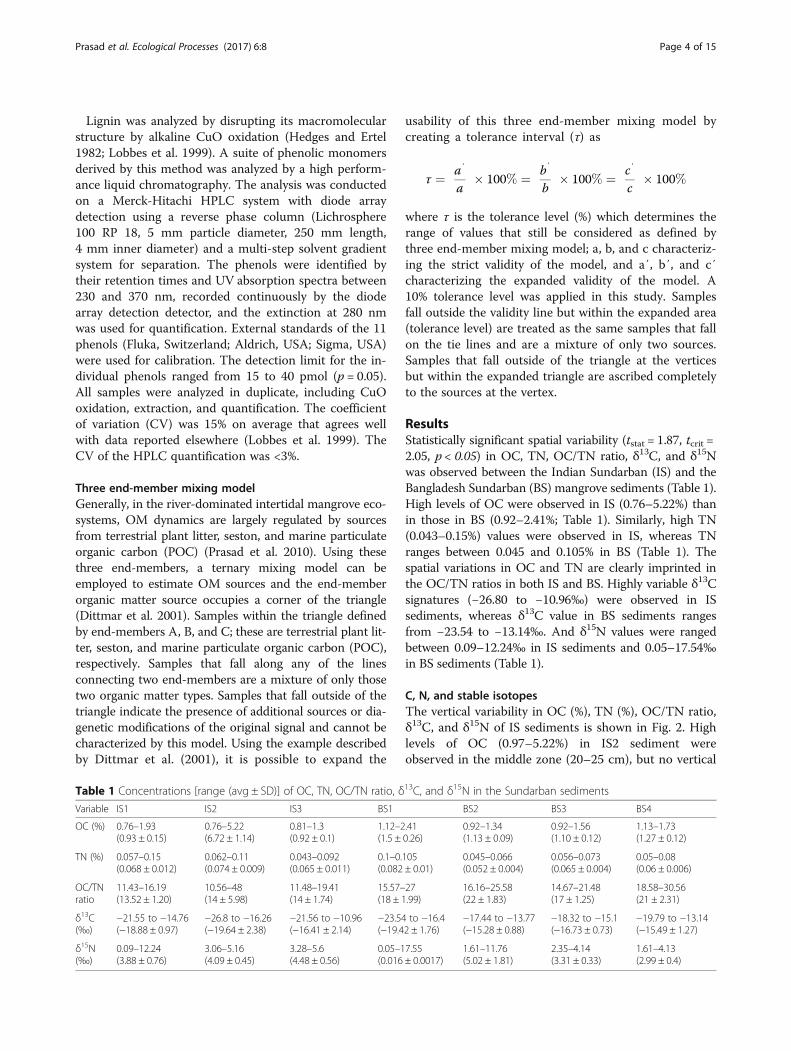
C, N, and stable isotopesThe vertical variability in OC (%), TN (%), OC/TN ratio,δ13C, and δ15N of IS sediments is shown in Fig. 2. Highlevels of OC (0.97–5.22%) in IS2 sediment wereobserved in the middle zone (20–25 cm), but no vertical
Table 1 Concentrations [range (avg ± SD)] of OC, TN, OC/TN ratio, δ13C, and δ15N in the Sundarban sediments
Variable IS1 IS2 IS3 BS1 BS2 BS3 BS4
OC (%) 0.76–1.93(0.93 ± 0.15)
0.76–5.22(6.72 ± 1.14)
0.81–1.3(0.92 ± 0.1)
1.12–2.41(1.5 ± 0.26)
0.92–1.34(1.13 ± 0.09)
0.92–1.56(1.10 ± 0.12)
1.13–1.73(1.27 ± 0.12)
TN (%) 0.057–0.15(0.068 ± 0.012)
0.062–0.11(0.074 ± 0.009)
0.043–0.092(0.065 ± 0.011)
0.1–0.105(0.082 ± 0.01)
0.045–0.066(0.052 ± 0.004)
0.056–0.073(0.065 ± 0.004)
0.05–0.08(0.06 ± 0.006)
OC/TNratio
11.43–16.19(13.52 ± 1.20)
10.56–48(14 ± 5.98)
11.48–19.41(14 ± 1.74)
15.57–27(18 ± 1.99)
16.16–25.58(22 ± 1.83)
14.67–21.48(17 ± 1.25)
18.58–30.56(21 ± 2.31)
δ13C(‰)
−21.55 to −14.76(−18.88 ± 0.97)
−26.8 to −16.26(−19.64 ± 2.38)
−21.56 to −10.96(−16.41 ± 2.14)
−23.54 to −16.4(−19.42 ± 1.76)
−17.44 to −13.77(−15.28 ± 0.88)
−18.32 to −15.1(−16.73 ± 0.73)
−19.79 to −13.14(−15.49 ± 1.27)
δ15N(‰)
0.09–12.24(3.88 ± 0.76)
3.06–5.16(4.09 ± 0.45)
3.28–5.6(4.48 ± 0.56)
0.05–17.55(0.016 ± 0.0017)
1.61–11.76(5.02 ± 1.81)
2.35–4.14(3.31 ± 0.33)
1.61–4.13(2.99 ± 0.4)
Prasad et al. Ecological Processes (2017) 6:8 Page 4 of 15
variability was observed in IS1 and IS3 sediments. TNincreased from 0.7–0.15% to 0.082–0.11% in the top 10and 22 cm of IS1 and IS2 sediments, whereas TNdecreased from surface to deep layer in IS3. The OC/TNratios were also decreased with depth in IS1, whereasthe OC/TN ratio was increased up to 20 cm and thendecreased with depth in IS3.In IS1, δ13C value decreased from −15.61 to −17.24‰
in the top 10 cm and then slightly increased to −14.76‰around 15 cm and again decreased with depth (Fig. 2).The δ13C value in IS2 increased from −20.08 to−19.77‰ in the top 15 cm and decreased from −24.02to −16.07‰ between 15 and 30 cm and again increasedto −16.79‰ at 35 cm depth. However, progressive in-crease in δ13C was observed in IS3 from −18.13 to−10.96‰ in the top 25 cm and then decreased to−16.06‰ near the bottom of the core (Fig. 2). In IS1, asharp decrease (5.21‰ at 2 cm) and increase (12.24‰ at3 cm) in δ15N value were observed in the top 3 cm anddecreased to 0.09‰ at 12 cm, but afterwards, increasedto 6.47‰ at 20 cm and then decreased. In IS2, δ15Nvalue increased from 3.28 to 4.79‰ in the top 16 cmand then decreased with depth. Similarly, in IS3, δ15Nincreased from 4.03 to 5.09‰ in the top 20 cm anddecreased with depth (Fig. 2).
The vertical variability in OC (%), TN (%), OC/TNratio, δ13C, and δ15N of BS sediments is shown inFig. 3. In BS1 and BS3, OC increased in the top5 cm and then decreased with depth. However, OCdecreased in the top 5 cm and increased with depthin BS2. In contrast, OC was remained constant in thetop 20 cm and then increased from 1.22 to 1.43% inbetween 20 and 25 cm depth (Fig. 3). In all samples,except BS2, TN decreased in the top 20 cm and in-creased near the bottom of the core. In BS2, the OC/TN ratio was increased from 17.49 to 23.58 in thetop 30 cm and then decreased, whereas no pattern inthe OC/TN ratio was observed in BS1 (Fig. 3). InBS3, the OC/TN ratio decreased from 18.08 to 15.32and remained constant. However, no pattern in theOC/TN ratio was observed in the top 25 cm andthen increased from 20.71 to 29.49 in between 25and 35 cm in BS4 (Fig. 3).In BS1 and BS2, δ13C values increased in the top
10 cm and decreased with depth (Fig. 3). In BS3, δ13Cvalues decreased from −16.01 to −17.84 in the top30 cm and then increased. But, no vertical pattern inδ13C was observed in BS4 up to 25 cm depth and thenincreased with depth (Fig. 3). A clear spatial variabilityin δ15N was observed across the ecosystem. In BS1,
Fig. 2 Vertical variability with the thick layer of 11 cm moving average levels in OC, TN, OC/TN ratio, δ13C, and δ15N from the IndianSundarban sediments
Prasad et al. Ecological Processes (2017) 6:8 Page 5 of 15
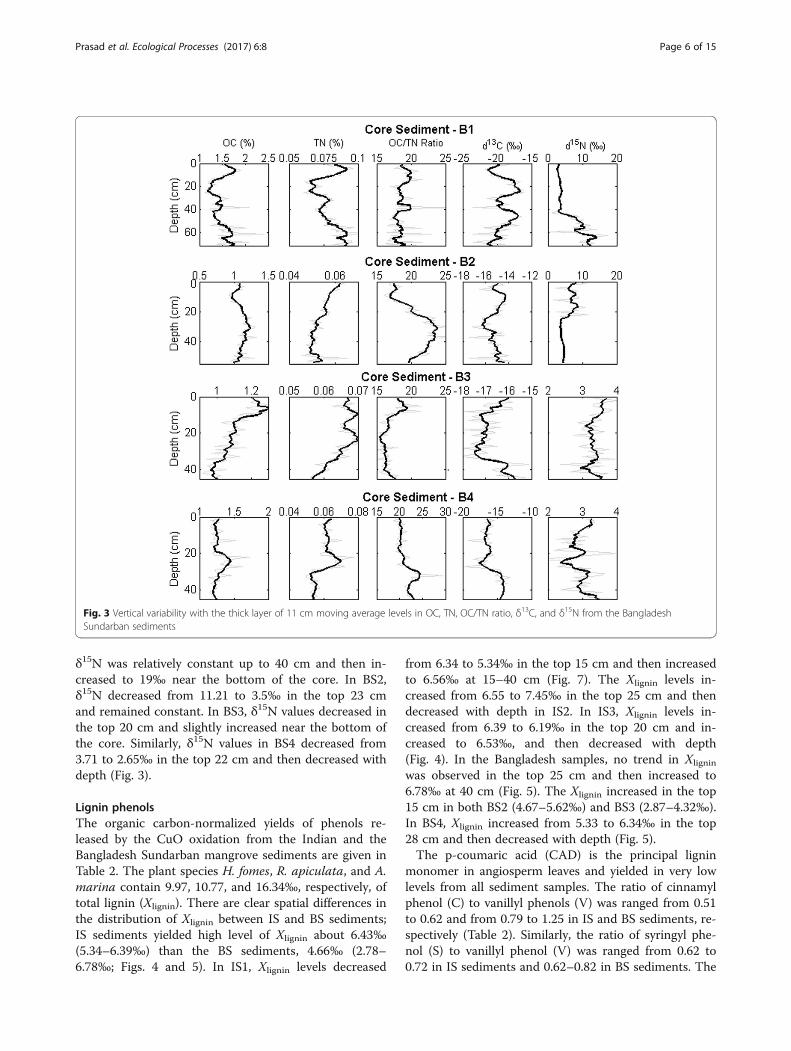
δ15N was relatively constant up to 40 cm and then in-creased to 19‰ near the bottom of the core. In BS2,δ15N decreased from 11.21 to 3.5‰ in the top 23 cmand remained constant. In BS3, δ15N values decreased inthe top 20 cm and slightly increased near the bottom ofthe core. Similarly, δ15N values in BS4 decreased from3.71 to 2.65‰ in the top 22 cm and then decreased withdepth (Fig. 3).
Lignin phenolsThe organic carbon-normalized yields of phenols re-leased by the CuO oxidation from the Indian and theBangladesh Sundarban mangrove sediments are given inTable 2. The plant species H. fomes, R. apiculata, and A.marina contain 9.97, 10.77, and 16.34‰, respectively, oftotal lignin (Xlignin). There are clear spatial differences inthe distribution of Xlignin between IS and BS sediments;IS sediments yielded high level of Xlignin about 6.43‰(5.34–6.39‰) than the BS sediments, 4.66‰ (2.78–6.78‰; Figs. 4 and 5). In IS1, Xlignin levels decreased
from 6.34 to 5.34‰ in the top 15 cm and then increasedto 6.56‰ at 15–40 cm (Fig. 7). The Xlignin levels in-creased from 6.55 to 7.45‰ in the top 25 cm and thendecreased with depth in IS2. In IS3, Xlignin levels in-creased from 6.39 to 6.19‰ in the top 20 cm and in-creased to 6.53‰, and then decreased with depth(Fig. 4). In the Bangladesh samples, no trend in Xlignin
was observed in the top 25 cm and then increased to6.78‰ at 40 cm (Fig. 5). The Xlignin increased in the top15 cm in both BS2 (4.67–5.62‰) and BS3 (2.87–4.32‰).In BS4, Xlignin increased from 5.33 to 6.34‰ in the top28 cm and then decreased with depth (Fig. 5).The p-coumaric acid (CAD) is the principal lignin
monomer in angiosperm leaves and yielded in very lowlevels from all sediment samples. The ratio of cinnamylphenol (C) to vanillyl phenols (V) was ranged from 0.51to 0.62 and from 0.79 to 1.25 in IS and BS sediments, re-spectively (Table 2). Similarly, the ratio of syringyl phe-nol (S) to vanillyl phenol (V) was ranged from 0.62 to0.72 in IS sediments and 0.62–0.82 in BS sediments. The
Fig. 3 Vertical variability with the thick layer of 11 cm moving average levels in OC, TN, OC/TN ratio, δ13C, and δ15N from the BangladeshSundarban sediments
Prasad et al. Ecological Processes (2017) 6:8 Page 6 of 15
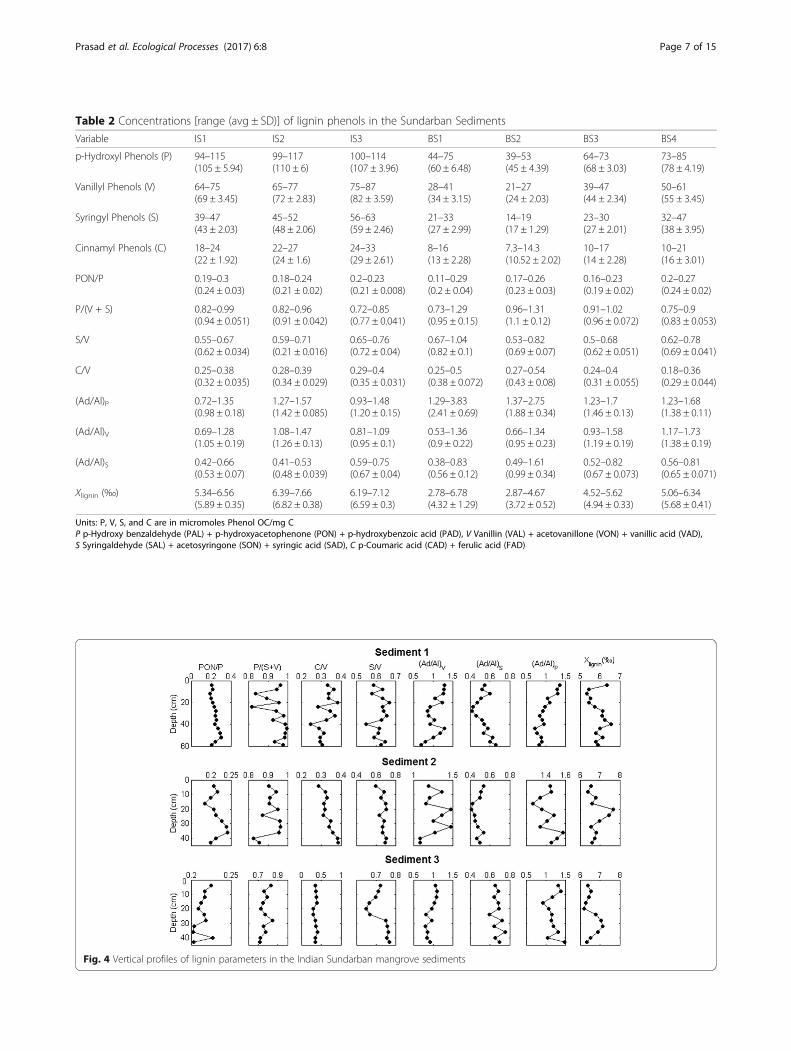
Table 2 Concentrations [range (avg ± SD)] of lignin phenols in the Sundarban Sediments
Variable IS1 IS2 IS3 BS1 BS2 BS3 BS4
p-Hydroxyl Phenols (P) 94–115(105 ± 5.94)
99–117(110 ± 6)
100–114(107 ± 3.96)
44–75(60 ± 6.48)
39–53(45 ± 4.39)
64–73(68 ± 3.03)
73–85(78 ± 4.19)
Vanillyl Phenols (V) 64–75(69 ± 3.45)
65–77(72 ± 2.83)
75–87(82 ± 3.59)
28–41(34 ± 3.15)
21–27(24 ± 2.03)
39–47(44 ± 2.34)
50–61(55 ± 3.45)
Syringyl Phenols (S) 39–47(43 ± 2.03)
45–52(48 ± 2.06)
56–63(59 ± 2.46)
21–33(27 ± 2.99)
14–19(17 ± 1.29)
23–30(27 ± 2.01)
32–47(38 ± 3.95)
Cinnamyl Phenols (C) 18–24(22 ± 1.92)
22–27(24 ± 1.6)
24–33(29 ± 2.61)
8–16(13 ± 2.28)
7.3–14.3(10.52 ± 2.02)
10–17(14 ± 2.28)
10–21(16 ± 3.01)
PON/P 0.19–0.3(0.24 ± 0.03)
0.18–0.24(0.21 ± 0.02)
0.2–0.23(0.21 ± 0.008)
0.11–0.29(0.2 ± 0.04)
0.17–0.26(0.23 ± 0.03)
0.16–0.23(0.19 ± 0.02)
0.2–0.27(0.24 ± 0.02)
P/(V + S) 0.82–0.99(0.94 ± 0.051)
0.82–0.96(0.91 ± 0.042)
0.72–0.85(0.77 ± 0.041)
0.73–1.29(0.95 ± 0.15)
0.96–1.31(1.1 ± 0.12)
0.91–1.02(0.96 ± 0.072)
0.75–0.9(0.83 ± 0.053)
S/V 0.55–0.67(0.62 ± 0.034)
0.59–0.71(0.21 ± 0.016)
0.65–0.76(0.72 ± 0.04)
0.67–1.04(0.82 ± 0.1)
0.53–0.82(0.69 ± 0.07)
0.5–0.68(0.62 ± 0.051)
0.62–0.78(0.69 ± 0.041)
C/V 0.25–0.38(0.32 ± 0.035)
0.28–0.39(0.34 ± 0.029)
0.29–0.4(0.35 ± 0.031)
0.25–0.5(0.38 ± 0.072)
0.27–0.54(0.43 ± 0.08)
0.24–0.4(0.31 ± 0.055)
0.18–0.36(0.29 ± 0.044)
(Ad/Al)P 0.72–1.35(0.98 ± 0.18)
1.27–1.57(1.42 ± 0.085)
0.93–1.48(1.20 ± 0.15)
1.29–3.83(2.41 ± 0.69)
1.37–2.75(1.88 ± 0.34)
1.23–1.7(1.46 ± 0.13)
1.23–1.68(1.38 ± 0.11)
(Ad/Al)V 0.69–1.28(1.05 ± 0.19)
1.08–1.47(1.26 ± 0.13)
0.81–1.09(0.95 ± 0.1)
0.53–1.36(0.9 ± 0.22)
0.66–1.34(0.95 ± 0.23)
0.93–1.58(1.19 ± 0.19)
1.17–1.73(1.38 ± 0.19)
(Ad/Al)S 0.42–0.66(0.53 ± 0.07)
0.41–0.53(0.48 ± 0.039)
0.59–0.75(0.67 ± 0.04)
0.38–0.83(0.56 ± 0.12)
0.49–1.61(0.99 ± 0.34)
0.52–0.82(0.67 ± 0.073)
0.56–0.81(0.65 ± 0.071)
Xlignin (‰) 5.34–6.56(5.89 ± 0.35)
6.39–7.66(6.82 ± 0.38)
6.19–7.12(6.59 ± 0.3)
2.78–6.78(4.32 ± 1.29)
2.87–4.67(3.72 ± 0.52)
4.52–5.62(4.94 ± 0.33)
5.06–6.34(5.68 ± 0.41)
Units: P, V, S, and C are in micromoles Phenol OC/mg CP p-Hydroxy benzaldehyde (PAL) + p-hydroxyacetophenone (PON) + p-hydroxybenzoic acid (PAD), V Vanillin (VAL) + acetovanillone (VON) + vanillic acid (VAD),S Syringaldehyde (SAL) + acetosyringone (SON) + syringic acid (SAD), C p-Coumaric acid (CAD) + ferulic acid (FAD)
Fig. 4 Vertical profiles of lignin parameters in the Indian Sundarban mangrove sediments
Prasad et al. Ecological Processes (2017) 6:8 Page 7 of 15
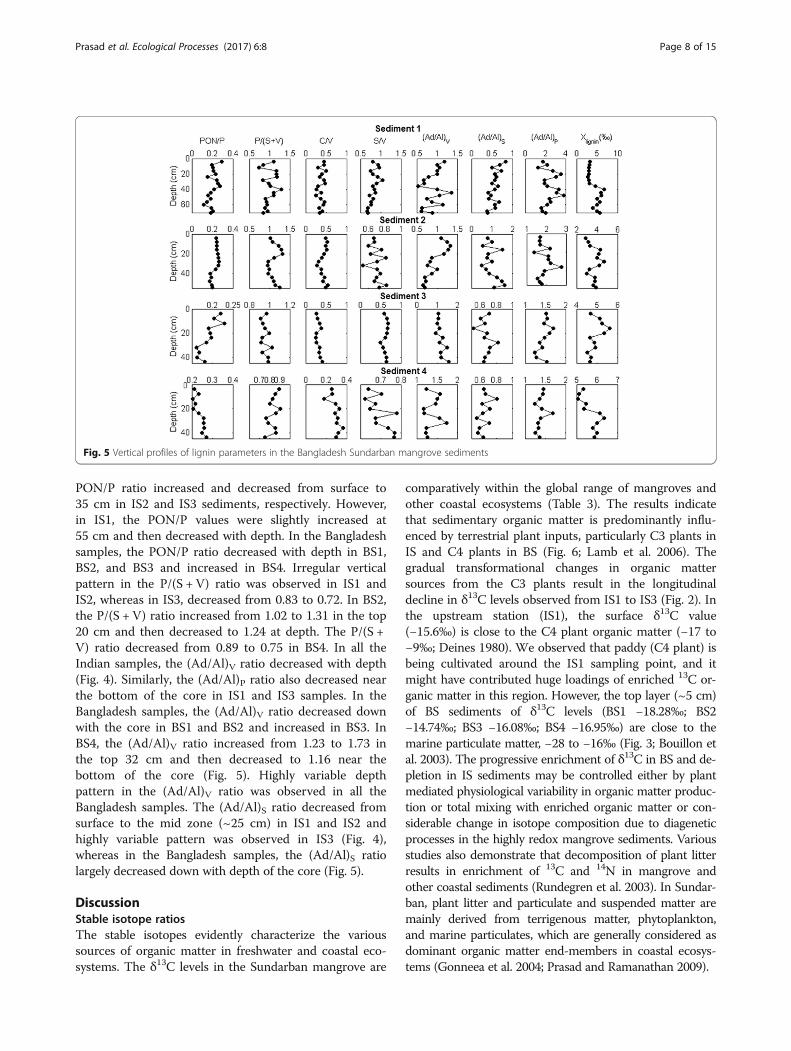
PON/P ratio increased and decreased from surface to35 cm in IS2 and IS3 sediments, respectively. However,in IS1, the PON/P values were slightly increased at55 cm and then decreased with depth. In the Bangladeshsamples, the PON/P ratio decreased with depth in BS1,BS2, and BS3 and increased in BS4. Irregular verticalpattern in the P/(S + V) ratio was observed in IS1 andIS2, whereas in IS3, decreased from 0.83 to 0.72. In BS2,the P/(S + V) ratio increased from 1.02 to 1.31 in the top20 cm and then decreased to 1.24 at depth. The P/(S +V) ratio decreased from 0.89 to 0.75 in BS4. In all theIndian samples, the (Ad/Al)V ratio decreased with depth(Fig. 4). Similarly, the (Ad/Al)P ratio also decreased nearthe bottom of the core in IS1 and IS3 samples. In theBangladesh samples, the (Ad/Al)V ratio decreased downwith the core in BS1 and BS2 and increased in BS3. InBS4, the (Ad/Al)V ratio increased from 1.23 to 1.73 inthe top 32 cm and then decreased to 1.16 near thebottom of the core (Fig. 5). Highly variable depthpattern in the (Ad/Al)V ratio was observed in all theBangladesh samples. The (Ad/Al)S ratio decreased fromsurface to the mid zone (~25 cm) in IS1 and IS2 andhighly variable pattern was observed in IS3 (Fig. 4),whereas in the Bangladesh samples, the (Ad/Al)S ratiolargely decreased down with depth of the core (Fig. 5).
DiscussionStable isotope ratiosThe stable isotopes evidently characterize the varioussources of organic matter in freshwater and coastal eco-systems. The δ13C levels in the Sundarban mangrove are
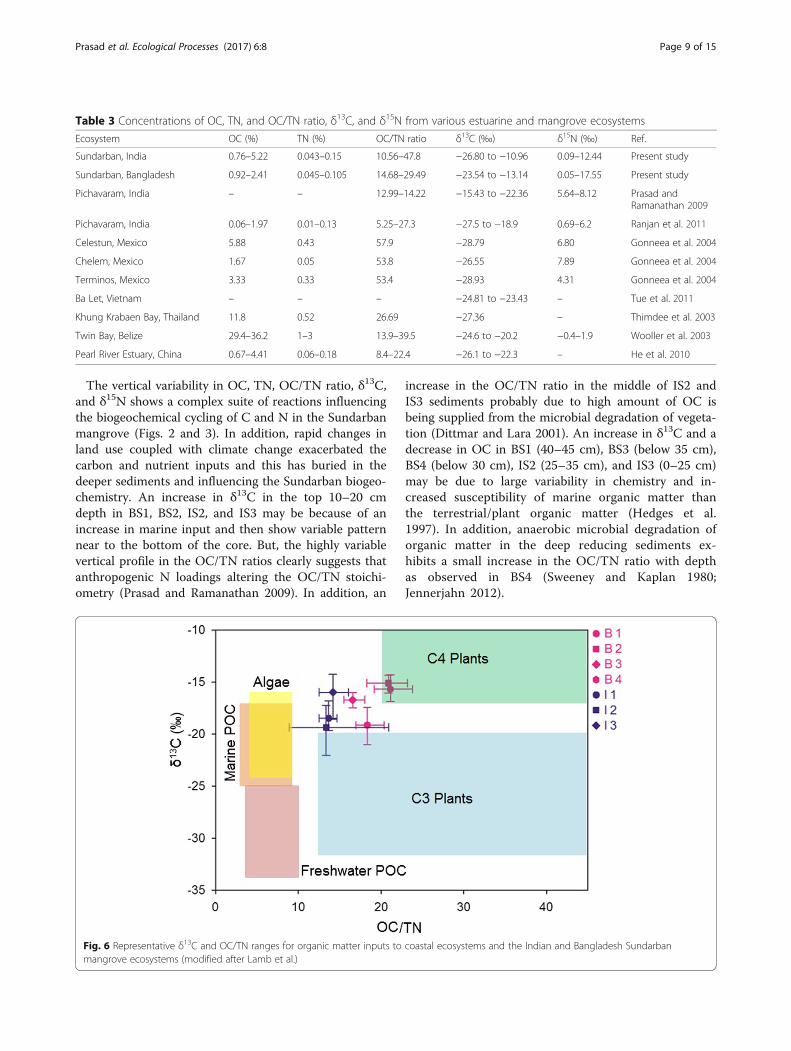
comparatively within the global range of mangroves andother coastal ecosystems (Table 3). The results indicatethat sedimentary organic matter is predominantly influ-enced by terrestrial plant inputs, particularly C3 plants inIS and C4 plants in BS (Fig. 6; Lamb et al. 2006). Thegradual transformational changes in organic mattersources from the C3 plants result in the longitudinaldecline in δ13C levels observed from IS1 to IS3 (Fig. 2). Inthe upstream station (IS1), the surface δ13C value(−15.6‰) is close to the C4 plant organic matter (−17 to−9‰; Deines 1980). We observed that paddy (C4 plant) isbeing cultivated around the IS1 sampling point, and itmight have contributed huge loadings of enriched 13C or-ganic matter in this region. However, the top layer (~5 cm)of BS sediments of δ13C levels (BS1 −18.28‰; BS2−14.74‰; BS3 −16.08‰; BS4 −16.95‰) are close to themarine particulate matter, −28 to −16‰ (Fig. 3; Bouillon etal. 2003). The progressive enrichment of δ13C in BS and de-pletion in IS sediments may be controlled either by plantmediated physiological variability in organic matter produc-tion or total mixing with enriched organic matter or con-siderable change in isotope composition due to diageneticprocesses in the highly redox mangrove sediments. Variousstudies also demonstrate that decomposition of plant litterresults in enrichment of 13C and 14N in mangrove andother coastal sediments (Rundegren et al. 2003). In Sundar-ban, plant litter and particulate and suspended matter aremainly derived from terrigenous matter, phytoplankton,and marine particulates, which are generally considered asdominant organic matter end-members in coastal ecosys-tems (Gonneea et al. 2004; Prasad and Ramanathan 2009).
Fig. 5 Vertical profiles of lignin parameters in the Bangladesh Sundarban mangrove sediments
Prasad et al. Ecological Processes (2017) 6:8 Page 8 of 15
The vertical variability in OC, TN, OC/TN ratio, δ13C,and δ15N shows a complex suite of reactions influencingthe biogeochemical cycling of C and N in the Sundarbanmangrove (Figs. 2 and 3). In addition, rapid changes inland use coupled with climate change exacerbated thecarbon and nutrient inputs and this has buried in thedeeper sediments and influencing the Sundarban biogeo-chemistry. An increase in δ13C in the top 10–20 cmdepth in BS1, BS2, IS2, and IS3 may be because of anincrease in marine input and then show variable patternnear to the bottom of the core. But, the highly variablevertical profile in the OC/TN ratios clearly suggests thatanthropogenic N loadings altering the OC/TN stoichi-ometry (Prasad and Ramanathan 2009). In addition, an
increase in the OC/TN ratio in the middle of IS2 andIS3 sediments probably due to high amount of OC isbeing supplied from the microbial degradation of vegeta-tion (Dittmar and Lara 2001). An increase in δ13C and adecrease in OC in BS1 (40–45 cm), BS3 (below 35 cm),BS4 (below 30 cm), IS2 (25–35 cm), and IS3 (0–25 cm)may be due to large variability in chemistry and in-creased susceptibility of marine organic matter thanthe terrestrial/plant organic matter (Hedges et al.1997). In addition, anaerobic microbial degradation oforganic matter in the deep reducing sediments ex-hibits a small increase in the OC/TN ratio with depthas observed in BS4 (Sweeney and Kaplan 1980;Jennerjahn 2012).
Fig. 6 Representative δ13C and OC/TN ranges for organic matter inputs to coastal ecosystems and the Indian and Bangladesh Sundarbanmangrove ecosystems (modified after Lamb et al.)
Table 3 Concentrations of OC, TN, and OC/TN ratio, δ13C, and δ15N from various estuarine and mangrove ecosystems
Ecosystem OC (%) TN (%) OC/TN ratio δ13C (‰) δ15N (‰) Ref.
Sundarban, India 0.76–5.22 0.043–0.15 10.56–47.8 −26.80 to −10.96 0.09–12.44 Present study
Sundarban, Bangladesh 0.92–2.41 0.045–0.105 14.68–29.49 −23.54 to −13.14 0.05–17.55 Present study
Pichavaram, India – – 12.99–14.22 −15.43 to −22.36 5.64–8.12 Prasad andRamanathan 2009
Pichavaram, India 0.06–1.97 0.01–0.13 5.25–27.3 −27.5 to −18.9 0.69–6.2 Ranjan et al. 2011
Celestun, Mexico 5.88 0.43 57.9 −28.79 6.80 Gonneea et al. 2004
Chelem, Mexico 1.67 0.05 53.8 −26.55 7.89 Gonneea et al. 2004
Terminos, Mexico 3.33 0.33 53.4 −28.93 4.31 Gonneea et al. 2004
Ba Let, Vietnam – – – −24.81 to −23.43 – Tue et al. 2011
Khung Krabaen Bay, Thailand 11.8 0.52 26.69 −27.36 – Thimdee et al. 2003
Twin Bay, Belize 29.4–36.2 1–3 13.9–39.5 −24.6 to −20.2 −0.4–1.9 Wooller et al. 2003
Pearl River Estuary, China 0.67–4.41 0.06–0.18 8.4–22.4 −26.1 to −22.3 – He et al. 2010
Prasad et al. Ecological Processes (2017) 6:8 Page 9 of 15
A decrease in δ13C and an increase in the OC/TNratio in IS2 (15–22 cm) and BS2 (10–30 cm) indicatethat the terrestrial organic matter inputs are dominantthan the marine inputs (Ranjan et al. 2011) and the de-posited terrestrial inputs are predominantly refractory innature. The deep sections of core samples and organicmatter quality is largely influenced by terrestrial inputsderived from the Hooghly River (India) and the RupsaRiver (Bangladesh), and slight variations may also belinked with microbial mineralization of organic matterin the deep sections of sediment (Andrews et al. 1998).The nitrogen biogeochemistry is largely influenced by
anthropogenic sources in coastal and marine ecosystems(Wigand et al. 2007; Prasad and Ramanathan 2008). Var-iations in δ15N levels with depth principally dependupon microbial immobilization of anthropogenic nitro-gen to fine-grained redox sediments (Groffman andBohlen 1999). However, the vertical variability in δ15Ndepends upon many factors like bioavailability of N, N2
fixation, δ15N levels of allochthonous N, and N fraction-ation (Meyers and Arnaboldi 2008). Relatively high δ15Nlevels observed in IS sediments are due to the 15N-enriched anthropogenic nitrogen pollution altered thenitrogen cycle (Wigand et al. 2007). Singh and Ramesh(2011) reported that ~0.38 Tg yr−1 of terrestrial N is be-ing supplied through various river systems, including theHooghly River, to the coastal Bay of Bengal. Similar tothe Pichavaram mangrove sediments (Ranjan et al.2011), an increase in δ15N levels with depth in IS2, IS3,and BS1 sediments indicates that accumulation of 15Ncompounds which are derived from anthropogenicactivities such as agricultural and aquaculture effluents,domestic sewage, and industrial effluents (Prasad andRamanathan 2008, 2009). In IS1, BS2, BS3, and BS4sediments, a decrease in δ15N levels may be attributedto the atmospheric N deposition and utilization of inor-ganic nitrogen depleted in δ15N (Ranjan et al. 2011).Largely, δ13C can be used as a proxy to delineate the
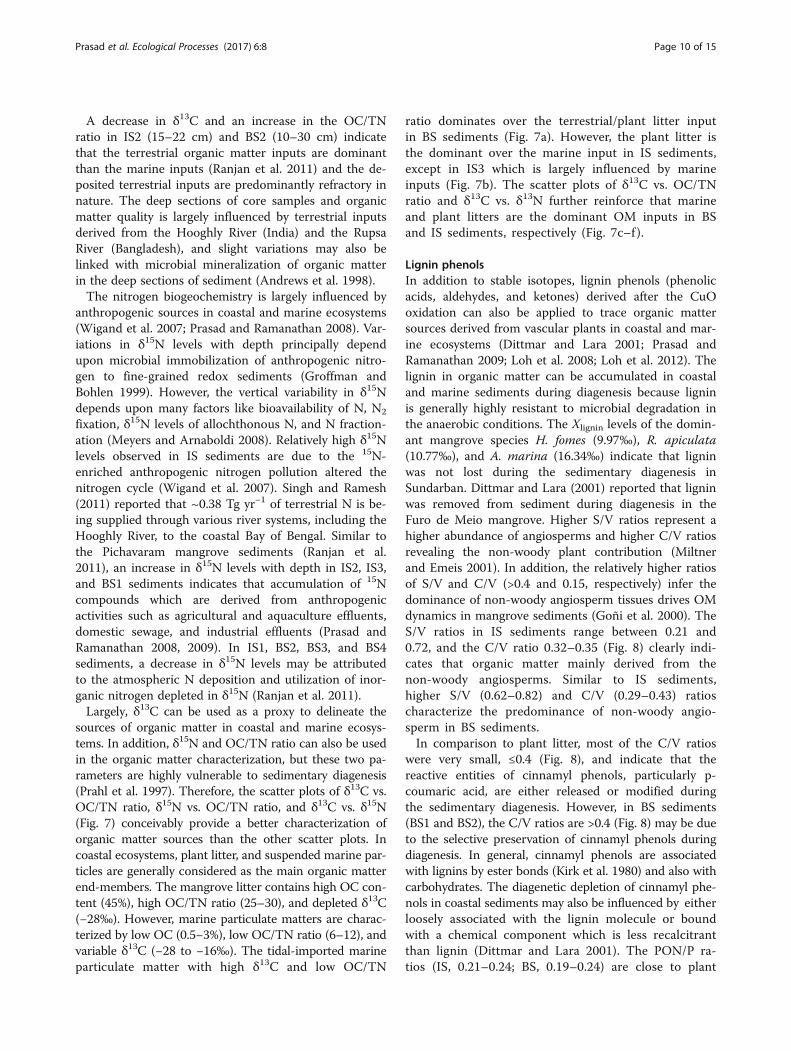
sources of organic matter in coastal and marine ecosys-tems. In addition, δ15N and OC/TN ratio can also be usedin the organic matter characterization, but these two pa-rameters are highly vulnerable to sedimentary diagenesis(Prahl et al. 1997). Therefore, the scatter plots of δ13C vs.OC/TN ratio, δ15N vs. OC/TN ratio, and δ13C vs. δ15N(Fig. 7) conceivably provide a better characterization oforganic matter sources than the other scatter plots. Incoastal ecosystems, plant litter, and suspended marine par-ticles are generally considered as the main organic matterend-members. The mangrove litter contains high OC con-tent (45%), high OC/TN ratio (25–30), and depleted δ13C(−28‰). However, marine particulate matters are charac-terized by low OC (0.5−3%), low OC/TN ratio (6–12), andvariable δ13C (−28 to −16‰). The tidal-imported marineparticulate matter with high δ13C and low OC/TN
ratio dominates over the terrestrial/plant litter inputin BS sediments (Fig. 7a). However, the plant litter isthe dominant over the marine input in IS sediments,except in IS3 which is largely influenced by marineinputs (Fig. 7b). The scatter plots of δ13C vs. OC/TNratio and δ13C vs. δ13N further reinforce that marineand plant litters are the dominant OM inputs in BSand IS sediments, respectively (Fig. 7c–f ).
Lignin phenolsIn addition to stable isotopes, lignin phenols (phenolicacids, aldehydes, and ketones) derived after the CuOoxidation can also be applied to trace organic mattersources derived from vascular plants in coastal and mar-ine ecosystems (Dittmar and Lara 2001; Prasad andRamanathan 2009; Loh et al. 2008; Loh et al. 2012). Thelignin in organic matter can be accumulated in coastaland marine sediments during diagenesis because ligninis generally highly resistant to microbial degradation inthe anaerobic conditions. The Xlignin levels of the domin-ant mangrove species H. fomes (9.97‰), R. apiculata(10.77‰), and A. marina (16.34‰) indicate that ligninwas not lost during the sedimentary diagenesis inSundarban. Dittmar and Lara (2001) reported that ligninwas removed from sediment during diagenesis in theFuro de Meio mangrove. Higher S/V ratios represent ahigher abundance of angiosperms and higher C/V ratiosrevealing the non-woody plant contribution (Miltnerand Emeis 2001). In addition, the relatively higher ratiosof S/V and C/V (>0.4 and 0.15, respectively) infer thedominance of non-woody angiosperm tissues drives OMdynamics in mangrove sediments (Goñi et al. 2000). TheS/V ratios in IS sediments range between 0.21 and0.72, and the C/V ratio 0.32–0.35 (Fig. 8) clearly indi-cates that organic matter mainly derived from thenon-woody angiosperms. Similar to IS sediments,higher S/V (0.62–0.82) and C/V (0.29–0.43) ratioscharacterize the predominance of non-woody angio-sperm in BS sediments.In comparison to plant litter, most of the C/V ratios
were very small, ≤0.4 (Fig. 8), and indicate that thereactive entities of cinnamyl phenols, particularly p-coumaric acid, are either released or modified duringthe sedimentary diagenesis. However, in BS sediments(BS1 and BS2), the C/V ratios are >0.4 (Fig. 8) may be dueto the selective preservation of cinnamyl phenols duringdiagenesis. In general, cinnamyl phenols are associatedwith lignins by ester bonds (Kirk et al. 1980) and also withcarbohydrates. The diagenetic depletion of cinnamyl phe-nols in coastal sediments may also be influenced by eitherloosely associated with the lignin molecule or boundwith a chemical component which is less recalcitrantthan lignin (Dittmar and Lara 2001). The PON/P ra-tios (IS, 0.21–0.24; BS, 0.19–0.24) are close to plant
Prasad et al. Ecological Processes (2017) 6:8 Page 10 of 15
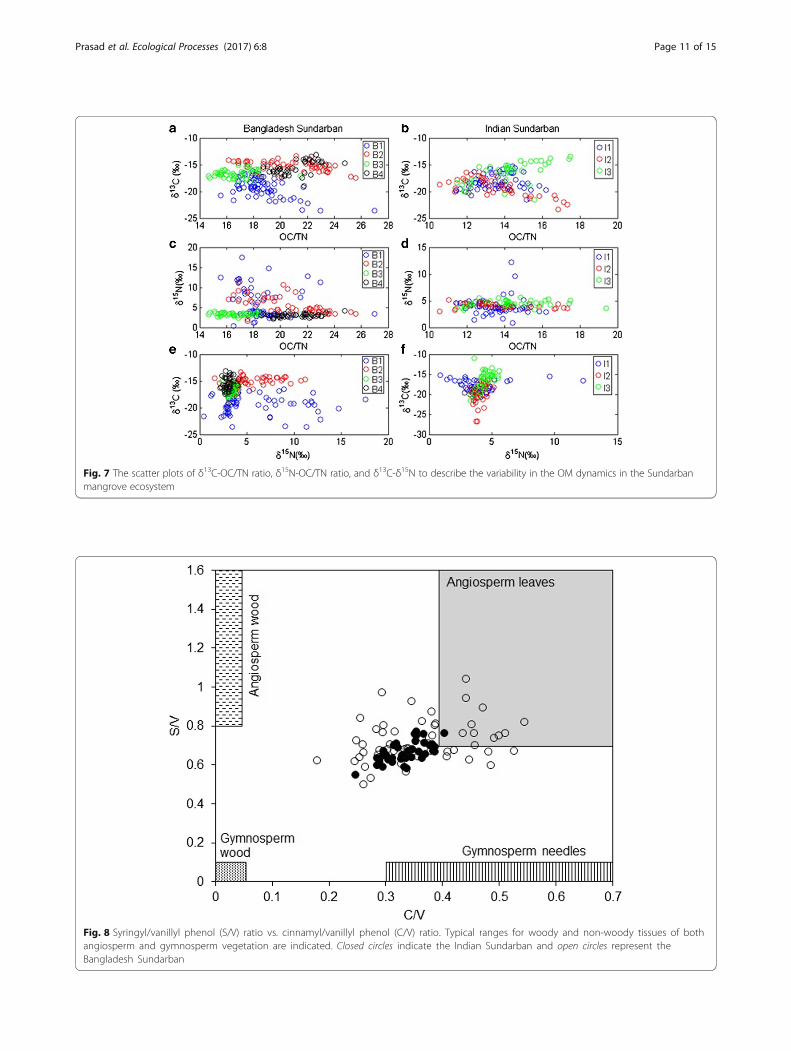
Fig. 8 Syringyl/vanillyl phenol (S/V) ratio vs. cinnamyl/vanillyl phenol (C/V) ratio. Typical ranges for woody and non-woody tissues of bothangiosperm and gymnosperm vegetation are indicated. Closed circles indicate the Indian Sundarban and open circles represent theBangladesh Sundarban
Fig. 7 The scatter plots of δ13C-OC/TN ratio, δ15N-OC/TN ratio, and δ13C-δ15N to describe the variability in the OM dynamics in the Sundarbanmangrove ecosystem
Prasad et al. Ecological Processes (2017) 6:8 Page 11 of 15
litter (0.19–0.24) representing the reactivity of p-hydroxyacetophenone comparable to total p-hydroxylphenols during diagenesis and microbial degradation(Prasad and Ramanathan 2009). In this context, P/(V + S)ratio can also applied as a proxy for methylation. Inaquatic ecosystems, lignin degradation generally initiatedwith either oxidation of propyl side chain or demethyla-tion of the methyl groups or both. But, in both IS and BSsediments, P/(V + S), (Ad/Al)V, (Ad/Al)S, and (Ad/Al)P ra-tios are lower than the plant litter explaining that aromaticring cleavage may be the dominant mechanism for lignindegradation in the Sundarban sediments (Dittmar andLara 2001; Loh et al. 2012). The Ad/Al ratios werehigher than the plant litter indicating that the ligninorganic matter degradation may be influenced by theoxidation of propyl side chain in the Sundarban man-grove ecosystem. Highly variable S/V ratios were ob-served in both mangrove sediments which explain thatthe relative diagenetic activity of syringyl phenols tovanillyl phenols are largely regulated by in situ redoxconditions and microbial interactions with the organicmatter at the particular depth. However, the relativelyconstant S/V ratio was observed in BS3 sediment sug-gesting a similar diagenetic activity for syringyl phenolsto vanillyl phenols.The relative contribution of terrestrial plant litter, ses-
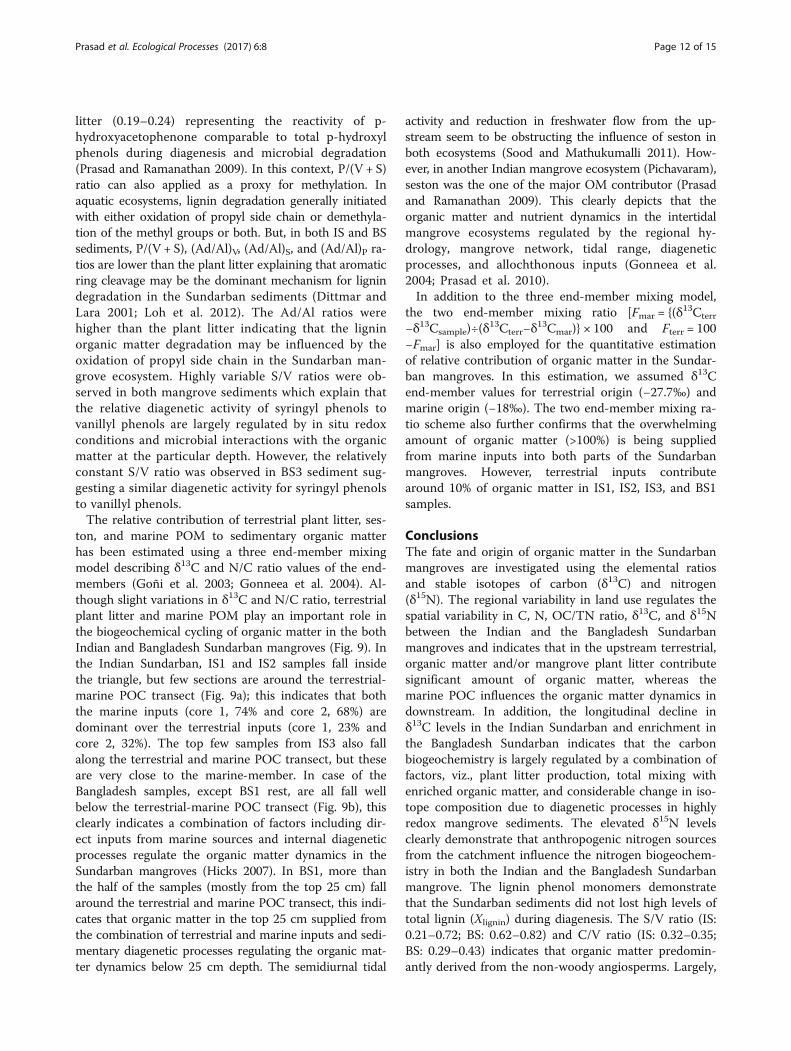
ton, and marine POM to sedimentary organic matterhas been estimated using a three end-member mixingmodel describing δ13C and N/C ratio values of the end-members (Goñi et al. 2003; Gonneea et al. 2004). Al-though slight variations in δ13C and N/C ratio, terrestrialplant litter and marine POM play an important role inthe biogeochemical cycling of organic matter in the bothIndian and Bangladesh Sundarban mangroves (Fig. 9). Inthe Indian Sundarban, IS1 and IS2 samples fall insidethe triangle, but few sections are around the terrestrial-marine POC transect (Fig. 9a); this indicates that boththe marine inputs (core 1, 74% and core 2, 68%) aredominant over the terrestrial inputs (core 1, 23% andcore 2, 32%). The top few samples from IS3 also fallalong the terrestrial and marine POC transect, but theseare very close to the marine-member. In case of theBangladesh samples, except BS1 rest, are all fall wellbelow the terrestrial-marine POC transect (Fig. 9b), thisclearly indicates a combination of factors including dir-ect inputs from marine sources and internal diageneticprocesses regulate the organic matter dynamics in theSundarban mangroves (Hicks 2007). In BS1, more thanthe half of the samples (mostly from the top 25 cm) fallaround the terrestrial and marine POC transect, this indi-cates that organic matter in the top 25 cm supplied fromthe combination of terrestrial and marine inputs and sedi-mentary diagenetic processes regulating the organic mat-ter dynamics below 25 cm depth. The semidiurnal tidal
activity and reduction in freshwater flow from the up-stream seem to be obstructing the influence of seston inboth ecosystems (Sood and Mathukumalli 2011). How-ever, in another Indian mangrove ecosystem (Pichavaram),seston was the one of the major OM contributor (Prasadand Ramanathan 2009). This clearly depicts that theorganic matter and nutrient dynamics in the intertidalmangrove ecosystems regulated by the regional hy-drology, mangrove network, tidal range, diageneticprocesses, and allochthonous inputs (Gonneea et al.2004; Prasad et al. 2010).In addition to the three end-member mixing model,
the two end-member mixing ratio [Fmar = {(δ13Cterr
−δ13Csample)÷(δ13Cterr−δ
13Cmar)} × 100 and Fterr = 100−Fmar] is also employed for the quantitative estimationof relative contribution of organic matter in the Sundar-ban mangroves. In this estimation, we assumed δ13Cend-member values for terrestrial origin (−27.7‰) andmarine origin (−18‰). The two end-member mixing ra-tio scheme also further confirms that the overwhelmingamount of organic matter (>100%) is being suppliedfrom marine inputs into both parts of the Sundarbanmangroves. However, terrestrial inputs contributearound 10% of organic matter in IS1, IS2, IS3, and BS1samples.
ConclusionsThe fate and origin of organic matter in the Sundarbanmangroves are investigated using the elemental ratiosand stable isotopes of carbon (δ13C) and nitrogen(δ15N). The regional variability in land use regulates thespatial variability in C, N, OC/TN ratio, δ13C, and δ15Nbetween the Indian and the Bangladesh Sundarbanmangroves and indicates that in the upstream terrestrial,organic matter and/or mangrove plant litter contributesignificant amount of organic matter, whereas themarine POC influences the organic matter dynamics indownstream. In addition, the longitudinal decline inδ13C levels in the Indian Sundarban and enrichment inthe Bangladesh Sundarban indicates that the carbonbiogeochemistry is largely regulated by a combination offactors, viz., plant litter production, total mixing withenriched organic matter, and considerable change in iso-tope composition due to diagenetic processes in highlyredox mangrove sediments. The elevated δ15N levelsclearly demonstrate that anthropogenic nitrogen sourcesfrom the catchment influence the nitrogen biogeochem-istry in both the Indian and the Bangladesh Sundarbanmangrove. The lignin phenol monomers demonstratethat the Sundarban sediments did not lost high levels oftotal lignin (Xlignin) during diagenesis. The S/V ratio (IS:0.21–0.72; BS: 0.62–0.82) and C/V ratio (IS: 0.32–0.35;BS: 0.29–0.43) indicates that organic matter predomin-antly derived from the non-woody angiosperms. Largely,
Prasad et al. Ecological Processes (2017) 6:8 Page 12 of 15
the Ad/Al ratios describe that the degradation of vascu-lar organic matter is mainly mediated by the oxidationof propyl side chain. The three end-member mixingmodel also further reinforces that the marine POCinputs are dominating over the terrestrial inputs in bothparts of Sundarban. However, further research isrequired to estimate the sediment accretion rates thatcould facilitate to describe and estimate the carbonburial in the changing climate, which is highly requiredin constructing the regional carbon budgets.
AcknowledgementsThis research was funded by the Asia-Pacific Network for Global ChangeResearch, Japan. We thank Dr. Mahmood Hossain, Mr. Mohammad RaqibulHasan Siddique, and Mr. Kushal Roy from Khulna University for theirassistance in the sample collection and field analysis.
Authors’ contributionsMBKP, ALR, and DKD developed the research concept and designed theproject objectives. MBKP, AK, and DKD collected and prepared thesamples from the field. MBKP and AK analyzed the samples. MBKPdrafted the manuscript. All authors read, contributed, and approved thefinal manuscript.
Fig. 9 The three end-member mixing plot to describe the potential contributors of OM in the Sundarban mangrove ecosystem
Prasad et al. Ecological Processes (2017) 6:8 Page 13 of 15
Competing interestsThe authors declare that they have no competing interests.
Author details122616 Shining Harness Street, Clarksburg, MD 20871, USA. 2School ofEnvironmental Sciences, Jawaharlal Nehru University, New Delhi 110067,India. 3Environmental Science Discipline, Khulna University, Khulna 9208,Bangladesh.
Received: 5 January 2017 Accepted: 8 February 2017
ReferencesAndrews JE, Greenaway AM, Dennis PF (1998) Combined carbon isotope and C/Nratios
as indicators of source and fate of organicmatter in a poorly flushed, tropicalestuary: Hunts Bay, Kingston Harbour, Jamaica. Estuar Coast Shelf Sci 46:743–756
Baneerjee K, Chowdhury MR, Sengupta K, Mitra A (2012) Influence ofanthropogenic and natural factors on the mangrove soil of IndianSundarbans wetland. Arch Environ Sci 6:80–91
Banerjee K, Senthilkumar B, Purvaja R, Ramesh R (2012) Sedimentation and tracemetal distribution in selected locations of Sundarbans mangroves and Hooghlyestuary, northeast coast of India. Environ Geochem Health 34(1):27–42
Biswas H, Mukhopadhyay SK, De TK, Sen S, Jana TK (2004) Biogenic controls on theair-water carbon dioxide exchange in the Sundarban mangrove environment,northeast coast of Bay of Bengal, India. Limnol Oceanogr 49(1):95–101
Bose S (2006) Mangrove forests in Sunderbans active delta - ecolog-ical disaster andremedies. http://archive.riversymposium.com/2005/index.php?element=12.
Bouillon S, Dahdouh-Guebas F, Rao AVVS, Koedam N, Dehairs F (2003) Sources oforganic carbon in mangrove sediments: variability and possible ecologicalimplications. Hydrobiologia 495:33–39
Deines P (1980) The isotopic composition of reduced organic carbon. In: Fritz P,Fontes JC (eds) Handbook of Environmental Isotope Geochemistry, vol 1, TheTerrestrial Environment. A. Elsevier, Amsterdam, pp 329–406
Dittmar T, Lara RJ (2001) Driving forces behind nutrient and organic matterdynamics in a mangrove tidal creek in North Brazil. Estuar Coast ShelfSci 52:249–259
Dittmar T, Lara RJ, Kattner G (2001) River or mangrove? Tracing major organicmatter sources in tropical Brazilian coastal waters. Mar Chem 73:253–271
Dittmar T, Hertkorn N, Kattner G, Lara RJ (2006) Mangroves, a major source ofdissolved organic carbon to the oceans. Global Biogeochem Cyc 20:GBS1012
Erwin KL (2009) Wetlands and global climate change: the role of wetlandrestoration in a changing world. Wetland Ecol Mgmt 17(1):71–84
Goñi MA, Yunker MB, Macdonald RW, Eglinton TI (2000) The supply andpreservation of organic biomarkers in arctic sediments from the MackenzieRiver and Beaufort Shelf. Mar Chem 71:23–51
Goñi M, Teixeira M, Perkey D (2003) Sources and distribution of organic matter ina river-dominated estuary (Winyah Bay, SC, USA). Estuar Coast ShelfSci 57:1023–1048
Gonneea ME, Paytan A, Herrera-Silveira JE (2004) Tracing organic matter sourcesand carbon burial in mangrove sediments over the past 160 years. EstuarCoast Shelf Sci 61:211–227
Gopal B, Chauhan M (2006) Biodiversity and its conservation in the Sundarbanmangrove ecosystem. Aquat Sci 68:338–354
Groffman PM, Bohlen PJ (1999) Soil and sediment biodiversity: cross-systemcomparisons and large-scale effects. Bioscience 49(2):139–148
He B, Dai M, Huang W, Liu Q, Chen H, Xu L (2010) Sources and accumulation oforganic carbon in the Pearl River Estuary surface sediment as indicated byelemental, stable carbon isotopic, and carbohydrate compositions.Biogeosciences 7:3343–3362
Hedges JI, Ertel JR (1982) Characterization of lignin by gas capillarychromatography of cupric oxide oxidation products. Anal Chem 54:174–178
Hedges JI, Keil RG, Benner R (1997) What happens to terrestrial organic matter inthe ocean? Org Geochem 27:195–212
Hicks C (2007) Sediment organic carbon pools and sources in a recently constructedmangrove and seagrass ecosystem. MS dissertation, University of Florida.
Jennerjahn TC (2012) Biogeochemical response of tropical coastal systems topresent and past environmental change. Earth Sci Rev 114:19–41
Kirk TK, Higuchi T, Chang HM (1980) Lignin biodegradation: microbiology,chemistry and potential applications. CRC Press Inc., Boca Raton
Kristensen E, Bouillon S, Dittmar T, Marchand C (2008) Organic matter dynamicsin mangrove ecosystems. Aquat Bot 89:201–219
Lamb AL, Wilson GP, Leng MJ (2006) A review of coastal palaeoclimate andrelative sea-level reconstructions using δ13C and C/N ratios in organicmaterial. Earth-Sci Rev 75:29–57
Lobbes JM, Fitznar HP, Kattner G (1999) High-performance liquidchromatography of lignin-derived phenols in environmental samples withdiode detection. Anal Chem 71:3008–3012
Loh PS, Reeves AD, Harvey SM, Overnell J, Miller AEJ (2008) The fate of terrestrialorganic matter in two Scottish sea lochs. Estuar Coast Shelf Sci 76:566–579
Loh PS, Chen C-T, Anshari GZ, Wang JT, Lou JY, Wang SL (2012) Acomprehensive survey of lignin geochemistry in the sedimentary organicmatter along the Kapuas River (West Kalimantan, Indonesia). J AsianEarth Sci 43:118–129
Mandal RN, Das CS, Naskar KR (2012) Dwindling Indian Sundarban mangrove: theway out. Sci Cul 76(7-8):275–282
Meyers PA, Arnaboldi M (2008) Paleoceanographic implications of nitrogen andorganic carbon isotopic excursions in mid-Pleistocene sapropels from theTyrrhenian and Levantine Basins, Mediterranean Sea. PalaeogeogrPalaeoclimatol Palaeoecol 266:112–118
Miltner A, Emeis KC (2001) Terrestrial organic matter in surface sediments of theBaltic Sea, NW Europe, as determined by CuO oxidation. GeochimCosmochim Acta 65(8):1285–1299
Mitra A, Gangopadhyay A, Dube A, Schmidt ACK, Banerjee K (2009) Observedchanges in water mass properties in the Indian Sundarbans (northwesternBay of Bengal) during 1980–2007. Cur Sci 97(10):1445–1452
Muzuka ANN, Shunula JP (2006) Stable isotope compositions of organic carbonand nitrogen of two mangrove stands along the Tanzanian coastal zone.Estuar Coast Shelf Sci 66:447–458
Prahl FG, De Lange GT, Scholten S, Cowie GL (1997) A case of post-depositionalaerobic degradation of terrestrial organic matter in turbidite deposits fromthe Madeira Abyssal Plain. Org Geochem 27:141–152
Prasad MBK, Ramanathan AL (2008) Sedimentary nutrient dynamics in a tropicalestuarine mangrove ecosystem. Estuar Coast Shelf Sci 80:60–66
Prasad MBK, Ramanathan AL (2009) Organic matter characterization in a tropicalestuarine-mangrove ecosystem of India: preliminary assessment by usingstable isotopes and lignin phenols. Estuar Coast Shelf Sci 84(4):617–624
Prasad MBK, Dittmar T, Ramanathan AL (2010) Organic matter and mangroveproductivity. In: Ramanathan AL, Bhattacharya P, Dittmar T, Prasad MBK,Nepaune B (eds) Management and Sustainable Development of the CoastalZone Environments. Springer, New Delhi, pp 175-193
Prasad MBK, Kaushal SS, Murtugudde R (2013) Long-term pCO2 dynamics inrivers in the Chesapeake Bay watershed. Appl Geochem 31:209–215
Preston T, Owens NJP (1983) Interfacing an automatic elemental analyser with anisotope ratio mass spectrometer: the potential for fully automated totalnitrogen and nitrogen-15 analysis. Analyst 108:971–977
Ranjan RK, Routh J, Ramanathan AL, Val Klump J (2011) Elemental and stableisotope records of organic matter input and its fate in the Pichavarammangrove–estuarine sediments (Tamil Nadu, India). Mar Chem 126:163–172
Rundegren N, Loader NJ, Hammarlund D (2003) Stable carbon isotopecomposition of terrestrial leaves: inter- and intraspecies variability, celluloseand whole-leaf tissue difference and potential for climate reconstruction. JQuat Sci 18:583–590
Singh A, Ramesh R (2011) Contribution of riverine dissolved inorganic nitrogenflux to new production in the coastal northern Indian Ocean: an assessment.Int J Oceanogr. doi:10.1155/2011/983561
Sood A, Mathukumalli MBK (2011) Managing international river basins: reviewingIndia–Bangladesh transboundary water issues. Int J River Basin Mgmt9(1):43–52
Sweeney RE, Kaplan IR (1980) Natural abundances of 15N as a source indicator fornear-shore marine sedimentary and dissolved nitrogen. Mar Chem 9:81–94
Thimdee W, Deein G, Sangrungruang C, Nishioka J, Matsunaga K (2003) Sourcesand fate of organic matter in Khung Krabaen Bay (Thailand) as traced byδ13C and C/N atomic ratios. Wetlands 23(4):729–738
Thornton SF, McManus J (1994) Application of organic carbon and nitrogenstable isotopes and C/N ratios as source indicators of organic matterprovenance in estuarine systems: evidence from the Tay Estuary, Scotland.Estuar Coast Shelf Sci 38:219–233
Tue NT, Hamaoka H, Sogabe A, Quy TD, Nhuan MT, Omori K (2011) Sources ofsedimentary organic carbon in mangrove ecosystems from Ba Lat estuary,Red River, Vietnam. In: Omori K, Guo X, Yoshie N, Fujii N, Handoh IC, Isobe A,Tanabe S (eds) Interdisciplinary Studies on Environmental Chemistry-MarineEnvironmental Modeling & Analysis. Terrapub, pp. 151–157
Prasad et al. Ecological Processes (2017) 6:8 Page 14 of 15

Wigand C, McKinney RA, Cole ML, Thursby GB, Cummings J (2007) Varying stablenitrogen isotope ratios of different marsh plants and their relationships withwastewater nitrogen and land use in New England, USA. Environ MonitAsses 131:71–81
Wooller MJ, Smallwood B, Jacobson M, Fogel M (2003) Carbon and nitrogenstable isotopic variation in Laguncularia racemosa from Florida and Belize:implication for trophic level studies. Hydrobiologia 499:13–23
Submit your manuscript to a journal and benefi t from:
7 Convenient online submission
7 Rigorous peer review
7 Immediate publication on acceptance
7 Open access: articles freely available online
7 High visibility within the fi eld
7 Retaining the copyright to your article
Submit your next manuscript at 7 springeropen.com
Prasad et al. Ecological Processes (2017) 6:8 Page 15 of 15
![Cyclone effects on Sundarban [Read-Only]cdn.cseindia.org/userfiles/presentation3_sundarbans.pdf · 2019-07-18 · The Sundarban • The Sundarban mangrove covers about 0.6 million](https://img.pdfslide.net/doc/110x75/5ea6fe17564be16b902fc148/cyclone-effects-on-sundarban-read-onlycdn-2019-07-18-the-sundarban-a-the.jpg)