Embed Size (px)
Citation preview
J.A. Izbicki et al., Annals of Environmental Science / 2009, Vol 3, 139-178
www.aes.northeastern.edu, ISSN 1939-2621 139
SOURCES OF FECAL INDICATOR BACTERIA IN URBAN STREAMS AND OCEAN BEACHES, SANTA BARBARA, CALIFORNIA John A. Izbicki,1* Peter W. Swarzenski,2 Christopher D. Reich,3 Carole Rollins,4 and Patricia A. Holden5
1 U.S. Geological Survey, California Water Science
Center, 4165 Spruance Street, San Diego, California 92101, USA
2 U.S. Geological Survey, Pacific Science Center, 400 Natural Bridges Dr., Santa Cruz, CA 95060, USA
3 U.S. Geological Survey, Coastal Marine Geology Program, 600 4th Street South, Room A254, St. Petersburg, FL 33701, USA
4 City of Santa Barbara, Water Resources Laboratory, El Estero Wastewater Treatment Plant, 520 East Yanonali Street, Santa Barbara, CA 93103, USA
5 Bren School of Environmental Science and Management, University of California Santa Barbara, 2400 Bren Hall Room 3508, Santa Barbara, California 93106, USA
Received May 6, 2009; in final form August 20, 2009; Accepted September 10, 2009.
ABSTRACT Fecal indicator bacteria (FIB) indicative of fecal contamination in urban streams and recreational ocean beaches in Santa Barbara, California often exceed recreational water-quality standards. During low flow, FIB and human-specific Bacteroides concentrations in urban streams were associated with point discharges. FIB concentrations varied three-fold during diurnal sampling as a result of small variations in these discharges. During stormflow, FIB concentrations were higher than during low flow and varied over three orders of magnitude. FIB in stormflow were associated with non-point sources, and concentrations decreased as fecal contamination was washed from the urban watershed. Sources of fecal contamination to near-shore ocean water included surface discharges
* Corresponding author: Phone: +619-225-6131, FAX +619-225-6101, e-mail: <[email protected]>
from urban streams, and fecal material from birds associated with sand, and to a lesser degree kelp, along the beachfront. FIB concentrations varied over three orders of magnitude during daily tidal cycles. Concentrations were higher during ebb tides and decreased to less than the detection limit during low tide when seepmeter and 222Rn data show groundwater discharge to the ocean was greatest. Groundwater discharge and leakage from a sewer line buried in the sand were not large sources of FIB contamination to near-shore waters. Interpretations of the sources of FIB from Principal Component Analysis (PCA) of genetic (Terminal-Restriction Fragment Length Poly-morphism, T-RFLP, data), molecular (PhosphoLipid Fatty Acid, PLFA, data), and chemical data (such as caffeine, fecal sterols, and detergent metabolites) were similar and consistent with interpretations supported by physical measures of water flow. The most robust PCA results were from PLFA data which explained 97 percent of the total variance within the first and second principal components. In contrast PCA analysis of chemical and T-RFLP data, explained 34 and 32 percent of the total variance, respectively. However, T-RFLP and chemical tracers captured relations not apparent in PLFA data, and certain compounds, especially the fecal sterols, lent them-selves to specific interpretations of the origin of fecal contamination. Keywords: fecal indicator bacteria, submarine ground-water discharge (SDG), surface water, groundwater, bacterial source-tracking 1. INTRODUCTION Direct measurement of human pathogens in recre-ational water is not commonly made because these assays are time consuming and expensive. In addition, assays for many human pathogens are not available for routine application. Instead, fecal indicator bacteria (FIB) are used as a surrogate for pathogens to determine fecal contamination and potential health hazards associated with recreational waters. FIB are used as a surrogate because they are 1) easily and relatively rapidly measured using standardized tests, 2) they are present at high concentrations in human waste, and 3) epidemiological studies have linked high FIB concentrations to gastrointestinal and respiratory illness in humans [1-6]. Some of the most commonly used FIB are fecal coliform, Escherichia coli (E. coli), and enterococci. Although not necessarily fecal in origin, total coliform bacteria also are commonly used

J.A. Izbicki et al., Annals of Environmental Science / 2009, Vol 3, 139-178
www.aes.northeastern.edu, ISSN 1939-2621 140
with FIB to assess microbial contamination of recreational waters.
The use of FIB to determine health hazards associated with recreational waters is complicated by their presence in warm-blooded animals other than humans, including seabirds living along shorelines, farm animals, pets, rodents and other animals common in urban and recreational areas. In addition to human and animal feces, growth or extended survival of FIB can occur in streambed sediments [7-10], in biofilms along stream channels and urban drains [11], and in beach sands [12-16]. The source of fecal contamin-ation is important since it is widely believed that human feces pose a greater human-health risk than animal feces. This is because fecal contamination from non-human sources does not contain human-specific viral pathogens [17].
Fecal contamination to urban streams and recre-ational beaches from urban drains as incidental dis-charges during baseflow, and from larger discharges during stormflow, has long been known and has been the focus of much research in recent years [11,18-21]. Streamflow and other surface discharges to the ocean have been shown to be a source of fecal contamination to near-shore ocean water extending as much as 5,000 m along the shoreline from the discharge point - with dilution rather than death, predation, or other bacterial inactivation processes being the primary attenuation mechanism [22]. Recent studies have implicated groundwater discharge as a possible source of fecal contamination to recreational ocean beaches [23-25].
In recent years, a wide range of genetic, mole-cular, and chemical tracer techniques have become available to supplement traditional measurements of FIB concentrations in water and to aid in determining the source of fecal contamination [26,27]. These tracer techniques include, but are not limited to, 1) direct measurement of fecal microorganisms such as Bacteroides or enteroviruses [28-35]. 2) genetic and molecular characterization of microbial populations associated with different fecal sources [31,36-40], and 3) measurement of low-concentrations of chemicals commonly associated with human wastewater [34,41-43], including fecal sterols [44-47].
The use of tracer techniques, especially genetically-based tracers, to determine the source of fecal contamination in recreational waters has expanded rapidly in recent years. However, only a few studies have attempted to constrain assessment of fecal contamination sources by integrating FIB data with multiple tracer techniques [30,32,36]. Even fewer studies have integrated FIB and tracer techniques with hydrologic data that quantify the movement of water
from different sources [11,36] or with groundwater exchange in beach settings over tidal cycles [32,48]. The combined use of FIB and multiple alternative tracers of fecal contamination constrained by an understanding of the movement of water may be a powerful approach for identifying FIB contributions from human and nonhuman sources.
The Santa Barbara area, 150 km northwest of Los Angeles, California (Figure 1) was selected to test the use of FIB data with multiple tracers of fecal contamination, constrained by an understanding of the physical hydrology, to determine the source of fecal contamination in an urban setting along the Pacific Ocean. The study area includes urban streams and ocean beaches. The urban streams are potentially subject to point and non-point FIB contamination from leaking sewer lines and laterals, discharges from urban baseflow, and stormflow runoff. Although not used as recreational waters, urban streams in the area are subject to incidental recreational use by the local population, and possible contamination by a transient homeless population. Ocean beaches in Santa Barbara are used for recreation and are potentially subject to fecal contamination from point and non-point sources similar to those affecting urban streams. Of particular concern was the potential for leakage from a sewer line underlying West Beach, less than 100 m inland from the high tide line. In addition, the ocean beaches also are potentially subject to fecal contamination from 1) shorebirds and other marine wildlife, 2) human use, including bathing and boating, and 3) discharges from streams and coastal estuaries known to contain high concentrations of FIB. 1.1. Purpose and Scope The purpose of this study was to determine the source of fecal contamination to urban streams and to near-shore ocean water in Santa Barbara, California between April 2005 and April 2007. The scope of the study included: 1) measurement of stream discharge and sample collection along an urban stream during baseflow and stormflow, 2) measurement of water levels and sample collection from water-table wells installed at selected locations in the urban area, near the stream, and at the beachfront, and 3) measurement of water exchange and FIB concentrations at the beachfront during selected tidal cycles. Water exchange at the beachfront was evaluated on the basis of changes in water levels in wells, seepmeter data, and isotopic data. Potential sources of fecal contam-ination were evaluated using genetic, molecular, and chemical data from surface water, groundwater, near-
J.A. Izbicki et al., Annals of Environmental Science / 2009, Vol 3, 139-178
www.aes.northeastern.edu, ISSN 1939-2621 141
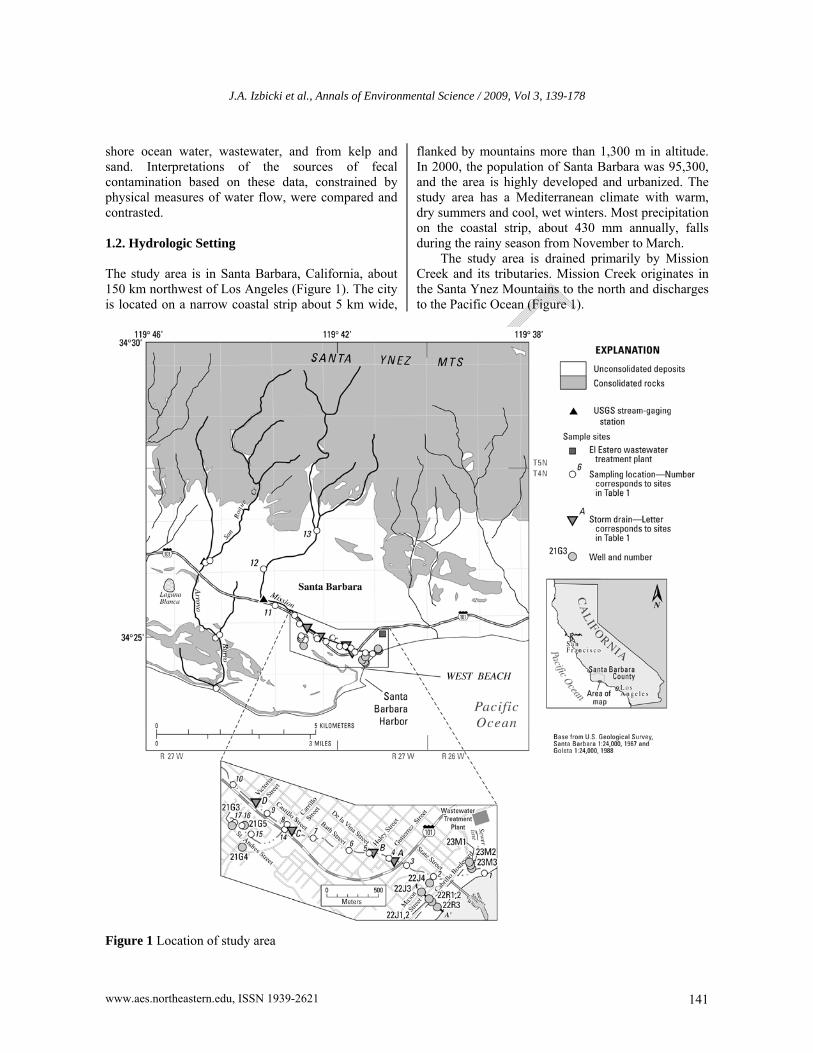
shore ocean water, wastewater, and from kelp and sand. Interpretations of the sources of fecal contamination based on these data, constrained by physical measures of water flow, were compared and contrasted. 1.2. Hydrologic Setting The study area is in Santa Barbara, California, about 150 km northwest of Los Angeles (Figure 1). The city is located on a narrow coastal strip about 5 km wide,
flanked by mountains more than 1,300 m in altitude. In 2000, the population of Santa Barbara was 95,300, and the area is highly developed and urbanized. The study area has a Mediterranean climate with warm, dry summers and cool, wet winters. Most precipitation on the coastal strip, about 430 mm annually, falls during the rainy season from November to March.
The study area is drained primarily by Mission Creek and its tributaries. Mission Creek originates in the Santa Ynez Mountains to the north and discharges to the Pacific Ocean (Figure 1).
Figure 1 Location of study area

J.A. Izbicki et al., Annals of Environmental Science / 2009, Vol 3, 139-178
www.aes.northeastern.edu, ISSN 1939-2621 142
Mission Creek is perennial along its lower reaches, where groundwater discharge sustains flow during the dry season [49]. In addition, base flow in the perennial downstream reach is sustained by flow from urban drains and dewatering wells used to lower water levels near highway underpasses and larger buildings. Much of the city was built in the early part of the 20th century. Although the sewer infrastructure has been updated, laterals connecting individual homes to the sewer may date from the time of original construction. The potential for sewage from leaking sewer lines or laterals to enter shallow groundwater and discharge to streams is increased by the high water table underlying much of the city.
Discharge from Mission Creek to the ocean is not continuous. During the dry season the mouth of the creek is impounded by a sand berm built by wave action along the beachfront to form a coastal estuary or “lagoon”. Water from the lagoon either discharges as small flows across the berm, or as infiltration through the berm. In recent years, water has been diverted from the lagoon to the El Estero wastewater treatment plant (WWTP). Occasionally the berm breaches, rapidly releasing a large amount of water to the ocean. These breaches commonly occur as a result of increased streamflow from precipitation and subsequent runoff into Mission Creek.
West Beach is a south facing ocean beach west of the mouth of Mission Creek. Discharges from Mission Creek may be a source of fecal contamination to West Beach. In addition, a sewer line runs the length of the beach about 100 m from the high tide line. There is concern that leakage from the sewer may contaminate shallow groundwater that subsequently discharges to the ocean. In addition, stormwater runoff from city streets discharged to the beach sand and direct discharges from commercial and recreational boats in the nearby harbor are other potential sources of fecal contamination to West Beach. West Beach is relatively protected from wave action because of its south facing position along the Santa Barbara Channel and the nearby harbor. Kelp and sand along protected beach areas may harbor FIB [14] and contribute to fecal contamination of near-shore ocean water [48]. 2. METHODS 2.1. Field Methods Grab samples were collected from streams and urban drains in the center of flow during April 2005 and August 2005 (Figure 1 and Table 1). Flow measure-
ments were made at the time of collection using current meters, flumes, or calibrated containers depending on site conditions. Automated samplers, equipped with Teflon sample lines were used to collect time-series data on Mission Creek at Gutierrez Street (site 4 in Figure 1) for diurnal sampling in August 2005, and stormflow sampling during January 2006. Intakes for water samplers were located in the center of flow and sample lines were rinsed three times prior to collection of each sample. Stream stage was measured using pressure transducers placed near the sample intake. For samples collected during August 2005, changes in stage were converted to flow from concurrent discharge measurements. Discharge measurements needed to convert stream stage to stream flow were not collected during stormflow.
Thirteen, 2-inch diameter PVC wells (Figure 1 and Table 1) installed using an auger drill rig were sampled in November 2005, May-June 2006, and April 2007. Wells were assigned numbers according to their position in the Public Land Survey System. In Tables and Figure titles, the complete well number including township, range, section, and sequence number is provided (for example 4N/27W-22R3). In the text a shortened form of the well number including only the section and sequence number (22R3) is used. Pressure transducers were installed on selected wells and data are available in the National Water Information System (NWIS-Web) and an online computer database operated by the U.S. Geological Survey. Prior to sample collection, wells were purged using portable pumps. Pumps were cleaned using Liquinox and distilled water between wells to minimize cross contamination. After purging, water samples from the wells were collected using peristaltic pumps. New nylon tubing (with a short length of Tygon tubing near the pump head) was used for each well and then discarded after use. Samples for trace organic and fecal sterol analysis were collected from wells using new glass bailers after the pumped samples were collected. Bailers were discarded after use. Most wells were sampled three times during the study. Well, 22R3, along the West Beach cross-section at the high-tide line (Figure 1) was sampled hourly during selected ebb tides in November 2005, May-June 2006, and April 2007. An additional well was installed and sampled at the beachfront during April 2007 to supplement data from Well 22R3, which because of sand accumulation on the beach was no longer located at the high tide line. Well 21G3 (Figure 1), was destroyed during the study and was only sampled twice.
Grab samples of near-shore ocean water were
J.A. Izbicki et al., Annals of Environmental Science / 2009, Vol 3, 139-178
www.aes.northeastern.edu, ISSN 1939-2621 143
collected in the “swash zone”, approximately between ankle and mid-calf in depth, so that the sample depth remained approximately constant but the location varied with the ebb and flow of the tide. Boehm, [22] showed little difference in FIB concentrations in samples collected at ankle and waist depth for at beach near Avalon, California. Grab samples of influent to the El Estero WWTP (Figure 1) were collected using sampling equipment available on site.
Kelp and sand from the upper 0.5 cm were collected from near the high tide line along West Beach. Samples were collected with stainless steel implements and placed in stainless steel buckets. Implements and buckets were cleaned and baked at 800oC prior to use. The buckets were discarded after use and sample implements were thoroughly cleaned and rinsed with organic-free water between sample collection. The mass of the sample was determined in the field by subtracting the weight of the bucket from the weight of the sample plus the bucket. Samples of kelp and sand were washed with organic-free water adjusted to seawater salinity using organic-free NaCl. Organic-free NaCl was prepared by baking reagent grade NaCl at 800oC for 24 hours. The baked NaCl was stored in baked glass containers and added to the organic-free water immediately before use in the field. The supernatant was decanted from the buckets and stored in appropriate bottles using sample handling and preservation procedures described below.
pH and specific conductance were measured in the field using portable meters. Dissolved oxygen also was measured in the field using the indigo-carmine method (CHEMetrics, Inc., Calverton, VA). Water samples for selected anions, cations, and nutrients were filtered in the field though 0.45 µm pore sized filters, placed in plastic bottles and chilled. Samples for cation analysis were preserved in the field using nitric acid. Samples for FIB were unfiltered, placed in sterile bottles, and chilled. Samples for human-specific Bacteroides and enteroviruses, T-RFLP, PLFA, were unfiltered, placed in 1 L glass bottles, and chilled. Samples for trace organic compounds were unfiltered, placed in 1-L glass bottles, preserved in the field using 10 mL of dichloromethane, and chilled. Aluminum foil lined caps were used to seal sample bottles intended for trace organic analysis. All 1-L glass bottles were baked at 800oC prior to use.
Most FIB samples and samples for Bacteriodes, enteroviruses, and T-RFLP were delivered to respect-ive labs for analysis within 8 hours of coll-ection. Stormflow samples and samples from diurnal studies that were collected after 2:00 PM were delivered to the lab the next morning. All other samples were
shipped on the day of collection by overnight delivery to their respective laboratories for analysis. 2.2. Analytical Methods Total coliform and E. coli were analyzed by Colilert and enterococci were analyzed using Enterolert (IDEXX, Westbrook MN) at the City of Santa Barbara Water Resources Laboratory. A range of dilutions was used to ensure proper quantification of samples in accordance with the manufacturers’ specifications.
Samples for human-specific Bacteroides [50], and enteroviruses were analyzed at the University of Southern California in Los Angeles, California. These samples were filtered in the laboratory within 8 hours of collection onto 47-mm 0.2-µm pore size Durapore filters. For surface-water and groundwater samples, the volume filtered ranged from 120 to 1,000 mL depending on the suspended sediment in the sample. Samples from the wastewater treatment plant and water rinses from kelp were difficult to filter and volumes ranged from 12 to 80 mL. Filters were frozen after filtration and thawed prior to extraction and analysis. DNA was extracted from all samples using the MoBio Ultraclean Fecal DNA kit and eluted in 50µL. The extracted DNA was quantified using the Molecular Probes dsDNA Quantitation Kit. Bacteroides levels were determined by SYBR Green-based quantitative Polymerase Chain Reaction (qPCR) [51]. For samples with DNA levels >0.2 ng/L, 2 ng of DNA were used as the template for the qPCR reaction. For samples with less than 0.2 ng DNA, 4 µL of eluted DNA was used. All samples were run in duplicate with a standard curve having a range of 102 to 108 copies from a plasmid containing the target gene fragment. Samples for enteroviruses were filtered in the laboratory within 8 hours of collection and the frozen. The volume filtered for each sample ranged from 25 to 1,000 mL depending on the ease of filtration. RNA was extracted using the Qiagen RNeasy Mini Kit (tissue protocol) with the QIAvac Manifold. Reverse Transcription and the qPCR were done in a single reaction [50]. All samples were run in duplicate with additional duplicate samples spiked with vaccine-type poliovirus to test for inhibition. A standard curve was run simultaneously with a range 3.3 x 101 to 3.3 x 10⁵ poliovirus particles per assay.
Samples for Terminal Restriction Fragment Length Polymorphism (T-RFLP) measurements were analyzed by the University of California at Santa Barbara. Samples were filtered in the lab within 8 hours of collection, and microbial cells were separated from particulate material using methods described by
J.A. Izbicki et al., Annals of Environmental Science / 2009, Vol 3, 139-178
www.aes.northeastern.edu, ISSN 1939-2621 144
LaMontagne and Holden [52]. Cells were concen-trated by centrifugation and DNA within the cells was extracted and purified using commercially available kits (UltraClean DNA; MoBio Laboratories Inc., Solana Beach, California) as specified by the manu-facturer. After extraction and purification, the DNA was stored at -80oC until analysis [52]. 16rRNA genes from the purified DNA were amplified using Polymerase Chain Reaction (PCR) with eubacterial primers 8F hex (fluorescently labeled forward primer) [53] and 1389R [54]. PCR reaction mixtures were processed on a PCRSprint thermal cycler (Hybaid US, Franklin, Mass.) using analytical and quality control procedures described by LaMontagne et al. [55]. PCR products were purified with the High Pure Kit (Boehringer Mannheim, Indianapolis, IN) and digested with H-ha1 and Msp1 restriction enzymes. The restriction enzymes were inactivated by heating (65oC for 10 min) and the length of the fluorescently labeled fragments was determined with an Applied Biosystems Instruments Model 373A automated sequencer (ABI: Foster City, California).
Samples for phospholipid fatty acids (PLFAs) were analyzed by Microbial Insights in Rockford, Tennessee Samples were chilled and shipped in coolers on the day of collection for overnight delivery. Upon arrival at the lab, lipids were recovered using a modified Bligh and Dyer method [56]. Extractions were performed using one-phase chloroform-methanol-buffer extractant. Lipids were recovered, dissolved in chloroform, and fractionated on disposable silicic acid columns into neutral-, glyco-, and polar-lipid fractions. The polar lipid fraction was transesterified with mild alkali to recover phospholipid fatty acids (PLFA) as methyl esters in hexane. PLFA were then analyzed by gas chromatography with peak confirmation performed by electron impact mass spectrometry (GC/MS).
Samples for selected wastewater indicators were analyzed by the U.S. Geological Survey National Water Quality Laboratory (NWQL) in Denver, Colorado Samples were preserved in the field using 10 mL of reagent grade dichloromethane (DCM), chilled, and shipped in coolers on the day of collection for overnight delivery to the lab. The DCM inhibited microbiological degradation and began the extraction of nonpolar organic compounds within the sample. Analysis was by Continuous Liquid–Liquid Extraction and Capillary-Column Gas Chromatography/Mass Spectrometry [57]. Samples for nutrient analysis were field filtered, chilled and shipped to the U.S. Geological Survey National Water Quality Laboratory in Denver, Colorado for analysis by various methods
described by Fishman et al. [58]. 2.3. Methods to Measure Exchange of Ocean Water with Groundwater Seepmeter, radon-222 (222Rn), and direct-current marine-resistivity data were collected to assess the magnitude, variability, and timing of exchange of near-shore ocean water with shallow groundwater. Direct-current resistivity data were collected from a boat along West Beach, near the mouth of Mission Creek, and along the beach to the east to determine the representativeness of seepmeter and 222Rn data collected in more limited areas along the beachfront.
The seepmeters used in this study focus water through a 2.5-cm-diameter orifice at the top of a 1.2-m-diameter dome emplaced in the beach sand just below the low-tide line [59]. An electromagnetic (EM) flowmeter embedded within the orifice measures velocity according to Faraday’s Law, where the voltage generated by movement of water through an induced magnetic field is proportional to the velocity of water flowing through the field [60]. The small diameter of the orifice constricts flow, thereby increasing the velocity of the water and increasing the sensitivity of the seepmeter. Positive values reflect discharge of water from the beach to the ocean; negative values reflect movement of water from the ocean into the beach deposits. Seepmeters must be deployed in a relatively calm environment as waves and currents may dislodge the meter and produce inaccurate results [61,62]. For this reason it is often difficult to operate seepmeters for extended periods. Seepmeter data are point measurements, and measurements can vary spatially and with depth [63].
222Rn is produced by the decay of radium-226 (226Ra) in the uranium-238 decay series and has a half-life of 3.8 days. Radon is the heaviest of the noble gases, does not react chemically with aquifer surfaces, and is highly mobile in groundwater [64]. 222Rn concentrations in groundwater are commonly several orders of magnitude higher than in ocean water. Diffusion of 222Rn from sediments is small [65], and increasing 222Rn activities in near-shore ocean water reflect discharge of shallow groundwater [64,66] and exchange of water between the ocean and beach deposits [64,67]. 222Rn was measured on an almost continuous basis using a water/air exchanger and a radon-in-air monitor [67,68]. In addition, 222Rn data average groundwater discharge over larger volumes than the point measurements obtained from seepmeters and are often a better indicator of exchange between groundwater and the ocean [68].
J.A. Izbicki et al., Annals of Environmental Science / 2009, Vol 3, 139-178
www.aes.northeastern.edu, ISSN 1939-2621 145
Direct-current marine-resistivity data were collected using a 112-m cable containing a 56-electrode array [68,69]. For marine applications, GPS data were logged, while water depth and the ship’s position were recorded on a separate GPS-enabled fathometer. Continuous salinity and temperature data also were recorded. 3. RESULTS 3.1. Fecal Indicator Bacteria, Bacteroides, and Enteroviruses in Urban Streams Streamflow and FIB concentrations were measured during baseflow in Mission Creek (including its tributary, Old Mission Creek) and Arroyo Burro, another urban stream, on April 19-21, 2005 and August 2-4, 2005 (Figure 1). On the basis of those data, 24-hour sample collection was done August 3-4, 2005 at Mission Creek at Gutierrez Street (Site 4, Figure 1) to determine temporal variability in FIB concentrations in the downstream urbanized reach of Mission Creek. Stormflow samples also were collected at Mission Creek at Gutierrez Street during
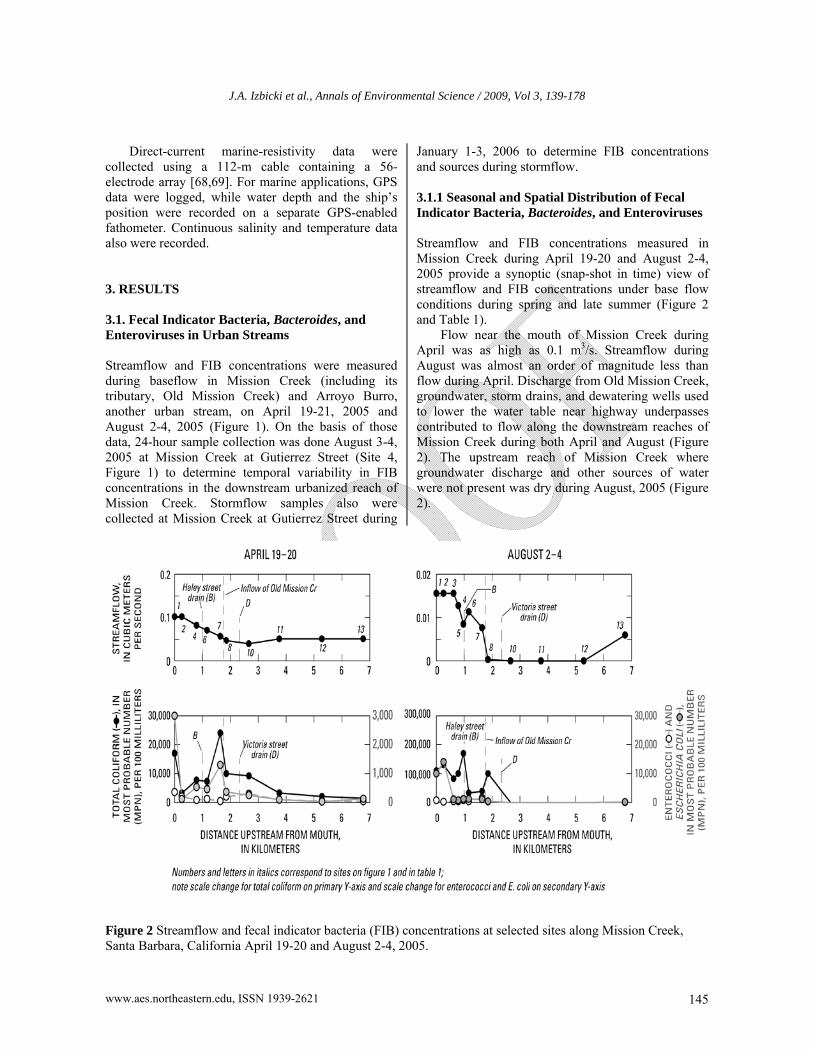
January 1-3, 2006 to determine FIB concentrations and sources during stormflow. 3.1.1 Seasonal and Spatial Distribution of Fecal Indicator Bacteria, Bacteroides, and Enteroviruses Streamflow and FIB concentrations measured in Mission Creek during April 19-20 and August 2-4, 2005 provide a synoptic (snap-shot in time) view of streamflow and FIB concentrations under base flow conditions during spring and late summer (Figure 2 and Table 1).
Flow near the mouth of Mission Creek during April was as high as 0.1 m3/s. Streamflow during August was almost an order of magnitude less than flow during April. Discharge from Old Mission Creek, groundwater, storm drains, and dewatering wells used to lower the water table near highway underpasses contributed to flow along the downstream reaches of Mission Creek during both April and August (Figure 2). The upstream reach of Mission Creek where groundwater discharge and other sources of water were not present was dry during August, 2005 (Figure 2).
Figure 2 Streamflow and fecal indicator bacteria (FIB) concentrations at selected sites along Mission Creek, Santa Barbara, California April 19-20 and August 2-4, 2005.
J.A. Izbicki et al., Annals of Environmental Science / 2009, Vol 3, 139-178
www.aes.northeastern.edu, ISSN 1939-2621 146
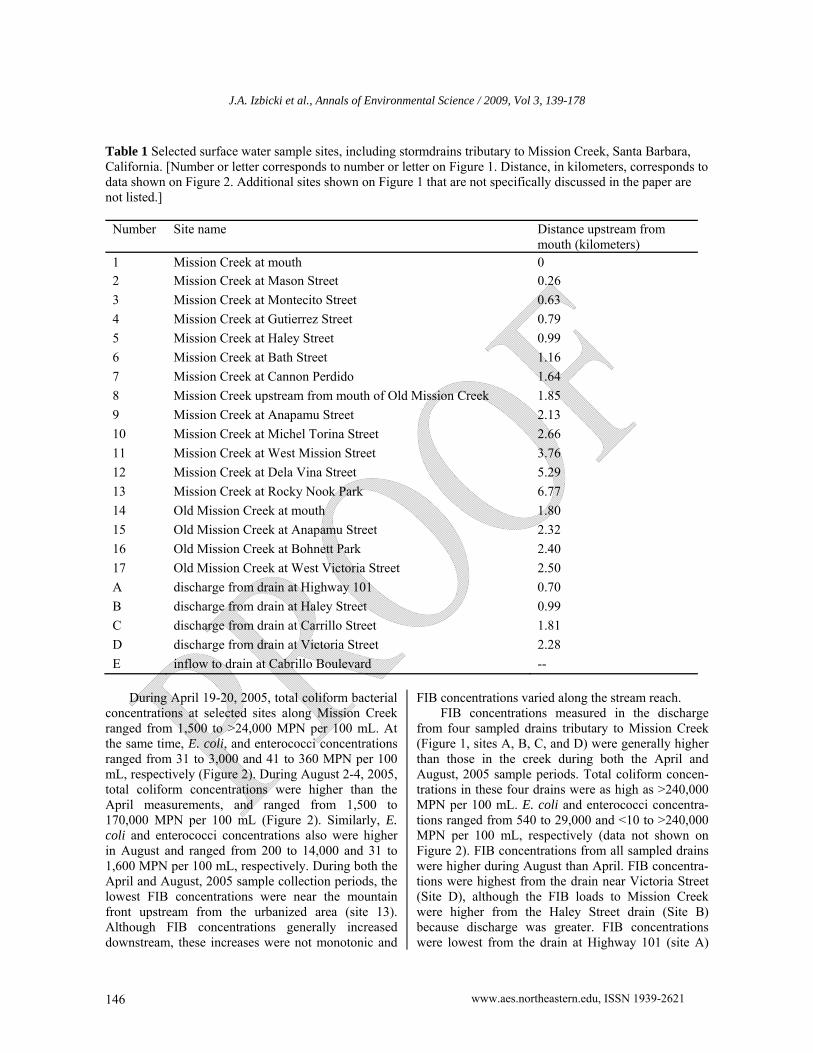
Table 1 Selected surface water sample sites, including stormdrains tributary to Mission Creek, Santa Barbara, California. [Number or letter corresponds to number or letter on Figure 1. Distance, in kilometers, corresponds to data shown on Figure 2. Additional sites shown on Figure 1 that are not specifically discussed in the paper are not listed.]
Number Site name Distance upstream from mouth (kilometers)
1 Mission Creek at mouth 0 2 Mission Creek at Mason Street 0.26
3 Mission Creek at Montecito Street 0.63
4 Mission Creek at Gutierrez Street 0.79
5 Mission Creek at Haley Street 0.99
6 Mission Creek at Bath Street 1.16
7 Mission Creek at Cannon Perdido 1.64
8 Mission Creek upstream from mouth of Old Mission Creek 1.85
9 Mission Creek at Anapamu Street 2.13
10 Mission Creek at Michel Torina Street 2.66
11 Mission Creek at West Mission Street 3.76
12 Mission Creek at Dela Vina Street 5.29
13 Mission Creek at Rocky Nook Park 6.77
14 Old Mission Creek at mouth 1.80
15 Old Mission Creek at Anapamu Street 2.32
16 Old Mission Creek at Bohnett Park 2.40
17 Old Mission Creek at West Victoria Street 2.50
A discharge from drain at Highway 101 0.70
B discharge from drain at Haley Street 0.99
C discharge from drain at Carrillo Street 1.81
D discharge from drain at Victoria Street 2.28
E inflow to drain at Cabrillo Boulevard --
During April 19-20, 2005, total coliform bacterial
concentrations at selected sites along Mission Creek ranged from 1,500 to >24,000 MPN per 100 mL. At the same time, E. coli, and enterococci concentrations ranged from 31 to 3,000 and 41 to 360 MPN per 100 mL, respectively (Figure 2). During August 2-4, 2005, total coliform concentrations were higher than the April measurements, and ranged from 1,500 to 170,000 MPN per 100 mL (Figure 2). Similarly, E. coli and enterococci concentrations also were higher in August and ranged from 200 to 14,000 and 31 to 1,600 MPN per 100 mL, respectively. During both the April and August, 2005 sample collection periods, the lowest FIB concentrations were near the mountain front upstream from the urbanized area (site 13). Although FIB concentrations generally increased downstream, these increases were not monotonic and
FIB concentrations varied along the stream reach. FIB concentrations measured in the discharge
from four sampled drains tributary to Mission Creek (Figure 1, sites A, B, C, and D) were generally higher than those in the creek during both the April and August, 2005 sample periods. Total coliform concen-trations in these four drains were as high as >240,000 MPN per 100 mL. E. coli and enterococci concentra-tions ranged from 540 to 29,000 and <10 to >240,000 MPN per 100 mL, respectively (data not shown on Figure 2). FIB concentrations from all sampled drains were higher during August than April. FIB concentra-tions were highest from the drain near Victoria Street (Site D), although the FIB loads to Mission Creek were higher from the Haley Street drain (Site B) because discharge was greater. FIB concentrations were lowest from the drain at Highway 101 (site A)

J.A. Izbicki et al., Annals of Environmental Science / 2009, Vol 3, 139-178
www.aes.northeastern.edu, ISSN 1939-2621 147
that contains a high fraction of shallow groundwater from dewatering wells.
Human-specific Bacteroides was detected in samples from the mouth of Mission Creek (site 1) and from three drains tributary to Mission Creek (sites B,C, and D) (Table 2). Although most concentrations were low, concentrations in the Haley drain on June 2, 2006 (Site B) were four orders of magnitude higher than other detections and were within 2-orders of magnitude of the concentrations in wastewater influent (Table 2). Enterovirus also were detected in samples from the Haley Drain (site B) (Table 2) and, with the exception of the El Estero WWTP, Haley drain was the only site where enterovirus was detected. 3.1.2 Diurnal Variations in Fecal Indicator Bacteria Data were collected from Mission Creek at Gutierrez Street (Site 4) over a 24-hour period during August 3-4, 2005, after an extended period of baseflow, to measure diurnal variations in FIB concentrations.
Streamflow in Mission Creek at Gutierrez Street during August 3-4, 2005 ranged from 0.009 to 0.01 m3/s (Figure 3). If streamflow was maintained only by groundwater discharge, there should be only small diurnal variations from transpiration by riparian vegetation. These variations would produce a sinusoidal variation in flow, with lower flows during the day and higher flows during the night. However, streamflow abruptly increased at about 6 AM - lagging early morning increases in municipal water deliveries by less than an hour (Figure 3). The increased streamflow preceded increased inflow into the WWTP by only about 0.5 hour. However, stream-flow did not continue to increase over the next 3 hours in the same manner as WWTP inflow (Figure 3). It is possible that the increase in early morning streamflow is the result of increased urban flow through lawn watering or other outdoor uses rather than leaking sewer lines. Urban contributions to Mission Creek at Gutierrez Street continued throughout the day and include discharge from storm drains, discharge from dewatering wells, leaking pipes or sewer lines, and runoff from lawn watering and other outdoor uses.
Figure 3 Streamflow and fecal indicator bacteria (FIB) concentrations in Mission Creek at Gutierrez Street, Santa Barbara, California, August 3-4, 2005.

J.A. Izbicki et al., Annals of Environmental Science / 2009, Vol 3, 139-178
www.aes.northeastern.edu, ISSN 1939-2621 148
Table 2 Human-specific Bacteroides and Entrovirus results for selected samples from urban stream and recreational beaches, Santa Barbara, California [±, plus or minus 1 standard deviation, for the purposes of this paper ± 2 standard deviations are considered as statistically significant result]
Site ID*
Station name Date Time Bacteroides, in target copy number per liter
enteroviruses, in viral particles per liter
Stream sites 1 Mission Creek at Mouth 6/1/06 13:00 47.1 ± 11.8 <0.1 ± 0.1 4/17/07 12:30 <0.1 ± 0.1 <0.1 ± 0.1 4 Mission Creek at Gutierrez 8/4/05 07:45 <0.1 ± 0.1 <0.1 ± 0.1 14 Old Mission Creek at Mouth 8/4/05 09:00 <0.1 ± 0.1 <0.1 ± 0.1 <0.1 ± 0.1 -- Arroyo Burro Creek at mouth 8/4/05 07:45 <0.1 ± 0.1 <0.1 ± 0.1 <0.1 ± 0.1 Drain sample sites
B Haley drain discharge at Mission Creek
8/4/05 08:30 2/ -- 89 ± 0.1
2/ -- 22 ± 0.1 6/2/06 08:00 7.1 ± 1.5 x 10⁴ <0.1 ± 0.1
D Victoria drain discharge at Mission Creek
6/6/06 11:30 294 ± 139 <0.1 ± 0.1
-- Cabrillo Street drain inflow 4/20/07 06:00 9.3 ± 0.8 <0.1 ± 0.1 Near-shore ocean sample sites -- West Beach at cross-section 6/1/06 02:00 38.3 ± 11.0 <0.1 ± 0.1 6/1/06 10:00 557 ± 515 <0.1 ± 0.1 4/17/07 21:00 20 ± 0.8 0.11 ± 0.11 4/18/07 00:00 4.2 ± 2.7 <0.1 ± 0.1 4/18/07 04:00 6.7 ± 6.7 <0.1 ± 0.1 4/20/07 10:00 23 ± 10 <0.1 ± 0.1 4/20/07 13:00 86 ± 40 <0.1 ± 0.1 -- 1/West Beach at Mission Creek 8/4/05 -- <0.1 ± 0.1 <0.1 ± 0.1 <0.1 ± 0.1 -- 1/Arroyo Burro Beach 8/4/.05 -- <0.1 ± 0.1 <0.1 ± 0.1 <0.1 ± 0.1 Well sample sites 21G3 4N/27W-21G3 6/2/06 09:00 0.2 ± 0.2 <0.1 ± 0.1 21G4 4N/27W-21G4 4/20/07 11:00 <0.1 ± 0.1 <0.1 ± 0.1 22R2 4N/27W-22R2 6/1/06 11:2 <0.1 ± 0.1 0.3 ± 0.3 4/18/07 11:45 0.43 ± 0.21 0.19 ± 0.19 22R3 4N/27W-22R3 6/1/06 02:00 <0.1 ± 0.1 <0.1 ± 0.1 6/1/06 10:00 6.7 ± 6.7 <0.1 ± 0.1 4/17/07 21:00 1.2 ± 1.2 <0.1 ± 0.1 4/18/07 00:00 0.11 ± 0.004 <0.1 ± 0.1 4/18/07 04:00 <0.1 ± 0.1 <0.1 ± 0.1 22J2 4N/27W-22J2 6/2/06 13:30 0.5 ± 0.5 <0.1 ± 0.1 4/17/07 09:30 <0.1 ± 0.1 <0.1 ± 0.1 22J3 4N/27W-22J3 6/2/06 13:20 <0.1 ± 0.1 <0.1 ± 0.1
*Site identification (Figure 1, Table 1); 1/ Sample collected by Heal the Ocean, Hillary Houser, written communication, August, 2005; 2/ Poor recovery from samples spiked with Bacteroides DNA suggesting that interference may have masked detection of Bacteroides

J.A. Izbicki et al., Annals of Environmental Science / 2009, Vol 3, 139-178
www.aes.northeastern.edu, ISSN 1939-2621 149
Table 2 (continued) Human-specific Bacteroides and Entrovirus results for selected samples from urban stream and recreational beaches, Santa Barbara, California [±, plus or minus 1 standard deviation, for the purposes of this paper ± 2 standard deviations are considered as statistically significant result]
Site ID
Station name Date Time Bacteroides, in target copy number per liter
enteroviruses, in viral particles per liter
23M1 4N/27W-23M1 5/31/06 09:30 <0.1 ± 0.1 <0.1 ± 0.1 4/19/07 12:30 <0.1 ± 0.1 0.26 ± 0.26 23M2 4N/27W-23M2 5/31/06 14:10 24 ± 24.0 <0.1 ± 0.1 4/19/07 10:45 <0.1 ± 0.1 <0.1 ± 0.1 4/19/07 10:46 <0.1 ± 0.1 <0.1 ± 0.1 23M3 4N/27W-23M3 5/31/06 12:30 4.7 ± 4.7 <0.1 ± 0.1 Special source -- El Estero WWTP 6/2/06 10:00 1.73 ± 0.25 x 10⁶ 28.4 ± 26 4/17/07 10:00 3.35 ± 3.7 x 10⁶ 682 ± 40 -- Kelp extract from West Beach 4/16/07 12:30 <0.1 ± 0.1 <0.1 ± 0.1 4/19/07 13:00 63 ± 63 <0.1 ± 0.1 -- Sand extract from West Beach 4/17/07 13:00 1.1 ± 1.1 <0.1 ± 0.1
*Site identification (Figure 1, Table 1); 1/ Sample collected by Heal the Ocean, Hillary Houser, written communication, August, 2005; 2/ Poor recovery from samples spiked with Bacteroides DNA suggesting that interference may have masked detection of Bacteroides
Total coliform bacteria concentrations in Mission Creek at Gutierrez Street measured during August 3-4, 2005 ranged from about 81,000 to greater than 240,000 MPN per 100 mL. E. coli and enterococci concentrations ranged from 730 to 2,800, and 100 to 2,000 MPN per 100 mL, respectively. FIB concentrations were higher and more variable during the day, especially in the early morning when runoff from lawn watering and other outdoor uses contributed to streamflow (Figure 3). After the early morning measurements, the magnitude and variability of FIB concentrations decreased during the day presumably as fecal material that accumulated on streets was washed into the stream. An increase in FIB concentrations occurred in the evening beginning at about 1700 hrs. This increase occurred at about the same time as evening increase inflows to the wastewater treatment plant (Figure 3). Direct leakage of sewer lines into the stream was not observed during this study and did not appear to occur in the morning hours, but unpermitted discharge to urban drains could cause changes in FIB concentrations measured in Mission Creek and would be consistent with the presence of human-specific Bacteroides in these drains.
Total coliform and E. coli concentrations were positively correlated (r = 0.64), while the correlation
was less for total coliform and enterococci (r = 0.37). The correlation between E. coli and enterococci (r = 0.06) was not statistically significant. The lack of correlation between E. coli and enterococci concentrations suggests that these bacteria may be contributed to the stream from different sources in the watershed, each having different environmental and hydrologic histories that contribute to differential survival of FIB.
3.1.3 Fecal Indicator Bacteria in Stormflow FIB concentrations were measured in Mission Creek at Gutierrez Street during a series of stormflows between January 1-3, 2006 (Figure 4). Total precipita-tion during this period was about 95 mm. Stormflow from a preceding storm that produced 44 mm of precipitation on December 31, 2005 was not sampled. The December 31st stormflow probably washed much of the highly mobile FIB and other material from the watershed that had accumulated in streets, storm-drains, and stream channels since the previous storm in September 2005. As a consequence, contributions from sanitary sewer lines, which could pressurize and leak as a result of increased flow during storms, were thought to be more easily detected during the sampled stormflow.

J.A. Izbicki et al., Annals of Environmental Science / 2009, Vol 3, 139-178
www.aes.northeastern.edu, ISSN 1939-2621 150
Figure 4 Precipitation, stream stage, and fecal indicator bacteria (FIB) from stormflow in Mission Creek at Gutierrez Street, Santa Barbara, California, January 1-2, 2006.
Stream stage increased in distinct peaks as a result of precipitation during January 1-3, 2006 (Figure 4). Total coliform, E. coli, and enterococci concentrations were as high as >242,000, 9,870 and 16,100 MPN per 100 mL, respectively. FIB concentra-tions generally decreased during the sample period although FIB concentrations increased during stormflow peaks. This decrease in concentrations during the storm is more consistent with successive stormflows washing material from the watershed than with repeated leaking from sanitary sewers during successive stormflow. FIB concentrations in storm-flow samples were highly correlated with each other, having correlation coefficients ranging from 0.81 to 0.71 and suggesting a more uniform source and environmental history for FIB during stormflow than for diurnal variations discussed previously. 3.2. Fecal indicator Bacteria, Bacteroides, and Enteroviruses in Shallow Groundwater
Depth to water in sampled wells ranged from less than
1 to 5.3 m below land surface. Depths to water were greater inland in the upland residential areas, and less along Old Mission Creek and near the ocean.
Total coliform was detected at least once in every well installed as part of this study. The median concentration was 295 MPN per 100 mL, for samples having detections (data not shown). The highest total coliform concentration (>240,000 MPN per 100 mL) was measured in a sample collected from well 23M2 near the mouth of Mission Creek in November 2005. E. coli and enterococci were detected in 7 and 8 of the 13 sampled wells, respectively. The highest E. coli and enterococci values were 1,300 and 13,000 MPN per 100 mL in water from wells 23M1 and 23M3, respectively, near the mouth of Mission Creek.
E. coli and enterococci concentrations were lowest in water from wells in the inland residential areas (21G3-5). E. coli was not detected in any of these wells and enterococci was detected once in water from well 21G5 adjacent to Old Mission Creek. Low FIB occurrence in shallow groundwater in this area suggests that leakage from lateral lines
J.A. Izbicki et al., Annals of Environmental Science / 2009, Vol 3, 139-178
www.aes.northeastern.edu, ISSN 1939-2621 151
connecting older residential development to the sewer has not resulted in extensive FIB contamination of shallow groundwater in this part of the city. This is consistent with streamflow and FIB data from Mission Creek that shows diffuse sources of FIB contamination associated with discharging groundwater were less important than point sources associated with urban drains.
Human-specific Bacteroides were detected at low levels in water from wells 22R2 and 22R3 during the April 2007 sample collection (Table 2). Well 22R2, adjacent to the sewer line along West Beach well, is closer to the beachfront. However, neither of these detections were associated with high FIB concentrations. Recent work has shown Bacteroides to be poorly correlated with detections of traditional FIB [70].
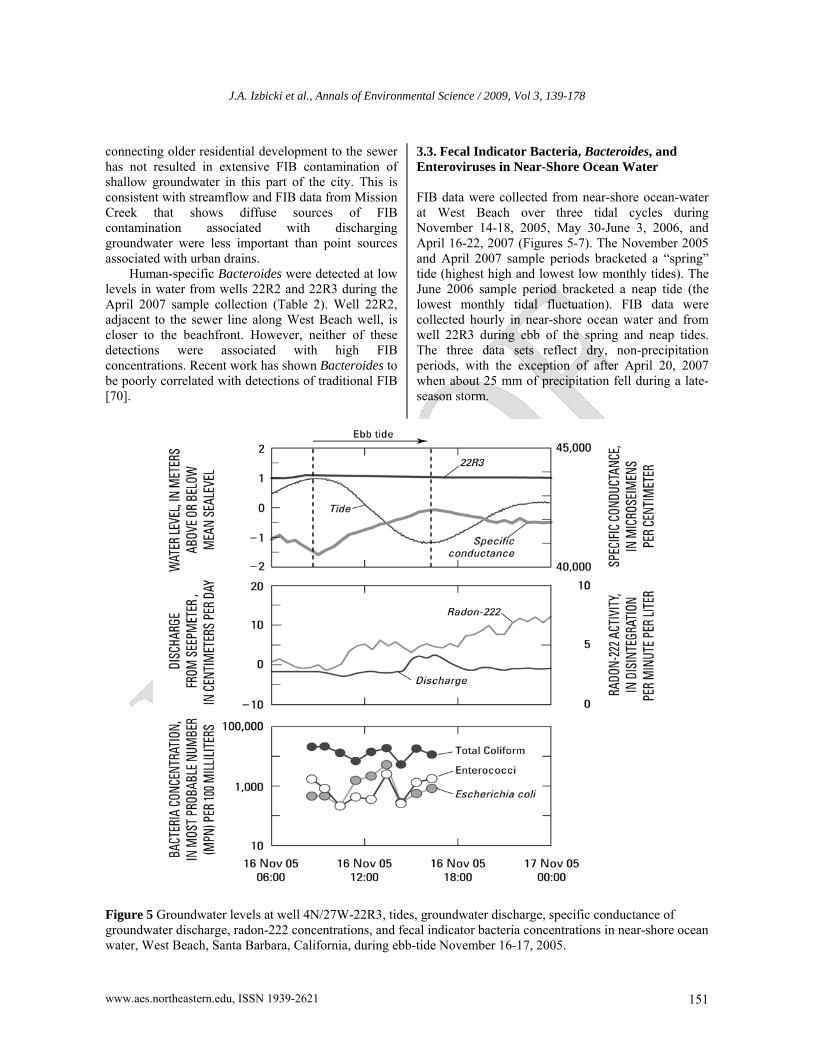
3.3. Fecal Indicator Bacteria, Bacteroides, and Enteroviruses in Near-Shore Ocean Water FIB data were collected from near-shore ocean-water at West Beach over three tidal cycles during November 14-18, 2005, May 30-June 3, 2006, and April 16-22, 2007 (Figures 5-7). The November 2005 and April 2007 sample periods bracketed a “spring” tide (highest high and lowest low monthly tides). The June 2006 sample period bracketed a neap tide (the lowest monthly tidal fluctuation). FIB data were collected hourly in near-shore ocean water and from well 22R3 during ebb of the spring and neap tides. The three data sets reflect dry, non-precipitation periods, with the exception of after April 20, 2007 when about 25 mm of precipitation fell during a late-season storm.
Figure 5 Groundwater levels at well 4N/27W-22R3, tides, groundwater discharge, specific conductance of groundwater discharge, radon-222 concentrations, and fecal indicator bacteria concentrations in near-shore ocean water, West Beach, Santa Barbara, California, during ebb-tide November 16-17, 2005.

J.A. Izbicki et al., Annals of Environmental Science / 2009, Vol 3, 139-178
www.aes.northeastern.edu, ISSN 1939-2621 152
Figure 6 Groundwater levels at well 4N/27W-22R3, tides, groundwater discharge, specific conductance of groundwater discharge, radon-222 concentrations, ammonia, and fecal indicator bacteria concentrations in near-shore ocean water, West Beach, Santa Barbara, California, during ebb-tide May 31-June 1, 2006.
Total coliform concentrations in near-shore ocean water during the three sampled tides ranged from less than the detection limit of 10 to 21,000 MPN per 100 mL. E. coli and enterococci concentrations in near-shore ocean water ranged from less than 10 to 5,200 and less than 10 to 2,500 MPN per 100 mL. About 45 percent of enterococci samples exceeded the California state marine recreational contact single sample standard of 104 MPN per 100 mL [71]. Similar large variations in FIB concentrations over short time intervals were observed at other sites in California [72]. Samples for regulatory purposes are collected once daily without regard for hydrologic conditions such as tides. FIB data collected during this study suggest that samples collected without reference to ambient conditions, such as tides, may be inadequate to characterize FIB concentrations at recreational ocean beaches.
Human-specific Bacteroides was present in low
concentrations in the near-shore ocean water at West Beach in 6 of 7 samples (Table 2). Enteroviruses were not detected in any of those samples. Bacteroides samples were not collected at the same frequency as FIB, but the high frequency of detection suggests that low-levels of human fecal material were consistently present and could be at least partly responsible for at least some of the FIB detected on West Beach. 3.4. Possible Sources of Fecal Indicator Bacteria Possible sources of FIB to near-shore ocean water at West Beach include 1) groundwater discharge contaminated with sewage from the nearby sewer line, 2) sewage from commercial and recreational boats in the nearby harbor, 3) guano contaminated sand, kelp, and debris on the beach, and 4) discharge from Mission Creek.
J.A. Izbicki et al., Annals of Environmental Science / 2009, Vol 3, 139-178
www.aes.northeastern.edu, ISSN 1939-2621 153
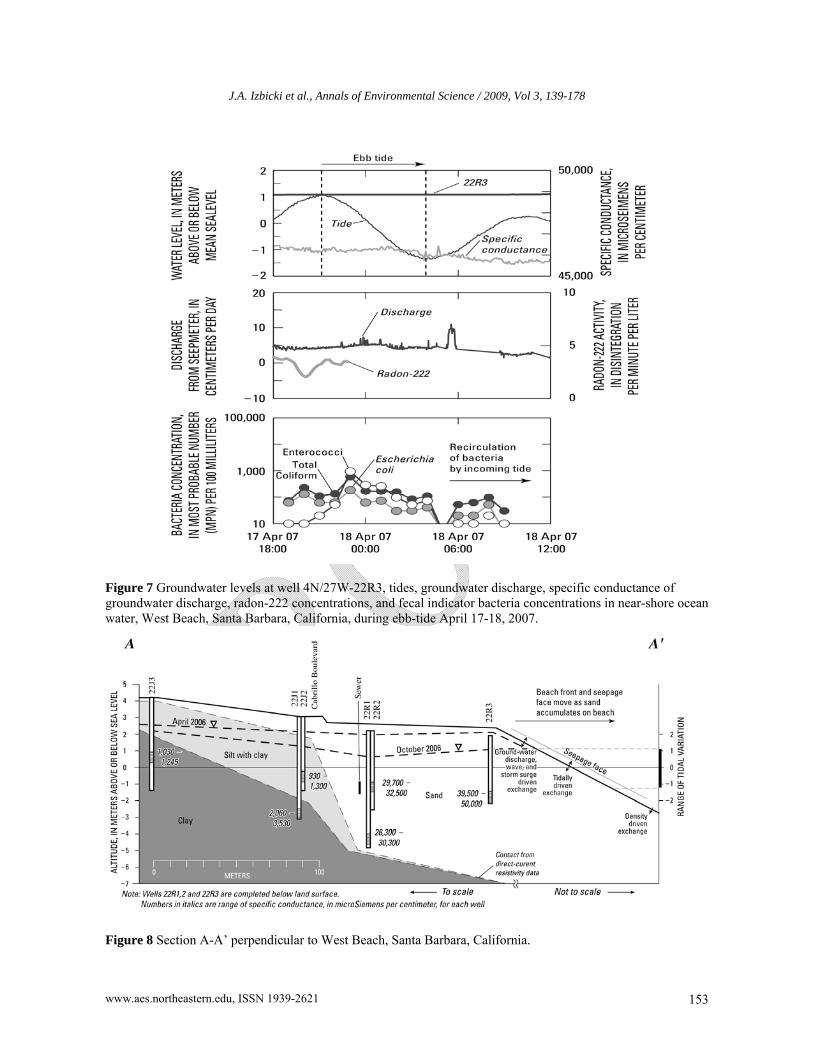
Figure 7 Groundwater levels at well 4N/27W-22R3, tides, groundwater discharge, specific conductance of groundwater discharge, radon-222 concentrations, and fecal indicator bacteria concentrations in near-shore ocean water, West Beach, Santa Barbara, California, during ebb-tide April 17-18, 2007.
Figure 8 Section A-A’ perpendicular to West Beach, Santa Barbara, California.
J.A. Izbicki et al., Annals of Environmental Science / 2009, Vol 3, 139-178
www.aes.northeastern.edu, ISSN 1939-2621 154
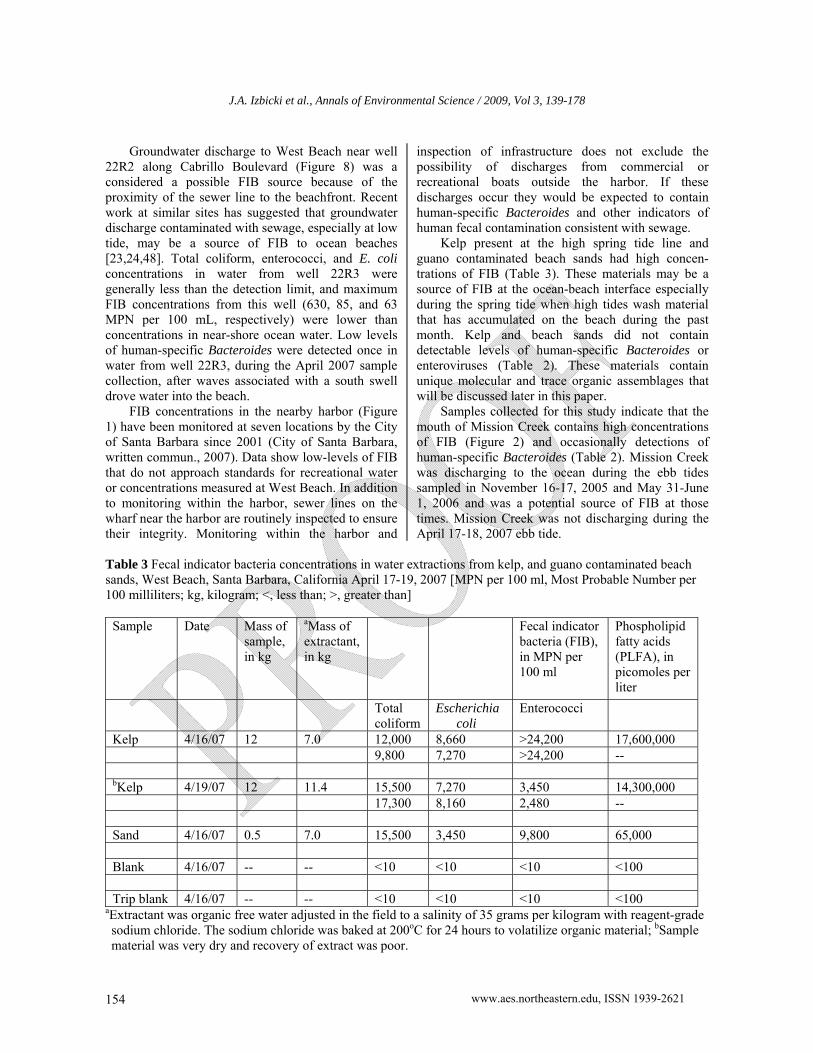
Groundwater discharge to West Beach near well 22R2 along Cabrillo Boulevard (Figure 8) was a considered a possible FIB source because of the proximity of the sewer line to the beachfront. Recent work at similar sites has suggested that groundwater discharge contaminated with sewage, especially at low tide, may be a source of FIB to ocean beaches [23,24,48]. Total coliform, enterococci, and E. coli concentrations in water from well 22R3 were generally less than the detection limit, and maximum FIB concentrations from this well (630, 85, and 63 MPN per 100 mL, respectively) were lower than concentrations in near-shore ocean water. Low levels of human-specific Bacteroides were detected once in water from well 22R3, during the April 2007 sample collection, after waves associated with a south swell drove water into the beach.
FIB concentrations in the nearby harbor (Figure 1) have been monitored at seven locations by the City of Santa Barbara since 2001 (City of Santa Barbara, written commun., 2007). Data show low-levels of FIB that do not approach standards for recreational water or concentrations measured at West Beach. In addition to monitoring within the harbor, sewer lines on the wharf near the harbor are routinely inspected to ensure their integrity. Monitoring within the harbor and
inspection of infrastructure does not exclude the possibility of discharges from commercial or recreational boats outside the harbor. If these discharges occur they would be expected to contain human-specific Bacteroides and other indicators of human fecal contamination consistent with sewage.
Kelp present at the high spring tide line and guano contaminated beach sands had high concen-trations of FIB (Table 3). These materials may be a source of FIB at the ocean-beach interface especially during the spring tide when high tides wash material that has accumulated on the beach during the past month. Kelp and beach sands did not contain detectable levels of human-specific Bacteroides or enteroviruses (Table 2). These materials contain unique molecular and trace organic assemblages that will be discussed later in this paper.
Samples collected for this study indicate that the mouth of Mission Creek contains high concentrations of FIB (Figure 2) and occasionally detections of human-specific Bacteroides (Table 2). Mission Creek was discharging to the ocean during the ebb tides sampled in November 16-17, 2005 and May 31-June 1, 2006 and was a potential source of FIB at those times. Mission Creek was not discharging during the April 17-18, 2007 ebb tide.
Table 3 Fecal indicator bacteria concentrations in water extractions from kelp, and guano contaminated beach sands, West Beach, Santa Barbara, California April 17-19, 2007 [MPN per 100 ml, Most Probable Number per 100 milliliters; kg, kilogram; <, less than; >, greater than]
Sample Date Mass of sample, in kg
aMass of extractant, in kg
Fecal indicator bacteria (FIB), in MPN per 100 ml
Phospholipid fatty acids (PLFA), in picomoles per liter
Total coliform
Escherichia coli
Enterococci
Kelp 4/16/07 12 7.0 12,000 8,660 >24,200 17,600,000 9,800 7,270 >24,200 -- bKelp 4/19/07 12 11.4 15,500 7,270 3,450 14,300,000 17,300 8,160 2,480 -- Sand 4/16/07 0.5 7.0 15,500 3,450 9,800 65,000 Blank 4/16/07 -- -- <10 <10 <10 <100 Trip blank 4/16/07 -- -- <10 <10 <10 <100
aExtractant was organic free water adjusted in the field to a salinity of 35 grams per kilogram with reagent-grade sodium chloride. The sodium chloride was baked at 200oC for 24 hours to volatilize organic material; bSample material was very dry and recovery of extract was poor.
J.A. Izbicki et al., Annals of Environmental Science / 2009, Vol 3, 139-178
www.aes.northeastern.edu, ISSN 1939-2621 155
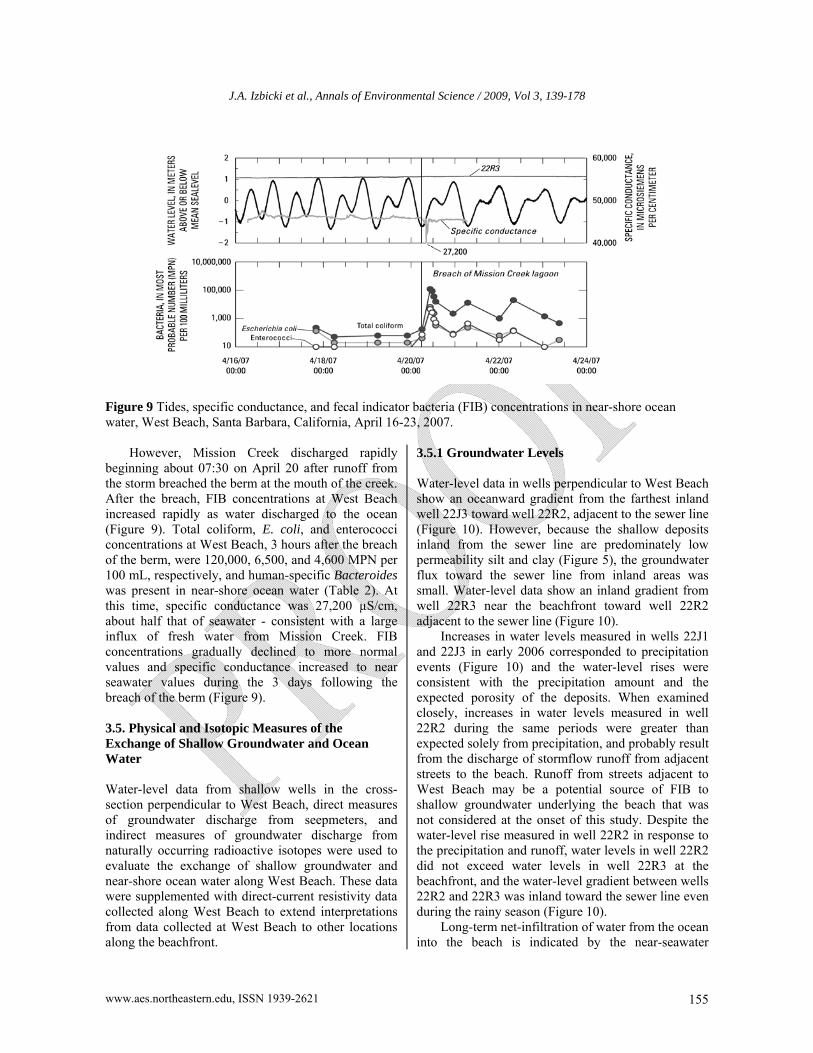
Figure 9 Tides, specific conductance, and fecal indicator bacteria (FIB) concentrations in near-shore ocean water, West Beach, Santa Barbara, California, April 16-23, 2007.
However, Mission Creek discharged rapidly beginning about 07:30 on April 20 after runoff from the storm breached the berm at the mouth of the creek. After the breach, FIB concentrations at West Beach increased rapidly as water discharged to the ocean (Figure 9). Total coliform, E. coli, and enterococci concentrations at West Beach, 3 hours after the breach of the berm, were 120,000, 6,500, and 4,600 MPN per 100 mL, respectively, and human-specific Bacteroides was present in near-shore ocean water (Table 2). At this time, specific conductance was 27,200 µS/cm, about half that of seawater - consistent with a large influx of fresh water from Mission Creek. FIB concentrations gradually declined to more normal values and specific conductance increased to near seawater values during the 3 days following the breach of the berm (Figure 9). 3.5. Physical and Isotopic Measures of the Exchange of Shallow Groundwater and Ocean Water Water-level data from shallow wells in the cross-section perpendicular to West Beach, direct measures of groundwater discharge from seepmeters, and indirect measures of groundwater discharge from naturally occurring radioactive isotopes were used to evaluate the exchange of shallow groundwater and near-shore ocean water along West Beach. These data were supplemented with direct-current resistivity data collected along West Beach to extend interpretations from data collected at West Beach to other locations along the beachfront.
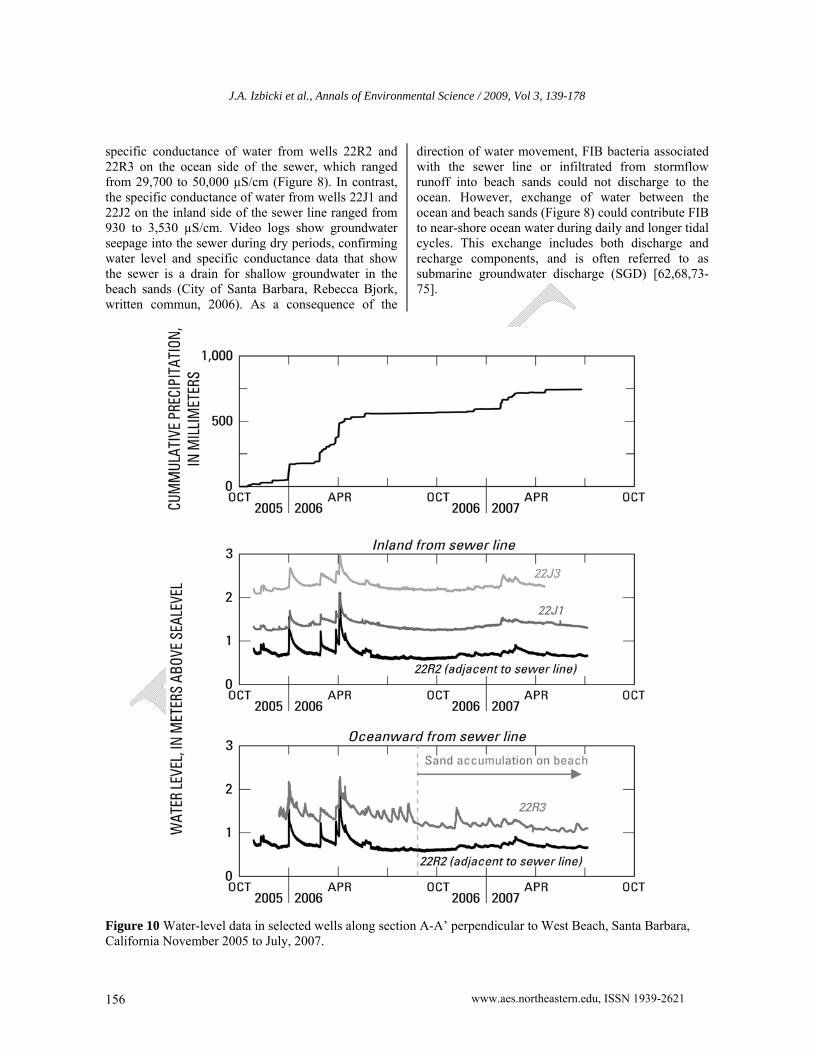
3.5.1 Groundwater Levels Water-level data in wells perpendicular to West Beach show an oceanward gradient from the farthest inland well 22J3 toward well 22R2, adjacent to the sewer line (Figure 10). However, because the shallow deposits inland from the sewer line are predominately low permeability silt and clay (Figure 5), the groundwater flux toward the sewer line from inland areas was small. Water-level data show an inland gradient from well 22R3 near the beachfront toward well 22R2 adjacent to the sewer line (Figure 10).
Increases in water levels measured in wells 22J1 and 22J3 in early 2006 corresponded to precipitation events (Figure 10) and the water-level rises were consistent with the precipitation amount and the expected porosity of the deposits. When examined closely, increases in water levels measured in well 22R2 during the same periods were greater than expected solely from precipitation, and probably result from the discharge of stormflow runoff from adjacent streets to the beach. Runoff from streets adjacent to West Beach may be a potential source of FIB to shallow groundwater underlying the beach that was not considered at the onset of this study. Despite the water-level rise measured in well 22R2 in response to the precipitation and runoff, water levels in well 22R2 did not exceed water levels in well 22R3 at the beachfront, and the water-level gradient between wells 22R2 and 22R3 was inland toward the sewer line even during the rainy season (Figure 10).
Long-term net-infiltration of water from the ocean into the beach is indicated by the near-seawater
J.A. Izbicki et al., Annals of Environmental Science / 2009, Vol 3, 139-178
www.aes.northeastern.edu, ISSN 1939-2621 156
specific conductance of water from wells 22R2 and 22R3 on the ocean side of the sewer, which ranged from 29,700 to 50,000 µS/cm (Figure 8). In contrast, the specific conductance of water from wells 22J1 and 22J2 on the inland side of the sewer line ranged from 930 to 3,530 µS/cm. Video logs show groundwater seepage into the sewer during dry periods, confirming water level and specific conductance data that show the sewer is a drain for shallow groundwater in the beach sands (City of Santa Barbara, Rebecca Bjork, written commun, 2006). As a consequence of the
direction of water movement, FIB bacteria associated with the sewer line or infiltrated from stormflow runoff into beach sands could not discharge to the ocean. However, exchange of water between the ocean and beach sands (Figure 8) could contribute FIB to near-shore ocean water during daily and longer tidal cycles. This exchange includes both discharge and recharge components, and is often referred to as submarine groundwater discharge (SGD) [62,68,73-75].
Figure 10 Water-level data in selected wells along section A-A’ perpendicular to West Beach, Santa Barbara, California November 2005 to July, 2007.

J.A. Izbicki et al., Annals of Environmental Science / 2009, Vol 3, 139-178
www.aes.northeastern.edu, ISSN 1939-2621 157
Figure 11 Groundwater levels at well 4N/27W-22R3, tides, groundwater discharge, and specific conductance of groundwater discharge, and radon-222 concentrations in near-shore ocean water, West Beach, Santa Barbara, California, November 14-18, 2005.
Figure 12 Groundwater levels at well 4N/27W-22R3, tides, quantity, direction, and specific conductance of groundwater discharge, and radon-222 concentrations in near-shore ocean water, West Beach, Santa Barbara, California, May 30-June 4, 2006.

J.A. Izbicki et al., Annals of Environmental Science / 2009, Vol 3, 139-178
www.aes.northeastern.edu, ISSN 1939-2621 158
Figure 13 Groundwater levels at well 4N/27W-22R3, tides, quantity, direction, and specific conductance of groundwater discharge, and radon-222 concentrations in near-shore ocean water, West Beach, Santa Barbara, California, April 16-22, 2007. 3.5.2 Seepmeter and Radon-222 Data Seepmeter and radon-222 (222Rn) data were collected during two spring tides, and during a neap tide to assess the magnitude, variability, and timing of the exchange of shallow groundwater with near-shore ocean water. 222Rn data were used in conjunction with seepmeter data to address spatial variability and to cover potential data gaps resulting from disturbance of the meters during deployment. Specific conductance was measured in water from the seepmeter to assess changes in salinity as shallow groundwater exchanged with ocean water. Although the water-level gradient from the ocean to the sewer line was inland, water levels measured in well 22R3 during the three measurement periods were always higher than the high tide, indicating the potential for groundwater discharge at the beachfront (Figures 11-13). Groundwater discharge and nutrient fluxes to near-shore ocean water along West Beach estimated from seepmeter data and 222Rn data collected as part of this study are discussed in detail by Swarzenski and Izbicki [76].
Discharge from EM seepmeter data measured during November 14-17, 2005 reflect net infiltration of water from the ocean into the beach prior to the spring tide followed by net discharge of water to the ocean after the spring tide (Figure 11). These values
correspond with increasing and decreasing water levels in well 22R3 (Δh, on Figure 11). The largest magnitude positive values were measured during low tide, reflect the largest discharge of water from the beach to the ocean (Figure 11).
During the November, 2005 measurement period, discharge data were collected using seepmeters at two different depths to determine if there was a difference in groundwater flow with depth. The shallowest seepmeter (data shown on Figure 11) was placed at the low tide line and the second meter was placed about 1 m below the low tide line. The deeper meter recorded negative values throughout the period, indicating movement of water from the ocean into the beach (data not shown). This difference in water movement with depth is believed to be the result of density-driven flow driving circulation between ocean and beach deposits, even as groundwater discharges from beach sands to the ocean at shallower depths [77]. The data suggest that exchange of shallow groundwater with near-shore ocean water driven by tidal forces extends from the high tide line to a depth of less than 1 meter below the low tide line (Figure 5).
Discharge data collected during neap tide, May 31 to June 31, 2006 (Figure 12) show smaller magnitude discharges from the beach to the near-shore ocean the throughout the daily tidal cycle. These discharges cease as the neap tide approached and the monthly

J.A. Izbicki et al., Annals of Environmental Science / 2009, Vol 3, 139-178
www.aes.northeastern.edu, ISSN 1939-2621 159
tidal cycle changed toward higher amplitude tides. During the April 16-22, 2007 period, seepmeter
data showed water moving from the beach sands into the ocean (positive values) throughout almost the entire measurement period irrespective of the daily tidal cycle (Figure 13).The greatest discharge, exceeding 300 cm/d, was measured on April 16, 2007 (not shown on Figure 13). These high values result from drainage of water driven into the beach sands by waves during a south swell prior to the measurement period.
222Rn activities in near-shore ocean water along West Beach ranged from 0.6 to 8 dpm/L (disinter-grations per minute per liter) (Figure 11-13). In contrast, 222Rn activities in wells along West Beach were as high as 1,300 dpm/L with a median activity of 610 dpm/L. Low 222Rn activities in near-shore ocean water at West Beach are consistent with water-level and seepmeter data that show little net groundwater discharge to the ocean. 222Rn activities measured in near-shore ocean water along West Beach are almost an order of magnitude lower than values in areas where groundwater is actively discharging to the ocean [72], and activities were similar to values measured in areas where beach deposits are underlain by impermeable crystalline rock that conduct only small amounts of groundwater to the ocean [62].
Despite the low values, 222Rn activities were positively correlated with groundwater discharge data from seepmeters, and 222Rn activities in the near-shore ocean increased during the lowest daily tide (Figures 11 and 12). However, the maximum 222Rn activity lagged the peak discharge measured by the seepmeter by several hours, possibly as water having longer contact with beach sediments and therefore higher 222Rn activities discharged to the ocean (Figure 11). Similar lags between groundwater discharges and peak 222Rn activities are apparent in data from the Florida, Mediterranean and Brazilian coasts [62,78]. Abrupt decreases in 222Rn activity were measured on the turning tide as near-shore ocean water containing a high fraction of discharging groundwater was displaced by ocean water on the incoming flood tide (Figure 12). Over the monthly tidal cycle, 222Rn activities in near-shore ocean water increased after the spring tide as groundwater having longer contact time with beach sediments discharged to the ocean (Figure 11).
Low 222Rn activities were associated with the high groundwater discharges measured after a south swell on April 16-17, 2007 (Figure 10). These low 222Rn activities probably result from drainage of ocean water only recently infiltrated into beach sands by
wave action. This water had not been in contact with beach sand long enough to equilibrate with 222Rn derived from radioactive decay of 226Ra sorbed on the sands. Increased specific conductance during low tides during this period is consistent with the discharge of recently infiltrated ocean-water (Figure 13). Similar increases in specific conductance of near-shore ocean water, measured during low tide on November 14-18, 2005 (Figure 11), suggest that this type of wave-driven exchange occurs frequently. 3.5.3 Exchange of Water at the Beachfront and Fecal Indicator Bacteria Concentrations Measurements of FIB concentrations during the ebb of the spring and neap tides, coupled with physical and isotopic data collected at the ocean-beach interface, were used to understand the variation, timing and sources of FIB to near-shore ocean water. If groundwater were a source of FIB, on the basis of seepmeter and 222Rn data the highest FIB concentrations would be expected on a daily basis shortly after low tide, with monthly maxima at neap tide when discharge from the beach sand to the ocean is greater.
FIB concentrations varied by as much as 2-orders of magnitude during the sampled ebb tides and the timing of the measured increases in FIB concentrations were consistent with contributions from the beach (Figures 5-7). However, groundwater has low FIB concentrations. Another source of FIB, capable of delivering high concentrations to near-shore ocean water during the ebb tide and turning tides, must be present along West Beach.
Kelp, and guano contaminated sands on West Beach near the high tide line contain high concentrations of FIB (Table 3). Drainage from these materials after the high tide may be a potential source of FIB. However FIB from these sources cannot explain low levels of human-specific Bacteriodes that were consistently present in near-shore ocean water at West Beach. Because Bacteroides were not detected in kelp or guano contaminated beach sand other human-derived sources also contribute to FIB concentrations at West Beach. The potential for FIB from these sources is discussed in greater detail in the following section. 3.5.4 Direct-current Resistivity Data
Direct-current resistivity data were collected from a boat along West Beach, near the mouth of Mission Creek, and along the beach to the east. The data were
J.A. Izbicki et al., Annals of Environmental Science / 2009, Vol 3, 139-178
www.aes.northeastern.edu, ISSN 1939-2621 160
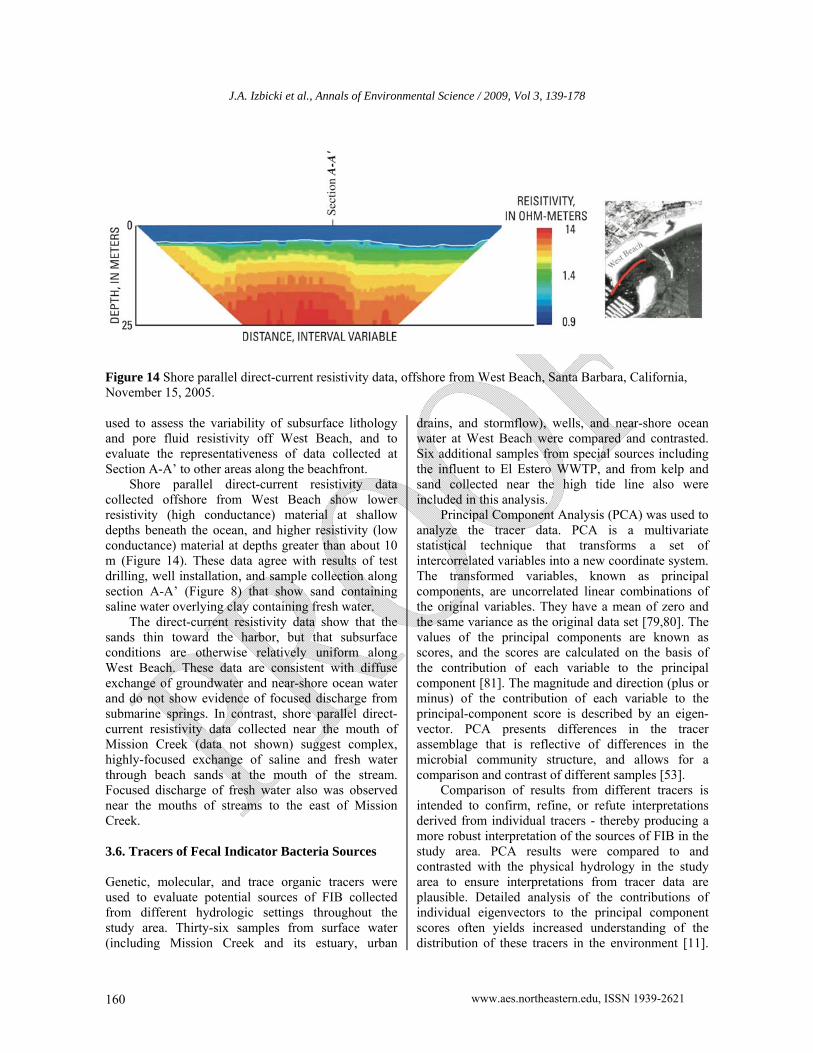
Figure 14 Shore parallel direct-current resistivity data, offshore from West Beach, Santa Barbara, California, November 15, 2005. used to assess the variability of subsurface lithology and pore fluid resistivity off West Beach, and to evaluate the representativeness of data collected at Section A-A’ to other areas along the beachfront.
Shore parallel direct-current resistivity data collected offshore from West Beach show lower resistivity (high conductance) material at shallow depths beneath the ocean, and higher resistivity (low conductance) material at depths greater than about 10 m (Figure 14). These data agree with results of test drilling, well installation, and sample collection along section A-A’ (Figure 8) that show sand containing saline water overlying clay containing fresh water.
The direct-current resistivity data show that the sands thin toward the harbor, but that subsurface conditions are otherwise relatively uniform along West Beach. These data are consistent with diffuse exchange of groundwater and near-shore ocean water and do not show evidence of focused discharge from submarine springs. In contrast, shore parallel direct-current resistivity data collected near the mouth of Mission Creek (data not shown) suggest complex, highly-focused exchange of saline and fresh water through beach sands at the mouth of the stream. Focused discharge of fresh water also was observed near the mouths of streams to the east of Mission Creek. 3.6. Tracers of Fecal Indicator Bacteria Sources Genetic, molecular, and trace organic tracers were used to evaluate potential sources of FIB collected from different hydrologic settings throughout the study area. Thirty-six samples from surface water (including Mission Creek and its estuary, urban
drains, and stormflow), wells, and near-shore ocean water at West Beach were compared and contrasted. Six additional samples from special sources including the influent to El Estero WWTP, and from kelp and sand collected near the high tide line also were included in this analysis.
Principal Component Analysis (PCA) was used to analyze the tracer data. PCA is a multivariate statistical technique that transforms a set of intercorrelated variables into a new coordinate system. The transformed variables, known as principal components, are uncorrelated linear combinations of the original variables. They have a mean of zero and the same variance as the original data set [79,80]. The values of the principal components are known as scores, and the scores are calculated on the basis of the contribution of each variable to the principal component [81]. The magnitude and direction (plus or minus) of the contribution of each variable to the principal-component score is described by an eigen-vector. PCA presents differences in the tracer assemblage that is reflective of differences in the microbial community structure, and allows for a comparison and contrast of different samples [53].
Comparison of results from different tracers is intended to confirm, refine, or refute interpretations derived from individual tracers - thereby producing a more robust interpretation of the sources of FIB in the study area. PCA results were compared to and contrasted with the physical hydrology in the study area to ensure interpretations from tracer data are plausible. Detailed analysis of the contributions of individual eigenvectors to the principal component scores often yields increased understanding of the distribution of these tracers in the environment [11].

J.A. Izbicki et al., Annals of Environmental Science / 2009, Vol 3, 139-178
www.aes.northeastern.edu, ISSN 1939-2621 161
However, this level of analysis and subsequent discussion would preclude the comparisons between tracers and to the physical hydrology and were beyond the scope of this paper. 3.6.1 Terminal-Restriction Fragment Length Polymorphism Data Genetic diversity in microbial populations was assessed using Terminal-Restriction Fragment Length Polymorphism (T-RFLP). T-RFLP uses restriction enzymes to break genetic material within the hypervariable region of mitochondrial DNA into smaller fragments know as amplicons. Amplicons
having different numbers of base pairs (amplicon length) represent different microorganisms. However, the sequence of base pairs within amplicons of the same length may be greatly different, and more than one type of microorganism may be represented. Two restriction enzymes, H-ha1 and M-sp1, were used in this study. Each breaks the mitochondrial DNA at different locations, and produces a different assemblage of amplicons (Figure 15). Quantitative Polymerase Chain Reaction (qPCR) was used to amplify the DNA to measurable concentrations, and the peak area is a measure of the abundance of an amplicon and the microorganism(s) it originated from.
Figure 15 Representative Terminal-Restriction Fragment Length Polymorphism (T-RFLP) amplicons produced using H-ha1 and M-sp1 restriction enzymes from selected samples, Santa Barbara, California, August 2005-April 2007.
J.A. Izbicki et al., Annals of Environmental Science / 2009, Vol 3, 139-178
www.aes.northeastern.edu, ISSN 1939-2621 162
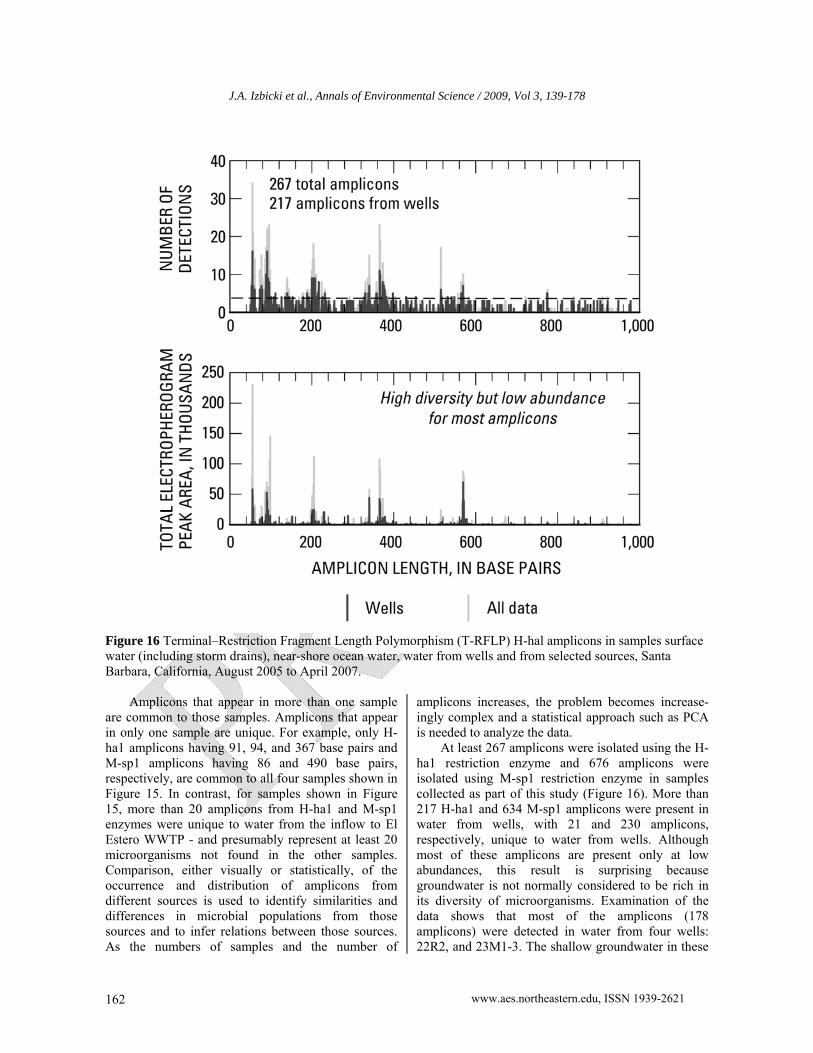
Figure 16 Terminal–Restriction Fragment Length Polymorphism (T-RFLP) H-hal amplicons in samples surface water (including storm drains), near-shore ocean water, water from wells and from selected sources, Santa Barbara, California, August 2005 to April 2007.
Amplicons that appear in more than one sample are common to those samples. Amplicons that appear in only one sample are unique. For example, only H-ha1 amplicons having 91, 94, and 367 base pairs and M-sp1 amplicons having 86 and 490 base pairs, respectively, are common to all four samples shown in Figure 15. In contrast, for samples shown in Figure 15, more than 20 amplicons from H-ha1 and M-sp1 enzymes were unique to water from the inflow to El Estero WWTP - and presumably represent at least 20 microorganisms not found in the other samples. Comparison, either visually or statistically, of the occurrence and distribution of amplicons from different sources is used to identify similarities and differences in microbial populations from those sources and to infer relations between those sources. As the numbers of samples and the number of
amplicons increases, the problem becomes increase-ingly complex and a statistical approach such as PCA is needed to analyze the data.
At least 267 amplicons were isolated using the H-ha1 restriction enzyme and 676 amplicons were isolated using M-sp1 restriction enzyme in samples collected as part of this study (Figure 16). More than 217 H-ha1 and 634 M-sp1 amplicons were present in water from wells, with 21 and 230 amplicons, respectively, unique to water from wells. Although most of these amplicons are present only at low abundances, this result is surprising because groundwater is not normally considered to be rich in its diversity of microorganisms. Examination of the data shows that most of the amplicons (178 amplicons) were detected in water from four wells: 22R2, and 23M1-3. The shallow groundwater in these

J.A. Izbicki et al., Annals of Environmental Science / 2009, Vol 3, 139-178
www.aes.northeastern.edu, ISSN 1939-2621 163
areas is recharged by surface runoff (22R2) or infiltration from Mission Creek (23M1-3). These wells also are near the main sewer line beneath West Beach serving that part of the city and may have a small component of sewage. These four wells have higher FIB concentrations than other wells sampled as part of this study.
The large numbers of amplicons detected in water from wells exert a high influence on the PCA results. This is especially true given the large number of unique amplicons in the four wells discussed above. These amplicons caused large magnitude differences
in the principal component scores for T-RFLP data from these wells that differentiated these wells from all other data. Groundwater moves slowly and organisms in groundwater have probably been there for a considerable period of time. The lack of similarity between the data from the four wells and sources of FIB such as stormflow, inflow to the El Estero WWTP, or from kelp and beach sands may result from changes in the microbial community through death and regrowth of different organisms as the microbial community adapts to the groundwater environment.
Figure 17 Results of Principal Component Analysis (PCA) for Terminal-Restriction Fragment Length Polymorphism (T-RFLP) data from surface water, near-shore ocean water, influent to El Estero WWTP, and from selected sources, Santa Barbara, California, August 2005 to April 2007.

J.A. Izbicki et al., Annals of Environmental Science / 2009, Vol 3, 139-178
www.aes.northeastern.edu, ISSN 1939-2621 164
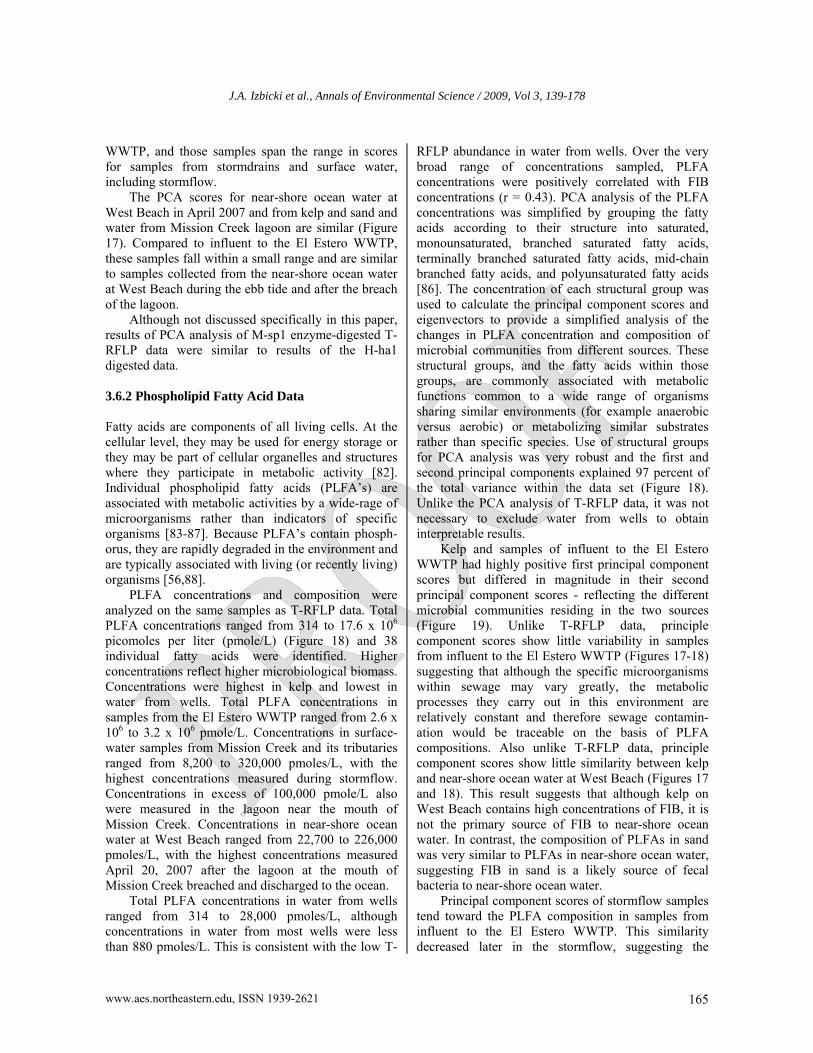
Figure 18 Results of Principal Component Analysis (PCA) for phospholipid fatty acid (PLFA) structural groups in surface water, water from wells, near-shore ocean water, influent to El Estero WWTP, and from selected sources, Santa Barbara, California, August 2005 to April, 2007.
If water from wells is excluded, the first and second principal components for the remaining 23 samples explain 32 percent of the variability in H-ha1 digested T-RFLP data (Figure 17). The first and second principal components in this smaller data set are dominated by large magnitude scores for samples collected from the Haley Drain and from near-shore ocean water at West Beach. These samples have the highest human-specific Bacteroides values sampled as part of this study (Table 2). Although these samples
do not closely resemble sewage influent to the El Estero WWTP, these samples appear to have been impacted by human fecal material.
The remaining samples plot within a compare-atively small range on Figure 17. However, PCA preserves the variable of the original data set and differences in principal component scores within this range reflect real differences within the data. Within this small range there was considerable variability PCA scores for samples from influent to the El Estero
J.A. Izbicki et al., Annals of Environmental Science / 2009, Vol 3, 139-178
www.aes.northeastern.edu, ISSN 1939-2621 165
WWTP, and those samples span the range in scores for samples from stormdrains and surface water, including stormflow.
The PCA scores for near-shore ocean water at West Beach in April 2007 and from kelp and sand and water from Mission Creek lagoon are similar (Figure 17). Compared to influent to the El Estero WWTP, these samples fall within a small range and are similar to samples collected from the near-shore ocean water at West Beach during the ebb tide and after the breach of the lagoon.
Although not discussed specifically in this paper, results of PCA analysis of M-sp1 enzyme-digested T-RFLP data were similar to results of the H-ha1 digested data. 3.6.2 Phospholipid Fatty Acid Data Fatty acids are components of all living cells. At the cellular level, they may be used for energy storage or they may be part of cellular organelles and structures where they participate in metabolic activity [82]. Individual phospholipid fatty acids (PLFA’s) are associated with metabolic activities by a wide-rage of microorganisms rather than indicators of specific organisms [83-87]. Because PLFA’s contain phosph-orus, they are rapidly degraded in the environment and are typically associated with living (or recently living) organisms [56,88].
PLFA concentrations and composition were analyzed on the same samples as T-RFLP data. Total PLFA concentrations ranged from 314 to 17.6 x 10⁶ picomoles per liter (pmole/L) (Figure 18) and 38 individual fatty acids were identified. Higher concentrations reflect higher microbiological biomass. Concentrations were highest in kelp and lowest in water from wells. Total PLFA concentrations in samples from the El Estero WWTP ranged from 2.6 x 10⁶ to 3.2 x 10⁶ pmole/L. Concentrations in surface-water samples from Mission Creek and its tributaries ranged from 8,200 to 320,000 pmoles/L, with the highest concentrations measured during stormflow. Concentrations in excess of 100,000 pmole/L also were measured in the lagoon near the mouth of Mission Creek. Concentrations in near-shore ocean water at West Beach ranged from 22,700 to 226,000 pmoles/L, with the highest concentrations measured April 20, 2007 after the lagoon at the mouth of Mission Creek breached and discharged to the ocean.
Total PLFA concentrations in water from wells ranged from 314 to 28,000 pmoles/L, although concentrations in water from most wells were less than 880 pmoles/L. This is consistent with the low T-
RFLP abundance in water from wells. Over the very broad range of concentrations sampled, PLFA concentrations were positively correlated with FIB concentrations (r = 0.43). PCA analysis of the PLFA concentrations was simplified by grouping the fatty acids according to their structure into saturated, monounsaturated, branched saturated fatty acids, terminally branched saturated fatty acids, mid-chain branched fatty acids, and polyunsaturated fatty acids [86]. The concentration of each structural group was used to calculate the principal component scores and eigenvectors to provide a simplified analysis of the changes in PLFA concentration and composition of microbial communities from different sources. These structural groups, and the fatty acids within those groups, are commonly associated with metabolic functions common to a wide range of organisms sharing similar environments (for example anaerobic versus aerobic) or metabolizing similar substrates rather than specific species. Use of structural groups for PCA analysis was very robust and the first and second principal components explained 97 percent of the total variance within the data set (Figure 18). Unlike the PCA analysis of T-RFLP data, it was not necessary to exclude water from wells to obtain interpretable results.
Kelp and samples of influent to the El Estero WWTP had highly positive first principal component scores but differed in magnitude in their second principal component scores - reflecting the different microbial communities residing in the two sources (Figure 19). Unlike T-RFLP data, principle component scores show little variability in samples from influent to the El Estero WWTP (Figures 17-18) suggesting that although the specific microorganisms within sewage may vary greatly, the metabolic processes they carry out in this environment are relatively constant and therefore sewage contamin-ation would be traceable on the basis of PLFA compositions. Also unlike T-RFLP data, principle component scores show little similarity between kelp and near-shore ocean water at West Beach (Figures 17 and 18). This result suggests that although kelp on West Beach contains high concentrations of FIB, it is not the primary source of FIB to near-shore ocean water. In contrast, the composition of PLFAs in sand was very similar to PLFAs in near-shore ocean water, suggesting FIB in sand is a likely source of fecal bacteria to near-shore ocean water.
Principal component scores of stormflow samples tend toward the PLFA composition in samples from influent to the El Estero WWTP. This similarity decreased later in the stormflow, suggesting the

J.A. Izbicki et al., Annals of Environmental Science / 2009, Vol 3, 139-178
www.aes.northeastern.edu, ISSN 1939-2621 166
possible presence of wastewater in initial stormflow runoff. However, wastewater indicator data, discussed later in this paper, show that El Estero WWTP influent was not present in the stormflow samples. Animal or human wastes (from leaking laterals or the homeless populations) released directly to the environment and washed into the stream during stormflow may be the cause of PLFA composition in stormwater samples collected early in the storm.
The PLFA composition of samples of near-shore ocean water collected from West Beach varied with discharge from Mission Creek. PLFA scores from West Beach samples collected when Mission Creek was discharging to the ocean (June 1, 2006 and April 20, 2007) were more similar to water sampled from the estuary at the mouth of the creek (Mission Creek lagoon). In contrast, the PLFA composition of samples from West Beach collected when Mission Creek lagoon was not discharging to the ocean were more similar to the PLFA composition of guano
contaminated beach sand and less similar to water from the creek. As previously discussed, the PLFA composition of near-shore ocean water showed little similarity to the PLFA composition of kelp (Figure 18). However, it is important to remember that the kelp is not the source of FIB, but rather fecal material deposited on the kelp by birds feeding along the shoreline or other sources are the source of FIB. The PLFA signature of the bird droppings may be overwhelmed by the large microbial populations residing on the kelp.
PCA also was conducted using the concentrations of the 38 individual fatty acids identified in samples from this study (results not shown). This analysis also was very robust and the first, second, and third principal components explained 91 percent of the variability within the data set. Interpretations derived from PCA of the individual fatty acids were similar to interpretations derived from analysis of the structural groups.
Figure 19 Trace organic compound abundance in surface water, water from shallow wells, near-shore ocean water, and from selected sources, Santa Barbara, California, August 2005 to April 2007.

J.A. Izbicki et al., Annals of Environmental Science / 2009, Vol 3, 139-178
www.aes.northeastern.edu, ISSN 1939-2621 167
3.6.3 Trace Organic Compounds A suite of 69 organic compounds was measured as part of this study to help identify the source or sources of FIB in the near-shore ocean water. The compounds can be divided into a number of categories on the basis of their use and origin (Table 4). Reporting limits for most analyzed compounds were within the part per trillion range, and concentrations were below thresholds for public health or environmental concerns. Compounds analyzed as part of this study are anthropogenic and do not occur naturally. Data are available on the U.S. Geological Survey on-line data base NWIS-Web.
At least one trace organic compound was detected in 88 percent of all samples. Not surprisingly, compounds were detected more frequently and at the higher concentrations in samples of wastewater influent to the El Estero WWTP (Figure 19). Large numbers of compounds also were detected in urban stormdrains and stormflow samples, and in near-shore ocean water at West Beach following the April 20, 2007 stormflow and subsequent discharge from the lagoon at the mouth of Mission Creek. Smaller numbers of compounds were detected in kelp and guano contaminated sands. Almost two-thirds of samples from wells had two or fewer compounds detected, and no compounds were detected in almost 25 percent of sampled wells. However, more than ten compounds were present in water from wells 22R2 and 23M2. These wells were discussed previously because of their high FIB concentrations, high diversity of microorganisms, and connection with surface sources of contamination.
Caffeine and cholesterol were the most commonly detected compounds and were present in almost 60 percent of the environmental samples (Figure 19). Caffeine and the various sterols were positively correlated, and these compounds were positively correlated with many personal-care products, flame retardants, flavors/fragrances, and d-limonene. In contrast, caffeine and sterols were poorly correlated with most industrial, and asphalt-derived compounds. Caffeine is associated with human use and consumption. Caffeine concentrations in samples from the El Estero WWTP influent ranged from 18 to 84 µg/L. High concentrations, 8 and 4 µg/L, also were measured in the Cabrillo and Haley Street storm drains tributary to Mission Creek, respectively. As previously discussed, both sites had measurable human-specific Bacteroides. Caffeine concentrations in samples from kelp were as high as 67 µg/L. This caffeine concentration was surprisingly high, although
these samples contained high concentrations of FIB, neither sample contained human-specific Bacteroides.
Sterols tend to degrade under aerobic conditions and have been interpreted as evidence of recent fecal contamination [89]. Four sterols (listed in order of abundance) were measured as part of this study, cholesterol, beta-sitosterol, 3-beta-coprostanol, and stigmastanol. Cholesterol is associated with wide range of sources, including human dietary cholesterol, but is not necessarily fecal in origin. 3-beta-coprost-anol is a fecal sterol produced in the gut of some mammals (including humans, pigs, and cats) by the microbially mediated reduction of cholesterol under anaerobic conditions. Although the sterol content of bird feces can be highly variable, they do not generally contain the proper bacteria to reduce cholesterol to 3-beta-coprostanol [90]. The absence of 3-beta-coprostanol in kelp and guano contaminated sand from West Beach is consistent with fecal contamination from birds rather than human or other mammalian fecal material (Table 5). Although 3-beta-coprostanol was absent, cholesterol and beta-sitosterol were present in samples of kelp- and guano-contaminated beach sands. Beta-sitosterol occurs in some plants and, as a consequence, in human dietary cholesterol and in the gut of birds.
At least one personal health-care product, detergent metabolite, flame-retardant, or asphalt-derived compound was present in 75 percent of environmental samples, although many compounds within these groups were detected only infrequently or not at all.
Most pesticides were notably absent compared to their abundance in urban surface water and stormflow in other parts of California [91]. However, d-limo-nene, an “environmentally-friendly” substitute for traditional pesticides used for termite control, was detected in 20 percent of environmental samples. Low pesticide detections may reflect local restrictions on pesticide use and sales.
There was concern that high concentrations of FIB present during stormflow in Mission Creek could result from discharge of wastewater from sewer lines near the stream if those lines flow under pressure during stormflow. This discharge might not occur during low-flow conditions. PCA analysis of PLFA data suggest there may be such a connection. However, stormflow samples collected from Mission Creek at Gutierrez Street did not contain detectable levels of the sterols 3-beta-coprostanol, beta-sitosterol, and beta-stigmastanol, but all of these sterols are present at high concentrations in wastewater. In contrast, stormflow samples contained high concentra-
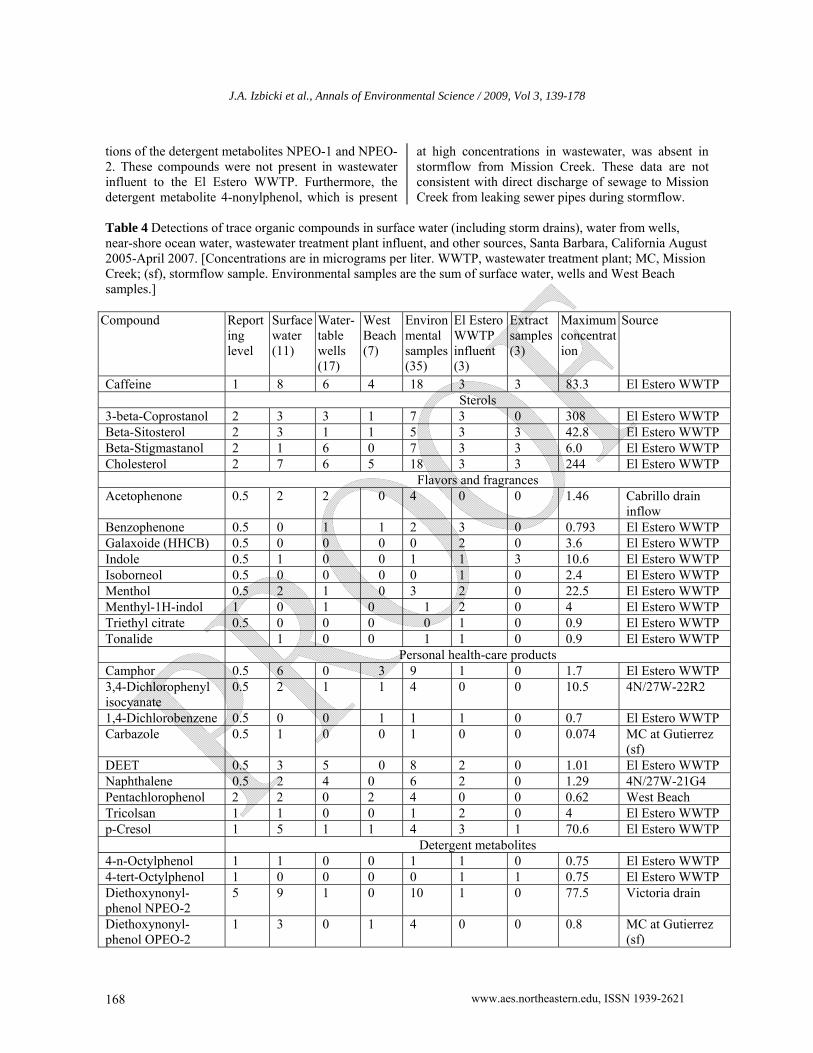
J.A. Izbicki et al., Annals of Environmental Science / 2009, Vol 3, 139-178
www.aes.northeastern.edu, ISSN 1939-2621 168
tions of the detergent metabolites NPEO-1 and NPEO-2. These compounds were not present in wastewater influent to the El Estero WWTP. Furthermore, the detergent metabolite 4-nonylphenol, which is present
at high concentrations in wastewater, was absent in stormflow from Mission Creek. These data are not consistent with direct discharge of sewage to Mission Creek from leaking sewer pipes during stormflow.
Table 4 Detections of trace organic compounds in surface water (including storm drains), water from wells, near-shore ocean water, wastewater treatment plant influent, and other sources, Santa Barbara, California August 2005-April 2007. [Concentrations are in micrograms per liter. WWTP, wastewater treatment plant; MC, Mission Creek; (sf), stormflow sample. Environmental samples are the sum of surface water, wells and West Beach samples.]
Compound Reporting level
Surface water (11)
Water-table wells (17)
West Beach (7)
Environmental samples (35)
El Estero WWTP influent (3)
Extract samples (3)
Maximum concentration
Source
Caffeine 1 8 6 4 18 3 3 83.3 El Estero WWTP Sterols 3-beta-Coprostanol 2 3 3 1 7 3 0 308 El Estero WWTP Beta-Sitosterol 2 3 1 1 5 3 3 42.8 El Estero WWTP Beta-Stigmastanol 2 1 6 0 7 3 3 6.0 El Estero WWTP Cholesterol 2 7 6 5 18 3 3 244 El Estero WWTP Flavors and fragrances Acetophenone 0.5 2 2 0 4 0 0 1.46 Cabrillo drain
inflow Benzophenone 0.5 0 1 1 2 3 0 0.793 El Estero WWTP Galaxoide (HHCB) 0.5 0 0 0 0 2 0 3.6 El Estero WWTP Indole 0.5 1 0 0 1 1 3 10.6 El Estero WWTP Isoborneol 0.5 0 0 0 0 1 0 2.4 El Estero WWTP Menthol 0.5 2 1 0 3 2 0 22.5 El Estero WWTP Menthyl-1H-indol 1 0 1 0 1 2 0 4 El Estero WWTP Triethyl citrate 0.5 0 0 0 0 1 0 0.9 El Estero WWTP Tonalide 1 0 0 1 1 0 0.9 El Estero WWTP Personal health-care products Camphor 0.5 6 0 3 9 1 0 1.7 El Estero WWTP 3,4-Dichlorophenyl isocyanate
0.5 2 1 1 4 0 0 10.5 4N/27W-22R2
1,4-Dichlorobenzene 0.5 0 0 1 1 1 0 0.7 El Estero WWTP Carbazole 0.5 1 0 0 1 0 0 0.074 MC at Gutierrez
(sf) DEET 0.5 3 5 0 8 2 0 1.01 El Estero WWTP Naphthalene 0.5 2 4 0 6 2 0 1.29 4N/27W-21G4 Pentachlorophenol 2 2 0 2 4 0 0 0.62 West Beach Tricolsan 1 1 0 0 1 2 0 4 El Estero WWTP p-Cresol 1 5 1 1 4 3 1 70.6 El Estero WWTP Detergent metabolites 4-n-Octylphenol 1 1 0 0 1 1 0 0.75 El Estero WWTP 4-tert-Octylphenol 1 0 0 0 0 1 1 0.75 El Estero WWTP Diethoxynonyl-phenol NPEO-2
5 9 1 0 10 1 0 77.5 Victoria drain
Diethoxynonyl-phenol OPEO-2
1 3 0 1 4 0 0 0.8 MC at Gutierrez (sf)

J.A. Izbicki et al., Annals of Environmental Science / 2009, Vol 3, 139-178
www.aes.northeastern.edu, ISSN 1939-2621 169
Table 4 (continued) Detections of trace organic compounds in surface water (including storm drains), water from wells, near-shore ocean water, wastewater treatment plant influent, and other sources, Santa Barbara, California, August 2005-April 2007. [Concentrations are in micrograms per liter. WWTP, wastewater treatment plant; MC, Mission Creek; (sf), stormflow sample. Environmental samples are the sum of surface water, wells and West Beach samples.]
Compound Reporting level
Surface water (11)
Water-table wells (17)
West Beach (7)
Environmental samples (35)
El Estero WWTP influent (3)
Extract samples (3)
Maximum concentration
Source
Ethoxynonylph-enol NPOE-1
2 6 0 0 6 1 0 17.6 Victoria drain
Ethoxyoctyl-phenol OPEO-1
1 2 0 0 2 1 0 3 El Estero WWTP
4-Nonylphenol 5 3 4 0 7 3 1 24.8 El Estero WWTP Flame retardants Tris-2-butoxy-ethylphosphate
0.5 5 3 3 11 2 0 6.38 El Estero WWTP
Tris-2-chloroethyl-phosphate
0.5 5 1 1 7 2 0 0.201 El Estero WWTP
Tris-dichloroiso-propylphosphate
0.5 2 2 0 4 2 0 0.49 Victoria drain
Asphalt derived compounds Methylnapthalene 0.5 2 1 0 3 1 0 0.186 4N/27W-21G4 2,6-Dimethylnaph-thalene
0.5 0 1 0 1 0 0 0.115 4N/27W-21G4
2-Methylnaph-thalene
0.5 3 1 0 4 1 0 0.31 4N/27W-21G4
Benzo(a)pyrene 0.5 1 1 1 3 2 0 0.17 Haley drain Fluoranthene 0.5 9 1 2 12 2 0 0.9 Haley drain Phenanthrene 0.5 6 1 0 7 2 0 0.31 El Estero WWTPPyren 0.5 9 1 2 12 1 0 0.5 El Estero WWTP Pesticides, insecticides, and herbicides Carbaryl 1 1 0 0 1 0 0 0.32 Victoria drain d-Limonene 0.5 4 0 1 5 2 0 18 El Estero WWTP Industrial compounds Anthraquinone 0.5 3 0 0 3 0 0 0.37 MC at Gutierrez Bisphenol-A 0.1 3 5 2 10 1 0 69.3 MC at mouth Bis-2-ethylhexyl-phthalate
2 2 3 3 8 1 0 49.9 Victoria drain
Diethylphthalate 0.5 1 3 0 4 3 0 15 El Estero WWTPIsophorone 0.5 1 1 0 2 0 0 0.14 Cabrillo drain
inflow Methyl salicylate 0.5 2 0 0 2 1 0 1.6 El Estero WWTPPhenol 0.5 1 1 0 2 2 2 38 El Estero WWTP
Triphenyl phosphate 0.5 2 0 0 2 1 0 0.14 El Estero WWTP5-Methyl-1H-benzotriazole
2 0 0 1 1 1 0 30 West Beach
Tetrachloroethene 0.5 3 1 2 6 2 0 0.48 MC at mouth Tribromomethane 0.5 1 0 5 6 0 2 0.588 Kelp extract
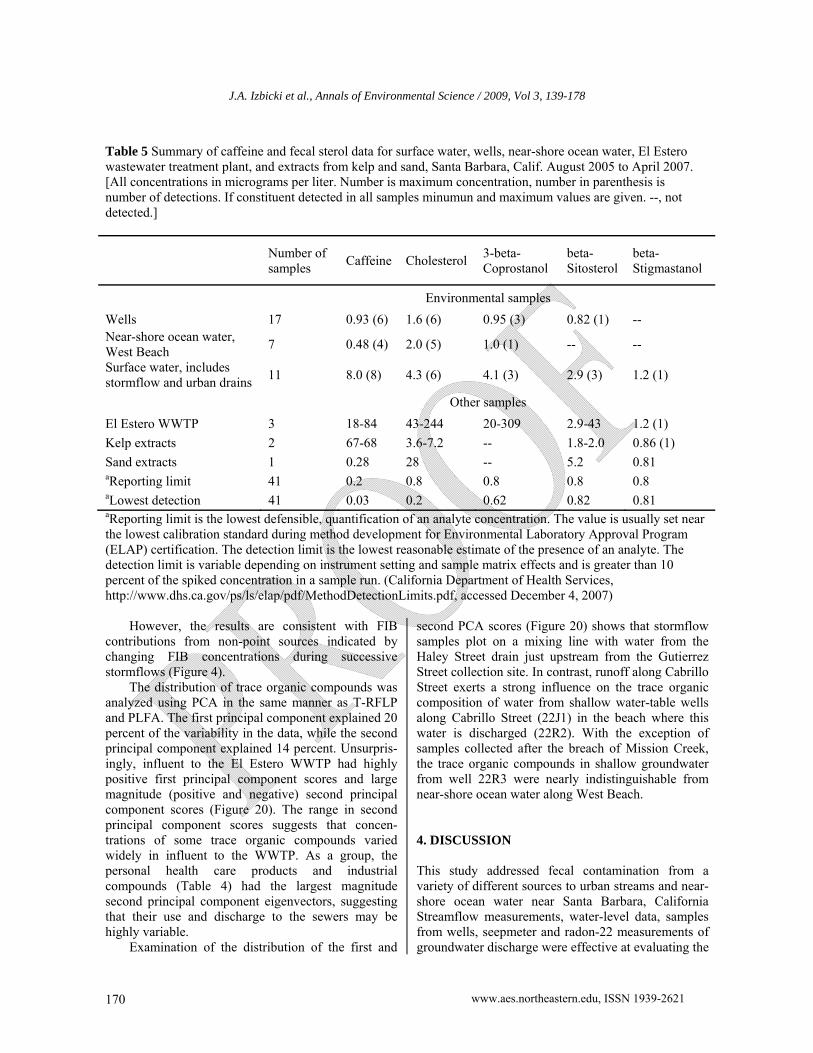
J.A. Izbicki et al., Annals of Environmental Science / 2009, Vol 3, 139-178
www.aes.northeastern.edu, ISSN 1939-2621 170
Table 5 Summary of caffeine and fecal sterol data for surface water, wells, near-shore ocean water, El Estero wastewater treatment plant, and extracts from kelp and sand, Santa Barbara, Calif. August 2005 to April 2007. [All concentrations in micrograms per liter. Number is maximum concentration, number in parenthesis is number of detections. If constituent detected in all samples minumun and maximum values are given. --, not detected.]
Number of samples
Caffeine Cholesterol 3-beta-Coprostanol
beta-Sitosterol
beta-Stigmastanol
Environmental samples
Wells 17 0.93 (6) 1.6 (6) 0.95 (3) 0.82 (1) -- Near-shore ocean water, West Beach
7 0.48 (4) 2.0 (5) 1.0 (1) -- --
Surface water, includes stormflow and urban drains
11 8.0 (8) 4.3 (6) 4.1 (3) 2.9 (3) 1.2 (1)
Other samples
El Estero WWTP 3 18-84 43-244 20-309 2.9-43 1.2 (1)
Kelp extracts 2 67-68 3.6-7.2 -- 1.8-2.0 0.86 (1)
Sand extracts 1 0.28 28 -- 5.2 0.81 aReporting limit 41 0.2 0.8 0.8 0.8 0.8 aLowest detection 41 0.03 0.2 0.62 0.82 0.81 aReporting limit is the lowest defensible, quantification of an analyte concentration. The value is usually set near the lowest calibration standard during method development for Environmental Laboratory Approval Program (ELAP) certification. The detection limit is the lowest reasonable estimate of the presence of an analyte. The detection limit is variable depending on instrument setting and sample matrix effects and is greater than 10 percent of the spiked concentration in a sample run. (California Department of Health Services, http://www.dhs.ca.gov/ps/ls/elap/pdf/MethodDetectionLimits.pdf, accessed December 4, 2007)
However, the results are consistent with FIB
contributions from non-point sources indicated by changing FIB concentrations during successive stormflows (Figure 4).
The distribution of trace organic compounds was analyzed using PCA in the same manner as T-RFLP and PLFA. The first principal component explained 20 percent of the variability in the data, while the second principal component explained 14 percent. Unsurpris-ingly, influent to the El Estero WWTP had highly positive first principal component scores and large magnitude (positive and negative) second principal component scores (Figure 20). The range in second principal component scores suggests that concen-trations of some trace organic compounds varied widely in influent to the WWTP. As a group, the personal health care products and industrial compounds (Table 4) had the largest magnitude second principal component eigenvectors, suggesting that their use and discharge to the sewers may be highly variable.
Examination of the distribution of the first and
second PCA scores (Figure 20) shows that stormflow samples plot on a mixing line with water from the Haley Street drain just upstream from the Gutierrez Street collection site. In contrast, runoff along Cabrillo Street exerts a strong influence on the trace organic composition of water from shallow water-table wells along Cabrillo Street (22J1) in the beach where this water is discharged (22R2). With the exception of samples collected after the breach of Mission Creek, the trace organic compounds in shallow groundwater from well 22R3 were nearly indistinguishable from near-shore ocean water along West Beach. 4. DISCUSSION This study addressed fecal contamination from a variety of different sources to urban streams and near-shore ocean water near Santa Barbara, California Streamflow measurements, water-level data, samples from wells, seepmeter and radon-22 measurements of groundwater discharge were effective at evaluating the
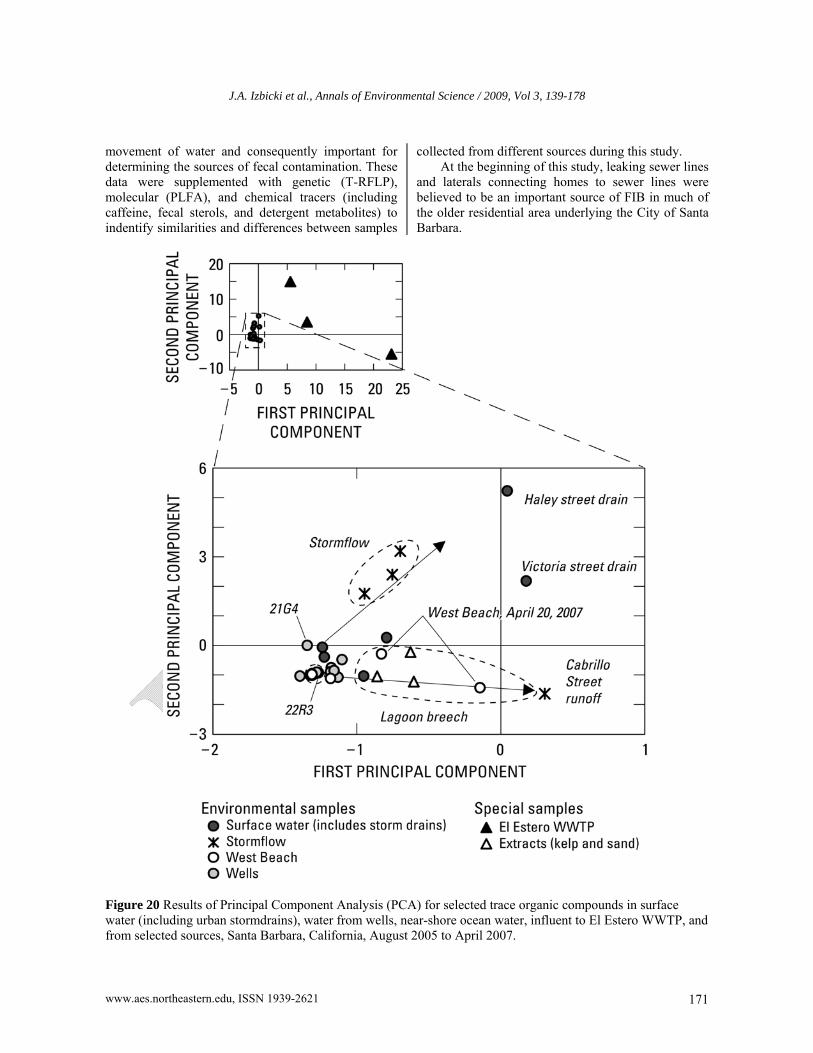
J.A. Izbicki et al., Annals of Environmental Science / 2009, Vol 3, 139-178
www.aes.northeastern.edu, ISSN 1939-2621 171
movement of water and consequently important for determining the sources of fecal contamination. These data were supplemented with genetic (T-RFLP), molecular (PLFA), and chemical tracers (including caffeine, fecal sterols, and detergent metabolites) to indentify similarities and differences between samples
collected from different sources during this study. At the beginning of this study, leaking sewer lines
and laterals connecting homes to sewer lines were believed to be an important source of FIB in much of the older residential area underlying the City of Santa Barbara.
Figure 20 Results of Principal Component Analysis (PCA) for selected trace organic compounds in surface water (including urban stormdrains), water from wells, near-shore ocean water, influent to El Estero WWTP, and from selected sources, Santa Barbara, California, August 2005 to April 2007.
J.A. Izbicki et al., Annals of Environmental Science / 2009, Vol 3, 139-178
www.aes.northeastern.edu, ISSN 1939-2621 172
The absence of FIB in water-table wells installed in the urban area suggests that while leaking laterals may be locally important, they have not resulted in areally extensive FIB contamination of groundwater. Consistent with this result, synoptic measurements of streamflow and FIB concentrations along Mission Creek showed urban drains tributary to Mission Creek contributed more to the FIB concentrations than groundwater discharge during dry periods. The presence of human-specific Bacteroides in some urban drains, especially the Haley Street drain, is indicative of human fecal contamination. This is consistent with recent results showing dry weather flows can contribute fecal contamination in urban areas [92].
Comparison of FIB concentrations in streamflow over a diurnal cycle indicated that FIB concentrations varied in a manner consistent with runoff from lawn watering and other urban flows. The lack of correlation in streamflow and FIB concentrations with WWTP inflows suggests that direct leakage from sewer lines into the stream is not the source of FIB concentrations during baseflow. FIB concentrations collected during successive stormflows decreased with runoff, consistent with contributions from non-point sources within the urban watershed.
The highest FIB concentrations in near-shore ocean water at West Beach were associated with stormflow discharges from nearby Mission Creek. High FIB concentrations persisted in near-shore ocean water for several days after the stormflow discharges to the ocean. This is consistent with a wide range of studies that show stream discharges can contaminate near-shore ocean water for considerable distances from the discharge point [11, 18-22]. However, during dry periods FIB concentrations in near-shore ocean water increased consistently during the ebb of sampled spring and neap tides. Groundwater discharge measured by seepmeters and 222Rn data was small [76] and because groundwater in wells on the beach did not contain high concentrations of FIB, discharging groundwater cannot explain near-shore ocean beach FIB concentrations. This is different from a number of recent studies that suggest groundwater is a possible source of fecal contamination to near-shore ocean water [23-25]. The timing of high FIB concentrations in the near-shore ocean water can be explained, in part, as drainage from kelp and guano-contaminated sand having high FIB concentrations at the high-tide line, consistent with work showing kelp and sand along protected beach areas may harbor FIB [14,48]. However, high FIB concentrations in kelp and sand cannot explain the consistent low-levels of human-specific Bacteroides detected in near-shore ocean
water at West Beach and additional sources of FIB contamination also must be present. Human-specific Bacteriodes in near-shore ocean water at West Beach may be associated with discharges from urban streams [92].
Genetic, molecular, and chemical data provided additional information on the sources of FIB and support interpretations derived from traditional hydrologic data. Principal Component Analysis (PCA) was used to interpret these data and identify similarities and differences between samples from different sources. All three types of data showed a high degree of similarity between samples from Mission Creek and samples collected in near-shore ocean water at West Beach, and suggest a common a common source of FIB at West Beach when Mission Creek is discharging to the ocean. The most robust PCA results were from molecular (PLFA) data, which captured 97 percent of the total variance in the data set within the first and second principal components. In contrast, the PCA analysis for T-RLFP data explained only 32 percent of the total variance within the first and second principal components. Neither genetic, molecular, nor chemical tracers show a strong similarity between samples from influent to the El Estero WWTP and samples collected in near-shore ocean water along West Beach. This is consistent with water-level data and specific conductance data from wells along the beachfront that show that the predominant direction of groundwater movement in the beach sands is from the beach towards the sewer line and that sewage contaminated groundwater does not discharge at the beachfront.
PCA analysis of the three types of tracer data did not always produce the same interpretation of the FIB sources in the near-shore ocean water. For example, PCA analysis of genetic and chemical data showed a similarity between samples collected from near-shore ocean water and kelp and guano-contaminated sand. PCA analysis of PLFA data suggest only a similarity between near-shore ocean water and sand and that PLFA contributions from kelp were greatly different. These data suggest that guano-contaminated sand is a more important source of FIB to near shore ocean water than FIB in kelp - despite the very high FIB concentrations in kelp. Differing interpretations of FIB sources from tracer data illustrate the need to use multiple tracers in conjunction with hydrologic data collected at appropriate spatial and temporal scales to identify sources of FIB.
In addition to the results from PCA analysis, a wide range of other information can be extracted from the tracer data collected as part of this study. For

J.A. Izbicki et al., Annals of Environmental Science / 2009, Vol 3, 139-178
www.aes.northeastern.edu, ISSN 1939-2621 173
example, although FIB were not present in water from wells, genetic and molecular data indicate a unexpectedly large diversity of organisms present at low concentrations in groundwater where surface runoff was discharged to beach sands. Chemical tracer data also are consistent with street runoff in water from some wells. Similarly, assemblages of waste water indicator compounds in stormflow, especially the presence of certain detergent metabolites and the absence of personal-health-care products (PHCP), flame retardants, and other compounds commonly present in waste water influent to the El Estero WWTP suggest that leakage of sewer lines is not an important source of FIB to Mission Creek during stormflow. 5. CONCLUSIONS Point sources dominated FIB contamination to streams during baseflow and non-point sources dominated FIB contamination to stream during stormflow. In most areas FIB concentrations in shallow groundwater were low, suggesting that leakage from sewer lines and laterals connecting sewer lines to residences, although locally important, were not a regional source of FIB contamination. Groundwater flow at West Beach was toward a regional sewer line, which acted as a drain. Sewage from the sewer could not move toward the beachfront and groundwater discharge at the beach-front was small. The timing of FIB concentrations during the ebb of the spring and neap times is consistent with FIB from guano contaminated kelp and beach sand. Discharge from nearby streams also contributed FIB to West Beach, especially after stormflow. Results of this study show the combined use of FIB and multiple tracers of fecal contamination, constrained by an understanding of the movement of water, is a powerful approach for identifying FIB sources to streams and near-shore ocean water. 1. FIB concentrations in the environment are highly
variable and range over three-fold in streams during baseflow, over three-orders of magnitude during stormflow, and over 2-orders of magnitude in near-shore ocean water over tidal cycles.
2. Increases in FIB concentrations in near-shore ocean water after stormflow were large and concentrations remained high for at least three days after the cessation of stormflow.
3. Traditional hydrologic data, collected at appropriate timescales, were the most valuable information for guiding interpretations on the sources of FIB to streams, shallow groundwater,
and near-shore ocean-water. 4. Water-level, seepmeter and isotopic data captured
the magnitude and direction of groundwater exchange with near-shore ocean water and were valuable in explaining FIB variations at the beachfront.
5. Tracer data captured aspects of FIB contamination sources that could not be obtained from hydrologic data alone.
6. The most robust PCA results were from PLFA data which explained 97 percent of the total variance within the first and second principal components. Smaller fractions of the total variance were explained by genetic (T-RFLP) and chemical data, with 32 and 34 percent of the total variance, respectively, explained in the first and second principal components.
7. Certain compounds used in this study as tracers of FIB sources, especially the fecal sterols, lent themselves to specific interpretations of the origins of FIB. The presence or absence of individual compounds were more easily interpreted than the presence of absence of amplicons and fatty acids also used as tracers.
6. ACKNOWLEDGEMENTS This study was funded by the City of Santa Barbara and Heal the Ocean in cooperation with the U.S. Geological Survey. Additional financial support was provided by The Andrew H. Burnett Foundation, The Ann Jackson Family Foundation, The WWW Foundation, and the Orange County Community Foundation. The authors thank Hillary Houser and Priya Verma of Heal the Ocean, and Rebecca Bjork, Steven Mack and Alex Alonzo of the City of Santa Barbara for their assistance with this study. The authors also thank the members of the City of Santa Barbara Water Commission and the Creeks Advisory Committee for their support and comments throughout the study. 7. REFERENCES [1] Balarajan R, Raleigh VS, Yuen P, Wheeler D,
Machin D, Cartwright R. Health risks associated with bathing in seawater. British Medical J., 1991, 303: 1444.
[2] Cabelli VJ, Dufour AP, Levin MA, McCabe LJ, Haberman PW. Relationship of microbial indicators to health effects at marine bathing

J.A. Izbicki et al., Annals of Environmental Science / 2009, Vol 3, 139-178
www.aes.northeastern.edu, ISSN 1939-2621 174
beaches. Amer. J. Public Health, 1979, 69: 690-696.
[3] Cabelli VJ. Health effects criteria for marine recreational waters. Technical Report EPA-600/1-80-031. Washington, DC, U.S. Environmental Protection Agency, 1983. http://www.epa.gov/nerlcwww/mrcprt1.pdf
[4] Dewailly E, Poirier C, Meyer FM. Health hazards associated with windsurfing on polluted water. Amer. J. Public Health, 1986, 76: 690-691.
[5] Haile RW, Witte JS, Gold M, Cressey R, McGee C, Millikan RC, Glasser A, Harawa N, Ervin C, Harmon P, Harper J, Dermand J, Alamillo J, Barrett K, Nides M, Wang GY. The health effects of swimming in ocean water contaminated by storm drain runoff. Epidemiology, 1999, 10: 355-363.
[6] Dufour AP, Ballentine P. Ambient water quality criteria for bacteria. Technical Report EPA A440/5-84-002. U.S. Environmental Protection Agency, Washington DC, 1986: 18.
[7] Von Donsel DJ, Geldreich EE. Relationships of Salmonellae to fecal coliforms in bottom sediments. Water Res., 1971, 5: 1079-1087.
[8] Matson EA, Horner SG, Buck JD. Pollution indicators and other microorganisms in river sediments. J. Water Pollu. Control Fed. 1978, 50: 13-19.
[9] Myers DN, Koltun GF, Francy DS. Effects of hydrologic, biological, and environmental processes on sources and concentrations of fecal bacteria in the Cuyahoga River, with implications for management of recreational waters in Summit and Cuyahoga Counties, Ohio. U.S. Geological Survey Water-Resources Investigations Report 98-4089, 1998. http://oh.water.usgs.gov./reports/Abstracts/wrir.98-4089.html
[10] Byappanahalli MN, Fowler M, Shively DA, Whitman RL. Ubiquity and persistence of Escherichia coli in a midwestern coastal stream. Appl. Environ. Microbiol., 2003, 69: 4549-4555.
[11] Izbicki JA, Pimentel MI, Leddy M, Bergamaschi B. Microbial and dissolved organic carbon characterization of stormflow in the Santa Ana River at Imperial Highway, southern California, 1999-2002. U.S. Geological Survey Scientific Investigations Report 2004-5116, 2004: 71. http://pubs.er.usgs. gov/usgspubs/sir/sir20045116.
[12] Ghinsberg RC, Leibowitz P, Witkin H, Mates
A, Seinberg Y, Bar DL, Nitzan Y, Rogol M. Monitoring of selected bacteria and fungi in sand and seawater along the Tel Aviv coast. MAP Technical Reports Series, 1994, 87: 65-81.
[13] Whitman RL, Shively DA, Pawlik H, Nevers MB, Byappanahalli MN. Occurrence of Escherichia coli and enterococci in Cladophora (Chlorophyta) in nearshore water and beach sand of Lake Michigan. Appl. Environ. Microbiol., 2003, 69: 4714-4719.
[14] Yamahara KM, Layton BA, Santoro AE, Boehm AB. Beach sands along the California coast are diffuse sources of fecal bacteria to coastal waters. Environ. Sci. Tech., 2007, 41: 4515-4521
[15] Kon T, Weir SC, Trevors JT, Lee H, Champagne J, Meunier L, Brousseau R, Masson L. Microarray analysis of Escherichia coli strains from interstitial beach waters of Lake Huron (Canada). Appl. Environ. Microbiol., 2007, 73: 7757-7758.
[16] Byappanahalli M N, Whitman RL, Shively DA, Evert Ting WT, Tseng CC, Nevers MB. Seasonal persistence and population characteristics of Escherichia coli and enterococci in deep backshore sand of two freshwater beaches. J. Water Health, 2006: 313-320.
[17] Juranek D, Calderon R, Colford J, Doyle E, McBride G, Myoda S. Comparing risk (to humans) from different sources, Chapter 4. In: Report of the Experts Scientific Workshop on Critical Research Needs for the Development of New or Revised Recreational Water Quality Criteria. Washington DC, U.S. Environmental Protection Agency 823-R-07-006, 2007: 77-90.
[18] Ahn JH, Grant SB, Surbeck CQ, DiGiacomo PM, Nazlin NP, Jiang S. Coastal Water Quality Impact of Stormwater Runoff from an Urban Watershed in Southern California. Environ. Sci. Tech., 2005, 39: 5940-5953.
[19] Pednekar AM, Grant SB, Jeong Y, Poon Y, Oancea C. Influence of climate change, tidal mixing, and watershed urbanization on historical water quality in Newport Bay, a saltwater wetland and tidal embayment in southern California. Environ. Sci. Tech., 2005, 39: 9071-9082.
[20] Grant SB, Kim JH, Jones BH, Jenkins SA, Wasyl J, Cudaback C. Surf zone entrainment, along-shore transport, and human health implications of pollution from tidal outlets. J. Geophys. Res., 2005, 110: C10025: 20.

J.A. Izbicki et al., Annals of Environmental Science / 2009, Vol 3, 139-178
www.aes.northeastern.edu, ISSN 1939-2621 175
[21] Surbeck CQ, Jiang SC, Ahn JH, Grant SB. Flow fingerprinting fecal pollution and suspended solids in stormwater runoff from an urban coastal watershed. Environ. Sci. Tech., 2006, 40: 4435-4441.
[22] Boehm AB, Keymer DP, Shellenbarger GG. An analytical model of enterococci inactivation, grazing, and transport in the surf zone of a marine beach. Water Res., 2005, 39: 3565-3578.
[23] Paytan A, Boehm AG, Shellenbarger GG. Bacterial contamination and submarine groundwater discharge - a possible link. Environ. Chem., 2004, 1: 29-30.
[24] Boehm AB, Shellenbarger GG, Paytan A. Groundwater discharge: A potential association with fecal indicator bacteria in the surf zone. Environ. Sci. Tech., 2004, 38: 3558-3566.
[25] Boehm AB, Paytan A, Shellenbarger GG, Davis KA. Composition and flux of groundwater from a California beach aquifer: Implication for nutrient supply to the surf zone. Continental Shelf Res., 2006, 26: 269-282.
[26] Pitt R, Labor M, Harper J, Nix C, Barbe D. Potential new tools for the use of tracers to indicate sources of contaminants to storm drainage systems. In: U.S. Environmental Protection Agency, National Conference on Tools for Urban Water Resource Management and Protection: Proceedings, February 7-10, 2000, Chicago, IL. EPA/625/R-00/001, 2000: 97-109. http://www.epa.gov/ordntrnt/ORD/Web Pubs/nctuw/
[27] Savichtcheva O, Okabe S. Alternative indicators of fecal pollution: Relations with pathogens and conventional indicators, current methodologies for direct athogen monitoring and future application perspectives. Water Res., 2006, 40: 2463-2476.
[28] Kreader CA. Design and evaluation of Bacteroides DNA probes for the specific detection of human fecal pollution. Appl. Environ. Microbiol., 1995, 61: 1171-1179.
[29] Bradley G, Carter J, Gaudie D, King C. Distribution of the human faecal bacterium Bacteroides fragilis, its bacteriophages and their relationship to current sewage pollution indicators in bathing water. J. Appl. Microbiol., 1999, 85: 905-1008.
[30] Simpson JM, Santo Domingo JW, Reasoner DJ. Assessment of equine fecal contamination: the search for alternative bacterial source-tracking targets. FEMS Microbial Ecology, 2004, 47: 65-75.
[31] Bernhard AE, Field KG. Identification of nonpoint sources of fecal pollution in coastal waters by using host-specific 16S ribosomal DNA genetic markers from fecal anaerobes. Appl. Environ. Microbiol., 2000, 66: 4571-4574.
[32] Boehm AB, Fuhrman JD, Mrse RD, Grant SB. Tiered approach for identification of a human fecal pollution source at a recreational beach: Case study at Avalon Bay, Catalina Island, California. Environ. Sci. Tech., 2003, 37: 673-680.
[33] Wong M., Kumar L, Jenkins TM, Xagoraraki I, Phanikumar MS, Rose JB. Evaluation of public health risks at recreational beaches in Lake Michigan via detection of enteric virusus and human-specific bacteriological marker. Wat. Res., 2009, 73: 1137-1149.
[34] Xagoraraki I, Kuo DH-W, Wong K, Wong M, Rose JB. Occurrence of human adenoviruses at two recreational beaches of the Great Lakes. Appl. Environ. Microbiol., 2007, 73: 7874-7881.
[35] Noble RT, Fuhrman JD. Enteroviruses detected by reverse transcroptase polymerase chain reaction from the coastal waters of Santa Monica Bay, California: Low correlation to bacteria indicator levels. Hydrobiologia, 2001, 460: 175-185.
[36] Francy DS, Bertke EE, Finnegan DP, Kephart CM, Sheets RA, Roades J, Stumpe L. Use of spatial sampling and microbial source-tracking tools for understanding fecal contamination at two Lake Erie beaches. U.S.G.S. SIR Rept. 2006-5298, 29 p.
[37] Samadpour M. Microbial source tracking: principals and practice. In: Bernstein, BB, Griffith, JF, Weisberg, SB. eds. Microbial Source Tracking Workshop: Summary of Proceedings. U.S. Environmental Protection Agency Workshop on Microbial Source Tracking, February 5, 2002, Irvine, California, 2002: 5-9.
[38] Hartel PG, Summer JD, Hill JL, Collins V, Entry JA, Segars WI. Geographic variability of Escherichia coli ribotypes from animals in Idaho and Georgia. J. Environ. Qual., 2002, 31: 1273-1278.
[39] Wheeler AL, Hartel PG, Godfrey DG, Hill JL, Segars WI. Potential of enterococcus faecalis as a humal fecal indicator for microbial source tracking. J. Environ. Qual., 2002, 31: 1286-1293.

J.A. Izbicki et al., Annals of Environmental Science / 2009, Vol 3, 139-178
www.aes.northeastern.edu, ISSN 1939-2621 176
[40] Lamendella R, Santo Domingo JW, Oerther DB, Vogel JR, Stoeckel DM. Assessment of fecal pollution sources in a small northern-plains watershed using PCR and phylogenic analyses of Bacteroidetes 16SRNA gene. FEMS Microbial Ecology, 2007, 59: 651-660.
[41] Brun GL, Bernier M, Losier R, Doe K, Jackman P, Lee HB. Pharmaceutically active compounds in Atlantic Canadian sewage treatment plant effluents and receiving waters, and potential for environmental effects as measured by acute and chronic aquatic toxicity. Environ. Toxicol. Chem., 2006, 25: 8: 2163-2176.
[42] Kolpin DW, Furlong ET, Meyer MT, Thurman EM, Zaugg SD, Barber LB, Buxton HT. Pharmaceuticals, hormones, and other organic wastewater contaminants in U.S. streams, 1999-2000: A national reconnaissance. Environ. Sci. Tech., 2002, 36: 1202-1211.
[43] Glassmeyer ST, Furlong ET, Kolpin DW, Cahill JD, Zaugg SD, Werner SL, Meyer MT, Kryak DD. Transport of chemical and microbial compounds from known wastewater discharges - potential for use as indicators of human fecal contamination. Environ. Sci. Tech., 2005, 39: 5157-5169.
[44] Dutka BJ, Chau ASY, Coburn J. Relationship between bacterial indicators of water pollution and fecal sterols. Water Res., 1974, 8: 1047-1055.
[45] Isobe KO, Tarao M, Zakaria MP, Chiem NH, Minh LY, Takada H. Quantitative application of fecal sterols using gas chromatography-mass spectrometry to investigate fecal pollution in tropical waters: Western Malaysia and Mekong Delta, Vietnam. Environ. Sci. Tech., 2002, 36: 4497-4507.
[46] Isobe KO, Tarao M, Chiem NH, Minh LY, Takada H. Effect of environmental factors on the relationship between concentrations of coprostanol and fecal indicator bacteria in tropical (Mekong Delta) and temperate (Tokyo) freshwaters. Appl. Environ. Microbiol., 2004, 70: 814-821.
[47] Noblet JA, Young DL, Zeng EY, Ensari S. Use of fecal steroids to infer the sources of fecal indicator bacteria in the lower Santa Ana River watershed: Sewage is unlikely a significant source. Environ. Sci. Tech., 2004, 38: 6002-6008.
[48] Boehm AB, Weisberg SB. Tidal forcing of enterococci at fortnightly and semidiurnal frequencies. Environ. Sci. Tech., 2005, 39:
5575-5583. [49] McFadden MC, Polinoski KG, Martin P.
Measurement of streamflow gains and losses on Mission Creek at Santa Barbara, California, July and September, 1987. U.S. Geological Survey Water Resources-Investigations Report 91-4002, 1991: 15 p. http://pubs.er.usgs.gov/usgspubs/wri/wri914002
[50] Fuhrman JA, Liang X, Noble RT. Rapid detection of enteroviruses in small volumes of natural waters by real-time quantitative reverse transcriptase PCR. Appl. Environ. Microbiol., 2005, 71: 4523-4530.
[51] Seurinck S, Defoirdt T, Verstraete W, Siciliano SD. Detection and quantification of the human-specific HF183 Bacteroides 16S rRNA genetic marker with real-time PCR for assessment of human fecal pollution in freshwater. Environ. Microbiol., 2005, 7: 249-259.
[52] LaMontagne MG, Holden PA. Comparison of free-living and particle-associated bacterial communities in a coastal lagoon. Microbial Ecology, 2003, 46: 228-237.
[53] Liu WT, Marsh TL, Cheng H, Forney LJ. Characterization of microbial diversity by determining terminal-restriction fragment length polymorphisms of gene encoding 16S rRNA. Appl. Environ. Microbiol., 1997, 63: 4516-4522.
[54] Osborn AM, Moore ERB, Timmis KN. An evaluation of terminal-restriction fragment length polymorphism (T-RFLP) analysis for the study of microbial community structure and dynamics. Environ. Microbiol., 2000, 2: 39-50.
[55] LaMontagne MG, Schimel JP, Holden PA. Comparison of subsurface and soil bacterial communities in California grassland as assessed by terminal-restriction fragment length polymorphisms of PCR-Amplified 16S rRNA genes. Microbial Ecology, 2003, 46: 216-227.
[56] White DC, Davis WM, Nickels JS, King JD, Bobbie RJ. Determination of the sedimentary microbial biomass by extractable lipid phosphate. Oecologia, 1979, 40: 51-62.
[57] Zaugg SD, Smith SG, Schroeder MP. Determination of wastewater compounds in whole water by continuous liquid–liquid extraction and capillary-column gas chromatography/mass spectrometry. U.S. Geological Survey Techniques and Methods, 2006, 5: B4: 30.
[58] Fishman MJ. ed. Methods of Analysis by the U.S. Geological Survey National Water Quality
J.A. Izbicki et al., Annals of Environmental Science / 2009, Vol 3, 139-178
www.aes.northeastern.edu, ISSN 1939-2621 177
Laboratory--Determination of Inorganic and Organic Constituents in Water and Fluvial Sediments. U.S. Geological Survey Open-File Report 93-125, 1993: 217. http://pubs.er.usgs.gov/usgspubs/ofr/ofr93125
[59] Swarzenski PW, Charette M, Langevin C. An autonomous electromagnetic seepage meter to study coastal groundwater/surface water exchange. U.S. Geological Survey Open-File Report 2004-1369, 2004: 4. http://pubs.er.usgs. gov/usgspubs/ofr/ofr20041369.
[60] Young SC, Pearson HS. The electromagnetic borehole flowmeter - description and applications. Groundwater Monitoring and Review, 1995, 15: 4: 138-146.
[61] Huettel M, Ziebis W, Forester S. Flow-induced uptake of particulate matter in permeable sediments. Limnol. Oceanogr., 1996, 41: 309-322.
[62] Shinn EA, Reich CD, Hickey TD. Seepage meters and Bernoulli’s revenge, Estuaries, 2002, 25: 1: 126-132.
[63] Burnett WC, Aggarwal PK, Aureli A, Bokuniewicz H, Cable JE, Charette MA, Kontar E, Krupa S, Kulkarni KM, Loveless A, Moore WS, Oberdorfer JA, Oliveria J, Ozyurt N, Povinec P, Privitera AGM, Rajar R, Ramessur RT, Scholten J, Stieglitz T, Taniguchi M, Turner JV. Quantifying submarine groundwater discharge in the coastal zone via multiple methods. Sci. Total Environ., 2006, 367: 498-543.
[64] Swarzenski PW. U/Th series radionuclides, as coastal groundwater tracers. Chem. Rev., 2007, 107: 2: 663-674.
[65] Corbett DR, Dillon K, Burnett W, Chanton J. Estimating the groundwater contribution into Florida Bay via natural tracers 222Rn and CH4. Limnol. Oceanogr., 2000, 45: 1546-1557.
[66] Burnett WC, Dulaiova H. Estimating the dynamics of groundwater input into the coastal zone via continuous radon-222 measurements. J. Environ. Radioactivity, 2003, 69: 21-35.
[67] Swarzenski PW, Burnett WC, Greenwood WJ, Herut B, Peterson R, Dimova N, Shalem Y, Weinstein Y. Combined time-series resistivity and geochemical tracer techniques to examine submarine groundwater discharge at Dor Beach, Israel. Geophys. Res. Lett., 2006, 33: L24405: 6.
[68] Dulaiova H, Peterson R, Burnett WC. A multi-detector continuous monitor for assessment of 222Rn in the coastal ocean. J. Radioanalytical Nuclear Chem., 2005, 263: 361-365.
[69] Swarzenski PW, Kruse S, Reich C, Swarzenski WV. Multi-channel resistivity investigations of the fresh water/saltwater interface: A new tool to study an old problem. In: A New Focus on Groundwater-Seawater Interactions. Sanford, W, Langevin, C, Polemio, M, Povinec, P. eds. IAHS Publ., 2007a, 312: 100-108.
[70] Santoro AE, Boehm AB. Frequent occurrence of the human-specific Bacteroides fecal marker at an open coast marine beach: Relationship to waves, tides, and traditional indicators. Environ. Microbiol., 2007, 9: 8: 2038-2049.
[71] U.S. Environmental Protection Agency Draft guidance for salt and freshwater beaches – Appendices, Appendix B. USEPA Guidance for Recreational Waters and Beaches, 2000. http://ww2.cdph.ca.gov/healthinfo/environhealth/water/Documents/Beaches/AppendixB.pdf. accessed June 10, 2008.
[72] Boehm AB. Enterococci concentrations in diverse coastal environments exhibit extreme variability. Environ. Sci. Tech., 2007, 41: 24: 8227-8232.
[73] Michael HA, Mulligan AE, Harvey CF. Seasonal oscillations in water exchange between aquifers and the coastal ocean. Nature, 2005, 436: 1145-1148.
[74] Moore WS. Large groundwater inputs to coastal water revealed by 226Ra enrichments. Nature, 1996, 380: 612-614.
[75] Povinec PP, Aggarwal PK, Aureli A, Burnett WC, Kontar EA, Kulkarni KM, Moore WS, Rajar R, Taniguchi M, Comanducci JF, Cusimano G, Dulaiova H, Gatto L, Groening M, Hauser S, Levy-Palomo I, Oregioni B, Ozorovich YR, Privitere AMG, Schiavo MA. Characterization of submarine groundwater discharge offshore south-eastern Sicily. J. Environ. Radioactivity, 2006, 89: 81-101.
[76] Swarzenski PW, Izbicki JA. Coastal groundwater dynamics off Santa Barbara, California: Combining geochemical tracers, electromagnetic seepmeters, and electrical resistivity. Estuar., Coast., Shelf Sci., 2009, 83: 77-89.
[77] Swarzenski PW, Izbicki JA. Examining coastal exchange processes within a sandy beach using geochemical tracers, seepage meters and electrical resistivity, Submitted to Mar. Chem.
[78] Swarzenski PW, Reich C, Kroeger KD, Baskaran M. Ra and Rn isotopes as natural tracers of submarine groundwater discharge in Tampa Bay, Florida. Mar. Chem., 2007, 104:

J.A. Izbicki et al., Annals of Environmental Science / 2009, Vol 3, 139-178
www.aes.northeastern.edu, ISSN 1939-2621 178
69-84. [79] Kshirsagar AM. Multivariate Analysis. New
York: Dekker, 1972, 534. [80] Gnanadesikan R. Methods for Statistical Data
Analysis of Multivariate Observations, 2nd edn. New York: Wiley, 1997: 384.
[81] Preisendorfer RW, Zwiers FW, Barnett TP. Foundations of principal component selection rules: SIO Reference Series 81-4. La Jolla, California, Scripps Institute of Oceanography, 1981: 191.
[82] Tunlid A, White DC. Biochemical analysis of biomass, community structure, nutritional status, and metabolic activity of microbial communities in soils. In: Stotzky, G, Bollang, JM, eds. Soil Biochemistry, New York: Decker, 1992: 229-262.
[83] Edlund A, Nichols PD, Roffey R, White DC. Extractable and lipopolysaccharide fatty acid and hydroxyl acid profiles from Desulfovibrio species. J. Lipid Res., 1985, 26: 982-988.
[84] Dowling NJ, Widdel F, White DC. Phospholipid ester-linked fatty acid biomarkers of acetate-oxidizing sulfate reducers and other sulfide forming bacteria. J. Gen. Microbiol., 1986, 132: 1815-1825.
[85] White DC, Stair JO, Ringelberg DB. Quantitative comparisons of in situ microbial biodiversity by signature biomarker analysis. J. Industrial Microbiol., 1996, 17: 185-196.
[86] Paul EA, Clark FE. Soil Microbiology and Biochemistry. New York: Academic Press, 1996: 340.
[87] Haack SK, Garchow H, Odelson DA, Forney LJ, Klug MJ. Accuracy, reproducibility, and
interpretation of fatty acid methyl ester profiles of model bacteria communities. Appl. Environ. Microbiol., 1994, 60: 7: 2483-2493.
[88] White DC. Is there anything else you need to understand about the microbiota that cannot be derived from analysis of nucleic acids? Microbiol Ecol., 1994, 28: 163-166.
[89] O'Leary T, Leeming R, Nichole PD, Volkman JK. Assessment of the sources, transport and fate of sewage-derived organic matter in Port Phillip Bay, Australia using the signature lipid coprostanol. Marine Freshwater Res., 1999, 50: 547-556.
[90] Leeming R, Ball A, Ashbolt N, Nichols P. Using faecal sterols from humans and animals to distinguish faecal pollution in receiving waters. Water Res., 1996, 30: 2893-2900.
[91] Izbicki JA, Mendez GO, Burton CA. Stormflow chemistry in the Santa Ana River below Prado Dam and at the diversion downstream from Imperial Highway, southern California, 1995-98. U.S. Geological Survey Water-Resources Investigations Report 00-4127, 2000: 92 p. http://pubs.er.usgs.gov/usgspubs/wri/wri004127.
[92] Sercu B, Van de Werfhorst LC, Murray J, Holden PA. Storm drains are sources of human fecal pollution during dry weather in three urban southern California watersheds. Env. Sci Tech., 2009, 43: 293-298.
AES 9506 © Northeastern University, 2009