Embed Size (px)
Citation preview
Sources of Growth in the Indian Economy
by
Barry Bosworth (the Brookings Institution) Susan M. Collins (Brooking Institution and Georgetown University)
Arvind Virmani (India Planning Commission)
July 15, 2006
This preliminary paper is prepared for the Indian Policy Forum to be held in New Delhi, July 31-Aug 1, 2006. Please do not cite.
Preliminary -July 15, 2006
Sources of Growth in the Indian Economy
by
Barry Bosworth, Susan M. Collins, and Arvind Virmani1
Recent years have witnessed a growing optimism about the potential for Indian
economic growth. In part, this is fueled by the example of strong sustained growth in
China, raising the obvious question of why India cannot do as well. However, the
optimism also reflects the fact that India’s growth has accelerated over the past two
decades. And while its growth rate remains well below that of China, this favorable
performance contrasts with the slowing of growth in other regions. It has also enabled
the emergence of a significant middle class in India. Interestingly, India’s economic
performance has differed from that of China and other parts of Asia in at least two
dimensions. First, India’s success has not been based on strong growth in the
manufacturing sector and in exports. Instead, it has reflected very rapid expansion of
service-producing industries. Second, it has been associated with relatively modest levels
of investment. Even incorporating recent data revisions, India’s physical capital
accumulation has not been impressive. And despite substantial increases in the number
of Indians attaining higher education, illiteracy rates remain high.
In this paper, we build on a growth accounting framework to empirically examine
these dimensions of India’s recent growth. Where has the growth been concentrated, as
among agriculture, industry, and the service-producing sectors? What are the major
contributors to that growth: increased employment, capital per worker, educational
attainment, or improvements in the basic efficiency of resource use (total factor
productivity)? We also examine each of the features noted above that distinguish India’s
1 The authors are respectively Senior Fellow at the Brookings Institution, Senior Fellow at Brookings and Professor of Economics at Georgetown University, and Principle Advisor, Planning Commission (former Director, ICRIER). We thank Gabriel Chodorow-Reich for research assistance.
1
recent performance. Thus, we are particularly interested in the sources of growth in the
service-producing industries. Is it sustainable or should India place greater emphasis on
the manufacturing sector and the promotion of rapid growth in export markets? We also
emphasize the roles of both physical and human capital accumulation. Throughout the
analysis, we are particularly concerned about the quality of the available statistical data,
and the influence this may have on our conclusions.
There is already an extensive empirical literature – often using growth accounts –
that examines these and other aspects of India’s economic growth. Many of the studies
address one or more of the following topics. First, a number of analysts have focused on
characterizing India’s economic performance at the most aggregate level. While there is
agreement that growth did indeed improve during the past quarter century, researchers
have reached varying conclusions on some issues such as the timing and precise
magnitude of this acceleration, and the relative importance of changes in domestic policy.
For example, Virmani (1997), Rodrik and Subramanian (2005) and Kohli (2006a and b)
point out that growth initially accelerated during the 1980s, predating the reforms that
followed the crisis of the early 1990s. Within this context, Rodrik-Subramanian and
Kohli both stress the role of what they term “pro-business” reforms that began in the
early 1980s. In contrast, Srinivasan (2003b) and Panagyria (2004) argue that, prior to the
more substantial liberalizations that emerged in the 1990s, growth was built largely on
unsustainable increases in public expenditures and excessive foreign borrowing that
culminated in the balance of payments crisis of 1991. There are on-going discussions
over the extent to which the current growth can be maintained and various means by
which it might be increased.
Second, analysts have examined the behavior of particular output sectors. A
number of authors have studied productivity in manufacturing – reaching a wide range of
conflicting conclusions. However, as explained in detail by Goldar and Mitra (2002),
differences in the findings can be attributed to a variety of measurement issues, such as
the use of singe versus double deflation to construct estimates of real growth in
manufacturing value added. Goldar (2004) provides a careful recent update showing that
TFP growth in manufacturing appears to have slowed in the post reform period – raising
additional puzzles discussed below. (These two papers provide additional references to
2
the relevant work.) However, due to difficulties in measuring employment within
individual industries, our analysis focuses primarily on the broader industrial sector. The
studies that focus on India’s services sector (many of which discuss the issue of
sustainability), and those that discuss agriculture, are discussed in the body of the paper.
Given the large body of prior research, many of the results to be discussed below
are already well-known to those in the field. None-the-less, this paper seeks to make a
contribution to that literature in a variety of ways. In particular, the growth accounting
framework, combined with our emphasis on data issues, pulls together concerns that have
typically been treated separately, and in some cases, raise implications that do not appear
to have been consistently recognized. Our updated growth accounts incorporate recent
data revisions, some of which are quite large. They also provide new estimates for the
contributions to overall growth of labor productivity growth within the major economic
sectors versus the gains from reallocation of labor and capital among the factors.
Furthermore, we have examined a variety of additional data in our analysis of the role of
capital accumulation – providing estimates of the returns to schooling for human capital,
and reporting on trends in sectoral saving and investment, for physical capital.
Thus, this paper is comprised of four remaining sections. The next section details
the construction of growth accounts for India, with considerable attention paid to the
quality of the underlying data. The following section presents and discusses the results.
Section three examines a range of issues related to the role of capital accumulation in
India’s growth experience. It focuses first on human capital and then turns to an analysis
of investment and saving behavior in India. Drawing from the preceding analyses, the
final section discusses implications for Indian economic growth, going forward.
We argue that the emphasis on business services as the driving force behind the
expansion of the Indian economy is frequently overstated. Despite its extraordinary
growth, the industry comprises only a small share of India’s GDP and overall
employment. Instead, high rates of total factor productivity (TFP) growth in the overall
services sector, which includes such industries as trade, transportation and education
where we would not expect to observe rapid TFP growth, raise concerns that growth of
the sector may be overstated in the statistics. In addition, business services provide jobs
primarily for the relatively small proportion of the workforce that is highly educated. We
3

find some evidence that the current emphasis on high-skill services is already
encountering some shortages -- a bidding up of the relative wage rate for secondary and
university-level graduates. In any case, the expansion is not creating adequate job growth
for the bulk of the Indian population that is not particularly well-educated.
Thus, it is important that India broaden the base of the current expansion by
promoting programs that would increase India’s attractiveness as a source of
manufactured goods for the world market. The growth of the manufacturing sector
would provide a strong match for the skills of the Indian workforce. This implies more
urgent attention to improving the infrastructure in the areas of energy reliability,
transportation and port facilities.
India also faces significant challenges in the quality of the educational system. As
we illustrate, the Indian workforce is not particularly well-educated. Illiteracy rates are
high by international standards, even among the young, and we find evidence of
shortages among the group of highly-educated workers (university graduates) who have
done so well in recent years. Thus, India needs to expand the supply of well-educated
workers at the same time that it increases the demand for workers with more modest
skills.
Furthermore, we conclude that the supply of private saving in India is adequate to
support a significantly higher rate of growth in future years. From the perspective of
physical capital formation, the problems are more concentrated in the extreme dissaving
of the public sector and the apparent weakness to the demand side to expand investment.
Construction of the Growth Accounts
Although empirical research on productivity growth has used a variety of
methodologies, most of the analysis has evolved along two primary paths: growth
accounting or direct econometric estimation. Both are based on the underlying concept
of an aggregate production function. Growth accounting combines the production
function with the assumption of competitive markets, leading to the usage of income
shares to measure the contribution of factor inputs. This method focuses on identifying
contributions of individual factor inputs and a residual, typically called total factor
productivity (TFP). In contrast, the econometric approach avoids any assumption that
4
markets are competitive, and focuses on exploring alternative functional forms for the
production function.
Most empirical studies have tended to emphasize what might be labeled the
proximate causes of growth: measuring the quantity and quality of capital and labor
inputs, and viewing the TFP residual as representing a combination of changes in
efficiency and the production technology. More recently, some researchers have sought
to go beyond proximate causes, so as to associate the fundamental sources of long-term
differences in living standards with underlying differences in institutional and legal
arrangements and geography. In these studies, TFP is perceived as the driving force
behind growth. Accumulation of both physical capital and labor skills is taken to be
largely endogenous -- and ultimately induced by changes in TFP. From this perspective,
developing a theory of TFP is a central objective.2
Basic Growth Accounting Framework.
Building from the seminal work by Solow (1957), modern productivity analysis
begins with the concept of an aggregate production function. As shown in equation (1),
this relates output (Q) to contributions of factor inputs, capital (K) and labor (L), as well
as a Hicks-neutral shift in the production function (A):
(1) ( )tttt LKFAQ ,= .
The next step is to combine the notion of a production function with the
assumption of competitive markets in which factors are paid their marginal products. It
is then straight-forward to derive a simple index number formulation relating growth in
output to increases in factor inputs and a residual shift term, identified with TFP:
(2) TFPLdsKdsQd lk ln)ln()ln(ln Δ++= ,
where sk and sl are the shares of capital and labor income, respectively.3
2 Examples of this literature are provided by Klenow and Rodriguez-Clare (1997) and Easterly and Levine (2001). 3 The use of income share weights is critical, because this makes it possible to avoid imposing restrictions on the possible functional forms of the production function. In empirical applications, the factor shares are replaced by average between period shares in a Tornqvist discrete time approximation. Thus sk is replaced by (skt + skt-1 ) / 2 . A summary of this literature is provided in Hulten (2001). OECD (2001) provides a detailed manual, elaborating on the major issues.
5
As discussed more fully below, it is often difficult to obtain meaningful time
series estimates of factor income shares. Thus, many studies adopt the more restricted
Cobb-Douglas production function, which assumes the contribution of each factor to be
constant:
(3) . ( )γαα −= 1ttt LKAQ
Again, A represents TFP and γ measures the extent of returns to scale. In this restricted
formulation, the sk and sl of equation (2) are replaced with constants. Many studies have
also simply assumed returns to scale of unity. In the absence of an explicit allowance,
returns to scale are subsumed within an overall residual of TFP. That is the approach
used in this study.
It has become standard to adjust the factor inputs, particularly labor, to reflect
changes in quality. Most of this research follows one of two common approaches. The
first seeks to cross-classify the workforce by a number of differentiating characteristics,
such as education, age, occupation and gender. Information on these characteristics is
combined with data on wage rates, so to compute each subgroup’s share of total
compensation, vi. An adjusted measure of the labor input is then computed as
(4) ii
i LdvLd lnln * ∑=
However, this process is very data intensive. In addition, some analysts object that
observed wage differentials may reflect factors other than productivity differences, such
as gender or age discrimination.
The alternative is to use a simple index of educational attainment to adjust for
skill differences. For example, an index of the form:
(5) LeL as=*
assumes that each year of schooling, s, raises the average worker’s productivity by a
constant percentage, a. This formulation has a ready parallel with the vast number of
empirical studies that have measured the relationship between wages and years of
schooling using “Mincer regressions”. Such studies have been carried out for different
6

time periods and for a large number of countries around the world, typically finding a
return to each additional year of education in the range of 7 to 12 percent.4
Quality adjustments can also be made to the measure used for capital input --
however, in most cases these are more properly identified as reflecting changes in the
composition of the capital stock. Current approaches were developed from Jorgenson’s
neoclassical investment theory that clarified the distinction between the capital stock and
capital services. Using his concept of user cost, the rental price of capital services is
given by
(6) , kks
k PPiP •−+= )( δ
where i represents the rate of return, and δ the rate of depreciation. and are the
price of a unit of capital, and its rate of change, respectively. This formulation makes it
clear that the flow of capital services will vary with difference in the rate of capital asset
depreciation. Assuming that the real rate of return is constant across asset classes, the
capital service term can be used to compute capital income shares. In a fashion
analogous to equation (4), these shares can then be used to aggregate capital of different
service lives, thereby constructing an adjusted capital input measure. The growing
importance of short-lived, high-tech capital has made the issue of compositional changes
in the capital stock more important.
kP kP
Unfortunately, few countries have sufficiently detailed information to make these
types of compositional adjustments to their capital inputs measure – and India is no
exception. The data constraints are particularly acute at the level of individual industries.
Instead, an estimate of the capital stock is commonly used as the index of capital services.
The essential difference between the two is that the capital stock aggregate is constructed
using purchase prices as the relevant weights, while the capital services aggregate would
be constructed using rental prices as weights.
Using this framework, we estimate a set of growth accounts over the period 1960-
61 to 2004-05, for the total economy as well as for its three major sectors -- agriculture,
4 References to many of these international studies are available in Psacharopoulos and Patrinos (2004). We will discuss several specific studies of India in a later section.
7

industry and services – as well as for manufacturing.5 We have excluded residential
housing from services and the total economy because income from housing is based
solely on imputations, and is all assigned to capital income. As described more fully
below, the output and capital stock data are from the national accounts. These reflect the
significant revisions associated with the adoption of the new 1999-00 base. Estimates of
employment are based on results from the quinquennial household surveys.
Data Sources
The Indian statistical agencies face substantial challenges in preparing measures
of output and employment at both the aggregate and sectoral levels. The difficulties arise
primarily because a large portion of the nonagricultural workforce operates outside of
standard reporting programs. Furthermore, India’s national accounts are highly
dependent on a series of quinquennial surveys for information on households and small
enterprises. Therefore, annual estimates of output and employment (as well as estimates
at higher frequencies), are largely based on either simple interpolations or on
extrapolations of underlying source data. We have relied heavily on the comprehensive
analysis of Sivasubramonian (2004) for the development of the requisite data at the level
of the total economy. We have extended his analysis by incorporating recent revisions of
the national accounts and by developing comparable growth accounts for major sub-
sectors of the Indian economy (agriculture, industry, manufacturing, and services). We
have also incorporated an alternative methodology to estimate the contribution of
improvements in the educational attainment of the workforce.
In the remainder of this section, we discuss the data used to construct growth
accounts for India. Output measures are considered first, followed by each of the factor
inputs and, finally, measures of factor shares. Along the way, we summarize key data
concerns and their implications.
5 We follow the grouping traditionally used by the UN and other international organizations. Indian statistical agencies use the same grouping, but refer to them as the primary, secondary and tertiary sectors. The agricultural sector includes forestry and fishing. Industry is comprised of mining, manufacturing, construction and utilities. The services sector covers the remainder of the economy.
8

Output. India has a reasonably good statistical system for measuring output of
the agricultural sector and of non-agricultural enterprises that participate in government
reporting programs, and are classified as part of the organized sector.6 For example, this
includes factories registered under the 1948 Factories Act, as well as large portions of
mining, utilities, communications and finance. For these enterprises, it is possible to
construct estimates of value added for national accounts, using either the production
approach or the income approach. Furthermore, original source data are often available
annually.
However, most workers are not included within the organized or formal sector of
the economy. This point is clearly illustrated in Table 1, which provides data for 1999-
2000. Its first three columns show the distribution of GDP by major industry, as well as
the share of output in each industry produced in the organized versus the unorganized
sectors.7 The final column shows the percent of employment that is unorganized in each
sector.8 Within the nonagricultural economy, for example, fully 44 percent of the GDP
was in the unorganized sector, and unorganized employment accounted for 88 percent of
total employment.
For the unorganized sector, Indian measures of GDP are constructed using the
labor input method. Thus, estimates of labor input at the industry level are combined
with measures of value added per worker (VAPW) from a variety of enterprise surveys.
In this context, it is important to note that labor input is defined in terms of the number of
jobs, not the number of workers. The total labor input measure comes from the
quinquennial household survey. Since the objective is to obtain an employment measure
equivalent to the one that employers would report (inclusive of multiple job holding), the
number of workers reporting a principal employment activity over the prior year is added
6 A recent review of the Indian statistical system is provided in the 2001 Report of the National Statistical Commission, available at: http://mospi.nic.in/nscr/mp.htm. The commission identified some significant areas of deterioration in the agricultural and industry statistics, and it highlighted the dearth of information about service-producing industries. 7 The unorganized sector is a bit broader than the related concept of the informal sector. For further discussion of the classification issues in the Indian context see Saha, Kar,and Baskaran (2004) and Kolli and Hazra (2005). 8 Note that the percent of employment in a particular industry that is unorganized may differ from the share of labor input to the unorganized sector. For example, labor inputs in the organized sector may include casual workers, who would be classified as “unorganized employment”.
9
to the number of workers reporting a subsidiary employment activity. Each worker could
be recorded as having up to two jobs. No adjustment is made for full versus part-time
work for either primary or secondary jobs.9 The measure of labor input in the organized
sector is obtained from employer reports. Thus, labor input in the unorganized sector is
simply a residual -- the difference between the two.
The techniques described above should generate reasonably good estimates of
output in the benchmark years for which survey data are available. However, India has
no consistent source of information about employment in the unorganized sector for the
years between the quinquennial surveys. Annual information on value added per worker
is equally limited, since the value-added data are also updated on an approximate 5-year
cycle. Therefore, detailed calculations of output using the labor input method can only be
undertaken for benchmark years. Estimates of value added for the years between
benchmarks are obtained by interpolation. Estimates for years since the most recent
benchmark are obtained by extrapolating the labor inputs, based on growth between the
two most recent benchmarks.
Table 2 provides a stark illustration of the problems created by the lack of
underlying annual survey data for the unorganized portions of the economy. The first
column shows the sectoral composition of GDP, using the revised data. The next two
columns show two estimates of 1993-94 GDP – one using the 1980-81 benchmark and
the other from the 1993-94 benchmark revision. Column 4 shows the percentage
difference between the two. The second panel provides parallel information for 1999-
2000 GDP, comparing the estimate using the 1993-94 benchmark, with the revision from
the 1999-00 benchmark. (We note that, prior to the introduction of the 1993-94 base,
GDP data were rebased to the decennial census with the last benchmark being 1980. The
Central Statistical Office (CSO) has now shifted to a procedure that ties benchmark
revisions to the quinquennial household surveys.)
9 The methods used to compute the labor input have varied significantly over time, further restricting the comparability of the estimates of industry value added. The 1950, 1970, and 1980 benchmarks used census estimates, whereas the 1993-94 and 1999-00 benchmarks used data from the quinquennial employment and unemployment surveys. The 1970 through 1990 censuses are known to have encountered severe problems in measuring the workforce (Visaria, 2002). Also the 1999-00 benchmark adjusted for multiple jobs at the level of individual industries, whereas the 1993-94 estimates relied on common ratios from aggregate data. Additional details are available in CSO (2004).
10
As shown in the fourth column of Table 2, revisions to 1993-94 GDP were
substantial, raising the estimate of total GDP by fully 9 percent. In part, the sizable
revisions that accompanied the shift to the 1993-94 base reflects the fact that it had been
so many years since the introduction of the 1980-81 base. But it is important to point out
that the revisions are quite small for those industries that are largely in the organized
sector and for which annual sources of information are available. In contrast, the
necessity of relying on the labor input methodology and past rates of change to
extrapolate output resulted in particularly large output revisions in the service-producing
industries (15 percent, on average). Output for the category that includes business
services was revised upwards by 103 percent. The lack of good output data for the service
industry is a problem in all countries. It is of particular importance for India because of
the prominent role that services are expected to play in the country’s future growth.
The 1999-00 base revisions, shown in column 8, were much smaller – both
because fewer years had elapsed and because there had been fewer methodological
changes. In addition, India adopted many elements of the 1993 Standard National
Accounts, which contributed to some of the upward revisions of GDP. The revisions for
agriculture and industry were minor, but output of the service-producing industries was
increased by 4.5 percent, adding almost a percentage point to the annual growth rate.
And once again, the revisions were quite large in some sub-sectors, such as the category
including business services.
The problems with annual output estimates in non-benchmark years suggest that
debates over the precise timing of changes in India’s rate of GDP growth around episodes
of economic reform should not be taken very seriously. Annual changes, based on
extrapolations from the last benchmark, may be misleading. In contrast, the benchmark
estimates themselves are constructed with considerable detail and a strong anchor in the
quinquennial surveys. This provides a reasonable degree of confidence for focusing on
those selected years to study India’s economic performance.
In the past, The CSO has provided revised historical estimates of GDP and its
components that are consistent with the latest benchmark. However, similar data have
not yet been published following the introduction of the new 1999-00 base. In the
absence of published data, we have assumed that the percentage revision of 1999-00
11
reflected a drift in the annual estimates and distributed this discrepancy back to 1993-94
in a linear fashion. We continue to measure output in 1993-94 prices. The output data of
1993-94 and earlier years are assumed to be unchanged.10
Capital Stock Estimates. Estimates of the capital stock by industry are available
back to 1950. However, these are dependent on the underlying measures of investment
by industry, and there is little direct information on capital service lives. The CSO
compiles two separate estimates of capital investment. First, aggregate investment by
asset type is based largely on a commodity-flow method. Second, investment by industry
is compiled from establishment surveys, which do not have asset detail. The two
estimates have differed substantially in some years. We have used the industry-based
estimates because we need estimates of the capital stock by broad industry groups.
The annual estimates of investment are subject to similar uncertainties between
benchmark years as those discussed above with regarding output data. Again, the
problems are most evident in the published revisions at the time a new base year is
adopted. The 1993-94 benchmark revisions increased total investment of all industries
by a relatively modest 9 percent.11 Somewhat surprisingly, the changes associated with
the shift to the 1999-00 base are much more substantial -- despite the passage of just 5
years since the prior benchmark. Total industry fixed investment in 1999-00 has been
increased by 33 percent, with revisions for agriculture, industry and services of 57, 17,
and 46 percent respectively.12
The recent investment revisions are sufficiently large to have a major effect on
estimates of growth in capital stocks since 1993-94. Since official capital stock revisions
are not yet available, we have created new estimates for the major economic sectors, and
for manufacturing, for the period of 1993-94 to 2004-05. As with output, we have phased
in the investment revisions beginning in 1993-94. For the capital stocks, we created 10 This procedure closely follows the description by the CSO for its revisions of the historical data after the 1993-94 revisions. 11 At the sector level, the percentage adjustments were -6 percent for agriculture, 18 percent for Industry, and 4 percent for services (Central Statistical Office, 1999, pp. 39-40). 12 CSO (2006), table 30, p. 53. The revisions to the commodity-flow estimates were much smaller, but the methodology was changed to bring the industry estimates into line with those based on the commodity flow method.
12
approximate measures using a fixed geometric rate of depreciation. These approximate
measures were then recomputed for the period after 1993-94, using both the old and the
revised estimates of investment. The percent adjustment for each year was applied to the
corresponding official series to obtain our final revised capital stock series. For 2004-05,
the last year of published data, our methodology implies that the revisions increased the
overall capital stock by 15 percent, with even larger increases for agriculture and services.
Land Input Estimates. Our growth accounts include land as well as capital and
labor as factor inputs to produce agriculture. An estimate of the volume of land used in
agricultural production is available annually (Directorate of Economics and Statistics,
2005). However, there are no available estimates of current market value of the land that
would enable us to construct measures of the annual flow of capital services. We use an
estimate of total cropped land that adjusts for irrigated lands, sown more than once per
year.
Employment. Difficulties also arise in the effort to construct reliable annual
estimates of employment, and thus labor productivity. The censuses of 1971, 1981, and
1991 are believed to have produced solid estimates of the overall population, but they
grossly underestimated the worker-population ratio (WPR) and thus the size of the total
workforce. Visaria (2002) discusses these problems and suggests the need for corrections
on the order of 26 (1971), 15 (1981) and 12 (1991) percent to the reported figures.13 In
contrast, the quinquennial surveys appear to yield consistent estimates of WPRs, but to
underestimate the total population. Thus, estimates of India’s labor force are typically
generated by combining the survey-based estimates of the WPR for four component
groups (rural men, rural women, urban men and urban women) with estimates of the
corresponding populations, obtained from interpolating the census data. As a result,
reliable estimates of the total workforce are limited to the years covered by the six
quinquennial household surveys that were conducted over the period of 1972-73 to 1999-
13 Provisional estimates of the WPRs are available for the 2001 census. The values appear to be much closer to the 1999-00 quinquennial survey than in past censuses.
13

2000. Annual estimates for the aggregate economy can only be obtained by
interpolations and extrapolations of the results from those surveys.14
The NSSO surveys incorporate several distinct measures of the economic
activities of the population. These are based on the prior year (usual status), the prior
week (current weekly status) and each day of the reference week (daily status). They also
distinguish between the principle activity status (plurality of time) and subsidiary status.
Most researchers have relied on a count of persons with employment in usual status
(either principle or subsidiary). However, unlike the national accounts their estimates are
based on a count of persons, not a count of jobs. Visaria (2002) used estimates of
worker participation rates from the quinquennial surveys and interpolated estimates of the
populations of rural and urban males and females to produce estimates of the workforce.
Sivasubramonian (2004) interpolated those estimates to obtain annual data for the
aggregate economy.
We have updated the data of Visaria and Sivasubramonian using slightly different
estimates of the WPRs by gender and sector from the NSSO surveys, and extended the
estimates through 2004. We also used information from the surveys to allocate
employment among the sectors: agriculture, industry (and manufacturing), and services.
The calculations are shown in appendix table 1. The resulting estimates of employment
apply to the seven years covered by surveys from 1973 to 2004. We combined those
observations with estimates from the 1961 Census, and interpolated the data to obtain
annual measures of employment by sector for the period from 1960-61 to 2004-05.15
These employment surveys also provide information about the highest level of
educational attainment for individuals in the workforce. These measures can be used to
adjust the workforce for improvements in quality over time. Thus, for constructing the
growth accounts, we computed average years of schooling for workers over age 15 in the
14 A recent evaluation of the potential usefulness of the smaller annual NSO surveys, which were undertaken in other years, is provided by Sundaram and Tendulkar (2005a). They concluded that the WPRs are not sufficiently comparable with those of the quinquennial surveys. Bhalla and Das (2006) reach a contrary conclusion. 15 The differences with the aggregate estimates of Sivasubramonian are small. In addition, the 60th round, conducted January – June, 2004, did not extend over a complete year; but when we compared the usual status WPRs for corresponding sub-rounds of the 55th round, we found no evidence of seasonality. We opted to use the estimates from the 60th round until those from the 61st (a quinquennial round) become available.
14
three sectors of agriculture, industry, and services. We assumed a 7 percent return for
each year of schooling in constructing an index of labor quality as in equation (5).16
Estimates of earnings are also available for four micro data sets that cover the 38th, 50th,
55th, and 60th rounds that enable us to compute estimates of the returns to education over
the 1983-2004 period. The analysis of the gains in educational attainment and their
relationship to earnings are discussed more fully in a later section.
Factor Incomes. The distribution of income payments between capital and labor
is an important input into growth accounts because income shares, under conditions of
competitive markets, can be used to measure the contributions of each factor without the
need to rely on a specific functional form for the aggregate production function.
However, such estimates are problematic for India (and most developing countries)
because of the dominant role of the self-employed in total employment. Their earnings,
which are labeled as mixed income in the national accounts, reflect a combination of
income from capital and their own labor. In industrial countries, where the income of the
self-employed is a small proportion of the total, it is common to impute a wage equal to
that of their employees or a return on capital equal to that of the corporate sector.
However, in the case of India, mixed income accounted for 45 percent of NDP in 2002-
03, and 79 percent of the income of the unorganized sector, which is a slowly declining
share of the total economy (CSO, 2005, p. xlv). The dominant role of mixed income
raises strong doubts about the validity of the imputation technique for such a large
income component.17
We have used fixed factor shares in our analysis. That implies a more restrictive
range of production functions, but the analysis of industrial countries -- where
information on factor income shares are available -- suggests little variation in share
weights over time. We have also assumed constant returns to scale in all three sectors --
any such gains are allocated to the TFP residual. For agriculture, our assumed shares are 16 As discussed later, returns to schooling in India seem comparable to international experience, and the assumption of a 7 percent return is consistent with our estimates for other countries (Bosworth and Collins, 2003). 17 Sivasubramonian (2004) allocated mixed income between labor and capital on the basis of the distribution of income in the private organized sector. The result is a labor share that declines from 55-60 percent of GDP in the 1960s to 45-50 percent by the late 1990s.
15
0.5, 0.25, and 0.25 for labor, capital and land respectively.18 For industry and services,
we used a simple capital share of 0.4. For the aggregate economy, we combined the
factor shares of individual sectors, weighted by their share of total nominal nonresidential
GDP. The share of agriculture, for example, declines from 52 percent of the total in
1960-61 to 23 percent in 2004-05. We also conducted some sensitivity analysis using
different values for the factor shares. However, in the case of India, choice of specific
shares has little impact on the analysis because, in general, there have been relatively
small differences in the growth rates for the labor and capital inputs. Thus, estimates of
TFP are only marginally affected.
India’s Growth Accounts: Results and Discussion
In this section, we present our updated growth accounts -- first for the total
economy and then by major sector. The results reflect many of the now standard themes
in the literature on India’s economic development. However, some new findings emerge
as well. Thus, drawing implications from our results, we build on the existing literature
to discuss some of the key issues for India’s growth experience and prospects for the
future. The basic growth accounts are provided for the aggregate economy in table 3 and
by sector in table 4, and we refer to these data throughout the discussion.
Aggregate Growth
We begin by looking at growth performance over the relatively long periods
1960-80 versus 1980-2004 (top panel of table 3). This split reflects the widespread view
that the performance of the Indian economy changed significantly around 1980.
(However, as discussed above, there is an on-going debate about the role of economic
reforms and the relative importance of changes undertaken during the 1980s versus those
undertaken after the 1991 economic crisis.)
18 Evenson and others (1999, p. 40). The values are an average of their results for 1967, 1977, and 1987. They included a weight for fertilizer; but because our data are based on valued added, we scaled up the estimates for the other inputs. A similar procedure was used to compute agricultural TFP in Bhattarai and Narayanmoorthy (2003).
16
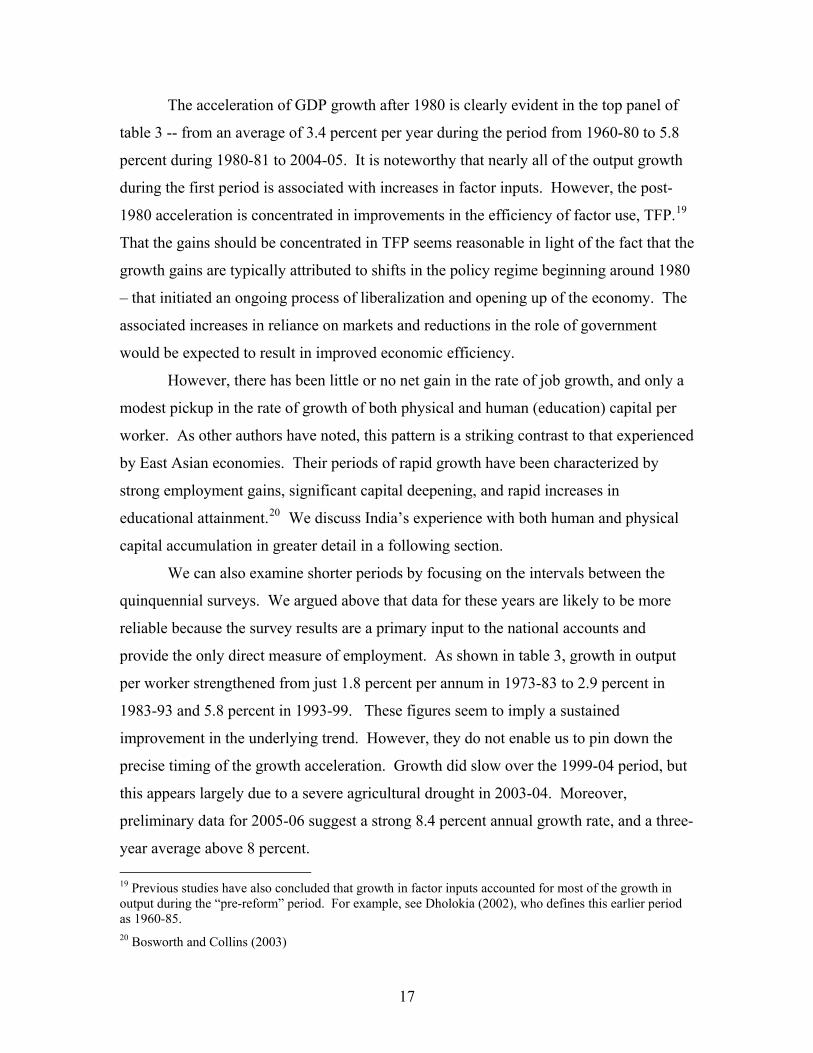
The acceleration of GDP growth after 1980 is clearly evident in the top panel of
table 3 -- from an average of 3.4 percent per year during the period from 1960-80 to 5.8
percent during 1980-81 to 2004-05. It is noteworthy that nearly all of the output growth
during the first period is associated with increases in factor inputs. However, the post-
1980 acceleration is concentrated in improvements in the efficiency of factor use, TFP.19
That the gains should be concentrated in TFP seems reasonable in light of the fact that the
growth gains are typically attributed to shifts in the policy regime beginning around 1980
– that initiated an ongoing process of liberalization and opening up of the economy. The
associated increases in reliance on markets and reductions in the role of government
would be expected to result in improved economic efficiency.
However, there has been little or no net gain in the rate of job growth, and only a
modest pickup in the rate of growth of both physical and human (education) capital per
worker. As other authors have noted, this pattern is a striking contrast to that experienced
by East Asian economies. Their periods of rapid growth have been characterized by
strong employment gains, significant capital deepening, and rapid increases in
educational attainment.20 We discuss India’s experience with both human and physical
capital accumulation in greater detail in a following section.
We can also examine shorter periods by focusing on the intervals between the
quinquennial surveys. We argued above that data for these years are likely to be more
reliable because the survey results are a primary input to the national accounts and
provide the only direct measure of employment. As shown in table 3, growth in output
per worker strengthened from just 1.8 percent per annum in 1973-83 to 2.9 percent in
1983-93 and 5.8 percent in 1993-99. These figures seem to imply a sustained
improvement in the underlying trend. However, they do not enable us to pin down the
precise timing of the growth acceleration. Growth did slow over the 1999-04 period, but
this appears largely due to a severe agricultural drought in 2003-04. Moreover,
preliminary data for 2005-06 suggest a strong 8.4 percent annual growth rate, and a three-
year average above 8 percent. 19 Previous studies have also concluded that growth in factor inputs accounted for most of the growth in output during the “pre-reform” period. For example, see Dholokia (2002), who defines this earlier period as 1960-85. 20 Bosworth and Collins (2003)
17

As discussed above, our measures of physical capital accumulation reflect the
significant upward revisions to investment in the 1999-2000 benchmark. We have
phased these in to our capital stock estimates beginning in 1993-94. The resulting
contribution of increased capital per worker during 1993-99 of 2.4 percent per annum is
similar to levels observed during East Asia’s rapid growth periods. However, India’s
capital deepening appears not to have kept pace with employment growth after 1999.
Agriculture
The growth accounts for the major sectors are shown in table 4. The first panel
summarizes the growth performance of the agricultural sector. The contrast between the
increase in labor productivity during 1960-80 (growth of just 0.1 percent per annum)
versus 1980-2004 (1.8 percent per annum) highlights the role of the green revolution. In
fact, the new technology began to be implemented in the early to mid-1970s. Our
decomposition shows TFP growth jumping from -0.2 percent per year during 1960-73 to
0.9 percent per year during 1973-83, and to 1.2 percent during 1983-99. This estimated
acceleration in TFP growth is consistent with a number of recent studies that focused on
agriculture.21 It also is coincident with other changes that expanded the role of private
decision-makers. There has been some concern that the rate of improvement in
agriculture has begun to moderate, possibly suggesting lower returns to the government’s
R&D and extension service expenditures on the sector. However, our results do not
suggest such a pattern -- except for the most recent five year period which includes the
drought. There is still considerable margin, judged by the performance in comparator
countries for improvements in agricultural yields.
One surprise is that agricultural employment continues to grow. The experience
with similar stages of development in other countries has been that employment within
agriculture tends to decline as underemployed workers are drawn out of agriculture into
industry and services. In this context, India’s experience is particularly notable because,
as is well known, a relatively large share of India’s employment remains in agriculture.
21 See, for example, Coelli and Rao (2003), Everson and others (1999), Foster and Rosenzweig (2004) and Janaiah and others (2005).
18
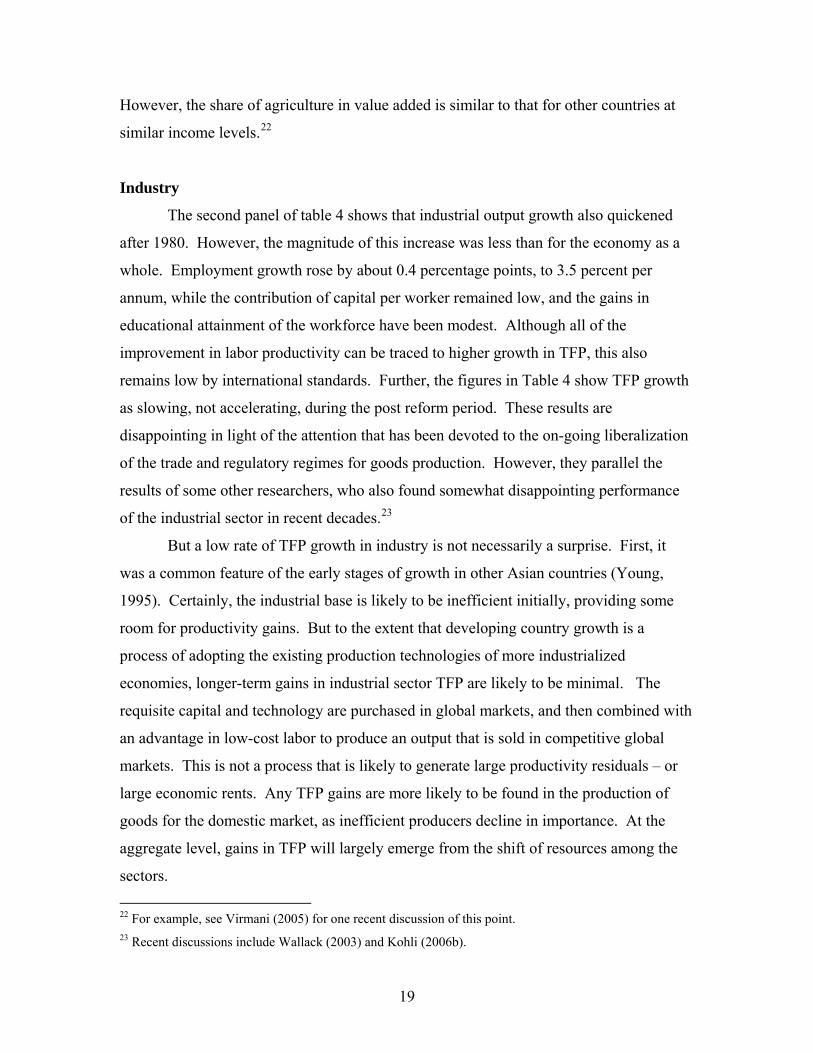
However, the share of agriculture in value added is similar to that for other countries at
similar income levels.22
Industry
The second panel of table 4 shows that industrial output growth also quickened
after 1980. However, the magnitude of this increase was less than for the economy as a
whole. Employment growth rose by about 0.4 percentage points, to 3.5 percent per
annum, while the contribution of capital per worker remained low, and the gains in
educational attainment of the workforce have been modest. Although all of the
improvement in labor productivity can be traced to higher growth in TFP, this also
remains low by international standards. Further, the figures in Table 4 show TFP growth
as slowing, not accelerating, during the post reform period. These results are
disappointing in light of the attention that has been devoted to the on-going liberalization
of the trade and regulatory regimes for goods production. However, they parallel the
results of some other researchers, who also found somewhat disappointing performance
of the industrial sector in recent decades.23
But a low rate of TFP growth in industry is not necessarily a surprise. First, it
was a common feature of the early stages of growth in other Asian countries (Young,
1995). Certainly, the industrial base is likely to be inefficient initially, providing some
room for productivity gains. But to the extent that developing country growth is a
process of adopting the existing production technologies of more industrialized
economies, longer-term gains in industrial sector TFP are likely to be minimal. The
requisite capital and technology are purchased in global markets, and then combined with
an advantage in low-cost labor to produce an output that is sold in competitive global
markets. This is not a process that is likely to generate large productivity residuals – or
large economic rents. Any TFP gains are more likely to be found in the production of
goods for the domestic market, as inefficient producers decline in importance. At the
aggregate level, gains in TFP will largely emerge from the shift of resources among the
sectors. 22 For example, see Virmani (2005) for one recent discussion of this point. 23 Recent discussions include Wallack (2003) and Kohli (2006b).
19
In any case, there remains considerable scope for growth of India’s industrial
sector. In particular, India’s employment share in industry remains surprisingly low
given its development level. Raising living standards will require expansion of relatively
labor-intensive activities, so as to productively employ the large pool of low-skilled
workers who are currently under-employed in agriculture.24 At its current stage of
development, India’s priority isto generate employment in industry. Less concern need
be devoted to increases in sectoral TFP.
Because much of the discussion of India’s economic growth has focused on
manufacturing, we extracted it from the rest of the industrial sector and compiled a
separate set of accounts. Our data include both the registered and unregistered portions
of manufacturing.25 Together they account for roughly half of the industrial sector, but
only about 15 percent of overall GDP. As shown in the third panel of table 4, the
general pattern of growth for manufacturing is very similar to that for total industry.
Like industry, manufacturing shows a sharp acceleration of growth after 1983. The
investment boom of the mid-1990s and the subsequent collapse are also evident in the
large change in the capital contribution before and after 1999-00.
Manufacturing experienced the same slowing of TFP growth after 1993 that was
reported for industry as a whole, but the improvement in the last 5 years is more
pronounced. The early and mid-1990s were marked by major reductions in industrial
tariffs that intensified the competitive pressures on domestic manufacturing and mining.
Thus, we would expect some initial reduction in TFP, but a steady pickup of growth as
the old capital depreciates and new technologies are adopted by an increasing proportion
of the industry. The cycle appears to have been amplified by a significant buildup of
excess capacity in the mid 1990s, leading to a sharp downturn in both output and capital
accumulation at the end of the decade. That excess capacity has been largely eliminated
in recent years.
It is notable that employment growth in manufacturing has been consistently
slower than for industry overall, giving rise to somewhat faster rates of growth of both 24 Many authors have made this point, including Banga (2005), Virmani (2005), and Krueger (2005). In this context, Foster and Rosenzweig (2004) highlight the role of increased non-agricultural activity in rural areas for raising rural incomes. 25 The registered portion has increased from 58 percent of the total in 1980 to about 65 percent today.
20

labor productivity and TFP. However, the measure of TFP in manufacturing is sensitive
to the precise factor share that is used to combine the inputs. This is the one case in
which the growth rates of capital and labor differ by a significant amount in some periods.
The general pattern of our results for the post-1993 period is comparable to the
results reported in Goldar (2004). However his study used data from the Annual Survey
of Manufacturing (ASI), and it related only to the registered portion of manufacturing.
Goldar also found that TFP growth slowed somewhat after 1991, but the analysis could
only cover the years up to 2001-02, the last year for which ASI data are available.
Services
The bottom panel of table 4 summarizes the growth performance of the services
sector. As frequently noted, service-producing industries have been the primary source
of India’s growth surge, consistently outperforming industry/manufacturing.26 Indeed,
since 1980, output growth has exceeded the pre-1980 growth rate by 2.7 percent per year
-- and maintained an average annual growth of 7½ percent. Furthermore, employment
growth in the sector has averaged 3.6 percent per year, roughly comparable to that for
industry. However, increases in capital per worker have made an even smaller
contribution to growth for services than for industry. The result is that gains in output
per worker are dominated by high rates of improvement in TFP, averaging nearly three
percent annually. We also note that this sector has registered the largest improvements in
the educational attainment of its workforce.
Another perspective on the role of TFP in India’s post-1980 growth is provided
by figure 1, which displays annual TFP trends by sector and for the total economy. The
dominance of the service-producing industries and the relatively weak performance of the
goods producers are both very evident. The chart also shows that the growth of TFP in
services has been remarkable consistent over the past quarter century and shows few
signs of abating.
26 Banga (2005) provides a recent overview of the issues associated with India’s rapid growth in services. He highlights explanations for and implications of the so-called “job-less growth” in India’s service sector whereby increases in the share of GDP have not been associated with equivalent increases in the share of employment. Banga and Goldar (2004) argue that services are increasingly important as an input to Indian manufacturing. See also Gordon and Gupta (2004). Srinivasan (2005) focuses specifically on the development of India’s IT sector and its implications for growth.
21
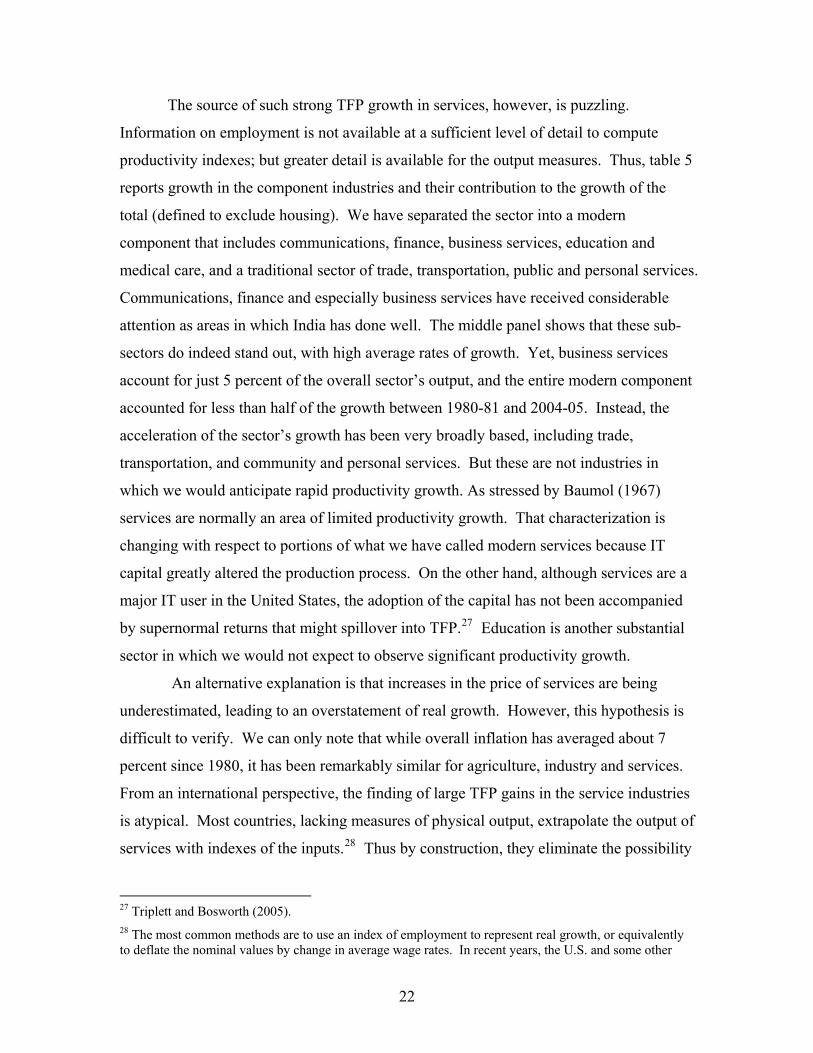
The source of such strong TFP growth in services, however, is puzzling.
Information on employment is not available at a sufficient level of detail to compute
productivity indexes; but greater detail is available for the output measures. Thus, table 5
reports growth in the component industries and their contribution to the growth of the
total (defined to exclude housing). We have separated the sector into a modern
component that includes communications, finance, business services, education and
medical care, and a traditional sector of trade, transportation, public and personal services.
Communications, finance and especially business services have received considerable
attention as areas in which India has done well. The middle panel shows that these sub-
sectors do indeed stand out, with high average rates of growth. Yet, business services
account for just 5 percent of the overall sector’s output, and the entire modern component
accounted for less than half of the growth between 1980-81 and 2004-05. Instead, the
acceleration of the sector’s growth has been very broadly based, including trade,
transportation, and community and personal services. But these are not industries in
which we would anticipate rapid productivity growth. As stressed by Baumol (1967)
services are normally an area of limited productivity growth. That characterization is
changing with respect to portions of what we have called modern services because IT
capital greatly altered the production process. On the other hand, although services are a
major IT user in the United States, the adoption of the capital has not been accompanied
by supernormal returns that might spillover into TFP.27 Education is another substantial
sector in which we would not expect to observe significant productivity growth.
An alternative explanation is that increases in the price of services are being
underestimated, leading to an overstatement of real growth. However, this hypothesis is
difficult to verify. We can only note that while overall inflation has averaged about 7
percent since 1980, it has been remarkably similar for agriculture, industry and services.
From an international perspective, the finding of large TFP gains in the service industries
is atypical. Most countries, lacking measures of physical output, extrapolate the output of
services with indexes of the inputs.28 Thus by construction, they eliminate the possibility
27 Triplett and Bosworth (2005). 28 The most common methods are to use an index of employment to represent real growth, or equivalently to deflate the nominal values by change in average wage rates. In recent years, the U.S. and some other
22
of reported productivity gains. This does not appear to be a common practice in the
Indian national accounts. While up-to-date information on the methods used to adjust for
price inflation is limited, it appears that services output is often adjusted only for general
(CPI) inflation (CSO, 1989). In the case of trade, margins are assumed to be constant in
real value and change in line with total sales. Because so much of services lies outside
the organized sector, the Indian statistical agencies have little or no direct information on
the output of services. To a large extent, they are forced to rely on extrapolation of the
base year values.
In summary, the growth of the service sector has been sustained and very broadly
based. However, the extent that it is concentrated in TFP and not employment does give
us pause. In addition, the lack of employment data at a more detailed level prevents us
from exploring the source of the TFP gains in greater detail.
Reallocation Effects
A potentially important source of growth comes from the reallocation of resources
from less productive to more productive activities. Traditionally, this has been associated
with a shift of labor from agriculture, where there is initially substantial under-
employment, to industry and then services. Output per worker in industry and services is
4 to 5 times that in agriculture. Thus, employment shifts from agriculture to either of
these sectors should contribute to substantial gains in productivity and average incomes.
However, as already discussed, the decline in agriculture as a share of Indian value added
has been associated with relatively little reallocation of employment.
Table 6 provides an estimate of the contribution of factor reallocation to India’s
growth. The first column shows growth in total output per worker for various periods.
The second column shows the combined contribution of growth in each of the three
sectors, weighted by the sectoral shares. The data for total and sector growth are taken
directly from tables 3 and 4. Thus, the reallocation effect is simply the difference
between the first and second columns, as shown in column 3. Post-1980, our calculations
show that this reallocation contributed roughly one percent per year to output growth.
OECD countries have moved away from this input-based valuation by developing explicit price indexes for services. However, the method is still used for government and education.
23

Our findings also suggest that this component has become increasingly important in
recent years.29
The Role of Capital Accumulation: Additional Perspectives
In recent years, controversy has surrounded the roles of physical capital and
education (human capital) in the growth process. Young (1995) has shown the
dominance of physical capital accumulation in the growth of the East Asian economies.
On the other hand, Klenow and Rodriguez-Clare (1997) argue that physical capital
accumulation is largely induced by increases in TFP, a phenomenon that leads to an
overstatement of the contribution of physical capital as an exogenous source of growth.
Easterly and Levine (2001) argue that only a small percentage of the variation in growth
across countries could be attributed to capital accumulation. Baier and others (2006)
argue the opposite. Our own reading is that both capital accumulation and gains in TFP
are important components of the growth process (Bosworth and Collins, 2003), although
we agree that the precise magnitude of the role varies across countries. Capital
accumulation is a necessary part of the process -- regardless of whether it is an exogenous
or induced factor. Furthermore, the investment underlying that capital accumulation
must be financed through national or foreign saving.
The role of education has been equally controversial. Many studies, including our
own, have relied on the strong microeconomic association between education and earning
to adjust the workforce for improvements in educational attainment.30 Again, rapid gains
in educational attainment have been a particular feature of many of the fast-growing East
Asian economies. Easterly (2001) and Pritchett (2001) question the relationship between
education and growth at the aggregate level.
29 See Bosworth (2005) for a similar calculation applied to Thailand. Using a different methodology, Wallock (2003) also concludes that much of India’s post 1980s growth is attributable to resource movements. 30 See Bosworth and Collins (2003) for a discussion of the differing perspectives.
24
The growth accounts presented above imply that both human and physical capital
have made relatively modest contributions to India’s growth performance by international
standards. We examine each of these areas in more detail below. Our examination of
human capital first reviews the evolution of educational attainment. Using individual
level data for selected years from 1983 to 2004, we then present new estimates of the
extent to which Indian labor markets reward workers for various levels of additional
schooling. This issue is of particular relevance, because increases in educational
attainment have evolved somewhat differently in India than for other rapidly growing
Asian economies – beginning with the push at tertiary levels, educating large numbers of
engineers and scientists, and only since 1986 emphasizing primary education more
broadly. Finally, the section turns to a discussion of investment and saving in India.
While India’s national saving rate has been rising and compares favorably to that for low
income countries, it remains below that for high growth Asian economies. Is saving
likely to act as a constraint for India’s growth? We use the accounting identity linking
investment to saving to frame our discussion, and explore the evolution over time as well
as across sectors. Once again, a variety of issues arise, regarding the data available for
measurement of both saving and investment.
The Contribution of Education
India is often cited as having a large cadre of well-educated university graduates.
However, overall levels of educational attainment are low compared to the East Asian
countries at similar stages of development.31 An international comparison suggest that
India has only now reached an average level of schooling comparable to that achieved in
other Asian countries a quarter century earlier (table 7). Today, most East Asian
countries, including China, maintain a substantial lead over India in terms of the average-
years-of-schooling. Using results from the household surveys, table 8 provides a more
detailed perspective on the changes in educational attainment of workers since 1960. The
first row shows that there has been a substantial reduction in the proportion of the
workforce that is illiterate -- from 72 per cent in the 1961 census. But illiteracy remains
31 Primary education did not become a national policy priority in India until 1986. The national Program of Universal Elementary Education was launched in 2001. (For example, see Wu, Kaul and Sankar (2005).
25
high, at about 40 percent currently. Those who have completed secondary schooling
account for about 14 percent of workers, while an additional 6 percent have a university
degree. Surprisingly, if we limit the analysis to those aged 24-34 in 2004, the proportion
with a secondary education or better only rises from 20 to 25 percent.
Education appears to earn a very good return in India, comparable to that of other
strongly growing countries. We obtained the micro household data files of the 38th (1983),
50th (1993-94), 55th (1999-00), and the 60th (2004) rounds of the NSSO employment
surveys. These are large surveys that provide estimates of the earnings of workers
(regular and laborers) as well as their educational attainment -- measured, as in table 8,
by the highest level completed. Regression estimates of the relationship between
schooling and earning in each of the four surveys are shown in table 9.32 A pattern of
strongly increasing earnings at each level of education is clearly evident. Except for
some evidence of a decline in the return to a secondary education in the 2004 survey, the
magnitudes of the estimated returns are highly stable across time.
We also explored an alternative formulation that replaced the categorical variables
with a single index of years of schooling.33 (In this formulation, we added two years for
those with a technical degree or certificate.) The estimation results imply an average rate
of return that varies between 9.1 and 9.8 percent per year of schooling. For comparison,
Psacharapoulus and Patrinos (2004) report an average return to additional schooling of
about 10 percent both overall and for the sub-group of Asian economies. However, the
returns to schooling in India are not quite as uniform as the log-linear formulation would
imply. Table 10 shows the annual marginal returns for different levels of schooling
implied by the regression results in table 9. Interestingly, the incremental returns to
primary education are significantly lower than the average returns, and there is a large
jump in the return associated with completing the secondary level of schooling (10 or 12
years). The additional return to a university degree was low in the 1980s, but it has been
rising rapidly in the latest surveys. This is consistent with the view that India may have 32 Our results for the 1983 and 1993-94 surveys are very similar to those of Duraisamy (2000), who used the same two data sets. Dutta (2004) found somewhat lower returns. However, her analysis included other determinants that are likely to be correlated with educational attainment. 33Most states have adopted a system of five years for primary, three for middle school, and two each for secondary and higher secondary. We have treated a university degree a equivalent to three years,and added an additional two years of schooling for those with a technical degree.
26

over-invested in higher education in earlier decades for fields such as engineering,
leading to the large diaspora of Indian engineers abroad. The rising return in recent years
is reflective of the changed economic situation, and the potential emergence of a scarcity
of highly-skilled workers.
These deviations in the return to schooling from a simple log-linear relationship
contrast sharply with results for some other countries.34 Psacharapoulus and Patrinos
(2004) report a general global pattern in which the returns are highest for elementary
education and decline slightly for higher levels of educational attainment. Those findings
have been used to argue for shifting public resources toward primary education and
reduction of illiteracy. However, our results would suggest that greater effort should be
made to ensure that students complete the secondary education level. In part, the pattern
of returns we find can be traced to strong gender effects in the relationship between
education and earnings. Women are particularly disadvantaged at low levels of education,
but do gain correspondingly more from secondary and tertiary education. In our analysis,
the jump in incremental returns upon completion of the secondary level is particularly
pronounced for women.
The finding of a relatively low return to an elementary education is consistent
with several recent articles that have been critical of the quality of the primary education
system.35 There has also been a large move from public to private schools; but that may
compound the problems as the poor are increasingly isolated and left behind in the
process. Kapur and Mehta (2004) offer an even more critical perspective on the system
of higher education. They argue that a crisis of governance in the public institutions is
forcing students into private universities and to enroll abroad. Such criticisms of India’s
education system stand in sharp contrast to a generally favorable foreign perspective on
the Indian education system, perhaps because so many of the highly-educated have
emigrated. They also raise challenges for a growth strategy that aims to build on
economic activities that have a large skill component.
34 The analysis of similar surveys for Thailand found no significant deviation from a log linear return of 10 percent (Bosworth, 2005). Also, our own analysis of U.S. data suggests a log-linear relationship is an adequate summary of the relationship between earnings and education. 35 Kochar (2002), and Kremer and others (2005). Psacharapoulus and Patrinos (2004) also report a surprisingly low return to primary education of 3 percent,
27
Saving and Investment
The small contribution of capital per worker to economic growth that is evident in
the growth accounts highlights important issues about the adequacy of Indian saving and
capital accumulation for sustaining high growth in the future. However, several studies
have pointed to strongly rising rates of saving and investment shown in the national
accounts to argue that capital accumulation should not be a major constraint on future
growth.36 At the same time, the magnitude of recent revisions to the national accounts
also raises questions about the reliability of the saving and investment data and the extent
to which they reflect the underlying reality (Shetty, 2006). In this section, we address
these issues, beginning once again with a discussion of the data available for analysis.
In the Indian national accounts, total saving is the sum of three separately-
compiled components: (1) public sector saving, (2) corporate saving and (3) household
(including non-corporate enterprises) saving.
(7) . hcpubT SSSS ++=
The CSO can construct reasonably good estimates of public sector saving from budget
records. Its measure of corporate saving is compiled from a sample of major
corporations’ income and balance sheets, maintained by the Reserve Bank of India.
Household saving is further divided into two independently-estimated components:
physical saving, and net financial saving. Saving in physical assets is simply set equal to
investment of the household sector, which is itself a residual estimate, as explained below.
The estimate of household financial saving is constructed from flow-of-funds measures
of the net addition to total financial assets less the accumulation of the public and
corporate sectors.
The overall national saving rate and its three components are shown as
percentages of GDP for the period 1970-2004 in figure 2a. The overall saving rate has
risen strongly, especially since the mid 1980s. Further, this increase is dominated by
major gains in household saving. Public sector saving actually turned negative in the late
36 See, for example, Mühleisen (1997) and Rodrik and Subramanian (2004b).
28

1990s, but with some recent improvement. Corporate saving (retained earnings) grew
substantially up to 1995, but has since remained in the range of 4-5 percent of GDP.
Thus, the expansion of saving is concentrated in the household sector. Total
household saving has increased from a modest 10 percent of GDP in the early 1970s to
25 percent today. Furthermore, in the 1970s, over two-thirds of household saving was in
physical saving, implying that it was dominated by housing and own-account
construction, much of which never passed through financial institutions. (An unknown
portion represents the investment of unincorporated business that are included as part of
the household sector.) The most impressive growth has been in the category of financial
saving, which increased from about 4 percent of GDP in the early 1970s to 12 percent in
recent years and now represents half of household saving. These funds are available to
finance investment in other sectors.
On the investment side, the CSO constructs two direct measures. The first is an
estimate of total investment derived using the commodity flow method. Under that
method, the total supply of capital goods is estimated from domestic production and
imports and then apportioned among intermediate inputs and the various components of
final demand. Of necessity, many of the demand components and some of the elements
of domestic production must be estimated using various fixed ratios. Investments of the
public sector and of private corporations are obtained from the same sources used to
estimate their saving. Household investment (physical saving) is derived in turn by
subtracting public and corporate investment from the total.
A second direct estimate of capital accumulation is built up from individual
industries, based largely on the expenditure approach. Measures of both fixed investment
and inventory accumulation are constructed from a variety of sources, including surveys,
public budget documents, and annual reports of public and private enterprises. Given the
importance of the unorganized sector, this latter set of estimates is particularly tenuous --
but they provide the only information on the distribution of investment at the industry
level.
Finally, by combining the estimate of national saving with the current account
balance of the balance of payments (CA), the CSO can derive still a third indirect
measure of total investment:
29

(8) . CASI TT −=
Thus, the CSO actually has three alternative measures of aggregate capital accumulation
that are largely independent of one another. Prior to the last revision (1999-00 base), all
three measures were published with their associated discrepancies. Since the CSO views
the valuation from the saving side as the most reliable, this is the one that is emphasized
in the aggregate table. The various measures of investment and saving are shown for the
period of 1960 to 2004 in appendix table 2.
With the introduction of the 1999-00 base, the CSO made several changes to its
calculation and presentation of the alternative measures of capital formation. First, the
definition of capital accumulation has been changed to include an estimate of net
purchases of valuables.37 By 2004-05, these purchases represented 1.4 percent of GNI.
However, no comparable change was made to include valuables on the saving side.
Since the saving-side measure of capital accumulation has been the larger in recent years,
this definitional change had the effect of sharply reducing the magnitude of the reported
discrepancy between the saving and the commodity-flow measures of capital
accumulation. However, we have retained the old treatment and excluded valuables from
our measure of productive capital.
Second, the CSO elected to eliminate the second discrepancy between the
commodity-flow and industry-based estimates by distributing the discrepancy across the
industry groups in proportion to their estimated levels of investment. The result was a
dramatic upward adjustment of the industry-based investment of 30 percent in 1999-00.38
A previous pattern of a declining rate of investment – particularly within industry-- was
converted into a strongly rising trend. We integrated the new 1999-00 and subsequent
estimates of both saving and investment into the historical data by phasing the changes in
between 1993-94 and 1999-00, the same procedure that was used to link in the revisions
to the other GDP data.
37 The accounts also adopted the suggestion of the 1993 SNA to include purchases of computer software, but the accounts do not include the development of own-account software and databases as investment. 38 The revision to the commodity-flow estimate was a more modest 12 percent.
30
The composition of investment by institutional sector is shown in figure 2b. It is
readily evident that the household sector has become an important source of finance for
both private corporations and the public sector. The investment of both sectors is much
larger than their own saving. The growth of investment, however, is concentrated in
households and corporations, while public sector investment has been a consistently
declining share of GDP. The increase in the household sector is largely due to the
growing importance of private noncorporate enterprises. While there was a substantial
upward revaluation of real estate investment (concentrated in the household sector) in the
1999-00 revisions, the growth in household investment is substantially larger.39
Additional information on the role of the public sector is given in table 11. First,
the historically low rate of public saving has primarily been due to the large dissaving in
the administrative budget. The shortfall of revenues relative to current outlays first
emerged in the mid-1980s and then grew steadily over the years. After peaking in 2001-
02 at 6.6 percent of GNI, the administrative budget deficit has been cut in half in recent
years. Saving within public enterprises has increased over the past decade, so that total
public sector saving turned positive in 2003-04.
Investment of public enterprises did rise significantly in the 1980s -- a point made
by those who point to demand stimulus as a cause of the acceleration of growth in the
1980s.40 However, enterprise investment was steadily cut back after the surge of the
1980s. Investment in the administrative budget has remained very low in recent years --
between one and two percent of GNI. The low investment within the administrative
budget reflects a longstanding lack of attention to infrastructure needs, particularly road
building. Some other types of infrastructure investment are captured in the industry data
for public utilities, transportation and communications, shown as an addendum to table
11. Again, this type of investment has also remained low as a share of GNI.
Some of the increase in the rate of gross investment that has taken place over the
last quarter century has been offset by a rise in capital consumption allowances as a share
of GDP. During the latest 5-year period (2000-04), net investment has averaged 17 39 As discussed in the section on growth accounts, the national accounts do not currently separate investment of the business services industry from that of real estate investment. That is unfortunate given the interest in the rapidly expanding business services industry. 40 See Srinivasan (2003b) and Buiter and Patel (1992).
31
percent of GDP (appendix table 2). The aggregate capital-output ratio has also been a
stable 2.5 times GDP. These figures suggest that the current rate of capital formation is
sufficient to support a growth rate of about 7 percent per annum.
Is saving constraining India’s growth? To the contrary, we think the evidence
suggests a higher potential growth rate should be quite feasible. First, the private saving
rate appears to be rising over time.41 Second, India should be able to support a
significantly higher rate of foreign saving (current account deficit), particularly if this
were financed by higher rates of FDI. Third, there continues to be substantial room for
improving the saving performance of the public sector.
As an additional reason for believing that current rates of saving are adequate to
support future growth, we note that we can find little evidence of heightened competition
for domestic capital. We constructed a lending rate by averaging the rates of four major
lending institutions, as reported by the Reserve Bank of India (RBI). A real interest rate
was computed on an annual basis using the ex-post realized rate of increase in the
Wholesale Price Index. These data are summarized in table 12. While the real rate
shows considerable fluctuation, there is little evidence of a secular increase. Although
the rate rose in the late 1990s, this appears to have been a transitory response to a sharp
decline in the inflation rate. Furthermore, a real interest rate in the range of 5-7 percent
is not particularly high for a developing country.
Overall, this evidence suggests to us that the low contribution of capital
accumulation to growth has largely been a product of the incentives to undertake
investment, rather than a saving constraint. Hallward-Dreimeir (2005) provides a recent
overview of the literature on business climate and its implications for investment and
private sector activity. Referring to the World Bank’s survey based indicators – “Doing
Business” – she finds that India ranks in the bottom 25 percent of countries. The survey
highlights firms’ concerns, including poor access to electricity, and stringent labor
regulations. The public sector, in particular, has not responded to obvious signs of
insufficient infrastructure capital.
41 Several international studies of saving in developing countries conclude that there is a strong positive association with the level of income. For a discussion see Mühleisen (1997), and Loayza and others (2000). Also, India’s demographic trends support the notion of continued increases in private saving (Higgins and Williamson, 1997).
32
Implications for the Future
India is still a very poor economy, and increasing overall living standards is
clearly the major priority. To achieve this, it is necessary both to raise labor productivity,
and to speed up the pace of job creation for those currently underemployed in rural
agriculture. Our analysis in prior sections points to three implications for achieving this
critical objective.
First India must broaden the base of the economic expansion beyond the modern
service sector, which, by itself, can not provide the requisite number of job opportunities.
This implies a much more rapid expansion of the manufacturing sector, which will
require strengthening India’s infrastructure, raising private sector investment and
adopting a more aggressive approach to expanding India’s export markets. A second
implication of our work is good news -- India has strong prospects for increasing the
saving necessary to finance the additional capital accumulation. Third, India must
accelerate the pace of improvements in the educational attainment of the population: This
requires a greater emphasis on increasing primary and secondary schooling, as well as
expanding its already substantial pool of highly educated labor. Finally, the lack of
reliable annual statistics on employment is a major limitation on efforts to evaluate
current economic performance. Thus, we believe that India needs to undertake an
ongoing household survey that would provide annual time-consistent measures of labor-
market performance. While we are certainly not the first to advocate these actions, we
believe our analysis sheds additional light on the reasons for their importance.
Over the past decade, India’s economic growth has been concentrated in the
service sector. On the one hand, there are many positive dimensions of this development.
India’s rapid in-roads into global markets for products such as business services have
increased domestic exposure to the world marketplace in areas with considerable room
for expansion. As we have seen, the services growth is not limited to a few selected IT
related activities, but appears to be considerably broader than often recognized. And
33

recent studies have found that growth in services has generated increased demand for
industrial products as well.42
While India’s very rapid recent growth in services is well known, some other
unusual dimensions of its growth pattern have received less attention. Kochhar and
others (2006) compares India’s development pattern to that for a large cross section of
economies, controlling for both per capita income levels and country size. They find that,
in 1981, India was an outlier in terms of the relatively low share of services in both GDP
and employment. While the share devoted to manufacturing did not stand out at that time,
they find that Indian production was concentrated in relatively skill-intensive industries.
Between the early 1980s and 2002, the share of agriculture in India’s GDP declined,
while the share of services increased. Currently, the Indian economy does stand out for
its relatively low manufactures share of GDP, and the high proportion of employment
remaining in agriculture. The paper also notes that both manufactures and services are
relatively concentrated in skill-intensive output. Virmani (2005) points out that the
manufactures share of GDP was just 15.8 percent in 2003, well below comparator
countries in East Asia.. For instance, manufactures shares ranged from 21 percent in
Vietnam to 39 percent in China.43
This development pattern is not one that offers expanding job opportunities for a
labor force that is dominated by relatively low-skilled workers. Only a rapidly-
expanding manufacturing sector, producing labor-intensive products for both global
markets and the domestic economy, offers the prospect of creating a large number jobs
aligned with the skills of the majority of the Indian workforce.
How can India encourage the development of a private manufacturing sector, as a
companion to the vibrant services industries? In recent years, considerable research has
sought to identify the determinants of private sector growth, with much of the analysis
emphasizing the importance of the investment climate faced by entrepreneurs. An
attractive environment for doing business is now typically seen as having a variety of
dimensions, ranging from access to infrastructure and financial services, to factors such
as the security of property rights and a simple and transparent regulatory system. The 42 See Banga and Goldar (2004) 43 Kochhar and others (2006) also examine the patters of development across India states.
34
World Bank’s Investment Climate and Doing Business Surveys are intended to strengthen
available measures of these and other aspects of the investment climate by including a
number of objective questions as well as some more subjective ones. Both cover a large
number of countries, including India. Many of these indicators have been shown to have
a strong correlation with growth in cross-country studies, and with labor productivity in
micro-economic studies of firm behavior.44
How does India fare in this evaluation of its business climate? There is both good
news and areas for concern. The Business Competitiveness Index for 2004 ranks India
37th out of 101 countries. This relatively favorable assessment largely reflects the pool of
highly skilled scientists, engineers and strong management programs. The main concerns
include regulatory issues and inadequate infrastructure.45 Thus, India ranks a poor 116th
out of 155 countries in the 2005 Doing Business indicators, which focus only on 10
regulatory areas. It does particularly poorly in terms of enforcing contracts (138th),
trading across boarders (130th) dealing with licenses (124th) and employing workers
(116th). However, India ranks 84th in terms of getting credit and a strong 29th for
protecting investors.46
Results from India’s Investment Survey highlight concerns about infrastructure –
especially electricity.47 Respondents noted very high delays in obtaining electrical
connections and large value lost to electric outages. The World Bank report concludes
that India’s power supply difficulties arise largely from problems with transmission and
distribution (T&D). In 2003, the average Indian firm experienced power outages nearly
every other day – more that three times the frequency endured by businesses in Brazil,
and more than seven times that endured in China. The study also reports that output
losses due to outages in India were more than four times those in either China or Brazil.
44 For example, see Hallward-Driemeier (2006). Dollar, Iarossi and Mengistae (2002) find that differences in investment climate across Indian states explain a substantial share of the differences in labor-productivity, using a sample of 1000 manufacturing firms. 45 See Hallward-Driemeier (2006). 46 See http://www.doingbusiness.org/ 47 Summary information for India’s results in the Investment Climate Survey are available at: http://rru.worldbank.org/EnterpriseSurveys/ExploreEconomies/Default.aspx?economyid=89
35
Furthermore, average power tariffs for industrial use in India are relatively high – around
$0.08 per kwh compared with $0.05 elsewhere in Southesast Asia.48
Virmani (2005) notes that there are two fundamental problems that must be
addressed. First, policy and regulatory risks are still too high, despite the passage of the
Electricity Act of 2003, discouraging the entry of private producers. Second, the issue of
T&D losses (in reality, utter theft) has not been seriously addressed. Officially reported
T&D losses at the all-India level were 32.5 percent of total availability in 2003-4. Others
have suggested that independent audits would place theselosses closer to 50 percent of
available capacity. Private entry into distribution cannot be sustained unless organized
theft is eliminated and T&D losses brought down to levels considered normal across the
World (i.e. around 8%).
Major concerns have also been raised about logistical difficulties in India. In
particular, road networks are relatively poor, limiting internal transport, especially in
some poorer regions. Detailing both infrastructure problems and operational weaknesses,
a 2002 World Bank study concluded that “poor transport has become a major drag on
economic growth.”49 The study notes that China had roughly five times the kilometers of
four to six-lane expressways. Most Indian national highways are only one or two lanes,
and heavy congestion on both national and state roads implies that trucks and buses can
travel at, on average, just half the expected speed. The 2004 report notes that India’s
major economic areas are not linked by an inter-state highway system. In contrast, China
is enjoying the benefits of having undertaken an extensive investment in its highway
system over the past decade.50 We also note the dramatic effect that building a system of
interstate highways had for the United States, as suggestive of the benefits of such a
program for India. Although the government has announced a major program to upgrade
and extend the highway system, implementation has been constrained by a lack of
funding..
On the more positive front, over 70 percent of respondents in the Investment
Survey expressed confidence in India’s judiciary system, compared with less than 60
48 World Bank (2004). See esp. pp. 35-36. 49 World Bank (2002) p. 7. 50 World Bank (2004), p. 36.
36

percent overall and just 48 percent in South Asia. Furthermore, India has achieve major
gains expanding access to high quality communications services, primarily by relying on
a rapid expansion of the private wireless component.
The discussion above stresses areas in which additional investment is needed to
make India an attractive business location. Our analysis suggests that the saving, required
to finance the investment, does not appear to pose an additional constraint. In this
dimension, we believe that India’s prospects are quite favorable. It is true that the
overall saving rate has not been as impressive as that of the high-growth East Asian
economics. However, India’s private saving rate was comparable to the developing
country average in the mid-1960s, and has grown more rapidly.51 As incomes increase,
experiences elsewhere suggest that India’s private saving would be expected to increase
somewhat further.
Equally important, India has considerable scope for raising foreign saving through
increased FDI. A number of studies have documented that there are strong positive
effects of increased FDI flows for domestic investment. However, to date India has
received little of the very substantial global FDI flows to developing countries. Virmani
(2005) notes that during 1980-2003) FDI flows averaged only 0.3% of India’s GDP,
putting India in the 7th percentile of his sample of 82 medium large countries. Despite
some recent liberalization, India’s ranking remains near the bottom of such indicators.
Estimates of the stock of FDI assets by country constructed by Philip Lane and Gian-
Maria Milesi Ferretti show that as a share of GD India’s FDI stock is less than one fifth
that for China..52
Concerns about the adequacy of national saving are centered on the behavior of
the public sector. As discussed in a prior section, the public saving rate has fallen
dramatically over the past twenty years. In part, this reflects a deteriorating situation
within the public enterprises, requiring substantial subsidies and other transfers from the
central administrative budget. In addition, central administrative budget deficits have
become endemic.
51 For example, see Loayza and Shankar (2000). 52 Lane and Milesi-Ferretti (2006). Their data are available at http://www.ssc.wisc.edu/~cengel/CAConference/WP_External%20Wealth_final.pdf
37
Finally, the assessment of India’s economic performance is made difficult by the
lack of statistical coverage of large portions of the economy. In particular, there is no
consistent information on employment between the quinquennial surveys. At a minimum
India need an annual survey for the intervening years. The quality of the quinquennial
surveys appears to be high, but the development of the sample frame for each survey is a
major undertaking. In addition, by constructing a large portion of the sample frame as a
new undertaking for each survey, the results have suffered from a lack of consistency
over time. We believe that the maintenance and continue use of the sample frame from
the quinquennial survey over the following five years would provide a relatively low cost
means of obtaining time-consistent employment data.
Concluding Remarks
In this paper, we have revisited some of the key issues regarding India’s economic
growth performance and prospects. Our work updates previous studies, and presents
results based on analysis of new data. Our analysis focuses on the periods de-lineated by
the survey benchmark years: 1960, 1973, 1983, 1993, 1999 and 2004 due to concerns
about India’s annual output data. We have argued that researchers should have a
reasonable degree of confidence in the GDP estimates for benchmark years. However,
for non-benchmark years, annual output data are based on interpolation and extrapolation
of the labor input data required to construct output measures for India’s large
unorganized sector. These estimates have been subject to substantial revisions. We
conclude that the lack of reliable annual series make it impossible to pin down the precise
timing of India’s growth acceleration. Although it does seem clear that growth
accelerated after 1983, the precise triggering events and the sustainability of this growth
remain topics of on-going debate.
India’s output growth has doubled from just 3.3 percent per year during our initial
period of 1960-73, to over 6 percent per year during the past decade. In the initial period,
we find that growth can be fully attributed to increases in factor inputs – with nearly two-
thirds accounted for by increased employment, and a third by increases in capital per
38

worker. Growth accelerated to 4.2 percent per year during the second sub-period, 1973-
83. Just over half of the gains are associated with TFP, and the remainder with
employment. The acceleration appears related to the green revolution, with gains
accruing to both increases in agricultural TFP and sectoral reallocation. Labor
productivity declined in both services and industry. There was a further, modest,
acceleration of output growth, to 5 percent per year during 1983-93. This increase can all
be attributed to increased TFP, concentrated in services and industry (especially
manufacturing). However, analysts remain divided on the reasons for the rise in growth
during this period, with the many possible explanations including (unsustainable) fiscal
expansion and response to initial policy reforms.
Output growth surged to 7 per cent per year during 1993-99. Given the somewhat
puzzling decline in employment, there is a particularly large jump in labor productivity –
concentrated in services but evident in all sectors. It is associated with rises in both TFP
and capital deepening. Output moderated somewhat during the most recent period (1999-
2004) with growth slowing in all sectors, in part due to the severe drought. Contributions
from TFP and capital deepening slowed in both services and industry. Notably,
investment failed to keep up with the more rapid employment growth. However, we note
that the two latter periods are quite short. Growth accounting is most appropriate for
relatively long time periods of a decade or more, in which output performance is not
dominated by cyclical shocks.
Considerable attention has been focused on the role of services – especially high-
tech services – as the source of India’s growth. Our growth accounts attribute 1.4
percentage points of the 3.8 percent per annum GDP growth during 1980-2004 to growth
in total services output (versus 0.7 percentage points each to agriculture and industry and
1 percent to reallocation, respectively). However, the very strong gains in service sector
TFP are quite puzzling. One might expect such rapid productivity growth in sub-sectors
such as finance and business services, but these sectors remain small – just 17 percent of
total services output in 2004. In fact, the output growth is quite widely dispersed across
service sub-sectors. But rapid productivity growth seems unlikely in the biggest, which
are trade, transportation and community services. Though difficult to verify, we
hypothesize that output growth in services has been overstated due to an underestimate of
39
services price inflation, particularly in the more traditional sectors. We have more
confidence in the estimates of the growth in employment.
The accounting decomposition finds that the growth contribution from increases
in education has been quite modest. While India can boast a relatively large share of
highly educated workers for its income level, average years of schooling and literacy
rates among its population remain low, and the effort to achieve universal primary
education is quite recent. Not only does India have a long way to go to catch up with
competitors such as China, the rapid increase in school enrollments appears to have
exacerbated concerns about educational quality –particularly in poorer regions. We do
find strongly increasing returns to schooling that have remained quite stable over time.
However, we confirm the finding of low returns to primary education – perhaps
associated with quality concerns. Further, the substantial additional gains from
completing secondary school are particularly strong for women.
Overall, the growth accounts show that capital deepening has also made small
made contributions to growth – despite the recent data revisions that substantially
increased in measured investment since 1993. Does the revised data put to rest earlier
concerns that investment may be too low, and constraining growth? The data do now
show a strongly rising trend for gross investment. However, net investment averaged
about 17 percent of GDP during 1999-2004, which we estimate can support an annual
growth rate of roughly 7 percent. More rapid growth over the longer term would require
an increased investment rate. Notably, the investment increases have been concentrated
in the private sector, while public sector investment has fallen steadily as a share of GDP.
As discussed below, this is particularly problematic, given concerns about India’s weak
and deteriorating infrastructure.
We also examine the evolution of India’s saving behavior, to explore whether
saving is likely to constrain India’s investment. We argue that private saving in India has
performed remarkably well. The rise is concentrated among households, who now save
fully 25 percent of GDP. Further, nearly half household saving is in the form of financial
saving, available to fund corporate or public investment. Corporate saving has also risen
somewhat over the period. However, public sector saving has been very low historically,
40
turning negative during the late 1990s, before recovering somewhat more recently.
While not a major focus of this paper, the administrative budget deficit remains a major
policy concern. We conclude that saving is not constraining India’s growth. There is
room for increased public saving, as well as a rise in foreign saving, particularly if
financed through FDI which remains quite low in India.
Pulling together the findings of our analysis we draw a number of implications for
India’s growth in the coming decade. Our starting point is that increasing living
standards in India will require a combination of increasing employment and raising labor
productivity. To date, the rise in India’s output growth has been associated with little or
no rise in overall rates of job creation. And while agricultural output has fallen as a share
of GDP, agriculture’s share of total employment remains surprisingly high. We find that
labor productivity in agriculture is just one-fifth that in either industry or services,
implying significant productivity gains from further sectoral reallocation of labor.
Thus, India needs to broaden the base of its economic growth through greater
efforts to promote the expansion of the industrial sector – especially manufacturing – and
to emphasize the creation of jobs as well as gains in TFP. In this context, China provides
a useful model, in its use of exports manufactured under foreign contract as a primary
driver for growth. One key attraction to this strategy is that it provided rapidly expanding
employment opportunities for relatively young, and low-skilled workers. A second is
that it generated large feedback effects for the domestic economy – both in promoting
linkages to the supplying industries (including services) and in developing local expertise
for doing business in a global market.
To follow this strategy, India needs to create a more attractive economic
environment for doing business – a location able to compete effectively with China. This
will require strengthening its infrastructure – including a weak and unreliable power
system, and poor land transportation in many states. However, compared with China,
India already enjoys relative good institutions and is strong in the areas of finance and
business services.
Finally, we stress that successful implementation of this growth strategy should
not be expected to generate rapid TFP growth within the growing sectors. Expansion of
41
both industry and services will draw workers out of agriculture. This will generate gains
in aggregate TFP from the reallocation of labor to more productivity activities and from
reduced labor redundancy in agriculture. Thus, reforms should be directed towards
making it easier to expand domestic production, and a creating a more attractive location
for foreign producers. We see the prospects for sustaining this broad-based type of high
growth in India as strong.
42
References
Acharya, Shankar. 2004. “India’s Growth Prospects Revisited,” Economic and Political
Weekly (October 9). Ahluwalia, Monteck. 2002. “Economic Reforms in India Since 1991: Has Gradualism
Worked?” Journal of Economic Perspectives, vol 16, no. 3:67-88. Baier, S. L., G. P. Dwyer Jr., and R. Tamura. 2006. “How Important are Capital and
Total Factor Productivity for Economic Growth?” Economic Inquiry, 44(1): 23 - 49. Banga, Rashmi. 2005. “Critical Issues in India’s Service-Led Growth.” Working paper no.
171, Indian Council for Research on International Economic Relations. (October) Banga, Rashmi, and Bishwananth Gopldar. 2004. “Contribution of Services to Output
Growth and Productivity In Indian Manufacturing: Pre And Post Reforms,” working paper 139, ICRIER.
Barro, Robert, and Jong-Wha Lee. 2000. “International Data on Educational Attainment,
Updates and Implications.” Working Paper 7911. Cambridge, MA: National Bureau of Economic Research (September).
Baumol, William J. 1967. “Macroeconomics of Unbalanced Growth: The Anatomy of
Urban Crises,” American Economic Review, 57(3), June: 415-26. Bhattarai, Madhusudan and A. Narayanmoorthy. 2003. 'Impact of Irrigation on Rural
Poverty in India: An Aggregate Panel-data Analysis', Water Policy 5: 443-458, 2003 Bosworth, Barry. 2005. “Economic Growth in Thailand: the Macroeconomic Context,’
paper prepared for world Bank project on the investment climate, firm competitiveness and growth in Thailand. Available at: http://www.brookings.edu/es/research/projects/develop/develop.htm
Bosworth, Barry, and Susan M. Collins.2003. “The Empirics of Growth: An Update,”
Brookings Papers on Economic Activity, 2003:1 Buiter, Willem and Urjit Patel. 1992. “Debt, Finances and Inflation: An Application to
the Public Finances of India.” Journal of Public Economics 47: 171-205. Central Statistical Organisation. 1989. National Accounts Statistics: Sources and Methods,
(New Delhi: Government of India). _____. 1999.New Series on National Accounts Statistics (Base Year 1993-94), (New Delhi:
Government of India).
43
_____. 2004. Report of the Working Group on Workforce Estimation for Compilation of National Accounts Statistics with Base Year 1999-2000, (New Delhi: Government of India)
_____. 2005. National Account Statistics, 2005. (New Delhi: Government of India) _____. 2006. New Series on National Accounts Statistics (Base Year 1999-2000), (New
Delhi: Government of India). Coelli, Tim J. and D. S. Prasada Rao. 2003. “Total Factor Productivity Growth in
Agriculture: A Malmquist Index Analysis of 93 Countries,” 1980-2000 Working Paper no. 02/2003, Centre for Efficiency and Productivity Analysis, School of Economics, The University of Queensland.
Directorate of Economics & Statistics.2005. Agricultural Statistics at a Glance, 2004.
New Delhi: Ministry of Agriculture. Available at: http://agricoop.nic.in/statatglance2004/AtGlance.pdf
Dholakia, Bakul H. 2002. “Sources of India’s Accelerated Growth and the Vision of
Indian Economy in 2020.” The Indian Economic Journal, Vol. 29 (4): 27-46. Dollar, david, Giuseppe Iorossi and taye Mengistae. 2002. “Investment Climate and
Economic performance: Some Firm level Evidence from India.” World Bank Development Research Group, mimeo (May).
Duraisamy, P. 2000. “Changes in Returns to Education in India, 1983-94: By Gender,
Age-Cohort and Location,” Discussion paper no. 615, Economic Growth Center, Yale University.
Dutta, Puja Vasudeva. 2004. “The Structure of Wages in India, 1983-1999,” PRUS
Working Paper no 25, Poverty Research Unit of Sussex, University of Sussex. Easterly, William. 2001. The Elusive Quest for Growth: Economists’ Adventures and
Misadventures in the Tropics. Cambridge, MA: MIT Press. Easterly, William, and Ross Levine. 2001. “It’s Not Factor Accumulation: Stylized Facts
and Growth Models.” World Bank Economic Review 15(2): 177-219. Everson, Robert, Carl Pray, and Mark Rosegrant. 1999. Agricultural Research and
Productivity Growth in India. (Washington D.C. International Food Policy Research Institute.
Foster, Andrew D. and Mark R. Rosenzweig. 2004. “Agricultural Productivity growth,
Rural Economic Diversity and Economic reforms: India 1970-2000.” Economic Development and Cultural Change. April; 52 (3): 509-542.
44

Goldar, Bishwanath. 2004. “Indian Manufacturing: Productivity Trends in Pre- and Post-Reform Periods,” Economic and Political Weekly November 20: 5033-42.
Goldar, Bishwanath, and Arup Mitra. 2002. “Total Factor Productivity Growth in Indian
Industry: a Review of Studies,” in B.S. Minhas (editor), National Income Accounts and Data Systems. New Delhi: Oxford University Press: 218-37.
Gordon, Jim and Poonam Gupta. 2004. “Understanding India’s Services Revolution.” IMF
Working paper WP/ 04/171 (September). Hallward-Driemeier, Mary. 2005. “Improving the Climate for Investment and Business
in South Asia.” World Bank mimeo. Higgins, M. and J.G. Williamson, 1997, “Age Structure Dynamics in Asia and Dependence
on Foreign Capital,” Population and Development Review, 23(2):261-293. Hulten, Charles. 2001. "Total Factor Productivity: A Short Biography," in New Developments in Productivity Analysis, Charles R. Hulten, Edwin R. Dean, and Michael J. Harper, eds., Studies in Income and Wealth, vol. 63, (Chicago: The University of Chicago Press for the National Bureau of Economic Research, Chicago): 1-47. Janaiah, Aldas, Lalith Achoth and Cynthia Bantilan. 2005. “Has the Green Revolution
Bypassed Coarse Cereal? The Indian Experience?” eJADE, Vol 2 (2005), Issue 1: 20-33.
Joshi, Vijay and Ian M. D. Little. 2004. India: Macroeconomics and Political Economy.
Washington DC: World Bank and Oxford University press: New Delhi: Oxford University Press.
Kapur, Devesh and Pratap Bhanu Mehta. 2004. “Indian Higher Education Reform: From
Half-Baked Socialism to Half-Baked Capitalism,” CID Working Paper No. 108 (Cambridge: Harvard University).
Klenow, Peter, and Andrés Rodriguez-Clare. 1997. “The Neoclassical Revival in Growth
Economics: Has It Gone Too Far?” In National Bureau of Economic Research Macroeconomics Annual 1997, edited by Ben S. Bernanke and Julio Rotemberg. Cambridge, MA: MIT Press. 73-103.
Kochar, Anjini. 2002. “Emerging Challenges for Indian Education Policy.” In Anne O.
Krueger, ed. Economic Policy Reforms and the Indian Economy. Chicago: The University of Chicago Press.
Kohli, Atul. 2006. “Politics of Economic growth in India, 1980-2005 – Part I: the 1980s.”
Economic and Political Weekly, April 1: 1251-1259. ______. 2006. “Politics of Economic growth in India, 1980-2005 – Part II: the 1990s and
Beyond.” Economic and Political Weekly, April 8: 1361-1370.
45

Kolli. Ramesh and S. Hazra. 2005. “Measuring Non-Observed Economy: Practices
Followed In Indian National Accounts Statistics.” No 5. Paper presented at 8th Meeting of Expert Group on Informal Sector Statistics (March), Nadi, Fiji Islands.
Kremer, Michael, Karthik Muralidharan, Nazmul Chaudhury, Jeffrey Hammer, and F.
Halsey Rogers. 2005. “Teacher Absence in India.” Journal of the European Economic Association 3 (2-3): 658-667.
Krueger, Anne. 2005 “Comment and Discussion,” Brookings Trade Forum 2005 (2005)
232-238. Lane, Philip and Gian Maria Milesi-Ferretti. 2006. “The External Wealth of Nations
mark II: Revised and Extended Estimates of Foreign Assets and Liabilities, 1970-2004.” IMF Working Paper WP/06/69 (March).
Loayza, Norman and Rashmi Shankar. 2000. “Private Saving in India.” The World Bank
Economic Review. Vol. 14, No. 3 (September): 571-94. Loayza, Norman, Klaus Schmidt-Hebbel, and Luis Serven. 2000. “What Drives Private
Saving across the World?” Review of Economics and Statistics, Vol. 82 (August): 165-181
Mühleisen, Martin. 1997, "Improving India's Saving Performance," IMF Working Paper
No. 97/4 (IMF: Washington). National Sample Survey Organization. 1997. Employment and Unemployment Situation in
India, 1993-1994. NSS 50th Round, Report No. 409 (New Delhi: Government of India). ______. 2001. Employment and Unemployment Situation in India, 1999-2000. NSS 55th
Round, Report No. 458 (New Delhi: Government of India). ______. 2005. Employment and Unemployment Situation in India, January – June 2004,
NSS 60th Round, Report No. 506 (New Delhi: Government of India). Organization for Economic Cooperation and Development (OECD). 2001. Measuring
Productivity: Measurement of Aggregate and Industry-level Productivity Growth. OECD Manual, Paris. Available at: http://www.oecd.org/dataoecd/59/29/2352458.pdf.
Psacharopoulos, George and Patrinos, Harry A., "Returns to Investment in Education: A
Further Update" (September 2002). World Bank Policy Research Working Paper No. 2881.
Panagariya, Arvind. 2004. “India in the 1980s and 1990s: A Triumph of Reforms,”
Economic and Political Weekly, Vol. 39, No. 25:2581-94.
46
Patrinos, Harry, Cris Ridao-Cano and Chris Sakellariou. 2004. “Estimating the returns to
education: Accounting for heterogeneity in ability.” http://www.u-bourgogne.fr/colloque-
iredu/posterscom/communications/PatrinosRidaoCanoSakellariou.pdf Pritchett, Lant. 2001. “Where has all the Education Gone?” World Bank Economic
Review 15(3): 367-391. Psacharopoulos, George, and Harry Patrinos. 2004. “Returns to Investment in Education:
A Further Update,” Education Economics, Vol. 12, No. 2, pp. 111-134, August Reddy, Y.V. 2005. “Importance of Productivity in India.” Inaugural address given at the
Annual Conference of the Indian Economic Association. http://rbidocs.rbi.org.in/rdocs/Speeches/PDFs/67936.pdf
Reserve Bank of India. 2006. Handbook of Statistics on the Indian Economy. Available
at: http://www.rbi.org.in/scripts/Statistics.aspx. Rodrik, Dani, and Arvind Subramanian. 2005. “From “Hindu Growth” to Productivity
Surge: The Mystery of the Indian Growth Transition,” IMF Staff Papers, vol. 52, No. 2.
______. 2004b. “Why India Can Grow at 7 Percent a Year or More,” Economic and
Political Weekly (April 17). Rogers, Mark. 2003. “Directly Unproductive Schooling: How country characteristics
affect the impact of schooling on growth.” Oxford University Department of Economics Discussion Paper #166 (July).
http://www.economics.ox.ac.uk/Research/wp/pdf/paper166.pdf Saha, V., A. Kar and T. Baskaran. 2004. “Contribution of Informal Sector and Informal
Employment in Indian Economy.” Paper presented at 7th Meeting of the Expert Group On Informal Sector Statistics New Delhi (February).
Shetty, S.L. 2006. “Revision of National Accounts Statistics: A Welcome Step, Good in
Parts,” Economic and Policy Weekly (June 10): 2317-26. Sivasubramonian, Siva. 2004. The Sources of Economic Growth in India, 1950-1 to
1999-2000, New Delhi: Oxford University Press. Solow, Robert. 1957. “Technical Change and the Aggregate Production Function,”
Review of Economics and Statistics, 39 (3): 312-20.
47
Srinivasan, T.N. 2003a. “The Indian Economy: Current Problems and Future Prospects,” Stanford Center for International Development, Working Paper No. 173 (July).
______. 2003b. “Indian Economic Reforms: A Stocktaking,” Stanford Center for
International Development, Working Paper No. 190 (October) ______. 2005. “Information-Technology-Enabled Services and India’s Growth
Prospects,” in Susan M. Collins and Lael Brainard (eds.) Brookings trade Forum 2005: Offshoring White-Collar Work.” Washington DC: The Brookings Institution: 203-240.
Srinivasan, T.N., and Suresh D. Tendulkar. 2003. Reintegrating India with the World
Economy (Washington D.C: Institute of International Economy)
Sundaram, K., and Suresh D. Tendulkar. 2005a. “Trends in Labour and Employment in India, 1983-2003,” paper presented for the India LES of the World Bank.
______. 2005b. “Changing Structure of Indian Workforce, Quality of Employment,
and Real Earnings, 1983-2000.” Triplett, Jack and Barry Bosworth. 2004. Productivity in the U.S. Services Sector: New
Sources of Economic Growth (Washington D.C: the Brookings Institution Press). Virmani, Arvind .1997. “India: Crises, Reform and Growth,” Economic and Political
Weekly, August 9, 1997. Virmani, Arvind. 2004. “Sources of India’s Economic Growth: Trends in Total Factor
Productivity,” Working paper no. 131, Indian Council for Research on International Economic Relations.
______. 2005. “Policy Regimes, Growth and Poverty in India: Lessons of Government
Failure and Entrepreneurial Success,” Working paper no. 170, Indian Council for Research on International Economic Relations.
Visaria, Pravin. 2002. “Workforce and Employment in India, 1961-94,” in B.S. Minhas
(editor), National Income Accounts and Data Systems. New Delhi: Oxford University Press: 1-46.
Wallack, Jessica Seddon. 2003. “Structural Breaks in Indian Macroeconomic Data.”
Economic and Political Weekly, October 11: 4312-4315. World Bank. 2002. India’s Transport sector: The Challenges Ahead, Volume 1.
Washington DC: The World Bank. (May).
48
_________. 2004. India: Investment Climate and Manufacturing Industry. Washington DC: The World bank (November).
Wu, Bing Kin, Venita Kaul and Deepa Sankar. 2005. “The Quiet Revolution: How India
is achieving universal elementary education,” Finance and Development 42:2 (June). Young, Alwyn. 1995. “The Tyranny of Numbers: Confronting the Statistical Realities of
the East Asian Growth Experience,” Quarterly Journal of Economics 100: 641-80.
49

Table 1. Measures of the Organized and Unorganized Sectors by Industry. 1999-2000percentIndustry Distribution of
GDP by sector Organized Unorganized UnorganizedAgriculture, forestry and fishering 25.3 3.1 -- 99.1
Agriculture 23.2 3.2 -- 99.2Forestry and logging 1.1 5.6 -- 98.3Fishing 1.1 0.1 -- 98.5
Industry 25.4 62.5 37.5 ..Mining and Quarrying 2.3 91.6 8.4 90.7Manufacturing 14.7 60.8 39.2 97.9Electricity, gas and water supply 2.5 93.8 6.2 90.1Construction1 5.9 41.8 58.2 85.8
Services 49.2 51.3 48.7 ..Trade 12.9 18.1 81.9 84.7Hotel and restaurants 1.2 41.2 58.8 90.7Transport and storage 5.8 35.2 64.8 79.3Communication 1.6 91.4 8.6 92.8Banking and insurance 5.9 90.5 9.5 88.7Real estate, ownership of dwellings and business services 7.1 18.6 81.4 89.9Public admininistration and defence 6.7 100.0 0.0 0.4Other services 8.1 69.5 30.5 87.4
Non-agricultural sector 74.7 56.0 44.0 88.3Total2
100.0 42.0 32.4 95.6Source: Saha, Kar and Baskaran (2004) and Government of India, Central Statistical Office (2006,February)1. norganized employment in construction includes casual laborers in the organized sector.
Percent of sector GDP Percent of sector employment

Table 2. National Accounts Revisions, Benchmark Years 1993-94 and 1999-00Millions of rupees
Sector Share 1980-81 1993-94 Percent Share 1993-94 1999-00 Percent of Total series series Change of Total series series Change
(1) (2) (3) (4) (5) (6) (7) (8)Agriculture, forestry and fishing 30.3 2,237 2,424 8.4 25.3 4,620 4,541 -1.7
Agriculture 27.9 2,063 2,231 8.2 23.2 4,224 4,153 -1.7Forestry and logging 1.3 98 102 3.9 1.1 196 195 -0.4Fishing 1.1 75 91 20.2 1.1 200 192 -3.9
Industry 25.8 2,040 2,058 0.9 25.4 4,556 4,556 0.0Mining and quarrying 2.5 168 197 17.1 2.3 413 416 0.7Manufacturing 15.9 1,276 1,267 -0.7 14.7 2,667 2,641 -1.0
Rregistered 10.4 812 831 2.3 9.7 1,708 1,730 1.3Unregistered 5.5 464 436 -6.0 5.1 959 911 -5.0
Electricity, gas and water supply 2.4 189 190 0.5 2.5 423 447 5.8Construction 5.1 407 404 -0.7 5.9 1,053 1,051 -0.1
Services 43.9 3,051 3,508 15.0 49.2 8,443 8,826 4.5Trade, hotels and restaurants 13.9 980 1,110 13.2 14.2 2,460 2,541 3.3
Trade 13.2 922 1,056 14.6 12.9 2,290 2,319 1.3Hotel and restaurants 0.7 59 54 -7.5 1.2 170 223 30.7
Transport, storage and communication 7.3 561 580 3.4 7.4 1,243 1,318 6.0Railways 1.2 96 96 0.0 1.1 156 195 24.8Transport by other means 4.8 371 383 3.4 4.6 819 824 0.6Storage 0.1 6 6 6.9 0.1 13 14 13.1Communication 1.2 88 94 6.9 1.6 256 284 11.3
Finance, insurance, real estate and business services 11.2 671 896 33.4 13.0 2,206 2,328 5.5
Banking and insurance 5.2 436 417 -4.4 5.9 1,191 1,057 -11.3Real estate and business services 6.0 236 479 103.3 7.1 1,015 1,271 25.2
Community, social and personal services 11.5 839 923 10.0 14.7 2,534 2,640 4.2Public administration and defence 5.4 400 431 7.9 6.7 1,167 1,197 2.6Other services 6.2 439 492 12.0 8.1 1,367 1,443 5.6
Total GDP at factor cost 100.0 7,329 7,991 9.0 100.0 17,618 17,923 1.7
1993-94 GDP by Sector 1999-00 GDP by Sector
Source: Central Statistical Organisation (2004, p.8), Central Statistical Organisation (2006, February, p.11), and authors' estimates.

Table 3. Sources of Economic Growth, Total Economy, 1960-2005Annual percentage rate of change
Output Employment Output per Physical FactorPeriod Worker Capital Land Education Productivity
Total Economy1960-04 4.7 2.0 2.6 1.2 -0.1 0.3 1.21960-80 3.4 2.2 1.3 1.0 -0.2 0.2 0.21980-04 5.8 1.9 3.8 1.4 0.0 0.4 2.0
1960-73 3.3 2.0 1.3 1.1 -0.2 0.1 0.21973-83 4.2 2.4 1.8 0.9 -0.2 0.3 0.61983-93 5.0 2.1 2.9 0.9 -0.1 0.3 1.71993-99 7.0 1.2 5.8 2.4 -0.1 0.4 2.81999-04 6.0 2.4 3.6 1.2 0.1 0.4 2.0
Source: Authors' calculations as explained in text.
Contribution of:

Table 4. Sources of Economic Growth, Major Sectors, 1960-2005Annual percentage rate of change
Output Employment Output per Physical FactorPeriod Worker Capital Land Education Productivity
Agriculture1960-04 2.4 1.4 1.0 0.4 -0.1 0.2 0.61960-80 1.9 1.8 0.1 0.2 -0.2 0.1 -0.11980-04 2.8 1.0 1.8 0.5 -0.1 0.3 1.1
1960-73 1.8 1.9 -0.1 0.2 -0.2 0.1 -0.21973-83 2.9 1.7 1.2 0.3 -0.2 0.2 0.91983-93 2.9 1.4 1.5 0.2 -0.1 0.2 1.21993-99 2.6 0.2 2.4 0.7 0.1 0.3 1.31999-04 1.8 1.0 0.8 0.9 -0.2 0.4 -0.1
Industry (Inclusive of Manufacturing)1960-04 5.6 3.3 2.3 1.6 0.3 0.31960-80 4.7 3.1 1.6 1.8 0.3 -0.41980-04 6.4 3.5 2.9 1.6 0.3 1.0
1960-73 4.7 2.3 2.4 2.3 0.2 -0.11973-83 5.2 4.5 0.7 1.1 0.3 -0.81983-93 6.0 2.9 3.1 1.3 0.3 1.41993-99 6.9 2.4 4.5 3.0 0.5 1.01999-04 6.4 5.5 0.9 -0.1 0.2 0.9
Manufacturing1960-04 5.7 2.6 3.1 1.8 0.3 0.91960-80 4.6 2.7 2.0 1.5 0.3 0.21980-04 6.6 2.6 4.0 2.1 0.4 1.5
1960-73 4.9 1.5 3.4 2.1 0.2 1.11973-83 5.3 4.3 1.0 1.0 0.4 -0.31983-93 6.0 2.1 3.9 1.3 0.4 2.11993-99 7.2 1.7 5.5 4.6 0.6 0.31999-04 6.4 4.4 2.0 0.4 0.3 1.4
Services1960-04 6.3 3.2 3.1 0.9 0.4 1.71960-80 4.9 2.8 2.0 1.1 0.5 0.41980-04 7.6 3.6 4.0 0.7 0.4 2.9
1960-73 4.7 1.9 2.8 1.8 0.4 0.51973-83 5.3 4.2 1.0 0.0 0.5 0.51983-93 6.5 3.8 2.7 0.3 0.4 2.01993-99 10.2 3.1 7.0 1.5 0.5 4.91999-04 7.8 3.5 4.4 0.9 0.4 3.1
Source: Authors' estimates as described in text.
Contribution of:
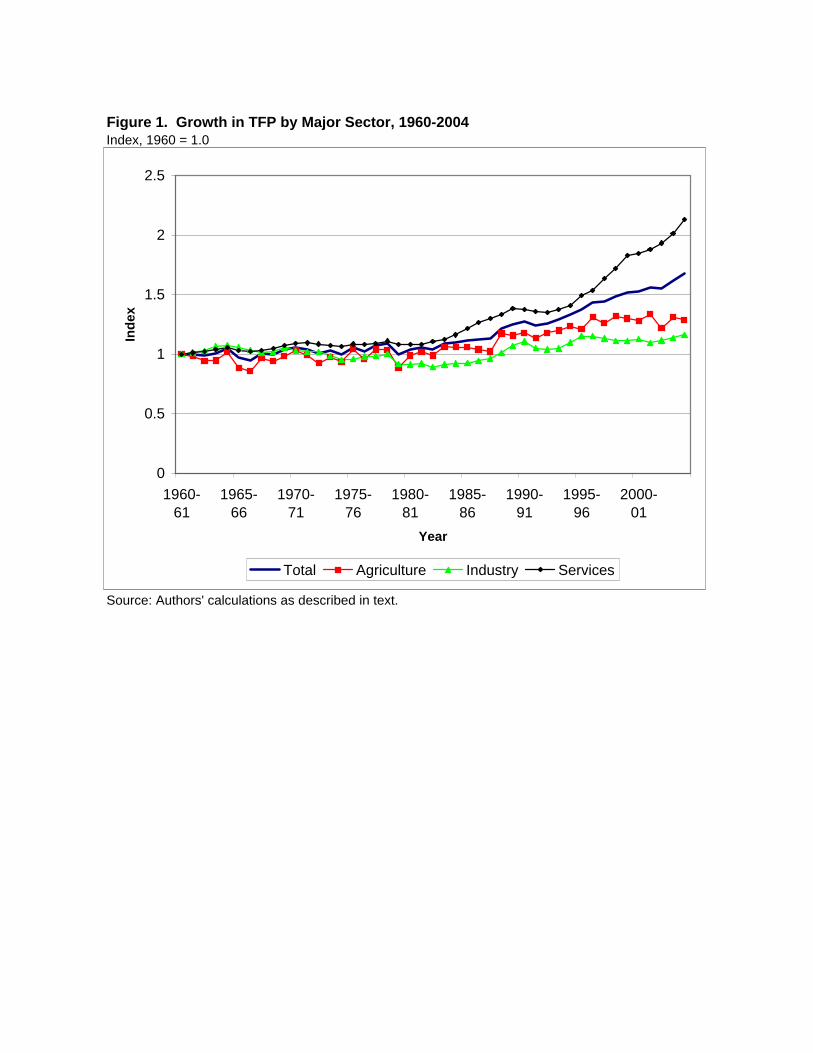
Figure 1. Growth in TFP by Major Sector, 1960-2004Index, 1960 = 1.0
Source: Authors' calculations as described in text.
0
0.5
1
1.5
2
2.5
1960-61
1965-66
1970-71
1975-76
1980-81
1985-86
1990-91
1995-96
2000-01
Year
Inde
x
Total Agriculture Industry Services
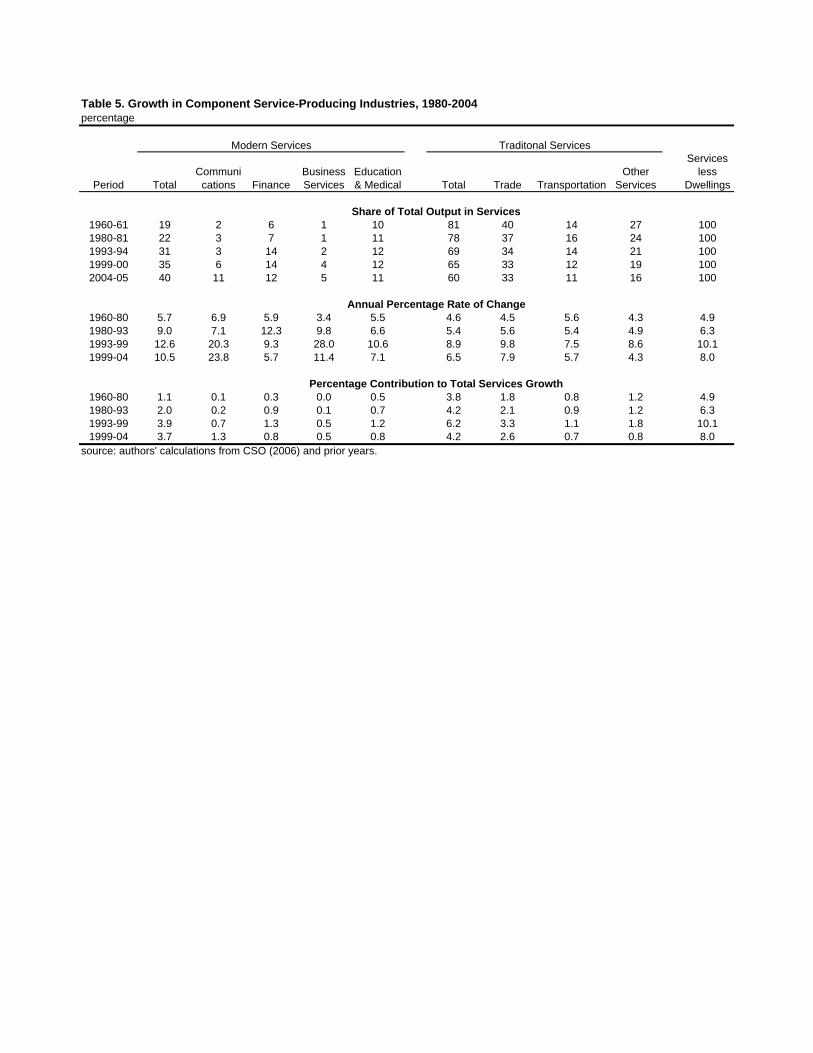
Table 5. Growth in Component Service-Producing Industries, 1980-2004percentage
Period TotalCommuni
cations FinanceBusiness Services
Education & Medical Total Trade Transportation
Other Services
Services less
Dwellings
1960-61 19 2 6 1 10 81 40 14 27 1001980-81 22 3 7 1 11 78 37 16 24 1001993-94 31 3 14 2 12 69 34 14 21 1001999-00 35 6 14 4 12 65 33 12 19 1002004-05 40 11 12 5 11 60 33 11 16 100
1960-80 5.7 6.9 5.9 3.4 5.5 4.6 4.5 5.6 4.3 4.91980-93 9.0 7.1 12.3 9.8 6.6 5.4 5.6 5.4 4.9 6.31993-99 12.6 20.3 9.3 28.0 10.6 8.9 9.8 7.5 8.6 10.11999-04 10.5 23.8 5.7 11.4 7.1 6.5 7.9 5.7 4.3 8.0
1960-80 1.1 0.1 0.3 0.0 0.5 3.8 1.8 0.8 1.2 4.91980-93 2.0 0.2 0.9 0.1 0.7 4.2 2.1 0.9 1.2 6.31993-99 3.9 0.7 1.3 0.5 1.2 6.2 3.3 1.1 1.8 10.11999-04 3.7 1.3 0.8 0.5 0.8 4.2 2.6 0.7 0.8 8.0
source: authors' calculations from CSO (2006) and prior years.
Percentage Contribution to Total Services Growth
Modern Services Traditonal Services
Share of Total Output in Services
Annual Percentage Rate of Change

Annual percentage rate of changeWeighted
Total Sectoral ReallocationEconomy Growth Effects
Period (1) (2) (1)-(2)
1960-80 1.3 0.9 0.41980-04 3.8 2.8 1.0
1960-73 1.3 1.1 0.21973-83 1.8 1.0 0.81983-93 2.9 2.3 0.61993-99 5.8 4.8 1.01999-04 3.6 2.4 1.2
Authors' estimates as described in the text.
Sectoral Growth vs. Reallocation EffectsTable 6. Growth in Output per Worker, 1960-2005

PercentAverage
No Below Post YearsSchooling Middle Middle Secondary Secondary of
Country Year SchoolIndia 1960 72.2 16.2 11.1 0.4 0.00 1.7
1980 55.0 10.0 23.9 8.6 2.61 2.92000 40.7 9.9 27.1 16.8 5.60 4.5
China 19601980 34.0 19.5 35.6 10.2 0.60 4.82000 18.0 21.1 43.3 15.5 2.10 6.4
Thailand 1960 36.9 12.7 47.6 2.3 0.40 4.31980 14.4 66.1 12.1 6.4 0.90 4.42000 12.6 34.5 37.9 8.1 7.00 6.5
Malaysia 1960 49.7 25.0 20.5 3.6 1.10 2.91980 26.8 22.2 41.0 8.8 1.10 5.12000 16.2 16.4 48.7 15.8 2.90 6.8
Indonesia 1960 68.0 16.8 14.5 0.8 0.00 1.61980 31.9 33.0 29.3 5.7 0.10 3.72000 32.1 18.2 36.7 12.4 0.50 5.0
Source: Barro and Lee (2000), NSSO various years, and authors' calculations.
Table 7. Educational Attainment of the Total Population Aged 15 and Over, Selected Countries and Years.
Highest Level Attained
Note: Data for India in 1980 and 2000 come from the surveys conducted in 1983-84 and 1999-2000, respectively.
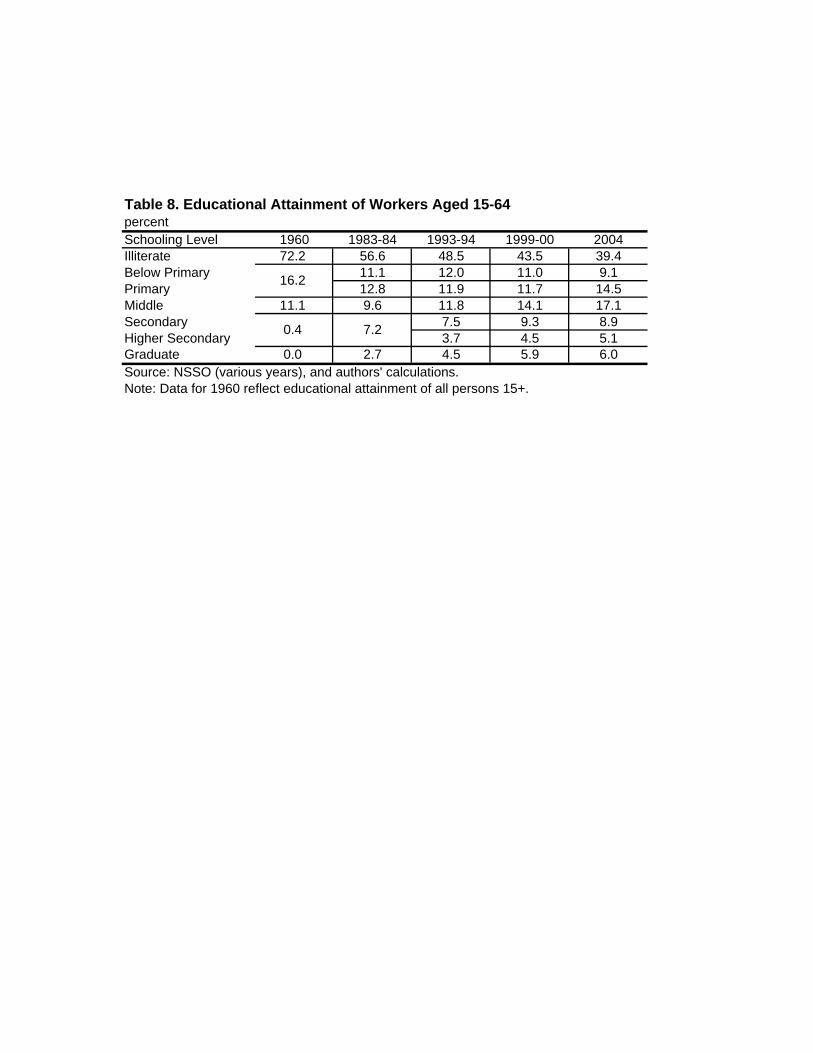
Table 8. Educational Attainment of Workers Aged 15-64percentSchooling Level 1960 1983-84 1993-94 1999-00 2004Illiterate 72.2 56.6 48.5 43.5 39.4Below Primary 11.1 12.0 11.0 9.1Primary 12.8 11.9 11.7 14.5Middle 11.1 9.6 11.8 14.1 17.1Secondary 7.5 9.3 8.9Higher Secondary 3.7 4.5 5.1Graduate 0.0 2.7 4.5 5.9 6.0Source: NSSO (various years), and authors' calculations.Note: Data for 1960 reflect educational attainment of all persons 15+.
16.2
0.4 7.2
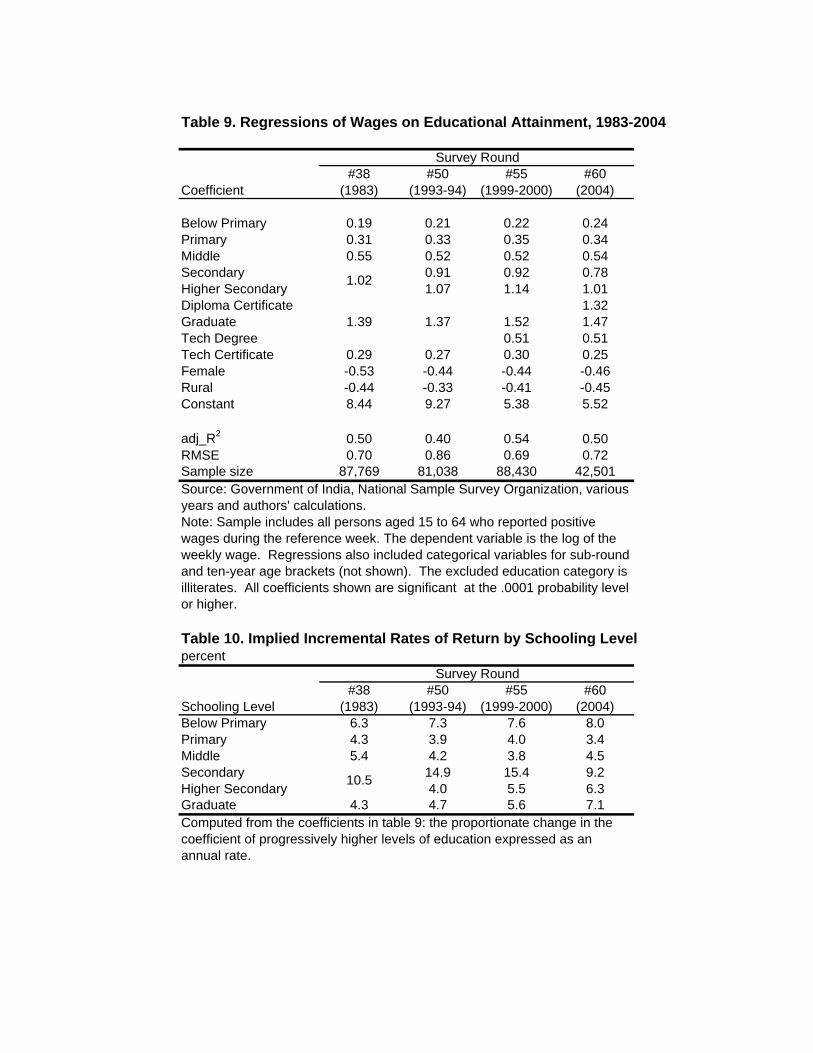
Table 9. Regressions of Wages on Educational Attainment, 1983-2004
#38 #50 #55 #60Coefficient (1983) (1993-94) (1999-2000) (2004)
Below Primary 0.19 0.21 0.22 0.24Primary 0.31 0.33 0.35 0.34Middle 0.55 0.52 0.52 0.54Secondary 0.91 0.92 0.78Higher Secondary 1.07 1.14 1.01Diploma Certificate 1.32Graduate 1.39 1.37 1.52 1.47Tech Degree 0.51 0.51Tech Certificate 0.29 0.27 0.30 0.25Female -0.53 -0.44 -0.44 -0.46Rural -0.44 -0.33 -0.41 -0.45Constant 8.44 9.27 5.38 5.52
adj_R2 0.50 0.40 0.54 0.50RMSE 0.70 0.86 0.69 0.72Sample size 87,769 81,038 88,430 42,501
Table 10. Implied Incremental Rates of Return by Schooling Levelpercent
#38 #50 #55 #60Schooling Level (1983) (1993-94) (1999-2000) (2004)Below Primary 6.3 7.3 7.6 8.0Primary 4.3 3.9 4.0 3.4Middle 5.4 4.2 3.8 4.5Secondary 14.9 15.4 9.2Higher Secondary 4.0 5.5 6.3Graduate 4.3 4.7 5.6 7.1
Survey Round
10.5
Computed from the coefficients in table 9: the proportionate change in the coefficient of progressively higher levels of education expressed as an annual rate.
Note: Sample includes all persons aged 15 to 64 who reported positive wages during the reference week. The dependent variable is the log of the weekly wage. Regressions also included categorical variables for sub-round and ten-year age brackets (not shown). The excluded education category is illiterates. All coefficients shown are significant at the .0001 probability level or higher.
1.02
Source: Government of India, National Sample Survey Organization, various years and authors' calculations.
Survey Round
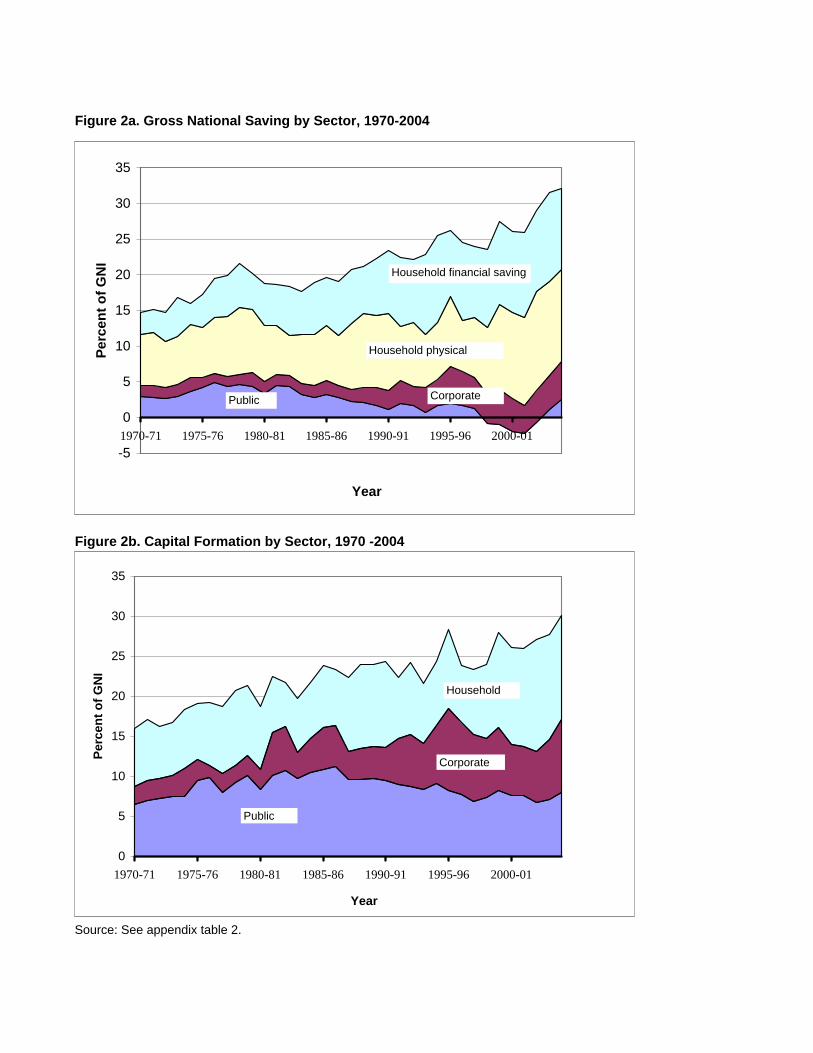
Figure 2a. Gross National Saving by Sector, 1970-2004
Figure 2b. Capital Formation by Sector, 1970 -2004
Source: See appendix table 2.
-5
0
5
10
15
20
25
30
35
1970-71 1975-76 1980-81 1985-86 1990-91 1995-96 2000-01
Year
Perc
ent o
f GN
I
Household physical
CorporatePublic
Household financial saving
0
5
10
15
20
25
30
35
1970-71 1975-76 1980-81 1985-86 1990-91 1995-96 2000-01
Year
Perc
ent o
f GN
I
Corporate
Public
Household

Table 11. Saving and Investment of the Public Sector, 1970-2004percent of GNI
1970-79 1980-84 1985-89 1990-94 1995-99 2000-04Public sector saving 3.7 3.7 2.4 1.4 0.6 -0.3
Administration 2.0 1.4 -1.2 -2.0 -3.3 -5.1Other public 1.7 2.3 3.6 3.4 3.9 4.8
Public sector investment 8.2 9.9 10.2 8.9 7.7 7.4Administration 1.4 1.6 1.6 1.4 1.2 2.0Other public 6.8 8.3 8.6 7.5 6.2 5.5
Puiblic sector net lending -4.5 -6.2 -7.8 -7.5 -7.1 -7.7Administration 0.6 -0.2 -2.8 -3.3 -4.5 -7.0Other public -5.1 -6.0 -5.0 -4.2 -2.3 -0.6
Addenda:Infrastructure investment 4.2 4.8 5.5 5.6 5.2 5.7
Source: appendix table 1.
Table 12. Nominal and Real Lending Rates, 1970-2004
Year 1970-74 1975-79 1980-84 1985-89 1990-94 1995-99 2000-04
Nominal lending rate 9.0 10.4 13.3 13.9 16.7 15.2 11.4Inflation rate 15.3 4.7 9.3 6.7 11.0 5.3 5.2Real interest rate -4.9 5.9 3.9 6.8 5.2 9.4 5.9Source: Reserve Bank of India(2006), tables 70 and 169.
note: Infrastucture investment includes investment of public utilities and the transportation and communication industries.
The nominal lending rate is an average of the rates for four major lending institutions. The inflation rate is measured by the annual rate of change in the wholesale price index for all commodities.
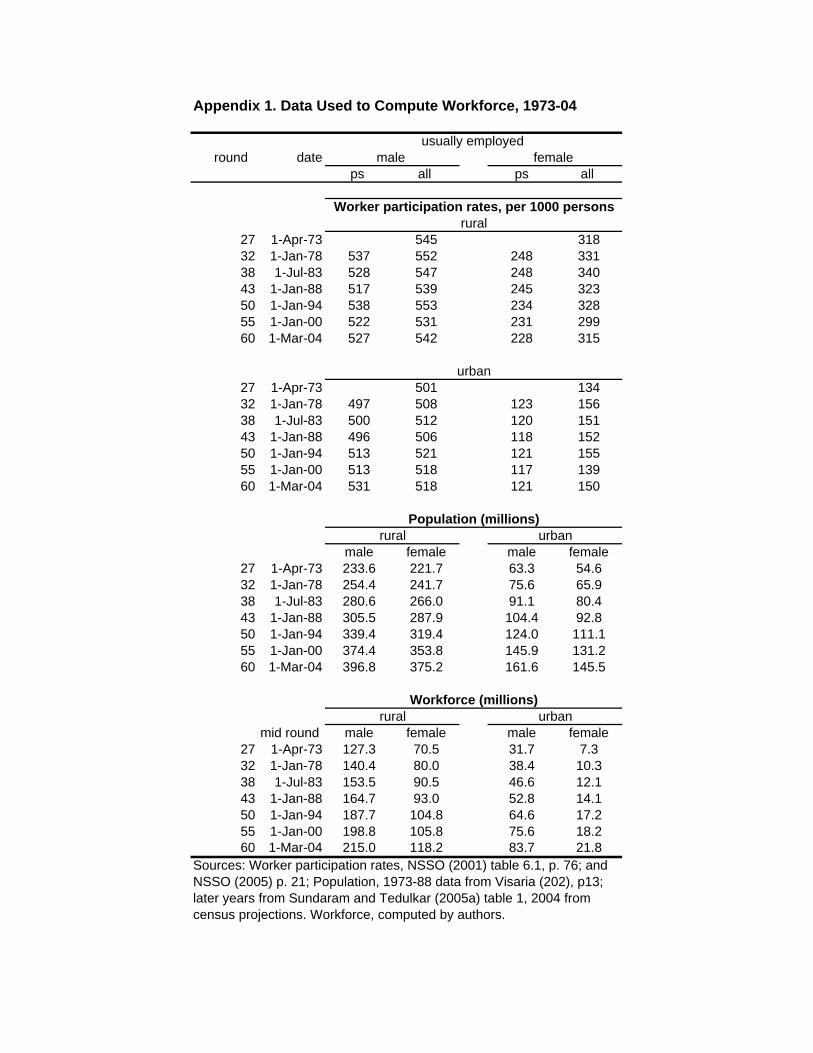
Appendix 1. Data Used to Compute Workforce, 1973-04
round date ps all ps all
27 1-Apr-73 545 31832 1-Jan-78 537 552 248 33138 1-Jul-83 528 547 248 34043 1-Jan-88 517 539 245 32350 1-Jan-94 538 553 234 32855 1-Jan-00 522 531 231 29960 1-Mar-04 527 542 228 315
27 1-Apr-73 501 13432 1-Jan-78 497 508 123 15638 1-Jul-83 500 512 120 15143 1-Jan-88 496 506 118 15250 1-Jan-94 513 521 121 15555 1-Jan-00 513 518 117 13960 1-Mar-04 531 518 121 150
male female male female27 1-Apr-73 233.6 221.7 63.3 54.632 1-Jan-78 254.4 241.7 75.6 65.938 1-Jul-83 280.6 266.0 91.1 80.443 1-Jan-88 305.5 287.9 104.4 92.850 1-Jan-94 339.4 319.4 124.0 111.155 1-Jan-00 374.4 353.8 145.9 131.260 1-Mar-04 396.8 375.2 161.6 145.5
mid round male female male female27 1-Apr-73 127.3 70.5 31.7 7.332 1-Jan-78 140.4 80.0 38.4 10.338 1-Jul-83 153.5 90.5 46.6 12.143 1-Jan-88 164.7 93.0 52.8 14.150 1-Jan-94 187.7 104.8 64.6 17.255 1-Jan-00 198.8 105.8 75.6 18.260 1-Mar-04 215.0 118.2 83.7 21.8
usually employed male female
urbanrural
ruralWorker participation rates, per 1000 persons
urban
Population (millions)
rural urbanWorkforce (millions)
Sources: Worker participation rates, NSSO (2001) table 6.1, p. 76; and NSSO (2005) p. 21; Population, 1973-88 data from Visaria (202), p13; later years from Sundaram and Tedulkar (2005a) table 1, 2004 from census projections. Workforce, computed by authors.

Appendix 2. Components of Saving and Invesment Balance, 1960-2004percent of GNI
Year 1960-79 1970-79 1980-84 1985-89 1990-94 1995-99 2000-04 2000-01 2001-02 2002-03 2003-04 2004-05Gross domestic saving 15.1 17.6 18.5 20.5 23.3 25.3 28.9 26.0 25.9 29.0 31.6 32.1
Household Sector 10.4 12.3 13.2 16.2 18.7 19.9 24.6 23.4 24.2 25.3 25.7 24.3Financial savings 3.7 4.6 6.4 7.3 10.2 10.5 11.7 11.3 11.9 11.3 12.5 11.4Physical savings 6.7 7.7 6.8 8.9 8.6 9.3 12.9 12.1 12.3 13.9 13.2 13.0
Private corporate sector 1.5 1.6 1.6 2.0 3.1 4.7 4.6 4.6 3.9 4.5 4.8 5.3
Public Sector 3.3 3.7 3.7 2.4 1.4 0.6 -0.3 -1.9 -2.2 -0.7 1.1 2.5Administration 1.7 2.0 1.4 -1.2 -2.0 -3.3 -5.1 -6.1 -6.6 -5.7 -4.0 -3.0Other 1.6 1.7 2.3 3.6 3.4 3.9 4.8 4.1 4.4 5.0 5.1 5.4
External Investment (current acc -1.1 -0.1 -1.4 -2.4 -1.5 -1.4 0.4 -0.7 0.7 1.3 1.8 -1.1
Total capital formation 16.2 17.7 19.8 22.9 24.8 26.6 28.5 26.7 25.2 27.7 29.8 33.2Errors and Omissions -0.7 -0.6 -1.0 -0.6 1.4 1.1 1.2 0.6 -0.8 0.7 2.0 3.2
Unadjusted capital formation 16.9 18.3 20.9 23.5 23.3 25.5 27.4 26.0 26.0 27.0 27.8 30.0Public sector 7.6 8.2 9.9 10.2 8.9 7.7 7.4 7.6 7.6 6.8 7.1 8.0
Administration 1.4 1.4 1.6 1.6 1.4 1.2 2.0 1.8 1.6 1.9 2.1 2.4Other public 6.2 6.8 8.3 8.6 7.5 6.2 5.5 5.9 6.0 4.8 5.0 5.6
Private crporate sector 2.6 2.4 4.1 4.4 5.9 8.6 7.1 6.3 6.1 6.3 7.5 9.1Household sector 6.7 7.7 6.8 8.9 8.6 9.3 12.9 12.1 12.3 13.9 13.2 13.0
Valuables 0.1 0.4 0.9 0.8 0.7 0.6 1.0 1.4Industry basis 17.3 18.8 22.6 23.8 22.1 27.3 27.4 26.0 26.0 27.0 27.8 30.0
Ariculture 34.0 25.2 17.4 12.1 7.9 8.6 5.1 5.4 3.6 4.9 5.4 6.1Industry 0.0 0.0 0.0 0.0 0.0 0.0 0.0 0.0 0.0 0.0 0.0 0.0Services 17.3 18.8 22.6 23.8 22.1 28.1 27.4 26.0 26.0 27.0 27.8 30.0Real estate 2.4 2.7 2.6 2.2 2.0 2.4 2.6 2.4 2.9 2.8 2.6 2.4
Capital consumption allowances 6.7 7.3 8.9 9.7 9.9 10.4 10.5 10.6 10.6 10.5 10.2 10.4
Infrastucture Investment 4.1 4.2 4.8 5.5 5.6 5.2 5.7 6.1 5.2 5.5 5.4 6.2Fixed Investment - asset 15.0 15.9 19.1 21.6 22.6 24.6 26.5 25.1 25.4 26.3 27.0 28.6Fixed investment - industry 15.4 16.3 20.8 22.0 22.6 26.6 26.5 25.1 25.4 26.3 27.0 28.6Source: CSO (2006) and prior years.Data include the revisions publised in the 1999-00 base year revisions, but total capital formation redefined to exclude valuables.