Embed Size (px)
Citation preview
www.elsevier.com/locate/marpolbul
Marine Pollution Bulletin 51 (2005) 200–211
Sources of sediment to the Great Barrier Reef World Heritage Area
Lucy A. McKergow a,*, Ian P. Prosser b, Andrew O. Hughes b, Jon Brodie c
a Department of Geography, University of Otago, P.O. Box 56, Dunedin, New Zealandb CSIRO Land and Water, GPO Box 1666, Canberra, ACT 2601, Australia
c Australian Centre for Tropical Freshwater Research, James Cook University, Townsville, Australia
Abstract
To reduce sediment exports discharging to the Great Barrier Reef (GBR), it is essential to identify the sources of exported sed-
iment. We used modelling of spatial sediment budgets (the SedNet model) to identify sources and deposition of sediment as it is
transported through river networks. Catchments with high levels of land clearing, cattle grazing and cropping show the largest
increases in sediment export compared with natural conditions. Hillslope erosion supplies 63% of sediment to the rivers. Gully ero-
sion and riverbank erosion are lower sources of sediment at the GBR catchment scale, but they are important in some catchments.
Overall, 70% of sediment exported from rivers comes from just 20% of the total catchment area, showing that much of the problem
can be addressed in a relatively small area. This is a much more manageable problem than trying to reduce erosion across the entire
GBR catchment. Areas of high contribution are all relatively close to the coast because of the high erosion and high sediment deliv-
ery potential.
� 2004 Elsevier Ltd. All rights reserved.
Keywords: Suspended sediment; Great Barrier Reef; Sediment budgets; Spatial modelling; GIS
1. Introduction
In the catchments adjacent to the Great Barrier Reef
(GBR) widespread clearing of native vegetation and
replacement with intensive cropping and grazing sys-
tems have increased erosion and river sediment exports
to many times the natural amount (Furnas, 2003;
McCulloch et al., 2003). Increased sediment exports
threaten to degrade inner shelf reef and benthic ecosys-tems, particularly those of the central and southern
GBR (Brodie, 2002; Furnas, 2003). The nearshore zone
at most risk contains 438 coral reefs, 462 km2 of seagrass
beds, dugong habitats, supports important fisheries and
contains significant tourism destinations (Brodie, 2002).
Increased sediment exports can inhibit growth of shal-
low seagrass beds and inshore reefs in deposition areas
0025-326X/$ - see front matter � 2004 Elsevier Ltd. All rights reserved.
doi:10.1016/j.marpolbul.2004.11.029
* Corresponding author. Tel.: +64 3 4798776; fax: +64 3 4799037.
E-mail address: [email protected] (L.A. McKergow).
and increase eutrophication (Bell and Elmetri, 1995;Wolanski and Spagnol, 2000; Wolanski and Duke,
2002; Wolanski et al., 2003; Fabricius and De�ath,2004). Mid and outer shelf reefs do not appear to be
at high risk from increased terrestrial runoff (Devlin
et al., 2003). The combined impact of runoff and other
stresses, such as freshwater inundation, cyclones,
crown-of-thorns starfish and high water temperatures,
may cause devastating changes (Fabricius and De�ath,2004).
While the precise impacts remain uncertain (Lar-
combe and Woolfe, 1999a,b), there is general agreement
that inshore areas are under threat and that sediment ex-
ports need reducing now for the threat to be removed. In
June 2001, the GBR Ministerial Council initiated a pro-
cess to set water quality targets for the GBR World Her-
itage Area (GBRWHA). As a result of this process, theGreat Barrier Reef Marine Park Authority (GBRMPA)
published end-of-catchment targets for suspended
sediment (SS), nitrogen and phosphorus, and targets
L.A. McKergow et al. / Marine Pollution Bulletin 51 (2005) 200–211 201
for chlorophyll and sediment associated pollutants in
the GBR lagoon (Brodie et al., 2001, 2003a). More re-
cently, the federal and Queensland governments have
developed a Reef Water Quality Protection Plan
(RWQPP) to protect the Reef from land-based sources
of pollution. The long-term target of the RWQPP is tohalt and reverse the decline in water quality entering
the Reef within 10 years (Anon, 2003).
The GBR catchment area is vast and diverse covering
423,000 km2. The region includes large river basins with
open, low energy floodplains draining inland Savannah
grazing and cereal and cotton cropping lands. At the
other extreme are small, high energy, coastal rivers
draining wet tropic rain forest and sugar cane and hor-ticulture croplands (Furnas, 2003). It is beyond current
resources to systematically control erosion and sediment
transport across the whole area, and we show in this
paper that this is unnecessary. Thus, to prioritise reha-
bilitation efforts, we need techniques that identify the
sub-catchments and erosion processes that contribute
the bulk of the sediment. The variability of environ-
ments and land uses across the region make this a chal-lenging task.
Monitoring of river sediment loads has revealed the
scale of sediment export to the reef from some catch-
ments (Furnas and Mitchell, 2001; Furnas, 2003). Sam-
pling of the Normanby, Barron, Johnstone, Tully,
Herbert, Burdekin and Fitzroy Rivers, was initiated in
1987 by the Australian Institute of Marine Science
(AIMS). This monitoring provides the only actual mea-surements of sediment concentrations and load esti-
mates. The expense and effort required mean that not
all rivers are monitored and until now the monitoring
has been limited to fixed-term funding, with little ongo-
ing commitment. Rainfall and runoff vary greatly from
year-to-year so the limited spatial and temporal scope
of monitoring mean that some form of modelling is re-
quired to assess the patterns of export to the GBR, evenif it is just extrapolation of monitoring data. More
importantly, modelling is required to interpret the pat-
terns of sediment sources within catchments.
A number of models have been developed to estimate
sediment exports to the GBR. The models and data sup-
porting them have grown in sophistication and reliabil-
ity over time. Sediment exports have been calculated
from the estimated accumulation of sediment in thecoastal sediment wedge (Belperio, 1983), weighted dis-
charge–transport relationships derived from a small
number of rivers (Neil and Yu, 1996) and simple models
of land use, runoff and sediment delivery (Moss et al.,
1992; Rayment and Neil, 1997). More recently, dis-
charge–export relationships derived from the AIMS
monitoring have been used to estimate sediment exports
(Furnas and Mitchell, 2001; Brodie and Furnas, 2003;Furnas, 2003). These models extrapolate from gauged
basins to predict the pattern of export along all 35 river
basins using empirical relationships to factors such as
discharge, land use, or catchment area. They all make
implicit assumptions that conditions in monitored
catchments can be applied to the unmonitored catch-
ments. When tested as predictive models they typically
have large residual errors that represent the additionalenvironmental factors that control sediment transport
in diverse environments. They do not address the source
of the sediment within each of the river basins.
We take an alternative conceptual approach to mod-
elling river basin sediment exports, which can also be
used to predict the sources of sediment within each
basin. This approach models spatially-distributed sedi-
ment budgets of the primary erosion and depositionprocesses. We map patterns of hillslope, gully, and river-
bank erosion and sediment deposition on floodplains,
riverbeds and in reservoirs across the GBR catchment,
and use them to construct a mean annual mass balance
for each link of the river network. Each of the erosion
and deposition processes is mapped from the primary
controlling environmental factors using empirical and
conceptual models. The environmental factors includethe effects of terrain, rainfall characteristics, soil proper-
ties, land use, and hydrology. The sediment budget
model is called SedNet (Sediment River Network Model;
Prosser et al., 2001b).
The guiding concept behind the budgets is that sus-
pended sediment transport is supply limited. That is,
the amount and pattern of mean annual suspended load
is determined by the supply to rivers from erosionsources, as has been widely inferred from measured
loads and concentrations (Olive and Walker, 1982; Wil-
liams, 1989). High rates of erosion will lead to high sedi-
ment concentrations and low rates will lead to low
concentrations. The approach contrasts with hydrologi-
cal modelling, based directly on gauging data, which
typically assumes that sediment concentrations are con-
stant between basins and can be extrapolated from onecatchment to another, so that load is proportional to
discharge. This implicitly assumes that suspended sedi-
ment transport is limited by transport capacity of the
discharge not supply of sediment.
Field and geochemical tracer sediment budgets sug-
gest that there are several sources of sediment contribut-
ing to coastal exports. Riverbank and gully erosion,
accelerated by changes in land use, can be the predomi-nant source of sediment across a range of environments
(Wallbrink et al., 1998; Prosser et al., 2001b; Poesen
et al., 2003). This is not always acknowledged in catch-
ment erosion modelling which often focuses purely on
soil erosion by surface wash processes. Comparisons
of catchment erosion rates with river sediment loads
(Walling, 1983) show that in large rivers much of the
sediment is deposited on floodplains (Dunne et al.,1998), riverbeds (Trimble, 1981) and in reservoirs and
does not contribute to coastal exports. Patterns of
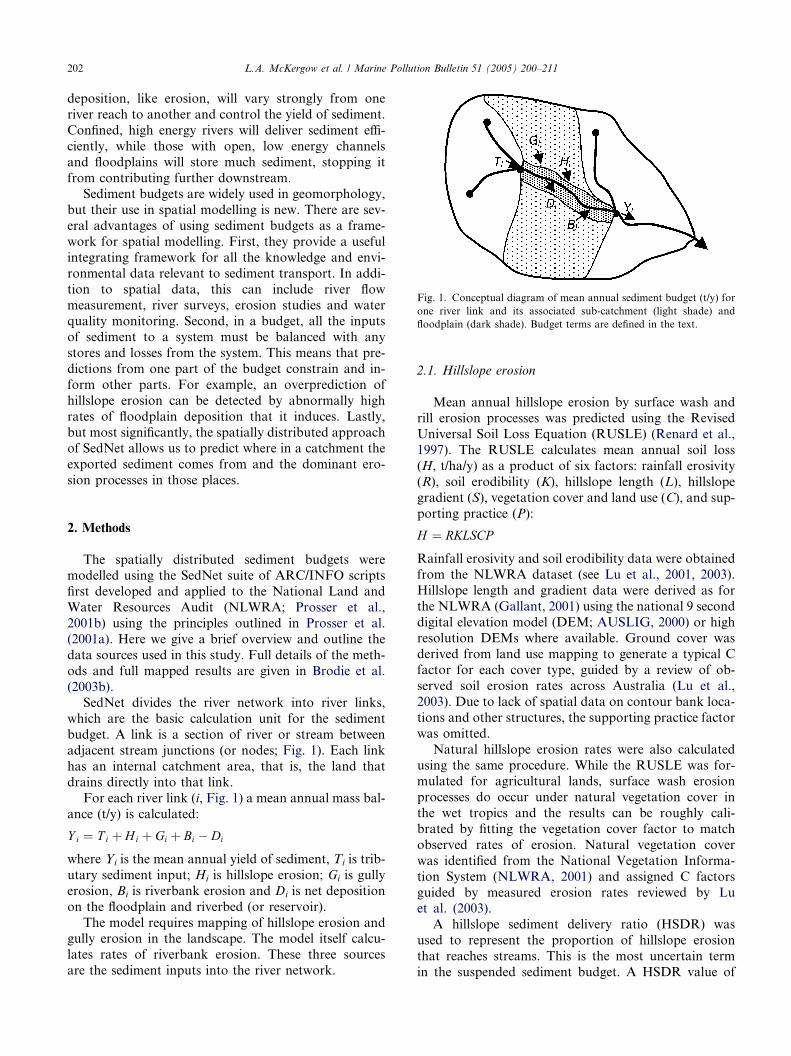
Fig. 1. Conceptual diagram of mean annual sediment budget (t/y) for
one river link and its associated sub-catchment (light shade) and
floodplain (dark shade). Budget terms are defined in the text.
202 L.A. McKergow et al. / Marine Pollution Bulletin 51 (2005) 200–211
deposition, like erosion, will vary strongly from one
river reach to another and control the yield of sediment.
Confined, high energy rivers will deliver sediment effi-
ciently, while those with open, low energy channels
and floodplains will store much sediment, stopping it
from contributing further downstream.Sediment budgets are widely used in geomorphology,
but their use in spatial modelling is new. There are sev-
eral advantages of using sediment budgets as a frame-
work for spatial modelling. First, they provide a useful
integrating framework for all the knowledge and envi-
ronmental data relevant to sediment transport. In addi-
tion to spatial data, this can include river flow
measurement, river surveys, erosion studies and waterquality monitoring. Second, in a budget, all the inputs
of sediment to a system must be balanced with any
stores and losses from the system. This means that pre-
dictions from one part of the budget constrain and in-
form other parts. For example, an overprediction of
hillslope erosion can be detected by abnormally high
rates of floodplain deposition that it induces. Lastly,
but most significantly, the spatially distributed approachof SedNet allows us to predict where in a catchment the
exported sediment comes from and the dominant ero-
sion processes in those places.
2. Methods
The spatially distributed sediment budgets weremodelled using the SedNet suite of ARC/INFO scripts
first developed and applied to the National Land and
Water Resources Audit (NLWRA; Prosser et al.,
2001b) using the principles outlined in Prosser et al.
(2001a). Here we give a brief overview and outline the
data sources used in this study. Full details of the meth-
ods and full mapped results are given in Brodie et al.
(2003b).SedNet divides the river network into river links,
which are the basic calculation unit for the sediment
budget. A link is a section of river or stream between
adjacent stream junctions (or nodes; Fig. 1). Each link
has an internal catchment area, that is, the land that
drains directly into that link.
For each river link (i, Fig. 1) a mean annual mass bal-
ance (t/y) is calculated:
Y i ¼ T i þ Hi þ Gi þ Bi � Di
where Yi is the mean annual yield of sediment, Ti is trib-
utary sediment input; Hi is hillslope erosion; Gi is gully
erosion, Bi is riverbank erosion and Di is net deposition
on the floodplain and riverbed (or reservoir).
The model requires mapping of hillslope erosion andgully erosion in the landscape. The model itself calcu-
lates rates of riverbank erosion. These three sources
are the sediment inputs into the river network.
2.1. Hillslope erosion
Mean annual hillslope erosion by surface wash andrill erosion processes was predicted using the Revised
Universal Soil Loss Equation (RUSLE) (Renard et al.,
1997). The RUSLE calculates mean annual soil loss
(H, t/ha/y) as a product of six factors: rainfall erosivity
(R), soil erodibility (K), hillslope length (L), hillslope
gradient (S), vegetation cover and land use (C), and sup-
porting practice (P):
H ¼ RKLSCP
Rainfall erosivity and soil erodibility data were obtained
from the NLWRA dataset (see Lu et al., 2001, 2003).
Hillslope length and gradient data were derived as for
the NLWRA (Gallant, 2001) using the national 9 second
digital elevation model (DEM; AUSLIG, 2000) or high
resolution DEMs where available. Ground cover wasderived from land use mapping to generate a typical C
factor for each cover type, guided by a review of ob-
served soil erosion rates across Australia (Lu et al.,
2003). Due to lack of spatial data on contour bank loca-
tions and other structures, the supporting practice factor
was omitted.
Natural hillslope erosion rates were also calculated
using the same procedure. While the RUSLE was for-mulated for agricultural lands, surface wash erosion
processes do occur under natural vegetation cover in
the wet tropics and the results can be roughly cali-
brated by fitting the vegetation cover factor to match
observed rates of erosion. Natural vegetation cover
was identified from the National Vegetation Informa-
tion System (NLWRA, 2001) and assigned C factors
guided by measured erosion rates reviewed by Luet al. (2003).
A hillslope sediment delivery ratio (HSDR) was
used to represent the proportion of hillslope erosion
that reaches streams. This is the most uncertain term
in the suspended sediment budget. A HSDR value of
L.A. McKergow et al. / Marine Pollution Bulletin 51 (2005) 200–211 203
10% produced results consistent with measured sedi-
ment loads, the dominance of channel over hillslope
erosion in some areas (Wallbrink et al., 1998) and ob-
served floodplain deposition rates (Prosser et al.,
2001a).
2.2. Gully and riverbank erosion
Gully erosion was derived from the NLWRA gully
erosion database (Hughes et al., 2001). The NLWRA
gully density model was constructed by explaining the
variability in gully density (km/km2), mapped from aer-
ial photographs, using various environmental variables
such as land use, soil texture, geology, relief and climaticindices in a geostatistical model (Hughes et al., 2001).
Gully density was converted to a mean annual rate of
erosion using typical values for gully age (100 y) and
cross sectional area (10 m2) to produce the average sedi-
ment yield required to excavate a gully. The typical age
and cross-section are based on field experience and pub-
lished research e.g. Prosser and Winchester (1996). Gul-
lies are new incised channels resulting from vegetationdisturbance so the natural sediment budget assumed
no sediment supply from gullies.
Riverbank erosion was estimated from a conceptual
relationship based on limited data (Hughes and Prosser,
2003). It is assumed that the potential bank erosion rate
is proportional to stream power but that the actual rate
of erosion is reduced by riparian vegetation and the pro-
portion of non-alluvial material in the banks, mappedfrom floodplain width. Riparian vegetation cover data
was obtained from the State of the Rivers (DNR,
1996–1999) or the Australian Land Cover Change Pro-
ject (Barson et al., 2000). Natural bank erosion was pre-
dicted from the same relationship using 95% riparian
cover.
2.3. River sediment loads
Sediment sources are divided into separate budgets
for suspended and bedload transport, reflecting the sep-
arate transport processes. Hillslope and half of gully and
riverbank erosion are the inputs to the suspended load
budget. The remaining gully and riverbank erosion con-
tribute to the bedload budget. This separation is based
upon observations from detailed field based sedimentbudgets (e.g. Dietrich and Dunne, 1978) and from parti-
cle size analysis of bank sediments which typically con-
tain 50% of coarse sand and larger particles.
For each link suspended load can be lost to flood-
plain or reservoir deposition. There is no net suspended
sediment deposition on riverbeds. Floodplain deposition
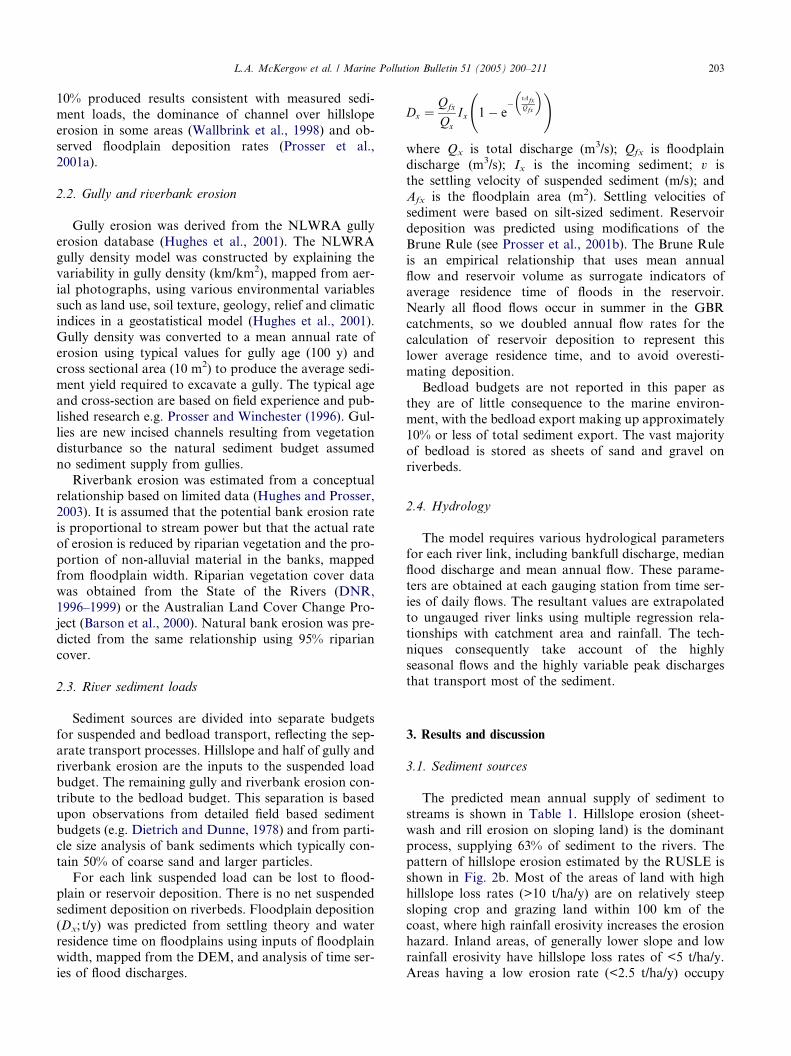
(Dx; t/y) was predicted from settling theory and water
residence time on floodplains using inputs of floodplainwidth, mapped from the DEM, and analysis of time ser-
ies of flood discharges.
Dx ¼Qfx
Qx
Ix 1 � e�
vAfxQfx
� � !
where Qx is total discharge (m3/s); Qfx is floodplaindischarge (m3/s); Ix is the incoming sediment; v is
the settling velocity of suspended sediment (m/s); and
Afx is the floodplain area (m2). Settling velocities of
sediment were based on silt-sized sediment. Reservoir
deposition was predicted using modifications of the
Brune Rule (see Prosser et al., 2001b). The Brune Rule
is an empirical relationship that uses mean annual
flow and reservoir volume as surrogate indicators ofaverage residence time of floods in the reservoir.
Nearly all flood flows occur in summer in the GBR
catchments, so we doubled annual flow rates for the
calculation of reservoir deposition to represent this
lower average residence time, and to avoid overesti-
mating deposition.
Bedload budgets are not reported in this paper as
they are of little consequence to the marine environ-ment, with the bedload export making up approximately
10% or less of total sediment export. The vast majority
of bedload is stored as sheets of sand and gravel on
riverbeds.
2.4. Hydrology
The model requires various hydrological parametersfor each river link, including bankfull discharge, median
flood discharge and mean annual flow. These parame-
ters are obtained at each gauging station from time ser-
ies of daily flows. The resultant values are extrapolated
to ungauged river links using multiple regression rela-
tionships with catchment area and rainfall. The tech-
niques consequently take account of the highly
seasonal flows and the highly variable peak dischargesthat transport most of the sediment.
3. Results and discussion
3.1. Sediment sources
The predicted mean annual supply of sediment tostreams is shown in Table 1. Hillslope erosion (sheet-
wash and rill erosion on sloping land) is the dominant
process, supplying 63% of sediment to the rivers. The
pattern of hillslope erosion estimated by the RUSLE is
shown in Fig. 2b. Most of the areas of land with high
hillslope loss rates (>10 t/ha/y) are on relatively steep
sloping crop and grazing land within 100 km of the
coast, where high rainfall erosivity increases the erosionhazard. Inland areas, of generally lower slope and low
rainfall erosivity have hillslope loss rates of <5 t/ha/y.
Areas having a low erosion rate (<2.5 t/ha/y) occupy
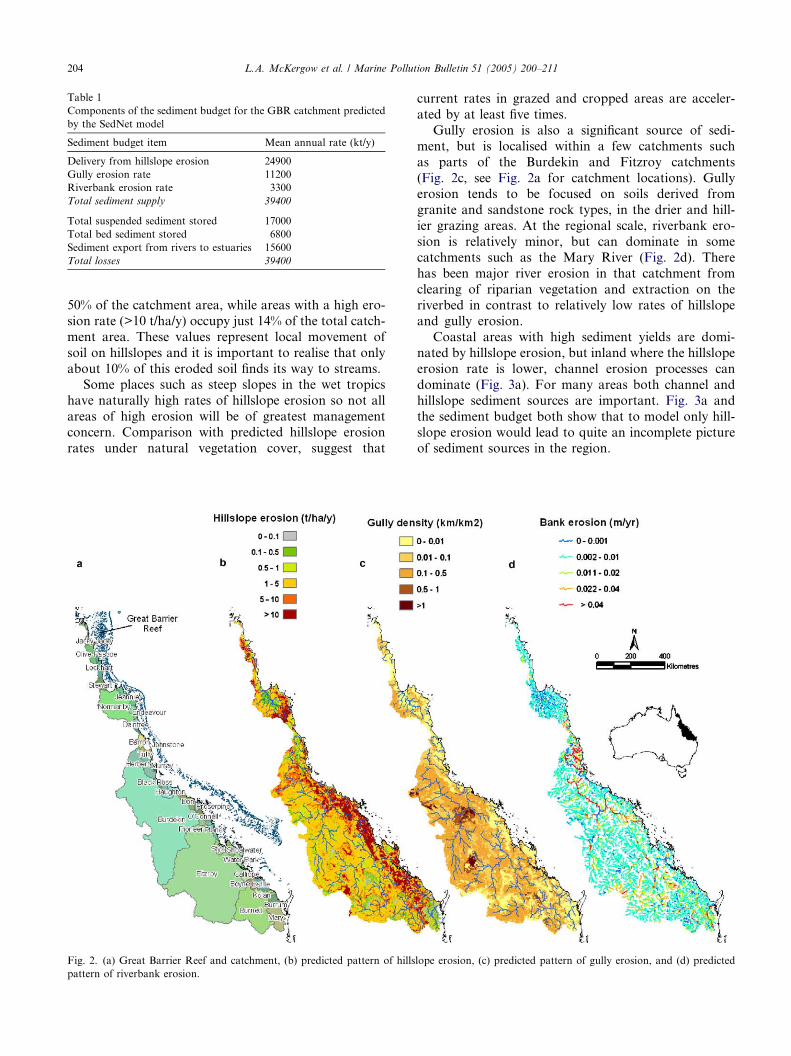
Table 1
Components of the sediment budget for the GBR catchment predicted
by the SedNet model
Sediment budget item Mean annual rate (kt/y)
Delivery from hillslope erosion 24900
Gully erosion rate 11200
Riverbank erosion rate 3300
Total sediment supply 39400
Total suspended sediment stored 17000
Total bed sediment stored 6800
Sediment export from rivers to estuaries 15600
Total losses 39400
204 L.A. McKergow et al. / Marine Pollution Bulletin 51 (2005) 200–211
50% of the catchment area, while areas with a high ero-
sion rate (>10 t/ha/y) occupy just 14% of the total catch-
ment area. These values represent local movement of
soil on hillslopes and it is important to realise that only
about 10% of this eroded soil finds its way to streams.Some places such as steep slopes in the wet tropics
have naturally high rates of hillslope erosion so not all
areas of high erosion will be of greatest management
concern. Comparison with predicted hillslope erosion
rates under natural vegetation cover, suggest that
Fig. 2. (a) Great Barrier Reef and catchment, (b) predicted pattern of hills
pattern of riverbank erosion.
current rates in grazed and cropped areas are acceler-
ated by at least five times.
Gully erosion is also a significant source of sedi-
ment, but is localised within a few catchments such
as parts of the Burdekin and Fitzroy catchments
(Fig. 2c, see Fig. 2a for catchment locations). Gullyerosion tends to be focused on soils derived from
granite and sandstone rock types, in the drier and hill-
ier grazing areas. At the regional scale, riverbank ero-
sion is relatively minor, but can dominate in some
catchments such as the Mary River (Fig. 2d). There
has been major river erosion in that catchment from
clearing of riparian vegetation and extraction on the
riverbed in contrast to relatively low rates of hillslopeand gully erosion.
Coastal areas with high sediment yields are domi-
nated by hillslope erosion, but inland where the hillslope
erosion rate is lower, channel erosion processes can
dominate (Fig. 3a). For many areas both channel and
hillslope sediment sources are important. Fig. 3a and
the sediment budget both show that to model only hill-
slope erosion would lead to quite an incomplete pictureof sediment sources in the region.
lope erosion, (c) predicted pattern of gully erosion, and (d) predicted
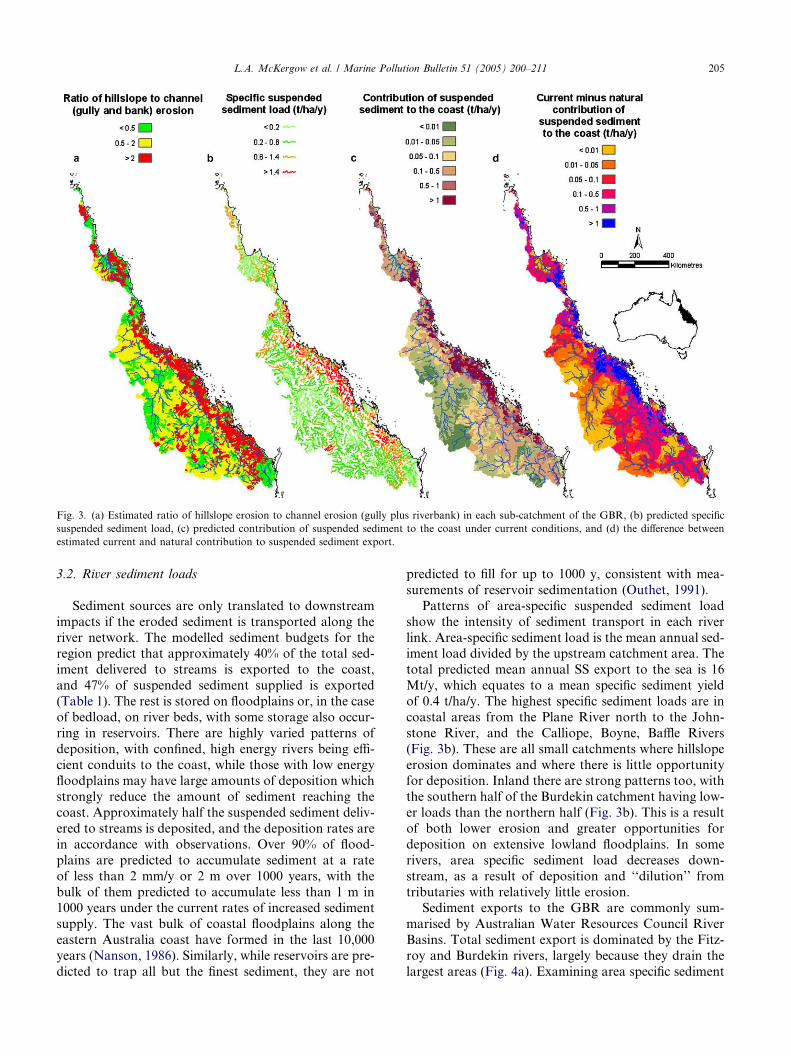
Fig. 3. (a) Estimated ratio of hillslope erosion to channel erosion (gully plus riverbank) in each sub-catchment of the GBR, (b) predicted specific
suspended sediment load, (c) predicted contribution of suspended sediment to the coast under current conditions, and (d) the difference between
estimated current and natural contribution to suspended sediment export.
L.A. McKergow et al. / Marine Pollution Bulletin 51 (2005) 200–211 205
3.2. River sediment loads
Sediment sources are only translated to downstream
impacts if the eroded sediment is transported along the
river network. The modelled sediment budgets for theregion predict that approximately 40% of the total sed-
iment delivered to streams is exported to the coast,
and 47% of suspended sediment supplied is exported
(Table 1). The rest is stored on floodplains or, in the case
of bedload, on river beds, with some storage also occur-
ring in reservoirs. There are highly varied patterns of
deposition, with confined, high energy rivers being effi-
cient conduits to the coast, while those with low energyfloodplains may have large amounts of deposition which
strongly reduce the amount of sediment reaching the
coast. Approximately half the suspended sediment deliv-
ered to streams is deposited, and the deposition rates are
in accordance with observations. Over 90% of flood-
plains are predicted to accumulate sediment at a rate
of less than 2 mm/y or 2 m over 1000 years, with the
bulk of them predicted to accumulate less than 1 m in1000 years under the current rates of increased sediment
supply. The vast bulk of coastal floodplains along the
eastern Australia coast have formed in the last 10,000
years (Nanson, 1986). Similarly, while reservoirs are pre-
dicted to trap all but the finest sediment, they are not
predicted to fill for up to 1000 y, consistent with mea-
surements of reservoir sedimentation (Outhet, 1991).
Patterns of area-specific suspended sediment load
show the intensity of sediment transport in each river
link. Area-specific sediment load is the mean annual sed-iment load divided by the upstream catchment area. The
total predicted mean annual SS export to the sea is 16
Mt/y, which equates to a mean specific sediment yield
of 0.4 t/ha/y. The highest specific sediment loads are in
coastal areas from the Plane River north to the John-
stone River, and the Calliope, Boyne, Baffle Rivers
(Fig. 3b). These are all small catchments where hillslope
erosion dominates and where there is little opportunityfor deposition. Inland there are strong patterns too, with
the southern half of the Burdekin catchment having low-
er loads than the northern half (Fig. 3b). This is a result
of both lower erosion and greater opportunities for
deposition on extensive lowland floodplains. In some
rivers, area specific sediment load decreases down-
stream, as a result of deposition and ‘‘dilution’’ from
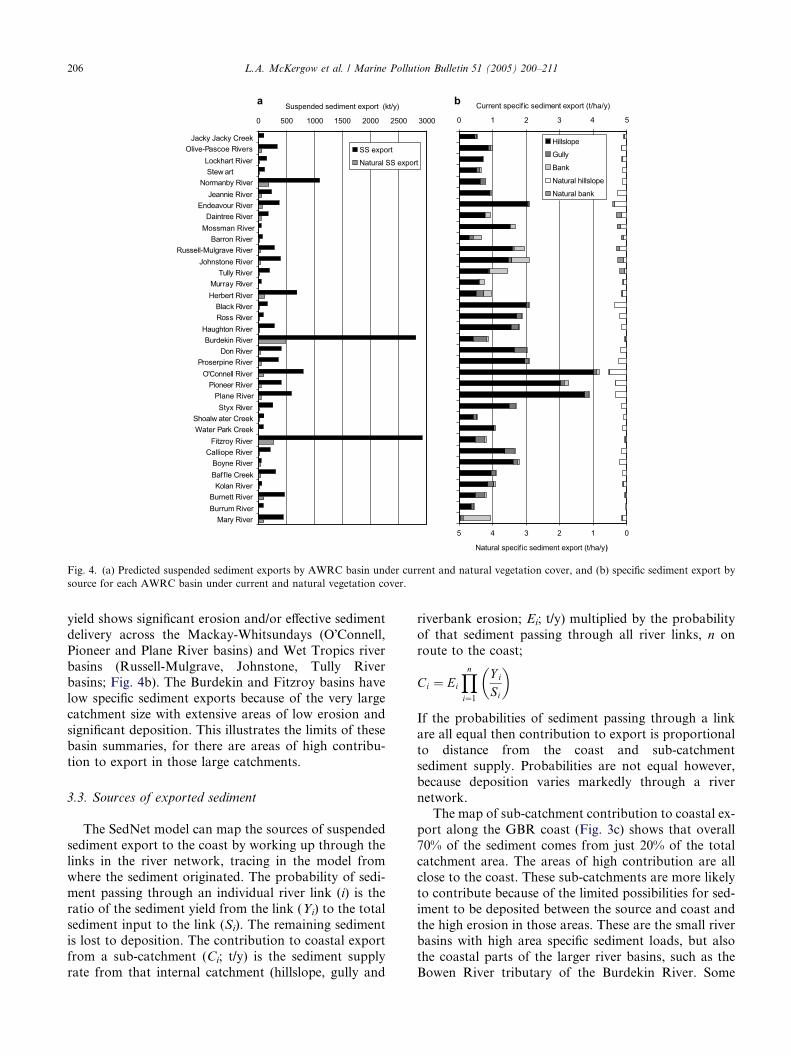
tributaries with relatively little erosion.Sediment exports to the GBR are commonly sum-
marised by Australian Water Resources Council River
Basins. Total sediment export is dominated by the Fitz-
roy and Burdekin rivers, largely because they drain the
largest areas (Fig. 4a). Examining area specific sediment
0 1 2 3
Current specif ic sediment export (t/ha/y)
012345
Natural specif ic sediment export (t/ha/y)
Hillslope
Gully
Bank
Natural hillslope
Natural bank
0 500 1000 1500 2000 2500 3000
Jacky Jacky CreekOlive-Pascoe Rivers
Lockhart RiverStew art
Normanby RiverJeannie River
Endeavour RiverDaintree River
Mossman RiverBarron River
Russell-Mulgrave RiverJohnstone River
Tully RiverMurray RiverHerbert River
Black RiverRoss River
Haughton RiverBurdekin River
Don RiverProserpine River
O'Connell RiverPioneer River
Plane RiverStyx River
Shoalw ater CreekWater Park Creek
Fitzroy RiverCalliope River
Boyne RiverBaff le CreekKolan River
Burnett RiverBurrum River
Mary River
Suspended sediment export (kt/y)
SS export
Natural SS export
a b4 5
Fig. 4. (a) Predicted suspended sediment exports by AWRC basin under current and natural vegetation cover, and (b) specific sediment export by
source for each AWRC basin under current and natural vegetation cover.
206 L.A. McKergow et al. / Marine Pollution Bulletin 51 (2005) 200–211
yield shows significant erosion and/or effective sediment
delivery across the Mackay-Whitsundays (O�Connell,
Pioneer and Plane River basins) and Wet Tropics river
basins (Russell-Mulgrave, Johnstone, Tully Riverbasins; Fig. 4b). The Burdekin and Fitzroy basins have
low specific sediment exports because of the very large
catchment size with extensive areas of low erosion and
significant deposition. This illustrates the limits of these
basin summaries, for there are areas of high contribu-
tion to export in those large catchments.
3.3. Sources of exported sediment
The SedNet model can map the sources of suspended
sediment export to the coast by working up through the
links in the river network, tracing in the model from
where the sediment originated. The probability of sedi-
ment passing through an individual river link (i) is the
ratio of the sediment yield from the link (Yi) to the total
sediment input to the link (Si). The remaining sedimentis lost to deposition. The contribution to coastal export
from a sub-catchment (Ci; t/y) is the sediment supply
rate from that internal catchment (hillslope, gully and
riverbank erosion; Ei; t/y) multiplied by the probability
of that sediment passing through all river links, n on
route to the coast;
Ci ¼ Ei
Yni¼1
Y i
Si
� �
If the probabilities of sediment passing through a link
are all equal then contribution to export is proportional
to distance from the coast and sub-catchment
sediment supply. Probabilities are not equal however,
because deposition varies markedly through a river
network.The map of sub-catchment contribution to coastal ex-
port along the GBR coast (Fig. 3c) shows that overall
70% of the sediment comes from just 20% of the total
catchment area. The areas of high contribution are all
close to the coast. These sub-catchments are more likely
to contribute because of the limited possibilities for sed-
iment to be deposited between the source and coast and
the high erosion in those areas. These are the small riverbasins with high area specific sediment loads, but also
the coastal parts of the larger river basins, such as the
Bowen River tributary of the Burdekin River. Some
0 1000 2000 3000 4000
Jacky Jacky CreekOlive-Pascoe Rivers
Lockhart RiverStewart River
Normanby RiverJeannie River
Endeavour RiverDaintree River
Mossman RiverBarron River
Russell-Mulgrave RiverJohnstone River
Tully RiverMurray RiverHerbert River
Black River
Suspended sediment export (kt/y)
SS export
Furnas (2003) SS export
L.A. McKergow et al. / Marine Pollution Bulletin 51 (2005) 200–211 207
inland areas are moderate contributors of sediment to
the coast, while others have low delivery potential.
Identification of areas contributing large quantities of
sediment to the coast must be placed in the context of
natural sediment contributions that occur under natural
vegetation cover and runoff. Almost all areas of currenthigh contribution of sediment export have rates well
above the predicted natural contribution (Fig. 3d).
Some moderate contributions, such as north of the
Endeavour basin, are largely natural sources.
Areas of unnaturally high contribution of sediment to
the coast are where management to reduce erosion can
most effectively reduce impact on the marine environ-
ment. The mapping of sediment sources identifies thetype of erosion that is most responsible for sediment ex-
port from each contributing sub-catchment.
Overall the results show a highly skewed distribution
of contributions to export. This suggests that the aims of
the RWQPP (Anon, 2003) are achievable with the lim-
ited resources available if rehabilitation efforts are fo-
cussed on the areas that have a significantly
accelerated contribution to export. This is a much moremanageable problem than tackling erosion across the
whole 423,000 km2 catchment area to the GBR. It is
only by mapping the terms of the sediment budget, that
the contributing sources can be identified.
3.4. Comparison of exports to other studies
Previously published estimates of mean annual sedi-ment export vary between 10 and 30 Mt/y (Table 2;
excluding Furnas and Mitchell, 2001). This illustrates
the uncertainties involved in all prediction methods.
There is little difference between the estimate of Furnas
(2003), based on the most comprehensive monitoring,
and the current SedNet results, considering the consider-
able uncertainties in both methods, and high variability
from one river basin to another. The estimate from thisproject is approximately 20% higher than that produced
for the NLWRA, using essentially the same model, dem-
Table 2
Comparison of previously modelled estimates of current and 1850
suspended sediment loads to the GBR lagoon with the current
modelling
Model Current sediment
(Mt/y)
1850 sediment
(Mt/y)
Belperio (1983) 27.4
Moss et al. (1992) 15.3 3.8
Neil and Yu (1996) 28.0 7.4
Furnas and Mitchell (2001) 3.3–66
Brodie and Furnas (2003) 14.4 4.0
Furnas (2003) 14.4 4.4
NLWRA (Prosser
et al., 2001b)
13.6
Current model 16 2
onstrating the uncertainties produced by the quality of
input data that is available.
The assessment for this project predicts an eightfold
increase in current sediment loads above natural rates,
whereas most other studies that have attempted to assess
this have predicted increases of approximately fourfold.Until recently all estimates of increases relative to natu-
ral load have been highly speculative and untested.
Now, isotope studies of coral cores put historical river
loads in a firmer long-term context. Corals beyond the
mouth of the Burdekin River record a 5–10 times in-
crease in sediment loads in historical times (McCulloch
et al., 2003) similar to the sixfold increase predicted by
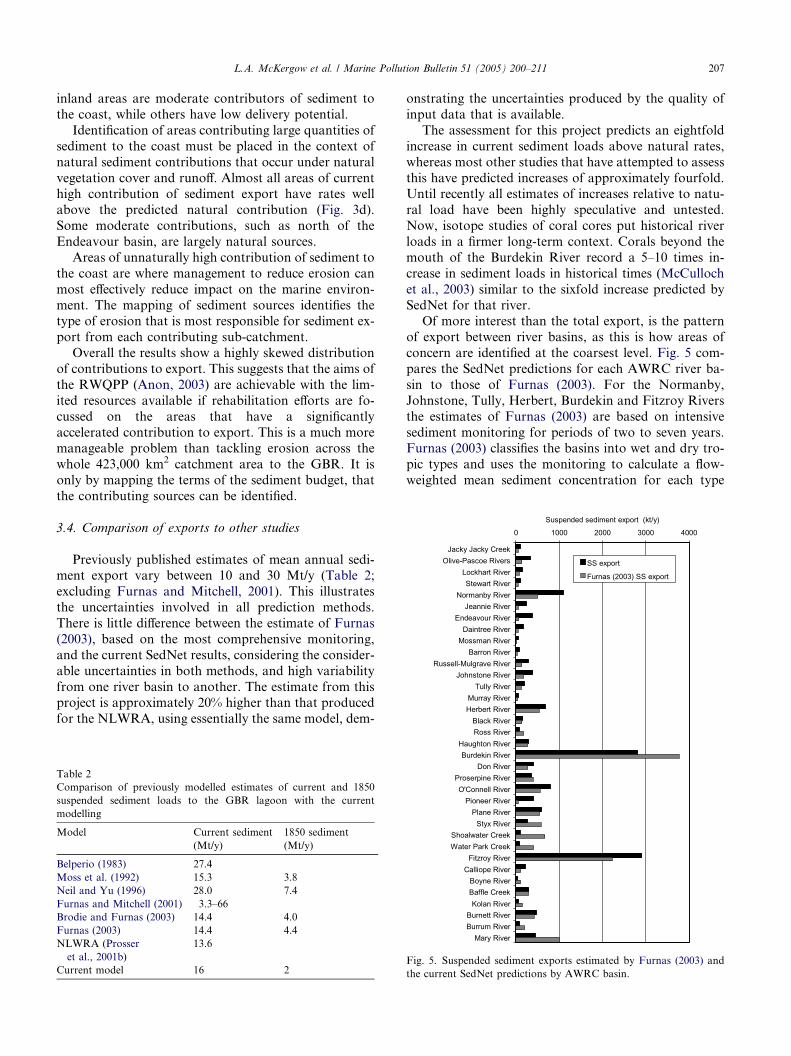
SedNet for that river.Of more interest than the total export, is the pattern
of export between river basins, as this is how areas of
concern are identified at the coarsest level. Fig. 5 com-
pares the SedNet predictions for each AWRC river ba-
sin to those of Furnas (2003). For the Normanby,
Johnstone, Tully, Herbert, Burdekin and Fitzroy Rivers
the estimates of Furnas (2003) are based on intensive
sediment monitoring for periods of two to seven years.Furnas (2003) classifies the basins into wet and dry tro-
pic types and uses the monitoring to calculate a flow-
weighted mean sediment concentration for each type
Ross RiverHaughton RiverBurdekin River
Don RiverProserpine RiverO'Connell River
Pioneer RiverPlane River
Styx RiverShoalwater CreekWater Park Creek
Fitzroy RiverCalliope River
Boyne RiverBaffle CreekKolan River
Burnett RiverBurrum River
Mary River
Fig. 5. Suspended sediment exports estimated by Furnas (2003) and
the current SedNet predictions by AWRC basin.
208 L.A. McKergow et al. / Marine Pollution Bulletin 51 (2005) 200–211
of river. Loads in ungauged basins are then predicted
from the mean concentration multiplied by mean annual
discharge. The monitoring data does not include signif-
icant parts of the AWRC basin for the Normanby,
Johnstone and Herbert, so Furnas (2003) scales the
basin exports to include the unmonitored area.Overall, there is relatively close agreement between
SedNet and the more direct extrapolation of data by
Furnas (2003). There are important differences between
the two techniques however. For example, Furnas
(2003) predicts that the Fitzroy River yields less sedi-
ment than the Burdekin River because it has a lower
mean annual flow. In contrast we predict a higher sedi-
ment yield because of the greater amount of erosion inthe catchment from more intensive land use and less
extensive floodplains than in the southern Burdekin in
particular. The Johnstone River is another area of differ-
ence, where SedNet predicts that the unmonitored part
of the basin has more intensive erosion, because of
highly erodible soils, than the monitored river. Our re-
sults in the monitored river agree well with the monitor-
ing of Hunter and Walton (unpublished data). One ofthe largest differences between the two techniques is
for the Normanby River, where monitoring has not in-
cluded major floods but where the land use is not very
intense, possibly leading to an overestimate from the
SedNet model.
While such basin summaries are useful, many of the
catchments are large and more detailed spatial informa-
tion is needed to effectively target available funding.SedNet can provide this information. There is a need,
however, to independently verify the spatial patterns
of the model outcomes, not just the river exports. This
has not been achieved for the GBR catchments, but Sed-
Net has been applied to three catchments in other parts
of Australia where geochemical tracing provides inde-
pendent evidence of source areas and processes of ero-
sion (e.g. Caitcheon et al., 2001; Olley et al., 2003;Wallbrink et al., 2003). In each case there is qualitative
agreement of the dominant sediment source, in terms of
particular sub-catchments and erosion processes.
3.5. Limitations of the modelling
The major limitations of the sediment budget ap-
proach are in our understanding of erosion and deposi-tion processes at the large scale, and the availability of
data to describe the patterns of those processes. SedNet
is based on our current understanding of erosion pro-
cesses, applied to the currently available data across
the region. Several processes are poorly understood at
the large scale, for example, floodplain deposition and
bank erosion. There are no extensive data sets of spatial
patterns in the world, let alone Australia, of either pro-cess. Consequently, constructing empirical rules of the
driving environmental factors on each process, similar
to the RUSLE, is not possible. Thus, for the poorly
known processes we have had to resort to physical rea-
soning. We have tried omitting the poorly understood
terms from the budgets, or aspects of their control, such
as riparian vegetation, but these lead to results that con-
flict with observations. To omit them would be to as-sume that the processes are not significant. We believe
that the poorly defined rules bring more information
than error to the budgets. The detailed spatial patterns
of the sediment budgets remain speculative, and a better
understanding of the most poorly understood erosion
and deposition processes would improve confidence in
the details of the model predictions.
While other transport processes are well described atsmall scales, this knowledge has not been expanded to
larger scales. For example, the limitations of the
RUSLE have been known for a long time. During this
time there has been much research into the mechanics
and modelling of soil erosion (e.g. GUEST: Misra and
Rose, 1996; WEPP: Foster et al., 1995). The improved
process knowledge has not been transferred effectively
to improved large-scale prediction of soil erosion be-cause of a lack of research into functions that relate
the soil and hydrological parameters required in those
models to available spatial information such as land
use and soil type.
SedNet suffers from similar disadvantages to some
degree, relying on intensive interrogation of spatial
and hydrological data. Much of the effort in its applica-
tion is in the data preparation. While the availability ofspatial data has increased in recent years, it is of variable
quality on a regional basis. High resolution datasets are
available for some catchments (e.g. Herbert: Bartley
et al., 2003), but for larger catchments, such as the Burd-
ekin and Fitzroy, quality data is scarce. Better data, as
well as process understanding, and transfer functions
to relate the data to processes, are required for reliable
prediction of detailed spatial patterns. Bank erosion pre-diction would benefit from better information on ripar-
ian condition and channel geometry for example.
An advantage of conceptual models such as SedNet is
that, through sensitivity analysis, they offer a formal
process for identifying the aspects of sediment transport
and the controlling environmental variables that most
matter at the large scale. The aim of SedNet is to encap-
sulate the most critical driving factors as well as possiblewith available knowledge, before moving on to second-
ary influences that refine predictions. At present, the 2 y
flood is set as the discharge that overtops banks and ini-
tiates the possibility for floodplain deposition, but work
is in progress to characterise patterns of channel geom-
etry so that we can vary this factor spatially through
catchments.
Mean annual sediment loads are predicted by SedNetand this resolution is suitable for planning major
changes to land use type and practise. We need to
L.A. McKergow et al. / Marine Pollution Bulletin 51 (2005) 200–211 209
predict the response of sediment transport to the full
range of hydrological conditions because managers are
interested in long-term improvements to water quality
and also because we have no way of predicting hydro-
logical conditions of the next few years. SedNet ap-
proaches this problem by analysing the effects of 100 yof flow conditions in a probabilistic sense. That is, the
mean annual loads include the varying intensity of
processes integrated from low flows up to a 1:100 y
event.
Daily sediment loads may be needed to examine eco-
logical effects of water quality on rivers and estuaries.
We believe this is best achieved by disaggregating the
mean annual loads to a daily record of sediment loadsor concentrations using a rating curve between concen-
tration and flow based upon gauging records (e.g. De-
Rose et al., 2002). While such disaggregations are
speculative beyond gauged conditions and may include
extrapolation to ungauged catchments, we believe that
they are preferable to attempts to model sediment bud-
gets on daily time scales, which is well beyond current
process understanding and data availability. For in-stance, distributed spatial patterns of daily discharge,
let alone erosion, cannot be predicted with any accuracy
in large catchments simply because of inadequate rain-
fall detection at that scale.
4. Conclusions
Spatial sediment budgets, routinely used as a research
tool by geomorphologists, have much to offer for identi-
fying sources of marine sediment pollution. We have ap-
plied the concept of sediment budgets to spatial
modelling so that large areas, such as the GBR catch-
ment, can be assessed relatively easily and repeatably.
Importantly, the technique offers a predictive approach
so that the consequences of future management can bepredicted from changed budget inputs. The modelling
approach of SedNet provides a conceptual basis for
extrapolation of river loads to ungauged catchments
based upon the effect of terrain, climate, hydrology, land
use and soil type on sediment transport processes. While
the technique requires considerable data analysis it has
the advantage of making full use of these data to extrap-
olate patterns rather than more direct use of river gaug-ing data, which often assumes that conditions are the
same between gauged and ungauged basins.
Most significantly, the sediment budgets offer for the
first time a means to identify the sources of exported
sediment across the vast catchment area of the GBR,
complementing the measurements of catchment exports.
The budgets include gully and riverbank erosion, show-
ing that these are locally significant sediment sources, inaddition to hillslope erosion. The inclusion of deposition
processes means that local sub-catchment erosion can be
separated from sediment that is transported all the way
to the coast.
SedNet has been widely used in Australia by catch-
ment managers to help prioritise and focus rehabilita-
tion efforts. The results suggest that 70% of the
suspended sediment discharged to the GBR comes fromonly 20% of the catchment area. The limits to resources
for rehabilitation require that they be focused on the
sediment sources that directly threaten downstream eco-
logical values and other assets, such as the Great Barrier
Reef World Heritage Area. The model results can guide
sub-catchment selection. They can also be used in risk
assessments of threats to the Reef (Brodie et al., 2001;
Devlin et al., 2003; Greiner et al., 2003), and analysesof the costs and benefits of various management ap-
proaches to reducing marine pollution.
Much uncertainty remains, however, in the detailed
pattern of sediment sources because of our limited
understanding of sediment transport processes at the
large scale, the limited resolution of spatial data, and
functions that relate erosion processes to that data.
There is much scope for improved resolution of themodel and for testing of the resulting spatial patterns.
Such improvements are required in order to have confi-
dence in the outcomes that can be achieved from the
considerable investments that are being made to reduce
sediment exports in the region. An analysis to estimate
the likely error range of the export estimates from the
modelling will be important so that the load estimates
can be used more confidently in the water quality targetsetting process now underway across the GBR
catchment.
Acknowledgments
This project was funded by Environment Australia,
through the Natural Heritage Trust. Much of the datawas provided by the Queensland Department of Natural
Resources, Mines and Energy. We also acknowledge the
assistance of Hua Lu (CSIRO Land and Water) for
hillslope erosion analysis, Tristram Miller (CSIRO Land
and Water) for technical support and Miles Furnas
(AIMS) and Heather Hunter (DNRME) for suspended
sediment data for GBR catchment rivers. The construc-
tive comments of two anonymous reviewers are grate-fully acknowledged.
References
Anon., 2003. Reef Water Quality Protection Plan; for catchments
adjacent to the Great Barrier Reef World Heritage Area. Queens-
land Department of Premier and Cabinet, Brisbane. <http://
www.thepremier.qld.gov.au/library/pdf/rwqpp.pdf>.
AUSLIG, 2000. GEODATA 9 Second Digital Elevation Model.
<http://www.auslig.gov.au/products/digidat/dem_9s.htm>.
210 L.A. McKergow et al. / Marine Pollution Bulletin 51 (2005) 200–211
Barson, M.M., Randall, L.A., Bordas, V., 2000. Land cover change
in Australia. Results of the collaborative Bureau of Rural
Sciences—State Agencies� project on remote sensing of land cover
change. Bureau of Rural Sciences, Canberra. <http://www.affa.
gov.au>.
Bartley, R., Henderson, A., Prosser, I.P., Hughes, A.O., McKergow,
L.A., Lu, H., Brodie, J., Bainbridge, Z., Roth, C.H., 2003. Patterns
of erosion and sediment and nutrient transport in the Herbert
River catchment, Queensland. CSIRO Land and Water Consul-
tancy Report. <http://www.clw.csiro.au/publications/consul-
tancy>, August 2003.
Bell, P.R.F., Elmetri, I., 1995. Ecological indicators of large-scale
eutrophication in the Great Barrier Reef lagoon. Ambio 24, 208–
215.
Belperio, A.P., 1983. Terrigenous sedimentation in the central great
barrier reef lagoon: a model from the burdekin region. BMR
Journal of Australian Geology and Geophysics 8 (3), 179–190.
Brodie, J.E., 2002. Keeping the wolf from the door: managing land-
based threats to the Great Barrier Reef. In: Moosa, M.K.K.,
Soemodihardjo, S., Nontji, A., Soegiarto, A., Romimohtarto, K.,
Sukarno, Suharsono. (Eds.), Proceedings of the 9th International
Coral Reef Symposium, Indonesian Institute of Sciences and State
Ministry for Environment, Jakarta, Indonesia, vol. 2, pp. 705–
714.
Brodie, J., Furnas, M.J., 2003. Status of nutrients and sediment inputs
from the Great Barrier Reef catchments and impacts on the reef.
In: Dawson, N., Brodie, J., Rayment, G. (Eds.), Proceedings of the
2nd National Conference on Aquatic Environments: Sustaining
our aquatic environments—Implementing solutions. Queensland
Department of Natural Resources and Mines, Brisbane.
Brodie, J., Mitchell, A., Furnas, M., Haynes, D., Waterhouse, J.,
Ghonim, S., Morris, S., Yorkston, H., Audas, D., 2003a. Devel-
oping catchment pollutant load targets for the protection of the
Great Barrier Reef. In: Dawson, N., Brodie, J., Rayment, G.
(Eds.), Proceedings of the 2nd National Conference on Aquatic
Environments: Sustaining our aquatic environments—Implement-
ing solutions. Queensland Department of Natural Resources and
Mines, Brisbane.
Brodie, J., McKergow, L.A., Prosser, I.P., Furnas, M., Hughes, A.O.,
Hunter, H., 2003b. Sources of sediment and nutrient exports to the
Great Barrier Reef World Heritage Area. Australian Centre for
Tropics Freshwater Research Report No. 03/11, Townsville.
<http://www.actfr.jcu.edu.au/Publications/index.html>.
Brodie, J., Furnas, M., Ghonim, S., Haynes, D., Mitchell, A., Morris,
S., Waterhouse, J., Yorkston, H., Audas, D., Lowe, D., Ryan, M.,
2001. Great barrier reef catchment water quality action plan. Great
Barrier Reef Marine Park Authority, Townsville, p. 116.
Caitcheon, G., Prosser, I., Wallbrink, P., Douglas, G., Olley, J.,
Hughes, A., Hancock, G., Scott, A., 2001. Sediment delivery from
Moreton Bay�s main tributaries: a multifaceted approach to
identifying sediment sources. In: Rutherfurd, I., Sheldon, F.,
Brierley, G., Kenyon, C. (Eds.), The value of healthy streams.
Third Australian Stream Management Conference, Cooperative
Research Centre for Catchment Hydrology, Melbourne, pp. 103–
107.
Devlin, M., Brodie, J., Waterhouse, J., Mitchell, A., Audas, D.,
Haynes, D., 2003. Exposure of Great Barrier Reef inner-shelf reefs
to river-borne contaminants. In: Dawson, N., Brodie, J., Rayment,
G. (Eds.), Proceedings of the 2nd National Conference on Aquatic
Environments: Sustaining our aquatic environments—Implement-
ing solutions. Queensland Department of Natural Resources and
Mines, Brisbane, Australia.
DeRose, R.C., Prosser, I.P., Wilkinson, L.J., Hughes, A.O., Young,
W.J., 2002. Regional patterns of erosion and sediment and nutrient
transport in the Mary River catchment, Queensland. CSIRO Land
and Water Technical Report No. 37/02, Canberra. <http://
www.clw.csiro.au/publications/technical>.
Dietrich, W.E., Dunne, T., 1978. Sediment budget for a small
catchment in mountainous terrain. Zeitschrift fur Geomorphologie
29, 191–206.
DNR, 1996–1999. State of the Rivers Reports. <http://www.nrme.qld.
gov.au/science/state_of_rivers/index.html>.
Dunne, T., Mertes, L.A.K., Meade, R.H., Richey, J.E., Forberg, B.R.,
1998. Exchanges of sediment between the flood plain and channel
of the Amazon River in Brazil. Geological Society of America
Bulletin 110, 450–466.
Fabricius, K.E., De�ath, G., 2004. Identifying ecological change and its
causes: a case study on coral reefs. Ecological Applications 14,
1448–1465.
Foster, G.R., Flanagan, D.C., Nearing, M.A., Lane, L.J., Risse, L.M.,
Finker, S.C., 1995. Hillslope erosion component. In: USDA Water
Erosion Prediction Project Hillslope Profile and Watershed Model
Documentation. NSERL Report 10. NSERL, West Lafayette, Ind.
Furnas, M., 2003. Catchments and Corals: Terrestrial Runoff to the
Great Barrier Reef. Australian Institute of Marine Science and
CRC Reef Research Centre, Townsville, 334 pp.
Furnas, M., Mitchell, A., 2001. Runoff of terrestrial sediment and
nutrients into the Great Barrier Reef World Heritage Area. In:
Wolanski, E. (Ed.), Oceanographic processes of coral reefs:
Physical and biological links in the Great Barrier Reef. CRC
Press, Boca Raton, pp. 37–51.
Gallant, J., 2001. Topographic scaling for the NLWRA sediment
project. Technical Report 27/01, CSIRO Land and Water, Canb-
erra. <http://www.clw.csiro.au/publications/technical>.
Greiner, R., Herr, A., Brodie, J., Haynes, D., Audas, D., Roth, C.,
2003. Profiling and assessment of basins with respect to the
sediment, nutrient and other diffuse-source loads they export to the
Great Barrier Reef WHA. CSIRO Sustainable Ecosystems,
Townsville. <http://www.cse.csiro.au/research/program5/down-
loads/>.
Hughes, A.O., Prosser, I.P., 2003. Gully and riverbank erosion
mapping for the Murray-Darling Basin. Technical Report 03/03,
CSIRO Land and Water, Canberra. <http://www.clw.csiro.au/
publications/technical>.
Hughes, A.O., Prosser, I.P., Stevenson, J., Scott, A., Lu, H., Gallant,
J., Moran, C.J., 2001. Gully density prediction for the intensive
landuse zone of Australia. Technical Report 26/01, CSIRO Land
and Water, Canberra. <http://www.clw.csiro.au/publications/
technical>.
Larcombe, P., Woolfe, K.J., 1999a. Terrigenous sediments as influence
upon Holocene nearshore coral reefs, central Great Barrier Reef,
Australia. Australian Journal of Earth Sciences 46, 141–154.
Larcombe, P., Woolfe, K., 1999b. Increased sediment supply to the
Great Barrier Reef will not increase sediment accumulation at most
coral reefs. Coral Reefs 18, 163–169.
Lu, H., Prosser, I.P., Moran, C.J., Gallant, J., Priestley, G., Stevenson,
J.G., 2003. Predicting sheetwash and rill erosion over the Austra-
lian continent. Australian Journal of Soil Research 41, 1037–1062.
Lu, H., Gallant, J., Prosser, I.P., Moran, C., Priestley, G., 2001.
Prediction of sheet and rill erosion over the Australian Continent,
incorporating monthly soil loss distribution. Technical Report 13/
01, CSIRO Land and Water, Canberra. <http://www.clw.csiro.au/
publications/technical>.
McCulloch, M., Fallon, S., Wyndham, T., Hendy, R., Lough, J.,
Barnes, D., 2003. Coral record of increased sediment flux to the
inner Great Barrier Reef since European settlement. Nature 421,
727–730.
Misra, R.K., Rose, C.W., 1996. Application and sensitivity analysis of
process-based erosion model GUEST. European Journal of Soil
Science 47, 593–604.
Moss, A.J., Rayment, G.E., Reilly, N., Best, E.K., 1992. A preliminary
assessment of sediment and nutrient exports from Queensland
coastal catchments. Department of Environment and Heritage,
Technical Report No. 4, Brisbane, 33 pp.
L.A. McKergow et al. / Marine Pollution Bulletin 51 (2005) 200–211 211
Nanson, G.C., 1986. Episodes of vertical accretion and cata-
strophic stripping: A model of disequilibrium floodplain
development. Geological Society of America Bulletin 97, 1467–
1475.
Neil, D.T., Yu, B., 1996. Fluvial sediment yield to the Great Barrier
Reef lagoon: spatial patterns and the effect of land use. In: Hunter,
H.M., Eyles, A.G., Rayment, G.E. (Eds.), Downstream Effects of
Land Use. Department of Natural Resources, Brisbane, pp. 281–
286.
NLWRA, 2001. National Land and Water Resources Audit. Com-
monwealth of Australia, Canberra, <http://audit.ea.gov.au>.
Olley, J., Young, B., Caitcheon, G., Hughes, A., Prosser, I., Croke, B.,
Beavis, S., Page, D., Wasson, R., 2003. Sediment sources. In: Olley,
J., Deere, D. (Eds.), Targeting rectification action in the Winge-
carribee catchment. CSIRO Land and Water Technical Report 47/
03, Canberra, pp. 25–42. <http://www.clw.csiro.au/publications/
technical>.
Olive, L.J., Walker, P.H., 1982. Processes in overland flow—Erosion
and production of suspended material. In: O�Loughlin, E.M.,
Cullen, P. (Eds.), Prediction in water quality. Australian Academy
of Science, Canberra, pp. 87–119.
Outhet, D.N., 1991. Sedimentation in variable reservoirs, New South
Wales. Macquarie University, Sydney.
Poesen, J., Nachtergaele, J., Verstraeten, G., Valentin, C., 2003. Gully
erosion and environmental change: importance and research needs.
Catena 50, 91–133.
Prosser, I.P., Rutherfurd, I.D., Olley, J.M., Young, W.J., Wallbrink,
P.J., Moran, C.J., 2001a. Large scale patterns of erosion and
sediment transport in river networks, with examples from Austra-
lia. Marine and Freshwater Research 52, 81–99.
Prosser, I.P., Rustomji, P., Young, W.J., Moran, C.J., Hughes, A.,
2001b. Constructing river basin sediment budgets for the National
Land and Water Resources Audit. CSIRO Land and Water
Technical Report 15/01, CSIRO, Canberra. <http://www.clw.csir-
o.au/publications/technical>.
Prosser, I.P., Winchester, S.J., 1996. History and processes of gully
initiation and development in eastern Australia. Zeitschrift fur
Geomorphologie Suppl.-Bd. 105, 91–109.
Rayment, G.E., Neil, D.T., 1997. Sources of material in river
discharge. In: Turia, N., Dalliston, C. (Eds.), The Great Barrier
Reef: science, use and management. Great Barrier Reef Marine
Park Authority, Townsville, Australia, pp. 42–58.
Renard, K.G., Foster, G.A., Weesies, D.K., McCool, D.K., Yoder,
D.C., 1997. Predicting soil erosion by water: A guide to conser-
vation planning with the revised universal soil loss equation.
Agriculture Handbook 703, United States Department of Agricul-
ture, Washington, DC.
Trimble, S.W., 1981. Changes in sediment storage in the Coon Creek
Basin, Driftless area, Wisconsin. Science 241, 181–183.
Wallbrink, P.J., Hancock, G.J., Olley, J.M., Hughes, A.O., Prosser,
I.P., Hunt, D., Rooney, G., Coleman, R., Stevenson, J., 2003. The
Western Port sediment study. CSIRO Land and Water Consul-
tancy Report.
Wallbrink, P.J., Murray, A.S., Olley, J.M., 1998. Determining sources
and transit times of suspended sediment in the Murrumbidgee
River, New South Wales, Australia using 137Cs and 210Pb. Water
Resources Research 34, 879–887.
Walling, D.E., 1983. The sediment delivery problem. Journal of
Hydrology 65, 209–237.
Williams, G.P., 1989. Sediment concentration versus water discharge
during single hydrologic events. Journal of Hydrology 111, 89–106.
Wolanski, E., Duke, N.C., 2002. Mud threat to the Great Barrier Reef
of Australia. In: Healy, T.R., Wang, Y., Healy, J.-A. (Eds.),
Muddy Coasts of the World: Processes, deposits and function.
Elsevier, Netherlands, pp. 533–543.
Wolanski, E., Spagnol, S., 2000. Pollution by mud of Great Barrier
Reef coastal waters. Journal of Coastal Research 16 (4), 1151–
1156.
Wolanski, E., Richmond, R., McCook, L., Sweatman, H., 2003. Mud,
marine snow and coral reefs. American Scientist 91, 44–51.