Embed Size (px)
Citation preview

South Africa
Pretoria
key figures• Land area, thousands of km2 1 221• Population, thousands (2005) 47 432• GDP per capita, $ PPP valuation (2005) 11 470• Life expectancy (2000-2005) 49• Illiteracy rate (2005) 12.9
African Economic Outlook 2005-2006 www.oecd.org/dev/publications/africanoutlook
South AfricaAll tables and graphs in this section are available in Excel format at:
http://dx.doi.org/10.1787/247175636241

African Economic Outlook© AfDB/OECD 2006
461
IN 2005, THE SOUTH AFRICAN economy experiencedGDP growth of 5 per cent, its highest since the end ofapartheid, and strong GDP growth, estimated at 4.8 percent, is forecast for 2006. Although this goodperformance is due in part to a favourable internationalenvironment, it also reflects the sound economic policiesthat have been carried out since 1996 in accordancewith the Growth and Employment and Redistribution(GEAR) strategy. Responsible monetary policy haspaid off in the form of stable inflation, just 4.5 per centin 2004, and low short-term interest rates. Similarly,the government’s conservative fiscal strategy hascontrolled the deficit, which is now expected to amountto only 0.5 per cent of GDP for the 2005/06 fiscal year.These sustained responsible monetary and fiscal policieshave entailed substantial increases in internationalreserves and raised the confidence of foreign investorsin the economy and the rand. Several credit-ratingagencies upgraded South African ratings in 2005,decreasing the cost of capital for South African borrowersby reducing sovereign spreads to historic lows. Thefalling cost of capital and sustained economic growthhave allowed the South African government to increase
development expenditure and easily finance a domesticdemand-driven and widening current-account deficit,which reached 3.3 per cent of GDP in 2004.
Despite this generally positive picture, however,South Africa is stillcharacterised by sharpeconomic dualism. Whilemuch of the whitepopulation and a growingblack middle class benefit from a “first world” economy,large sections of the population still live in poverty. Sofar, the African National Congress (ANC) governmenthas been able to maintain austere macroeconomicpolicies while retaining the support of the black majority.Nevertheless, impatience regarding the unequaldistribution of the benefits of growth appears to bebuilding and could lead to political and social instabilitythat would jeopardise these hard-won macroeconomicachievements.
While growth in the post-apartheid era has beenrespectable and is now accelerating, it has been slow
Growth is picking up and the authorities have unveiled an ambitious Accelerated and Shared Growth Initiative.
0
2000
4000
6000
8000
10000
12000
14000
2007(p)2006(p)2005(e)20042003200220012000199919981997
0
1
2
3
4
5
6
Real GDP Growth (%) Per Capita GDP ($ PPP)
Figure 1 - Real GDP Growth and Per Capita GDP($ PPP at current prices)
Source: IMF and South African Reserve Bank data; estimates (e) and projections (p) based on authors’ calculations.

African Economic Outlook © AfDB/OECD 2006
462
South Africa
in comparison with a number of other emergingeconomies. Moreover, the growth that has occurredhas not substantially reduced the high rate ofunemployment. This poor performance of growth andemployment has resulted from several factors, notablyfrom the lack of domestic and foreign investment, adeficient infrastructure, the lack of competition and theshortage of skilled workers. Accordingly, the governmentis now focusing on these microeconomic impediments,with a goal of 6 per cent growth in the coming years.Taking advantage of the country’s strong fiscal position,President Mbeki plans to unveil an ambitiousAccelerated and Shared Growth Initiative (ASGI) inhis address to the nation in February 2006. The ASGIcalls for reduced taxation, significant investments in theinfrastructure, assistance to strategic economic sectors,and increased resources for education and training.The programme’s success will hinge crucially onimproving the government’s implementation capacityas, in recent years, weaknesses in this area have severelyhindered progress in areas such as infrastructure,education, poverty alleviation and health.
Recent Economic Developments
GDP growth is expected to be in the area of 5 percent in 2005 after reaching 4.5 per cent in 2004, theacceleration in growth being broadly based acrosssectors.
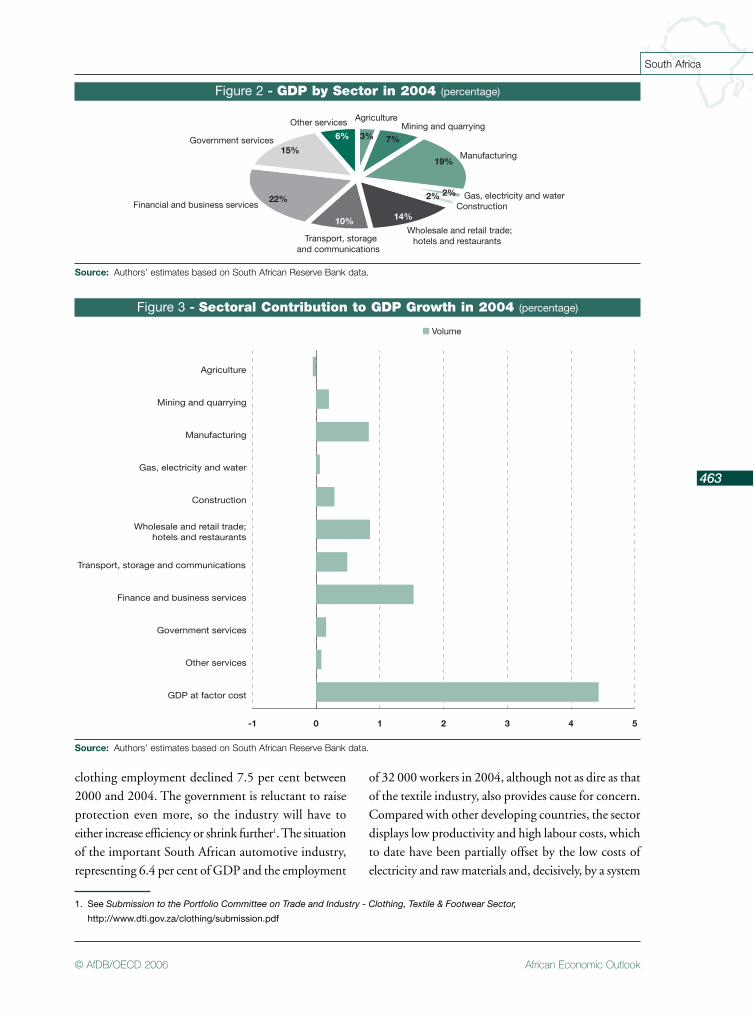
The primary sector, which accounts for 10 per centof GDP, experienced 3.9 per cent growth during thefirst three-quarters of 2005 with respect to the sameperiod in 2004. Agriculture, representing 3 per cent ofGDP, delivered a 4.9 per cent growth rate, largelythanks to a bumper maize crop in 2004/05 and stronglivestock production. The horticulture and fruitindustries also turned in robust performances.Nevertheless, the strong rand and the inadequateinfrastructure affected the agricultural sector adversely.In particular, the surplus maize could not be fullyexported, resulting in a collapse in maize prices andleading many small producers to the brink ofbankruptcy. South Africa’s leading position in exportsof off-season citrus fruits, wine and other produce to
the Northern Hemisphere was also affected by thesefactors. In short, both small-scale farmers and largeexport-oriented agribusiness would benefit fromimproved transport infrastructure and more generally,from a more favourable business climate.
The mining sector, which accounted for 7 per centof GDP in 2004, strongly benefited from vigorousglobal demand and high prices, growing 3.6 per centin the first nine months of 2005. With the notableexception of gold, all major sub-sectors (platinum,copper, nickel, iron ore and steel) have grown at a briskpace. Platinum, in particular, benefited from risingworld prices. Despite rapidly rising prices, gold output,after falling by 21 per cent between 2000 and 2004,shrank a further 12 per cent during the first ninemonths of 2005. This poor performance reflects theexhaustion of easily accessible ore and the impact ofthe strong rand. Nonetheless, the rising rand-denominated prices of gold in late 2005 bode well forgreater future profitability and thus for increasedproduction in 2006, provided that local companiesretain their focus on cost cutting and restructuring.
The secondary sector, accounting for 23 per centof GDP, recorded 4.9 per cent growth during the firstthree-quarters of 2005. The manufacturing sector,which accounts for 19 per cent of GDP, grew 4.6 percent despite the strong rand. In fact, the strength ofthe rand may be a blessing in disguise, insofar as it hasenabled the monetary authorities to maintain lowinterest rates. The Investec Purchasing Managers Index(PMI), a leading indicator of manufacturing activity,posted an overall upward trend in 2005.
Some export-oriented manufacturing sub-sectorsare nonetheless facing difficulties. The textile industryis a case in point. While the strong rand and increasedAsian competition since the end of the Multi-FibreAgreement (MFA) are certainly important local factors,notably labour-market rigidities, also loom large. Despitehigh tariffs – greater than 40 per cent on someproducts – other forms of government assistance inthe course of the last decade and preferential access tothe United States (US) market under the AfricanGrowth and Opportunity Act (AGOA), textile and
African Economic Outlook© AfDB/OECD 2006
463
South Africa
clothing employment declined 7.5 per cent between2000 and 2004. The government is reluctant to raiseprotection even more, so the industry will have toeither increase efficiency or shrink further1. The situationof the important South African automotive industry,representing 6.4 per cent of GDP and the employment
of 32 000 workers in 2004, although not as dire as thatof the textile industry, also provides cause for concern.Compared with other developing countries, the sectordisplays low productivity and high labour costs, whichto date have been partially offset by the low costs ofelectricity and raw materials and, decisively, by a system
Agriculture
Manufacturing
Gas, electricity and water
Wholesale and retail trade;hotels and restaurants
Construction
Government services
Other services
Financial and business services
6%
15%
14%10%
7%
2%2%
19%
3%
22%
Mining and quarrying
Transport, storageand communications
Figure 2 - GDP by Sector in 2004 (percentage)
Source: Authors’ estimates based on South African Reserve Bank data.
-1 0 1 2 3 4 5
GDP at factor cost
Other services
Government services
Finance and business services
Transport, storage and communications
Wholesale and retail trade;hotels and restaurants
Construction
Gas, electricity and water
Manufacturing
Mining and quarrying
Agriculture
Figure 3 - Sectoral Contribution to GDP Growth in 2004 (percentage)
Source: Authors’ estimates based on South African Reserve Bank data.
1. See Submission to the Portfolio Committee on Trade and Industry - Clothing, Textile & Footwear Sector,
http://www.dti.gov.za/clothing/submission.pdf

African Economic Outlook © AfDB/OECD 2006
464
South Africa
of export subsidies and import tariffs afforded by theMotor Industry Development Programme. Exportsubsidies do not, however, appear to be compatiblewith World Trade Organisation (WTO) rules and mayhave to be scaled back, if not completely phased out,intensifying the challenges that the industry is facing.
The construction sector, constituting 2 per cent ofGDP, expanded at a brisk 9.6 per cent rate in the firstthree-quarters of 2005 thanks to a buoyant propertymarket driven by low interest rates, rising householddisposable income and rising public expenditure oninfrastructure.
Tertiary activities, representing 66.1 per cent ofGDP, were those that most benefited from vigorousdomestic demand in 2005 with 5.3 per cent growthin the first three-quarters of the year. The financialindustry led the way, growing at a rate of 8.4 per cent,largely thanks to the expansion of real-estate financeand retail banking supported by the Mzansi bank-accounts initiative, aimed at enlarging the access ofthe poorest to banking services. Real estate, civilengineering (associated to major infrastructure projects),telecommunications (the cell-phone industry inparticular), distribution and transport also expandedstrongly. As well, the South African tourism sectorwithstood the strength of the rand in 2005, with a10 per cent increase in foreign tourists in the first ninemonths of 2005 following the record 6.7 million touristsin 2004. The World Cup in 2010 will provide a furtherimpetus to tourism.
Output growth has been primarily driven by domesticdemand, which increased by 6.5 per cent in 2005. Privateconsumption recorded a strong increase of 6 per cent,while government consumption posted an increase inreal growth of 7.8 per cent. Several factors havecontributed to the rapid pace of private-consumptiongrowth during the last two years. First, the real incomeof households has been increasing, especially for the lesswell-off, who have benefited from rising wages,employment and transfer payments. Nominalremuneration per worker rose by 12.7 per cent year-on-year in the fourth quarter of 2004, while inflationremained around 4 per cent. The March 2005 LabourForce Survey indicates a 6.5 per cent increase in formalemployment between September 2001 and March 2005and a corresponding decline in the official unemploymentrate, from 29.4 per cent to 26.5 per cent in the sameperiod. Second, increased consumer borrowing, drivenby low interest rates and expanded collateral based onrising housing prices, has also increased demand, especiallyamong the emerging black middle class. As a result,household debt rose sharply to 62 per cent of householddisposable income in the second quarter of 2005. Despitethis increase, debt service remains manageable at 6.5 percent of disposable income. Third, the most well-off havealso experienced a wealth effect on consumption, inducedby the strong performance of the Johannesburg StockExchange, which gained 35 per cent between April andSeptember 2005.
This favourable context improved business prospectsand spurred private investment, with the First National
Table 1 - Demand Composition (percentage of GDP)
Source: South African Reserve Bank data; estimates (e) and projections (p) based on authors’ calculations.
1997 2002 2003 2004 2005(e) 2006(p) 2007(p)
Gross capital formation 16.7 16.1 16.6 17.9 18.6 18.4 18.6Public 4.8 4.1 4.3 4.7 4.7 5.2 5.4Private 11.9 12.0 12.2 13.2 13.7 13.2 13.3
Consumption 82.2 80.2 81.5 82.8 80.7 81.2 80.6Public 19.2 18.4 19.1 19.9 20.8 21.3 21.7Private 62.9 61.8 62.3 63.0 59.9 59.9 58.9
External sector 1.2 3.7 1.9 0.7 0.6 0.4 0.7Exports 24.6 32.7 27.9 26.6 26.6 24.5 25.3Imports 23.4 29.1 26.0 27.3 26.0 24.1 24.6

African Economic Outlook© AfDB/OECD 2006
465
South Africa
Bank and Bureau for Economic Research (FNB/BER)Consumer Confidence Index revealing business andconsumer confidence to be surging in 2005. Publicinvestment also rose sharply in 2005, by 8 per cent inreal terms, contributing to a total fixed investmentgrowth of 6.5 per cent. Export volume stagnated, however,with only 0.3 per cent growth, while import volume,boosted by domestic demand, grew by 6 per cent.
In 2006, GDP growth should remain vibrant atabout 4.8 per cent. Private consumption shoulddecelerate to 3.4 per cent growth due to a slower risein labour compensation and housing prices. It isinvestment that is forecasted to take over as the maindriver of growth at 7.6 per cent, boosted by theambitious ASGI investment plans in energy, transport2
and industrial development zones (IDZs). These public-investment projects might in turn catalyse increasedprivate investment. For example, the Coega IDZ isdesigned to host the Coega Smelter Project, which isexpected to produce up to 660 000 tonnes of aluminiumannually after a $2.2 to $2.5 billion investment. Thisproject is the subject of negotiations between the SouthAfrican authorities and the international aluminiumgroup Alcan. A decision is expected in 2006. The CoegaIDZ is intended to be a focal point for other foreigninvestment as well.
Macroeconomic Policies
Fiscal Policy
Unexpectedly strong growth in 2005 is expected tobring down the 2005/06 fiscal deficit to 0.5 per centof GDP instead of the 3.5 per cent of GDP anticipatedin the February 2005 budget. In 2004, the budgetdeficit of 1.5 per cent of GDP also came under thetargeted 3.1 per cent. The decline in the projected2005 deficit was essentially due to unexpected revenuesof ZAR41 billion (South African rands) and debt-service costs that were ZAR1.9 billion less thananticipated, while expenditures were onlyZAR1.2 billion higher than budgeted.
The higher-than-expected revenues originated invalue-added taxes (ZAR9 billion), corporate incometaxes (ZAR16.2 billion), personal income taxes(ZAR8.8 billion), taxes on property transactions(ZAR1.2 billion) and import taxes (ZAR5.8 billion).Although much of this bonanza is attributable to theunexpectedly vigorous economic activity, it also resultedfrom enhanced efficiency in tax collection by the SouthAfrica Revenue Service (SARS) and a broadening of thetax base. Tax revenues rose from 24.5 per cent of GDPin 2000/01 to 26.1 per cent of GDP in 2005/06. Theimproving fiscal situation made room for income-taxrelief for both individuals and companies. In 2006,greater exemptions for medical contributions andemployer-provided health services will provideadditional relief to lower-income taxpayers. The2006/07 budget should also provide substantial relieffor taxpayers through inflation adjustments to taxbrackets.
The government’s sustained fiscal discipline ismanifested in a total gross debt of only 35 per cent ofGDP in 2005. Moreover, 86 per cent of the total stockof public debt is rand-denominated, thus largelyshielding the budget from currency risk. The country’ssound fiscal policies have been recognised in the formof better credit ratings. South Africa’s rating wasupgraded in January by Moody’s from Baa2 to Baa1,and in August by both S&P and Fitch from BBB toBBB+, putting it in the same range as countries suchas Poland, Thailand, Mexico and Chile. South Africanbond spreads have declined correspondingly.
The government’s sound fiscal position providesroom for the greater spending embodied in the ASGI,as well as the previously mentioned tax cuts. The budgetreleased in February 2006 sets out the South Africanfiscal strategy for 2006/07 and revises the MediumTerm Expenditure Framework (MTEF) through2008/09. Based on assumptions of a continued annualaverage GDP growth of 5 per cent and associatedrevenue growth, the MTEF allows for a substantialincrease of expenditures of ZAR160 billion between2005 and 2008. Non-interest expenditure is set to
2. Eskom and Transnet are planning to spend ZAR134 billion in the next five to seven years, 26.1 billion of which in 2006.
African Economic Outlook © AfDB/OECD 2006
466
South Africa
grow approximately 7 per cent a year, increasing as ashare of GDP from 22.8 per cent in 2004 to 24.8 percent in 2007. Between 2005 and 2008, expenditureson social services – including education, health, welfare,housing and community development – are expectedto increase by 36 per cent to ZAR305 billion whileexpenditures on transport and telecommunications areexpected to double during the same period toZAR30 billion.
At the same time, the government is maintaininga prudent fiscal stance. Expenditures on education,health and social security services as a share of GDPwill remain kept in check through 2008/09. Althoughcapital expenditure, notably for infrastructure, is a highpriority for the government and is slated to grow fasterthan current expenditure, the share of capitalexpenditure in total expenditure will remain low,increasing from 4.1 per cent in 2004/05 to only 4.8 percent in 2008/09. Most significantly, public deficits areexpected to average only 2.1 per cent of GDP in thenext three years.
The implementation of ambitious spending plansremains constrained by the limited administrativecapacity of the government, especially at the provincialand municipal levels. Nevertheless, more resources willbe channelled through regional and municipalgovernments, requiring efforts to upgrade their
capacities. The government plans two major efforts toaddress this problem. First, it is to expand the ProjectConsolidate initiative, in which teams of financialexperts as well as project-management and -planningspecialists provide training to local officials. Thisprogramme will be extended to 136 municipalities inthe next three years. Second, municipalities will receiveZAR1.1 billion in capacity-building and restructuringgrants during the same period.
Monetary Policy
The South African Reserve Bank (SARB) maintainsa policy of inflation targeting (IT) aimed at keepinginflation, as measured by the CPIX3, in a range of 3 to6 per cent. Monetary authorities have no officialexchange-rate target, but they nevertheless take intoconsideration potential pass-through effects of currencydepreciation on domestic prices. During 2005, theSARB reduced interest rates once, in April, from 7.5 percent to 7 per cent, but otherwise kept them steady.
Inflation has remained in the SARB’s inflationtarget range since September 2003 and stood at 3.9 percent in 2005. The strong rand largely offset the effectsof rising world oil-price increases on the overall pricelevel, and the CPIX, excluding petrol and diesel, showedlittle change in 2005. Unit labour costs increased at a4.2 per cent annual rate in the first half of 2005
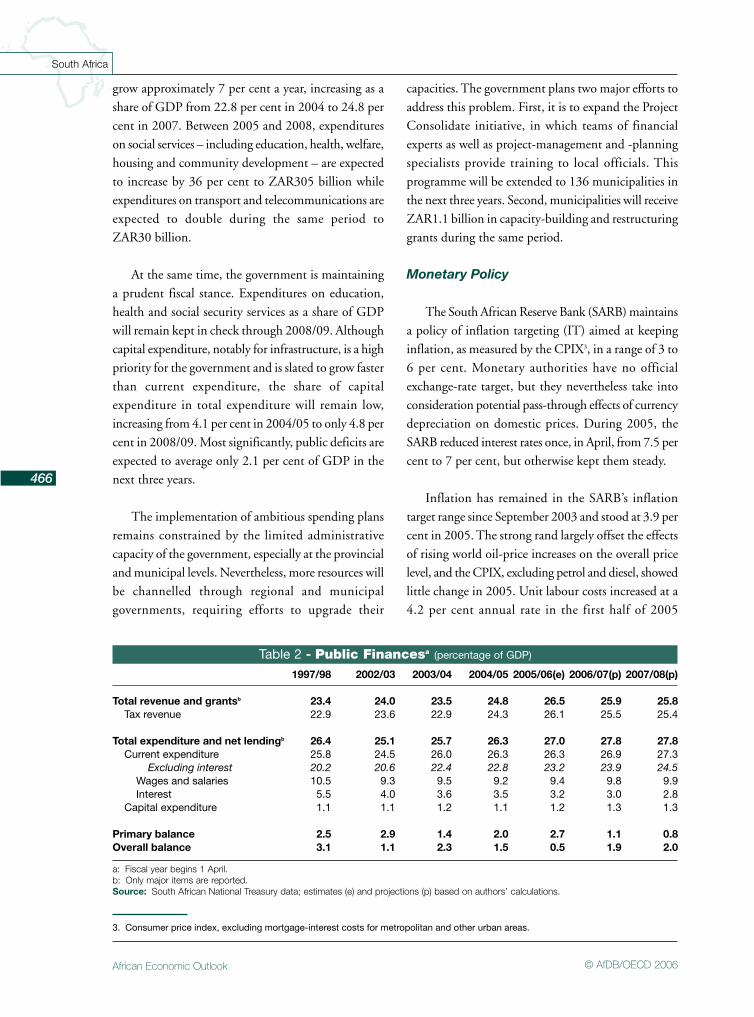
Table 2 - Public Financesa (percentage of GDP)
a: Fiscal year begins 1 April.b: Only major items are reported.Source: South African National Treasury data; estimates (e) and projections (p) based on authors’ calculations.
1997/98 2002/03 2003/04 2004/05 2005/06(e) 2006/07(p) 2007/08(p)
Total revenue and grantsb 23.4 24.0 23.5 24.8 26.5 25.9 25.8Tax revenue 22.9 23.6 22.9 24.3 26.1 25.5 25.4
Total expenditure and net lendingb 26.4 25.1 25.7 26.3 27.0 27.8 27.8Current expenditure 25.8 24.5 26.0 26.3 26.3 26.9 27.3
Excluding interest 20.2 20.6 22.4 22.8 23.2 23.9 24.5Wages and salaries 10.5 9.3 9.5 9.2 9.4 9.8 9.9Interest 5.5 4.0 3.6 3.5 3.2 3.0 2.8
Capital expenditure 1.1 1.1 1.2 1.1 1.2 1.3 1.3
Primary balance 2.5 2.9 1.4 2.0 2.7 1.1 0.8Overall balance 3.1 1.1 2.3 1.5 0.5 1.9 2.0
3. Consumer price index, excluding mortgage-interest costs for metropolitan and other urban areas.

African Economic Outlook© AfDB/OECD 2006
467
South Africa
compared to 7.2 per cent in 2004. Apparently, thecredibility of the SARB’s anti-inflationary monetarypolicy and the strong rand have held down inflationaryexpectations. According to the Bureau of EconomicResearch survey, the expected rate of CPIX inflationis 5.2 per cent in 2006 and 5.4 per cent in 2007, wellwithin the SARB’s target range. Furthermore, capacityutilisation in the manufacturing sector is unchangedfrom 2004 at a moderate 83.9 per cent, providing littleindication of inflationary pressure.
The rand remained largely stable despite a wideningcurrent-account deficit. The currency has beensupported by high commodity prices, upgraded creditratings and capital inflows, which more than cover thecurrent-account deficit, with resulting increases ininternational reserves. While local manufacturerscontinue to decry the strength of the rand, the realeffective exchange rate has returned to the average1996-2000 level.
In short, fiscal policy remains prudent despiteexpenditure increases, and inflation is under controlthanks to credibly but not unduly restrictive monetarypolicy.
External Position
Along with higher world oil prices, strong domesticdemand – both consumption and investment – broughtabout a 10 per cent increase in the value of imports (inrands) during the first three-quarters of 2005. Exportsgrew at an estimated 2.5 per cent in value, mainlythanks to the previously mentioned strength of demandfor South Africa’s natural-resource-based products,
notably platinum and diamonds. Gold exports, secondto platinum as a source of export revenues, droppedby 17.2 per cent, however. Despite a strong rand,manufacturing exports have fared well, growing at a rateof 17.6 per cent. The two main manufacturing productsexported by South Africa, steel and motor vehicles,recorded 19.2 per cent and 11 per cent growth,respectively.
The trade deficits in both the oil and non-oilmerchandise rose to about 1.7 per cent of GDP in2005. At the same time, the service and investmentincome balance is estimated to have posted a deficit ofabout 2.5 per cent of GDP. As a result, the current-account deficit is estimated to have reached 4.2 per centof GDP in 2005.
In December 2004, South Africa concluded apreferential trade agreement with the Mercado Comúndel Sur (Mercosur). Negotiations to reach a similararrangement with India started in the second half of2005. The government is also committed to negotiatea trade arrangement with China, but this may be sometime in coming.
Though flows of foreign direct investment (FDI)remain small by the standards of emerging markets,inflows were unusually large in 2005, at an estimated2.8 per cent of GDP. The surge in 1995 was due in partto several major transactions, including Vodaphone’sbid for more Vodacom assets in the telecommunicationssector and the Barclays-Absa deal in the banking sector.Substantial additional inward FDI is on the way. TataSteel and Mita Steel have embarked on negotiations withAnglo American to acquire a 79 per cent stake in
Table 3 - Current Account (percentage of GDP)
Source: South African Reserve Bank data; estimates (e) and projections (p) based on authors’ calculations.
1997 2002 2003 2004 2005(e) 2006(p) 2007(p)
Trade balance 1.6 4.3 2.1 0.1 1.7 2.1 2.0Exports of goods (f.o.b.) 21.0 28.5 23.2 22.4 19.8 18.0 18.4Imports of goods (f.o.b.) -19.4 -24.2 -21.1 -22.5 -21.5 -20.0 -20.4
Services 0.4 0.6 0.3 0.5Factor income 2.2 2.5 2.8 2.0Current transfers 0.5 0.5 0.5 0.7
Current account balance 1.5 0.7 1.4 3.3

African Economic Outlook © AfDB/OECD 2006
468
South Africa
Highveld Steel & Vanadium Corp Ltd., the secondlargest steelmaker in South Africa. Additional FDImay be forthcoming in: telecommunications, where theFrench cellular operator Orange may be interested inacquiring the local operator MTN; retail, whereWal-Mart has shown interest; and in the tourismindustry. From a balance-of-payments viewpoint,however, these expected FDI inflows are likely to bepartly offset by growing outflows, to some extent to otherAfrican countries.
Despite the surge in FDI in 2005, the main sourceof current-account financing in 2005 has remainedforeign portfolio investments, spurred by growingconfidence in South Africa and its currency, as notedabove.
With a current-account deficit more than financedby capital inflows, the SARB’s international liquidityposition increased by $7 billion between January 2005and January 2006. As a result, reserve coverage ofimports rose from 7 weeks at the end of 2003 to 15weeks in June 2005, while the ratio of net foreignexchange reserves to gross external short-term debtstood at 120 per cent in September 2005 up from
51 per cent in December 2003. Furthermore, SouthAfrica’s foreign debt was just 20.2 per cent of GDP atthe end of 2005, 38.5 per cent of which was rand-denominated, while interest payments were limited to3.6 per cent of export revenues. Capitalising on thecountry’s strengthened external position, the governmentis planning further liberalisation of capital controls.In particular, limits on holdings of foreign assets bySouth African banks will be raised in 2006.
Structural Issues
Recent Developments
Restructuring of state-owned enterprises in thetelecommunications, energy and transport sectorscontinued to receive significant attention from thegovernment in 2005. Although the year saw somesuccess in increasing competitiveness in thetelecommunications sector, restructuring is still provingdifficult in the others. In addition, although the businessenvironment is largely satisfactory, efforts to lower thecost of doing business in South Africa and to makegrowth more job-intensive are critically in order.
0
5
10
15
20
25
30
20042003200220012000199919981997
Figure 4 - Stock of Total External Debt (percentage of GNI)and Debt Service (percentage of exports of goods and services)
Source: IMF and World Bank.

African Economic Outlook© AfDB/OECD 2006
469
South Africa
The recent economic boom has led to increasedenergy demand, with growing pressure on the powergrid. Although such energy shortages were not expecteduntil 2010 and Eskom, the power utility, remainsconfident that it can meet increased demand and financeits capital expenditure programme, the governmenthas had to revise its investment timetable. Real signsof stress are evident in some provinces. Cape Town, forexample, experienced three blackouts in the autumnof 2005. Despite Eskom’s claims that sufficient capacityis in place to avoid future blackouts, there is concernthat the Western Cape province may face rollingblackouts until new power lines connecting the coal-fired power stations in Mpumalanga and Koeberg arecompleted in 2007.
Eskom was given the green light in 2004 to investabout ZAR92.9 billion in new power stations,transmission and distribution. To that end, five consortiahave qualified to bid for the exclusive rights to build,own and operate two new power stations needed to meetSouth Africa’s growing energy demands. These newplants in the Eastern Cape and KwaZulu-Natal shouldbe fully operational by the end of 2008. Theintroduction of independent power producers willbring competition to Eskom, which currently produces95 per cent of South Africa’s electricity, and furtherreduce the cost of electricity, already among the cheapestin the world.
There has been some progress in bringingcompetition to the telecommunications market. InDecember 2005, after a three-year delay, theIndependent Communications Authority of SouthAfrica licensed a second national operator to operatea fixed-line telephone network in the public domain,providing some competition to Telkom starting in thesecond half of 2006. The six-group coalition includedthe black-empowerment group Nexus Connexion andthe Indian group Tata. As in many African countries,the greatest growth has been in mobiletelecommunications. There are over 18 million cell-phone subscribers compared with only 4.8 millionfixed-line subscribers. In addition, as in other emergingmarkets, international mobile-phone companies areshowing increased interest in investing in South Africa.
The announcement in late 2005 of a joint venturebetween South Africa’s Cell C and Branson’s VirginMobile followed Vodafone’s announcement that itplanned to increase its stake in South Africa’s Vodacomto 50 per cent, equalising its stake with Telkom’s.Despite increased competition in telephony, Telkomretains substantial control over Internet access, andInternet-service providers continue to complain aboutTelkom’s dominance and anti-competitive practices.
During 2005, the South African banking systemremained sound and banks benefited from South Africa’sstrong growth. The average capital-adequacy ratioslightly receded from 13.2 per cent in December 2004to 12.5 per cent in October 2005 but remains well overthe minimum capital-adequacy ratio of 10 per cent; onlyone bank fell below the required threshold in 2004. Inaddition, overdue payments were less than 2 per centof total loans and advances in October 2005. All thesame, the South African banking sector suffers fromlow competition. The sector is dominated by the “bigfour” banks, which in December 2004 constituted83.7 per cent of the banking-sector assets. It remainsto be seen whether the Barclays-Absa deal will helpalleviate this problem.
Business confidence is high in South Africa thanksto the efficient financial market and a largely friendlybusiness environment. Nevertheless, problems remain.The South African Chamber of Business (SACOB)points to deficiencies in public services as impedimentsto business. Other pressing challenges include labour-force skills and education, labour-market regulation,exchange-rate instability and crime (South AfricaInvestment Climate Assessment, 2005). The lack ofcompetition in industries producing intermediate goodssuch as steel and chemicals also produces inefficienciesand additional costs for downstream activities andconsumers.
Many consider inflexible labour-market regulationsto be a major obstacle to private investment, especiallyin labour-intensive activities. Indeed, South Africanfirms have about twice as much capital per worker asfirms in Lithuania, Brazil and in the most productiveareas of China. Growth has consequently failed to be

African Economic Outlook © AfDB/OECD 2006
470
South Africa
as labour-absorbing as in other emerging economies.Business organisations attribute the economy’s lowlabour intensity to high labour costs and labour-marketregulations, which inhibit employment. For instance,many claim that wage setting is too centralised, especiallybecause bargaining council agreements are extended tonon-unionised small firms. The evidence, however, iscontested by unions and their supporters, who claimthat labour-market regulations are not enforced strictly.
Regardless of the controversies concerning labour-market rigidities, there is a broad consensus that skillshortages, inequality in access to education for blackSouth Africans and immobility of the working-forcepopulation, all legacies of the apartheid regime, arebarriers to well-functioning labour markets. Shortageof skilled labour is a particularly important barrier tobusiness development. Engineers, scientists and artisansare so scarce that many companies want to importpeople with these skills from abroad, which wouldrequire an amendment to the Immigration Act. Giventhe unemployment rate, such proposals are controversial.The government is also considering revision of theEmployment Equity Act to remove obstacles toemploying skilled white South Africans, notablyengineers.
Several initiatives aim to improve the skill level ofthe working population. For example, the 2003 SkillsDevelopment Act and Learnership programmes usefinancial contributions from private companies toinvest in training the South African workforce. Theseprogrammes have had limited success so far, not leastbecause most skills-development programmes aretargeted at the employed. The 23 Sector Educationand Training Authorities (SETAs), responsible fordesigning sector-specific skill-development strategies andpromoting learnerships, have also had uneven results.
The affirmative-action Black EconomicEmpowerment (BEE) programme also continues toprovoke debate in South Africa. There are someencouraging signs that a black middle class is emerging,but broadening the breadth of empowerment remainscrucial. More sectors are writing charters that providea framework and scorecard for empowering historically
disadvantaged individuals and communities. The ServiceCharter, which is particularly relevant to small andmedium enterprises, should be published in 2006. Thegovernment is also currently proposing “codes of goodpractice in empowerment”, to which all charters shouldconform. Some complain, however, that these codeswould lead to too much central decision making in areasthat would be better left for sector-by-sector levelnegotiations.
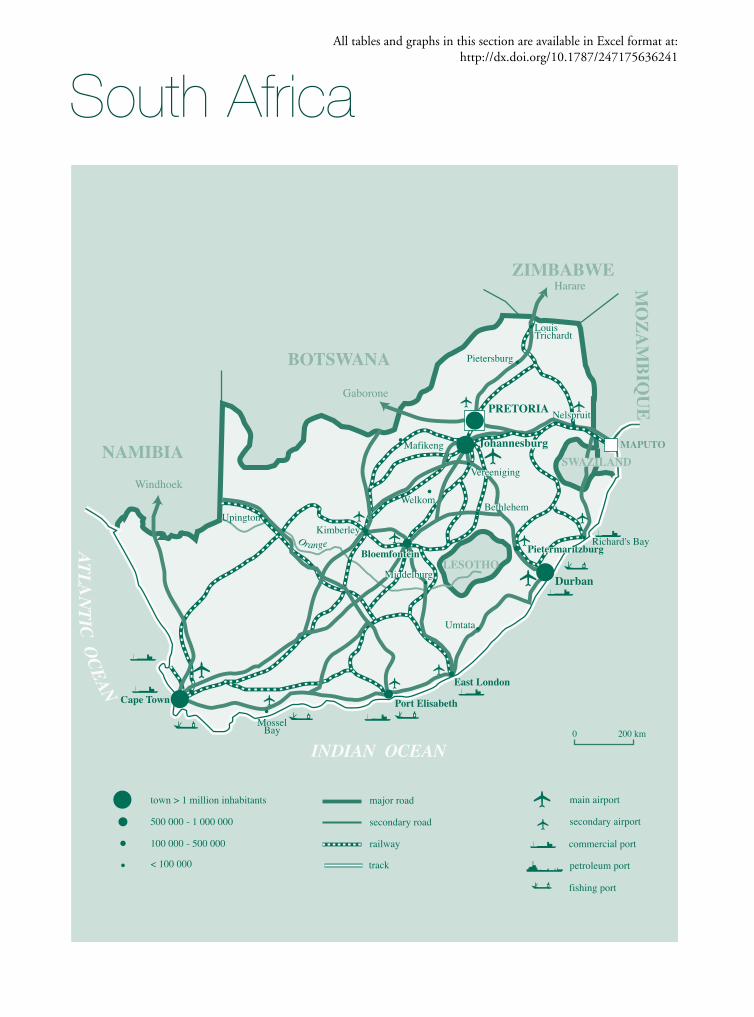
Transport Infrastructure
The provision of adequate transport infrastructureis one of the key elements of South Africa’s strategy forgrowth. While South African transport is in stellarcondition compared to other African countries, thequality of the various components of the system isuneven and higher growth of output and trade requirenew investments. Organisation and financing for roadsis superior to that of the other transport systems. Therailways and ports, in particular, function poorly andconstitute obstacles to increased growth. Moreover,demand is increasing and the growth of freight traffichas surpassed most of the 20-year growth forecastsmade by the Moving South Africa (MSA) strategy in1999. Rapid urban development and migration to thecities, as well as the forthcoming soccer World Cup in2010, provide additional pressure to strengthen urbantransport infrastructure.
The Department of Transport (DOT) overseesoverall co-ordination of transport policy, with particularresponsibility for roads, aviation, and passenger andcommuter rail, while the Department of PublicEnterprise (DPE) is responsible for rail and ports, i.e.the parastatal Transnet and her subsidiaries Spoornet,South African Ports Operations (SAPO) and theNational Ports Authority (NPA). Transport policy isbuilt on the framework set out by the 1999 MSAstrategy and the 2000 National Land TransportTransition Act. A National Roads Plan is currentlybeing developed.
Going forward, the government is working to ensurethat different parts of the transport system work togethereffectively. To date, this goal has been undermined by
African Economic Outlook© AfDB/OECD 2006
471
South Africa
the fact that the DOT and DPE have overlappingfunctions and powers, with resulting waste, confusionand turf battles. Addressing this problem of overlappingresponsibilities is a large part of the newly approved 2005National Freight Logistics Strategy. The strategy alsoseeks to open the ports and railroads to competition,as is already the case in the road and airfreight sectors.
Investment in the road network since 2001 hasresulted in a doubling of the surfaced national toll andnon-toll roads, with a further doubling targeted by2010. There are 56 000 km of surfaced provincialroads, 301 000 km of unpaved (gravel) road network,168 000 km of surfaced and unpaved urban roads,and 221 000 km of unpaved rural roads includingaccess roads. The road system is the only part of thenational transport system that receives regularinvestment, although even there, investment levelsare well below the levels necessary to maintain allroads in good condition. Roads receive a fiscalallocation of 900 million rands per annum and5.2 billion rands of private-sector funding through toll-road concessions.
In 2003, 74 per cent of domestic freight was carriedby road and 26 per cent by rail. In the last decade, freightlevels on roads have grown at an annual rate of 4 percent, while rail freight traffic has shown a slight decline.
South Africa is expected to experience the highestgrowth in airfreight of any country in the world duringthe next decade. Johannesburg International Airportis a rapidly growing cargo hub that is likely to experiencecapacity constraints in the near future. There are twoother international airports, in Cape Town and Durban,and seven regional airports.
The railways and ports are controlled by the statemonopoly Transnet. They are the weakest links in theSouth African transport system. Spoornet, a Transnetsubsidiary, has a near monopoly on commercial cargotransport by rail. South Africa is home to 26.6 percent of the African continent’s rail network with22 300 km of rail. There are rail lines reserved for ironore and coal, which account for most of the profitsgenerated by Spoornet.
Rail infrastructure suffers from 15 years of deferredinvestment: 45 per cent of trains are late and 25 per centdo not show up; freight loads per wagon are at only halfthe international best-practice level; and the average ageof locomotives is 25 years, compared with theinternational average of 16 years. Derailments have alsobeen too frequent, with two just in October 2005. As aresult of these efficiency problems, customers who userail do so only for goods that are least time-sensitive,limiting Spoornet’s ability to increase container traffic.
Ports are also owned by the state monopoly Transnet,though there are a few concessions run by privateoperators. Despite an increase in investment in thepast few years, the ports are under growing pressure fromrising demand. Container volume handled in SouthAfrica’s seven commercial ports has grown at a 7.25 percent annual rate since 2000. In addition, the portsremain extremely inefficient by international standards.They move 17 container units per hour versus a best-practice standard of 35. One particular problem is theinefficient interface between railcars and ships, whichcauses regular, severe congestion problems. The lack ofcompetition in port operations is an underlying sourceof these inefficiencies. Even compared with some otherAfrican countries, South African ports perform poorly.For example, the port of Dar es Salaam (Tanzania)averages 21 container moves per hour, the ports ofNamibia 18 and those of Brazil 42.
Given that Transnet controls the port and railsystems, its restructuring strategy is crucial to improvingthe inefficient port and rail systems in South Africa.The restructuring strategy calls for Transnet to transformitself into a freight transport company. Transnet willnarrow its focus on ports, rail and pipeline businesses,which are currently operated by its subsidiaries Spoornet,SAPO, the NPA and Petronet. Transnet will divestitself of other business, including passenger rail service,tourism and baggage handling, which have generallyshown poor performance and required cross-subsidisation, using Spoornet and SAPO profits. Inparticular, South African Airways will be split off fromTransnet and will report directly to the government asof the spring of 2006. These reforms are to beaccompanied by ZAR40 billion in investment in freight
African Economic Outlook © AfDB/OECD 2006
472
South Africa
infrastructure, which is essential to upgrade the systemand satisfy the rising demands.
Substantial barriers to restructuring Transnet remain,however. First, despite the government’s efforts tobroker an agreement between the unions and Transnetthrough the Transnet Restructuring Committee (TRC),the unions are calling for strikes, claiming that Transnetbreached the “letter and spirit” of the constitution ofthe TRC. Union leaders are particularly worried aboutthe 25 000 jobs they claim will be lost. Second, theextensive cross-subsidisation between Transnet’s varioussubsidiaries makes it difficult to identify which businessunits are performing well and should receive additionalinvestment and which are performing poorly and shouldbe eliminated.
Urban transport infrastructure is under increasingstress as well, as traffic volumes grow in cities such asGauteng and Durban, impeding the flow of bothpersons and merchandise. Due in part to the risingpublic anger of commuters, the DOT has made it ahigh priority to improve commuter rail-service delivery.The DOT reform programme emphasises the institutionof public-private partnerships that will secure increasedpublic investment. One such example is the constructionof the high-speed Gautrain rail line between Pretoriaand Johannesburg. The 80-km connection is made upof two links, one from Pretoria and Johannesburg andanother between Johannesburg International Airportand Sandton. The latter link is highly controversialbecause of its 750 million euros cost, the high level ofsubsidies guaranteed by the authorities to the privateoperator, its limited integration with the pre-existingrail system and the expected modest daily number ofpassengers of only 600. Nonetheless, at its last meetingin 2005, the South African Cabinet reiterated its supportfor the Gautrain Project. If finally endorsed by thegovernment, it is expected to be ready when SouthAfrica hosts the World Cup in 2010.
There is broad agreement that the transportinfrastructure in South Africa needs substantialupgrading, and the government is committed toaddressing this problem. It has increased the financialresources for transport to approximately
ZAR14.3 billion over four years, starting in 2006.Transnet’s investments of ZAR40.8 billion and statefunding for future private-public partnership agreementsof ZAR18.2 billion are expected to add to this total.
Political and Social Context
After an overwhelming victory in the 2004 generalelections, the honeymoon period for the AfricanNational Congress (ANC) came to an abrupt end in2005, when the popular Vice-President, Jakob Zuma,was charged with being in a “generally corruptrelationship” with his financial adviser. As a result ofthese revelations, President Mbeki dismissed Zumafrom his position, a move that was unpopular withmany members of the ANC. After his dismissal, Zumawas charged with rape in a separate case, which helpedto temper the unhappiness over Mbeki’s decision.Nonetheless, the “Zuma affair” has made 2005 themost difficult year for the ANC since it came to powerin 1994.
In particular, the Zuma affair has brought to thefore the question of who will lead the ANC afterPresident Mbeki’s tenure ends in 2009. While Zumahad previously been seen as one of the strongestcandidates for this position, the rape and corruptioncharges have severely weakened his standing. The resultis a wide-open selection process that will sorely test ANCunity and thereby potentially threaten its continueddominance of South African politics.
On the other hand, the Zuma affair has enhancedthe democratic credibility of South Africa byhighlighting the independence of the judiciary branchand demonstrating that even high-profile public officialsare not above the law. According to TransparencyInternational, the government’s response is a signal ofSouth Africa’s maturing democracy and sets animportant precedent for the advancement of goodgovernance.
The government is acutely aware that there isgrowing impatience among many South Africans,especially among the poor majority, regarding the lack

African Economic Outlook© AfDB/OECD 2006
473
South Africa
of improvement in living standards despite the economicgrowth of the past decade. President Mbeki is wellaware of the importance of improving social servicesand infrastructure, and he has made this a priority forthe rest of his term of office. Nevertheless, protestsabout poor service delivery, housing and unemploymenthave been increasing, and observers suggest that someof this frustration may affect the outcomes of the local-government elections planned for March 2006. Somemembers of civil society are already threatening toboycott the elections.
While the government has made progress intargeting aid to the poorest and most vulnerable, notablythrough the social-grants scheme described below,poverty has not diminished much since the democratictransition. Indeed, a debate is currently under way onthe definition of poverty in South Africa. In 2000,according to the international poverty standards of $1per day or $2 per day (the equivalent at that time ofZAR87 per month or ZAR174 per month), 11.3 percent or 34.4 per cent of the population lived in poverty,respectively (South Africa United Nations MDG Report2005). When the national poverty line of ZAR354 permonth per adult is used, however, 57 per cent of thepopulation lived in poverty in 2001. In any case, SouthAfrica remains a very unequal society with a Ginicoefficient of 0.59, although the latter drops to 0.35when transfers are included, as explained below.
One of the government’s main tools for addressingextreme poverty is cash transfers, the so-called “socialgrants”. Expenditures on these grants increased 3.7-foldbetween 1994 and 2004 to ZAR37.1 billion as thenumber of beneficiaries grew from 2.6 million in 1994to 7.9 million in 2004. In addition to the social-grantsprogramme, the Expanded Public Works Programme(EPWP), the Agricultural Starter Pack Programme toprovide food production start-up support and theComprehensive Agricultural Support Programmeproviding post-settlement support to beneficiaries ofthe Land Reform processes also aim to alleviate poverty.
There is some controversy about the adequacy ofthe government’s anti-poverty programmes. Forexample, the People’s Budget Campaign, a coalition of
civil-society organisations, is calling for the introductionof a universal Basic Income Grant of ZAR100 perperson per month, indexed to inflation, and a NationalHealth Insurance system. The government will surelyresist these proposals, however, given the concernsabout the cost of the present social-grants programmeand its objective of preserving incentives to work.Overall, it appears that the current system of socialgrants works well, as demonstrated by the increase inexpenditure on basic commodities such as food and fuel,as well as by school attendance in households receivinggrants. The South African Social Security Agency,which began operating in April 2005, should increasethe impact of social grants further by improving deliveryand reducing fraud, which leads to an estimatedZAR1.5 billion in losses per year.
Official unemployment remains very high at 26 percent but the rate rises to 41 per cent when a broaddefinition is used. Approximately 2.5 million peopleare employed in the informal sector (Labour ForceSurvey, 2005:12). The high level of unemployment isthe main source of continued poverty and inequality.In what is clearly a lasting legacy of apartheid, poorhouseholds tend to be disconnected from the labourmarket. In particular, the lack of skills among the poor,due largely to the neglect of education for blacks duringapartheid, make them difficult to employ. Only 9 percent of working-age individuals in the bottom-incomedecile are employed, compared to 68 per cent in thetop decile (United Nations Development Programme[UNDP], Development Bank of Southern Africa[DBSA], Human Sciences research Council of SouthAfrica [HSRC] Development Report, 2005:6).
The EPWP, launched in 2004, seeks to providepublic employment for the unskilled, particularly ingovernment infrastructure projects. The EPWP has atarget of creating jobs for one million people, withZAR15 billion of the infrastructure funds allocated toprovinces and municipalities earmarked for the EPWP.Unfortunately, the public’s high expectations from theprogramme may be difficult to fulfil, as most of the jobswill be temporary and no more than 200 000 peopleare likely to be employed at any given time (DBSADevelopment Report, 2005).

African Economic Outlook © AfDB/OECD 2006
474
South Africa
Although more than 95 per cent of both boys andgirls between the ages of 7 and 13 are reported to beattending school, school conditions are unfavourablein poorer areas. Some civil-society organisations decrythe low level of expenditure in poorer provinces andthe resulting inadequate education facilities. Currently,there is a shortage of about 57 000 classrooms (People’sBudget: 28). In addition, although public educationis funded primarily by taxes, most cash-strapped schoolswill continue to charge fees as long as there is no clearpolicy prohibiting the practice (People’s Budget: 30).The Department of Education Costs Review foundthat most schools charge fees of up to ZAR100 a year,a substantial sum for people living in extreme poverty.
Access to water and electricity has been improvingsteadily since 2000 although there is still some backlog.The proportion of households with access to cleanwater increased to 85.5 per cent in 2003 from 60 percent in 1995 and access to sanitation increased to63 per cent in 2003 from 49 per cent in 1994.Nevertheless, many argue that the current allocationof 6 000 litres of water per household per month isinadequate, as it falls short of the World HealthOrganisation (WHO) recommendation of 100 litresper person per day. The share of people living inReconstruction and Development Programme housingrose to 26 per cent in September 2003, but there is alsocontinued backlog in housing.
Both the government and its critics agree that thepace of land redistribution remains too slow. Fallingfar short of a target of 30 per cent redistribution by 2014,only 3 per cent of land has been redistributed. Therewas general consensus at the National Land Summitheld in July 2005 that relying on voluntary land salesis inadequate and that expropriation should beconsidered. The government, however, remains reluctantto follow this path for obvious reasons.
About 5 million South Africans are infected withHIV, the largest number in the world in one country.A recent report by the HSRC suggests that the rate ofHIV infection may be flattening, with 21.5 per centof 15- to 49-year-olds being HIV positive at the endof 2003 (UNAIDS 2004 Report on the global AIDS
epidemic). The government’s approach to HIV/AIDSprevention and treatment is improving, despite theMinister of Health’s continued misleading statementsabout the disease. The 2005 budget allocatedZAR6.6 billion for the national integrated response tocover the health, education and other social-development sectors. Nevertheless, the fact that 77 percent of the total HIV and AIDS budget are allocatedto the provinces as conditional grants is cause forconcern, given the provincial authorities’ weakimplementation capacity. Consequently, the HealthDepartment will have to strengthen its monitoring,evaluation and support mechanisms.
Once again, a scarcity of workers with the properskills is the largest barrier to a comprehensive treatmentof AIDS. By 2009, South Africa will need approximatelyan additional 3 200 doctors, 2 400 nurses, 765 socialworkers, 765 dieticians, 112 pharmacists and 2 000 datarecorders to fully implement treatment withantiretroviral (ARV) drugs. Migration of health workersto better-paying countries contributes to this shortage.Partly as a result of this latter, ARV therapy reached only28 786 of the targeted 53 000 in 2004, but increasedto an estimated 50 000 individuals in 2005 (SouthAfrica MDG Report). Even with increased access toARV drugs, however, mortality rates from AIDS are notexpected to peak in South Africa until about 2010(HSRC HIV and AIDS survey).
There are encouraging signs that South Africans aremore aware of HIV/AIDS as well as the availability ofARV drugs. Unfortunately, public awareness onprevention is lagging and the public displays a false senseof security regarding their risk of infection. Accordingto a survey by HSRC, half of the people diagnosed asHIV-positive did not think they were at risk of HIVinfection. Awareness campaigns must address thesemisperceptions actively.