Embed Size (px)
Citation preview

SOUTH AFRICA
F O R M A L E C O N D O M S
ATOTAL
M A R K E TA P P R O A C H

ContentsGREETINGS 1
EXECUTIVE SUMMARY 2
METHODS 3
STATE OF THE MARKET 4
INTRODUCTION 6
Health Context 6
HIV Situation 7
Public Sector 8
Social Marketing Sector 9
Commercial Sector 10
RESULTS 11
Universe of Need 11
Condom Use 12
Market Volume 13
Missions: UNFPA and PSI
Recommended citation:
Pallin, S.C., D. Meekers, O. Lupu, K. Longfield. November 2013.
South Africa: A Total Market Approach. PSI/UNFPA Joint Studies on the Total Market for Male Condoms in Six African Countries.
Retrieved from www.psi.org/total-market-approach
UNFPA, THE UNITED NATIONS POPULATION FUND, delivers a world where every pregnancy is wanted, every birth is safe, and every young person's potential is fulfilled.
PSI, POPULATION SERVICES INTERNATIONAL, makes it easier for people in the developing world to lead healthier lives and plan the families they desire by marketing affordable products and services.
Market Value 14
Subsidy 15
Number of Brands 15
Equity 16
CHALLENGES AND OPPORTUNITIES 17
RECOMMENDATIONS 18
Informed Demand 18
Distribution 18
Coordination 18
Reporting 18
Partnerships 18
ACRONYM KEY 19
ACKNOWLEDGEMENTS 20
REFERENCES 21
COVER PHOTO: © PANOS / DAVID LARSEN / AMO
TOTAL MARKET APPROACH CASE STUDY | SOUTH AFRICA1
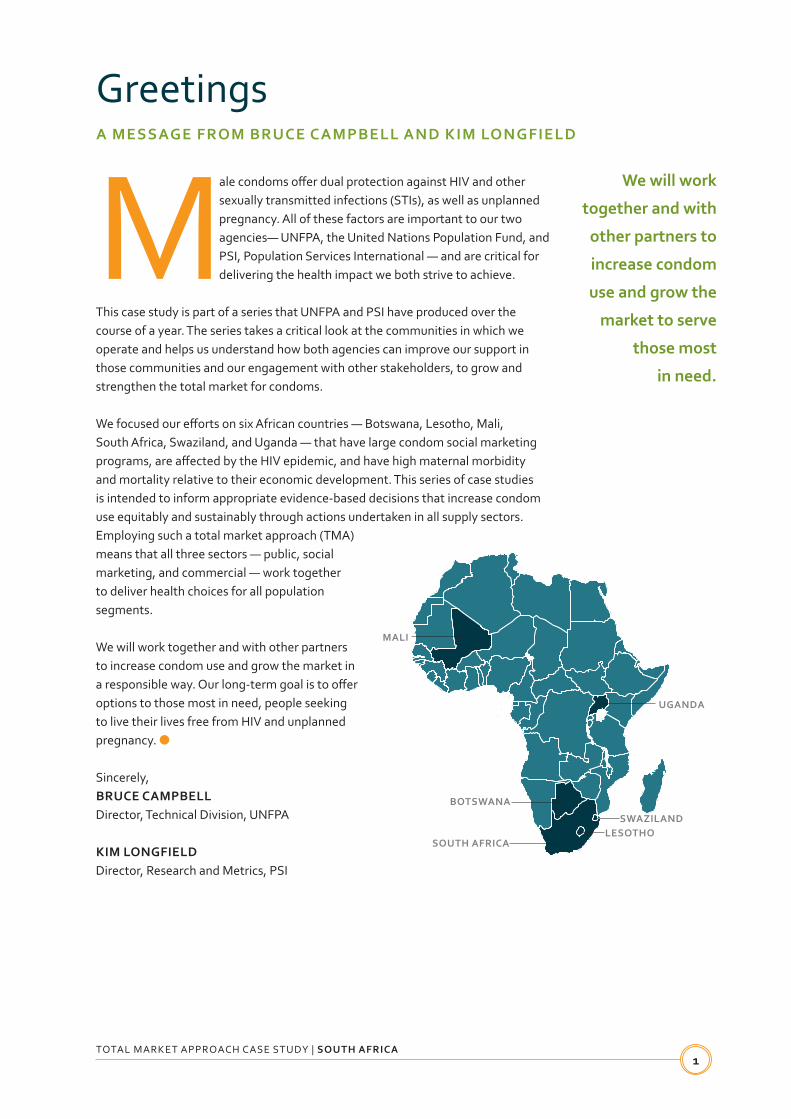
Male condoms offer dual protection against HIV and other sexually transmitted infections (STIs), as well as unplanned pregnancy. All of these factors are important to our two agencies— UNFPA, the United Nations Population Fund, and PSI, Population Services International — and are critical for delivering the health impact we both strive to achieve.
This case study is part of a series that UNFPA and PSI have produced over the course of a year. The series takes a critical look at the communities in which we operate and helps us understand how both agencies can improve our support in those communities and our engagement with other stakeholders, to grow and strengthen the total market for condoms.
We focused our efforts on six African countries — Botswana, Lesotho, Mali, South Africa, Swaziland, and Uganda — that have large condom social marketing programs, are affected by the HIV epidemic, and have high maternal morbidity and mortality relative to their economic development. This series of case studies is intended to inform appropriate evidence-based decisions that increase condom use equitably and sustainably through actions undertaken in all supply sectors. Employing such a total market approach (TMA) means that all three sectors — public, social marketing, and commercial — work together to deliver health choices for all population segments.
We will work together and with other partners to increase condom use and grow the market in a responsible way. Our long-term goal is to offer options to those most in need, people seeking to live their lives free from HIV and unplanned pregnancy. ●
Sincerely,BRUCE CAMPBELL Director, Technical Division, UNFPA
KIM LONGFIELDDirector, Research and Metrics, PSI
GreetingsA MESSAGE FROM BRUCE CAMPBELL AND KIM LONGFIELD
We will work
together and with
other partners to
increase condom
use and grow the
market to serve
those most
in need.
MALI
UGANDA
BOTSWANA
SOUTH AFRICALESOTHO
SWAZILAND

TOTAL MARKET APPROACH CASE STUDY | SOUTH AFRICA2
Executive Summary
South Africa has the greatest number of people living with HIV in the world, with an estimated 16.9% of the adult population infected. Although large-scale HIV prevention efforts have resulted in a decrease in new infections, risky sexual behavior and insufficient levels of condom use continue to drive the HIV epidemic. Male condoms are a vital part of South Africa’s HIV prevention strategy, and because condoms offer dual protection against both HIV and unplanned
pregnancy, they also play an important role in meeting the need for family planning.
In South Africa, the number of condoms needed to protect all sexual acts from HIV and unplanned pregnancy (universe of need) is much higher than the actual number of condoms on the market (volume). Although public health efforts encouraging condom use for HIV prevention and family planning succeeded in increasing condom use among adults from less than 50% to more than 65% between 2005 and 2008, recent reports show that condom use has decreased among all age groups except women over age 50. This discouraging trend highlights the need for better condom marketing and promotion to increase informed demand, and prevent new HIV infections and unplanned pregnancy.
The condom market in South Africa has traditionally consisted of three sectors: the public sector, which distributes fully subsidized (free) condoms; the social marketing sector, which distributes partially subsidized condoms at low cost; and the commercial sector, which sells condoms for a profit. While the role of the public and commercial sectors has not changed, the social marketing sector no longer sells partially subsidized condoms. In 2012, the Society for Family Health (SFH), the only social marketing organization in the country, transferred the management of its condom brands to PSI/South Africa, a regional foreign branch office of PSI based in Johannesburg, South Africa. As a result of this change, socially marketed brands that were previously subsidized are now sold at full cost recovery. Despite these improvements, the market remains heavily subsidized and dominated by free public sector condoms. Concerns about appropriate pricing
strategies, “crowding out” the commercial sector, and inefficiencies in the use of public funds, have prompted UNFPA and PSI to adopt a total market approach (TMA) to help manage the condom supply in South Africa. TMA requires that all three sectors work together to “grow the condom market” and meet the needs of different segments of the population.
The results of our study yielded several important findings. Currently, lengthy condom procurement processes, an unreliable condom supply, and lack of government funds for warehousing and distribution cause inefficiencies in public sector distribution, which result in shortages throughout the country. Although the commercial sector has grown, it still accounts only for a small share of the market, and the market is
dominated by fully subsidized condoms. Both circumstances limit market sustainability. Finally, even though some information on recent condom use is available through reports, a lack of access to behavioral survey data limits our analysis of the market, including equity analysis. Accessible, high quality data are needed to guide decisions by all market stakeholders. This study presents a picture of the most recent market trends, analyzes past market trends, and provides a series of recommendations intended to help policymakers, donors, and other stakeholders better manage South Africa’s condom market. ●
The Total Market
Approach (TMA)
seeks to maximize
market efficiency,
equity, and
sustainability
through the
coordination of
the public, social
marketing, and
commercial sectors.
TOTAL MARKET APPROACH CASE STUDY | SOUTH AFRICA3
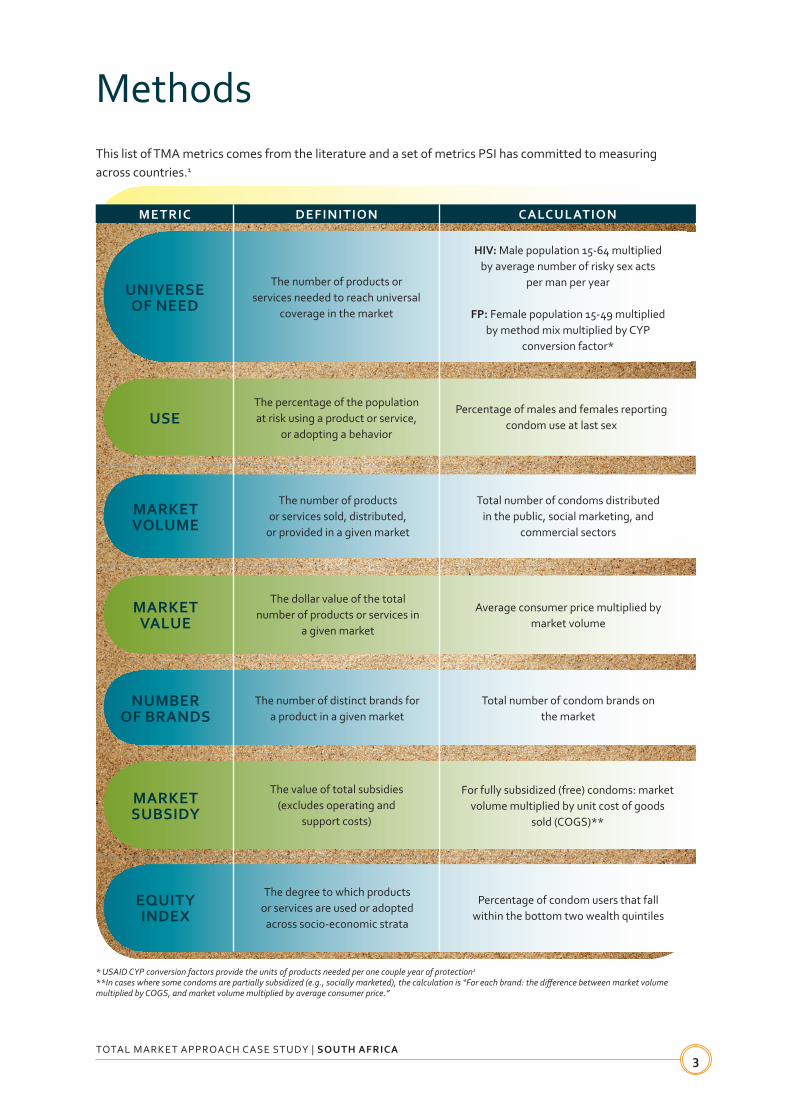
MethodsThis list of TMA metrics comes from the literature and a set of metrics PSI has committed to measuring across countries.1
* USAID CYP conversion factors provide the units of products needed per one couple year of protection2
**In cases where some condoms are partially subsidized (e.g., socially marketed), the calculation is “For each brand: the difference between market volume multiplied by COGS, and market volume multiplied by average consumer price.”
METRIC DEFINITION CALCULATION
The number of products or services needed to reach universal
coverage in the market
HIV: Male population 15-64 multiplied by average number of risky sex acts
per man per year
FP: Female population 15-49 multiplied by method mix multiplied by CYP
conversion factor*
The number of products or services sold, distributed,
or provided in a given market
The percentage of the population at risk using a product or service,
or adopting a behavior
Total number of condoms distributed in the public, social marketing, and
commercial sectors
Percentage of males and females reporting condom use at last sex
The dollar value of the total number of products or services in
a given market
Average consumer price multiplied by market volume
The number of distinct brands for a product in a given market
Total number of condom brands on the market
The value of total subsidies (excludes operating and
support costs)
For fully subsidized (free) condoms: market volume multiplied by unit cost of goods
sold (COGS)**
The degree to which products or services are used or adopted
across socio-economic strata
Percentage of condom users that fall within the bottom two wealth quintiles
UNIVERSE OF NEED
USE
MARKET VOLUME
MARKET VALUE
MARKET SUBSIDY
EQUITY INDEX
NUMBER OF BRANDS

Sources: PSI7, Nielsen8, National Department of Health9
*For 2013, the social marketing sector is considered “commercial sector” because its condoms are profitable. Where official data were unavailable, figures used are best estimates.**2012 public sector distribution figures were used for 2013
TOTAL MARKET APPROACH CASE STUDY | SOUTH AFRICA4
State of the Market
Sources: UNAIDS Investment Framework Study Group3; UN Population Division, 2010 revision4; USAID conversion factors2; Guttmacher Institute. Adding it up: The costs and benefits of investing in family planning and maternal and newborn health (estimation methodology), 2011.5
Source: Simbayi, L. (2013). South African National HIV Prevalence, Incidence and Behaviour Survey, 2012: Behavioural data and male circumcision. Oral presentation during Satellite session on the 2012 National HIV Household Survey: Key Findings together with Shisana, O., Rehle, T. and Zuma, K. at the 6th South African AIDS Conference held at the International Convention Centre in Durban, 18-21 June 2013.6
UNIVERSE OF NEEDCALCULATION:HIV: Male population 15-64 multiplied by average number of risky sex acts per man per year
FP: Female population 15-49 multiplied by method mix multiplied by CYP conversion factor
MARKET VOLUMECALCULATION: Total number of condoms distributed in the public, social marketing, and commercial sectors
USECALCULATION: Percentage of males and females reporting condom use at last sex
72.8%
45.4%
67.4% 67.4%
55.7%
35.9%
66.5%62.5%
85.2%
51.0%
72.8%
45.4%
67.4% 67.4%
55.7%
35.9%
66.5%62.5%
85.2%
51.0%

Sources: PSI7,Nielsen8,National Department of Health9,PSI/South Africa11
*Includes Trust and Lovers+ brands
Sources: PSI7, Nielsen8, National Department of Health9, SFH/South Africa and PSI/South Africa10
TOTAL MARKET APPROACH CASE STUDY | SOUTH AFRICA5
MARKET VALUECALCULATION: Average consumer price multiplied by market volume
NUMBER OF BRANDSCALCULATION: Total number of condom brands on the market
EQUITYCALCULATION: Percentage of condom users by education level*
SUBSIDYCALCULATION: For fully subsidized (free) condoms: market volume multiplied by unit COGS
$14,179,508R137,607,871
$22,220,745R215,645,664
AVERAGECONSUMER
PRICE
MARKET VOLUME
MARKET VALUE
● ●
●●
● ●
● ●
● ●
● ●
●●
● ●
● ●
● ●
● ●
●●
● ●
● ●
● ●
● ●
●●
● ●
● ●
● ●
● ●
●●
● ●
● ●
● ●
● ●
●●
● ●
● ●
at least
58different brands
of condomson the market
$15 millionR128 million
Estimated subsidy for public sector condoms
83%of condoms fully
subsidizied
17%commercial sector condoms*
Source: SABSSM 200512
*Wealth quintile data were not available, so education was used as a proxy.

TOTAL MARKET APPROACH CASE STUDY | SOUTH AFRICA6
IntroductionHEALTH CONTEXTThe prevalence of HIV in South Africa is among the highest in the world, with an estimated 17.3% of adults infected.13 More than five million South Africans are living with HIV.13 Rates of HIV infection are higher among key populations at risk, including sex workers, men who have sex with men, and youth.14,15,16 Women are disproportionately affected, with HIV prevalence more than four times higher than men in some age groups.16 Multiple concurrent partnerships and intergenerational partnerships remain common and contribute to the epidemic.16
Major HIV prevention efforts have succeeded in decreasing new infections by 41% since 2001 and male condoms remain a critical component of South Africa’s HIV prevention strategy.17 Condom use is essential for those who engage in casual or multiple partnerships, or when one partner in a relationship is HIV positive or infected with an STI. In addition to providing protection against HIV and other STIs, condoms play a role in preventing unplanned pregnancy. Although the frequency with which condoms are used for dual protection is unknown, approximately 14% of South African women have an unmet need for family planning.18 A consistent supply of high-quality condoms is required to fill the need for both HIV prevention and family planning. However, it is clear from our research that the current market falls short of meeting these needs. In order to increase condom use and ensure long-term, equitable access to condoms, we recommend several improvements to strengthen and stabilize the market.
Male condoms are
an important part
of South Africa’s
national strategy for
HIV prevention.

TOTAL MARKET APPROACH CASE STUDY | SOUTH AFRICA7
South Africa: HIV Situation
HIV PREVALENCE IS HIGH, APPROXIMATELY 17%13
RISKY SEXUAL BEHAVIOR REMAINS COMMON16
NEED FOR CONSISTENT SUPPLY OF HIGH QUALITY CONDOMS
RATES ARE HIGHER AMONG KEY POPULATIONS AT RISK:
60% 50% 22%
Sex workers14 MSM15 Youth aged 15-2416
MORE THAN FIVE MILLION SOUTH AFRICANS ARE LIVING WITH HIV13
WOMEN ARE MORE THAN TWICE AS LIKELY AS MEN TO BE INFECTED16
VS
Multiple partnerships
Concurrent partnerships
Intergenerational partnerships

TOTAL MARKET APPROACH CASE STUDY | SOUTH AFRICA8
PUBLIC SECTORThe South African National Department of Health (NDOH) coordinates condom procurement and distribution. The NDOH contracts with eight suppliers around the country to supply, warehouse, and distribute public sector condoms to approximately 220 primary distribution sites. These distribution sites include health facilities as well as non-medical outlets that attract key populations at risk, including outlets such as bars and nightclubs. While the NDOH does its own distribution to health facilities, the government relies on the Society for Family Heath (SFH), a PSI network member, to distribute public sector condoms to non-medical outlets. SFH distributes approximately one-third of all public sector condoms on behalf of the government, using United States Centers for Disease Control and Prevention (CDC) funds as well as funds from PSI/South Africa for distribution. While SFH serves as NDOH’s national non-governmental distribution partner, provincial health departments partner with non-governmental organizations (NGOs) in each province to distribute condoms.
Relationships between the public sector and private corporations are also potentially important for free condom distribution in South Africa. SABMiller, a South African brewing and beverage company, offers space on SAB beer trucks for free condoms to be distributed to bars. The pharmaceutical company, Merck, provides assistance with communications while UTi Worldwide, a supply chain management company, offers provincial warehousing of public sector condoms at no cost. The South African Business Coalition on HIV/AIDS (SABCOHA), an organization that seeks to empower businesses to take action against HIV/AIDS in the workplace, encourages and supports such partnerships. These partnerships are currently underutilized but may be a valuable tool for improving efficiency and sustainability in the public sector.
Since 2004, the government of South Africa has distributed the Choice brand. Currently, Choice is not targeted at any specific population. Although market research shows that consumers identify Choice as the “always available brand,” there is no official marketing strategy. The South African government has taken steps to remedy this and is expecting to have a marketing plan in place by the end of 2013, along with a possible rebranding of Choice.
Quality concerns and stock-outs have hurt the reputation of Choice; however, the brand still accounts for approximately 80% of the total condom market. The South African government provides funding for the brand without assistance from international donors. The government budget allows for one billion condoms per year; this budget is meant to include procurement, warehousing, and distribution. However, only 392 million Choice condoms were actually distributed in 2012, including those distributed with funds from PSI/South Africa and CDC.
South African National Department of Health (NDOH) coordinates
condom procurement and distribution
Society for Family Health (SFH) distributes
condoms to non-government facilities
on behalf of the government
The government brand, Choice, is not targeted at
any specific population and currently has no marketing strategy
SOUTH AFRICAECONOMICINDICATORS
19
■ Development category: developing
■ Income level: upper middle
■ GDP:$384.3 billion (USD)
■ Population: 51.2 million

TOTAL MARKET APPROACH CASE STUDY | SOUTH AFRICA9
SFH, a PSI network member, and PSI/South Africa are the only social marketing organizations
with a presence in South Africa
PSI/South Africa, a PSI regional
branch, coordinates procurement,
distribution, and marketing for Trust and
Lovers+ brands
Trust and Lovers+, the only socially marketed
brands, have been profitable since late 2012
Income from Trust and Lovers+ condoms are
used to grow the brands as well as to support
public sector distribution
PSI/South Africa contracts with a large
commercial distributor to distribute Trust and
Lovers+ to independent distributors, wholesalers,
and retail chains in South Africa
SOCIAL MARKETING SECTORThe social marketing sector has changed considerably in the last five years. Prior to 2012, SFH sold subsidized Trust and Lovers+ condoms in South Africa. In August 2012, SFH transferred the management of its condom brands to PSI/South Africa, a regional foreign branch office of PSI based in Johannesburg, South Africa. PSI's regional office manages procurement, distribution, marketing, and all other activities related to Trust and Lovers+ condoms in South Africa, Botswana, Lesotho, and Swaziland. PSI sells Trust and its brand extension, Trust Studded. It also sells Lovers+ as well as two extensions of the Lovers+ brand: Lovers+ Coloured and Flavoured and Lovers+ Ribbed and Studded. TFD Network Africa (TFD), a commercial entity that distributes the brands along with other fast moving consumable goods, has contracted with PSI to deliver Trust and Lovers+ condoms to independent distributors, wholesalers (which then sell smaller quantities of condoms to informal retail outlets) and major retail chains. Trust and Lovers+ are widely available in South Africa in shops, pharmacies, kiosks, and petrol stations. Trust is positioned as a caring brand for couples, while Lovers+, a higher-end brand, has more modern, bold packaging and is positioned as a playful brand.
Since late 2012, steps have been taken to bridge price disparities in the region through price increases for Trust and Lovers+ condoms and to reach full cost recovery. Regional pricing was standardized across all countries and condom brands by April 2013. Consistent price increases over the years, in addition to brand popularity, have allowed Trust and Lovers+ brands to keep pace with inflation and even become profitable. Profits from PSI condom sales in South Africa are not only used to support the Trust and Lovers+ brands, but also to fund SFH's distribution of public sector condoms. The Kingdom of the Netherlands is the main donor for socially marketed condoms; however, a plan to eliminate donor funding is in place and the social marketing sector should become completely self-sustainable by 2015.
ST
EP
HA
NIE
O’C
ON
NO
R
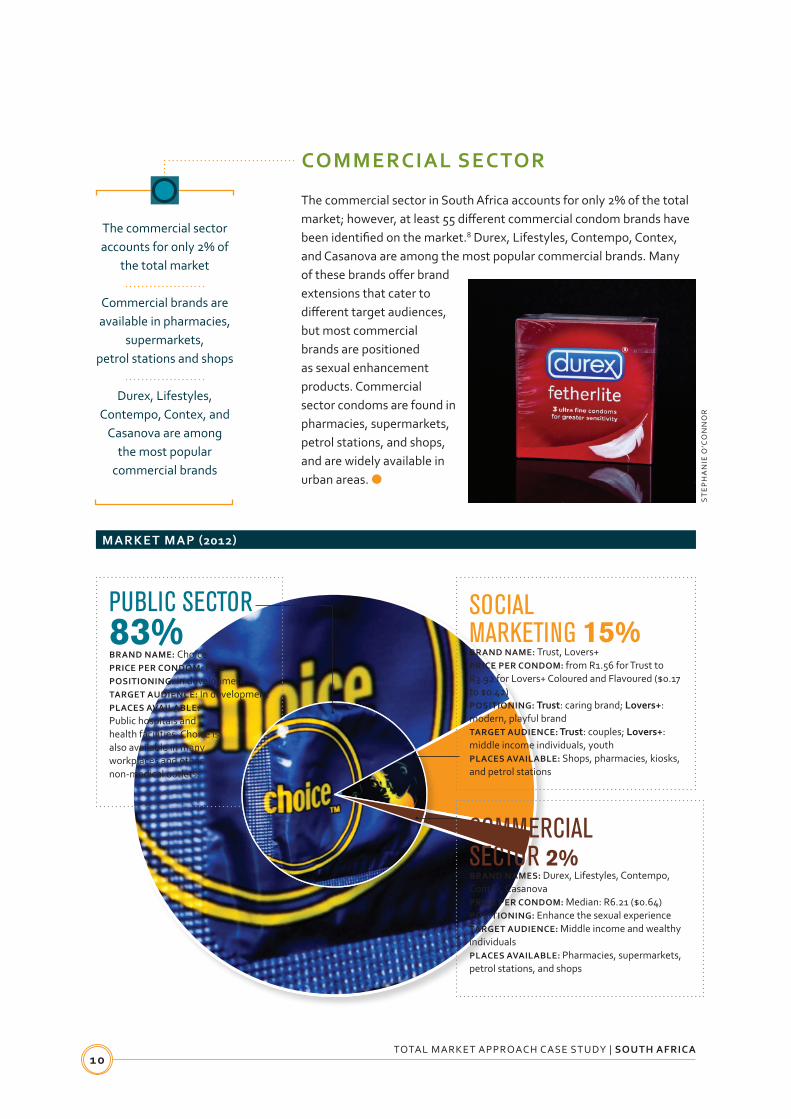
PUBLIC SECTOR 83%BRAND NAME: ChoicePRICE PER CONDOM: FreePOSITIONING: In developmentTARGET AUDIENCE: In developmentPLACES AVAILABLE: Public hospitals and health facilities. Choice is also available in many workplaces and other non-medical outlets.
SOCIAL MARKETING 15%BRAND NAME: Trust, Lovers+PRICE PER CONDOM: from R1.56 for Trust to R3.92 for Lovers+ Coloured and Flavoured ($0.17 to $0.42)POSITIONING: Trust: caring brand; Lovers+: modern, playful brandTARGET AUDIENCE: Trust: couples; Lovers+: middle income individuals, youthPLACES AVAILABLE: Shops, pharmacies, kiosks, and petrol stations
COMMERCIAL SECTOR 2%BRAND NAMES: Durex, Lifestyles, Contempo, Contex, CasanovaPRICE PER CONDOM: Median: R6.21 ($0.64)POSITIONING: Enhance the sexual experienceTARGET AUDIENCE: Middle income and wealthy individualsPLACES AVAILABLE: Pharmacies, supermarkets, petrol stations, and shops
TOTAL MARKET APPROACH CASE STUDY | SOUTH AFRICA10
COMMERCIAL SECTOR
The commercial sector in South Africa accounts for only 2% of the total market; however, at least 55 different commercial condom brands have been identified on the market.8 Durex, Lifestyles, Contempo, Contex, and Casanova are among the most popular commercial brands. Many of these brands offer brand extensions that cater to different target audiences, but most commercial brands are positioned as sexual enhancement products. Commercial sector condoms are found in pharmacies, supermarkets, petrol stations, and shops, and are widely available in urban areas. ●
MARKET MAP (2012)
The commercial sector accounts for only 2% of
the total market
Commercial brands are available in pharmacies,
supermarkets, petrol stations and shops
Durex, Lifestyles, Contempo, Contex, and
Casanova are among the most popular
commercial brands
ST
EP
HA
NIE
O’C
ON
NO
R

Sources: UNAIDS Investment Framework Study Group3; UN Population Division, 2010 revision4; USAID conversion factors2; Guttmacher Institute. Adding it up: The costs and benefits of investing in family planning and maternal and newborn health (estimation methodology), 2011.5
TOTAL MARKET APPROACH CASE STUDY | SOUTH AFRICA11
ResultsUNIVERSE OF NEED*In 2012, approximately 848 million condoms were needed to cover all risky sex acts, 8% more than were required in 2006. The need for condoms is expected to increase as the population grows. For family planning, the universe of need increased from 77 million in 2006 to 79.5 million in 2012. While the universe of need greatly exceeded total distribution in all years, there was some encouraging growth. In 2012, distribution of male condoms met approximately 56% of the need for HIV prevention, compared to just 41% in 2009.
* Total universe of need for condoms could be as low as the number needed for HIV prevention or as high as the sum of the universe of need for HIV prevention and family planning. Most likely, total need falls somewhere between these two figures. A lack of data on dual protection prevents our ability to estimate the total number of condoms needed per year for both HIV prevention and family planning.
UNIVERSE OF NEED & TOTAL CONDOMS DISTRIBUTED
In South Africa’s
current market, the
number of condoms
needed to protect
all sexual acts from
HIV and unplanned
pregnancy is much
higher than the actual
number of condoms
on the market.

TOTAL MARKET APPROACH CASE STUDY | SOUTH AFRICA12
CONDOM USE In 2005, fewer than half of men and women aged 15-49 reported using condoms the last time they had sex.12 The Human Sciences Research Council (HSRC) in South Africa reports that by 2008, condom use had increased more than 50%, with approximately 67% of men and 63% of women reporting that they used a condom the last time they had sex.20 However, preliminary HSRC reports for 2012 indicate that the trend has reversed. Between 2008 and 2012, condom use decreased among all age groups, with the exception of females over the age of 50.6 Among youth aged 15-24, only 67% of males and 51% of females reported using a condom the last time they had sex, compared to 85% of men and 67% of women in 2008.6 Reports from national surveys indicate that condom use is higher among key populations at risk. The 2013 National Sex Worker Programme Evaluation report found that condom use is much higher among sex workers, one key population at risk for HIV in South Africa. Ninety-five percent of sex workers reported that they used a condom the last time they had sex with a client, and 81% said they used a condom the last time they had sex with a partner who was not a client.14 Since raw behavioral data were not available to the authors, we could not analyze other trends in condom use, including condom use among key populations at risk.
PERCENTAGE OF RESPONDENTS WHO USED A CONDOM AT LAST SEX
The percentage of
males and females
using condoms
in South Africa
increased between
2005 and 2008, but
has since decreased.
Sources: Simbayi, L. (2013). South African National HIV Prevalence, Incidence and Behavior Survey, 2012: Behavioural data and male circumcision. Oral presentation during Satellite session on the 2012 National HIV Household Survey: Key Findings together with Shisana, O., Rehle, T. and Zuma, K. at the 6th South African AIDS Conference held at the International Convention Centre in Durban, 18-21 June 2013.6
72.8%
45.4%
67.4% 67.4%
55.7%
35.9%
66.5%62.5%
85.2%
51.0%

South Africa’s
condom market
is dominated by
the public sector.
TOTAL MARKET APPROACH CASE STUDY | SOUTH AFRICA13
MARKET VOLUME From 2008 to 2012, the total market volume for condoms increased from 359 million to 473 million.7,8,9 South Africa’s condom market has been and remains dominated by the public sector. Free condoms have accounted for 82% to 87% of the total market since 2008. 7,8,9 Social marketing sales have consistently increased over the years, more than tripling since 2006. In 2012, more than 70 million socially marketed condoms were sold.7 Using projections, we estimate that 83 million Trust and Lovers+ condoms will be sold in 2013. The commercial sector has also grown over time, from approximately 4 million condoms sold in 2006 to 10 million in 20118. The commercial sector only accounts for approximately 2% of the total market in all study years. Now that socially marketed condoms are being sold as commercial brands, the commercial sector will account for a greater percentage of the total market.
DISTRIBUTION BY SECTOR
Sources: PSI7, Nielsen8, National Department of Health9
*For 2013, the social marketing sector is considered “commercial sector” because its condoms are profitable. Where official data were unavailable, figures used reflect best estimates. **2012 public sector distribution figures were used for 2013
ST
EP
HA
NIE
O’C
ON
NO
R
TOTAL MARKET APPROACH CASE STUDY | SOUTH AFRICA14
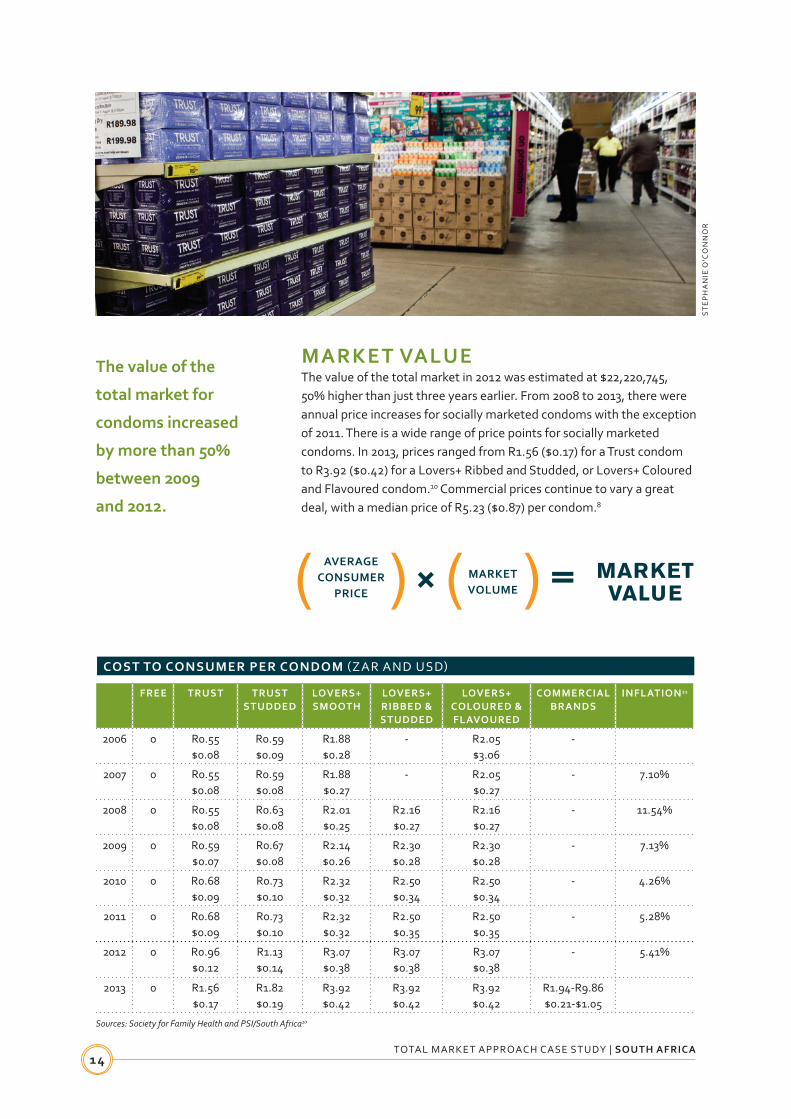
MARKET VALUEThe value of the total market in 2012 was estimated at $22,220,745, 50% higher than just three years earlier. From 2008 to 2013, there were annual price increases for socially marketed condoms with the exception of 2011. There is a wide range of price points for socially marketed condoms. In 2013, prices ranged from R1.56 ($0.17) for a Trust condom to R3.92 ($0.42) for a Lovers+ Ribbed and Studded, or Lovers+ Coloured and Flavoured condom.10 Commercial prices continue to vary a great deal, with a median price of R5.23 ($0.87) per condom.8
AVERAGECONSUMER
PRICE
MARKET VOLUME
MARKET VALUE
The value of the
total market for
condoms increased
by more than 50%
between 2009
and 2012.
ST
EP
HA
NIE
O’C
ON
NO
R
COST TO CONSUMER PER CONDOM (ZAR AND USD)
FREE TRUST TRUSTSTUDDED
LOVERS+ SMOOTH
LOVERS+ RIBBED & STUDDED
LOVERS+ COLOURED & FLAVOURED
COMMERCIALBRANDS
INFLATION21
2006 0 R0.55$0.08
R0.59$0.09
R1.88$0.28
- R2.05$3.06
-
2007 0 R0.55$0.08
R0.59$0.08
R1.88$0.27
- R2.05$0.27
- 7.10%
2008 0 R0.55$0.08
R0.63$0.08
R2.01$0.25
R2.16$0.27
R2.16$0.27
- 11.54%
2009 0 R0.59$0.07
R0.67$0.08
R2.14$0.26
R2.30$0.28
R2.30$0.28
- 7.13%
2010 0 R0.68$0.09
R0.73$0.10
R2.32$0.32
R2.50$0.34
R2.50$0.34
- 4.26%
2011 0 R0.68$0.09
R0.73$0.10
R2.32$0.32
R2.50$0.35
R2.50$0.35
- 5.28%
2012 0 R0.96$0.12
R1.13$0.14
R3.07$0.38
R3.07$0.38
R3.07$0.38
- 5.41%
2013 0 R1.56$0.17
R1.82$0.19
R3.92$0.42
R3.92$0.42
R3.92$0.42
R1.94-R9.86$0.21-$1.05
Sources: Society for Family Health and PSI/South Africa10
TOTAL MARKET APPROACH CASE STUDY | SOUTH AFRICA15
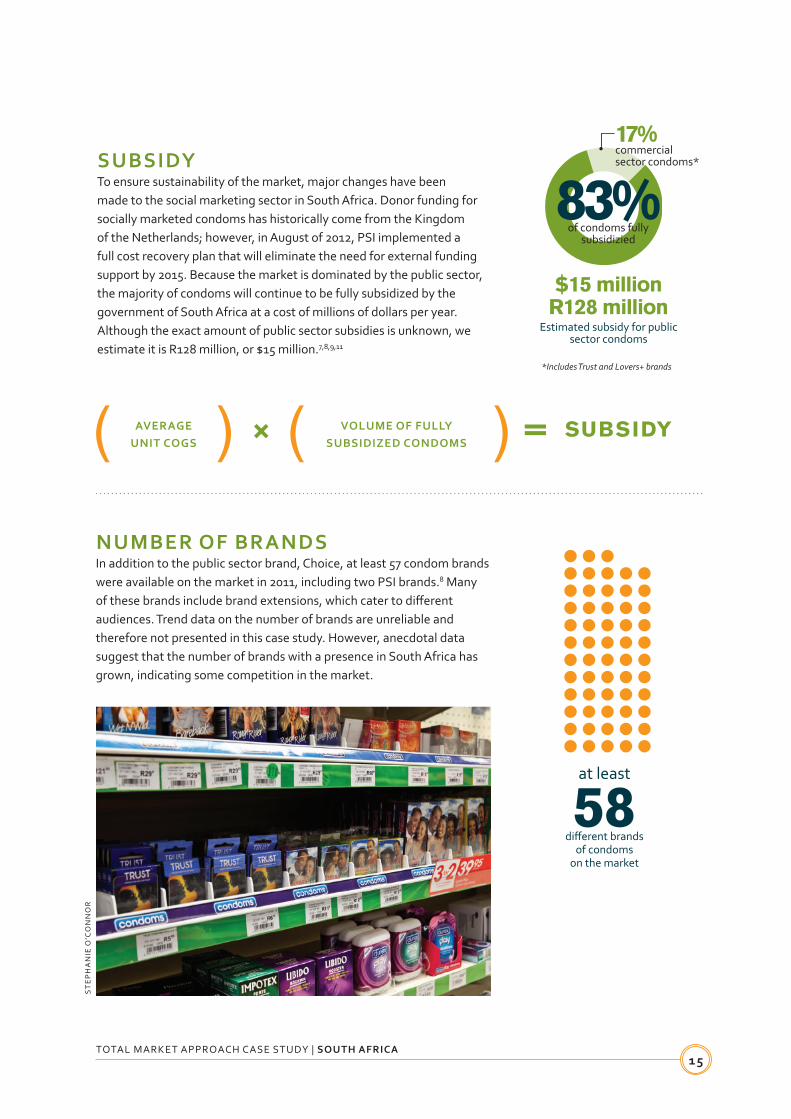
SUBSIDYTo ensure sustainability of the market, major changes have been made to the social marketing sector in South Africa. Donor funding for socially marketed condoms has historically come from the Kingdom of the Netherlands; however, in August of 2012, PSI implemented a full cost recovery plan that will eliminate the need for external funding support by 2015. Because the market is dominated by the public sector, the majority of condoms will continue to be fully subsidized by the government of South Africa at a cost of millions of dollars per year. Although the exact amount of public sector subsidies is unknown, we estimate it is R128 million, or $15 million.7,8,9,11
NUMBER OF BRANDSIn addition to the public sector brand, Choice, at least 57 condom brands were available on the market in 2011, including two PSI brands.8 Many of these brands include brand extensions, which cater to different audiences. Trend data on the number of brands are unreliable and therefore not presented in this case study. However, anecdotal data suggest that the number of brands with a presence in South Africa has grown, indicating some competition in the market.
AVERAGE UNIT COGS
VOLUME OF FULLY SUBSIDIZED CONDOMS
SUBSIDY
● ● ●● ● ● ● ●● ● ● ● ●● ● ● ● ●● ● ● ● ●● ● ● ● ●● ● ● ● ●● ● ● ● ●● ● ● ● ●● ● ● ● ●● ● ● ● ●● ● ● ● ●
at least
58different brands
of condomson the market
*Includes Trust and Lovers+ brands
$15 millionR128 million
Estimated subsidy for public sector condoms
83%of condoms fully
subsidizied
17%commercial sector condoms*
ST
EP
HA
NIE
O’C
ON
NO
R

TOTAL MARKET APPROACH CASE STUDY | SOUTH AFRICA16
EQUITYA lack of available socioeconomic data prevents an analysis on equity, the degree to which condoms are used across socioeconomic strata over time. We were, however, able to use proxy data from the 2005 SABSSM.12 We used “went without food some time in the previous year” and found no significant difference in condom use among those who went without food some time in the previous year and those who did not. We also used education level as a proxy for socioeconomic status and noted similar results: condom use was not more concentrated among those who received the most education. Better and more recent population-based data are necessary to further analyze market equity. ●
ST
EP
HA
NIE
O’C
ON
NO
R
CONDOM USE BY EDUCATION STATUS
55%of men with no
education reported using a condom12
While condom use remains low,
evidence suggests that levels of use have been similar
among the poor and wealthy.
49%of women with no
education reported using a condom12
Source: SABSSM 200512

Challenges and Opportunities
Since 2006, there has been substantial growth in the South African condom market. Although much of this growth is due to the number of free condoms available, the commercial sector has nearly tripled in size and social marketing sales have increased more than three-fold. There are several opportunities
for improvement to meet the country’s need for male condoms.
Although large-scale HIV prevention efforts have resulted in a decrease in new infections, risky sexual behavior and insufficient levels of condom use continue to drive the HIV epidemic. Rates of condom use have also fallen in recent years. It is essential that condom use increase, especially among those who have casual or multiple partnerships. There is a need for additional behavior change communication to continue emphasizing the importance of consistent condom use.
While the government budget allows for expansion of public sector distribution, funds often go unspent because it is difficult to find a distributor and the procurement processes are lengthy and complicated. Frequent shortages of public sector condoms result in lapses in the availability of free condoms. SFH teams that distribute free condoms often operate far below capacity because of these stock shortages. Although the supply of condoms to health facilities is relatively consistent, distribution to non-medical outlets is often inconsistent and reaches only a small portion of the country. While data on equity in condom use are lacking, these distribution challenges are likely to disproportionately affect the poor and those who live in rural areas.
The value of the total market has increased more than 50% since 2009 and is projected to increase as both market volume and price increase for socially marketed and commercial condoms. The change to a cost recovery model indicates strong progress towards market sustainability. However, more than 80% of the South African market continues to be fully subsidized by the government. Improved targeting and marketing by the public, social marketing, and commercial sectors may help increase willingness to pay for condoms, decrease reliance on free products for those who are able to pay, and allow the public sector to increase efficiency by focusing on the poor.
Due to restrictions on data availability, only one data point (2005) is currently available for analysis of trends in condom use. Although some recent figures were available in reports, this study was limited by a lack of nationally representative survey data. As a result, it was not possible to conduct a more in-depth analysis of condom use among key populations at risk or equity in condom use. Without these data, it is difficult to provide specific recommendations about whom should be targeted or how the market should be adapted to reach those most in need. ●
TOTAL MARKET APPROACH CASE STUDY | SOUTH AFRICA17
GAPS AND BARRIERS■ Condom use
remains too low to prevent all new HIV infections and has decreased since 2008
■ There are stock shortages for free condoms
■ Coordination between public sector entities is limited
■ Public sector funds for distribution to non-medical outlets are insufficient
■ Reporting systems are inadequate

TOTAL MARKET APPROACH CASE STUDY | SOUTH AFRICA18
Recommendations Our research yielded the following recommendations for policymakers, donors and other stakeholders. Recommendations come from a TMA perspective and are intended to support the three sectors – public, socially marketed, and private – to work together to grow and sustain South Africa’s condom market.
INCREASING INFORMED DEMANDCondom use has decreased across most age groups in the last several years. This trend is alarming
and efforts should be made to increase condom use to prevent new HIV infections. Additional condom promotion and behavior change communication is critical, with an emphasis on generic communications that promote the condom category, not just specific brands. Campaigns that target key populations, including youth, are also necessary.
INCREASING DISTRIBUTION TO NON-MEDICAL OUTLETS: Public sector condom distribution by NGOs to non-medical outlets is less extensive than distribution
to health facilities. Ensuring that condoms, including free condoms, are available in outlets where risky behavior takes place is essential. Increasing condom distribution in bars, especially by taking better advantage of the SAB/Miller public-private partnership, should improve condom availability.
IMPROVING COORDINATION BETWEEN KEY STAKEHOLDERSFor more effective free condom distribution, better coordination is needed between all
stakeholders. Within the public sector, improved coordination between condom suppliers, distributors, and government entities would help prevent stock-outs and increase efficiency. Coordinating bodies should ensure that money is appropriately allocated for distribution and warehousing, especially in the provinces.
REPORTINGImproved reporting systems are required for forecasting how many condoms are needed on
the market. Consistent reporting would facilitate efficient and effective decisions by the South African government, SFH and other stakeholders. A common data repository might be one way for sectors to work together to share information that would benefit the total market. In addition, information on TMA metrics should be collected in national surveys. High quality, accessible survey data are required for informing decisions about the condom market, specifically which groups should be targeted with free condoms or behavior change communication. A lack of accessible and raw data on condom use also makes it difficult to know if marketing strategies are working to inform condom use and market equity. Finally, knowing about condom use for dual protection would improve distribution and ensure that condoms are available in targeted sites for HIV prevention and integrated into family planning programs.
UTILIZING AND STRENGTHENING PARTNERSHIPSThe public sector has already entered into successful partnerships with several private companies.
These partnerships maximize the use of government funds and encourage involvement of community partners. The South African government should make every effort to strengthen existing partnerships with the private sector and form new partnerships to further support the public sector. ●

TOTAL MARKET APPROACH CASE STUDY | SOUTH AFRICA19
Acronym KeyCDC United States Center for Disease
Control and PreventionCOGS Cost of goods soldFP Family PlanningHSRC Health Sciences Research CouncilMOH Ministry of HealthMSM Men who have sex with menNDOH South African National Department
of HealthNGOs Non-governmental organizationsPSI Population Services InternationalSABCOHA South African Business Coalition on
HIV/AIDSSABSSM South African National HIV
Prevalence, Behaviour and Communication Survey
SFH Society for Family HealthSTIs Sexually Transmitted InfectionsTFD TFD Network AfricaTMA Total Market ApproachUN United NationsUNFPA United Nations Population FundUoN Universe of needUSAID United States Agency for
International DevelopmentUSD United States DollarsZAR South African Rand

TOTAL MARKET APPROACH CASE STUDY | SOUTH AFRICA20
AcknowledgementsWe would like to acknowledge those who contributed to this case study, including:
Dejus Abreu – Head of Consumer Marketing, PSI/South Africa
Scott Billy – Country Representative, SFH/South Africa
Doug Call – Regional Director, Southern Africa, PSI
Collin Chengapar – Head of Sales, PSI/South Africa
Thato Chidarikire – Director, HIV Prevention Strategies, National Department of Health, South Africa
Jennifer Christian – Global Social Marketing Advisor, PSI
Lethu Dlamini – Public Sector Distribution Manager, SFH/South Africa
Adebayo Fayoyin – Regional Communications Advisor for South and East Africa, UNFPA
Ghairunisa Galeta – Regional Project Coordinator, PSI/South Africa
Krishna Jafa – Vice President, Sexual and Reproductive Health and TB, PSI
Agai Jones – Regional Representative, PSI/South Africa
Ben Light – Senior Technical Advisor, UNFPA
Eva Marumo – Deputy Director, South African National Department of Health
Brian McKenna – Deputy Regional Director, Southern Africa, PSI
Tessa Meyer – Head of Marketing and Communications, SFH/South Africa
Miriam Mhazo – Deputy Country Director, SFH/South Africa
Regina Moore – Manager, Communications, PSI
David Nowitz – Head of Customer Marketing, PSI/South Africa
Maria Sese Paul – Graphic Designer, Streetsense
Elena Pirondini – Special Assistant to the Deputy Executive Director, UNFPA
Tlangelani Shilubane – National Program Officer, UNFPA, South Africa
Amy Ratcliffe – Senior Technical Advisor, Metrics, PSI
Meghan Reidy – Technical Advisor, Metrics, PSI
Guy Rogers – General Manager, PSI/South Africa
John Stover – President, Futures Institute
Kanyanta Sunkutu – Programme Specialist, HIV/AIDS, UNFPA
Noah Taruberekera – Regional Researcher, Southern Africa, PSI
Renata Tallarico – Project Coordinator, UNFPA
Jagdish Upadhyay – Chief, Commodity Management, UNFPA
David Walker – Director, Global Social Marketing, PSI
Josiane Yaguibou – Technical Advisor, Reproductive Health and Commodities Security, UNFPA

TOTAL MARKET APPROACH CASE STUDY | SOUTH AFRICA21
REFERENCES
1. O'Sullivan G., C. Cisek, J. Barnes, and S. Netzer. May 2007. Moving Toward Sustainability: Transition Strategies for Social Marketing Programs. Bethesda, MD: Private Sector Partnerships-One project, Abt Associates Inc.
2. USAID. 2011. Couple Years of Protection (CYP). Retrieved from http://transition.usaid.gov/our_work/global_health/pop/ techareas/cyp.html
3. UNAIDS Investment Framework Study Group. 2013.Risky acts estimates. .
4. United Nations Population Division, 2010 Revision.
5. Guttmacher Institute 2011. Adding it up: the costs and benefits of investing in family planning and maternal and newborn health. Estimation Methodology.
6. Simbayi, L. 2013. South African National HIV Prevalence, Incidence and Behavior Survey, 2012: Behavioural data and male circumcision. Oral presentation during Satellite session on the the2012 National HIV Household Survey: Key Findings together with Shisana, O., Rehle, T. and Zuma, K. at the 6th South African AIDS Conference held at the International Convention Centre in Durban, 18-21 June 2013.
7. Population Services International. Annual Distribution Reporting Data 2006-2012.
8. Nielsen 2013. Commercial condom sales data for 2006, 2007, 2008, 2011, and 2012.
9. National Department of Health 2013. National Public Sector Distribution Trends 2003-2012.
10. Society of Family Health and PSI/South Africa. 2013. Consumer prices: socially marketed condoms.
11. PSI/South Africa 2013. Cost of goods sold estimates.
12. Human Sciences Research Council. 2005. South African National HIV Prevalence, Incidence, Behaviour and Communication Survey, 2005. Access granted October, 2012.
13. The National Antenatal Sentinel HIV and Syphilis Prevalence Survey, South Africa, 2011, National Department of Health.
14. Sex Worker Evaluation and Advocacy Task Force 2013. Beginning to Build the Picture: South African National Survey of Sex Worker Knowledge, Experiences and Behaviour.
15. Rispel, L.C., Metcalf, C.A., Cloete, A., Reddy, V. & Lombard, C. 2011. HIV prevalence and risk practices among men who have sex with men in two South Africa cities. Journal of Acquired Immune Deficiency Syndromes, 57 (1), 69-76.
16. South African National AIDS Council and UNAIDS. 2012. Global AIDS Response Progress Report. Retrieved from http://www.unaids.org/en/dataanalysis/knowyourresponse/countryprogressreports/2012countries/ce_ZA_Narrative_Report.pdf
17. UNAIDS. 2012 World AIDS Day Report 2012. Retrieved from http://www.unaids.org/en/media/unaids/contentassets/documents/epidemiology/2012/gr2012/JC2434_WorldAIDSday_results_en.pdf.
18. United Nations Population Fund 2012. The State of World Population. Retrieved from http://www.unfpa.org/webdav/site/global/shared/swp/2012/EN_SWOP2012_Report.pdf.
19. World Bank. (2012). Indicators. Retrieved from www.data.worldbank.org.
20. Shisana, O., Rehle, T., Simbayi, L.C., Zuma, K., Jooste, S., Pillay-van-Wyk, V., Mbelle, N., Van Zyl, J., Parker, W., Zungu, N.P., Pezi, S. & the SABSSM III Implementation Team 2009. South African national HIV prevalence, incidence, behaviour and communication survey, 2008: A turning tide among teenagers? Cape Town: HSRC Press.
21. TheGlobalEconomy.com. 2013. Economy Indicators: Inflation Rates. Retrieved from www.theglobaleconomy.com.
MA
RIL
YN
KE
EG
AN
, CO
UR
TE
SY
OF
PH
OT
OS
HA
RE

South Africa
UNFPA HEADQUARTERS605 Third AvenueNew York, New York 10158USATelephone: + 1-212-297-5000Fax: + 1-212-370-0201Website: www.unfpa.org
UNFPA SOUTH AFRICA351 Francis Baard StreetPretoriaSouth AfricaTelephone: + 27-12-354-8401Fax: + 27-12-354-8419Website: southafrica.unfpa.org
PSI HEADQUARTERS1120 19th Street, Suite 600, NWWashington, DC 20036USATelephone: +1-202-785-0072Fax: +1-202-785-0120Website: www.psi.org
SOCIETY FOR FAMILY HEALTH/ PSI SOUTH AFRICA8 Hillside Road2nd Floor, Block BParktownJohannesburg 2193South AfricaTelephone: + 27-11-484-5320Fax: + 27-11-484-5802Website: www.sfh.co.za