Embed Size (px)
Citation preview
SOUTH AFRICAN ENERGY SECTOR
Presented by Daniel Modise/Vania Mahotas
1
Overview of the RSA electricity industry sources of power
2
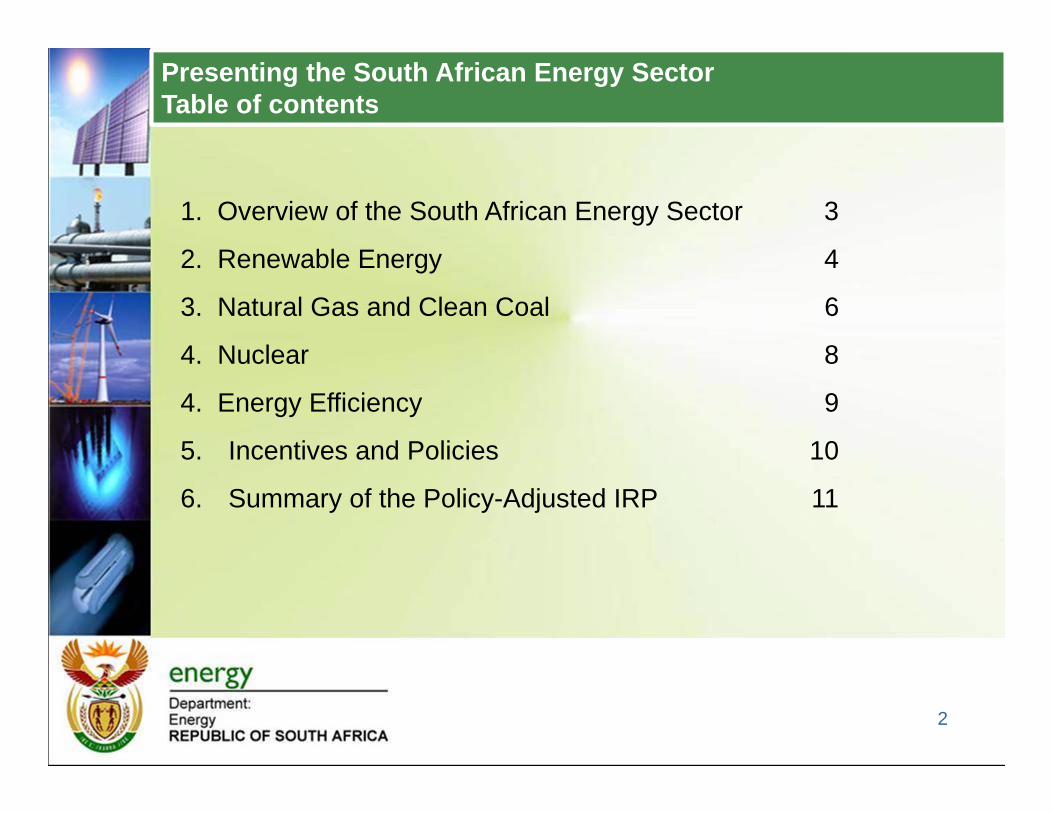
Presenting the South African Energy SectorTable of contents
1. Overview of the South African Energy Sector 3
2. Renewable Energy 4
3. Natural Gas and Clean Coal 6
4. Nuclear 8
4. Energy Efficiency 9
5. Incentives and Policies 10
6. Summary of the Policy-Adjusted IRP 11
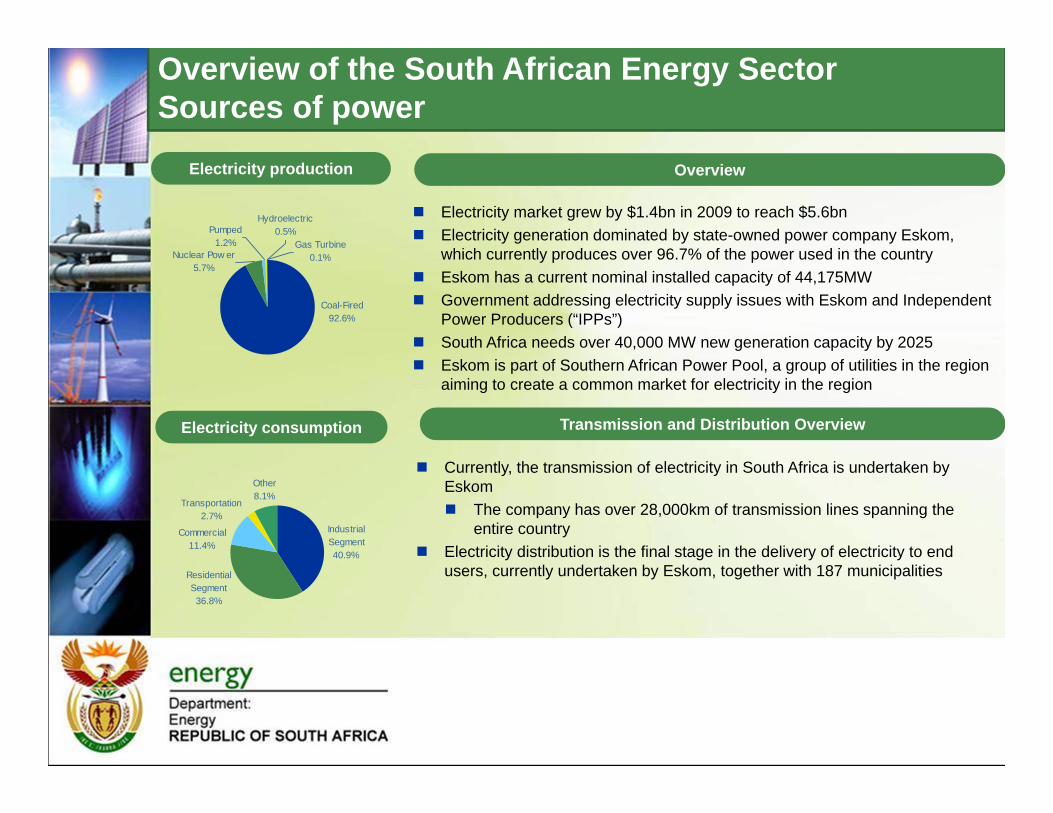
Overview of the South African Energy SectorSources of power
Electricity consumption
Transportation2.7%
Commercial 11.4%
Industrial Segment 40.9%
Residential Segment 36.8%
Other 8.1%
Electricity production
Hydroelectric0.5%Pumped
1.2%
Coal-Fired92.6%
Nuclear Pow er 5.7%
Gas Turbine0.1%
Overview
Electricity market grew by $1.4bn in 2009 to reach $5.6bn Electricity generation dominated by state-owned power company Eskom,
which currently produces over 96.7% of the power used in the country Eskom has a current nominal installed capacity of 44,175MW Government addressing electricity supply issues with Eskom and Independent
Power Producers (“IPPs”) South Africa needs over 40,000 MW new generation capacity by 2025 Eskom is part of Southern African Power Pool, a group of utilities in the region
aiming to create a common market for electricity in the region
Transmission and Distribution Overview
Currently, the transmission of electricity in South Africa is undertaken by Eskom The company has over 28,000km of transmission lines spanning the
entire country Electricity distribution is the final stage in the delivery of electricity to end
users, currently undertaken by Eskom, together with 187 municipalities
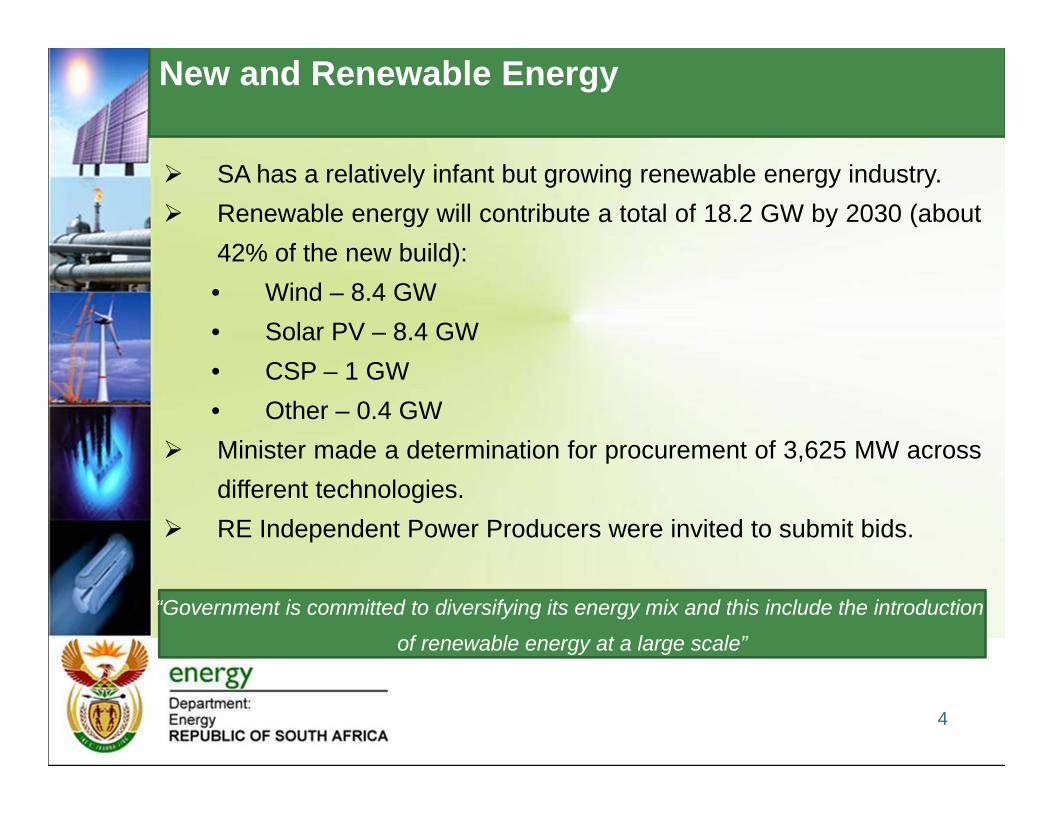
New and Renewable Energy
“Government is committed to diversifying its energy mix and this include the introduction
of renewable energy at a large scale”
4
SA has a relatively infant but growing renewable energy industry. Renewable energy will contribute a total of 18.2 GW by 2030 (about
42% of the new build):• Wind – 8.4 GW• Solar PV – 8.4 GW• CSP – 1 GW• Other – 0.4 GW
Minister made a determination for procurement of 3,625 MW acrossdifferent technologies.
RE Independent Power Producers were invited to submit bids.
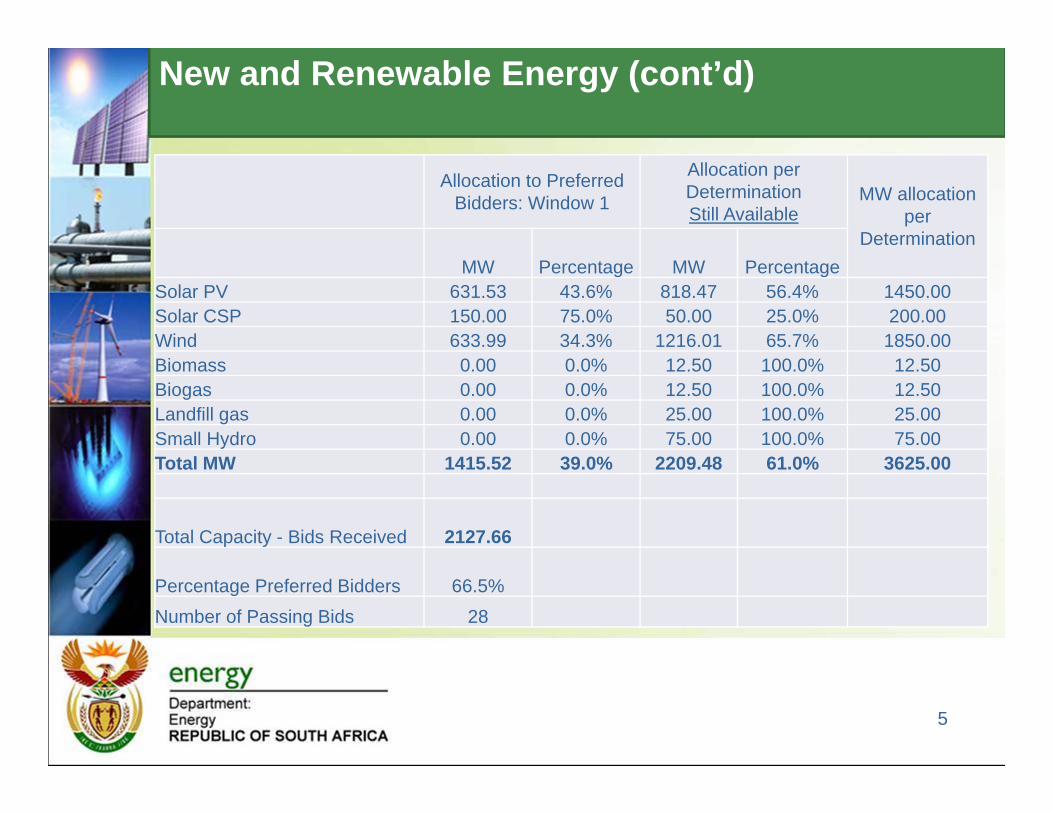
New and Renewable Energy (cont’d)
5
Allocation to Preferred Bidders: Window 1
Allocation per Determination Still Available
MW allocation per
DeterminationMW Percentage MW Percentage
Solar PV 631.53 43.6% 818.47 56.4% 1450.00Solar CSP 150.00 75.0% 50.00 25.0% 200.00Wind 633.99 34.3% 1216.01 65.7% 1850.00Biomass 0.00 0.0% 12.50 100.0% 12.50Biogas 0.00 0.0% 12.50 100.0% 12.50Landfill gas 0.00 0.0% 25.00 100.0% 25.00Small Hydro 0.00 0.0% 75.00 100.0% 75.00Total MW 1415.52 39.0% 2209.48 61.0% 3625.00
Total Capacity - Bids Received 2127.66
Percentage Preferred Bidders 66.5%Number of Passing Bids 28
Natural Gas
6
South Africa has very limited natural gas resources. Natural gas accounts for 3% of energy consumption. Awaiting outcome of the assessment of shale gas
potential estimated to be approximately 485 trillion cubicfeet by the USA Energy Information Administration.
Petro SA efforts to source gas for its Gas-to-Liquidsfacility in Mossel Bay from other African Countries.
IRP 2010 -2030 expects the imported gas to meet 6% ofall new generation capacity and OCGTs to meet 8%
Clean Coal
7
South Africa is committed to the management of efficient use of its coalthrough employment of Clean Coal Technologies such as CarbonCapture Storage (CCS) and the stabilization of CO2 emissions.
CCS development roadmap:• 2009 – Launch of the South African Centre for Carbon Capture
and Storage under South Africa Energy Development Institute(SANEDI).
• 2010 – Launch of Atlas on Geological Storage of in CO2 SouthAfrica.
• 2011 – Regulatory Framework Development included in work plan.• 2016 – conduct a test injection experiment by end of 2016.• 2020 – commission a demonstration plant.• 2025 – commission a commercial scale plant.
Nuclear Programme
Only one nuclear power station (Koeberg), a base-load station witha nominal installed capacity of 1,930 MW (c.5%).• Construction for the plant began in 1976 and full operations in
1985.• Produced 12,806 GWh electricity in year ended 31 March
2010.
It is intended that nuclear will comprises 17% of South Africa’sbase load energy mix by 2030.
9,600 MW will be added by 2030.
8
Energy Efficiency Programmes Energy Efficiency target is to reduce final energy demand by 12% by 2015. Targeted sectors – industry and mining, power generation, commercial and
public sector buildings, residential sector & transport sector. Industrial energy efficiency programme is underway and tax incentives and
rebates are used to encourage sustainable energy sector development andenergy use through efficient practices.
Appliance labelling programme is currently underway – companies areencouraged to manufacture and sell appliances which are energy efficienti.e. Samsung and Phillips have already signed the voluntary accord andother companies are following suit.
Implementing a fiscus programme where municipalities and Eskom areimplementing energy efficiency technologies on streetlights, buildings andinstallation of Solar Water Geysers (1 million SWHs to be installed by2015).
9
Incentives and Policies Incentives:
• Rebates for installation of energy efficiency and demand side management
interventions.
• Tax credits for deploying energy efficiency interventions.
• Tax credits for investing in Green field projects.
• Government allocated R 20 billion to Industrial Development Corporation
(IDC) to invest in Green Projects.
Policies:
• Renewable Energy White Paper 2003.
• Energy Efficiency Strategy 2005.
• Regulations on Energy Savings Allowance 2011.
• An Integrated Resource Plan 2010 – 2030.
• New Generation Capacity Regulations 2009.
10
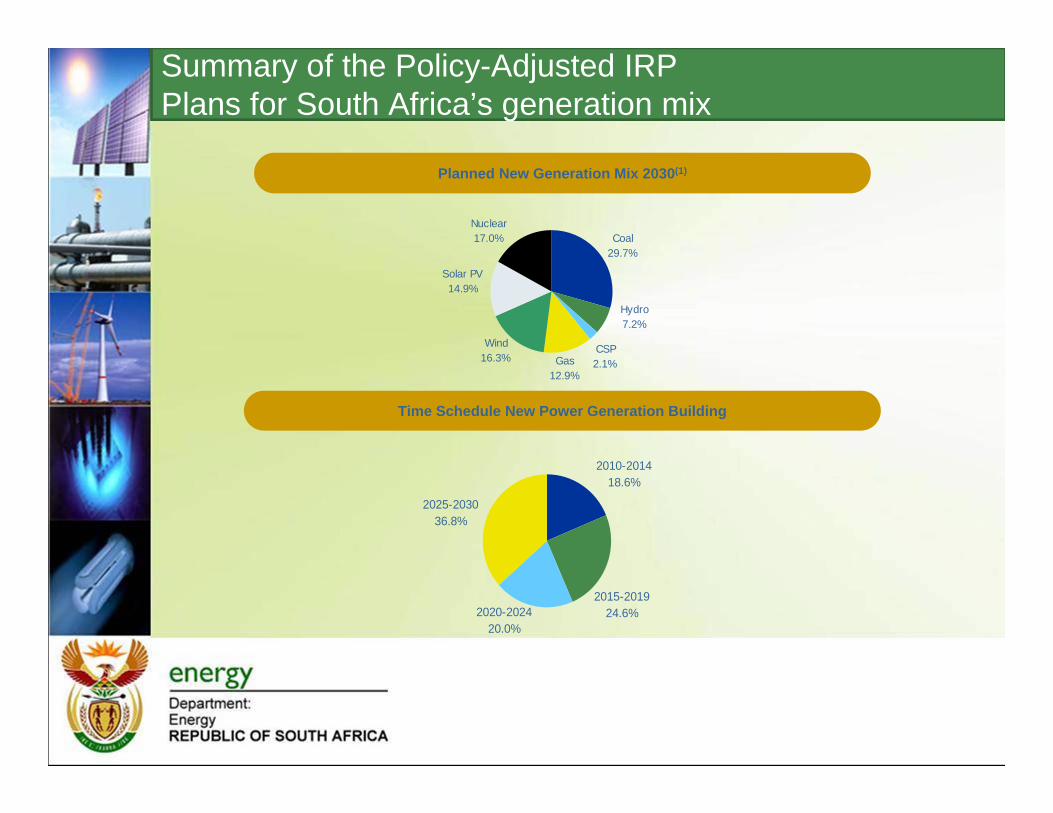
Summary of the Policy-Adjusted IRPPlans for South Africa’s generation mix
Planned New Generation Mix 2030(1)
Nuclear17.0%
Solar PV14.9%
Gas12.9%
CSP2.1%
Coal29.7%
Hydro7.2%
Wind16.3%
Time Schedule New Power Generation Building
2025-203036.8%
2020-202420.0%
2010-201418.6%
2015-201924.6%
THANK YOU….
12