Embed Size (px)
Citation preview
Univers
ity of
Cap
e Tow
n
South African Grassland Ecology and its Restoration
Nicholas Paul Zaloumis
Thesis presented for the degree of the Master of Science (MSc) in the Department of Biological
Sciences, University of Cape Town, South Africa
Supervised by Professor William Bond
Co-Supervised by Professor Kevin Kirkman
June 2013
The copyright of this thesis vests in the author. No quotation from it or information derived from it is to be published without full acknowledgement of the source. The thesis is to be used for private study or non-commercial research purposes only.
Published by the University of Cape Town (UCT) in terms of the non-exclusive license granted to UCT by the author.
Univers
ity of
Cap
e Tow
n

Univers
ity of
Cap
e Tow
n
ii
Declaration
I, Nicholas Paul Zaloumis, hereby,
1. grant the University of Cape Town free licence to reproduce the above thesis in whole or
in part, for the purpose of research;
2. declare that:
i. the above thesis is my own unaided work, both in concept and execution,
ii. neither the substance nor any part of the above thesis has been submitted in the past, or
is being, or is to be submitted for a degree at this University or at any other university.
I am now presenting the thesis for examination for the degree of Master of Botany, Plant
Ecology.
Nicholas Paul Zaloumis
Univers
ity of
Cap
e Tow
n
iii
Acknowledgements:
I would firstly like to thank my Supervisor, William Bond, without his help and energy this
project would only be half the success it was. Thank you for your energy, for teaching me to
think, providing suggestions, to refine my ideas and helping me keep an open mind no
matter what. Also for giving me the freedom to guide my own project and for the patience
you showed me when it came to putting this all together onto paper in the end.
I would like to thank Prof. Kevin Kirkman for his supervision in setting up and defining
chapter four and making it possible to work on the potting experiment at the School of Life
Sciences at UKZN, PMB campus. Without the access to the campus I would not have had the
ability to follow through with this phase of the project.
I would like to thank the staff of Mpumalanga Parks Board , EKZN Wildlife and iSimangaliso
Wetland Authority for helping facilitate access to study areas. In particularly Mervyn Lotter
from MBP, Dirk Rousouw, the EKZN head ranger for the Eastern Shores and Nerosha
Govender and Bronwyn James of IWA. I would also like to thank Makobulaan Nature
Reserve for their help and interest in allowing this project to happen.
I would like to thank the staff of Silverglen Nature reserve for all their help in finding seed
for the project and letting me test my restoration ideas in the reserve. Particularly Ross
Crouch and Isaac.
I would like to thank John and Sandy Burrows for making me feel welcome at Buffelskloof
Nature Reserve, offering me discounted accommodation and for all their help in identifying
difficult plant specimens and for the several discussion of the matter of grasslands, their
restoration and problems that Nature Reserve managers face. Also for letting me use
several of the resources available at Buffelskloof Nature Reserve.
Thank you to all the field assistants that put up with the long hours, some hard labour and
all the laughing and discussion and sharing of great experiences that come from being in the
outdoors. To Rob Skelton, Cathy Pineo, Eleanor Shadwell and Michelle Malan for spending

Univers
ity of
Cap
e Tow
n
iv
extended periods of time in the field with me, doing lots of the dirty work. Especially
Eleanor and Michelle for all the back breaking work carrying hundreds of sods all over the
Eastern Shores of iSimangaliso. Included in this were the numerous discussions on all our
related work and helping to refine my ideas. To the 2010 second year students who helped
out in Buffelskloof, Geeta Payle, Katherine Smit, Rageema Joseph, Alison Bijl and Tanya
Scott. To the 2011 second year students who helped out the following year, Chantel Elston,
Lucas Du Toit, Jacques Nel, Ariella Rink, Sizakele Sibanda and Storme Viljoen. To Joy Waddell
for keeping me company in the Biome Boundary Bakkie as I scoped out several potential
sites all the way from Gauteng to Durban via Lydenberg and St Lucia.
Thank you to Julia Wakeling for being there when I needed a person to talk to whenever I hit
a wall or just needed a guiding hand from somebody who has been there before. Also
thanks for all the help with organising and coming along on the 2nd year student trips which
we lead together. Thanks for helping with any admin related issues.
Thank you Tracy Nowell for helping me sort out all my soil lab needs and to Simon Power
and Julia Angstmann for advice on how to approach the soil analysis.
Thank you to Emma Gray for helping with R Studio and developing my rarefaction plots.
To my dad, Alex Zaloumis, who came on numerous field trips, helped with lots of field work,
both survey and back breaking restoration labour and the simple wandering around in the
field looking for sites. For keeping me up to date with cricket scores when I was in the field
and for all the discussion and arguments we would have over dinner, sitting on the porch,
and for when you would rather be fishing or birding instead of carrying heavy sods, but you
came along anyways. Also for all the advice and feedback during my write up period. It was
great to spend the time with you out in the field, and very much appreciated.
I would really like to thank my family for all the support they gave during my Masters. To my
mother who supported me from the beginning, worried for me when I was on the road and
made sure that I always had food on the table in the busier times. Thanks to George and Liz
Zaloumis, Penny and Craig Sinclair, Andrew and Tracy Zaloumis, Molly-Ann Zaloumis and

Univers
ity of
Cap
e Tow
n
v
Cath Sinclair for having me in their homes, allowing me to store my things in there space
and opening their homes to some of my field assistants.
I would like to thank the many people for the initial scoping discussions at the beginning of
this project. Clinton Carbutt, Rob Scot-Shaw, Ian Rushworth, Roger Uys and Ricky Taylor of
Ezemvelo KZN Wildlife. Angus Burns and Brent Corcoran of the Enkangala Grasslands Project
and WWF. Isabel Johnson from CREW. Prof. Timm Hoffmann. Peta Hardy, Sappi, Chris
Birchmore, Mondi and Steve Germishuizen, Grasslands Program. Geoff Nichols and Elsa
Pooley.
I would like to thank the University of Cape Town’s Botany Department staff and
administrators, particularly Sandy Smuts and Tamara Nozewu.
This project was made possible by funding from the Andrew W Mellon foundation, the
SANBI Grasslands Project and the Postgraduates Office of the University of Cape Town.
It has been an eye opening and enriching experience. Thank you for all being a part of it.
Univers
ity of
Cap
e Tow
n
vi
Table of Contents
Declaration .................................................................................................................................. i
Acknowledgements .................................................................................................................... ii
Table of contents ...................................................................................................................... vi
List of tables ............................................................................................................................... x
List of figures ............................................................................................................................ xii
Chapter 1: Introduction ............................................................................................................. 1
Grasslands misunderstood ..................................................................................................... 1
The importance of grasslands ................................................................................................ 2
Grasslands in South Africa ...................................................................................................... 3
Grasslands conservation and restoration .............................................................................. 4
Structure of this Thesis ........................................................................................................... 5
References .............................................................................................................................. 9
Chapter 2: Mesic C4 grasslands of South Africa and their fragility ........................................ 13
Abstract ................................................................................................................................ 13
Introduction .......................................................................................................................... 14
Methods ............................................................................................................................... 18
Study Areas ....................................................................................................................... 18
Plot selection .................................................................................................................... 20
Sampling method ............................................................................................................. 21
Plant survey ...................................................................................................................... 21
Underground biomass survey .......................................................................................... 22
Soil sampling ..................................................................................................................... 22
Data analysis ..................................................................................................................... 23
Results .................................................................................................................................. 27
Sample areas .................................................................................................................... 27
Species richness ................................................................................................................ 27
Species richness patterns for fire, elevation and vegetation treatments ........................ 28
Study area heterogeneity ................................................................................................. 32
Univers
ity of
Cap
e Tow
n
vii
Species Turnover .............................................................................................................. 34
Understory in Pine Stands ................................................................................................ 35
Plant ground and dominant species cover ....................................................................... 36
Community composition .................................................................................................. 38
Plant growth form composition ....................................................................................... 39
Ordinations ....................................................................................................................... 40
Plant family richness and abundance ............................................................................... 42
Below ground biomass ..................................................................................................... 43
Succession......................................................................................................................... 45
Soils ................................................................................................................................... 46
Discussion ............................................................................................................................. 48
Composition and characteristics of the South African grassland biome ......................... 48
Are secondary grasslands recovering from afforestation and ploughing? ...................... 48
Potential physical and biological restoration constraints for South African grassland ... 51
Conclusion ............................................................................................................................ 54
References ............................................................................................................................ 55
Chapter 3: Transplanting mixed species sods as a method for re-introducing natural
resprouting species into secondary grasslands in South Africa. ............................................. 62
Abstract ................................................................................................................................ 62
Introduction .......................................................................................................................... 63
Methods ............................................................................................................................... 69
Study area selection ......................................................................................................... 69
Plot selection and preparation ......................................................................................... 70
Surveys .............................................................................................................................. 71
Data analysis ..................................................................................................................... 72
Results .................................................................................................................................. 74
Initial sod plant cover and richness .................................................................................. 74
Final sod plant cover and richness ................................................................................... 74
Change of sod diversity for BCF and ESI over 12 months ................................................ 75
Plant growth form composition ....................................................................................... 76
Comparison of plant cover and richness after four months ............................................ 78
Univers
ity of
Cap
e Tow
n
viii
Comparison of plant cover and richness after 12 months ............................................... 80
Using burnt and un-burnt sods for transplanting ............................................................ 81
Effect of fire at survey T3 ................................................................................................. 81
Discussion ............................................................................................................................. 82
Practicalities of mixed species sod transplants ................................................................ 84
Criteria for measuring transplant success ........................................................................ 85
Conclusion ............................................................................................................................ 86
References ............................................................................................................................ 87
Chapter 4: Grass competition as a constraint for grassland forb seedling establishment ..... 92
Abstract ................................................................................................................................ 92
Introduction .......................................................................................................................... 93
Methods ............................................................................................................................... 96
Forb and grass species selection ...................................................................................... 96
Pot preparation ................................................................................................................ 97
Measurement of response variables ................................................................................ 98
Data analysis ..................................................................................................................... 98
Results ................................................................................................................................ 100
Forb biomass .................................................................................................................. 100
Plant leaf number and basal width ................................................................................ 103
Forb biomass growth over 11 months ........................................................................... 104
Forb leaf and root length ................................................................................................ 107
Forb root wet vs. dry weight .......................................................................................... 108
Discussion ........................................................................................................................... 109
Conclusion .......................................................................................................................... 112
References .......................................................................................................................... 113
Chapter 5: Conclusion ............................................................................................................ 116
What are the key difference between natural and secondary grasslands? ...................... 116
What is a reference grassland? ...................................................................................... 116
What are the key differences between natural and secondary grasslands? ................. 117
Do secondary grasslands recover? ................................................................................. 117
Univers
ity of
Cap
e Tow
n
ix
Can sods be used as a method to re-introduce native grasslands species into secondary
grasslands? ......................................................................................................................... 118
Can we restore South African grasslands? ..................................................................... 118
What restoration methods could we use in South African grasslands? ........................ 119
Was the method of introducing mixed species sods into secondary grasslands
successful? ...................................................................................................................... 119
How are grassland forb species affected by grass competition?....................................... 120
How important is grass competition .............................................................................. 120
Do grassland forb seedlings compete successfully with grass species? ........................ 120
Future research .................................................................................................................. 121
Can secondary grasslands be restored? ............................................................................. 123
References .......................................................................................................................... 125
Appendix: .............................................................................................................................. 129
Appendix 1: Example of resprouting grassland forb species ............................................. 129
Appendix 2: Examples of grassland Geoxylic suffrutices ................................................... 130
Appendix 3: Examples of underground storage organs found in South African grasslands
............................................................................................................................................ 131
Appendix 4: Examples of burnt highland grassland ........................................................... 132
Appendix 5: Examples of burnt coastal grassland ............................................................. 133
Appendix 6: Examples of un-burnt highland grassland ..................................................... 134
Appendix 7: Family richness and abundance for Makobulaan Nature Reserve ................ 135
Appendix 8: Family richness and abundance for Buffelskloof Nature Reserve ................. 136
Appendix 9: Family richness and abundance for Blue Crane Farm ................................... 137
Appendix 10: Family richness and abundance for Eastern Shores, iSimangaliso Wetland
Park ..................................................................................................................................... 138
Appendix 11: Preliminary simple, four step method to aid in the identification of natural
grassland and distinguish it from secondary grassland .................................................... 139
Appendix 12: Mixed sod restoration plot preparation ...................................................... 142
Univers
ity of
Cap
e Tow
n
x
List of Tables
Chapter 2:
Table 2.1: GLM for all study areas compared between sites and vegetation treatments using
natural and secondary grassland total plant and forb species richness averages separately 27
Table 2.2: Average total plant species richness. # Plots = number of plots per treatment per
study area, N = natural, S = secondary .................................................................................... 28
Table 2.3: GLMs comparing total plant and forb species richness averages between
elevation and fire treatments for all study areas .................................................................... 29
Table 2.4: GLMs comparing total plant and forb species richness averages for vegetation
treatments (Natural vs. pine and ploughed) with fire treatments for all study areas ............ 31
Table 2.5: GLMs comparing the average total plant ground cover and the average total
cover of the top five species for vegetation treatments (Natural vs. pine and ploughed) with
fire treatments for all study areas ........................................................................................... 36
Table 2.6: Independent t-test by variables to compare the average below ground biomass
for non-graminoid plant species and forb species between vegetation treatments (Natural
vs. secondary) for Makobalaan (MNR) and Eastern Shores (ESI) ............................................ 44
Table 2.7a and b: Soil properties comparison for vegetation treatments (Natural - N vs.
secondary - S and pine stand – PS or Ploughed – Pl) for Makobalaan (MNR - a), Buffelskloof
(BKNR - b) and Blue Crane (BCF - b). MNR includes two separate age treatments, 10 and 40
years since deforestation. Significant differences are shown for natural treatment values
versus all other treatments...................................................................................................... 47
Chapter 3:
Table 3.1: Total average plant percentage cover and species richness of quadrats for both
treatments in each study area. Significant difference between grass treatments (Cleared (C)
and Un-cleared (U)) = * ............................................................................................................ 74
Table 3.2: GLM of Blue Crane Farm and Eastern Shores, iSimangaliso restoration plot
averages for three surveys over 12 months assessing the changes in plant percentage cover
and species richness for transplanted sods ............................................................................. 75
Univers
ity of
Cap
e Tow
n
xi
Table 3.3: GLM of Blue Crane Farm and Eastern Shores, iSimangaliso restoration plot
averages for three surveys over 12 months assessing the changes in plant growth form
percentage cover and species richness for transplanted sods with time. F – Forbs, G –
Grasses, S – Sedges, GS – Geoxylic suffrutices ........................................................................ 77
Table 3.4: GLM comparing all three study area restoration plot averages for the three
surveys over 12 months. Net changes between surveys were assessed in plant percentage
cover and species richness for transplanted sods with time and between grass treatments 79
Table 3.5: GLM comparing Blue Crane Farm and Eastern Shores, iSimangaliso restoration
plot averages for the three surveys over 12 months. Net changes between surveys were
assessed in plant percentage cover and species richness for transplanted sods with time and
between grass treatments ....................................................................................................... 80
Table 3.6: GLM significance values for survey 3 plant percentage cover and species richness
in BCF and ESI comparing un-burnt and burnt restoration plots ............................................ 81
Chapter 4:
Table 4.1. Number of pots per grass treatment (rows) per species (columns). ...................... 97
Table 4.2. GLM of forb species comparing leaf and root dry weight averages for each
grassland treatment .............................................................................................................. 100
Table 4.3. Comparison of wet and dry root weights for each forb species showing the
average calculated weight loss and percentage loss among grass treatments. * indicates
Tukey post-hoc test significant difference between the control and grass treatments. ** is
significant difference from both the control and the other grass treatments. ..................... 108
Univers
ity of
Cap
e Tow
n
xii
List of Figures
Chapter 1:
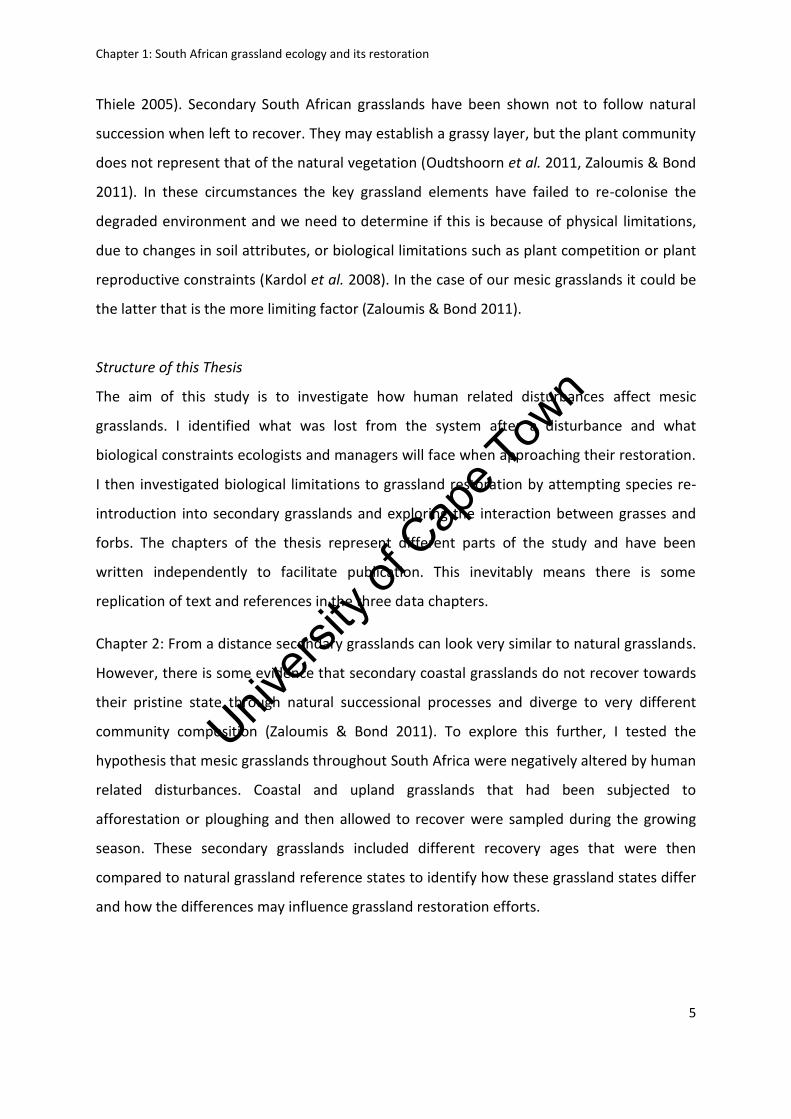
Figure 1.1: Examples of the diverse range of flowering forbs found in South African grassland
.................................................................................................................................................... 7
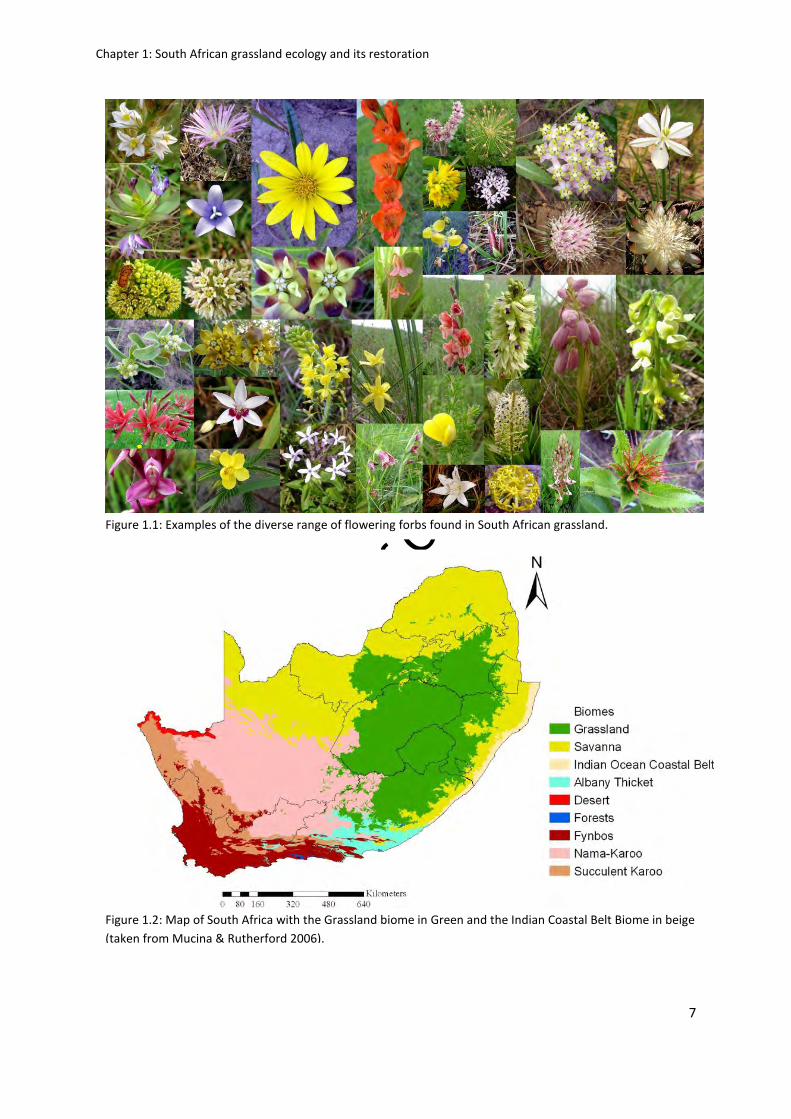
Figure 1.2: Map of South Africa with the Grassland biome in Green and the Indian Coastal
Belt Biome in beige (taken from Mucina & Rutherford 2006) .................................................. 7
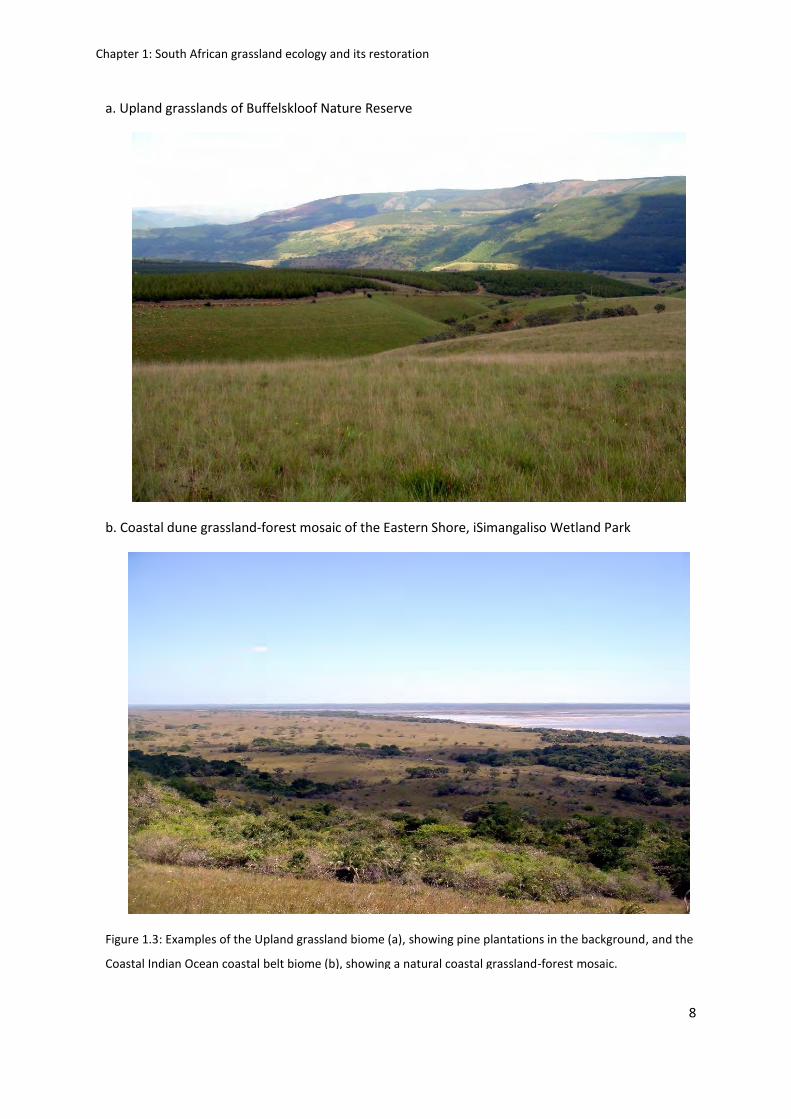
Figure 1.2: Examples of the Upland grassland biome (a), showing pine plantations in the
background, and the Coastal Indian Ocean coastal belt biome (b), showing a natural coastal
grassland-forest mosaic ............................................................................................................. 8
Chapter 2:
Figure 2.1: The four main study areas situated within Mpumalanga and KwaZulu-Natal ...... 18
Figure 2.2: Nested quadrat method of sampling at each plot................................................. 21
Figure 2.3: Average species richness of forbs for natural (N) and secondary (S) treatment
plots for each study area. MNR, BNR - Mesic Highveld Grassland Bioregion. BCF - Sub-
escarpment Grassland Bioregion. ESI - Indian Ocean Coastal Belt. MNR, BNR and ESI - S are
pine treatments. BCF - S are ploughed treatments ................................................................. 28
Figure 2.4a and b: a. Average species richness for both total number of species for natural
(N) and secondary (S) treatment plots at each elevation range across the study. F-value:
27.88, P<0.0001. b. Average forb species per meter squared for N and S treatments at each
elevation range across the study. F-value: 9.23, P<0.0005 ..................................................... 30
Figure 2.5: Average total plant species richness for burnt and unburnt plots comparing
vegetation treatments. N – Natural, Pi – Afforested, Pl – Ploughed. F-value: 7.94, p < 0.001
.................................................................................................................................................. 32
Figure 2.6 a - h: Average species rarefaction curves showing increasing species with
increasing plots for both natural and secondary treatments. The left column shows total
species and the right column shows forbs species only .......................................................... 33
Figure 2.7 a - d: Species richness turnover for increasing nested plot area from 1m2 to 78m2
for main sample areas a. MNR b. BKNR d. ESI Squares indicate total species and diamonds
Univers
ity of
Cap
e Tow
n
xiii
indicate forb species only. Black indicates natural sites and grey indicates secondary
treatments ............................................................................................................................... 34
Figure 2.8: Average number of species found under afforested (PS) and recently clear-felled
and burnt (CF) plots compared to natural (N) and secondary (S) treatment plots for the MNR
and BKNR study areas. F-value: 178.11, P<0.0001 .................................................................. 35
Figure 2.9: Total plant ground cover (a) and total cover of the top 5 most dominant species
(b) for each vegetative treatment, N – Natural, Pi – Pine, Pl – Ploughed, for both burnt (B)
and un-burnt (U) treatments ................................................................................................... 36
Figure 2.10: Average total percentage cover for each of the top 5 most dominant species per
plot for each vegetative treatment. The number on the data label relates to the species
prevalence. 1st most dominant species = 1, etc. F-value: 140, p < 0.0001 .............................. 37
Figure 2.11: Breakdown of occurrence for total species (a) and forb species (b) for natural
and secondary vegetation treatments. SO – secondary only, S – Shared by both treatments,
NO – Natural Only .................................................................................................................... 38
Figure 2.12: Breakdown on plant elements of species in natural (a) and secondary (b)
treatments for each main study area. F – Forbs, WS – Woody Species, GS – Geoxylic
Suffrutice, G – Grasses ............................................................................................................. 39
Figure 2.13: Detrended correspondence analysis (Decorana) plots showing relative similarity
in composition of total plant species for plots sampled in natural and secondary vegetation
for each study area. Rare species were not downweighted. MNR (a) axis 1, eigenvalue =
0.6268 and axis 2, eigenvalue = 0.4221, BKNR (b), axis 1, eigenvalue = 0. 7607 and axis 2,
eigenvalue = 0. 3352, BCF (c) axis 1, eigenvalue = 0.6460 and axis 2, eigenvalue = 0.3445, ESI
(d) axis 1, eigenvalue = 0.7189 and axis 2, eigenvalue = 0.3189 ............................................. 41
Figure 2.14: Average below ground biomass of non graminoid plant species (dry mass in
kgm-2) for two study areas, Makobulaan Nature Reserve and the Eastern Shores,
iSimangaliso. a. Non-graminoid root biomass (includes woody species) and b. forb only root
biomass for natural (N) and secondary (S) treatments ........................................................... 44
Figure 2.15: Change in species richness with increasing time since deforestation for
Makobulaan (a, c – 40 years) and Eastern Shores study areas (b, d – 20 years). The top two
figures show total species richness with time and the bottom two figures show forb species
Univers
ity of
Cap
e Tow
n
xiv
richness with time (a. R2 = 0.25, p = 0.50, b. R2 = 0.05, p = 0.62, c. R2 = 0.75, p = 0.14, d. R2 =
0.65, p < 0.05). The solid line (N-B) represents the average number of species for natural
treatments and the grey diamonds (S) represents secondary plot age species averages ...... 45
Chapter 3:
Figure 3.1: Two examples of how restoration plots were set up. Seven Un-cleared (U) and
seven Cleared (C) quadrats. 1 – 5 and A – E were used to map the plots. Refer to Appendix
12 ............................................................................................................................................. 71
Figure 3.2: Average quadrat plant percentage cover and species richness of restored
quadrats for three surveys over a period of 12 months for both Blue Crane Farm (BCF, a and
b) and Eastern Shores, iSimanagaliso (ESI, c and d). .............................................................. 76
Figure 3.3: Average plant growth form percentage cover and species richness make up per
quadrat for each survey time at both the Blue Crane Farm (a and b) and the Eastern Shores,
iSimangaliso (c and d). F – forbs, G – Grass, GS – Geoxylic suffrutices, S – Sedges ................ 78
Figure 3.4: Average net change in sod plant species richness and percentage cover of
restored quadrats at the T2 survey in both grass treatments for all study areas. C – Cleared,
U – Un-cleared ......................................................................................................................... 79
Figure 3.5: Average net change in sod plant species richness and percentage cover of
restored quadrats at the T3 survey in both grass treatments for BCF and ESI. C – Cleared, U –
Un-cleared ................................................................................................................................ 80
Chapter 4:
Figure 4.1: Species leaf dry weight for each grass treatment. a. Aloe maculata, b. Eucomis
autumnalis and c. Aristea woodii. C – Control, Ec – E. curvula, Tt – T. triandra, Aj – A.
junciformis, M – Mixed .......................................................................................................... 101
Figure2: A, c and e are species root dry weight for each grass treatment. a +b. Aloe
maculata, c+d. Eucomis autumnalis and e + f. Aristea woodii. B, d and f show root dry weight
data for individual samples against grass dry leaf biomass. C – Control, Ec – E. curvula, Tt – T.
triandra, Aj – A. junciformis, M – Mixed. B, d and f compare grass dry biomass with species
root dry weight ...................................................................................................................... 102
Univers
ity of
Cap
e Tow
n
xv
Figure 4.3: Species relationship between leaf # and leaf dry weight. a. Aloe maculata:
R2=0.92, p < 0.0001, b. Eucomis autumnalis: R2=0.78, p < 0.0001 and c. Aristea woodii:
R2=0.89, p < 0.0001 ................................................................................................................ 103
Figure 4.4: Species relationship between plant basal width and USO dry weight. a. Aloe
maculata: R2=0.83, p < 0.0001, b. Eucomis autumnalis: R2=0.81, p < 0.0001 and c. Aristea
woodii: R2=0.52, p < 0.0005 ................................................................................................ 104
Figure 4.5: Forb species above ground biomass growth at 0, 1.2, 4 and 11 months for
different grass treatments. a. Aloe maculata (F-value: 82.8, p < 0.0001), b. Eucomis
autumnalis (F-value: 16.2, p < 0.0001) and c. Aristea woodii (F-value: 69.3, p < 0.0001). C –
Control, Ec – E. curvula, Tt – T. triandra, Aj – A. junciformis, M – Mixed .............................. 105
Figure 4.6: Species below ground biomass growth, as indexed by basal width of each forb, at
0, 4 and 11 months for different grass treatments. a. Aloe maculata, b. Eucomis autumnalis
and c. Aristea woodii. C – Control, Ec – E. curvula, Tt – T. triandra, Aj – A. junciformis, M –
Mixed ..................................................................................................................................... 106
Figure 4.7: Leaf length for each forb species in relation to grass leaf biomass per pot. a. Aloe
maculata, b. Eucomis autumnalis and c. Aristea woodii. Diamonds = Control and Squares =
Grass treatments ................................................................................................................... 107
Univers
ity of
Cap
e Tow
n
Chapter 1: South African grassland ecology and its restoration
1
South African grassland ecology and its restoration
Introduction:
Grasslands are characterised by open vegetation cover, made up of predominantly a
continuous grassy layer. Well-known examples of grassland include the Prairies of North
America (Knapp et al. 2004), the Campos of South America (Overbeck et al. 2007) and the
temperate grasslands of Australia (Morgan 1999). Grasslands also occur throughout Africa
and Madagascar (White 1983, Bond et al. 2008). Despite covering around 11% of the earth’s
vegetated land surface (Ramankutty & Foley 1999) grassland systems are still largely under-
appreciated and under-conserved even with the increasing realisation that these systems
are some of the most threatened systems in the world (Lubke et al. 1996, Overbeck et al.
2007, Bond & Parr 2010). Grassy biomes are heavily utilised by human activities and face
increasing anthropogenic pressure as human populations increase and with it the need for
the resources that grasslands provide (Myers et al. 2000, Reyers et al. 2001, Hoekstra et al.
2005). Agriculture, afforestation, urban expansion and mining are the main drivers of
grassland loss.
Grasslands misunderstood
There is the unfortunate public misconception that, while forests are ‘pristine’ and ‘ancient’
landscapes, grasslands are derived from anthropogenic clearing and burning of forest and
thus are secondary in nature (Bond & Parr 2010). One of the reasons why natural grasslands
were thought to be secondary systems is because mesic grasslands do not exist in
equilibrium with their climate and they could return to a forest state if fire was excluded
from the system (Acocks 1953). As evidence arose, that South African grasslands could
actually be natural systems, Ellery & Mentis (1992) and Meadows & Linder (1993)
challenged the idea that South African grasslands were anthropogenic systems. If South
African grassland were truly secondary in nature we would expect to find these ‘novel’ open
environments with traits ill adapted to frequent fire disturbances and comprised of little
biodiversity and few endemics. On the contrary, much evidence supports the idea that
tropical and sub-tropical grasslands may be ancient, derived before humans even played a
major role in influencing the world’s landscape (Overbeck et al. 2007, Bond & Parr 2010).
Univers
ity of
Cap
e Tow
n
Chapter 1: South African grassland ecology and its restoration
2
Fire is a natural disturbance that plays an influential role in C4 grasslands where the majority
of grass species have the C4 photosynthetic pathway. C4 dominated biomes support the
highest fire frequencies in the world (Mouillet & Field 2005, Chuvieco et al. 2008, Archibald
et al. 2013). Grasslands in South Africa and South America support diverse and distinct
faunal and floral communities. Upland grasslands can contain 82 plant species within
1000m2 making it the second most diverse vegetation in South Africa (van Wyk 1998
,Oudtshoorn et al. 2011). Forbs, herbaceous plant species, are one notable grassland plant
growth form that makes up a considerable proportion of South African grassland
biodiversity (Figure 1.1). They are able to resprout after fire from a multitude of woody or
tuberous root systems (Bews 1925, Hilliard & Burtt 1987,Williams et al. 2000) known as
underground storage organs (USOs) which are protected from the fire itself (Uys 2006,
Overbeck & Pfadenhauer 2007). Grassland forbs are thought to be able to persist in the
landscape for very long periods without the need to successfully reproduce (Zaloumis &
Bond 2011). However without fire they disappear in as little as a decade (Fynn et al. 2004,
Uys et al. 2004, Uys 2006). Another little known but remarkable grassland growth form is
the geoxylic suffrutex, otherwise known as an ‘underground tree’, which also resprouts
directly after fire (White 1976). These are woody plants that support extensive underground
stems and a number of reduced vegetative and fertile aerial parts. The forb USO and
geoxylic suffrutex habits are two specific fire-adapted traits that could not have been
derived in the last 2000 years or since the last glacial maximum and distinguish our
grasslands from northern hemisphere grassland equivalents (Bond & Parr 2010).
The importance of grasslands
Globally grasslands contribute significantly to environmental, economic and cultural values
in the provision of several important ecosystem services (Reyers & Tosh 2003, Overbeck et
al. 2007, Blignaut et al. 2008, Hardy 2008, O'Connor & Kuyler 2009). Globally the
importance of their role in climate regulation and carbon sequestration still needs to be
investigated; such as their role in the global carbon and energy cycles. Some ecosystem
services are well documented and can have significant consequences in a local context.
These include the production of high quality grazing, water moderation and erosion control
(Reyers & Tosh 2003, Overbeck et al. 2007, Blignaut et al. 2008, Hardy 2008). Within South
Univers
ity of
Cap
e Tow
n
Chapter 1: South African grassland ecology and its restoration
3
Africa intact natural grasslands play an important role in the major summer-rainfall
catchment areas where they stabilise soils, promote rainfall infiltration, and support more
streamflow than pine plantations grown under the same conditions (Bosch & Hewlett 1982,
Le Maitre et al. 2002, Driver et al. 2004, Hardy 2008, Blignaut et al. 2010). Catchments with
high levels of erosion and therefore high siltation rates have negative economic impacts for
the management of our major water reservoirs by increasing the need for further civil
engineering construction works (Driver et al. 2004, Blignaut et al. 2010). Grasslands are
solely responsible for providing water to the entire Gauteng province (Reyers & Tosh 2003).
Natural grasslands also provide high quality grazing for our beef industry (Hardy 2008).
Grasslands in South Africa
In this study I focus on the grasslands of South Africa (Figure 1.2 and 1.2). The grassland
biome is the second largest biome in South Africa mostly situated on the high central
plateau commonly known as the Highveld (Figure 1.3a, Mucina & Rutherford 2006). The
coastal grasslands make up one component of the grassland-forest mosaic that is the Indian
Ocean Coastal Belt biome (Figure 1.3b, Mucina & Rutherford 2006). The characteristics of
the grassland vegetation types sampled in the study are elaborated upon further within
Chapter 2. South Africa’s mesic grasslands are seasonal with an annual rainfall above
500mm to 700mm that predominantly falls in the summer months (Ellery et al. 1995). My
study focuses on grasslands below about 2000m which are dominated by C4 grass species
(Mucina & Rutherford 2006).
South Africa boasts a long history of ecological work focused in the grassland biome. Much
of this work has explored the impacts of land-use practices such as grazing and fire
management driving changes in the environment and the influence of climatic and soil
variables that play an important role in grassland ecology (Tainton 1981, O’ Connor &
Bredenkamp 1997, Mucina & Rutherford 2006). The investigation of plant diversity patterns
within South African grasslands has also featured prominently in the grassland literature
(Acocks 1953, Cowling et al. 1989, van Wyk 1998).
As conservation biologists and grassland scientists began to realise the importance of our
grassland systems we saw the establishment of several protected areas and implementation
Univers
ity of
Cap
e Tow
n
Chapter 1: South African grassland ecology and its restoration
4
of several conservation related programs to try and encourage their protection. 1999 saw
the establishment of South Africa’s first world heritage site, iSimangaliso Wetland Park,
which encompasses one of the largest remaining areas of coastal grassland (Taylor 2004).
Soon afterward the uKhahlamba Drakensberg Park, situated in the higher grassland regions
of KwaZulu-Natal, followed suit also being declared a world heritage site in 2000. There are
several well-known parks within most of the South African provinces that are included in the
biome boundary. The only national park is the Golden Gate National Park in the Free State.
Despite this, however, only just 2.2% of the biome is under any formal conservation
protection (Hardy 2008). In an effort to advance grassland conservation several
conservations programs have been developed to promote conservation ideals with
landowners. SANBI’s Grassland Program, Bird Life South Africa and WWF have been actively
involved in supporting projects like the Enkangala Grasslands Project which encourages
landowners to engage in conservation.
Grassland conservation and restoration
South African grasslands are facing increased habitat loss and fragmentation and have
become one of the most threatened vegetation types in South Africa making them a priority
for conservation efforts (Matsika 2007). Restoration can be used both as a tool in the
conservation of grasslands and to improve our understanding of this system (Young 2000).
There has been considerable active restoration work done on our mined coastal dune forest
systems in KwaZulu-Natal (Mentis & Ellery 1994, Avis & Lubke 1996, Lubke & Avis 1999,
Wassenaar et al. 2005). However, South African grassland restoration literature is sparse
(Lubke et al. 1996) and often only compares post-disturbance grasslands to natural
grassland. There are however some studies that have focused on the re-seeding of common
grass species and these have reported some success in re-establishing vegetative cover and
some grazing value (Mentis 1999, Oudtshoorn et al. 2011). Otherwise there is a lot of active
unpublished restoration work, which usually focuses on establishment of fast growing
grasses. These efforts are generally not monitored or are only noted in the grey literature.
The lack of monitoring of a restoration project after the active restoration has finished has
most likely slowed our understanding of grassland restoration problems. Monitoring of
restoration should be encouraged to develop the feedback and learning process (Prober &
Univers
ity of
Cap
e Tow
n
Chapter 1: South African grassland ecology and its restoration
5
Thiele 2005). Secondary South African grasslands have been shown not to follow natural
succession when left to recover. They may establish a grassy layer, but the plant community
does not represent that of the natural vegetation (Oudtshoorn et al. 2011, Zaloumis & Bond
2011). In these circumstances the key grassland elements have failed to re-colonise the
degraded environment and we need to determine if this is because of physical limitations,
due to changes in soil attributes, or biological limitations such as plant competition or plant
reproductive constraints (Kardol et al. 2008). In the case of our mesic grasslands it could be
the latter that is the more limiting factor (Zaloumis & Bond 2011).
Structure of this Thesis
The aim of this study is to investigate how human related disturbances affect mesic
grasslands. I identified what was lost from the system after a disturbance and what
biological constraints ecologists and managers will face when approaching their restoration.
I then investigated biological limitations to grassland restoration by attempting species re-
introduction into secondary grasslands and exploring the interaction between grasses and
forbs. The chapters of the thesis represent different parts of the study and have been
written independently to facilitate publication. This inevitably means there is some
replication of text and references in the three data chapters.
Chapter 2: From a distance secondary grasslands can look very similar to natural grasslands.
However, there is some evidence that secondary coastal grasslands do not recover towards
their pristine state through natural successional processes and diverge to very different
community composition (Zaloumis & Bond 2011). To explore this further, I tested the
hypothesis that mesic grasslands throughout South Africa were negatively altered by human
related disturbances. Coastal and upland grasslands that had been subjected to
afforestation or ploughing and then allowed to recover were sampled during the growing
season. These secondary grasslands included different recovery ages that were then
compared to natural grassland reference states to identify how these grassland states differ
and how the differences may influence grassland restoration efforts.

Univers
ity of
Cap
e Tow
n
Chapter 1: South African grassland ecology and its restoration
6
Chapter 3: Biological barriers may prevent grassland forb species from re-colonising
secondary grasslands (Bond & Parr 2010, Zaloumis & Bond 2011). I attempted to transplant
natural grassland mixed species sods into two montane and one coastal grassland to re-
introduce natural grassland species into secondary grasslands. I investigated sod species
establishment and survival over a period of 12 months to test the hypothesis that natural
grassland sods could be successfully transplanted into secondary grasslands. The transplant
experiment included grass removal and control treatments with observations on the effects
of pre- and post-transplant burning on transplant success. The project was set up to allow
repeated monitoring in the future with the intention of monitoring sod species survival and
dispersal success.
Chapter 4: Secondary grasslands were dominated by competitive mono-specific grass
swards (Chapter 2). Little is known about how South African grass and forb species interact
in a natural grassland context and how this changes with secondary grassland grass species.
I tested the hypothesis that grassland forbs were limited by grass competition by
investigating the effect of several common natural and secondary grass species on grassland
forb establishment. The experiment was conducted in pots in a glasshouse on the
Pietermaritzburg campus of UKZN.
The thesis concludes with a chapter summarising the results with a discussion of the
implications of this study for future work on restoration and on South African grasslands
more generally.
Univers
ity of
Cap
e Tow
n
Chapter 1: South African grassland ecology and its restoration
7
Figure 1.1: Examples of the diverse range of flowering forbs found in South African grassland.
Figure 1.2: Map of South Africa with the Grassland biome in Green and the Indian Coastal Belt Biome in beige
(taken from Mucina & Rutherford 2006).
Univers
ity of
Cap
e Tow
n
Chapter 1: South African grassland ecology and its restoration
8
a. Upland grasslands of Buffelskloof Nature Reserve
b. Coastal dune grassland-forest mosaic of the Eastern Shore, iSimangaliso Wetland Park
Figure 1.3: Examples of the Upland grassland biome (a), showing pine plantations in the background, and the
Coastal Indian Ocean coastal belt biome (b), showing a natural coastal grassland-forest mosaic.
Univers
ity of
Cap
e Tow
n
Chapter 1: South African grassland ecology and its restoration
9
References:
Acocks, J.P.H. 1953. Veld types of South Africa. Memoirs of the Botanical Survey of South
Africa. 28: 1-192.
Avis, A. M. & Lubke, R. A. 1996. Dynamics and succession of coastal dune vegetation in the
Eastern Cape, South Africa. Landscape and Urban Planning. 34: 237-253.
Archibald, S., Lehmann, C. E., Gómez-Dans, J. L., & Bradstock, R. A. 2013. Defining pyromes
and global syndromes of fire regimes. Proceedings of the National Academy of
Sciences. 110: 6442-6447.
Bews, J. W. 1925. Plant forms and their evolution in South Africa. Longmans: London. Pg. 81-
82.
Blignaut, J., Aronson, J., Mander, M., & Marais, C. 2008. Investing in natural capital and
economic development: South Africa’s Drakensberg Mountains. Ecological
Restoration. 26: 143-150.
Blignaut, J., Mander, M., Schulze, R., Horan, M., Dickens, C., Pringle, C., Mavundla, K.,
Mahlangu, I., Wilson, A., McKenzie, M. & McKean, S. 2010. Restoring and managing
natural capital towards fostering economic development: Evidence from the
Drakensberg, South Africa. Ecological Economics. 69: 1313-1323.
Bond, W.J. 2008. What limits trees in C4 grasslands and savannas? Annual review of ecology,
evolution and systematics. 39: 641-593.
Bond WJ and Parr CL. 2010. Beyond the forest edge: Ecology, diversity and conservation of
the grassy biomes. Biological Conservation. 143: 2395-2404.
Bosch, J. M. & Hewlett, J. D. 1982. A review of catchment experiments to determine the
effect of vegetation changes on water yield and evapotranspiration. Journal of
hydrology. 55: 3-23.
Cowling, R.M., Gibbs-Russel, G.E., Hoffmann, M.T. & Hilton-Taylor, C., 1989. Patterns of
plant species diversity in southern Africa. In: Huntley, B.J. (Ed.), Biotic Diversity in
Southern Africa. Oxford University Press, Cape Town, pp. 19-50
Chuvieco, E., Giglio, L., & Justice, C. 2008. Global characterization of fire activity: toward
defining fire regimes from Earth observation data. Global Change Biology. 14: 1488-
1502.
Univers
ity of
Cap
e Tow
n
Chapter 1: South African grassland ecology and its restoration
10
Driver, A., Maze, K., Rouget, M., Lombard, A. T., Nel, J., Turpie, J. K., Cowling, R. M, Desmet,
P., Goodman, P., Harris, J., Jonas, Z., Reyers, B., Sink, K. & Strauss, T. 2005. National
spatial biodiversity assessment 2004: priorities for biodiversity conservation in South
Africa. South African National Biodiversity Institute. Available at
http://bgis.sanbi.org/nsba/NSBA_Report.pdf [accessed 2013].
Ellery, W.N. & Mentis, M.T. 1992. How old are South Africa’s grasslands? In: Furley PA,
Proctor J, Ratter JA (eds) Forest Savanna Boundaries. Chapman and Hall, London, Pg.
659-682
Ellery, W. N., Scholes, R. J., & Scholes, M. C. (1995). The distribution of sweetveld and
sourveld in South Africa's grassland biome in relation to environmental factors.
African Journal of Range & Forage Science, 12(1), 38-45.
Fynn R.W. S., Morris C. D., Edwards T. J. & Skarpe C. 2004. Effect of burning and mowing on
grass and forb diversity in a long-term grassland experiment. Applied Vegetation
Science. 7: 1-10.
Hardy, P. 2008. Grasslands and Forestry. SA Forestry. Grasslands Program (Accessed on 13
September 2009) Resources page. http://www.grasslands.org.za/. SANBI.
Hoekstra J.M., Boucher T.M. , Ricketts T.H. & Roberts C. 2005. Confronting a biome crisis:
global disparities of habitat loss and protection. Ecology Letters 8:23-29.
Hilliard, O. M., & Burtt, B. L. 1987. The botany of the southern Natal Drakensberg. Annals of
Kirstenbosch Botanic Gardens. 15.
Knapp A. K., Smith M. D., Collins S. L. 2004. Generality in ecology: testing North American
grassland rules in South African savannas. Frontiers in Ecology and the Environment
2: 483-91.
Le Maitre, D. C., Van Wilgen, B. W., Gelderblom, C. M., Bailey, C., Chapman, R. A., & Nel, J. A.
2002. Invasive alien trees and water resources in South Africa: case studies of the
costs and benefits of management. Forest Ecology and management. 160: 143-159.
Lubke R. A., Avis A. M. & Moll J. B. 1996. Post-mining rehabilitation of coastal sand dunes in
Zululand South Africa. Landscape Urban Planning. 34: 335-45.
Lubke, R. A. & Avis, A. M. 1999. A review of the concepts and application of rehabilitation
following heavy mineral dune mining. Marine Pollution Bulletin. 37: 546-557.
Univers
ity of
Cap
e Tow
n
Chapter 1: South African grassland ecology and its restoration
11
Matsika R. 2007. Unpublished Data: Land-cover Change: Threats to the grassland Biome of
South Africa. Unpublished MSc thesis. Pg. 131. University of Witwatersrand,
Johannesburg.
Meadows, M.E. & Linder, H.P. 1993. A palaeoecological perspective on the origin of
Afromontane grasslands. Journal of Biogeography. 20: 345-355.
Mentis, M.T. & Ellery, W.N. 1994. Post-mining rehabilitation of dunes on the north-east
coast of South Africa. South African Journal of Science. 90. 69-74.
Morgan J. W. 1999. Defining grassland fire events and the response of perennial plants to
annual fire in temperate grasslands of south-eastern Australia. Plant Ecology. 144:
127-44.
Mouillot, F., & Field, C. B. 2005. Fire history and the global carbon budget: a 1× 1 fire history
reconstruction for the 20th century. Global Change Biology. 11: 398-420.
Mucina, L. & Rutherford, M. C. 2006. The Vegetation of South Africa, Lesotho and Swaziland.
Strelitzia 19, Pretoria.
Myers, N., Mittermeier, R.A., Mittermeier, C.G., Fonseca, G.A.B. & Kent, J. 2000. Biodiversity
hotspots for conservation priorities. Nature. 403: 853-858.
O’ Connor, T. J. & Bredenkamp, G.J. 1997. Grassland. In: R. M. Cowling, D. M. Richardson
And S.M. Pierce (eds) Vegetation of Southern Africa. Cambridge University Press,
Cambridge, UK. Pg. 215-257.
O’Connor T. G. O. 2005. Influence of land use on plant community composition and diversity
in Highland Sourveld grassland in the southern Drakensberg, South Africa. Journal of
Applied Ecology. 42: 975-88.
Overbeck, G. E. Müller, S. C. Fidelis, A., Pfadenhauer, J. Pillar, V. D., Blanco, C. C. & Forneck,
E. D. 2007. Brazil's neglected biome: The South Brazilian Campos: Perspectives in
Plant Ecology, Evolution and Systematics. 9: 101-116.
Overbeck, G. E. & Pfadenhauer, J. 2007. Adaptive strategies in burned subtropical grassland
in Southern Brazil. Flora 202: 27-49.
Prober, S. M. & Thiele, K. R. 2005. Restoring Australia’s temperate grasslands and grassy
woodlands: integrating function and diversity. Ecological Management Restoration.
6: 16-27.
Univers
ity of
Cap
e Tow
n
Chapter 1: South African grassland ecology and its restoration
12
Ramankutty, N. & Foley, J.A. 1999. Estimating historical changes in global land cover:
croplands from 1700 to 1992. Global Biogeochemical Cycles. 13: 997-1027.
Reyers, B., Fairbanks, D. H. K., Van Jaarsveld, A. S., & Thompson, M. 2001. Priority areas for
the conservation of South African vegetation: a coarse‐filter approach. Diversity and
Distributions. 7: 79-95.
Reyers, B., & Tosh, C. 2003. National Grassland Initiative: concept document. Gauteng
Department of Agriculture Conservation & Land Affairs, Johannesburg.Uys (2006).
Tainton, N.M. 1981. The ecology of the main grazing lands of South Africa. In: Tainton, N.M.
(ed). Veld management in South Africa. University of Natal Press. Pietermaritzburg.
Taylor R. 2004. Management of the Coastal Grasslands of the Greater St. LuciaWetland Park.
Ezemvelo KZN Wildlife, St Lucia. Pg. 17.
Uys, R.G. 2006. Unpublished data: Patterns of plants diversity and their management across
South African rangelands. Unpublished PhD thesis. In: Department of Botany.
University of Cape Town, Cape Town.
Young, T. P. 2000. Restoration ecology and conservation biology. Biological conservation.
92: 73-83.
Williams, V. L., Balkwill, K., & Witkowski, E. T. 2000. Unraveling the commercial market for
medicinal plants and plant parts on the Witwatersrand, South Africa. Economic
Botany. 54: 310-327.White F. 1983. The Vegetation of Africa. Paris: UNESCO
Wassenaar, T. D., van Aarde, R. J., Pimm, S. L. & Ferreira, S. M. 2005. Community
convergence in disturbed subtropical dune forests. Ecology. 86: 655-666.
van Oudtshoorn, F. V., Brown, L., & Kellner, K. 2011. The effect of reseeding methods on
secondary succession during cropland restoration in the Highveld region of South
Africa. African Journal of Range & Forage Science. 28: 1-8.
van Wyk AE. 1998. Grassland: the most threatened biome in South Africa. Available at
http://www.geasphere.co.za/articles/grasslands.htm#Grasslands_Most_Threatened
Biome. htm [accessed 2013].
Zaloumis, N.P. and Bond, W. J. 2011. Grassland restoration after afforestation: No direction
home? Austral Ecology. 36: 357-366.
Univers
ity of
Cap
e Tow
n
Chapter 2 - Mesic C4 grasslands of South Africa and their fragility
13
Chapter 2: Mesic C4 grasslands of South Africa and their fragility
Abstract:
Grasslands are considered to be the most threatened biome in South Africa and yet they are
still generally misunderstood. Often ignored as part of the conservation estate, grasslands
are viewed as secondary vegetation derived from the felling of forests and therefore
suitable targets for afforestation. However, the mesic grasslands of southern Africa are now
thought to be ancient and much more extensive in the last glacial. They are very rich in
perennial forb species, many of which have large underground storage organs and seldom
recruit from seed. We studied the diversity of natural grasslands within Mpumalanga and
KwaZulu-Natal and compared them with secondary grasslands after different forms of
disturbance, including afforestation and ploughing. We found that natural succession in
secondary grasslands failed to restore the diversity of forbs, with very poor recovery, even
decades after removal of plantation forests. Secondary grasslands were completely missing
the resprouting forb component typical of natural grasslands and they responded differently
to natural disturbances such as fire. Thus primary grasslands appear to be at least as fragile
as primary forests and may take decades to centuries to recover from major disturbance.
We discuss the biological and physical constraints that our grasslands plant species face in a
restoration context. It is important to promote the value of our grasslands and, until we can
develop practical methods for successful active grassland restoration. We need to strive to
conserve what we have left.
Univers
ity of
Cap
e Tow
n
Chapter 2 - Mesic C4 grasslands of South Africa and their fragility
14
Introduction:
As the pressure of human activities increases on the natural environment, further
conservation efforts are needed to sustain the increasingly fragmented natural landscape.
Included in these efforts are; a. the development of better land use management practices
that mitigate degradation and promote diversity, b. the placing of more land under formal
protection and c. the restoring of land that has been already degraded. Ideally the
conservation of pristine environments is the most important goal to achieve. In contrast,
restoration tends to be viewed as a last, but increasingly necessary resort (Young 2000,
Prober & Thiele 2005, Hobbs 2007). With growing demands on natural resources and land
itself there will be a greater reliance on restoration to maintain biodiversity and return some
level of functionality to already degraded land. For restoration to become an effective
conservation tool there is a need to develop a better understanding of the original plant
communities and functions in the target system that is due to undergo restoration ( Soule &
Kohm 1989, Soc. Eco. Rest. 2004, Prober & Thiele 2005, Le Stradic 2012). To do this, one
needs to determine how human disturbances have had an effect on the original system by
comparing a suitable reference of the natural system with a degraded system. The reference
system then helps us identify targets and set goals when undergoing restoration.
To identify the reference system, one needs to know the makeup of the natural landscape
that came before the disturbance occurred. Unfortunately this is not always possible. Often
one must settle with the next best thing; a pristine system within close proximity to the
degraded area (Bakker & Berendse 1999, Soc. Eco. Rest. 2004, Zaloumis & Bond 2011, Le
Stradic 2012). Sometimes finding these reference landscapes can be difficult as surrounding
land uses may not be conducive to preserving the pristine state and natural land may have
been subjected to some form of historical land use degradation (Pers. observations, Harris
et al. 2006).
One natural landscape that poses a challenge to restoration ecology is the grasslands of
Southern Africa (Lubke et al. 1996, Mentis 2006, Zaloumis & Bond 2011). These grassy
systems are extensive, with the grassland biome being the second largest biome in South
Univers
ity of
Cap
e Tow
n
Chapter 2 - Mesic C4 grasslands of South Africa and their fragility
15
Africa after the Savanna. The grassland biome supports a rich and distinct diversity of plant
and animal life (Cowling et al. 1989, Rebelo et al. 1997). In the upland grasslands from the
Eastern Cape to Mpumalanga, studies have shown that plots of 100m2 can contain up to 40
species. Within a 1000m2, a natural grassland state can support an average of 82 different
species making grassland the second most diverse vegetation in South Africa after
renosterveld (van Wyk 1998 , van Oudtshoorn et al. 2011). Grassland landscapes support a
plant community rich in forb species (herbaceous non-grass plants) often with a woody or
tuberous root system (Bews 1925, Hilliard & Burtt 1987, Williams et al. 2000, Zaloumis &
Bond 2011). Forbs largely account for grassland species richness with grass species
accounting for only a small proportion (Uys et al. 2004, Zaloumis & Bond 2011). A woody
plant element called a geoxylic suffrutex (commonly known as an ‘underground tree’) also
occurs frequently throughout the biome (White 1976). This growth form is particularly rich
in species within the coastal grasslands of KwaZulu-Natal.
These forbs, grasses and geoxylic suffrutices are all resprouting species that respond
positively to the presence of fire. When fire is removed, grassy systems can be converted to
woodlands and forests over time, particularly in mesic systems (>750 mm mean annual
precipitation in South Africa) (Bond et al. 2003, Uys et al. 2004). A grassland system without
fire would see a shift from shade intolerant forb and grass species to shade tolerant woody
and herbaceous species (Fynn et al. 2004) and ultimately a biome shift to closed forest (Parr
et al. 2012).
Despite grasslands being globally widespread there is a lack of understanding of their
ecological functioning (Lubke et al. 1996, Bond &Parr 2010). Part of this is because their
diversity and general value have largely been neglected by the public and conservation
biologists until relatively recently (Lunt 1994, O’Connor 2005). Most South African literature
has focused on the use of grasslands for livestock farming and therefore is biased towards a
rangeland perspective (Tainton 1981, Post & Kwon 2000, Conant et al. 2001, to mention a
few). Little has been recorded on alternative grassland functions and diversity (Uys et al.
2004, Carbutt & Edwards 2004, 2006, Fynn et al. 2004, Zaloumis & Bond 2011). However,
Univers
ity of
Cap
e Tow
n
Chapter 2 - Mesic C4 grasslands of South Africa and their fragility
16
South African grasslands have been well served by popular books on species identification
(Hilliard & Burtt 1987, Pooley 1998, Pooley 2003).
Like other grassy biomes around the world, South Africa’s grasslands have been subject to
much human alteration, mostly in the form of conversion to crop land and forestry but also
as urban expansion and mining (Rebelo 1997, van Wyk 1998, Mucina & Rutherford 2006).
The grassland biome is the most transformed biome in South Africa, with 30% of the
transformation being irreversible (van Oudtshoorn et al. 2011). Another 30% is only partially
degraded by agriculture and bad management practices or is encroached upon by woody
species. The remaining 40% remains relatively pristine. However, fragmentation of grassland
patches increased drastically in six years between 1994 and 2000 from 4017 patches to
13503 while average patch size decreased substantially from 44.5km2 to only 13.75km2
(Matsika 2007). Transformation of this magnitude has made grasslands the most threatened
biome in South Africa (van Wyk 1998).
Misunderstanding grasslands has not helped us in identifying how they react to human
related disturbance. Two previous studies have shown that South African grassland systems
are fragile and difficult to restore after being transformed. The first studied secondary
grassland that was recovering after coal mining (Mentis 2006) and the second studied
grassland recovery after being excised of pine plantations (Zaloumis & Bond 2011). There
have also been several theses on the topic (Olivier 2008, Kruger 2012). To improve our
knowledge in this regard we would have to increase the number of post recovery and
restoration monitoring projects (Prober and Thiele 2005). Grassland restoration is also
complicated by the fact that grassland systems are often not at equilibrium with their local
climate and soils (Lubke et al. 1996, Bond et al. 2003). In short, grassland systems have been
difficult to rehabilitate successfully, let alone restore, far more than was previously thought.
Since grasslands are under threat of being degraded it is important to identify what this
means in terms of species richness, composition and function. Once we have a better

Univers
ity of
Cap
e Tow
n
Chapter 2 - Mesic C4 grasslands of South Africa and their fragility
17
understanding of these characteristics we can identify what is missing from disturbed and
degraded landscapes and determine methods to restore them.
The aim of this study is to characterise pristine grassland communities and compare them to
secondary grasslands which have been subjected to human related disturbances. We asked
the following questions:
1. What is the composition of South African grasslands? What characteristics or
elements define the biome and are there any key functional traits that are common?
2. Can we develop an identification toolkit that incorporates more than grass species?
Can we use this to help practitioners to easily distinguish natural grassland from
secondary grassland?
3. How do different land-uses affect natural grassland characteristics and do secondary
grasslands recover once the land use is removed?
4. Which factors, biological and physical, are most limiting in South African grassland
restoration efforts?
This chapter aims to explore the community make up of natural grasslands. A better
understanding of our grassland biome can help us promote its value in conservation efforts
and develop policy guidelines to inform better land-use and management decisions.
Grasslands, besides their intrinsic value, have much to offer both scientifically and
economically. Studies like this are one way we can put them into the public eye.
Univers
ity of
Cap
e Tow
n
Chapter 2 - Mesic C4 grasslands of South Africa and their fragility
18
Methods:
Study areas
Our study areas occurred within the eastern side of South Africa in the mesic part of the
Grassland biome. We were able to find areas suitable for the study in the high elevation
parts of the biome in Mpumalanga province and mid elevation and coastal grassy biomes of
KwaZulu-Natal province. Study areas had to both have secondary grassland sites as well as
comparable reference natural grasslands sites within close proximity to each other. This
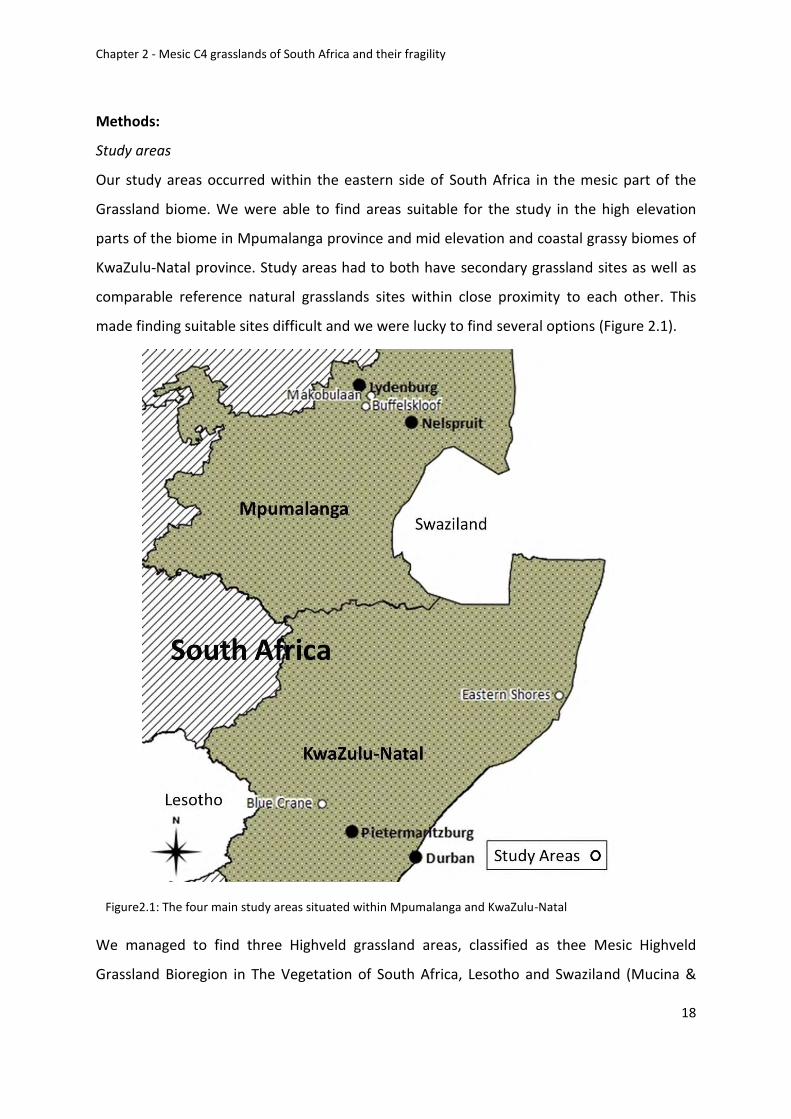
made finding suitable sites difficult and we were lucky to find several options (Figure 2.1).
We managed to find three Highveld grassland areas, classified as thee Mesic Highveld
Grassland Bioregion in The Vegetation of South Africa, Lesotho and Swaziland (Mucina &
Figure2.1: The four main study areas situated within Mpumalanga and KwaZulu-Natal
Univers
ity of
Cap
e Tow
n
Chapter 2 - Mesic C4 grasslands of South Africa and their fragility
19
Rutherford 2006). Two occurred near the town of Lydenburg, on Lydenburg Montane
Grassland (Gm18 – Mucina & Rutherford 2006), Makobulaan Nature Reserve (-25° 12'
30.24" South, 30° 33' 40.104" East), a privately run pine plantation and Buffelskloof Nature
Reserve (-25° 18' 15.156" South, 30° 31' 11.928" East). Both occur within mountainous
terrain which has largely been afforested with pine plantations with fragmented islands of
grassland retained. Mean annual precipitation (MAP) for this area is 858mm with a rainfall
range between 660mm and 1180 mm. Frequent mists occur during most months of the
year and the region experiences frost. The mean annual temperature (MAT) is 14.1˚C. The
grasslands occur on high elevation plateaus with undulating plains, peaks, slopes, hills and
deep valleys all set within the Northern Escarpment region. The soil of this grassland type is
mostly derived from shale and quartzite with occasional dolerite intrusions.
One area close to the town of Wakkerstroom (-27° 14' 25.3674" South, 29° 59' 9.6714" East)
occurred within the Wakkerstroom Montane Grasslands (Gm 14 – Mucina & Rutherford
2006). The MAP for the area is 902mm with a yearly range between 800mm and 1250mm.
The MAT is 14.1 ˚C with these grasslands experiencing very cold winters and mild summers.
The grasslands occur on low mountains and undulating plains. Soils are derived from
mudstone, sandstones and shale of the Karoo Supergroup.
One area occurring within a mid-altitudinal grassland area is classified as Sub-escarpment
Grassland Bioregion, within the Drakensberg Foothill Moist Grassland type (Gs 10 – Mucina
& Rutherford 2006). This was on the Blue Crane Farm near Nottingham Road (-29° 19'
10.8114" South, 30° 4' 13.62" East). Within this grassland type the MAP is 890mm with a
MAT of 14.6 ˚C. The region experience frost days. These grasslands occur on a moderately
rolling and mountainous landscape which is often carved out by river gorges. Soils are
derived from mudstones and sandstones. The soils of the sedimentary parent material are
well drained with a depth of 800mm and a clay content between 15- 55%.
The final study area was located in the Indian Ocean Coastal Belt including both
Maputaland Coastal Belt(CB 1) and Maputaland Wooded Grassland (CB2) vegetation types
on the Eastern Shores of the iSimangaliso Wetland Park (-28° 11' 25.8354" South, 32° 28'
45.084" East). Here the MAP can be up to 1200mm, with about 1000mm on Lake St. Lucia.
Most days have high humidity and temperatures and no frost. MAT is 21.1 ˚C. The
Univers
ity of
Cap
e Tow
n
Chapter 2 - Mesic C4 grasslands of South Africa and their fragility
20
vegetation is a mosaic of coastal dune forest and grassland occurring on flat coastal plains
bordering wetlands and undulating old vegetated dunes. The geology is mostly up to 18000
years old quaternary sediments of marine origin. The sandy soils are highly leached and very
nutrient poor.
Plot selection
Plots were spread out throughout the sample areas and included all available secondary and
natural areas. Plots were selected to represent natural grasslands or secondary grasslands
(recovering after plantation trees have been excised or after having been cultivated)
referred to as ‘vegetation treatments’. Plots in the two vegetation treatments were selected
to be similar in geologies, fire regimes (recently burnt or not) and were often within close
proximity of one another. Where possible, age (time since recovery) treatments were
included. Plots were randomly selected within a treatment using a spun stick.
Makobulaan Nature Reserve (MNR) had 32 plots, 16 for each vegetation treatment. All
plots were burnt annually. Plot ages ranged from 10 to 40 years since clear-felling. Recovery
was from afforestation. Plots ranged between 2000 and 2080m above sea level.
Buffelskloof Nature Reserve (BKNR) had 24 plots, 12 for each vegetation treatment. All
plots were burnt every second year. Secondary grassland plots were 20 years old. Recovery
was from afforestation. Plots ranged from 1600 and 1750m above sea level.
Wakkerstroom (WS) had 8 plots, 4 for each treatment. All plots were burnt annually. The
age of secondary grasslands plots were 18 years since land was withdrawn from cultivation.
Recovery was from ploughing. Plots ranged between 1780 and 1810m above sea level.
Blue Crane Farm (BCF) had 16 plots, 8 for each vegetation treatment. Fire treatments
differed within the study area. Secondary plots were 20 years old. Recovery was from
ploughing. Plots ranged between 1475 and 1520m above sea level.
Eastern Shores, iSimangaliso (ESI) had 64 plots, 32 per vegetation treatment. Fire
treatments differed within the study area. The time since deforestation ranged from 4 – 18
years. Recovery was from afforestation. Plots ranged between 30 and 90m above sea level.
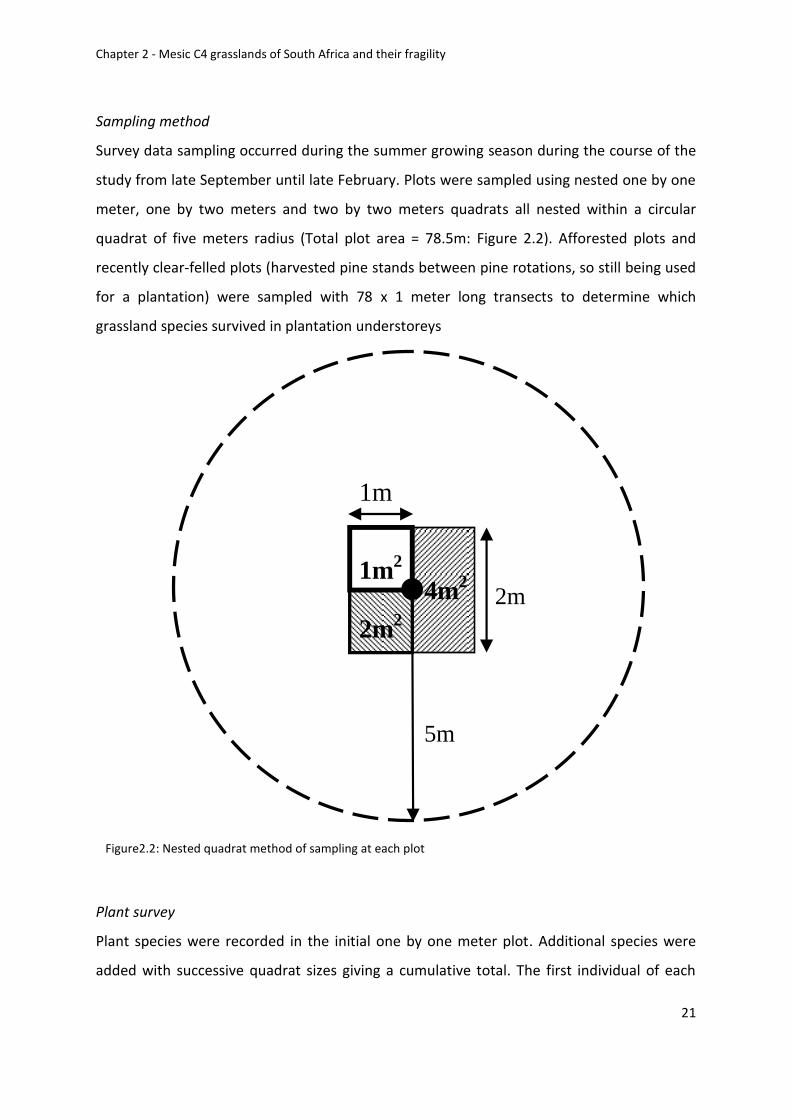
Univers
ity of
Cap
e Tow
n
Chapter 2 - Mesic C4 grasslands of South Africa and their fragility
21
Sampling method
Survey data sampling occurred during the summer growing season during the course of the
study from late September until late February. Plots were sampled using nested one by one
meter, one by two meters and two by two meters quadrats all nested within a circular
quadrat of five meters radius (Total plot area = 78.5m: Figure 2.2). Afforested plots and
recently clear-felled plots (harvested pine stands between pine rotations, so still being used
for a plantation) were sampled with 78 x 1 meter long transects to determine which
grassland species survived in plantation understoreys
Plant survey
Plant species were recorded in the initial one by one meter plot. Additional species were
added with successive quadrat sizes giving a cumulative total. The first individual of each
1m2
4m2
2m2
2m
5m
1m
Figure2.2: Nested quadrat method of sampling at each plot
Univers
ity of
Cap
e Tow
n
Chapter 2 - Mesic C4 grasslands of South Africa and their fragility
22
plant species was excavated for further species identification and documentation of plant
functional traits, specifically below ground root structure. Within the initial one meter
squared plot the total plant ground cover was assessed and the top five most abundant
species were identified and their individual percentage cover estimated. The Eastern Shores
cover estimates were not completed as it was not part of the initial study plan when it was
first surveyed.
Plant species were identified with the use of local field guides (Pooley 1998, van Oudtshoorn
1999 – Refer to Appendix 1 and 2 for examples of grassland forbs and geoxylic suffrutices).
Herbarium samples and knowledgeable local experts aided in the identification of hard-to-
identify species where possible. The plant characteristics scored for each species included
medicinal properties or traditional uses and preference for disturbance when noted in the
guide books. Species were noted as resprouters if they had any underground storage organs
(USOs – Appendix 3) in the form of thickened root stocks as mentioned in Uys (2006) and
Overbeck & Pfadenhauer (2007).
Underground biomass survey
At Makobulaan and Eastern Shores, we estimated underground forb biomass. Within the
plots an area of 50x50cm was excavated up to a depth of 25cm. Below ground biomass of
non-grassy plants was removed. Root structures were separated from soil and grass roots
using a sieve. The wet weight was measured immediately after excavation. The bags were
then put in a drying oven at 70oC for 96 hours to ensure that the large USO’s were
completely dry. Once dry, the dry weight for each sample was measured.
Soil Sampling
Soils were sampled at all the mid and high altitudinal grassland study areas. iSimangaliso’s
Eastern Shores have had previous soil studies comparing soil characteristics between the
secondary and natural treatments. Soils were not sampled here but our plot sampling
design was based around their sampling sites (James 1998). Soil samples were taken
between 5cm and 15cm below the ground. The soil was dried at 70°C for 48 hours and
sieved (2 mm mesh). Dried soil samples were further sieved (0.5 mm mesh) to measure
Univers
ity of
Cap
e Tow
n
Chapter 2 - Mesic C4 grasslands of South Africa and their fragility
23
Total Carbon and Nitrogen. Around 40 mg of soil was weighed into a tin capsule then
combusted in a Thermo Flash EA 1112 series elemental analyser and the gasses fed into a
Delta Plus XP isotope ratio mass spectrometer (Thermo Electron Corporation, Milan, Italy).
Two in-house, and one IAEA, standards were used to calibrate the results. Soil samples were
sent to Bemlab (www.bemlab.co.za) and Elsenburg (Institute for Plant Production) for
further soil property analysis. Bemlab measured the Total P and Aluminium levels in the soil
for the Makobulaan Nature Reserve soil samples. Elsenburg labs were used to measure the
Sum of Bases, pH (KCl) and available Phosphorus (P (citric acid)) for Makobulaan and
Buffelskloof Nature Reserve and Blue Crane Farm. Zinc and Manganese levels were also
measured for Buffelskloof. Soil pH was determined by shaking 2g soil in 20 mL 1 M KCl at
180 r.p.m. for 60 min, centrifuging at 10000g0 for 10 min and measuring the supernatant
pH. Soil was prepared for Bray II P analysis by extracting 2g soil in Bray II solution (Bray &
Kurtz 1945) before filtering it though Machrey-Nagel MN 616 filter paper. The filtrate was
then analysed colorimetrically using the malachite green method (Motomizu et al. 1983).
For total P soil was digested in an Agua regia solution (2 parts HCl to 1 part HNO3) in a sand
bath for two hours, filtered through Whatman no.1 filter paper. The filtrate was analysed
against ICP-AES standards (Varian Vista MPX, Melbourne, Australia). Soil samples were
filtered through Whatman no. 2, made up to 200 mL and the sum of bases, K, Na, Ca and
Mg, was measured using ICP-AES analysis.
Data analysis
General Linear Models (GLM) were used to determine differences and interactions within
and between treatments. Elevation and study area, when used, were selected as random
factors. Vegetation and fire treatments were fixed factors. Species richness was used as one
of the main diversity metrics to determine recovery success in this study. However, species
richness is not the best measure when used by itself as it does not indicate species
composition of a secondary landscape reacting to restorative attempts (Zaloumis and Bond
2011). We included several other measures to test restoration success. Species composition
within treatments helps us determine the common plant elements that make up a
community while species turnover within plots indicates heterogeneity from plot to plot for
Univers
ity of
Cap
e Tow
n
Chapter 2 - Mesic C4 grasslands of South Africa and their fragility
24
a study area within each treatment. Similarity measured between treatments can also be
useful and is often used in restoration projects to test how secondary grassland areas
compare to a benchmark natural state (van Aarde et al. 1996a,b, Wassenaar et al. 2005).
However, similarity measures typically emphasise common elements and will often fail to
reveal rare but important elements or functional traits that are missing from secondary
grassland areas (Zaloumis and Bond 2011). In this study we use several methods to explore
the difference between secondary and natural grasslands from across the east side of the
country.
Species Richness
GLM’s were used to investigate the contribution of study area, elevation, vegetation and fire
treatment differences and interactions between plots for all plants and for forb species in
particular. Elevation was broken into three classes: Study areas above 1700 meters, 1400 -
1700 meters and below 200 meters. Vegetation treatments consisted of three land uses;
natural grassland, grasslands recovering after afforestation and then excised, and grasslands
recovering from ploughing and then land abandonment. Fire treatments included burnt and
unburnt (Refer to Appendix 4 – 6 for examples of burnt and un-burnt treatments).
Species rarefaction curves for each study area were created in R developmental software to
compare natural and secondary vegetation. These curves were produced by randomly re-
sampling plots in 1000 permutations within the vegetation treatments. The average
accumulated number of species was then plotted with increasing number of plots within a
vegetation treatment (Gotelli and Colwell 2001).
A rarefaction plot with a high starting point and a steep starting gradient ending in a high
number of total species would show high point diversity and a high level of heterogeneity
within a study areas treatment compared to the alternative. Curves that start with lower
point diversity and have a shallow gradient asymptoting earlier in the species accumulation
curve suggest low levels of heterogeneity in the environment.
Species turnover was compared between vegetation treatments using a similar method to
Schwilk et al. (1997), measuring intra-plot richness and accumulation by regressing the
average cumulative plant and forb richness against quadrat size for each nested plot.
Univers
ity of
Cap
e Tow
n
Chapter 2 - Mesic C4 grasslands of South Africa and their fragility
25
Species richness and abundance was investigated for afforested and recently clear-felled
pine stands. Species richness was then compared to natural and secondary treatments for
the study areas where these pine stands were sampled.
Plant ground and dominant species cover
GLMs were again used in the analysis of plant cover. Here vegetation treatments included
natural, afforested and ploughed. Fire treatments were also used in the analysis. Total plant
ground cover of plots and the total cover of the five species with highest cover per plot were
used to determine any differences between vegetative treatments.
We also then compared the difference between each of the top 5 dominant plants species
for each vegetation treatment.
Community composition
The distribution of plant and forb species for natural and secondary treatments for each
sample area was broken down into plants and forbs that only occurred in natural plots,
secondary plots or that were common to both. Species were separated into plants and
forbs that occurred only within one treatment or the other or that were common to both.
Plant species were then broken down into four growth forms: forbs (Appendix 1),
graminoids, woody and geoxylic suffrutex (Appendix 2) for each study area. Woody
elements included trees and shrubs. This was determined for both natural and secondary
treatments.
We used a detrended correspondence analysis (Decorana) to ordinate sample plots for each
study area and establish patterns of community composition for all species.
Family richness and abundance distribution tables for natural and secondary treatments
were also drawn up for each study area. We then identified the families with the most
species and families that had highest occurrences in plots.
When investigating the effects of fire treatments (burnt/un-burnt) no differences in pattern
were observed so they were excluded for this analysis.
Univers
ity of
Cap
e Tow
n
Chapter 2 - Mesic C4 grasslands of South Africa and their fragility
26
Biomass
Dried below ground non-graminoid root biomass was compared using a T-test between
natural and secondary treatments for both MNR and ESI study sites separately. Average plot
biomass was calculated as dry mass in kg/m2.
Succession
Both the Eastern Shores and Makobulaan Nature Reserve gave us the rare opportunity to
investigate grassland succession during recovery. The data from Eastern Shores has already
been partially reported in Zaloumis and Bond (2011). In this study we added more data
points, updated and reanalysed patterns in succession. Eastern Shores had four different
ages of time since recovery of up to 17 years and Makobulaan Nature Reserve also had four
different ages of time since recovery but starting 40 years before this study. With these
data sets, we were able to determine whether or not recovering afforested areas showed a
successional trajectory for plant and forb species richness. Mean plant and forb species
were regressed against age since clearance.
Soil
Soil properties were compared within study area vegetation treatments with the use of
GLMs. As Makobulaan Nature Reserve had four separate age groups, soil recovery
succession was also assessed between each age and the natural average. Makobulaan and
Buffelskloof Nature Reserves’ pine stand plots were also compared to the secondary and
natural treatments.
Statistical analyses
Statistical analyses were performed using the STATISTICA 11 software package (StatSoft:
Tulsa, OK, USA) with some analyses being done in Rstudio. Ordination and similarity analysis
was performed in Community Analysis Package 2.13 (Henderson & Seaby 2002). QGIS V1.7.4
was used for all GIS work (GNU 2012).
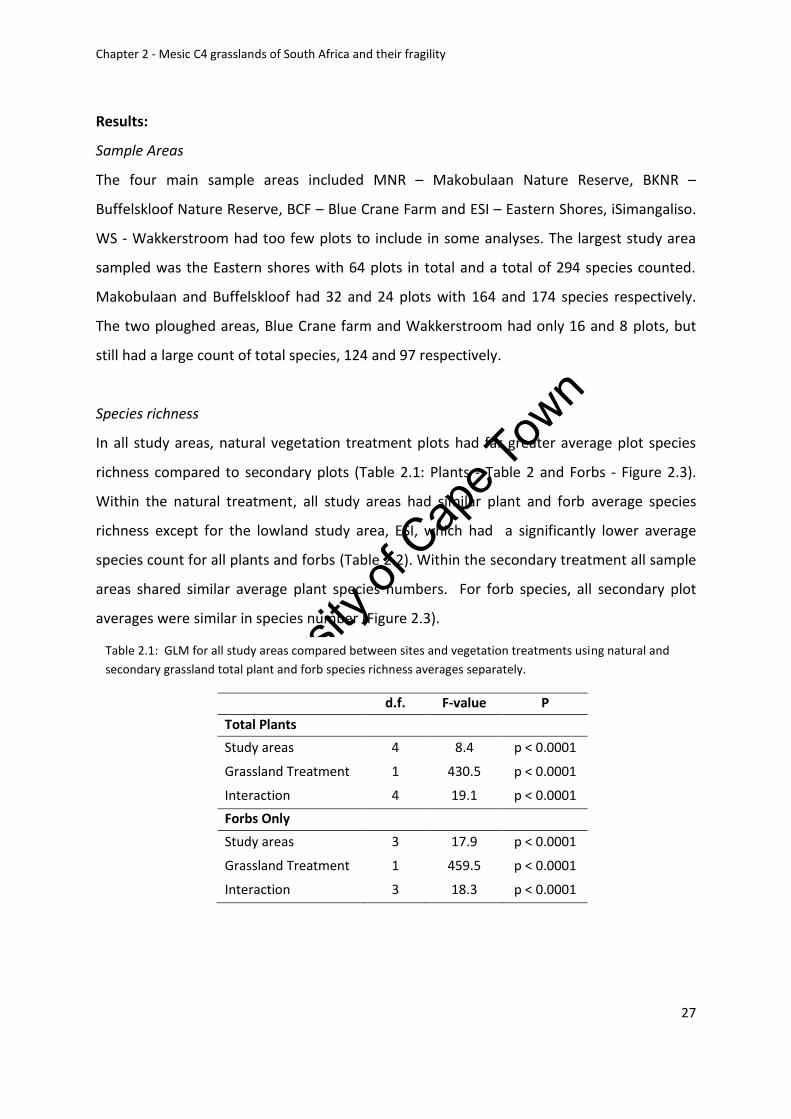
Univers
ity of
Cap
e Tow
n
Chapter 2 - Mesic C4 grasslands of South Africa and their fragility
27
Results:
Sample Areas
The four main sample areas included MNR – Makobulaan Nature Reserve, BKNR –
Buffelskloof Nature Reserve, BCF – Blue Crane Farm and ESI – Eastern Shores, iSimangaliso.
WS - Wakkerstroom had too few plots to include in some analyses. The largest study area
sampled was the Eastern shores with 64 plots in total and a total of 294 species counted.
Makobulaan and Buffelskloof had 32 and 24 plots with 164 and 174 species respectively.
The two ploughed areas, Blue Crane farm and Wakkerstroom had only 16 and 8 plots, but
still had a large count of total species, 124 and 97 respectively.
Species richness
In all study areas, natural vegetation treatment plots had far greater average plot species
richness compared to secondary plots (Table 2.1: Plants - Table 2 and Forbs - Figure 2.3).
Within the natural treatment, all study areas had similar plant and forb average species
richness except for the lowland study area, ESI, which had a significantly lower average
species count for all plants and forbs (Table 2.2). Within the secondary treatment all sample
areas shared similar average plant species numbers. For forb species, all secondary plot
averages were similar in species number (Figure 2.3).
Table 2.1: GLM for all study areas compared between sites and vegetation treatments using natural and
secondary grassland total plant and forb species richness averages separately.
d.f. F-value P
Total Plants
Study areas 4 8.4 p < 0.0001
Grassland Treatment 1 430.5 p < 0.0001
Interaction 4 19.1 p < 0.0001
Forbs Only
Study areas 3 17.9 p < 0.0001
Grassland Treatment 1 459.5 p < 0.0001
Interaction 3 18.3 p < 0.0001
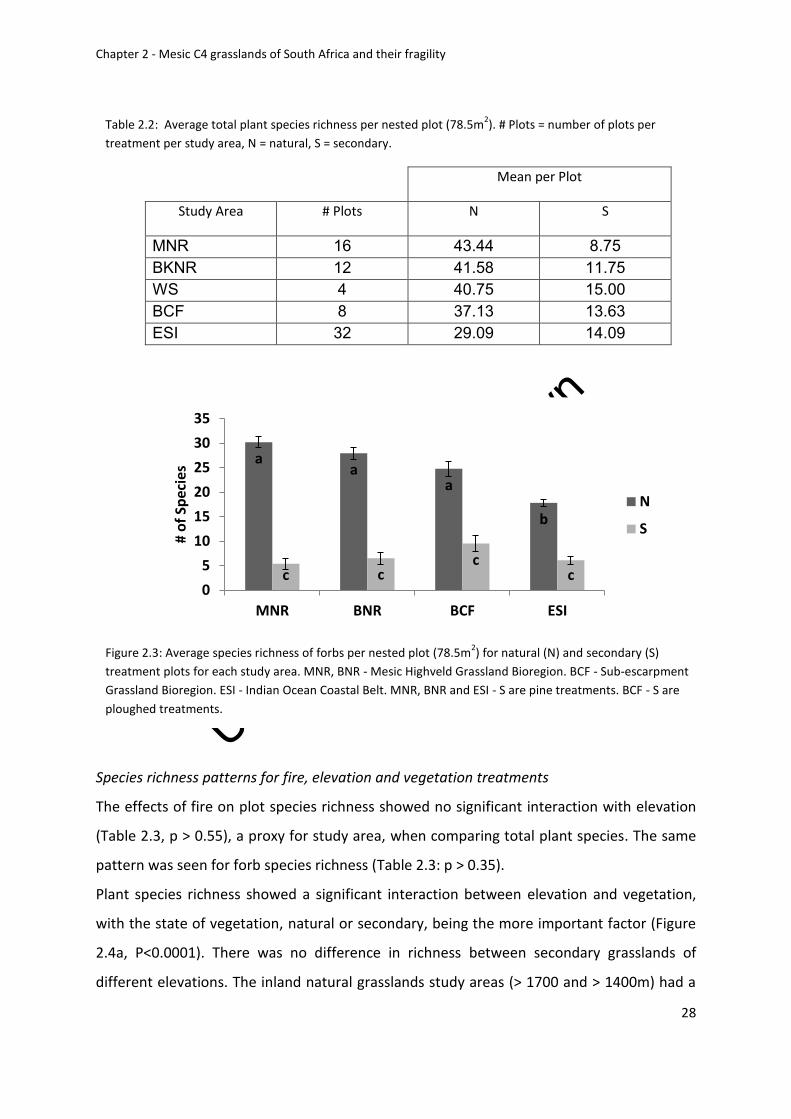
Univers
ity of
Cap
e Tow
n
Chapter 2 - Mesic C4 grasslands of South Africa and their fragility
28
Species richness patterns for fire, elevation and vegetation treatments
The effects of fire on plot species richness showed no significant interaction with elevation
(Table 2.3, p > 0.55), a proxy for study area, when comparing total plant species. The same
pattern was seen for forb species richness (Table 2.3: p > 0.35).
Plant species richness showed a significant interaction between elevation and vegetation,
with the state of vegetation, natural or secondary, being the more important factor (Figure
2.4a, P<0.0001). There was no difference in richness between secondary grasslands of
different elevations. The inland natural grasslands study areas (> 1700 and > 1400m) had a
aa
a
b
c cc
c0
5
10
15
20
25
30
35
MNR BNR BCF ESI
# o
f Sp
ecie
s
N
S
Figure 2.3: Average species richness of forbs per nested plot (78.5m2) for natural (N) and secondary (S)
treatment plots for each study area. MNR, BNR - Mesic Highveld Grassland Bioregion. BCF - Sub-escarpment
Grassland Bioregion. ESI - Indian Ocean Coastal Belt. MNR, BNR and ESI - S are pine treatments. BCF - S are
ploughed treatments.
Table 2.2: Average total plant species richness per nested plot (78.5m2). # Plots = number of plots per
treatment per study area, N = natural, S = secondary.
Mean per Plot
Study Area # Plots N S
MNR 16 43.44 8.75 BKNR 12 41.58 11.75 WS 4 40.75 15.00 BCF 8 37.13 13.63 ESI 32 29.09 14.09
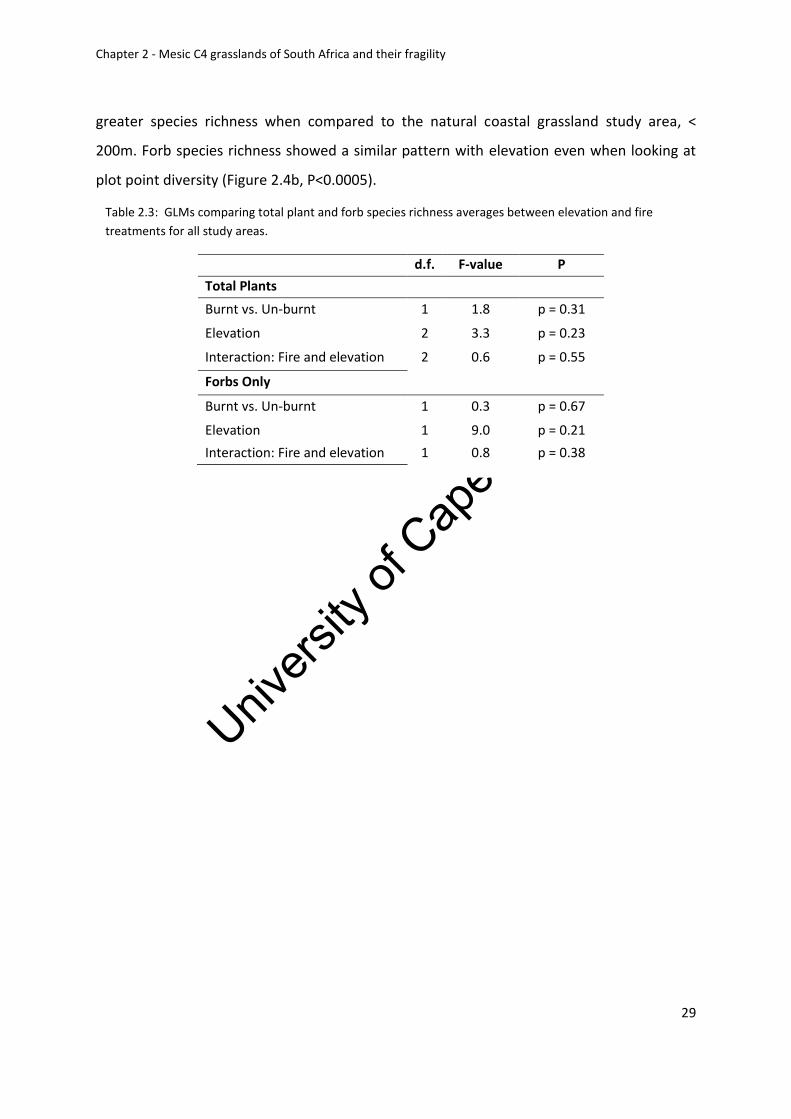
Univers
ity of
Cap
e Tow
n
Chapter 2 - Mesic C4 grasslands of South Africa and their fragility
29
greater species richness when compared to the natural coastal grassland study area, <
200m. Forb species richness showed a similar pattern with elevation even when looking at
plot point diversity (Figure 2.4b, P<0.0005).
Table 2.3: GLMs comparing total plant and forb species richness averages between elevation and fire
treatments for all study areas.
d.f. F-value P
Total Plants
Burnt vs. Un-burnt 1 1.8 p = 0.31
Elevation 2 3.3 p = 0.23
Interaction: Fire and elevation 2 0.6 p = 0.55
Forbs Only
Burnt vs. Un-burnt 1 0.3 p = 0.67
Elevation 1 9.0 p = 0.21
Interaction: Fire and elevation 1 0.8 p = 0.38
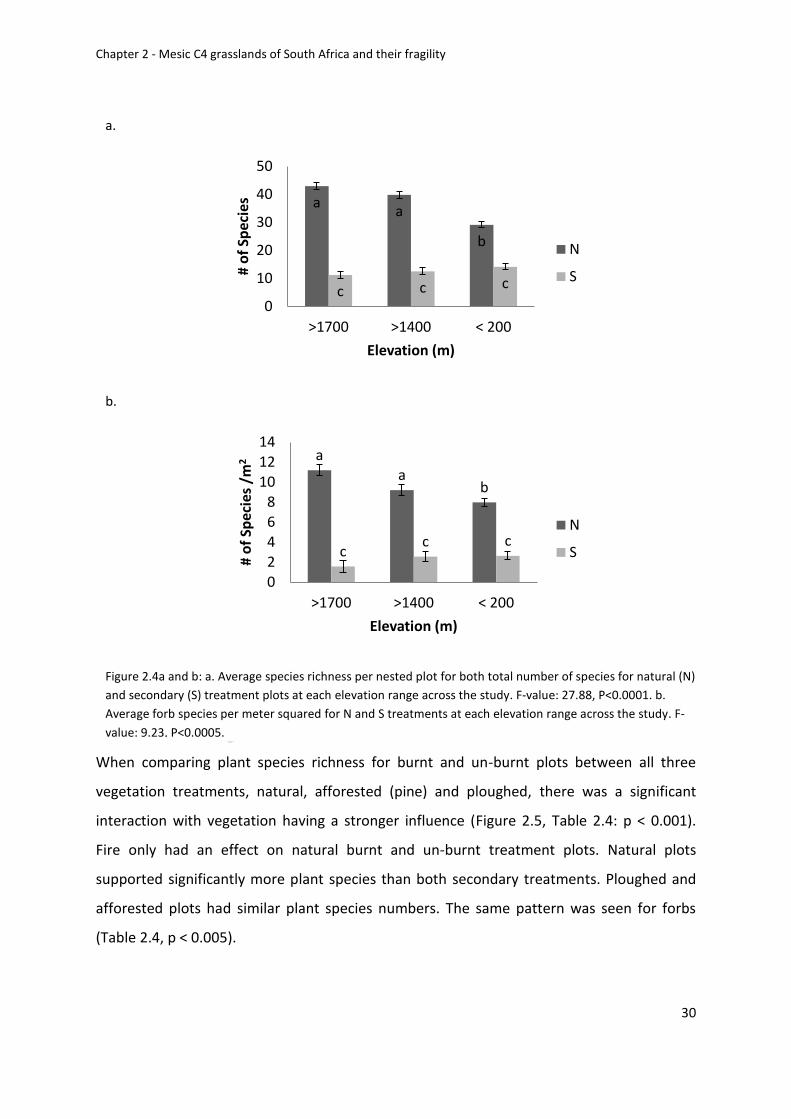
Univers
ity of
Cap
e Tow
n
Chapter 2 - Mesic C4 grasslands of South Africa and their fragility
30
When comparing plant species richness for burnt and un-burnt plots between all three
vegetation treatments, natural, afforested (pine) and ploughed, there was a significant
interaction with vegetation having a stronger influence (Figure 2.5, Table 2.4: p < 0.001).
Fire only had an effect on natural burnt and un-burnt treatment plots. Natural plots
supported significantly more plant species than both secondary treatments. Ploughed and
afforested plots had similar plant species numbers. The same pattern was seen for forbs
(Table 2.4, p < 0.005).
a.
aa
b
c c c
0
10
20
30
40
50
>1700 >1400 < 200
# o
f Sp
ecie
s
Elevation (m)
N
S
b.
aa
b
cc c
0
2
4
6
8
10
12
14
>1700 >1400 < 200
# o
f Sp
ecie
s /m
2
Elevation (m)
N
S
Figure 2.4a and b: a. Average species richness per nested plot for both total number of species for natural (N)
and secondary (S) treatment plots at each elevation range across the study. F-value: 27.88, P<0.0001. b.
Average forb species per meter squared for N and S treatments at each elevation range across the study. F-
value: 9.23, P<0.0005.
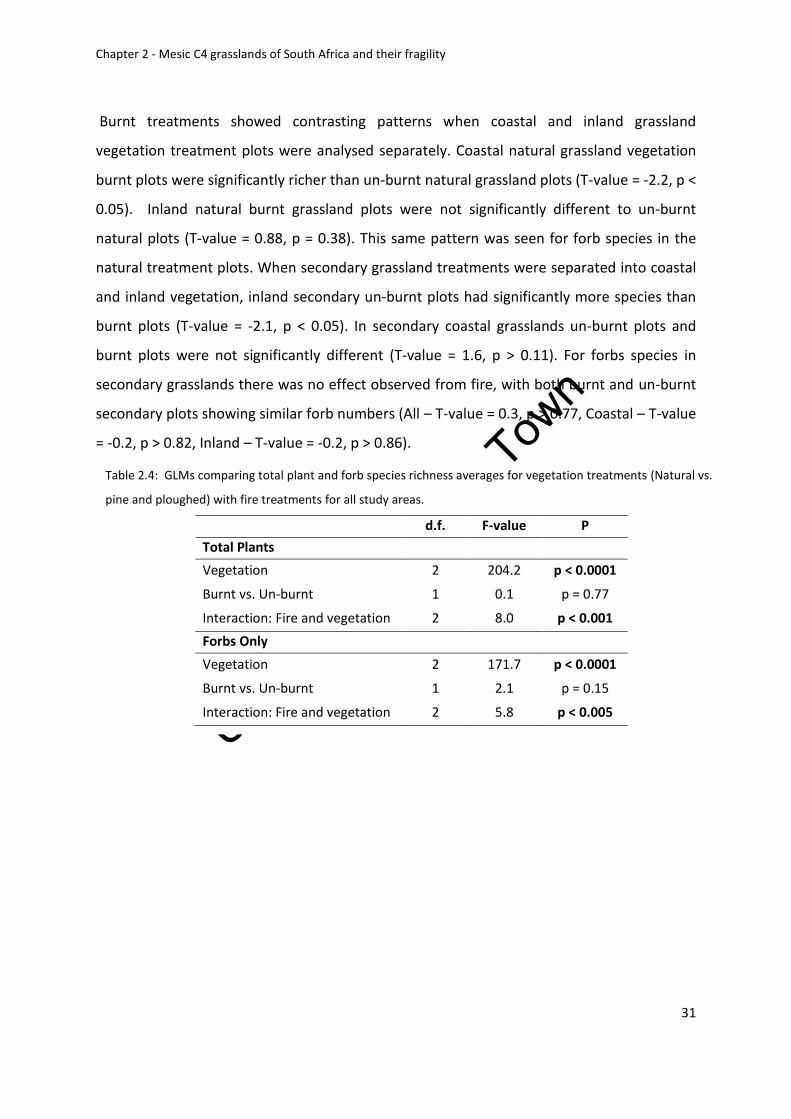
Univers
ity of
Cap
e Tow
n
Chapter 2 - Mesic C4 grasslands of South Africa and their fragility
31
Burnt treatments showed contrasting patterns when coastal and inland grassland
vegetation treatment plots were analysed separately. Coastal natural grassland vegetation
burnt plots were significantly richer than un-burnt natural grassland plots (T-value = -2.2, p <
0.05). Inland natural burnt grassland plots were not significantly different to un-burnt
natural plots (T-value = 0.88, p = 0.38). This same pattern was seen for forb species in the
natural treatment plots. When secondary grassland treatments were separated into coastal
and inland vegetation, inland secondary un-burnt plots had significantly more species than
burnt plots (T-value = -2.1, p < 0.05). In secondary coastal grasslands un-burnt plots and
burnt plots were not significantly different (T-value = 1.6, p > 0.11). For forbs species in
secondary grasslands there was no effect observed from fire, with both burnt and un-burnt
secondary plots showing similar forb numbers (All – T-value = 0.3, p > 0.77, Coastal – T-value
= -0.2, p > 0.82, Inland – T-value = -0.2, p > 0.86).
Table 2.4: GLMs comparing total plant and forb species richness averages for vegetation treatments (Natural vs.
pine and ploughed) with fire treatments for all study areas.
d.f. F-value P
Total Plants
Vegetation 2 204.2 p < 0.0001
Burnt vs. Un-burnt 1 0.1 p = 0.77
Interaction: Fire and vegetation 2 8.0 p < 0.001
Forbs Only
Vegetation 2 171.7 p < 0.0001
Burnt vs. Un-burnt 1 2.1 p = 0.15
Interaction: Fire and vegetation 2 5.8 p < 0.005
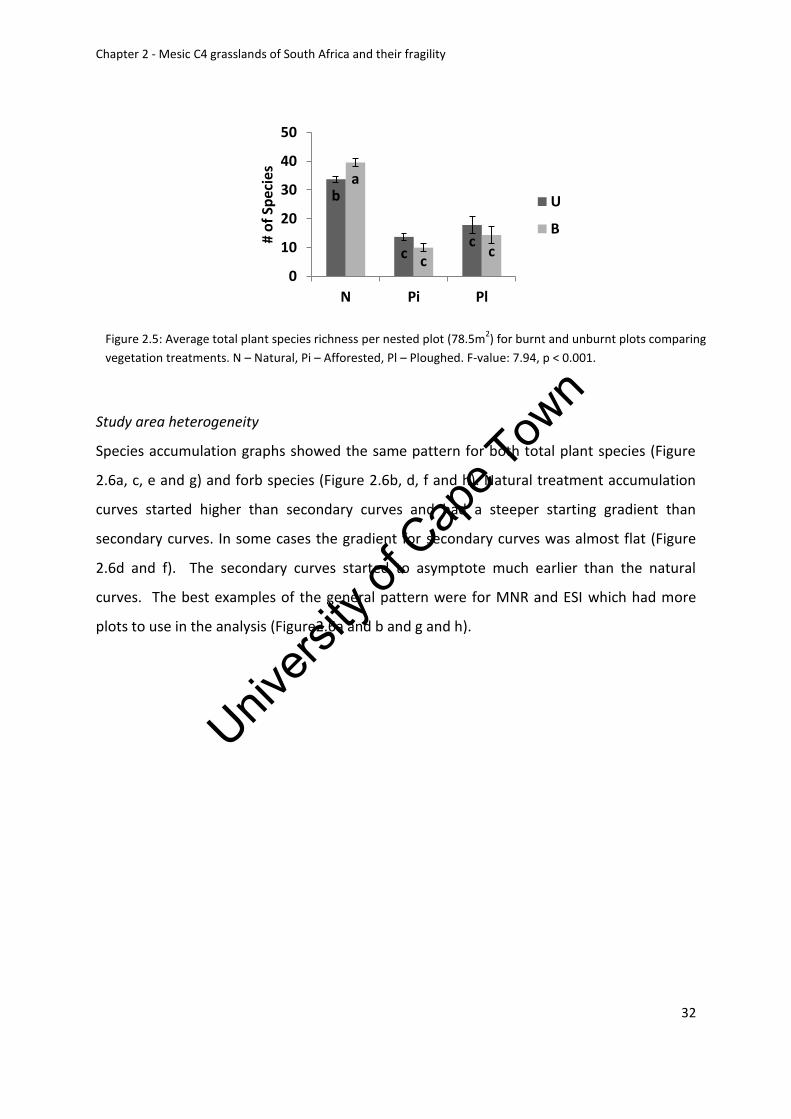
Univers
ity of
Cap
e Tow
n
Chapter 2 - Mesic C4 grasslands of South Africa and their fragility
32
Study area heterogeneity
Species accumulation graphs showed the same pattern for both total plant species (Figure
2.6a, c, e and g) and forb species (Figure 2.6b, d, f and h). Natural treatment accumulation
curves started higher than secondary curves and had a steeper starting gradient than
secondary curves. In some cases the gradient for secondary curves was almost flat (Figure
2.6d and f). The secondary curves started to asymptote much earlier than the natural
curves. The best examples of the general pattern were for MNR and ESI which had more
plots to use in the analysis (Figure2.6a and b and g and h).
b
cc
a
cc
0
10
20
30
40
50
N Pi Pl
# o
f Sp
ecie
s
U
B
Figure 2.5: Average total plant species richness per nested plot (78.5m2) for burnt and unburnt plots comparing
vegetation treatments. N – Natural, Pi – Afforested, Pl – Ploughed. F-value: 7.94, p < 0.001.
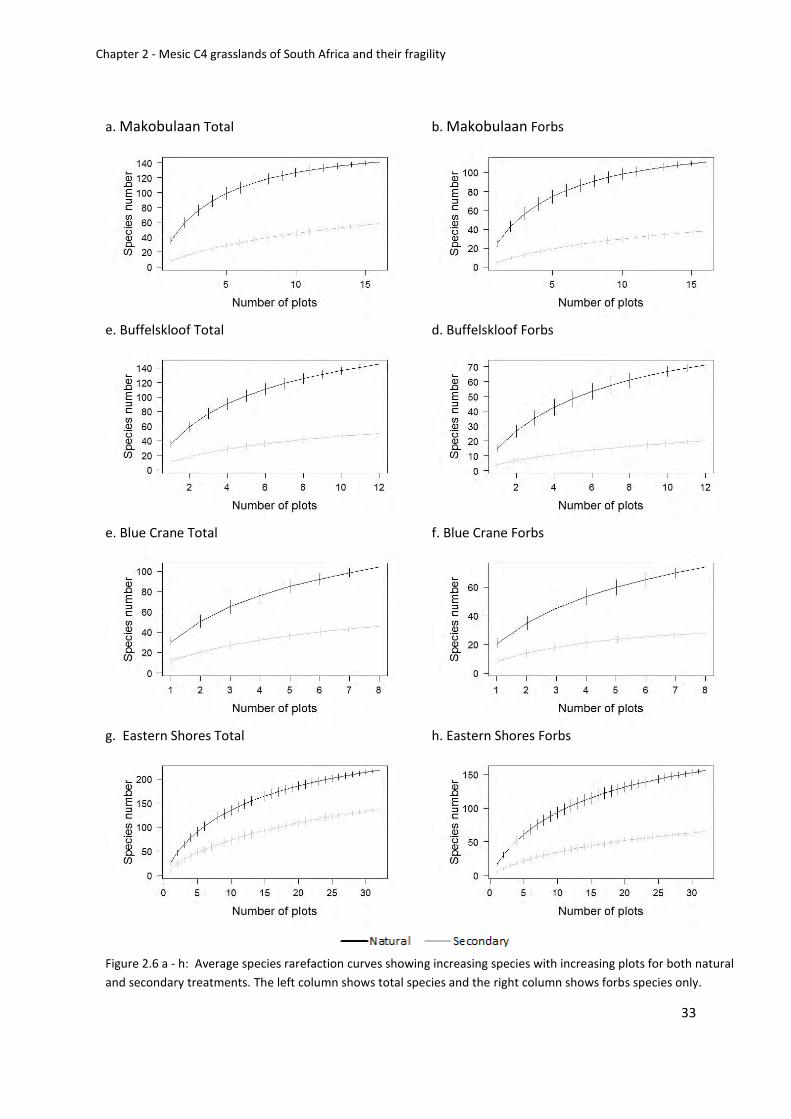
Univers
ity of
Cap
e Tow
n
Chapter 2 - Mesic C4 grasslands of South Africa and their fragility
33
a. Makobulaan Total
b. Makobulaan Forbs
e. Buffelskloof Total
d. Buffelskloof Forbs
e. Blue Crane Total
f. Blue Crane Forbs
g. Eastern Shores Total
h. Eastern Shores Forbs
Figure 2.6 a - h: Average species rarefaction curves showing increasing species with increasing plots for both natural
and secondary treatments. The left column shows total species and the right column shows forbs species only.
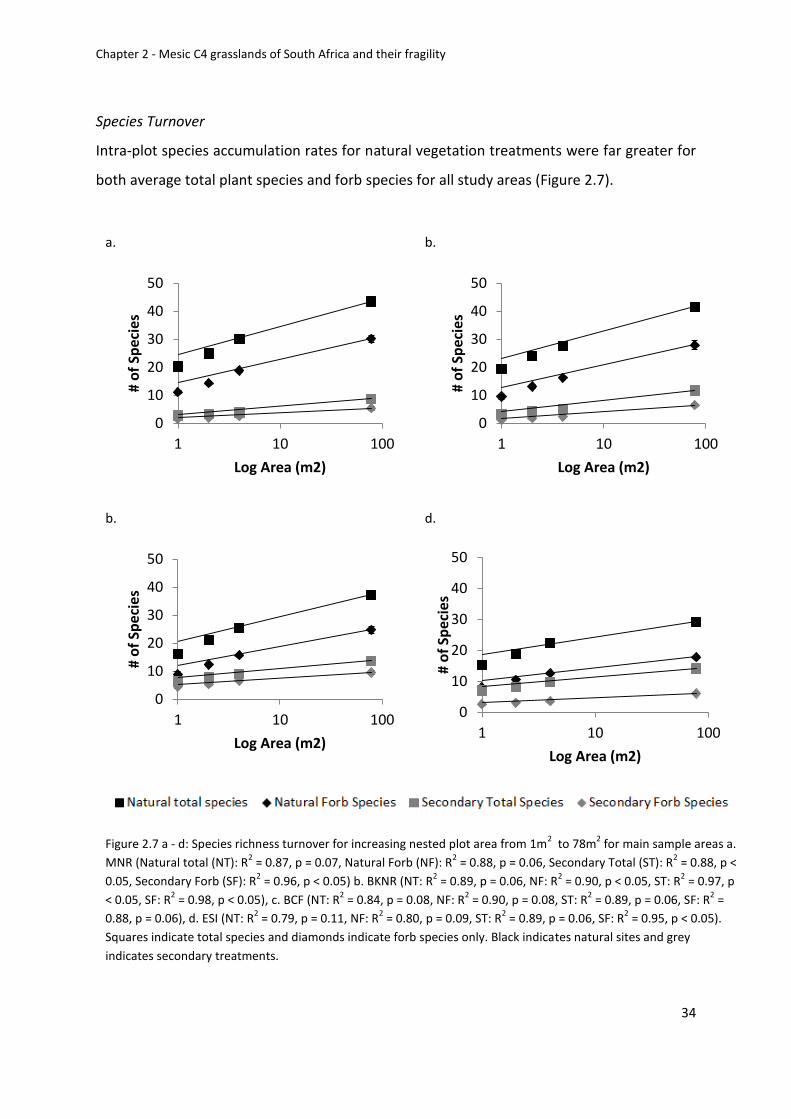
Univers
ity of
Cap
e Tow
n
Chapter 2 - Mesic C4 grasslands of South Africa and their fragility
34
Species Turnover
Intra-plot species accumulation rates for natural vegetation treatments were far greater for
both average total plant species and forb species for all study areas (Figure 2.7).
a.
0
10
20
30
40
50
1 10 100
# o
f Sp
ecie
s
Log Area (m2)
b.
0
10
20
30
40
50
1 10 100#
of
Spec
ies
Log Area (m2)
b.
0
10
20
30
40
50
1 10 100
# o
f Sp
eci
es
Log Area (m2)
d.
0
10
20
30
40
50
1 10 100
# o
f Sp
eci
es
Log Area (m2)
Figure 2.7 a - d: Species richness turnover for increasing nested plot area from 1m2 to 78m
2 for main sample areas a.
MNR (Natural total (NT): R2 = 0.87, p = 0.07, Natural Forb (NF): R
2 = 0.88, p = 0.06, Secondary Total (ST): R
2 = 0.88, p <
0.05, Secondary Forb (SF): R2 = 0.96, p < 0.05) b. BKNR (NT: R
2 = 0.89, p = 0.06, NF: R
2 = 0.90, p < 0.05, ST: R
2 = 0.97, p
< 0.05, SF: R2 = 0.98, p < 0.05), c. BCF (NT: R
2 = 0.84, p = 0.08, NF: R
2 = 0.90, p = 0.08, ST: R
2 = 0.89, p = 0.06, SF: R
2 =
0.88, p = 0.06), d. ESI (NT: R2 = 0.79, p = 0.11, NF: R
2 = 0.80, p = 0.09, ST: R
2 = 0.89, p = 0.06, SF: R
2 = 0.95, p < 0.05).
Squares indicate total species and diamonds indicate forb species only. Black indicates natural sites and grey
indicates secondary treatments.
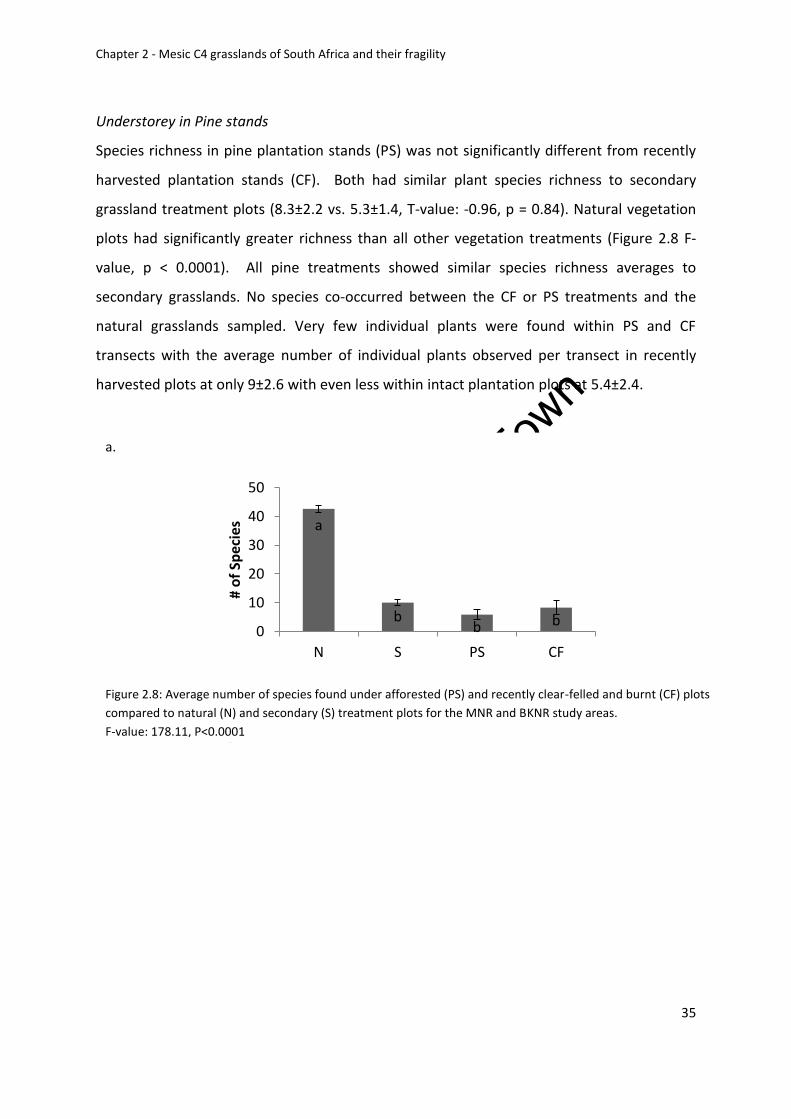
Univers
ity of
Cap
e Tow
n
Chapter 2 - Mesic C4 grasslands of South Africa and their fragility
35
Understorey in Pine stands
Species richness in pine plantation stands (PS) was not significantly different from recently
harvested plantation stands (CF). Both had similar plant species richness to secondary
grassland treatment plots (8.3±2.2 vs. 5.3±1.4, T-value: -0.96, p = 0.84). Natural vegetation
plots had significantly greater richness than all other vegetation treatments (Figure 2.8 F-
value, p < 0.0001). All pine treatments showed similar species richness averages to
secondary grasslands. No species co-occurred between the CF or PS treatments and the
natural grasslands sampled. Very few individual plants were found within PS and CF
transects with the average number of individual plants observed per transect in recently
harvested plots at only 9±2.6 with even less within intact plantation plots at 5.4±2.4.
a.
a
bb b
0
10
20
30
40
50
N S PS CF
# o
f Sp
ecie
s
Figure 2.8: Average number of species found under afforested (PS) and recently clear-felled and burnt (CF) plots
compared to natural (N) and secondary (S) treatment plots for the MNR and BKNR study areas.
F-value: 178.11, P<0.0001
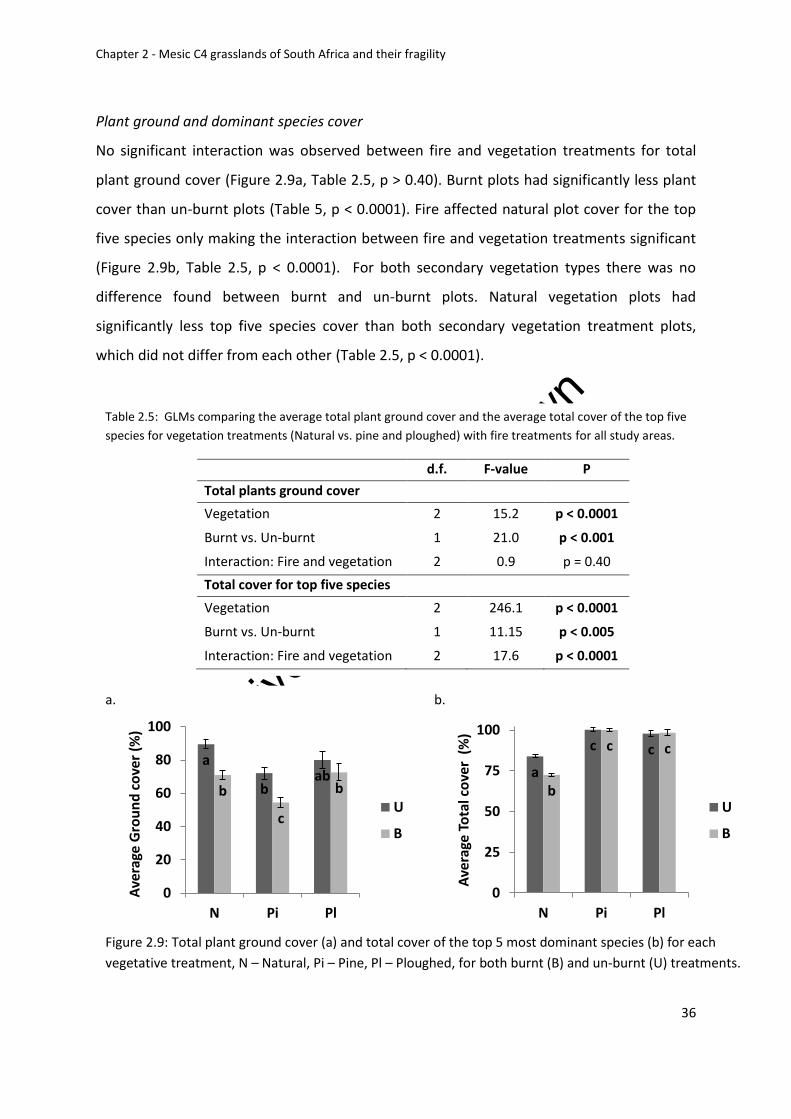
Univers
ity of
Cap
e Tow
n
Chapter 2 - Mesic C4 grasslands of South Africa and their fragility
36
Plant ground and dominant species cover
No significant interaction was observed between fire and vegetation treatments for total
plant ground cover (Figure 2.9a, Table 2.5, p > 0.40). Burnt plots had significantly less plant
cover than un-burnt plots (Table 5, p < 0.0001). Fire affected natural plot cover for the top
five species only making the interaction between fire and vegetation treatments significant
(Figure 2.9b, Table 2.5, p < 0.0001). For both secondary vegetation types there was no
difference found between burnt and un-burnt plots. Natural vegetation plots had
significantly less top five species cover than both secondary vegetation treatment plots,
which did not differ from each other (Table 2.5, p < 0.0001).
Table 2.5: GLMs comparing the average total plant ground cover and the average total cover of the top five
species for vegetation treatments (Natural vs. pine and ploughed) with fire treatments for all study areas.
d.f. F-value P
Total plants ground cover
Vegetation 2 15.2 p < 0.0001
Burnt vs. Un-burnt 1 21.0 p < 0.001
Interaction: Fire and vegetation 2 0.9 p = 0.40
Total cover for top five species
Vegetation 2 246.1 p < 0.0001
Burnt vs. Un-burnt 1 11.15 p < 0.005
Interaction: Fire and vegetation 2 17.6 p < 0.0001
a.
a
bab
b
c
b
0
20
40
60
80
100
N Pi Pl
Ave
rage
Gro
un
d c
ove
r (%
)
U
B
b.
a
c c
b
c c
0
25
50
75
100
N Pi Pl
Ave
rage
To
tal c
ove
r (
%)
U
B
Figure 2.9: Total plant ground cover (a) and total cover of the top 5 most dominant species (b) for each
vegetative treatment, N – Natural, Pi – Pine, Pl – Ploughed, for both burnt (B) and un-burnt (U) treatments.
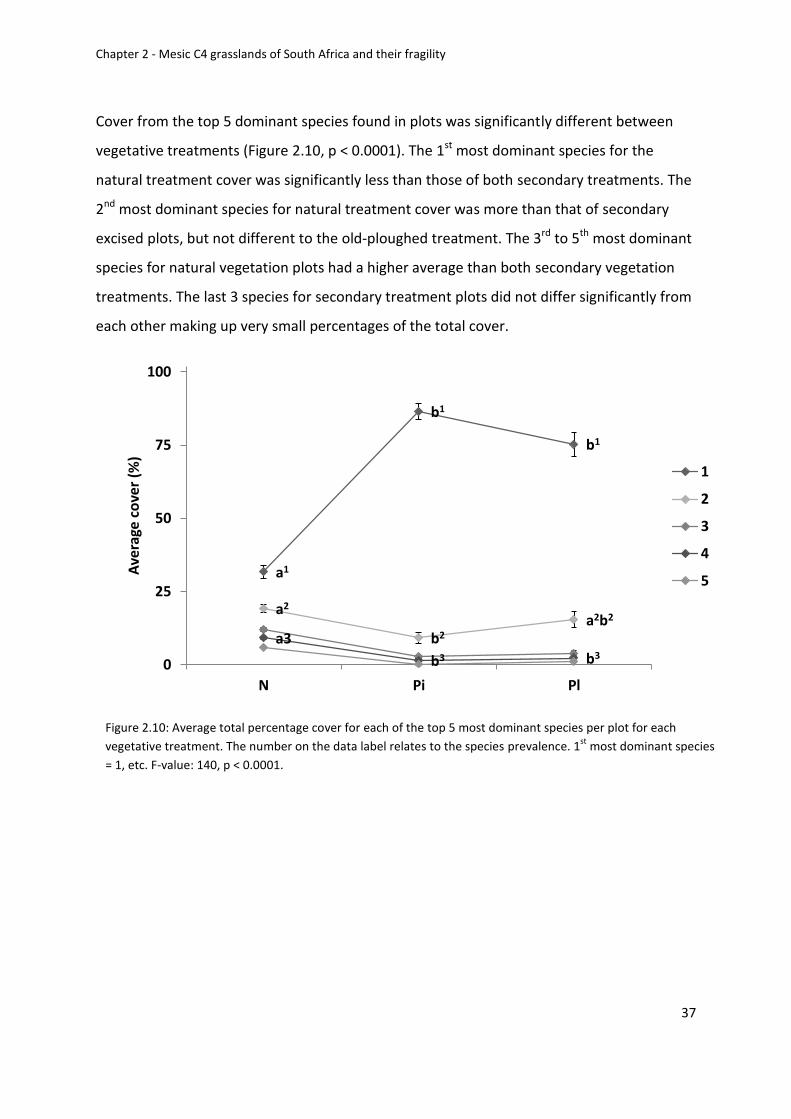
Univers
ity of
Cap
e Tow
n
Chapter 2 - Mesic C4 grasslands of South Africa and their fragility
37
Cover from the top 5 dominant species found in plots was significantly different between
vegetative treatments (Figure 2.10, p < 0.0001). The 1st most dominant species for the
natural treatment cover was significantly less than those of both secondary treatments. The
2nd most dominant species for natural treatment cover was more than that of secondary
excised plots, but not different to the old-ploughed treatment. The 3rd to 5th most dominant
species for natural vegetation plots had a higher average than both secondary vegetation
treatments. The last 3 species for secondary treatment plots did not differ significantly from
each other making up very small percentages of the total cover.
a1
b1
b1
a2
b2a2b2
a3
b3 b30
25
50
75
100
N Pi Pl
Ave
rage
co
ver
(%)
1
2
3
4
5
Figure 2.10: Average total percentage cover for each of the top 5 most dominant species per plot for each
vegetative treatment. The number on the data label relates to the species prevalence. 1st
most dominant species
= 1, etc. F-value: 140, p < 0.0001.
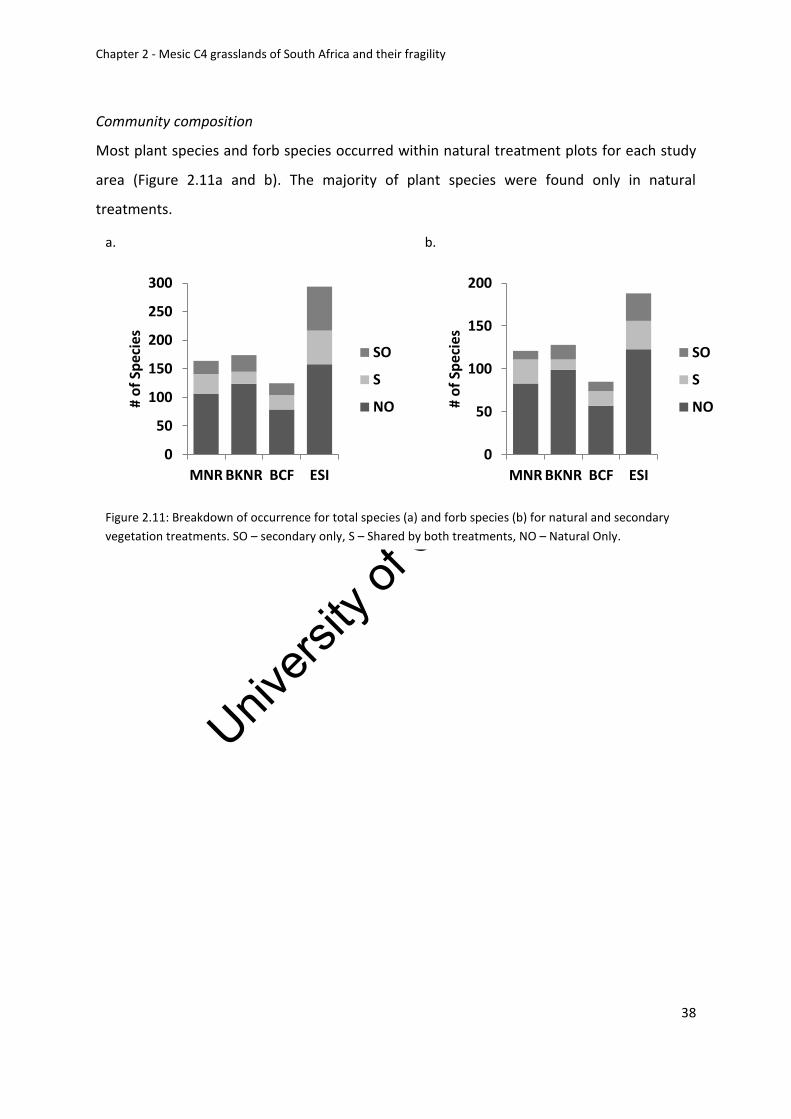
Univers
ity of
Cap
e Tow
n
Chapter 2 - Mesic C4 grasslands of South Africa and their fragility
38
Community composition
Most plant species and forb species occurred within natural treatment plots for each study
area (Figure 2.11a and b). The majority of plant species were found only in natural
treatments.
a.
0
50
100
150
200
250
300
MNR BKNR BCF ESI
# o
f Sp
ecie
s
SO
S
NO
b.
0
50
100
150
200
MNR BKNR BCF ESI
# o
f Sp
ecie
s
SO
S
NO
Figure 2.11: Breakdown of occurrence for total species (a) and forb species (b) for natural and secondary
vegetation treatments. SO – secondary only, S – Shared by both treatments, NO – Natural Only.
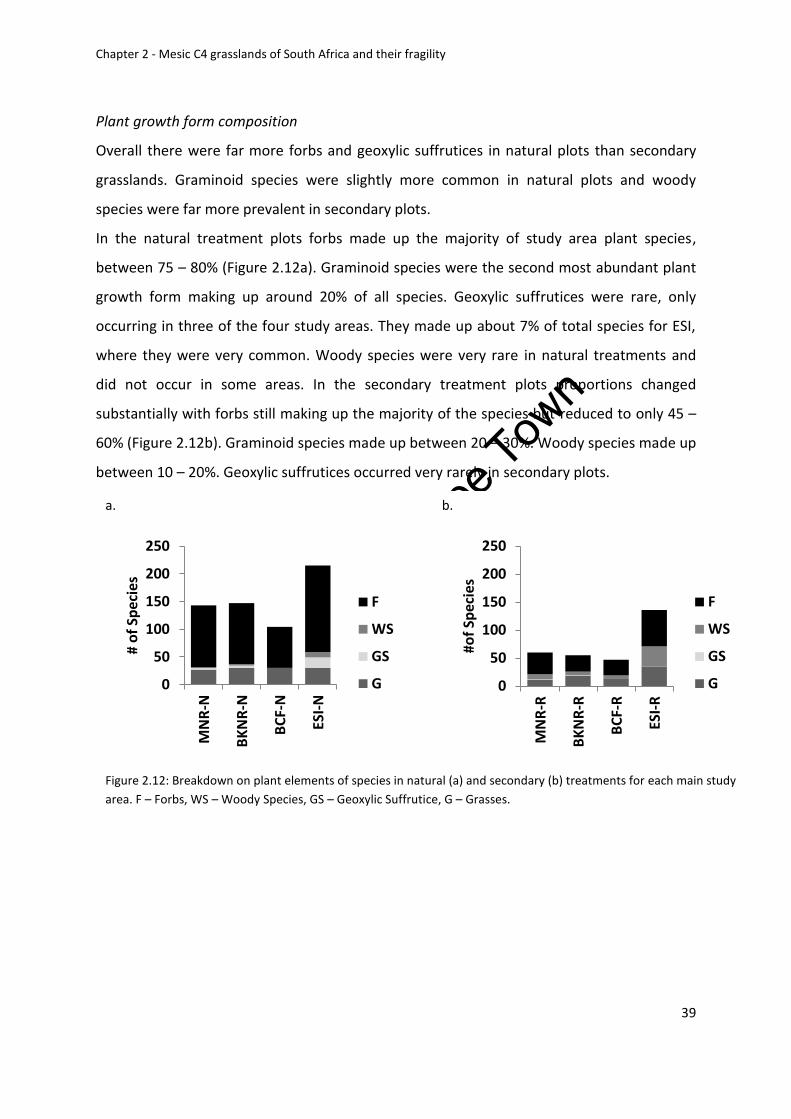
Univers
ity of
Cap
e Tow
n
Chapter 2 - Mesic C4 grasslands of South Africa and their fragility
39
Plant growth form composition
Overall there were far more forbs and geoxylic suffrutices in natural plots than secondary
grasslands. Graminoid species were slightly more common in natural plots and woody
species were far more prevalent in secondary plots.
In the natural treatment plots forbs made up the majority of study area plant species,
between 75 – 80% (Figure 2.12a). Graminoid species were the second most abundant plant
growth form making up around 20% of all species. Geoxylic suffrutices were rare, only
occurring in three of the four study areas. They made up about 7% of total species for ESI,
where they were very common. Woody species were very rare in natural treatments and
did not occur in some areas. In the secondary treatment plots proportions changed
substantially with forbs still making up the majority of the species but reduced to only 45 –
60% (Figure 2.12b). Graminoid species made up between 20 – 30%. Woody species made up
between 10 – 20%. Geoxylic suffrutices occurred very rarely in secondary plots.
a.
0
50
100
150
200
250
MN
R-N
BK
NR
-N
BC
F-N
ESI-
N
# o
f Sp
ecie
s
F
WS
GS
G
b.
0
50
100
150
200
250M
NR
-R
BK
NR
-R
BC
F-R
ESI-
R
#of
Spec
ies
F
WS
GS
G
Figure 2.12: Breakdown on plant elements of species in natural (a) and secondary (b) treatments for each main study
area. F – Forbs, WS – Woody Species, GS – Geoxylic Suffrutice, G – Grasses.
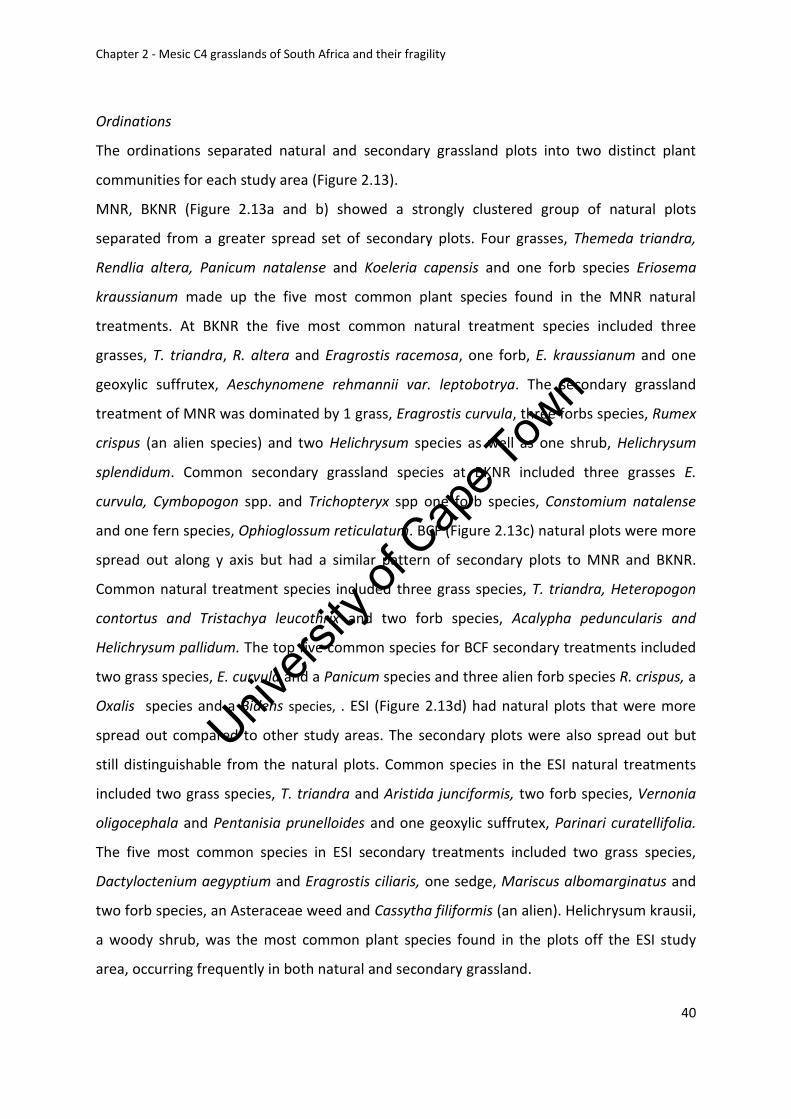
Univers
ity of
Cap
e Tow
n
Chapter 2 - Mesic C4 grasslands of South Africa and their fragility
40
Ordinations
The ordinations separated natural and secondary grassland plots into two distinct plant
communities for each study area (Figure 2.13).
MNR, BKNR (Figure 2.13a and b) showed a strongly clustered group of natural plots
separated from a greater spread set of secondary plots. Four grasses, Themeda triandra,
Rendlia altera, Panicum natalense and Koeleria capensis and one forb species Eriosema
kraussianum made up the five most common plant species found in the MNR natural
treatments. At BKNR the five most common natural treatment species included three
grasses, T. triandra, R. altera and Eragrostis racemosa, one forb, E. kraussianum and one
geoxylic suffrutex, Aeschynomene rehmannii var. leptobotrya. The secondary grassland
treatment of MNR was dominated by 1 grass, Eragrostis curvula, three forbs species, Rumex
crispus (an alien species) and two Helichrysum species as well as one shrub, Helichrysum
splendidum. Common secondary grassland species at BKNR included three grasses E.
curvula, Cymbopogon spp. and Trichopteryx spp one forb species, Constomium natalense
and one fern species, Ophioglossum reticulatum. BCF (Figure 2.13c) natural plots were more
spread out along y axis but had a similar pattern of secondary plots to MNR and BKNR.
Common natural treatment species included three grass species, T. triandra, Heteropogon
contortus and Tristachya leucothrix and two forb species, Acalypha peduncularis and
Helichrysum pallidum. The top five common species for BCF secondary treatments included
two grass species, E. curvula and a Panicum species and three alien forb species R. crispus, a
Oxalis species and a Bidens species, . ESI (Figure 2.13d) had natural plots that were more
spread out compared to other study areas. The secondary plots were also spread out but
still distinguishable from the natural plots. Common species in the ESI natural treatments
included two grass species, T. triandra and Aristida junciformis, two forb species, Vernonia
oligocephala and Pentanisia prunelloides and one geoxylic suffrutex, Parinari curatellifolia.
The five most common species in ESI secondary treatments included two grass species,
Dactyloctenium aegyptium and Eragrostis ciliaris, one sedge, Mariscus albomarginatus and
two forb species, an Asteraceae weed and Cassytha filiformis (an alien). Helichrysum krausii,
a woody shrub, was the most common plant species found in the plots off the ESI study
area, occurring frequently in both natural and secondary grassland.
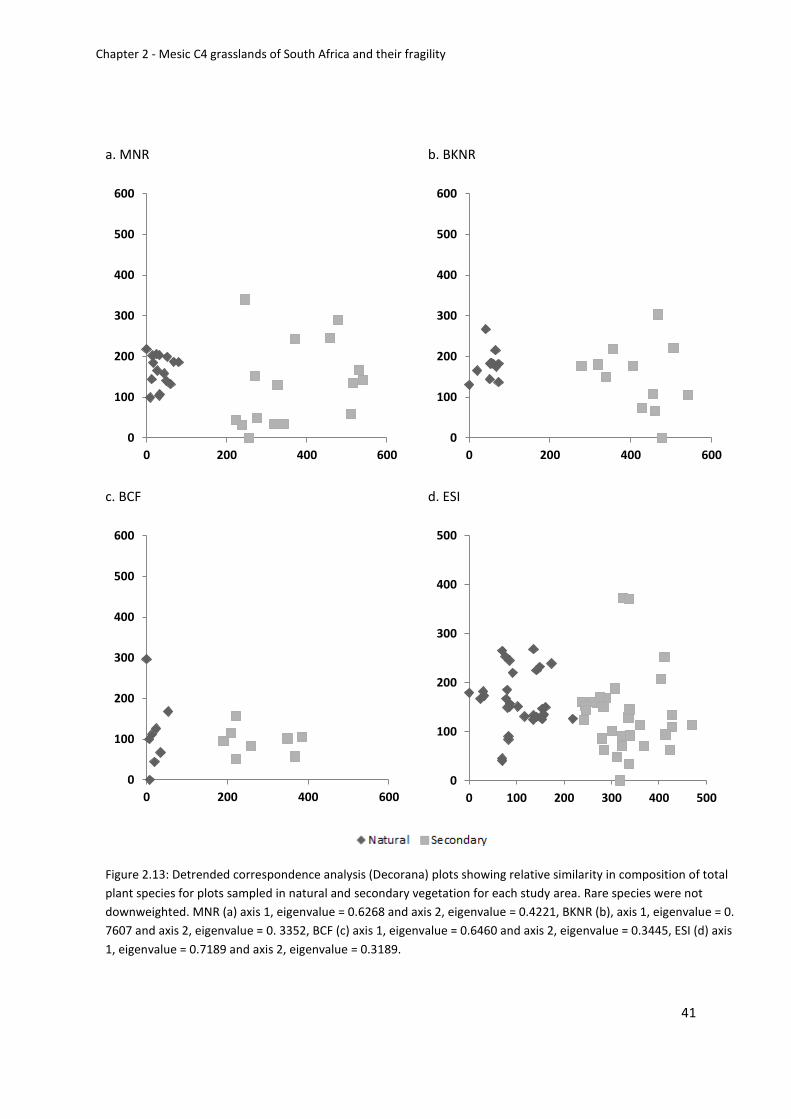
Univers
ity of
Cap
e Tow
n
Chapter 2 - Mesic C4 grasslands of South Africa and their fragility
41
a. MNR
0
100
200
300
400
500
600
0 200 400 600
b. BKNR
0
100
200
300
400
500
600
0 200 400 600
c. BCF
0
100
200
300
400
500
600
0 200 400 600
d. ESI
0
100
200
300
400
500
0 100 200 300 400 500
Figure 2.13: Detrended correspondence analysis (Decorana) plots showing relative similarity in composition of total
plant species for plots sampled in natural and secondary vegetation for each study area. Rare species were not
downweighted. MNR (a) axis 1, eigenvalue = 0.6268 and axis 2, eigenvalue = 0.4221, BKNR (b), axis 1, eigenvalue = 0.
7607 and axis 2, eigenvalue = 0. 3352, BCF (c) axis 1, eigenvalue = 0.6460 and axis 2, eigenvalue = 0.3445, ESI (d) axis
1, eigenvalue = 0.7189 and axis 2, eigenvalue = 0.3189.
Univers
ity of
Cap
e Tow
n
Chapter 2 - Mesic C4 grasslands of South Africa and their fragility
42
Plant family richness and abundance
Natural plots supported greater family diversity than secondary plots (Appendix 7 – 10).
Within MNR, vegetation treatments shared 10 dicot and five monocot families. Natural
treatments included an additional 20 dicot and 10 monocot families while secondary
treatments included an additional 10 dicot and 3 monocot families.
BKNR vegetation treatments shared only two dicot and four monocot families. Natural
treatments included an additional 24 dicot and eight monocot families while secondary
treatments included an additional nine dicot and two monocot families.
BCF treatments shared six dicot and five monocot families. Natural treatments included an
additional 15 dicot and seven monocot families while secondary treatments included an
additional nine dicot and one monocot families.
ESI vegetation treatments shared 17 dicot and 4 monocot families. Natural treatments
included an additional 22 dicot families and 12 monocot families while secondary
treatments included an additional 10 dicot and five monocot families.
Members of the Asteraceae were found in all study areas in the natural vegetation
treatments and typically were among the top two richest families: MNR had 37 species,
BKNR had 35 species, BCF had 21 and ESI had 23. Poaceae and Fabaceae were the only
other two families found within all the study areas. As regards Poaceae, MNR had 22
species, BKNR had 24, BCF had 25 and ESI had 22. For Fabaceae, MNR had 10, BKNR had 18,
BCF had 11 and ESI had 35 species. Iridaceae and Euphorbiaceae were common families for
three of the study areas. Cyperaceae was rich in species at BCF and ESI. ESI also had an
additional two species-rich families, Scrophulariaceae and Commelinaceae.
For secondary treatments, only Poaceae was rich in species for all the study areas. MNR had
9 species, BKNR had 15, BCF had 12 and ESI had 25. Species of Asteraceae had high species
richness at all study areas except BKNR. Fabaceae had rich species numbers for BKNR and
ESI. Cyperaceae was rich at ESI.
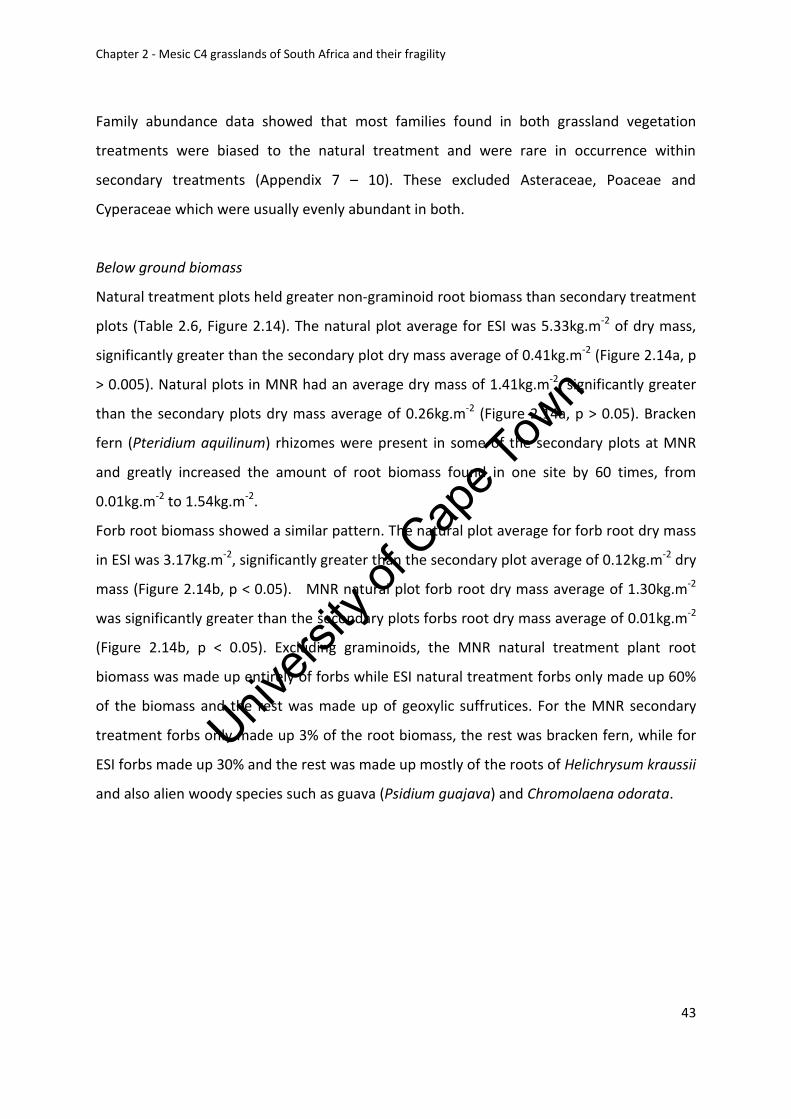
Univers
ity of
Cap
e Tow
n
Chapter 2 - Mesic C4 grasslands of South Africa and their fragility
43
Family abundance data showed that most families found in both grassland vegetation
treatments were biased to the natural treatment and were rare in occurrence within
secondary treatments (Appendix 7 – 10). These excluded Asteraceae, Poaceae and
Cyperaceae which were usually evenly abundant in both.
Below ground biomass
Natural treatment plots held greater non-graminoid root biomass than secondary treatment
plots (Table 2.6, Figure 2.14). The natural plot average for ESI was 5.33kg.m-2 of dry mass,
significantly greater than the secondary plot dry mass average of 0.41kg.m-2 (Figure 2.14a, p
> 0.005). Natural plots in MNR had an average dry mass of 1.41kg.m-2, significantly greater
than the secondary plots dry mass average of 0.26kg.m-2 (Figure 2.14a, p > 0.05). Bracken
fern (Pteridium aquilinum) rhizomes were present in some of the secondary plots at MNR
and greatly increased the amount of root biomass found in one site by 60 times, from
0.01kg.m-2 to 1.54kg.m-2.
Forb root biomass showed a similar pattern. The natural plot average for forb root dry mass
in ESI was 3.17kg.m-2, significantly greater than the secondary plot average of 0.12kg.m-2 dry
mass (Figure 2.14b, p < 0.05). MNR natural plot forb root dry mass average of 1.30kg.m-2
was significantly greater than the secondary plots forbs root dry mass average of 0.01kg.m-2
(Figure 2.14b, p < 0.05). Excluding graminoids, the MNR natural treatment plant root
biomass was made up entirely of forbs while ESI natural treatment forbs only made up 60%
of the biomass and the rest was made up of geoxylic suffrutices. For the MNR secondary
treatment forbs only made up 3% of the root biomass, the rest was bracken fern, while for
ESI forbs made up 30% and the rest was made up mostly of the roots of Helichrysum kraussii
and also alien woody species such as guava (Psidium guajava) and Chromolaena odorata.
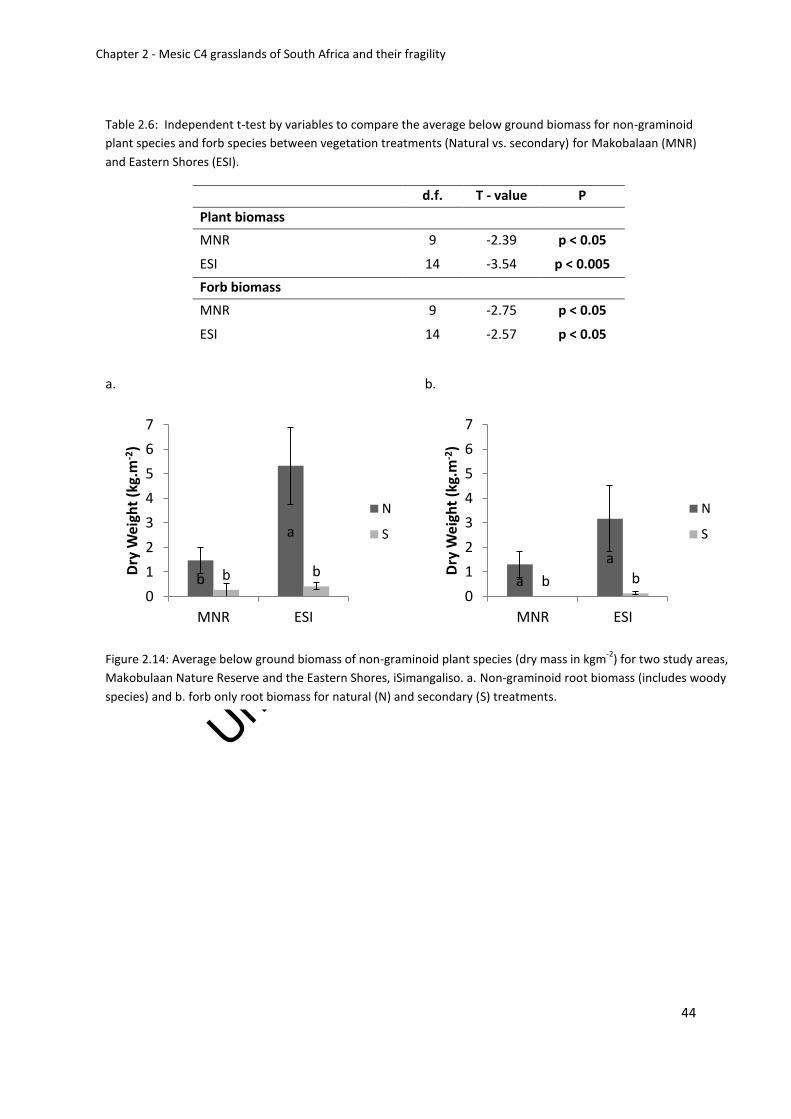
Univers
ity of
Cap
e Tow
n
Chapter 2 - Mesic C4 grasslands of South Africa and their fragility
44
Table 2.6: Independent t-test by variables to compare the average below ground biomass for non-graminoid
plant species and forb species between vegetation treatments (Natural vs. secondary) for Makobalaan (MNR)
and Eastern Shores (ESI).
d.f. T - value P
Plant biomass
MNR 9 -2.39 p < 0.05
ESI 14 -3.54 p < 0.005
Forb biomass
MNR 9 -2.75 p < 0.05
ESI 14 -2.57 p < 0.05
a.
b
a
b b
0
1
2
3
4
5
6
7
MNR ESI
Dry
Wei
ght
(kg.
m-2
)
N
S
b.
a
a
b b0
1
2
3
4
5
6
7
MNR ESI
Dry
We
igh
t (k
g.m
-2)
N
S
Figure 2.14: Average below ground biomass of non-graminoid plant species (dry mass in kgm-2
) for two study areas,
Makobulaan Nature Reserve and the Eastern Shores, iSimangaliso. a. Non-graminoid root biomass (includes woody
species) and b. forb only root biomass for natural (N) and secondary (S) treatments.
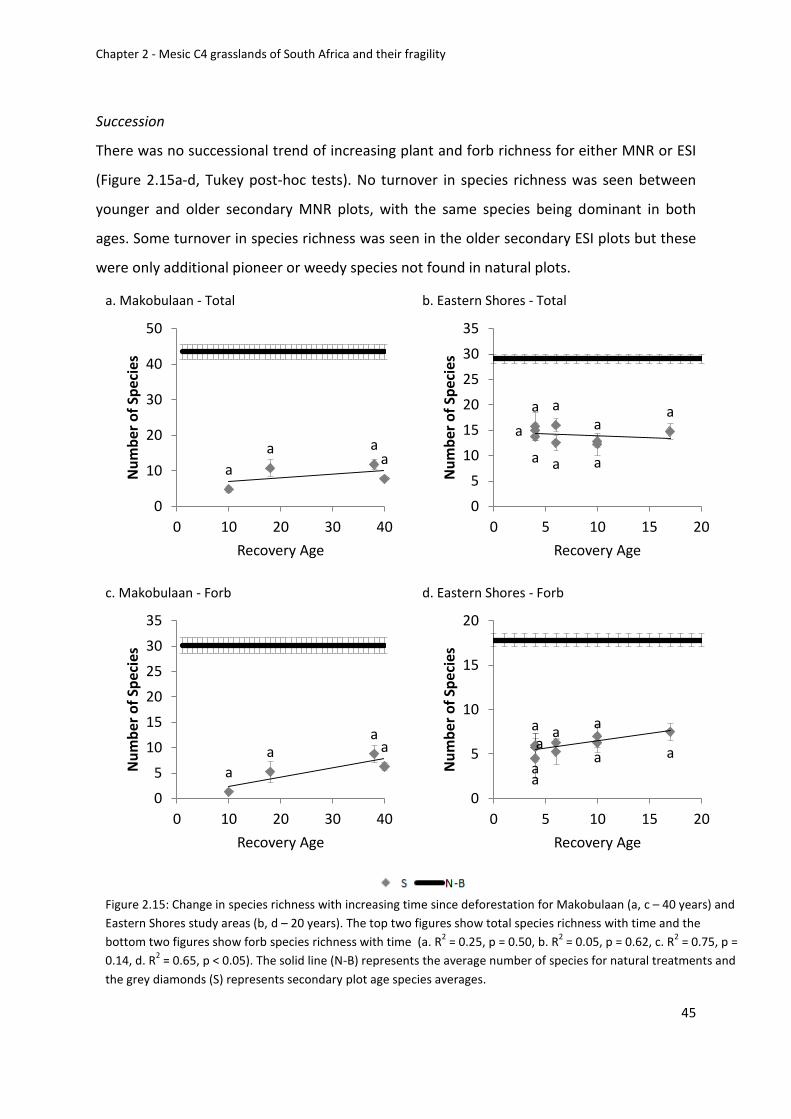
Univers
ity of
Cap
e Tow
n
Chapter 2 - Mesic C4 grasslands of South Africa and their fragility
45
Succession
There was no successional trend of increasing plant and forb richness for either MNR or ESI
(Figure 2.15a-d, Tukey post-hoc tests). No turnover in species richness was seen between
younger and older secondary MNR plots, with the same species being dominant in both
ages. Some turnover in species richness was seen in the older secondary ESI plots but these
were only additional pioneer or weedy species not found in natural plots.
a. Makobulaan - Total
a
a aa
0
10
20
30
40
50
0 10 20 30 40
Nu
mb
er o
f Sp
ecie
s
Recovery Age
b. Eastern Shores - Total
a
a
a a
aa
a
a
0
5
10
15
20
25
30
35
0 5 10 15 20
Nu
mb
er o
f Sp
ecie
s
Recovery Age
c. Makobulaan - Forb
a
aa
a
0
5
10
15
20
25
30
35
0 10 20 30 40
Nu
mb
er o
f Sp
ecie
s
Recovery Age
d. Eastern Shores - Forb
a
a
a
aa
a
a
a
0
5
10
15
20
0 5 10 15 20
Nu
mb
er
of
Spe
cie
s
Recovery Age
Figure 2.15: Change in species richness with increasing time since deforestation for Makobulaan (a, c – 40 years) and
Eastern Shores study areas (b, d – 20 years). The top two figures show total species richness with time and the
bottom two figures show forb species richness with time (a. R2 = 0.25, p = 0.50, b. R
2 = 0.05, p = 0.62, c. R
2 = 0.75, p =
0.14, d. R2 = 0.65, p < 0.05). The solid line (N-B) represents the average number of species for natural treatments and
the grey diamonds (S) represents secondary plot age species averages.
Univers
ity of
Cap
e Tow
n
Chapter 2 - Mesic C4 grasslands of South Africa and their fragility
46
Soils
Soil properties at each of the study areas measured showed a mix of results (Table 2.7a and
b). Makobulaan (Table 2.7a - MNR) secondary treatment plots differed significantly from
natural treatment plots for only three of the tested nutrients, Ca, Mg and K, all of which
were lower in secondary treatments (p < 0.0005). Pine stands were also found to be
significantly lower for these three nutrients when compared to natural plots (p < 0.0005).
Pine stands had significantly more C% (p < 0.005) and N% (p < 0.0005) than natural plots.
Although pine stands and secondary plots had far greater mean Al concentrations than
natural grasslands, there variances were high and therefore not significantly different from
natural plots (p = 0.19). Secondary plots were mostly similar in soil properties to natural
plots, but there was a significant difference found between some younger and older
secondary plots for N%, C% and P – Total (p < 0.0005).
For N%, C%, Ca, Mg and K, younger plots had similar mean values to the natural plots. Older
plots, however, had significantly lower means than those of the natural plots (p < 0.0005). Al
averages found in 10 year old secondary plots were significantly greater than natural plot
averages (p < 0.0005), while older secondary plots had similar averages to natural plots.
Available P increased with increasing plot age but this was not statistically significant.
Buffelskloof (Table 2.7b - BKNR) secondary plots were significantly different from natural
plots for all tested nutrients (p < 0.05) except for pH and Mn. Means for secondary plots
were lower than those of natural plots. Pine stands had significantly lower nutrient
concentrations than natural plots for pH, Ca and K (p < 0.05).
Blue Crane Farm (Table2.7b – BCF) secondary ploughed plots did not differ significantly from
natural plots for any nutrient value.
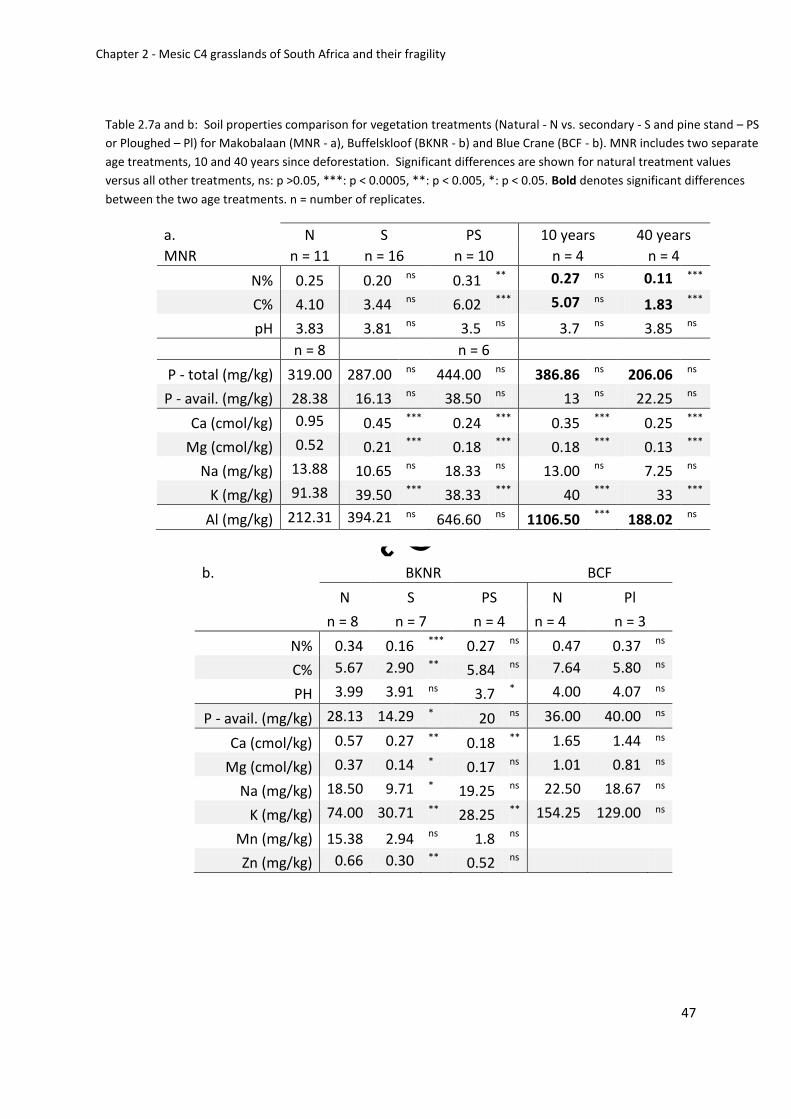
Univers
ity of
Cap
e Tow
n
Chapter 2 - Mesic C4 grasslands of South Africa and their fragility
47
b. BKNR BCF
N S PS N Pl
n = 8 n = 7 n = 4 n = 4 n = 3
N% 0.34 0.16 *** 0.27 ns 0.47 0.37 ns
C% 5.67 2.90 ** 5.84 ns 7.64 5.80 ns
PH 3.99 3.91 ns 3.7 * 4.00 4.07 ns
P - avail. (mg/kg) 28.13 14.29 * 20 ns 36.00 40.00 ns
Ca (cmol/kg) 0.57 0.27 ** 0.18 ** 1.65 1.44 ns
Mg (cmol/kg) 0.37 0.14 * 0.17 ns 1.01 0.81 ns
Na (mg/kg) 18.50 9.71 * 19.25 ns 22.50 18.67 ns
K (mg/kg) 74.00 30.71 ** 28.25 ** 154.25 129.00 ns
Mn (mg/kg) 15.38 2.94 ns 1.8 ns
Zn (mg/kg) 0.66 0.30 ** 0.52 ns
Table 2.7a and b: Soil properties comparison for vegetation treatments (Natural - N vs. secondary - S and pine stand – PS
or Ploughed – Pl) for Makobalaan (MNR - a), Buffelskloof (BKNR - b) and Blue Crane (BCF - b). MNR includes two separate
age treatments, 10 and 40 years since deforestation. Significant differences are shown for natural treatment values
versus all other treatments, ns: p >0.05, ***: p < 0.0005, **: p < 0.005, *: p < 0.05. Bold denotes significant differences
between the two age treatments. n = number of replicates.
a. N S PS 10 years 40 years
MNR n = 11 n = 16 n = 10 n = 4 n = 4
N% 0.25 0.20 ns 0.31 ** 0.27 ns 0.11 ***
C% 4.10 3.44 ns 6.02 *** 5.07 ns 1.83 ***
pH 3.83 3.81 ns 3.5 ns 3.7 ns 3.85 ns
n = 8 n = 6
P - total (mg/kg) 319.00 287.00 ns 444.00 ns 386.86 ns 206.06 ns
P - avail. (mg/kg) 28.38 16.13 ns 38.50 ns 13 ns 22.25 ns
Ca (cmol/kg) 0.95 0.45 *** 0.24 *** 0.35 *** 0.25 ***
Mg (cmol/kg) 0.52 0.21 *** 0.18 *** 0.18 *** 0.13 ***
Na (mg/kg) 13.88 10.65 ns 18.33 ns 13.00 ns 7.25 ns
K (mg/kg) 91.38 39.50 *** 38.33 *** 40 *** 33 ***
Al (mg/kg) 212.31 394.21 ns 646.60 ns 1106.50 *** 188.02 ns
Univers
ity of
Cap
e Tow
n
Chapter 2 - Mesic C4 grasslands of South Africa and their fragility
48
DISCUSSION:
Composition and characteristics of the South African grassland biome
Natural grassland systems throughout South Africa support diverse plant communities. In
the present study, resprouting forbs dominated the grasslands in terms of number of
species, being the most diverse plant life form. The plant alpha diversity was far greater at
higher elevations overall, while the coastal mosaic grassland supported far more woody
individuals including many geoxylic suffrutices which are far more abundant and diverse in
this area. Although all of the natural grasslands were heterogeneous, there were far more
locally widespread species sampled at higher elevations with the Eastern Shores area
supporting a lot more rare plant species that gave the Eastern shores a higher beta diversity.
Forb richness in natural grasslands was seemingly increased in burnt areas, as a result of
fire-stimulated growth seen in natural grassland forb species (Uys et al. 2004). Fire
decreased ground cover in the higher natural grasslands and particularly the cover of the
dominant species compared to un-burnt veld. Forbs are able to take advantage of this post-
fire reduction in above ground grass competition.
This research indicated several possible criteria that could be used to identify natural
grassland and distinguish it from secondary grassland (Appendix 11). Focusing on natural
grassland characteristics one could identify a natural grassland by the diversity in number
and cover of its plant species. More specifically this would include a. an evenly distributed
grass species vegetation cover combined with b. a high alpha diversity in forb species.
c. High resprouting forb USO biomass would be the third criteria to test for. These criteria
are more distinct in natural grassland if they have been recently burnt.
Are secondary grasslands recovering from afforestation and ploughing?
Both afforestation and ploughing had negative effects on secondary grassland systems. Each
land use resulted in fundamentally different plant communities compared to natural
grassland vegetation and although differing slightly with different elevations this pattern is
similar for all study areas. As in the secondary coastal grassland sampled by Zaloumis and
Univers
ity of
Cap
e Tow
n
Chapter 2 - Mesic C4 grasslands of South Africa and their fragility
49
Bond (2011), higher elevation secondary grasslands supported far more homogenous
communities that are species poor with little intra-plot turnover. Secondary grasslands were
dominated by fewer widespread invasive species and communities were very monospecific.
Burnt secondary grasslands had a barren appearance. The plants they supported had no fire
stimulated flowering response. Unlike natural grasslands, there was no change in
proportional plant cover, or a seeming increase in forb richness, as there were no forbs to
take advantage of the reduced grass competition. Grasses therefore remain the visually
dominant plant life form.
Secondary grasslands were not only missing a whole suite of natural grassland species but
families and plant functional types had been lost. Most notable was the lack of resprouting
forbs. Natural grasslands contained up to 31000kg of below ground forb root mass per
hectare compared to less than 5% of this biomass in secondary grasslands. Resprouting
forbs had been replaced by weedy or woody elements, members of the Asteraceae and
Fabaceae being the most frequent. This catastrophic loss of forbs in secondary grasslands
raises a number of questions: How important are forbs in the context of grassland ecology?
What are the implications of removing resprouting forbs from grassland systems? At a local
scale forbs and their roots are food for animals (Laden & Wrangham 2005). Natural
grasslands support far higher grazing potential than secondary grasslands (Mentis 1999).
Resprouting forbs probably play an important role in nutrient cycling within the soil because
of lower C:N ratios than C4 grasses. However this would need further investigation. Along
with an intact grassy layer they help prevent top soil loss, responding appropriately to and
promoting resilience against natural disturbances such as fire and high intensity erosive
rainfall. Bare burnt secondary grassland are prone to soil erosion as they have little in the
way of established plants to hold the soil together when faced with high levels of water run-
off. The large quantity of underground forb biomass has to play an enormous role in the
carbon cycle, trapping carbon in the soil within perennial underground storage organs.
When these forbs are removed all this carbon is released back into the atmosphere while
secondary grasslands lack the forbs with large USOs and may therefore be slow to sequester
carbon. This only incorporates the non-graminoid plant species sampled during this study,
Univers
ity of
Cap
e Tow
n
Chapter 2 - Mesic C4 grasslands of South Africa and their fragility
50
however, grass roots biomass, which we suspect to be far lower in secondary grassland,
could also contribute to carbon sequestration in natural grasslands.
The grasslands within the Eastern Shores study area occurred on sandy, naturally nutrient-
poor soils (Taylor 2004). For the measured soil parameters conifer plantations have had
little effect on these soils and post-afforestation soil attributes were found to be similar in
most respects to natural grasslands (James 1998) so that soil differences are unlikely to
account for divergent grassland composition in this particular instance.
Blue Crane Farm was situated in grassland that has well drained, nutrient poor sedimentary
material with a low to medium proportion of clay content (Mucina & Rutherford 2006). Our
investigation into soil attributes showed that for this study area nutrient level did not differ,
yet there was an increased level of weedy elements rather than natural plants that had
established in the secondary grassland. It is possible that fertilizer was added when this area
was cultivated and it has managed to maintain similar nutrient levels to natural grassland. It
would appear that, like with some ex-arable grassland in Australia (Scott & Morgan 2012),
changes in soil properties are not the main driver of recovery after cropland abandonment.
The higher elevation grasslands of Makobulaan and Buffelskloof were both situated in
grasslands derived namely from shale and quartzite which are also nutrient poor (Mucina &
Rutherford 2006). Buffelskloof and Makobulaan showed contradicting results with
Buffelskloofs secondary grasslands being lower than natural grasslands in most soil
attributes tested while Makobulaan mostly matched secondary and natural soils with similar
nutrient elements. Soils of older secondary grasslands at Makobulaan had lower nutrient
values than their younger counterparts. This suggests a loss of nutrients after pine
plantations are cleared perhaps because secondary grasslands are unable to maintain their
initial nutrient levels due to the loss of a functioning nutrient cycle or, as these two areas
are mountainous, through the erosion of the remaining top soil. These hypotheses could be
explored in further studies. If excised and clear-felled pine plantations share similar nutrient
levels to the surrounding natural grassland one should aim management efforts to prevent
or limit the nutrients lost with increasing recovery age. Further restoration studies could
explore such management or restoration interventions.
Univers
ity of
Cap
e Tow
n
Chapter 2 - Mesic C4 grasslands of South Africa and their fragility
51
Potential physical and biological restoration constraints for South African grassland
Restoration success in the secondary grasslands of our study has been poor. There are two
main obstacles that determine and drive secondary succession, namely physical and
biological limitations (Pywell 2002, Soc. Eco Rest. 2004, Suding et al. 2004, Kardol et al.
2008). The focus of this study was on the latter. However, in most restoration studies, it is
often the physical environment that takes the spotlight (Mentis 1999, Young 2000, Mentis
2006). Human related disturbances can alter soil characteristics and these impede plant re-
establishment, whether it is through an increase in ‘toxic’ elements or the loss of important
nutrients (Bradshaw 2000, Shu et al. 2005, Mentis 2006, Le Stradic 2012). The addition of
specific nutrients can also be detrimental: for example, adding nitrogen to the soil can
promote the spread of weedy and alien species (Cole and Lunt 2005, Prober & Thiele 2005,
Norman et al. 2006, Kardol et al. 2008, Scott & Morgan 2012). These instances are more
relevant in the case of mined grasslands or similar severe disturbances that have resulted in
the loss, mixing or contamination of top soil (Mentis 1999, Mentis 2006) or cropland that
has been fertilised, or depleted of nutrients (Scott & Morgan 2008, van Oudtshoorn et al.
2011). Our soil evidence in excised plantations and abandoned ploughed land suggests that
it cannot be the only factor playing a role; at least it is not the biggest limiting factor. Plant
communities have managed to establish in both coastal and higher elevation secondary
grasslands but are not even close to representing their reference natural grasslands, even
after 40 years.
Biological constraints seem to be the prime limitation on the successful recolonisation of
secondary grasslands by natural grassland elements. Firstly, grasses are competitive life
forms (Scholes & Archer 1997, Bond 2008, Dickson & Busby 2008), and have been shown to
affect forb seedling establishment (Chapter 3). Mono-specific stands of invasive grass
species within secondary grasslands are hostile environments for seedling recruitment.
Secondly, grassland forbs have the ability persist in the grassy fire adapted land scape (Bond
& Parr 2010, Zaloumis & Bond 2011). Traits that promote persistence come at the cost of
those that promote recruitment (Bond & Midgley 2001). This trade-off makes grassland
forbs poor colonisers and probably accounts for the absences of any successional trend
Univers
ity of
Cap
e Tow
n
Chapter 2 - Mesic C4 grasslands of South Africa and their fragility
52
towards a natural grassland state. Seed and dispersal limitations as key limiting restoration
factors have been noted in many other instances of restoration, particularly in grassland
systems (Lunt 1994, Pywell 2002, Buisson & Dutoit 2004, Cole & Lunt 2005, Prober & Thiele
2005, Buisson et al. 2006, Dickson & Busby 2008, Kardol et al. 2008, Scott & Morgan 2012).
In Western Australia restored shrublands after bauxite mining lacked most native
resprouting species found in un-mined vegetation (Norman et al. 2006) and, as in this study,
Norman et al. (2006) found no evidence of succession towards increasing numbers of
resprouters even with applied active restoration methods.
This study has allowed us to understand the biological consequences of human disturbances
on our ancient grassland systems. We see a community shift from a diverse persistent forb
and grass assemblage to one with a few annual forbs and mono-specific dominant grasses.
The implications of this have largely been ignored in the South African context as more and
more pristine grasslands are planted up and/or ploughed.
Our priority is to promote grassland conservation. However, there are large areas of
afforested, mined and ploughed land that need restoration to the original grassland state
meriting the development of methods that will help promote restoration. Restoration
priorities should include the immediate management of secondary grassland soil to ensure
no further top soil and nutrients are lost, however, a second phase is needed that re-
introduces native plant propagules. The aim here is to re-introduce some native species to
help prevent invasive species from creating entire mono-specific stands (Pywell 2002) and
to re-establish several important grassland functions. Returning grazing value and grass
cover is much more attainable (Mentis 1999) than completely restoring diversity, below
ground biomass and ensuring top soil stability. However, a multiphase plan can at least
encourage a more natural succession. Without a focus on the biological limitations, any
restoration effort of secondary grasslands is unlikely to achieve true restoration and, as our
soil evidence suggests, could even lead to further degradation. Without a natural species
composition secondary grasslands respond differently to natural disturbances, such as fire
Univers
ity of
Cap
e Tow
n
Chapter 2 - Mesic C4 grasslands of South Africa and their fragility
53
and grazing, compared to natural grasslands. The incorrect application of frequent burning
of secondary grassland may expose more bare soil to erosion.
Our grasslands differ fundamentally from those of Europe and North America (Bond & Parr
2010) and this would need to be considered when approaching conventional methods of
grassland restoration. South African grasslands need frequent fire otherwise we see a loss of
shade-intolerant forbs and grasses and the community shifts to more shade loving species
(Fynn et al. 2004, Uys et al. 2004), forbs also have a fire stimulated response (Zaloumis &
Bond 2011). North American prairies, in contrast, lose forb diversity with a high fire
frequency. In the prairies, grazing reduces grassy biomass and promotes forb diversity
(Collins 1992, Leach & Givnish 1996, Collins et al. 1998, Olff & Ritchie 1998, Knapp et al.
2004). This being the case our secondary grasslands may function more like these northern
hemisphere systems.
In comparison, Australian temperate and South American grasslands show more similarities
to our grasslands. They are both fire driven systems with fire stimulated flowering (Lunt
1994, 1995, Lunt & Morgan 1999, Morgan 1999, Overbeck et al. 2007, Overbeck &
Pfadenhauer 2007). Australian grasslands, after fire suppression, have some grass species
that self-shade and few native species that survive longer than 10 years in the absence of
burning (Lunt 1995, Cole & Lunt 2005). Brazil’s tropical grassy biomes share several
characteristic families and genera with our grasslands, support a large diversity of
resprouting forb and geoxylic plant species and lose these species without frequent fire
events (Overbeck et al. 2007). Like South African grasslands, Brazil’s grasslands are ancient
systems and are rapidly being transformed for agriculture (Overbeck & Pfadenhauer 2007).
Univers
ity of
Cap
e Tow
n
Chapter 2 - Mesic C4 grasslands of South Africa and their fragility
54
Conclusion:
This study has shown that secondary grasslands are fundamentally different from natural
grasslands and when resprouting forbs are removed from the grassland system they are
very unlikely to return. This work has helped us to develop criteria to better identify natural
grasslands. We need to determine how to overcome the identified biological barriers that
are restricting grassland succession. We cannot continue to ignore grassland systems in a
conservation context because without any easy way of restoring grasslands we risk
completely losing more and more of this valuable system to human related activities.
Grasslands in South Africa are fragile systems, at least as fragile as primary forests and may
take decades to centuries to recover from a major disturbance.
Univers
ity of
Cap
e Tow
n
Chapter 2 - Mesic C4 grasslands of South Africa and their fragility
55
References:
Bews, J. W. 1925. Plant forms and their evolution in South Africa. Longmans: London. Pg. 81-
82.
Bond W. J. & Midgley J. M. 2001. The persistence niche: ecology of sprouting in woody
plants. Trends Ecology and Evolution. 16: 45-51.
Bond, W. J., Midgley, G. F., & Woodward, F. I. 2003. What controls South African vegetation-
climate or fire? South African Journal of Botany. 69: 79-91.
Bond, W.J. 2008. What limits trees in C4 grasslands and savannas? Annual review of ecology,
evolution and systematics. 39: 641-593.
Bond W.J. & Parr CL. 2010. Beyond the forest edge: Ecology, diversity and conservation of
the grassy biomes. Biological Conservation. 143: 2395-2404.
Bradshaw, A. 2000. The use of natural processes in reclamation - advantages and difficulties.
Landscape and Urban Planning. 51: 89-100.
Bray R.H. & Kurtz L.T. 1945. Determination of total, organic, and available forms of
phosphorus in soils. Soil Science. 59:39-45.
Buisson, E. & Dutoit, T. 2004. Colonisation by native species of abandoned farmland
adjacent to a remnant patch of Mediterranean steppe. Plant Ecology. 371-384.
Buisson, E., Dutoit, T., Torre, F., Römermann, C., & Poschlod, P. 2006. The implications of
seed rain and seed bank patterns for plant succession at the edges of abandoned fields in
Mediterranean landscapes. Agriculture, ecosystems & environment. 115: 6-14.
Carbutt, C., & Edwards, T. J. 2003. The flora of the Drakensberg alpine centre. Edinburgh
Journal of Botany. 60: 581-607.
Carbutt, C., & Edwards, T. J. 2006. The endemic and near-endemic angiosperms of the
Drakensberg Alpine Centre. South African Journal of Botany. 72: 105-132.
Cole I. & Lunt I.D. 2005. Restoring Kangaroo Grass (Themeda triandra) to grassland and
woodland understoreys: a review of establishment requirements and restoration
exercises in south-east Australia. Ecological Management and Restoration. 6: 28-33.
Collins S. L. 1992. Fire frequency and community heterogeneity in tall grass prairie
vegetation. Ecology. 73: 2001-2006.
Univers
ity of
Cap
e Tow
n
Chapter 2 - Mesic C4 grasslands of South Africa and their fragility
56
Collins S. L., Knapp A. K., Briggs J. M., Blair J. M. & Steinauer E. M. 1998. Modulation of
diversity by grazing and mowing in native tallgrass prairie. Science. 280: 745-747.
Conant, R. T., Paustian, K., & Elliott, E. T. 2001. Grassland management and conversion into
grassland: effects on soil carbon. Ecological Applications. 11: 343-355.
Cowling, R.M., Gibbs-Russel, G.E., Hoffmann, M.T., Hilton-Taylor, C., 1989. Patterns of plant
species diversity in southern Africa. In: Huntley, B.J. (Ed.), Biotic Diversity in Southern
Africa. Oxford University Press, Cape Town, Pg. 19-50.
Davies, T. J., Barraclough, T. G., Savolainen, V., & Chase, M. W. 2004. Environmental causes
for plant biodiversity gradients. Philosophical Transactions of the Royal Society of
London. Series B: Biological Sciences. 359: 1645-1656.
Dickson T. L. & Busby W. H. 2008. Forb species establishment increases with decreased grass
seeding density and with increased forb seeding density in a Northeast Kansas, U.S.
A., experimental prairie restoration. Restoration Ecology. 17: 597-605.
Fynn R.W. S., Morris C. D., Edwards T. J. & Skarpe C. 2004. Effect of burning and mowing on
grass and forb diversity in a long-term grassland experiment. Applied Vegetation
Science. 7: 1-10.
Gotelli, N., and Colwell, R. K. 2001. Quantifying biodiversity: Procedures and pitfalls in the
measurement and comparison of species richness. Ecology Letters. 4: 379-391
Harris, J. A., Hobbs, R. J., Higgs, E., & Aronson, J. 2006. Ecological restoration and global
climate change. Restoration Ecology. 14: 170-176.
Hilliard, O. M., & Burtt, B. L. 1987. The botany of the southern Natal Drakensberg. Annals of
Kirstenbosch Botanic Gardens, 15.
James B. M. 1998. Unpublished Data: vegetation succession and soil properties following
the removal of pine plantations on the eastern shores of Lake St. Lucia, South Africa.
Unpublished MSc thesis. In: Department of Range and Forage Resource p. 181.
University of Natal, Pietermaritzburg.
Kardol, P., Wal, A. V. D., Bezemer, T. M., Boer, W. D., Duyts, H., Holtkamp, R., & Putten, W.
H. 2008. Restoration of species-rich grasslands on ex-arable land: Seed addition
outweighs soil fertility reduction. Biological conservation: 2208-2217.
Univers
ity of
Cap
e Tow
n
Chapter 2 - Mesic C4 grasslands of South Africa and their fragility
57
Knapp A. K., Smith M. D., Collins S. L. 2004. Generality in ecology: testing North American
grassland rules in South African savannas. Frontiers in Ecology and the Environment
2: 483-91.
Kruger, L. E. 2012. Unpublished Data: Regeneration of Grassland after Removal of Pine
Plantations in North Eastern Mountain Grassands of the Drakensberg Escarpment,
Mpumalanga, South Africa. Unpublished thesis. In: Centre for Environmental Studies,
Resource p. 35. University of Pretoria, Pretoria.
Laden, G., & Wrangham, R. 2005. The rise of the hominids as an adaptive shift in fallback
foods: plant underground storage organs (USOs) and australopith origins. Journal of
Human Evolution. 49: 482-498.
Leach M. K. & Givnish T. J. 1996. Ecological determinants of species loss in remnant prairies.
Science. 273: 1555-1558.
Le Stradic, S. 2012. Unpublished Data: Composition, phenology and restoration of campo
rupestre mountain grasslands - Brazil. Unpublished PhD thesis. In: Laboratório de
Ecologia Evolutiva e Biodiversidade, Resource p. 87. Institut Méditerranéen de
Biodiversité et d’Écologie, Brazil.
Lunt D. L. 1994. Variation in flower production of nine grassland species with time since fire,
and implications for grassland management and restoration. Pacific Conservation
Biology. 1: 359-366.
Lunt D. L. 1995. Seed longevity of six native forbs in a closed Themeda triandra grassland.
Australian Journal of Botany. 43: 439-49.
Lunt D. L. & Morgan J.W. 1999. Effect of fire frequency on plant composition at the Laverton
North Grassland Reserve, Victoria. Victorian Naturalist. 116: 84-90.
Lubke R. A., Avis A. M. & Moll J. B. 1996. Post-mining rehabilitation of coastal sand dunes in
Zululand South Africa. Landscape Urban Planning. 34: 335-45.
Matsika R. 2007. Unpublished Data: Land-cover Change: Threats to the grassland Biome of
South Africa. Unpublished MSc thesis. p. 131. University of Witwatersrand,
Johannesburg.
Mentis, M. T. 1999. Diagnosis of the rehabilitation of opencast coal mines on the Highveld of
South Africa. South African journal of science. 95: 210-215.
Univers
ity of
Cap
e Tow
n
Chapter 2 - Mesic C4 grasslands of South Africa and their fragility
58
Mentis M. T. 2006. Restoring native grassland on land disturbed by coal mining on the
Eastern Highveld of South Africa. South African Journal of Science. 102: 193-8.
Morgan J. W. 1999. Defining grassland fire events and the response of perennial plants to
annual fire in temperate grasslands of south-eastern Australia. Plant Ecology. 144:
127-44.
Motomizu S., Wakimoto T., Toei K. 1983. Spectrophotometric determination of phosphate
in river waters with molybdate blue and malachite green. Analyst. 108: 361-367.
Mucina L. & Rutherford M. C. 2006. The Vegetation of South Africa, Lesotho and Swaziland.
Strelitzia 19, Pretoria.
Norman M. A., Koch J. M., Grant C. D., Morald T. K. & Ward S. C. 2006. Vegetation
succession after bauxite mining in Western Australia. Restoration Ecology. 14: 278-
88.
O’Connor T. G. O. 2005. Influence of land use on plant community composition and diversity
in Highland Sourveld grassland in the southern Drakensberg, South Africa. Journal of
Applied Ecology. 42: 975-88.
Olff H. & Ritchie M. E. 1998. Effects of herbivores on grassland plant diversity. Trends in
Ecology and Evolution. 13: 261-5.
Olivier, H. 2008. Unpublished Data: A floristic comparison of natural and disturbed grassland
after the removal of commercial pine plantations in Mpumalanga, South Africa.
Unpublished thesis. In: Centre for Environmental Management, Resource p. 87.
University of the Free State, Bloemfontein.
GNU 2012. Quantum GIS, Version 1.7.4. www.gnu.org.
van Oudtshoorn, F. V., Brown, L., & Kellner, K. 2011. The effect of reseeding methods on
secondary succession during cropland restoration in the Highveld region of South
Africa. African Journal of Range & Forage Science. 28: 1-8.
Overbeck, G. E. Müller, S. C. Fidelis, A., Pfadenhauer, J. Pillar, V. D., Blanco, C. C. & Forneck,
E. D. 2007. Brazil's neglected biome: The South Brazilian Campos: Perspectives in
Plant Ecology, Evolution and Systematics. 9: 101-116.
Overbeck, G. E. & Pfadenhauer, J. 2007. Adaptive strategies in burned subtropical grassland
in Southern Brazil. Flora 202: 27-49.
Univers
ity of
Cap
e Tow
n
Chapter 2 - Mesic C4 grasslands of South Africa and their fragility
59
Parr, C. L., Gray, E. F., & Bond, W. J. 2012. Cascading biodiversity and functional
consequences of a global change–induced biome switch. Diversity and Distributions.
18: 493-503.
Pooley, E. 1998. A Field Guide to Wild Flowers KwaZulu-Natal & the Eastern Region. Natal
Flora. Publications Trust, Durban, South Africa.
Pooley, E. 2003. Mountain flowers: A field guide to the flora of the Drakensberg and
Lesotho. Publications Trust, Durban, South Africa.
Post, W. M., & Kwon, K. C. 2000. Soil carbon sequestration and land‐use change: processes
and potential. Global Change Biology. 6: 317-327.
Prober, S. M. & Thiele, K. R. 2005. Restoring Australia’s temperate grasslands and grassy
woodlands: integrating function and diversity. Ecological Management Restoration.
6: 16-27.
Pywell, R. F., Bullock J. M. & Hopkins, A. 2002. Restoration of species-rich grassland on
arable land: assessing the limiting processes using a multi-site experiment. Journal
Applied Ecology. 39: 294-309.
Rebelo, A.G. 1997. Conservation. The Vegetation of Southern Africa (ed. by R.M. Cowling,
D.M. Richardson & S.M. Pierce), Cambridge University Press, Cambridge. Pg. 571-
590.
Scholes, R. J. and Archer, S. R. 1997. Tree-Grass Interactions in Savannas. Annual Review of
Ecology and Systematics. 28: 517-544.
Society for Ecological Restoration International Science Policy Working Group (Soc. Eco.
Rest.) 2004. The SER International Primer on Ecological Restoration. www.ser.org &
Tucson: Society for Ecological Restoration International.
Tainton, N.M. 1981. The ecology of the main grazing lands of South Africa. In: Tainton, N.M.
(ed). Veld management in South Africa. University of Natal Press. Pietermaritzburg.
Uys, R.G., Bond, W.J., and Everson, T.M. 2004. The effect of different fire regimes on plant
diversity in southern African grasslands. Biological Conservation. 118: 489-499.
van Aarde, R. J., Ferreira, S. M., & Kritzinger, J. J. 1996a. Successional changes in
rehabilitating coastal dune communities in northern KwaZulu/Natal, South Africa.
Landscape and Urban Planning 34: 277-86.
Univers
ity of
Cap
e Tow
n
Chapter 2 - Mesic C4 grasslands of South Africa and their fragility
60
van Aarde, R. J., Ferreira, S. M.,Kritzinger, J. J., van Dyk, P. J., Vogt, M. & Wassenaar, T. D.
1996b. An evaluation of habitat rehabilitation on coastal dune forests in Northern
KwaZulu-Natal, South Africa. Restoration Ecology. 4: 334-45.
van Wyk AE. 1998. Grassland: the most threatened biome in South Africa. Available at
http://www.geasphere.co.za/articles/grasslands.htm#Grasslands_Most_Threatened
_Biome. htm [accessed 2013].
van Oudtshoorn, F. 1999. Guide to Grasses of Southern Africa. Briza Publications, Pretoria.
van Oudtshoorn, F. V., Brown, L., & Kellner, K. 2011. The effect of reseeding methods on
secondary succession during cropland restoration in the Highveld region of South
Africa. African Journal of Range & Forage Science. 28: 1-8.
White, F. 1976. The underground forests of Africa: a preliminary review. Gardens Bulletin,
Singapore. 29: 57-71.
Williams, V. L., Balkwill, K., & Witkowski, E. T. 2000. Unraveling the commercial market for
medicinal plants and plant parts on the Witwatersrand, South Africa. Economic
Botany. 54: 310-327.
Schwilk, D.W., Keeley, J. E. & Bond, W. J. 1997. The intermediate disturbance hypothesis
does not explain fire and diversity pattern in fynbos. Plant Ecology. 132: 77-84.
Scott, A. J., & Morgan, J. W. 2012. Resilience, persistence and relationship to standing
vegetation in soil seed banks of semi‐arid Australian old fields. Applied Vegetation
Science, 15: 48-61.
Shu, W. S., Ye, Z. H., Zhang, Z. Q., Lan, C. Y., & Wong, M. H. 2005. Natural colonization of
plants on five lead/zinc mine tailings in Southern China. Restoration Ecology, 13: 49-
60.
Soulé, M.E. & Kohm, K.A. 1989. Research Priorities for Conservation Biology. Island press,
Washington, US.
Suding, K. N., Gross, K. L., & Houseman, G. R. 2004. Alternative states and positive feedbacks
in restoration ecology. Trends in Ecology & Evolution, 19: 46-53.
Wassenaar, T. D., van Aarde, R. J., Pimm, S. L. & Ferreira S. M. 2005. Community
convergence in disturbed subtropical dune forests. Ecology 86: 655-666.

Univers
ity of
Cap
e Tow
n
Chapter 2 - Mesic C4 grasslands of South Africa and their fragility
61
Zaloumis, N.P. and Bond, W. J. 2011. Grassland restoration after afforestation: No direction
home? Austral Ecology. 36: 357–366.
Univers
ity of
Cap
e Tow
n
Chapter 3 - Transplanting mixed species sods as a method for re-introducing natural resprouting species into
secondary grasslands in South Africa.
62
Chapter 3: Transplanting mixed species sods as a method for re-introducing natural
resprouting species into secondary grasslands in South Africa.
Abstract:
The conservation of threatened ecosystems is not always possible. When this is the case
ecological restoration can be used as a conservation tool. South African grasslands are
currently severely threatened and fragmented systems, their value and diversity only just
beginning to be understood. We have much secondary grassland within South Africa that
has failed to restore through the process of natural succession. Practical restoration
methods are needed that take into account the biological limitations that grasslands face
which prevent natural succession after their diversity has been lost. We identified secondary
grassland vegetation plots to transplant grassland mixed species sods collected within
natural mesic grassland areas situated in both Mpumalanga and KwaZulu-Natal. Sods were
placed within two different grass treatments, cleared and un-cleared, to help identify
whether grass competition played a role in restricting sod species survival. Using species
percentage cover and richness we monitored the success of these recovery plots over a
period of 12 months. Although sods lost species percentage cover and richness over this
time period it was within an acceptable range. The biggest loss was of the forb and geoxylic
suffrutex plant growth forms. However, forbs on average only lost at most a third of their
richness. Grass competition did not appear to play a role within this short term study.
Although sod transplants may be an impractical method of restoration on a larger scale, we
were able to determine that it is possible to increase species diversity within secondary
grasslands by this method. We can build on this study to develop better ways of re-
introducing natural grassland species into secondary grassland.
Univers
ity of
Cap
e Tow
n
Chapter 3 - Transplanting mixed species sods as a method for re-introducing natural resprouting species into
secondary grasslands in South Africa.
63
Introduction:
Restoration ecology is a useful tool in conservation and can be used to help towards
preserving threatened ecosystems when formal conservation protection is not possible
(Hobbs & Norton 1996, Young 2000, Pywell et al. 2002, Prober & Thiele 2005, Dickson &
Busby 2008, Kardol et al. 2008). Conservation is also not the only reason why one may
consider a restoration project. Rehabilitating or restoring land to a point where it is partially
productive and regains some level of ecological function can be useful in commercial,
private and communal lands. One example is to return livestock grazing potential of
rangeland after it has been mined, controlling weed invasion, securing soil to prevent
erosion and restoring hydrological function (Mentis 1999, Driver et al. 2004, Suding et al.
2004, Cole & Lunt 2005). In the process these goals can also add conservation value to the
land and help contribute to other restoration targets.
The goal of restoration is to assist with the recovery of degraded or damaged ecosystems.
Restoration involves the re-establishment of native ecological processes, functions and the
productivity of the ecosystem facilitating the return of the original plant community
structure and diversity over time (Soc. Eco Rest. 2004). This necessitates the use of historical
and existing references within the landscapes and commonly includes sampling of
undisturbed natural vegetation within close proximity to the recovering area.
Grassland systems are under increasing pressure around the world, have suffered some
extreme levels of habitat loss and are being identified more and more as conservation
priorities (Lunt 1995, Myers et al. 2000, Reyers et al. 2001, Bonn & Gaston 2005, Hoekstra et
al. 2005, Buisson et al. 2006a, Overbeck et al. 2007, van Oudtshoorn et al. 2011). As a result
grassland restoration has become an important issue especially in the context of what
grasslands provide for humans. Intact grassland systems provide several notably important
ecosystem services; grazing production, water moderation and erosion control are some
examples (Reyers & Tosh 2003, Overbeck et al. 2007, Blignaut et al. 2008, Hardy 2008,
O'Connor & Kuyler 2009). South Africa’s grasslands provide considerable high quality grazing
land to our livestock industry, while being the source of water for the entire Gauteng
Univers
ity of
Cap
e Tow
n
Chapter 3 - Transplanting mixed species sods as a method for re-introducing natural resprouting species into
secondary grasslands in South Africa.
64
Province as well as a considerable portion of South Africa’s population. Intact grasslands
ensure that this water does not all rush directly into our river systems after a rainfall event
(Driver et al. 2004, Hardy 2008, Blignaut et al. 2010). This same reduction of surface flow
ensures that valuable top soil is not eroded away and lost to the river and ocean systems,
silting up dams on the way. Restoration that reduces siltation rates has large economic
benefits by extending the life of major water reservoirs thereby reducing the need for
constructing new major civil engineering works (Driver et al. 2004, Blignaut et al. 2010).
Even though grasslands are more and more considered highly valuable, there is still a lack of
literature available on restoration efforts, especially in South Africa. Grassland restoration
projects have been increasing particularly within Europe, North America and Australia
(Schramm 1978, Lunt 1994, Leach & Givnish 1996, Pärtel et al. 1998, Pywell et al. 2002, Cole
& Lunt 2005, Prober & Thiele 2005, Buisson et al. 2006b, Dickson & Busby 2008, Kardol et al.
2008, van Oudtshoorn et al. 2011, Piqueray et al. 2011). However, successful grassland
restoration is still very difficult with most projects showing varied or limited success. Some
return vegetation that only vaguely resembles the natural system, with more successful
projects also returning several useful or common species. This restored vegetation does not
often respond to natural drivers such as fire in the same way as the original vegetation
(Grant & Loneragan 2001, Smith et al. 2004, Norman et al. 2006). Full restoration is
generally still out of reach.
Most available grassland restoration literature is from the Northern Hemisphere where
grassland systems may differ fundamentally from our southern equivalents (Bond & Parr
2010, Zaloumis & Bond 2011). The application of restoration methods developed for
northern grasslands may therefore be ineffective unless these differences in the ecology of
grasslands are recognized and considered in each local context. There are a growing number
of reports on grassland restoration from the southern hemisphere, including work in
southern Africa, Australia, and South America (Lunt 1994, Lunt & Morgan 1999, Mentis
1999, Fynn et al. 2004, Uys et al. 2004, Cole & Lunt 2005, Mentis 2006, Overbeck et al. 2007,
van Oudtshoorn et al. 2011, Zaloumis & Bond 2011, Le Stradic 2012, Scott & Morgan 2012).
Univers
ity of
Cap
e Tow
n
Chapter 3 - Transplanting mixed species sods as a method for re-introducing natural resprouting species into
secondary grasslands in South Africa.
65
These can be used as guidelines to the most practical methods on how best to improve the
accomplishment of restoration goals.
There are two key limitations for grassland restoration (Ash et al. 1994, Bradshaw 1997,
Bakker & Berendse 1999, Cole & Lunt 2005, Prober & Theile 2005, Mentis 2006, Shu et al.
2005, Kiehl 2010). Physical factors can slow or prevent restoration. These include
fragmentation of the vegetation producing barriers between sites that prevent propagule
dispersal. Dispersal failures can be through the loss of dispersers or increased distances
between sites. Physical problems also include alteration in soil physical and chemical
properties which can influence plant growth and competition. Soil disturbances can
promote weedy species through the presence of added fertilizers, or reduce the pool of
plants that can easily establish because of residual toxic elements or the hardening or
erosion of top soil.
There are also biological reasons that may make it difficult for plants to re-colonise
recovering areas (Bakker et al. 1996, Hoffman 1998, Norman et al. 2006, Overbeck &
Pfadenhauer 2007, Bond & Parr 2010, Zaloumis & Bond 2011, Chapter 2). South African and
South American grasslands are populated by resprouting species that are adapted to fire
and grazing. These plants may have traded off sexual reproduction for the ability to persist
in frequently burnt grasslands (Bond & Parr 2010, Zaloumis & Bond 2011). Successful
seedling establishment may be very rare while vegetative reproduction by the slow process
clonal spread is relatively common.
Re-seeding disturbed habitats is a common method used for reintroducing native species in
grasslands (Pywell et al. 2002, Buisson et al. 2006b, Dickson & Busby 2007, Prober & Theile
2005, Kardol et al. 2008). Even if seed is available it can often be too expensive. A key
limiting factor for restoration projects in Australian and South African grasslands has been
access to sufficient seeds and propagules for the majority of the species (Cole & Lunt 2005,
Lunt, Zaloumis & Bond 2011). In South Africa this could be particularly limiting since the
grasslands are rich in species and a large proportion of the original species composition has
Univers
ity of
Cap
e Tow
n
Chapter 3 - Transplanting mixed species sods as a method for re-introducing natural resprouting species into
secondary grasslands in South Africa.
66
been lost (Chapter 2). One study in Australian temperate grassland concluded that, even for
relatively small areas, enormous numbers of plant seeds would be needed to successfully
re-establish just a few species in their natural densities (Lunt 1994). This may be impractical
or even impossible as sufficient seed or seedlings of plants required for restoring the South
African grasslands are probably not available or easy to attain. Even if seed banks are
available for forb species in temperate grasslands they are poor in species and seed
abundance and tend to be short-lived (Lunt 1995). Physical and biological limitations must
therefore be identified before we can determine the best approach for a restoration
project.
Restoring cover and basic common pasture species will reduce erosion, help prevent weed
invasions and allow for restoration of fire regimes (Cole & Lunt 2005, Prober & Theile 2005).
However many of these recovered grasslands tend to be mono-specific stands, not high
value grazing land and tend to discourage any further colonising of native species (Mentis
1999, Chapter 2, Chapter 4). Most grass species that were easy to use in previous
restoration projects or easily invaded secondary grasslands on their own are usually highly
competitive (Fynn et al. 2009). A study in the USA showed that forb seedling establishment
can be negatively affected by high densities of dominant grass species (Dickson & Busby
2007). However, if done correctly, grass restoration is also the initial step in the restoration
process preparing a suitable environment to promote grassland restoration efforts.
Collecting sods or turfs from a reference habitat is one way of re-introducing plant species
into secondary environments (Pärtel et al. 1998, Cole & Lunt 2005). Ideally this recreates a
source of seeds and living plant species within a microenvironment derived from the
primary source. In the South African context seed banks are not present and species are
suspected of reproducing vegetatively (Uys 2006). Establishing adult plants of forbs and
grasses through sod transfer could allow species to gain a foothold in the secondary
environment. It is also possible that combining a method like sod transfer with large scale
seeding, spreading of hay and/or plug restoration projects could improve biodiversity in the
restored system.
Univers
ity of
Cap
e Tow
n
Chapter 3 - Transplanting mixed species sods as a method for re-introducing natural resprouting species into
secondary grasslands in South Africa.
67
To determine whether a sod transfer method has been a success requires both short term
and long term considerations. One way is to compare species cover and richness over time.
However for a short term study species cover may be less useful as a plant species may lose
most of its cover during and after the transplant process but remain alive and dormant
within the sod. If this is the case we would expect a drop in percentage ground cover for a
follow up survey at the end of the growing season and some gain in ground cover again
once the sod is established during the next growing season. Fire may also complicate
assessments when measuring cover. This could be due to the vegetation cover reduction of
sods sourced from burnt grassland, or, when restored plots that have been burnt are re-
surveyed. In diverse grasslands, species composition may be too heterogeneous for
evaluating restoration success. Another option is to consider the different plant growth
forms found in the grasslands. By measuring these growth forms separately we can
determine if any functional groups suffer a higher proportion of species loss than any other.
The focus of this chapter is to assess the success of sod transplants as a tool for restoration.
Since grass is known to be highly competitive and limiting to the establishment of non-grass
seedlings, it is important to understand how mono-specific stands in recovering grasslands
affect restoration efforts. We planted mix species sods in areas that we had cleared of
plants and in areas where no previous clearing had been done. We measured species
percentage cover and species richness over 12 months after transplanting to evaluate
success. We were then able to identify potentially useful criteria for evaluating plant
establishment success in future grassland restoration efforts. We had no experimental
control over the burning of natural and secondary grasslands used in the study. Sods were
collected from available natural grassland, both burnt and un-burnt. Some secondary
grassland that contained restoration plots where burnt during the winter between the initial
and final evaluations of transplanted sods. However this allowed us to investigate whether
selecting sods from burnt or un-burnt natural grassland had an effect on the plant
establishment. We could also measure if burnt and un-burnt restoration plots showed
different comparative results in success. The role of fire on sod transplanting and

Univers
ity of
Cap
e Tow
n
Chapter 3 - Transplanting mixed species sods as a method for re-introducing natural resprouting species into
secondary grasslands in South Africa.
68
establishment would seem to be important in this fire adapted landscape. It could affect the
initial establishment success by either promoting or hindering the way natural grassland
species cope with transplanting. Harvesting recently burnt sods may add extra stress to the
plant species when being transplanted because these plants are already responding to a fire
disturbance.
The study also aimed to establish a small scale long term monitoring project to determine,
once established, how transplanted sods cope in the secondary environment and if they
manage to successfully expand beyond the original transplanted sod. True restoration
success would be for species found in the sods to increase and eventually to successfully
reproduce in restored grassland.
We asked the following questions:
1. Do grassland plant species survive sod transplanting and if they do, how well?
2. Which plant growth forms struggle to establish?
3. Can we establish criteria to determine successful transplanting of mix species sods?
4. How does grass competition affect transplanting success?
5. Can fire influence sod and plot transplant success?
Restoration requires time so that projects that have strong baselines as well as the potential
to be monitored indefinitely are key to helping derive and refine restorative techniques in
the future. Though I report results after only the first year of restoration, the project was
designed to allow continued future monitoring to determine longer term success in
increasing diversity in restored grasslands.
Univers
ity of
Cap
e Tow
n
Chapter 3 - Transplanting mixed species sods as a method for re-introducing natural resprouting species into
secondary grasslands in South Africa.
69
Methods:
Study area selection
Three study areas were used in this study. Found in mesic grassland systems, Buffelskloof
Nature Reserve (BKNR) in Mpumalanga, Blue Crane Farm (BCF) and Eastern Shores,
iSimagaliso (ESI) in KwaZulu-Natal. Each had multiple examples of secondary and primary
grassland within close proximity. BKNR and ESI were both areas with land recovering from
afforestation while BCF had land recovering from ploughing. These study areas had also
undergone survey comparisons between recovering and natural grassland states (Chapter 2,
Zaloumis & Bond, 2011). The land owners and managers of these areas were interested in
trying restoration methods for their secondary grasslands and to support the long term
monitoring of the project after the initial restoration stage was completed.
BKNR occurs within the Lydenburg Montane Grassland system (GM18 – Mucina &
Rutherford 2006). This area’s mean annual precipitation (MAP) is 858mm with a rainfall
range between 660mm and 1180mm during the year. Frequent mists occur during most
months of the year and the region experiences frost. The mean annual temperature (MAT)
is 14.1˚C. The grasslands occur on high altitude plateaus with undulating plains, peaks,
slopes, hills and deep valleys, all set within the Northern Escarpment region. The soil of this
grassland type is mostly derived from shale and quartzite. -25° 18' 15.156" South, 30° 31'
11.928" East.
BCF occurred near Nottingham Road, within a mid-altitudinal grassland system called the
Drakensberg Foothill Moist Grassland type (Gs 10 – Mucina & Rutherford 2006). Within this
grassland type the MAP is 890mm with a MAT of 14.6 ˚C. The region experiences frost.
These grasslands occur on a moderately rolling and mountainous landscape which is often
carved out by river gorges. The soil geology is dominated by mudstones and sandstones. The
soils of the sedimentary parent material are well drained with a depth of 800mm and a clay
content between 15- 55%. -29° 19' 10.8114" South, 30° 4' 13.62" East.
Univers
ity of
Cap
e Tow
n
Chapter 3 - Transplanting mixed species sods as a method for re-introducing natural resprouting species into
secondary grasslands in South Africa.
70
ESI occurs within the Indian Ocean Coastal Belt including both Maputaland Coastal Belt (CB
1) and Maputaland Wooded Grassland (CB 2) vegetation (Mucina & Rutherford 2006). ESI
makes up part of the iSimangaliso Wetland Park. Here the MAP can be up to 1200mm, with
about 1000mm on Lake St. Lucia. Most days have high humidity and high temperatures with
no frost. MAT is 21.1 ˚C. The mosaic of coastal dune forest and grassland occurs on flat
coastal plains bordering wetlands and undulating old vegetated dunes. The soils are derived
from young material that is mostly less than 18000 years old consisting of quaternary
sediments of marine origin. The soil consists of mainly yellowish sands, which are highly
leached and nutrient poor-28° 11' 25.8354" South, 32° 28' 45.084" East.
Plot selection and preparation
Plots were selected in sites that were sampled during the survey work (Chapter 2). They
were randomly selected within a recovering area by the using a spun stick method. We
prepared 7 plots at both the BKNR and BCF and 12 plots at ESI. At BKNR plots ranged from
1600m and 1750m above sea level. At BCF plots ranged between 1475m and 1520m above
sea level. At ESI plots ranged between 30m and 90m above sea level.
Plots were prepared and planted during the growing season of 2011/12 from November
until January. We started with BKNR in November, moved to BCF in December and then ESI
in January. Staves and rope were used to set up a five x five meter squared plot. Twenty-five
1m2 quadrats were then marked out (Figure 3.1). Using a random number generator, 14 of
these quadrats were then selected and prepared to receive sods directly from natural
grassland areas. Seven of these quadrats were left alone to be used as grass competition
controls labelled as un-cleared (U) treatments. The remaining seven were prepared as
cleared (C) treatments. These quadrats were marked out and we removed all the plant
biomass both above and below-ground from the entire meter squared. After this was
completed we dug 30x 30cm holes within the centre of all treatment quadrats to receive the
prepared sods.
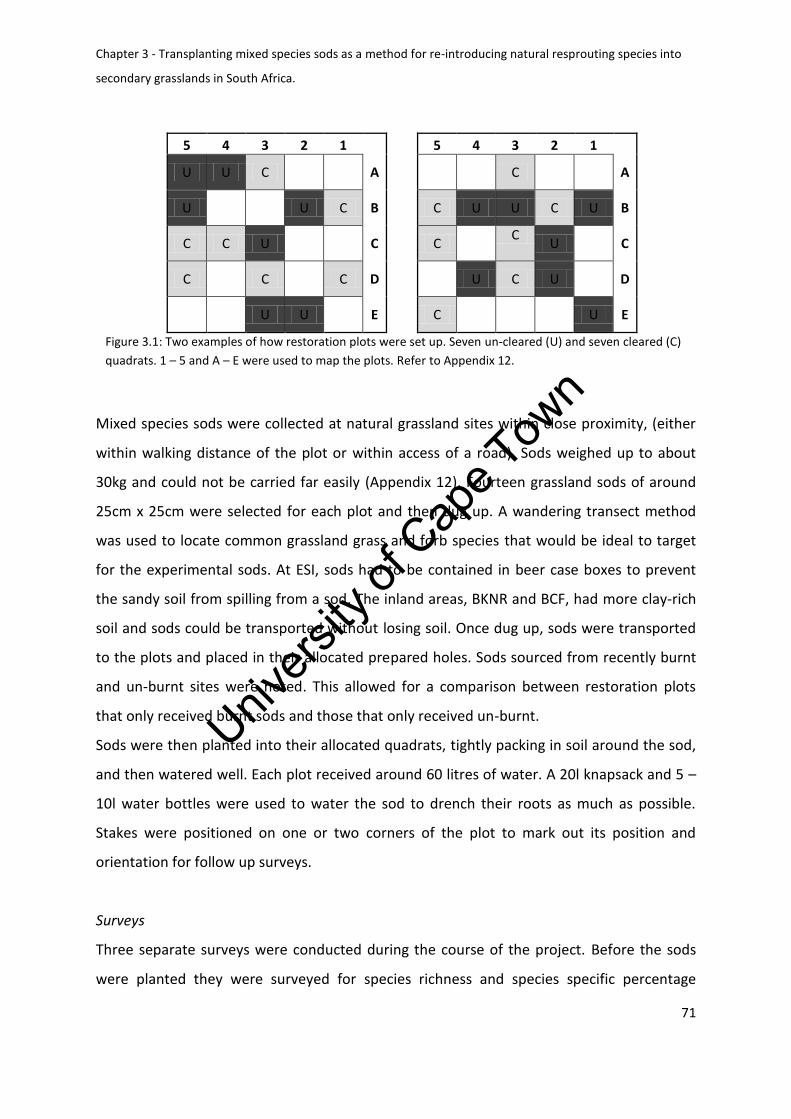
Univers
ity of
Cap
e Tow
n
Chapter 3 - Transplanting mixed species sods as a method for re-introducing natural resprouting species into
secondary grasslands in South Africa.
71
Mixed species sods were collected at natural grassland sites within close proximity, (either
within walking distance of the plot or within access of a road). Sods weighed up to about
30kg and could not be carried far easily (Appendix 12). Fourteen grassland sods of around
25cm x 25cm were selected for each plot and then dug up. A wandering transect method
was used to locate common grassland grass and forb species that would be ideal to target
for the experimental sods. At ESI, sods had to be contained in beer case boxes to prevent
the sandy soil from spilling from a sod. The inland areas, BKNR and BCF, had more clay-rich
soil and sods could be transported without losing soil. Once dug up, sods were transported
to the plots and placed in their allocated prepared holes. Sods sourced from recently burnt
and un-burnt sites were noted. This allowed for a comparison between restoration plots
that only received burnt sods and those that only received un-burnt.
Sods were then planted into their allocated quadrats, tightly packing in soil around the sod,
and then watered well. Each plot received around 60 litres of water. A 20l knapsack and 5 –
10l water bottles were used to water the sod to drench their roots as much as possible.
Stakes were positioned on one or two corners of the plot to mark out its position and
orientation for follow up surveys.
Surveys
Three separate surveys were conducted during the course of the project. Before the sods
were planted they were surveyed for species richness and species specific percentage
5 4 3 2 1
5 4 3 2 1
U U C
A
C
A
U
U C B
C U U C U B
C C U
C
C
C U
C
C
C
C D
U C U
D
U U
E
C
U E
Figure 3.1: Two examples of how restoration plots were set up. Seven un-cleared (U) and seven cleared (C)
quadrats. 1 – 5 and A – E were used to map the plots. Refer to Appendix 12.
Univers
ity of
Cap
e Tow
n
Chapter 3 - Transplanting mixed species sods as a method for re-introducing natural resprouting species into
secondary grasslands in South Africa.
72
ground cover (survey T1). In March, near the end of the growing season, we returned to re-
survey each plot in all three study areas (survey T2). This survey was used primarily to
observe how the sods coped with the transplant shock. In November 2012 in the middle of
the next growing season we returned for the final survey at the BCF and ESI study areas
(survey T3). During the follow up surveys, T2 and T3, all species, within the original sod
extent were included in the survey. It was noted if restoration plots had been burnt during
2012 since receiving sods. Unfortunately time constraints prevented us from surveying
BKNR for a third time. For this reason BKNR has been excluded from most of the analyses
for this study. Analyses of the change in the number of species from the T1 to T2 survey
were used to assess how successfully plants had established in their new environment after
having faced one winter season. Comparison of T3 to the T2 survey in March could also help
determine the best time for transplanting sods.
Data analysis
General Linear Models (GLM) where used to compare species richness and percentage
cover for time and grass competition treatments. Study areas were analysed for these
separately. Net loss of species richness and percentage cover was compared between study
area and grass competition treatments.
Sod species richness and percentage cover
Species richness and percentage ground cover was summed up for each quadrat and the
average of all the quadrats was compared between the three surveys over the 12 month
period of the study. Sod survival was accessed by using the T1 data as a baseline and
comparing it to the later survey data.
Plant growth forms
To understand how different grassland plant growth forms respond to transplanting we
calculated the average species richness and percentage cover for all surveys of the
following growth forms: graminoids – grasses and sedges, forbs and geoxylic suffrutices (see
White 1979). The change in values between surveys was then assessed. These changes in
Univers
ity of
Cap
e Tow
n
Chapter 3 - Transplanting mixed species sods as a method for re-introducing natural resprouting species into
secondary grasslands in South Africa.
73
time were also used to assess if certain growth forms needed longer recovery time to
stabilise within a new environment.
Study areas
Average net change in plot (T2-T1) data were assessed between all the study areas to look
for different initial responses towards transplanting. Average T3-T1 was compared between
BCF and ESI as they were the only two study areas with a final survey. This was an attempt
to establish if there is a general pattern between the study areas.
Burnt and un-burnt plots
Restored plots that received burnt sods were compared to plots that received un-burnt
sods. The comparison was only done at T1 and T3 to establish an effect of fire on
percentage cover and richness numbers at T1 and species survival by T3. Plots that had been
burnt in the period between T2 and T3 were also compared to un-burnt plots to determine
if fire had an effect on percentage cover and richness for the final survey.
Statistical Analysis
GLM statistical analysis was performed using the STATISTICA 11 software package (StatSoft;
Tulsa, OK, USA).
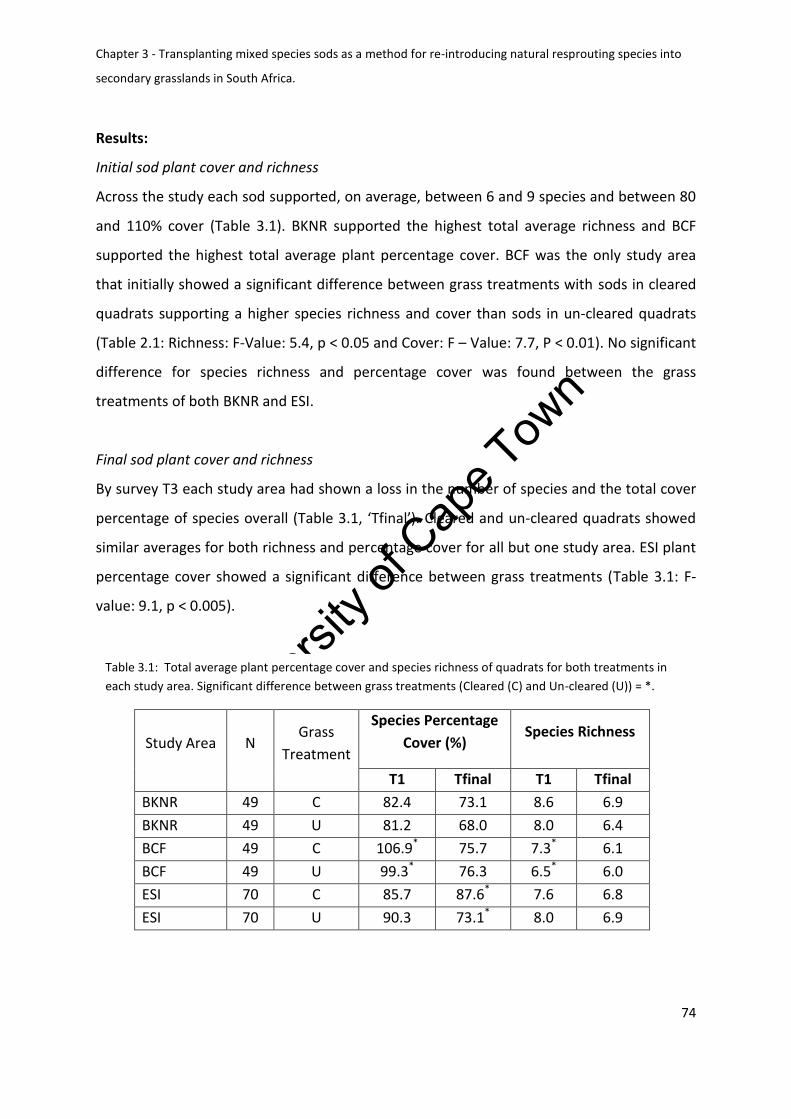
Univers
ity of
Cap
e Tow
n
Chapter 3 - Transplanting mixed species sods as a method for re-introducing natural resprouting species into
secondary grasslands in South Africa.
74
Results:
Initial sod plant cover and richness
Across the study each sod supported, on average, between 6 and 9 species and between 80
and 110% cover (Table 3.1). BKNR supported the highest total average richness and BCF
supported the highest total average plant percentage cover. BCF was the only study area
that initially showed a significant difference between grass treatments with sods in cleared
quadrats supporting a higher species richness and cover than sods in un-cleared quadrats
(Table 2.1: Richness: F-Value: 5.4, p < 0.05 and Cover: F – Value: 7.7, P < 0.01). No significant
difference for species richness and percentage cover was found between the grass
treatments of both BKNR and ESI.
Final sod plant cover and richness
By survey T3 each study area had shown a loss in the number of species and the total cover
percentage of species overall (Table 3.1, ‘Tfinal’). Cleared and un-cleared quadrats showed
similar averages for both richness and percentage cover for all but one study area. ESI plant
percentage cover showed a significant difference between grass treatments (Table 3.1: F-
value: 9.1, p < 0.005).
Table 3.1: Total average plant percentage cover and species richness of quadrats for both treatments in
each study area. Significant difference between grass treatments (Cleared (C) and Un-cleared (U)) = *.
Study Area N Grass
Treatment
Species Percentage
Cover (%) Species Richness
T1 Tfinal T1 Tfinal
BKNR 49 C 82.4 73.1 8.6 6.9
BKNR 49 U 81.2 68.0 8.0 6.4
BCF 49 C 106.9* 75.7 7.3* 6.1
BCF 49 U 99.3* 76.3 6.5* 6.0
ESI 70 C 85.7 87.6* 7.6 6.8
ESI 70 U 90.3 73.1* 8.0 6.9
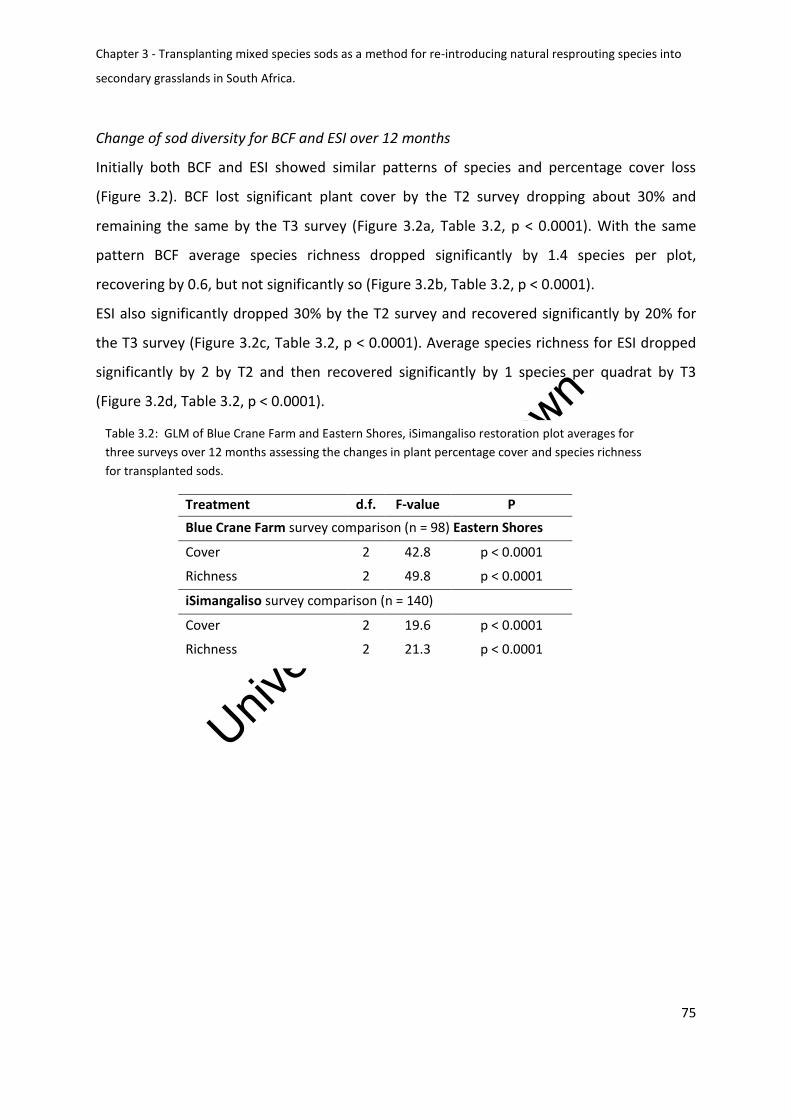
Univers
ity of
Cap
e Tow
n
Chapter 3 - Transplanting mixed species sods as a method for re-introducing natural resprouting species into
secondary grasslands in South Africa.
75
Change of sod diversity for BCF and ESI over 12 months
Initially both BCF and ESI showed similar patterns of species and percentage cover loss
(Figure 3.2). BCF lost significant plant cover by the T2 survey dropping about 30% and
remaining the same by the T3 survey (Figure 3.2a, Table 3.2, p < 0.0001). With the same
pattern BCF average species richness dropped significantly by 1.4 species per plot,
recovering by 0.6, but not significantly so (Figure 3.2b, Table 3.2, p < 0.0001).
ESI also significantly dropped 30% by the T2 survey and recovered significantly by 20% for
the T3 survey (Figure 3.2c, Table 3.2, p < 0.0001). Average species richness for ESI dropped
significantly by 2 by T2 and then recovered significantly by 1 species per quadrat by T3
(Figure 3.2d, Table 3.2, p < 0.0001).
Table 3.2: GLM of Blue Crane Farm and Eastern Shores, iSimangaliso restoration plot averages for
three surveys over 12 months assessing the changes in plant percentage cover and species richness
for transplanted sods.
Treatment d.f. F-value P
Blue Crane Farm survey comparison (n = 98) Eastern Shores
Cover 2 42.8 p < 0.0001
Richness 2 49.8 p < 0.0001
iSimangaliso survey comparison (n = 140)
Cover 2 19.6 p < 0.0001
Richness 2 21.3 p < 0.0001
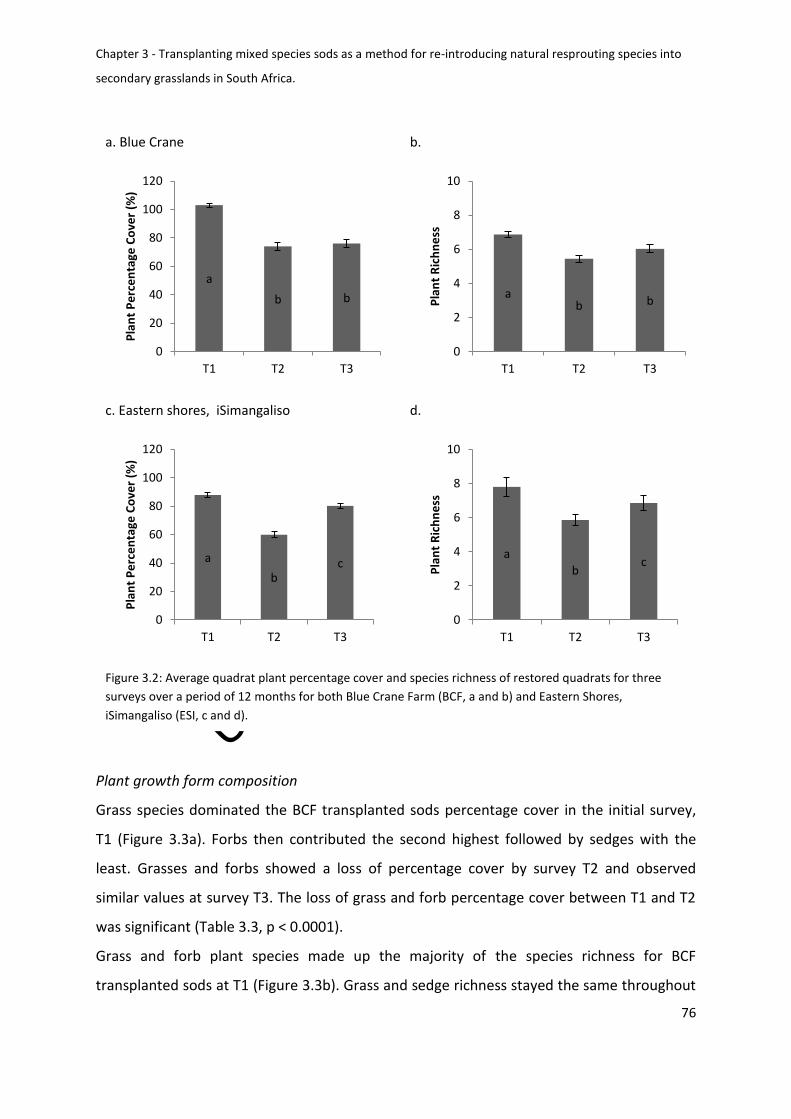
Univers
ity of
Cap
e Tow
n
Chapter 3 - Transplanting mixed species sods as a method for re-introducing natural resprouting species into
secondary grasslands in South Africa.
76
Plant growth form composition
Grass species dominated the BCF transplanted sods percentage cover in the initial survey,
T1 (Figure 3.3a). Forbs then contributed the second highest followed by sedges with the
least. Grasses and forbs showed a loss of percentage cover by survey T2 and observed
similar values at survey T3. The loss of grass and forb percentage cover between T1 and T2
was significant (Table 3.3, p < 0.0001).
Grass and forb plant species made up the majority of the species richness for BCF
transplanted sods at T1 (Figure 3.3b). Grass and sedge richness stayed the same throughout
a. Blue Crane
a
b b
0
20
40
60
80
100
120
T1 T2 T3
Pla
nt
Pe
rce
nta
ge C
ove
r (%
)
b.
ab b
0
2
4
6
8
10
T1 T2 T3
Pla
nt
Ric
hn
ess
c. Eastern shores, iSimangaliso
a
bc
0
20
40
60
80
100
120
T1 T2 T3
Pla
nt
Pe
rce
nta
ge C
ove
r (%
)
d.
a
bc
0
2
4
6
8
10
T1 T2 T3
Pla
nt
Ric
hn
ess
Figure 3.2: Average quadrat plant percentage cover and species richness of restored quadrats for three
surveys over a period of 12 months for both Blue Crane Farm (BCF, a and b) and Eastern Shores,
iSimangaliso (ESI, c and d).
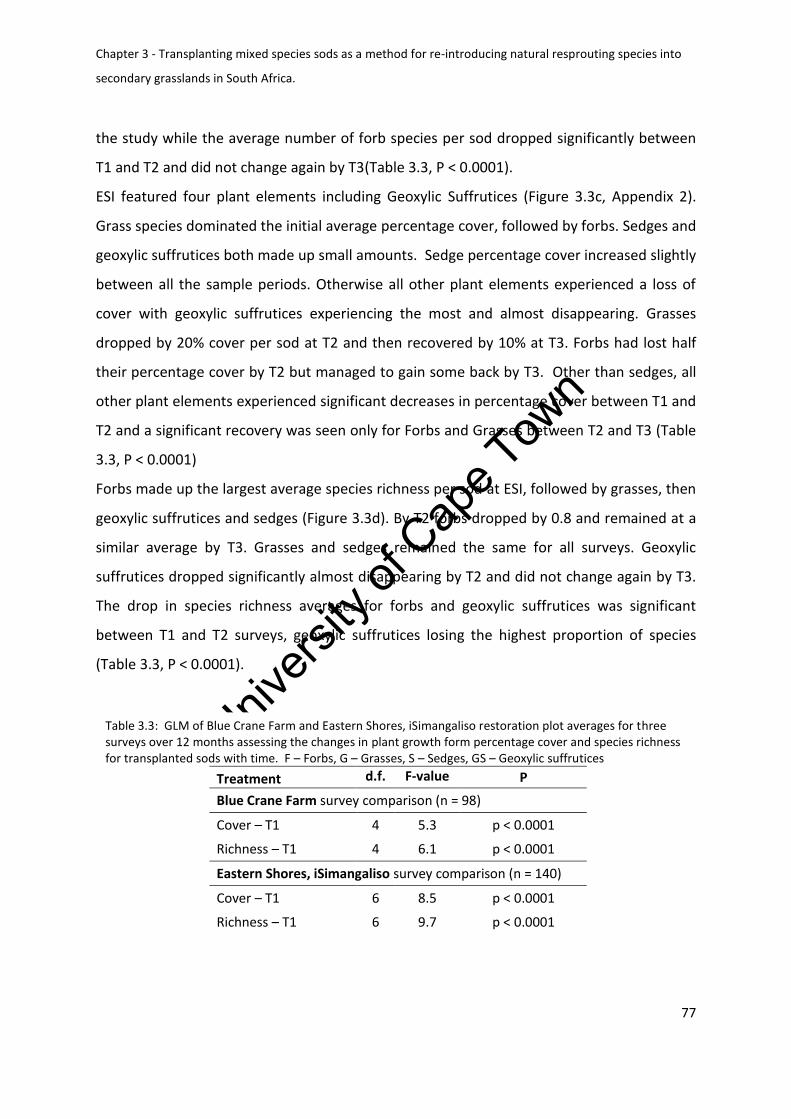
Univers
ity of
Cap
e Tow
n
Chapter 3 - Transplanting mixed species sods as a method for re-introducing natural resprouting species into
secondary grasslands in South Africa.
77
the study while the average number of forb species per sod dropped significantly between
T1 and T2 and did not change again by T3(Table 3.3, P < 0.0001).
ESI featured four plant elements including Geoxylic Suffrutices (Figure 3.3c, Appendix 2).
Grass species dominated the initial average percentage cover, followed by forbs. Sedges and
geoxylic suffrutices both made up small amounts. Sedge percentage cover increased slightly
between all the sample periods. Otherwise all other plant elements experienced a loss of
cover with geoxylic suffrutices experiencing the most and almost disappearing. Grasses
dropped by 20% cover per sod at T2 and then recovered by 10% at T3. Forbs had lost half
their percentage cover by T2 but managed to gain some back by T3. Other than sedges, all
other plant elements experienced significant decreases in percentage cover between T1 and
T2 and a significant recovery was seen only for Forbs and Grasses between T2 and T3 (Table
3.3, P < 0.0001)
Forbs made up the largest average species richness per sod at ESI, followed by grasses, then
geoxylic suffrutices and sedges (Figure 3.3d). By T2 forbs dropped by 0.8 and remained at a
similar average by T3. Grasses and sedges remained the same for all surveys. Geoxylic
suffrutices dropped significantly almost disappearing by T2 and did not change again by T3.
The drop in species richness averages for forbs and geoxylic suffrutices was significant
between T1 and T2 surveys, geoxylic suffrutices losing the highest proportion of species
(Table 3.3, P < 0.0001).
Table 3.3: GLM of Blue Crane Farm and Eastern Shores, iSimangaliso restoration plot averages for three surveys over 12 months assessing the changes in plant growth form percentage cover and species richness for transplanted sods with time. F – Forbs, G – Grasses, S – Sedges, GS – Geoxylic suffrutices
Treatment d.f. F-value P
Blue Crane Farm survey comparison (n = 98)
Cover – T1 4 5.3 p < 0.0001
Richness – T1 4 6.1 p < 0.0001
Eastern Shores, iSimangaliso survey comparison (n = 140)
Cover – T1 6 8.5 p < 0.0001
Richness – T1 6 9.7 p < 0.0001
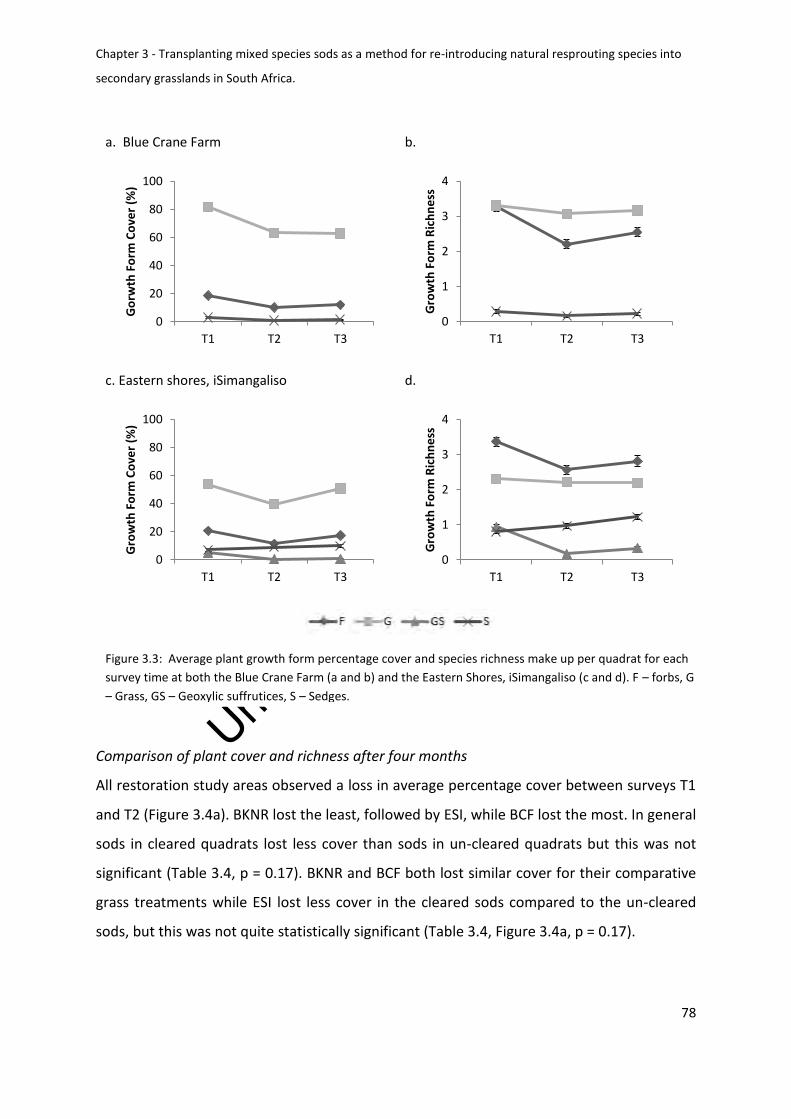
Univers
ity of
Cap
e Tow
n
Chapter 3 - Transplanting mixed species sods as a method for re-introducing natural resprouting species into
secondary grasslands in South Africa.
78
Comparison of plant cover and richness after four months
All restoration study areas observed a loss in average percentage cover between surveys T1
and T2 (Figure 3.4a). BKNR lost the least, followed by ESI, while BCF lost the most. In general
sods in cleared quadrats lost less cover than sods in un-cleared quadrats but this was not
significant (Table 3.4, p = 0.17). BKNR and BCF both lost similar cover for their comparative
grass treatments while ESI lost less cover in the cleared sods compared to the un-cleared
sods, but this was not quite statistically significant (Table 3.4, Figure 3.4a, p = 0.17).
a. Blue Crane Farm
0
20
40
60
80
100
T1 T2 T3
Go
rwth
Fo
rm C
ove
r (%
)
b.
0
1
2
3
4
T1 T2 T3
Gro
wth
Fo
rm R
ich
ne
ss
c. Eastern shores, iSimangaliso
0
20
40
60
80
100
T1 T2 T3
Gro
wth
Fo
rm C
ove
r (%
)
d.
0
1
2
3
4
T1 T2 T3
Gro
wth
Fo
rm R
ich
ne
ss
Figure 3.3: Average plant growth form percentage cover and species richness make up per quadrat for each
survey time at both the Blue Crane Farm (a and b) and the Eastern Shores, iSimangaliso (c and d). F – forbs, G
– Grass, GS – Geoxylic suffrutices, S – Sedges.
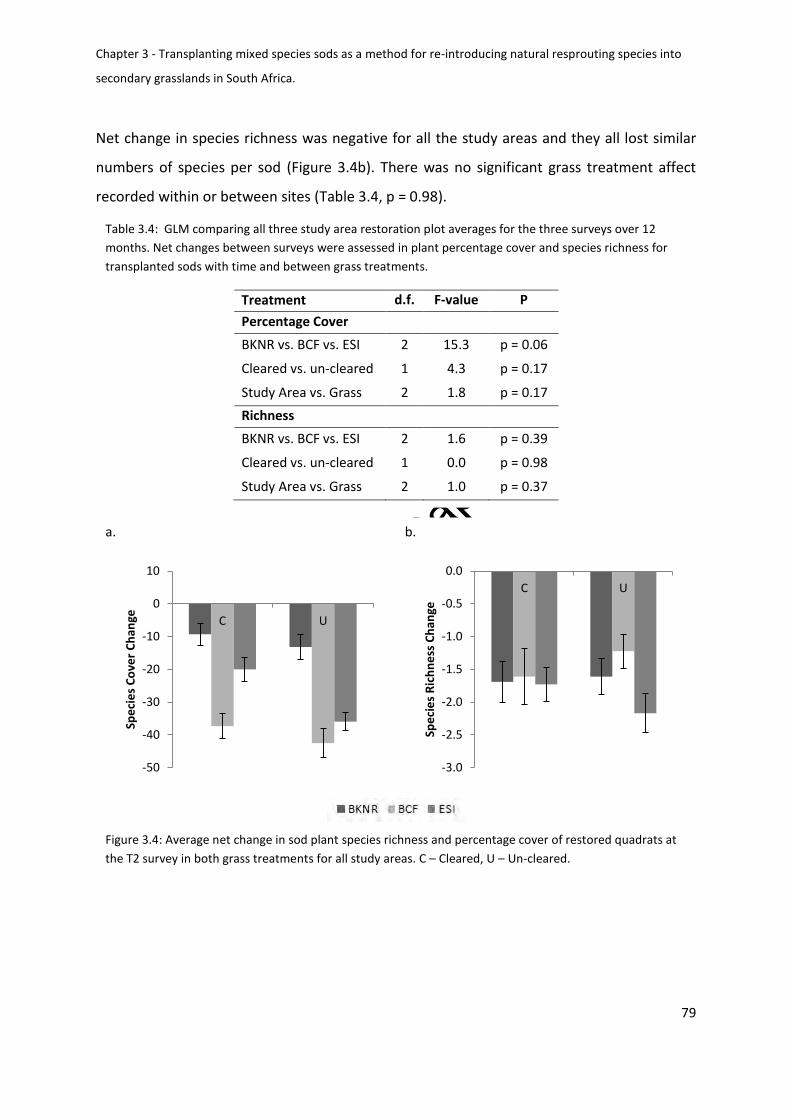
Univers
ity of
Cap
e Tow
n
Chapter 3 - Transplanting mixed species sods as a method for re-introducing natural resprouting species into
secondary grasslands in South Africa.
79
Net change in species richness was negative for all the study areas and they all lost similar
numbers of species per sod (Figure 3.4b). There was no significant grass treatment affect
recorded within or between sites (Table 3.4, p = 0.98).
Table 3.4: GLM comparing all three study area restoration plot averages for the three surveys over 12
months. Net changes between surveys were assessed in plant percentage cover and species richness for
transplanted sods with time and between grass treatments.
Treatment d.f. F-value P
Percentage Cover
BKNR vs. BCF vs. ESI 2 15.3 p = 0.06
Cleared vs. un-cleared 1 4.3 p = 0.17
Study Area vs. Grass 2 1.8 p = 0.17
Richness
BKNR vs. BCF vs. ESI 2 1.6 p = 0.39
Cleared vs. un-cleared 1 0.0 p = 0.98
Study Area vs. Grass 2 1.0 p = 0.37
a.
-50
-40
-30
-20
-10
0
10
C U
Spe
cie
s C
ove
r C
han
ge
b.
-3.0
-2.5
-2.0
-1.5
-1.0
-0.5
0.0
C U
Spe
cie
s R
ich
ne
ss C
han
ge
Figure 3.4: Average net change in sod plant species richness and percentage cover of restored quadrats at
the T2 survey in both grass treatments for all study areas. C – Cleared, U – Un-cleared.
Univers
ity of
Cap
e Tow
n
Chapter 3 - Transplanting mixed species sods as a method for re-introducing natural resprouting species into
secondary grasslands in South Africa.
80
Comparison of plant cover and richness after 12 months
No significant difference in net cover loss was found between BCF and ESI for T3-T1 (Table
3.5, Figure 3.5a, p = 0.40). There was no significant difference between grass treatments
overall (Table 3.5, p = 0.76). There was a significant interaction between study area and
grass treatment with ESI cleared plots losing no cover while all the other treatments lost
similar amounts of cover (Table 3.5, p < 0.002). For species richness no significant effect was
found between study areas or grass treatment and for the interaction between the areas
and grass treatments (Table 3.5, Figure 3.5b).
Table 3.5: GLM comparing Blue Crane Farm and Eastern Shores, iSimangaliso restoration plot averages for
the three surveys over 12 months. Net changes between surveys were assessed in plant percentage cover
and species richness for transplanted sods with time and between grass treatments.
Treatment d.f. F-value P
Percentage Cover
BCF vs. ESI 1 2.0 p = 0.40
Cleared vs. un-cleared 1 0.2 p = 0.76
Study Area vs. Grass 1 10.0 p < 0.002
Richness
BCF vs. ESI 1 0.1 p = 0.87
Cleared vs. un-cleared 1 0.3 p = 0.68
Study Area vs. Grass 1 2.0 p = 0.16
a.
aa
b
a
-50
-40
-30
-20
-10
0
10
C U
Spe
cie
s C
ove
r C
han
ge
b.
-3
-2.5
-2
-1.5
-1
-0.5
0
C U
Spe
cie
s R
ich
ne
ss C
han
ge
Figure 3.5: Average net change in sod plant species richness and percentage cover of restored quadrats at
the T3 survey in both grass treatments for BCF and ESI. C – Cleared, U – Un-cleared.
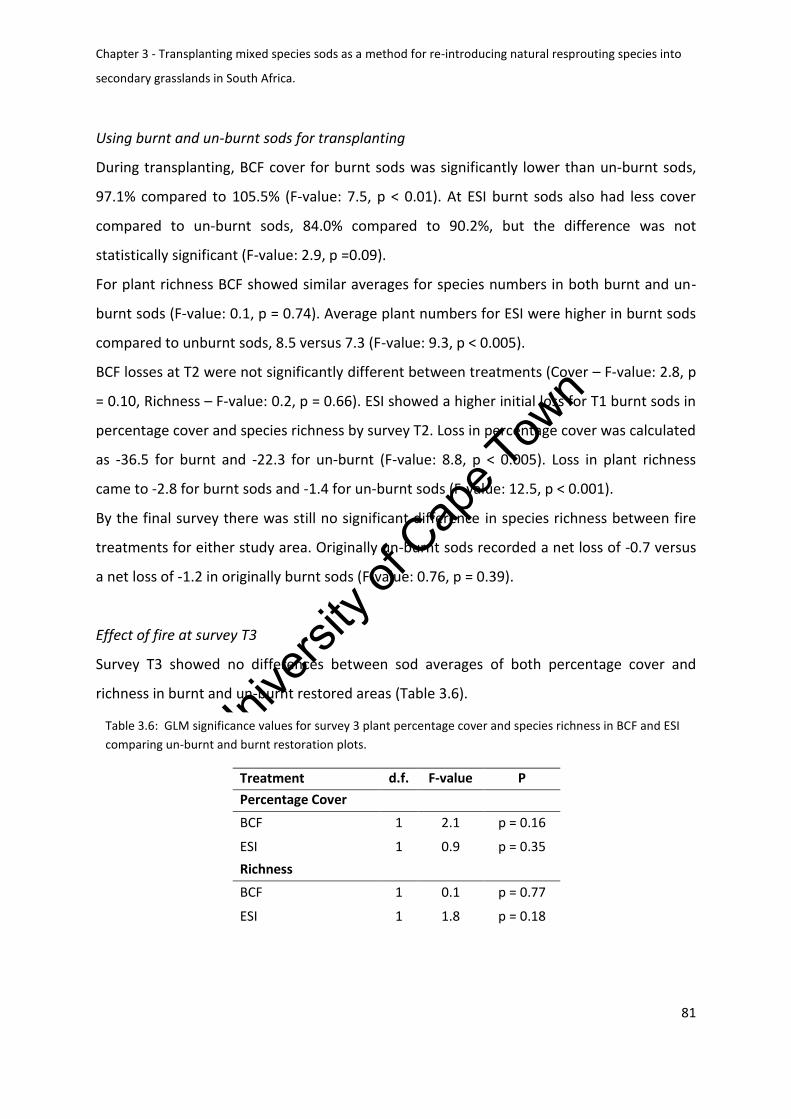
Univers
ity of
Cap
e Tow
n
Chapter 3 - Transplanting mixed species sods as a method for re-introducing natural resprouting species into
secondary grasslands in South Africa.
81
Using burnt and un-burnt sods for transplanting
During transplanting, BCF cover for burnt sods was significantly lower than un-burnt sods,
97.1% compared to 105.5% (F-value: 7.5, p < 0.01). At ESI burnt sods also had less cover
compared to un-burnt sods, 84.0% compared to 90.2%, but the difference was not
statistically significant (F-value: 2.9, p =0.09).
For plant richness BCF showed similar averages for species numbers in both burnt and un-
burnt sods (F-value: 0.1, p = 0.74). Average plant numbers for ESI were higher in burnt sods
compared to unburnt sods, 8.5 versus 7.3 (F-value: 9.3, p < 0.005).
BCF losses at T2 were not significantly different between treatments (Cover – F-value: 2.8, p
= 0.10, Richness – F-value: 0.2, p = 0.66). ESI showed a higher initial loss for T1 burnt sods in
percentage cover and species richness by survey T2. Loss in percentage cover was calculated
as -36.5 for burnt and -22.3 for un-burnt (F-value: 8.8, p < 0.005). Loss in plant richness
came to -2.8 for burnt sods and -1.4 for un-burnt sods (F-value: 12.5, p < 0.001).
By the final survey there was still no significant difference in species richness between fire
treatments for either study area. Originally un-burnt sods recorded a net loss of -0.7 versus
a net loss of -1.2 in originally burnt sods (F-value: 0.76, p = 0.39).
Effect of fire at survey T3
Survey T3 showed no differences between sod averages of both percentage cover and
richness in burnt and un-burnt restored areas (Table 3.6).
Table 3.6: GLM significance values for survey 3 plant percentage cover and species richness in BCF and ESI
comparing un-burnt and burnt restoration plots.
Treatment d.f. F-value P
Percentage Cover
BCF 1 2.1 p = 0.16
ESI 1 0.9 p = 0.35
Richness
BCF 1 0.1 p = 0.77
ESI 1 1.8 p = 0.18
Univers
ity of
Cap
e Tow
n
Chapter 3 - Transplanting mixed species sods as a method for re-introducing natural resprouting species into
secondary grasslands in South Africa.
82
Discussion:
Transplanting established plants creates possible sources of propagules for natural species
within secondary habitat. This could facilitate the restoration process in vegetation where
resprouters are dominant and thus do not easily re-colonise recovering land (Chapter 2,
Norman et al. 2006, Zaloumis and Bond 2010). In this study we managed to successfully
transplant the majority of 364 sods from natural grassland into secondary grassland and
measure their success in re-establishing in a recovering environment.
This study was able to increase the species diversity of each restoration plot on a small scale
despite the losses of some species and cover from transplanted sods. These losses were
proportionally small compared to the numbers recorded on the sods introduced and
resulting in a number of common grassland species being successfully re-introduced into the
secondary grassland.
There was no clear effect of grass competition. The only case where there was an effect was
from the coastal grasslands. Here cleared quadrats lost less cover than the un-cleared
quadrats. This is what you could expect for sods surrounded by competitive monospecific
grass stands without a cleared boundary. However, plant richness between treatments did
not show the same pattern. It is possible that the apparent absence of a grass competition
effect was because this was only a short study. The effect of grass competition may yet
emerge in the longer term. It is also likely to depend on the management practices of the
area. Monospecific grass stands can both create competition for below ground resources
and for sunlight in the secondary areas (Chapter 3). If these secondary grass swards were
allowed to shade out the sods in the future, we should expect to see a greater loss the of
shade intolerant species in the sods (Uys et al. 2004). If competition for resources was more
severe then we would also expect the more competitive grasses to eventually replace the
re-introduced natural species over time (Fynn et al. 2010).
Species richness measurements for plant growth forms can help to determine which
functional groups are more successful at establishing after a transplant. Graminoid
Univers
ity of
Cap
e Tow
n
Chapter 3 - Transplanting mixed species sods as a method for re-introducing natural resprouting species into
secondary grasslands in South Africa.
83
elements, grasses and sedges, did far better in the transplanting compared to forbs and
geoxylic suffrutices which lost the highest proportion of their percentage cover and
richness. This is because the below ground habit of forbs and geoxylic suffrutices make them
far more difficult to practically and safely remove from the ground. Forbs come in all sizes
(Uys 2006) but some are very large (Zaloumis & Bond 2011) and you cannot avoid chopping
off bits of their underground storage organs (USO) thereby possibly compromising
transplanting success. USOs may also increase the length of dormancy a forb undergoes
before resprouting after a transplant. A year may not be enough to record a forb recovery
from this treatment. Also, it was usually a few of the hardier more common forbs that were
regularly recorded in the final survey. It would be beneficial to identify why this is so. The
USOs of some forbs are very hardy and difficult to damage while others are very easy to
break or cut (pers. observation). Geoxylic suffrutices are even more difficult to transplant as
they form clones with very large subterranean structures (White 1979). When removing
these you are basically removing a small segment of their structure and the survival of this
element is more likely dependant on how much of the structure you were able to take with
the sod. As forbs and geoxylic suffrutices are important components of grasslands making
up the majority of the grasslands biodiversity it is important to ensure minimum loss of
these elements during the transplanting process. Our results in this study indicate that this
is possible for forbs as three quarters of their species survived the process. Geoxylic
suffrutices suffered the most, almost completely disappearing from the majority of sods and
therefore failed to successfully establish once transplanted.
Change in plant cover within the original sod area was far more variable between and within
the study areas than species richness. This potentially makes richness a better measure of
success for sod establishment in this study. Cover may also be far more reliant on post
transplanting rain events. It is possible that this is the reason for the smaller initial loss of
plant cover for BKNR, which saw the best post-transplanting rain. It did however initially
lose similar amounts of plant species to the other two sites. Unfortunately there is not a
final survey of BKNR to provide a proper comparison. However we can predict that there
would also have been a recovery seen in plant species and potentially an increase in
Univers
ity of
Cap
e Tow
n
Chapter 3 - Transplanting mixed species sods as a method for re-introducing natural resprouting species into
secondary grasslands in South Africa.
84
percentage cover. Hopefully another survey after a few years will be able to include all three
sites for a complete comparison.
Fire did not seem to have an effect on the outcome of this study. Harvested sods that had
been burnt did not show any lower diversity values than the sods harvested from un-burnt
areas. This may be because grassland forbs, supported by their USO’s, are likely to be able
to respond quickly to multiple forms of defoliation disturbances during a single growing
season. Fire also had no measurable influence on recorded cover and richness data from
restored plots that had been burnt before the final survey was completed.
Practicalities of mixed species sod transplants
This study indicated several serious limitations that one would face using sod transplants for
restoration on a larger scale. It also suggests some potential opportunities for further
investigation in grassland restoration.
Graminoids were by far the easiest plant element to transplant and re-establish. Unlike
forbs, grasses were supported by a thick layer of roots below ground which were much
easier to excavate without having to worry about killing them. Although forb transplants
were partly successful, it may be worth finding a more practical way of re-introducing larger
numbers of them as adults or established seedlings to increase the proportion that are
successfully transplanted.
The timing of this study was limited by the constraints of a masters thesis. The transplanting
occurred in the middle of the growing season. Discussion amongst some stake holders
involved in this project along with field observations suggest that the ideal time to do the
transplants would have been during the dormant season especially towards the end of
winter. During this time plants would be inactive and daytime temperatures during the
transplanting would not be those experienced in summer thus reducing the transpiration
stress that a forb would experience. The only limitations with this would be the inability to
identify plant species that are not flowering or even present above ground at this time. One
Univers
ity of
Cap
e Tow
n
Chapter 3 - Transplanting mixed species sods as a method for re-introducing natural resprouting species into
secondary grasslands in South Africa.
85
could try marking out sods to sample during the growing season to use in restoration plots
during the dormant season. Should one want to do another study during the summer
period, it may be worth trimming the above ground biomass of forb species to reduce the
transpiration stress as well as using plants that had not been burnt.
Criteria for measuring transplant success
The aim of this study was to determine if sods can survive a transplant and re-establish in
recovering areas. They did. The best metric of sod re-establishment success was species
richness. Cover was far more variable and although some plants, especially forbs, had
considerable cover to start with, they were often then reduced to just a single resprouting
stem. Monitoring in the future should still include both cover and richness because they can
both be used to determine how sod plant species, after establishing, have started to
increase their distribution by dispersing successfully within the recovering area.
In this study the transplanting of natural grassland sods was marginally successful.
Unfortunately this is not the most practical method to use in grassland restoration efforts.
There are few intact natural grassland available that can be used for such a project (pers.
observation), especially on a larger scale, unless one was to transplant from an entire area
that was being developed. Remaining areas of natural grasslands can also be difficult to
access (one of the reasons why they are still intact). Sods are impractical to move over
larger distances because of the considerable range of forb USO sizes. If forbs are delicate to
transplant, one would end up losing several of the larger USO species. Also, on a larger
scale, a project like this could really damage natural grasslands that are sourced for the sod
harvesting and one would have to consider the pros and cons of such an endeavour.
We need to develop a better understanding of grass and forb reproduction, both sexual and
vegetative. At the same time we can build on the work of this project as we know that forbs
and grasses can be successfully transplanted. One suggestion would be to establish a project
where plant propagules, both plant specimens and seeds, are collected for an area intended
for restoration. From these an attempt could be made to create artificial sods with the local
Univers
ity of
Cap
e Tow
n
Chapter 3 - Transplanting mixed species sods as a method for re-introducing natural resprouting species into
secondary grasslands in South Africa.
86
soil, or at least to grow a sufficient number of the plants individually for large scale re-
introduction into recovering areas.
Conclusion:
Mix species sod transplanting as a possible method for re-introducing natural resprouting
species has some potential. We established seemingly viable populations and increased the
diversity of natural grassland species in the study areas. However, the longevity of this
success can only be measured through continual monitoring. We now have an established
project that we can build on and continue to monitor in the future.
We found that transplanting worked, but the method of using sods, by itself, may just not
be practical for large scale projects. It is important to build on such a project to help
establish alternative and more practical methods for grassland restoration. This could
include the collecting of seed and other plant propagules and growing these plants in
specialised nurseries specifically managed for restoration projects.
Univers
ity of
Cap
e Tow
n
Chapter 3 - Transplanting mixed species sods as a method for re-introducing natural resprouting species into
secondary grasslands in South Africa.
87
References:
Ash H.J., Gremmell R.P. & Bradshaw A.D. 1994. The introduction of native plant species on
industrial waste heaps: a test of immigration and other factors affecting succession
primary. Journal of Applied Ecology. 31: 74-84.
Bakker J.P., Poschlod P., Strykstra R.J., Bekker R.M. & Thompson K. 1996. Seed banks and
seed dispersal: important topic in restoration ecology. Acta Botanica Neerlandica. 45:
461-490.
Bakker J.P. & Berendse F. 1999. Constraints in the restoration of ecological diversity in
grassland and heathland communities. Trends Evolution and Ecology. 14: 63-68.
Bradshaw A.D. 1997. Restoration of mined lands - using natural processes. Ecological
Engineering. 8: 255-269.
Blignaut, J., Aronson, J., Mander, M., & Marais, C. 2008. Investing in natural capital and
economic development: South Africa’s Drakensberg Mountains. Ecological
Restoration. 26: 143-150.
Blignaut, J., Mander, M., Schulze, R., Horan, M., Dickens, C., Pringle, C., Mavundla, K.,
Mahlangu, I., Wilson, A., McKenzie, M. & McKean, S. 2010. Restoring and managing
natural capital towards fostering economic development: Evidence from the
Drakensberg, South Africa. Ecological Economics. 69: 1313-1323.
Bond W.J. & Parr C.L. 2010. Beyond the forest edge: Ecology, diversity and conservation of
the grassy biomes. Biological Conservation. 143: 2395-2404.
Bonn, A., & Gaston, K. J. 2005. Capturing biodiversity: selecting priority areas for
conservation using different criteria. Biodiversity & Conservation, 14: 1083-1100.
Buisson, E., Dutoit, T., Torre, F., Römermann, C., & Poschlod, P. 2006a. The implications of
seed rain and seed bank patterns for plant succession at the edges of abandoned
fields in Mediterranean landscapes. Agriculture, ecosystems & environment. 115: 6-
14.
Buisson, E., Holl, K. D., Anderson, S., Corcket, E., Hayes, G. F., Torre, F., Peteers, A. & Dutoit,
T. 2006b. Effect of seed source, topsoil removal, and plant neighbor removal on
restoring California coastal prairies. Restoration Ecology. 14: 569-577.
Univers
ity of
Cap
e Tow
n
Chapter 3 - Transplanting mixed species sods as a method for re-introducing natural resprouting species into
secondary grasslands in South Africa.
88
Cole I. & Lunt I.D. 2005. Restoring Kangaroo Grass (Themeda triandra) to grassland and
woodland understoreys: a review of establishment requirements and restoration
exercises in south-east Australia. Ecological Management and Restoration. 6: 28-33.
Dickson T. L. & Busby W. H. 2008. Forb species establishment increases with decreased grass
seeding density and with increased forb seeding density in a Northeast Kansas, U.S.
A., experimental prairie restoration. Restoration Ecology. 17: 597-605.
Driver, A., Maze, K., Rouget, M., Lombard, A. T., Nel, J., Turpie, J. K., Cowling, R. M, Desmet,
P., Goodman, P., Harris, J., Jonas, Z., Reyers, B., Sink, K. & Strauss, T. 2005. National
spatial biodiversity assessment 2004: priorities for biodiversity conservation in South
Africa. South African National Biodiversity Institute. Available at
http://bgis.sanbi.org/nsba/NSBA_Report.pdf [accessed 2013].
Fynn R.W. S., Morris C. D., Edwards T. J. & Skarpe C. 2004. Effect of burning and mowing on
grass and forb diversity in a long-term grassland experiment. Applied Vegetation
Science. 7: 1-10.
Fynn, R.W.S., Wragg, P.D., Morris, C.D., Kirkman, K.P. and Naiken, J. 2009. Vegetative traits
predict grass species’ invasiveness and the invasibility of restored grassland. African
Journal of Range & Forage Science. 26: 59–68.
Fynn, R.W.S., Morris, C.D. and Kirkman, K.P. 2010. Plant strategies and trait trade-offs
influence trends in competitive ability along gradients of soil fertility and disturbance.
Journal of Ecology. 93: 384-394.
Grant, C.D. & Loneragan, W. A. 2001. The effects of burning on the understory composition
of rehabilitated bauxite mines in Western Australia: community changes and
vegetation succession. Forest Ecology Management. 145: 255-279.
Hardy, P. 2008. Grasslands and Forestry. SA Forestry. Grasslands Program (Accessed on 13
September 2009) Resources page. http://www.grasslands.org.za/. SANBI.
Hobbs, R. J., & Norton, D. A. 1996. Towards a Conceptual Framework for Restoration
Ecology. Restoration Ecology. 4: 93-110.
Hoekstra, J.M., Boucher, T.M. , Ricketts, T.H. & Roberts, C. 2005. Confronting a biome crisis:
global disparities of habitat loss and protection. Ecology Letters 8:23-29.
Univers
ity of
Cap
e Tow
n
Chapter 3 - Transplanting mixed species sods as a method for re-introducing natural resprouting species into
secondary grasslands in South Africa.
89
Hoffmann, W.A. 1998. Post-burn reproduction of woody plants in a Neotropical savanna:
the relative importance of sexual and vegetative reproduction. Journal of Applied
Ecology. 35: 422-433.
Kardol, P., Wal, A. V. D., Bezemer, T. M., Boer, W. D., Duyts, H., Holtkamp, R., & Putten, W.
H. 2008. Restoration of species-rich grasslands on ex-arable land: Seed addition
outweighs soil fertility reduction. Biological conservation: 2208-2217.
Kiehl K. 2010. Plant species introduction in ecological restoration : Possibilities and
limitation. Basic and Applied. Ecology 11: 1-4.
Leach M. K. & Givnish T. J. 1996. Ecological determinants of species loss in remnant prairies.
Science. 273: 1555-1558.
Le Stradic, S. 2012. Unpublished Data: Composition, phenology and restoration of campo
rupestre mountain grasslands - Brazil. Unpublished PhD thesis. In: Laboratório de
Ecologia Evolutiva e Biodiversidade, Resource p. 261. Institut Méditerranéen de
Biodiversité et d’Écologie, Brazil.
Lunt D. L. 1994. Variation in flower production of nine grassland species with time since fire,
and implications for grassland management and restoration. Pacific Conservation
Biology. 1: 359-366.
Lunt D. L. 1995. Seed longevity of six native forbs in a closed Themeda triandra grassland.
Australian Journal of Botany 43: 439-449.
Lunt D. L. & Morgan J.W. 1999. Effect of fire frequency on plant composition at the Laverton
North Grassland Reserve, Victoria. Victorian Naturalist. 116: 84-90.
Mentis, M. T. 1999. Diagnosis of the rehabilitation of opencast coal mines on the Highveld of
South Africa. South African journal of science. 95: 210-215.
Mentis M. T. 2006. Restoring native grassland on land disturbed by coal mining on the
Eastern Highveld of South Africa. South African Journal of Science. 102: 193-8.
Mucina L. & Rutherford M. C. 2006. The Vegetation of South Africa, Lesotho and Swaziland.
Strelitzia 19, Pretoria.
Myers, N., Mittermeier, R.A., Mittermeier, C.G., Fonseca, G.A.B. & Kent, J. 2000. Biodiversity
hotspots for conservation priorities. Nature. 403: 853-858.
Univers
ity of
Cap
e Tow
n
Chapter 3 - Transplanting mixed species sods as a method for re-introducing natural resprouting species into
secondary grasslands in South Africa.
90
Norman M. A., Koch J. M., Grant C. D., Morald T. K. & Ward S. C. 2006. Vegetation
succession after bauxite mining in Western Australia. Restoration Ecology 14: 278-
288.
O'Connor, T. G., & Kuyler, P. 2009. Impact of land use on the biodiversity integrity of the
moist sub-biome of the grassland biome, South Africa. Journal of environmental
management. 90: 384-395.
Overbeck, G. E., Müller, S. C., Fidelis, A., Pfadenhauer, J., Pillar, V. D., Blanco, C. C., &
Forneck, E. D. 2007. Brazil's neglected biome: The South Brazilian Campos.
Perspectives in Plant Ecology, Evolution and Systematics. 9: 101-116.
Pärtel, M., Kalamees, R., Zobel, M., & Rosén, E. 1998. Restoration of species-rich limestone
grassland communities from overgrown land: the importance of propagule
availability. Ecological Engineering. 10:275-286.
Piqueray, J., Bottin, G., Delescaille, L. M., Bisteau, E., Colinet, G., & Mahy, G. 2011. Rapid
restoration of a species-rich ecosystem assessed from soil and vegetation indicators:
the case of calcareous grasslands restored from forest stands. Ecological Indicators,
11: 724-733.
Prober, S. M. & Thiele, K. R. 2005. Restoring Australia’s temperate grasslands and grassy
woodlands: integrating function and diversity. Ecological Management Restoration.
6: 16-27.
Pywell, R. F., Bullock J. M. & Hopkins, A. 2002. Restoration of species-rich grassland on
arable land: assessing the limiting processes using a multi-site experiment. Journal
Applied Ecology. 39: 294-309.
Reyers, B., Fairbanks, D. H. K., Van Jaarsveld, A. S., & Thompson, M. 2001. Priority areas for
the conservation of South African vegetation: a coarse‐filter approach. Diversity and
Distributions. 7: 79-95.
Reyers, B., & Tosh, C. 2003. National Grassland Initiative: concept document. Gauteng
Department of Agriculture Conservation & Land Affairs, Johannesburg.
Schramm, P. 1978. The" do's and don'ts" of prairie restoration. In 5th Midwest prairie
conference proceedings, Midwest prairie conference, Ames, IA. Ames, IA: Iowa State
University. Pg. 139-150.
Univers
ity of
Cap
e Tow
n
Chapter 3 - Transplanting mixed species sods as a method for re-introducing natural resprouting species into
secondary grasslands in South Africa.
91
Scott, A. J., & Morgan, J. W. 2012. Resilience, persistence and relationship to standing
vegetation in soil seed banks of semi‐arid Australian old fields. Applied Vegetation
Science. 15: 48-61.
Smith, M. A., Grant, C. D., Loneragan, W. A., & Koch, J. M. 2004. Fire management
implications of fuel loads and vegetation structure in jarrah forest restoration on
bauxite mines in Western Australia. Forest Ecology and Management. 187: 247-266.
Society for Ecological Restoration International Science Policy Working Group (Soc. Eco.
Rest.) 2004. The SER International Primer on Ecological Restoration. www.ser.org &
Tucson: Society for Ecological Restoration International.
Shu W.S., Ye Z.H., Zhang Z.Q., Lan C.Y. & Wong M.H. 2005. Natural Colonization of Plants on
Five Lead/Zinc Mine Tailings in Southern China. Restoration Ecology. 13: 49-60.
Suding, K. N., Gross, K. L., & Houseman, G. R. 2004. Alternative states and positive feedbacks
in restoration ecology. Trends in Ecology & Evolution, 19: 46-53.
Uys, R.G., Bond, W.J., and Everson, T.M. 2004. The effect of different fire regimes on plant
diversity in southern African grasslands. Biological Conservation. 118: 489-499.
Uys, R.G. 2006. Unpublished data: Patterns of plants diversity and their management across
South African rangelands. Unpublished PhD thesis. In: Department of Botany.
University of Cape Town, Cape Town.
van Oudtshoorn, F. V., Brown, L., & Kellner, K. 2011. The effect of reseeding methods on
secondary succession during cropland restoration in the Highveld region of South
Africa. African Journal of Range & Forage Science. 28: 1-8.
White, F. 1979. The subdivisions of Magnistipula Engl.(Chrysobalanaceae). Brittonia. 31:
480-482.
Young, T. P. 2000. Restoration ecology and conservation biology. Biological conservation.
92: 73-83.
Zaloumis, N.P. and Bond, W. J. 2010. Grassland restoration after afforestation: No direction
home? Austral Ecology. 36: 357–366.
Univers
ity of
Cap
e Tow
n
Chapter 4 - Grass competition as a constraint for grassland forb seedling establishment
92
Chapter 4: Grass competition as a constraint for grassland forb seedling establishment
Abstract:
A great diversity of forb and grass species co-exist within the primary grasslands of southern
Africa, yet little is known of their interaction when competing for similar resources. The
conditions that determine forb seedling establishment in the natural environment are still
unknown. In the context of grassland restoration the implications of grass-forb competition
on discouraging forb seedling establishment becomes far more relevant from a
management context.
The aim of this study was to explore the effect of grass competition on forb establishment in
a glasshouse pot experiment. Propagules of five forb species were planted into pots
containing tillers of five different grass species with different levels of competitiveness. Forb
leaf and root traits were then measured and compared between competition treatments.
Forb growth was found to be limited by grass competition, with some grass species having
more of an affect than others. Forb species that were able to respond to the high levels of
grass competition by changing their growth habit coped better. Forb seedlings require a
spatial and temporal ‘gap’ to successfully establish under medium and high levels of grass
competition. The dimensions of a gap, and how to simulate their formation, have important
implications for grassland management and the restoration of secondary grasslands. A field
project simulating potential gap conditions under natural and secondary grassland
conditions would be the next step in furthering our understanding of grassland seedling
gaps.
Univers
ity of
Cap
e Tow
n
Chapter 4 - Grass competition as a constraint for grassland forb seedling establishment
93
Introduction:
Whereas the effects of grass on tree growth and recruitment in savannas has been a topic of
a number of studies (Scholes & Archer 1997, Bond 2008, Tedder et al. 2012), very little is
known about forbs and how they establish and compete in a grass sward. Forbs, a largely
ignored and unexplored grassy biome component, make up a significant proportion of
grassland biodiversity in South Africa (Uys et al. 2004, Zaloumis & Bond 2011) and in similar
tropical and sub-tropical montane grasslands elsewhere (Overbeck et al. 2007, Overbeck &
Pfadenhauer 2007, Bond & Parr 2010). Grassland ecology and forb-grass interactions have
been explored to some extent in the prairies of North America and the Temperate
Grasslands of eastern Australia (Collins 1992, Lunt 1994 and 1995, Leach & Givnish 1996,
Collins et al. 1998, Olff & Ritchie 1998, Lunt & Morgan 1999, Morgan et al. 1999a and
1999b, Knapp et al. 2004, Dickson & Busby 2008) including an investigation of the effect of
grass competition on annual forbs in North America (Gillespie & Allen 2004). In South
America and South Africa, the study of grassland forbs has been neglected until very
recently, especially in comparison with work on the grasses (Uys et al. 2004, Zaloumis &
Bond 2010, Overbeck et al. 2007, Overbeck & Pfadenhauer 2007). Two specific studies have
focused on the direct interaction of native grass and forbs in Kansas, North America (Dwyer
1958) and how competitive grasses can have a negative effect on forb establishment in
prairie restoration (Dickson & Busby 2008).
The growth form of grasses makes them very competitive. Grasses are effective competitors
for light and are able to respond quickly to resource pulses (Bond 2008). Grasses have
shallow, but dense and fibrous root systems and are also intense competitors for nutrients
and water within their rooting zone (Harris 1977, Scholes & Archer 1997, Cramer et al.
2010). Trees, being large and long lived, have a growth form with the ability to access
resources above and below ground that grasses cannot (Smith & Shackleton 1988, Bond
2008). How do forbs fare in this competitive milieu?
Like trees in a savanna, resprouting grassland forbs are a plant growth form that co-exist
with grasses. They make up a considerable proportion of the diversity of grasslands and
Univers
ity of
Cap
e Tow
n
Chapter 4 - Grass competition as a constraint for grassland forb seedling establishment
94
contribute to its biomass and cover. In the case of southern Africa and South America, they
are persistent growth forms that could survive for decades or maybe even centuries (Uys et
al. 2004, Overbeck et al. 2007, Overbeck & Pfadenhauer 2007, Bond & Parr 2010). Along
with the South African grass species they even have adaptations to frequent defoliation
events like fire and herbivory because of characteristic woody, tuberous or bulbous storage
organs below the ground (Underground Storage Organs – USOs). Unlike trees, however,
forbs have negligible above-ground woody biomass. They are short and often over-topped
by surrounding grass species. Established forbs are able to respond to fire very quickly and
can flower within weeks of a burn, with many species flowering before the dominant grass
species begin to dominate again (Chapter 2, Uys et al. 2004, Zaloumis & Bond 2011). Forbs
and grasses also appear to occupy the same surface soil layers (Chapter 2).
Thus grasses and forbs have extensive niche overlap on many habitat axes. Both compete
for sunlight and exist mostly in the same height zone, although some dominant grasses can
grow much taller than most forbs. However, many native grass species are short and tend to
keep the grass layer heterogonous in height (Fynn et al. 2010, Fynn et al. 2011,
Observation). Height is also controlled by natural disturbances such as grazing or fire. Both
grass and forbs recover quickly after fire (Zaloumis & Bond 2011). Forbs and grasses mostly
share the same soil depth. Grass roots in the South African grasslands occur between 0 – 20
cm, being extremely dense for the top 7 – 13 cm (especially in the high veld) and then
thinning out at 15 - 20cm with coastal grasslands having significant grass rooting as deep as
25cm (Chapter 2, pers. obs.). Many forbs also exist in this same soil plane with some forbs
that can produce large storage organs being able to occur as deep as 40 cm or more.
Dwyers (1958) work in North America showed that forbs could occupy two soil levels under
the ground. Dicot forbs, which he refers to having ‘rhizomatous’ roots, compete in the same
soil level as grass roots and can actually decrease grass biomass. Dicot forbs that he refers to
as having taproots are able to go deeper than the grass layer and therefore don’t compete
with grasses, with minor impacts on grassy biomass. This suggests that 1) forbs could be
important competitors in a grassland system and 2) there are two tiers of soil that forb USOs
can occupy.
Univers
ity of
Cap
e Tow
n
Chapter 4 - Grass competition as a constraint for grassland forb seedling establishment
95
However, all forb seedlings, like those of trees, have to compete with grass. Reproductive
opportunities are likely to be very rare and forb seedlings are very rarely seen in South
Africa’s natural veld, especially the more productive grassland vegetation types with high
rooting biomass. As for trees, forbs will probably need a gap of some sort to establish and
persist (Bond 2008, Cramer et al. 2010). In trees this gap is often related to disturbance
regime such as a drought, grazing or change in fire frequency. Is there a forb gap and what
are its spatial and temporal dimensions? When there is a gap, how successful are seeds at
germinating and establishing? How fast do they grow especially when not limited by
competition with grasses?
The aim of this study is to identify how forbs are affected by grass species competition. We
expect that forbs will struggle to establish when under fierce competitive pressure. Grasses
are thought to vary in their competitiveness. Do some grass species have a greater effect on
forb seedling growth than others? The species effects are relevant because often the more
competitive grasses make up mono-specific or species poor grass stands in recovering areas
or are used in restoration projects. This information can then be used to consider what mix
of grass species to utilise for restoration work (Chapter 2). If stands with more diverse grass
species facilitate forb establishment, then introducing more grass species into secondary
grasslands could help restoration efforts.
We asked the following questions:
1. How well do grassland forbs establish when facing grass competition?
2. Do different grass species affect forb establishment and growth differently?
3. Does mixing grass species help facilitate forb establishment and growth better when
compared to a single species of grass?
As for savannas, it is possible that the interactions between forbs and grasses are dynamic
and affected by many factors. All these questions have important implications for the
management and restoration of grassland systems.
Univers
ity of
Cap
e Tow
n
Chapter 4 - Grass competition as a constraint for grassland forb seedling establishment
96
Methods:
Forb and grass species selection
This study was carried out at the UKZN Life Sciences Campus in Pietermaritzburg, within the
Grasslands Science department greenhouse. Naturally occurring grassland forb seeds and
seedlings were difficult to find and even more difficult to successfully germinate. I acquired
the forb species propagules from the Silverglen Nursery, situated South of Durban. I
managed to obtain multiple seedlings, cuttings and seeds for five widespread grassland forb
species, four of which were monocot, Aloe maculata, Aristea woodii, Eucomis autumnalis
and Watsonia densiflora and one a dicot, Senecio speciosa. Individual grass tussocks were
collected from a local grassland patch close to the greenhouse. These were used to create
hundreds of individual tillers. Five widespread, co-occurring native grassland C4 grass
species were selected.
Eragrostis curvula is a tall strongly tufted species which invades grassland fertilised with
nitrogen (Fynn et al. 2005). It is a grass that is often used in rehabilitation projects and also
dominates the cover of many recovering excised afforested stands and old fields (Chapters
2). It is known to be a highly competitive species (Fynn et al. 2010).
Themeda triandra is a relatively short, narrow leaved species in the grasslands dominating
well drained infertile soil (Fynn et al. 2005). It is famous for its stands of red in winter
indicating healthy grazing veld. It is also often used in rehabilitation projects. It is a highly
competitive grass in the right conditions (Fynn et al. 2010). It is not often found in
recovering excised afforested and/or old field grasslands.
Aristida junciformis is a medium sized species with very narrow needle like leaves, common
on infertile soils and when veld is under a high level of selective grazing pressure (Fynn et al.
2005). It is not a very competitive species (Fynn et al. 2010). Aristida species can be found in
recovering excised afforested and old field grasslands.
Heteropogon contortus and Tristachya leucothrix are both relatively short species, with the
latter species not being greatly competitive (Tainton et al. 1990, Fynn et al. 2010). They are
not found in recovering excised afforested and old field grasslands. These two species were
used with Themeda triandra to make the mixed grass species treatment.
Univers
ity of
Cap
e Tow
n
Chapter 4 - Grass competition as a constraint for grassland forb seedling establishment
97
Pot preparation
140 pots with a diameter of 20cm and depth of 27cm were filled to the rim with potting soil.
The pots were divided into groups of seven to replicate each treatment.
The forb seedling were then planted individually in the middle of each pot after which four
grass tillers were added to each grass species treatment pot. They were planted on the edge
of the pot equidistant apart. For mixed grass treatments, two of Themeda triandra tillers
were used with one each of Heteropogon contortus and Tristachya leucothrix. Control pots
were not planted with grass tillers. The planting of tillers at the same time as the forbs
delayed the competitive effect of the grass species on the forb seedlings until the grass
tillers had effectively established in the pots.
Each forb species was planted into a control (no grass) treatment. Each forb species then
had two or more grass species treatments. The treatments for each forb species are listed
in table 4.1. In the experiment, Aloe maculata (Aloaceae), Eucomis autumnalis
(Hyacinthaceae) and Senecio speciosa (Asteraceae) each had 28 pots with four grass
treatments, Watsonia densiflora (Iridaceae) 35 pots with five grass treatments and Aristea
woodii (Iridaceae) had 21 pots with three grass treatments (Table 4.1). Forbs were allocated
grass treatments based on the number of available forb seedlings and to ensure that each
grass treatment had at least three forb species comparisons.
Table 4.1: Number of pots per grass treatment (rows) per species (columns).
Species Aloe maculata
Aristea woodii
Eucomis autumnalis
Watsonia densiflora
Senecio speciosa Grass Treatments
Control 7 7 7 7 7
Eragrostis curvula 7 0 7 7 7
Themeda triandra 7 7 0 7 7
Aristida junciformis 0 7 7 7 0
Mixed 7 0 7 7 7
Total Pots 28 21 28 35 28
Alive at end 25 20 28 10 0
Univers
ity of
Cap
e Tow
n
Chapter 4 - Grass competition as a constraint for grassland forb seedling establishment
98
Measurement of response variables
When the forbs were being planted several measurements were taken of the seedlings and
cuttings. Leaf length, root length and basal width were measured along with the number of
leaves per plant individual. All of the measurements done above ground were then repeated
after 1.2 months, 4months and 11 months. Grass height was recorded at 11 months.
After their final above ground measurements at 11 months the forbs were harvested and
maximum root length was measured. The above ground and below ground parts of the
plant were then collected separately, weighed individually and placed in a drying oven set at
70˚C for 48 hours. Aloe maculata required another 48 hours in the oven to lose its moisture
content completely. They were weighed again when dried. The same was also done for
grass leaf biomass, where total wet weight of above-ground grass biomass was weighed
then a sub-sample of the grass was taken and weighed again to be placed into the drying
oven. The dry weight of the grass portion was used to calculate the total grass dry weight.
Although I had numerous Watsonia densiflora seedlings they did not do well in the
transplanting into pots and, except for the control, none of the treatments survived to the
11 month stage. A few made it to the 4th month measurement. Senecio speciosa was
planted as seed but never germinated.
Data analysis
General Linear Model statistical analysis was performed using the STATISTICA 11 software
package (StatSoft;Tulsa, OK, USA). Post-hoc Tukey tests were then used to distinguish
significant difference within a GLM among several treatments.
Forb biomass
The average leaf dry weight and root dry weight for each forb species was compared among
each grass species treatment. Forb dry root weight was compared to pot grass blade
biomass to determine the effect of grass competition on forb USO development.
Plant leaf number and basal width
Univers
ity of
Cap
e Tow
n
Chapter 4 - Grass competition as a constraint for grassland forb seedling establishment
99
Forb dry leaf weight was compared to the number of leaves on the forb in a regression
analysis. Forb dry root weight was compared to the basal width of the forb in a similar
analysis. This helped determine if number of leaves and basal width can be used as a
biomass proxy for the rest of the analysis.
Forb biomass growth over 11 months
The average number of leaves and their average basal width was compared for each forb
species among each grass treatment for the sampled 11 months. The use of these two
proxies was to determine how each forb species responded to grass competition over the
year.
Forb leaf and root length
Individual forb leaf and root lengths were compared to pot grass leaf biomass for each grass
treatment to look at any trait responses to grass competition.
Forb root wet weight vs. dry weight
The root weight loss for each forb species was compared among grass treatments to
determine how the below-ground (USO) parts of each forb species respond to grass
competition.
Univers
ity of
Cap
e Tow
n
Chapter 4 - Grass competition as a constraint for grassland forb seedling establishment
100
Results:
Forb biomass
Leaf dry weight of each forb species was far greater in the control (no grass) treatments
when compared to all other grass species treatments (Figure 4.1). Aloe maculata (Aloe),
Eucomis autumnalis (Eucomis) and Aristea woodii (Aristea) showed a significant difference
between the control dry leaf biomass and that of the other grass treatments (Table 4.2: For
all three species, p < 0.0001). Aloeshowed the largest proportional difference between the
control and the other grass species treatments and there was no difference between the dry
leaf biomass of its remaining grass species treatments (Figure 4.1a). Eucomis grew
significantly more leaf biomass in the mixed grass (Mixed) treatment compared to A.
junciformis (Aristida) and E. curvula (Eragrostis) grass treatments (Figure 4.1b). The Aristida
grass treatment did produce more dry leaf biomass on average than Eragrostis Aristea
produced more dry leaf biomass in the Aristida treatment compared to the T. triandra
(Themeda) treatment but the differences were not significant (Figure 4.1c).
Table 4.2: GLM of forb species comparing leaf and root dry weight averages for each grassland treatment.
Species d.f. F-value P
Leaf dry weight (g) (n = 7 per treatment)
Aloe maculata 3 57.2 p < 0.0001
Eucomis autumnalis 3 82.7 p < 0.0001
Aristea woodii 2 99.6 p < 0.0001
Root dry weight (g) (n = 7 per treatment)
Aloe maculata 3 40.0 p < 0.0001
Eucomis autumnalis 3 108.1 p < 0.0001
Aristea woodii 2 15.3 p < 0.0005
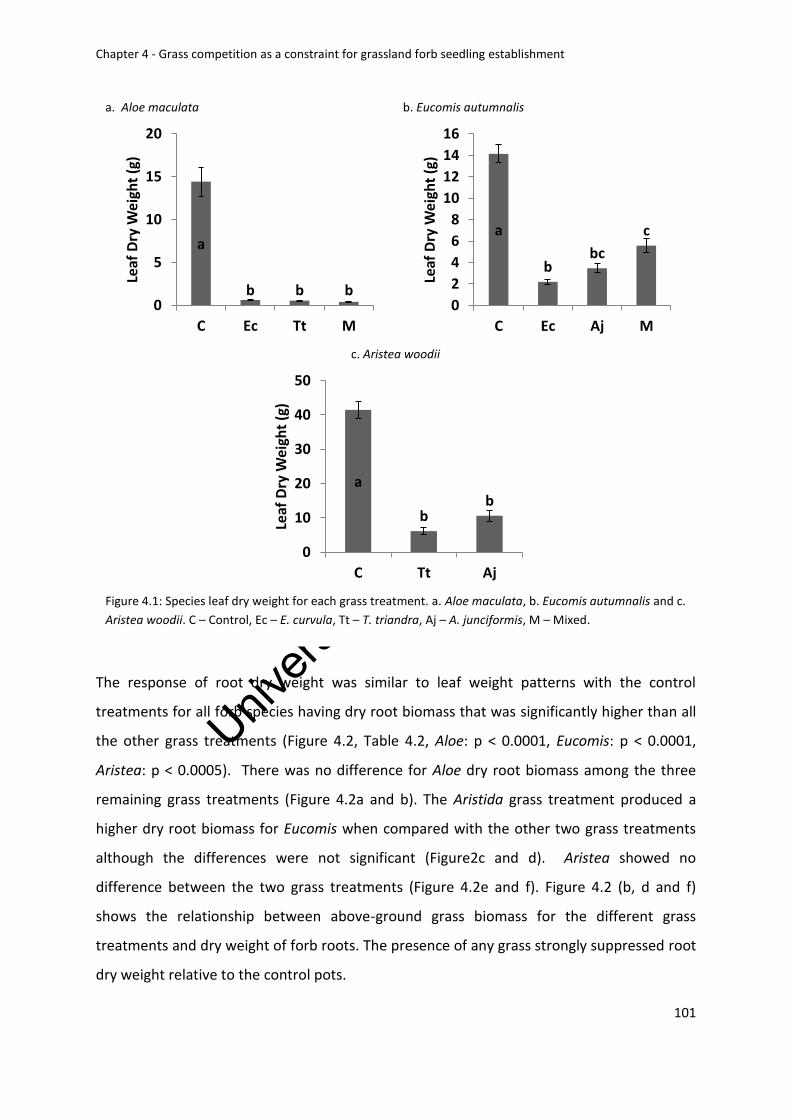
Univers
ity of
Cap
e Tow
n
Chapter 4 - Grass competition as a constraint for grassland forb seedling establishment
101
The response of root dry weight was similar to leaf weight patterns with the control
treatments for all forb species having dry root biomass that was significantly higher than all
the other grass treatments (Figure 4.2, Table 4.2, Aloe: p < 0.0001, Eucomis: p < 0.0001,
Aristea: p < 0.0005). There was no difference for Aloe dry root biomass among the three
remaining grass treatments (Figure 4.2a and b). The Aristida grass treatment produced a
higher dry root biomass for Eucomis when compared with the other two grass treatments
although the differences were not significant (Figure2c and d). Aristea showed no
difference between the two grass treatments (Figure 4.2e and f). Figure 4.2 (b, d and f)
shows the relationship between above-ground grass biomass for the different grass
treatments and dry weight of forb roots. The presence of any grass strongly suppressed root
dry weight relative to the control pots.
a. Aloe maculata
a
b b b0
5
10
15
20
C Ec Tt M
Leaf
Dry
Wei
ght
(g)
b. Eucomis autumnalis
a
bbc
c
0
2
4
6
8
10
12
14
16
C Ec Aj M
Leaf
Dry
Wei
ght
(g)
c. Aristea woodii
a
bb
0
10
20
30
40
50
C Tt Aj
Leaf
Dry
Wei
ght
(g)
Figure 4.1: Species leaf dry weight for each grass treatment. a. Aloe maculata, b. Eucomis autumnalis and c.
Aristea woodii. C – Control, Ec – E. curvula, Tt – T. triandra, Aj – A. junciformis, M – Mixed.
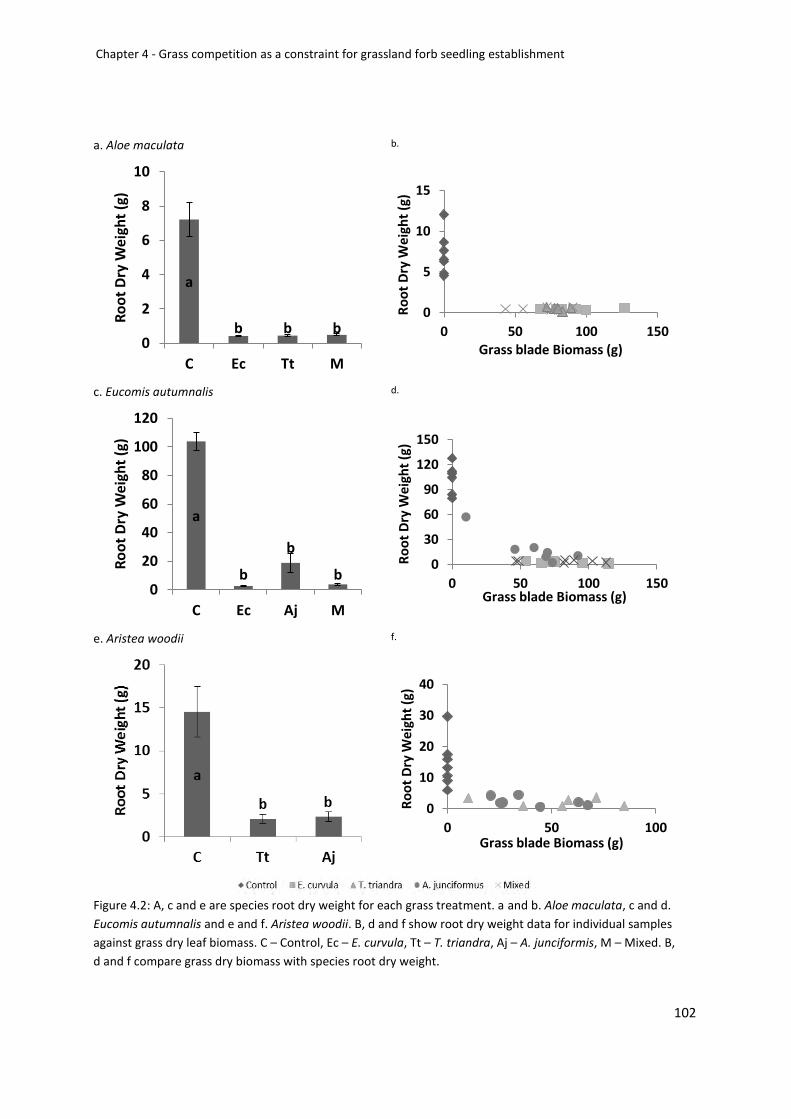
Univers
ity of
Cap
e Tow
n
Chapter 4 - Grass competition as a constraint for grassland forb seedling establishment
102
a. Aloe maculata
a
b b b0
2
4
6
8
10
C Ec Tt M
Ro
ot
Dry
Wei
ght
(g)
b.
0
5
10
15
0 50 100 150
Ro
ot
Dry
We
igh
t (g
)
Grass blade Biomass (g)
c. Eucomis autumnalis
a
b
b
b0
20
40
60
80
100
120
C Ec Aj M
Ro
ot
Dry
We
igh
t (g
)
d.
0
30
60
90
120
150
0 50 100 150
Ro
ot
Dry
Wei
ght
(g)
Grass blade Biomass (g)
e. Aristea woodii
f.
0
10
20
30
40
0 50 100
Ro
ot
Dry
Wei
ght
(g)
Grass blade Biomass (g)
Figure 4.2: A, c and e are species root dry weight for each grass treatment. a and b. Aloe maculata, c and d.
Eucomis autumnalis and e and f. Aristea woodii. B, d and f show root dry weight data for individual samples
against grass dry leaf biomass. C – Control, Ec – E. curvula, Tt – T. triandra, Aj – A. junciformis, M – Mixed. B,
d and f compare grass dry biomass with species root dry weight.
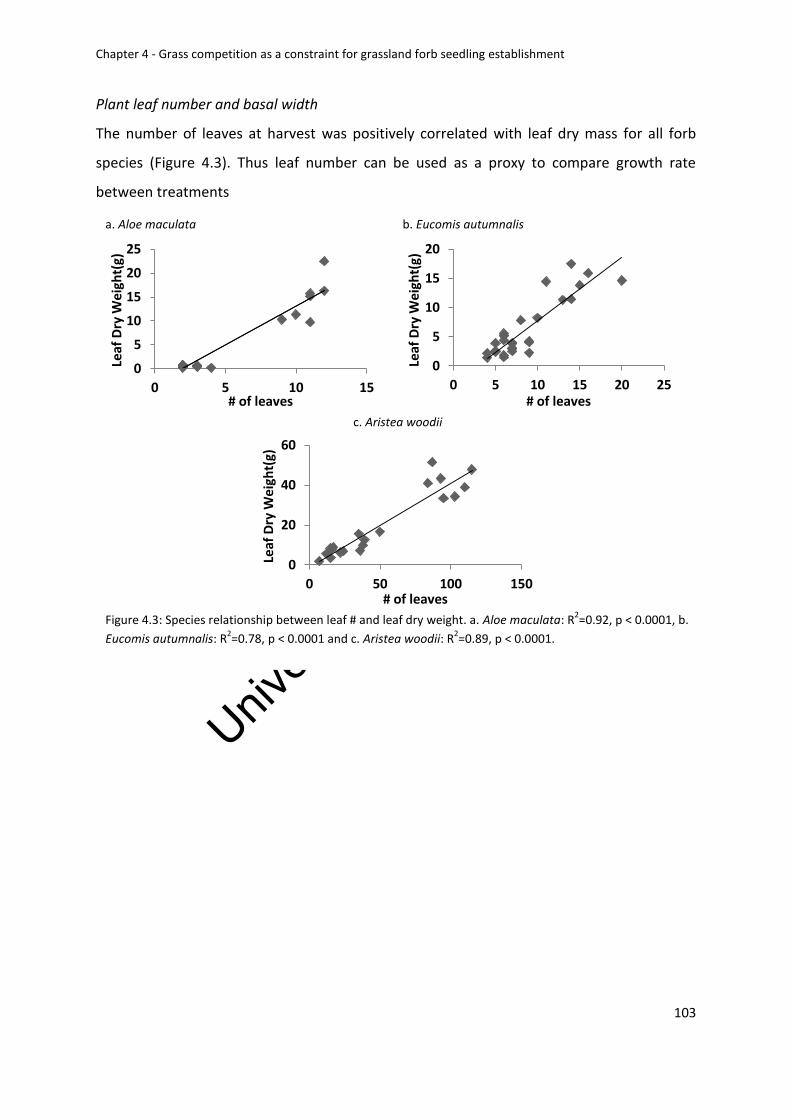
Univers
ity of
Cap
e Tow
n
Chapter 4 - Grass competition as a constraint for grassland forb seedling establishment
103
Plant leaf number and basal width
The number of leaves at harvest was positively correlated with leaf dry mass for all forb
species (Figure 4.3). Thus leaf number can be used as a proxy to compare growth rate
between treatments
a. Aloe maculata
0
5
10
15
20
25
0 5 10 15
Leaf
Dry
Wei
ght(
g)
# of leaves
b. Eucomis autumnalis
0
5
10
15
20
0 5 10 15 20 25
Leaf
Dry
Wei
ght(
g)# of leaves
c. Aristea woodii
0
20
40
60
0 50 100 150
Leaf
Dry
Wei
ght(
g)
# of leaves
Figure 4.3: Species relationship between leaf # and leaf dry weight. a. Aloe maculata: R2=0.92, p < 0.0001, b.
Eucomis autumnalis: R2=0.78, p < 0.0001 and c. Aristea woodii: R
2=0.89, p < 0.0001.
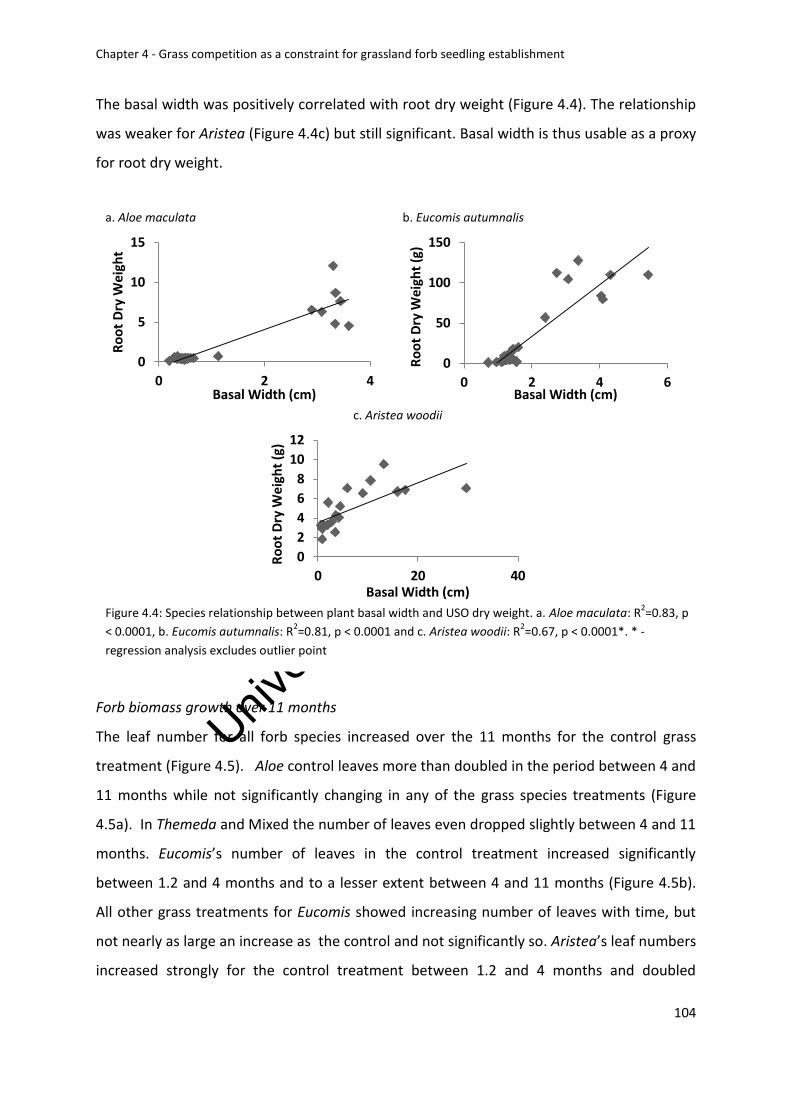
Univers
ity of
Cap
e Tow
n
Chapter 4 - Grass competition as a constraint for grassland forb seedling establishment
104
The basal width was positively correlated with root dry weight (Figure 4.4). The relationship
was weaker for Aristea (Figure 4.4c) but still significant. Basal width is thus usable as a proxy
for root dry weight.
Forb biomass growth over 11 months
The leaf number for all forb species increased over the 11 months for the control grass
treatment (Figure 4.5). Aloe control leaves more than doubled in the period between 4 and
11 months while not significantly changing in any of the grass species treatments (Figure
4.5a). In Themeda and Mixed the number of leaves even dropped slightly between 4 and 11
months. Eucomis’s number of leaves in the control treatment increased significantly
between 1.2 and 4 months and to a lesser extent between 4 and 11 months (Figure 4.5b).
All other grass treatments for Eucomis showed increasing number of leaves with time, but
not nearly as large an increase as the control and not significantly so. Aristea’s leaf numbers
increased strongly for the control treatment between 1.2 and 4 months and doubled
a. Aloe maculata
0
5
10
15
0 2 4
Ro
ot
Dry
We
igh
t
Basal Width (cm)
b. Eucomis autumnalis
0
50
100
150
0 2 4 6
Ro
ot
Dry
Wei
ght
(g)
Basal Width (cm)
c. Aristea woodii
0
2
4
6
8
10
12
0 20 40
Ro
ot
Dry
We
igh
t (g
)
Basal Width (cm)
Figure 4.4: Species relationship between plant basal width and USO dry weight. a. Aloe maculata: R2=0.83, p
< 0.0001, b. Eucomis autumnalis: R2=0.81, p < 0.0001 and c. Aristea woodii: R
2=0.67, p < 0.0001*. * -
regression analysis excludes outlier point
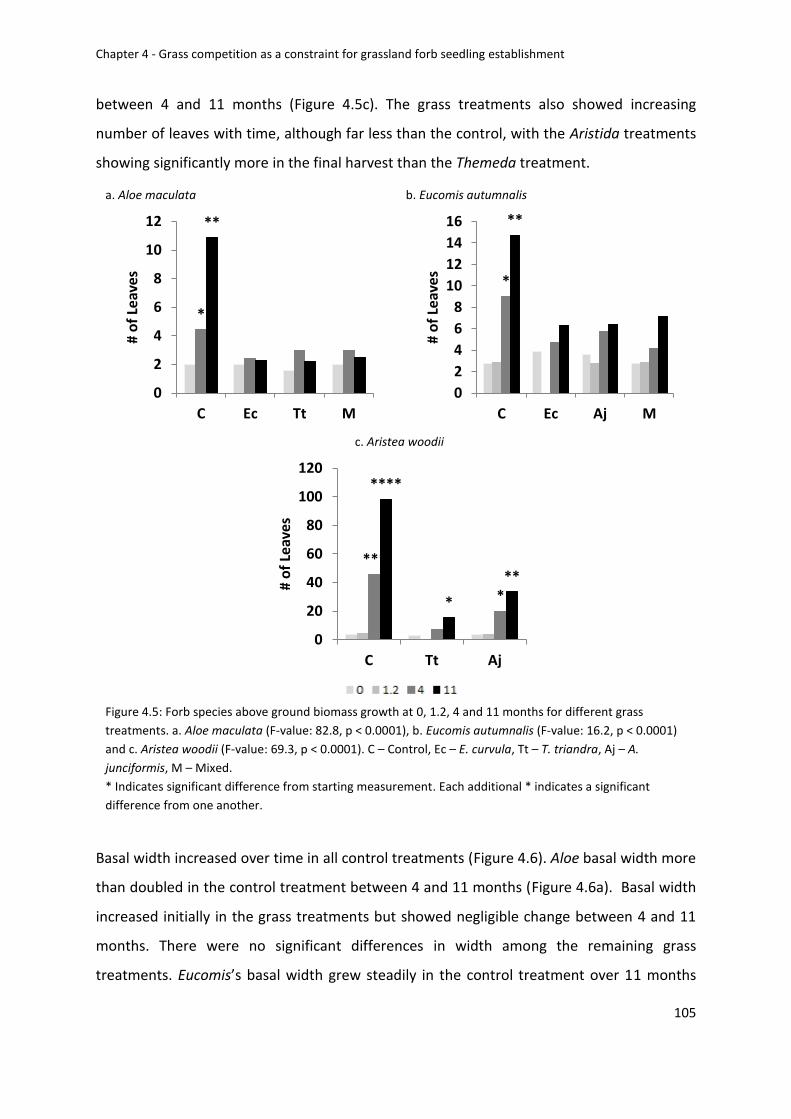
Univers
ity of
Cap
e Tow
n
Chapter 4 - Grass competition as a constraint for grassland forb seedling establishment
105
between 4 and 11 months (Figure 4.5c). The grass treatments also showed increasing
number of leaves with time, although far less than the control, with the Aristida treatments
showing significantly more in the final harvest than the Themeda treatment.
Basal width increased over time in all control treatments (Figure 4.6). Aloe basal width more
than doubled in the control treatment between 4 and 11 months (Figure 4.6a). Basal width
increased initially in the grass treatments but showed negligible change between 4 and 11
months. There were no significant differences in width among the remaining grass
treatments. Eucomis’s basal width grew steadily in the control treatment over 11 months
a. Aloe maculata
*
**
0
2
4
6
8
10
12
C Ec Tt M
# o
f Le
aves
b. Eucomis autumnalis
*
**
0
2
4
6
8
10
12
14
16
C Ec Aj M#
of
Leav
es
c. Aristea woodii
***
*
****
*
**
0
20
40
60
80
100
120
C Tt Aj
# o
f Le
aves
Figure 4.5: Forb species above ground biomass growth at 0, 1.2, 4 and 11 months for different grass
treatments. a. Aloe maculata (F-value: 82.8, p < 0.0001), b. Eucomis autumnalis (F-value: 16.2, p < 0.0001)
and c. Aristea woodii (F-value: 69.3, p < 0.0001). C – Control, Ec – E. curvula, Tt – T. triandra, Aj – A.
junciformis, M – Mixed.
* Indicates significant difference from starting measurement. Each additional * indicates a significant
difference from one another.
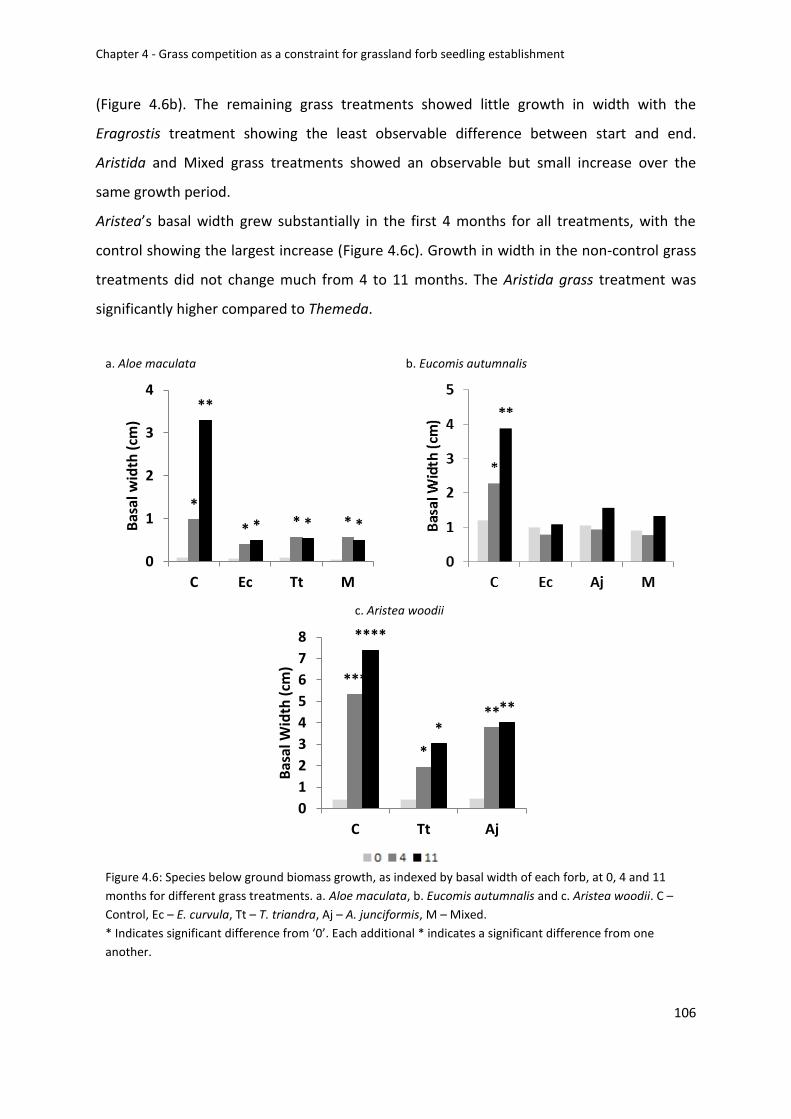
Univers
ity of
Cap
e Tow
n
Chapter 4 - Grass competition as a constraint for grassland forb seedling establishment
106
(Figure 4.6b). The remaining grass treatments showed little growth in width with the
Eragrostis treatment showing the least observable difference between start and end.
Aristida and Mixed grass treatments showed an observable but small increase over the
same growth period.
Aristea’s basal width grew substantially in the first 4 months for all treatments, with the
control showing the largest increase (Figure 4.6c). Growth in width in the non-control grass
treatments did not change much from 4 to 11 months. The Aristida grass treatment was
significantly higher compared to Themeda.
a. Aloe maculata
*
* * *
**
* * *
0
1
2
3
4
C Ec Tt M
Bas
al w
idth
(cm
)
b. Eucomis autumnalis
c. Aristea woodii
***
*
**
****
*
**
0
1
2
3
4
5
6
7
8
C Tt Aj
Bas
al W
idth
(cm
)
Figure 4.6: Species below ground biomass growth, as indexed by basal width of each forb, at 0, 4 and 11
months for different grass treatments. a. Aloe maculata, b. Eucomis autumnalis and c. Aristea woodii. C –
Control, Ec – E. curvula, Tt – T. triandra, Aj – A. junciformis, M – Mixed.
* Indicates significant difference from ‘0’. Each additional * indicates a significant difference from one
another.
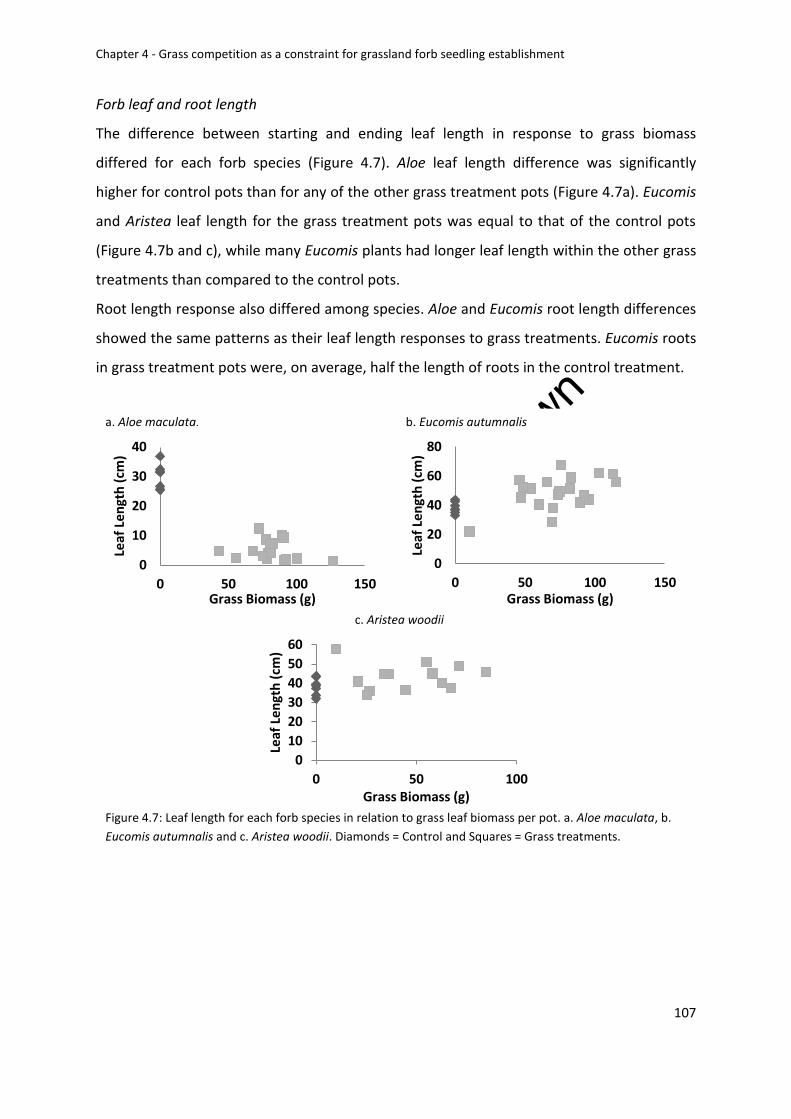
Univers
ity of
Cap
e Tow
n
Chapter 4 - Grass competition as a constraint for grassland forb seedling establishment
107
Forb leaf and root length
The difference between starting and ending leaf length in response to grass biomass
differed for each forb species (Figure 4.7). Aloe leaf length difference was significantly
higher for control pots than for any of the other grass treatment pots (Figure 4.7a). Eucomis
and Aristea leaf length for the grass treatment pots was equal to that of the control pots
(Figure 4.7b and c), while many Eucomis plants had longer leaf length within the other grass
treatments than compared to the control pots.
Root length response also differed among species. Aloe and Eucomis root length differences
showed the same patterns as their leaf length responses to grass treatments. Eucomis roots
in grass treatment pots were, on average, half the length of roots in the control treatment.
a. Aloe maculata.
0
10
20
30
40
0 50 100 150
Leaf
Le
ngt
h (
cm)
Grass Biomass (g)
b. Eucomis autumnalis
0
20
40
60
80
0 50 100 150
Leaf
Le
ngt
h (
cm)
Grass Biomass (g)
c. Aristea woodii
0
10
20
30
40
50
60
0 50 100
Leaf
Le
ngt
h (
cm)
Grass Biomass (g)
Figure 4.7: Leaf length for each forb species in relation to grass leaf biomass per pot. a. Aloe maculata, b.
Eucomis autumnalis and c. Aristea woodii. Diamonds = Control and Squares = Grass treatments.
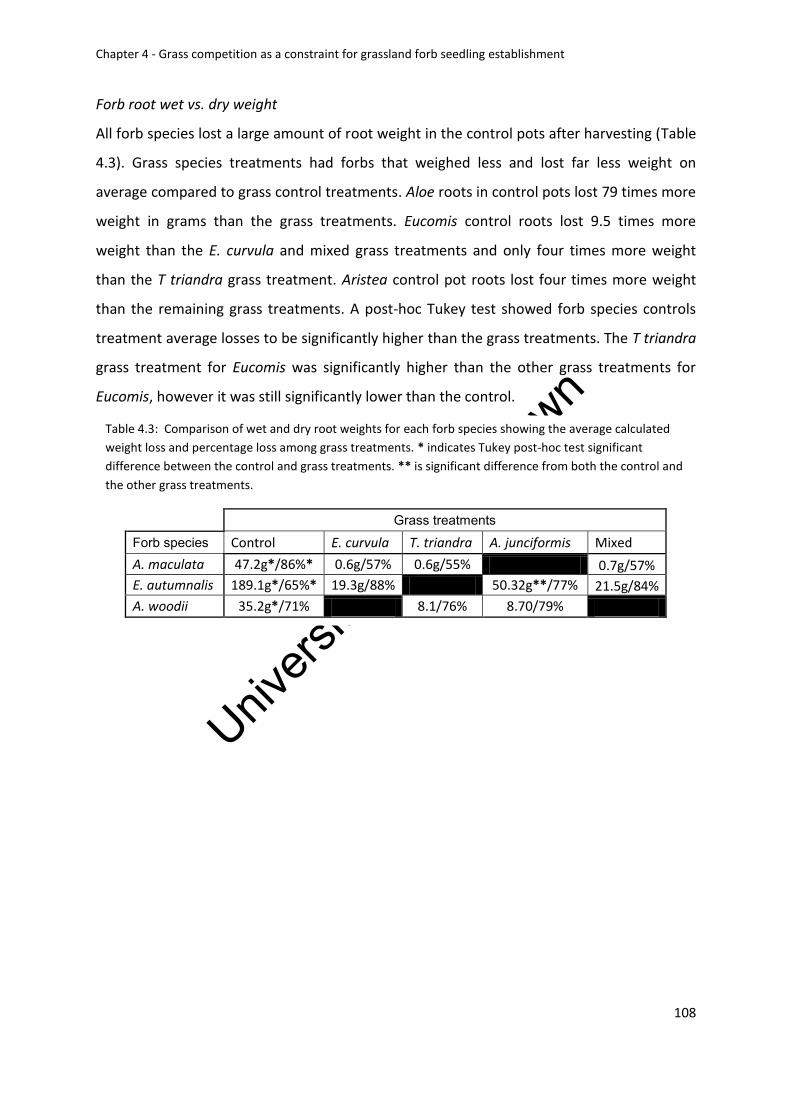
Univers
ity of
Cap
e Tow
n
Chapter 4 - Grass competition as a constraint for grassland forb seedling establishment
108
Forb root wet vs. dry weight
All forb species lost a large amount of root weight in the control pots after harvesting (Table
4.3). Grass species treatments had forbs that weighed less and lost far less weight on
average compared to grass control treatments. Aloe roots in control pots lost 79 times more
weight in grams than the grass treatments. Eucomis control roots lost 9.5 times more
weight than the E. curvula and mixed grass treatments and only four times more weight
than the T triandra grass treatment. Aristea control pot roots lost four times more weight
than the remaining grass treatments. A post-hoc Tukey test showed forb species controls
treatment average losses to be significantly higher than the grass treatments. The T triandra
grass treatment for Eucomis was significantly higher than the other grass treatments for
Eucomis, however it was still significantly lower than the control.
Table 4.3: Comparison of wet and dry root weights for each forb species showing the average calculated
weight loss and percentage loss among grass treatments. * indicates Tukey post-hoc test significant
difference between the control and grass treatments. ** is significant difference from both the control and
the other grass treatments.
Grass treatments
Forb species Control E. curvula T. triandra A. junciformis Mixed
A. maculata 47.2g*/86%* 0.6g/57% 0.6g/55% 0.7g/57%
E. autumnalis 189.1g*/65%* 19.3g/88% 50.32g**/77% 21.5g/84%
A. woodii 35.2g*/71% 8.1/76% 8.70/79%
Univers
ity of
Cap
e Tow
n
Chapter 4 - Grass competition as a constraint for grassland forb seedling establishment
109
Discussion:
This study brings us one step closer to understanding forb-grass dynamics. Investigating how
these two growth forms interact in a South African grassland context can help us better
determine how forbs establish themselves in such a competitive environment. These
findings have important implications for future secondary grassland restoration projects.
This project was completed in a controlled environment giving forb seedlings a ‘head start’
to establish themselves in the pots before the grass competition became an effective
limiting factor. Despite this we were able to see some considerable competitive effects. Left
alone, the three forbs species had limited ability to compete with the grass stands once the
grass species had become established and over shadowed the forbs. All three forbs had
different responses to grass competition.
One of the forbs, E. autumnalis, managed to respond by manipulating its leaf length,
increasing its length in a way which helped it cope better under the high level of grass
competition. Another species, A. woodii was able to use the way it grows to its own benefit,
building on a stable base habit to grow taller and stay at the same level as the grass. These
two species, having being able to take advantage of what light they could, both managed to
establish viable root structures quickly enough to potentially be able to resprout after a fire.
Thus they would be able to take advantage of the reduced grass competition. In contrast A.
maculata was unable to respond to the grass competition and remained the same size
throughout the experiment. In a grassland context, had this project continued for another
year, A. maculata would need a defoliation event, such as fire, for its continued survival.
However it is unlikely that these plants would have survived a fire after being restricted so
heavily by grass competition.
Although the effect of grass competition is evident for all grass treatments, we found some
evidence that indicates forbs can respond to different level of grass species
competitiveness. Grasses like A. junciformis, or even a mix of species, could be better for
facilitating the forb species recovery.
Univers
ity of
Cap
e Tow
n
Chapter 4 - Grass competition as a constraint for grassland forb seedling establishment
110
The experiment was not designed to identify if shading or root competition plays more of a
role in limiting forb seedling growth. We do know that grassland forbs are shade intolerant
and can be lost from the system if shaded out for too long (Uys et al. 2004). In my study,
many forb seedlings managed to establish some root stock. It is possible that below ground
root competition with grasses would play a more important restricting role in the initial
germination of seed and their establishment into seedlings rather than once forbs have
matured.
Forbs in control plots were able to take advantage of the lack of grass competition by being
able to partition more growth to their root structure while still having a substantial above
ground biomass. Some controls even showed evidence of vegetative preproduction with off
-shoots stemming from the original roots which produced stems. Not only could they take
up more water, but they managed to accumulate far more carbon in the root stock. This
process was hampered by the presence of grass species, although forb species were
affected differently.
Above ground adult grassland forbs are not like full grown adult savanna trees, they are
more similar to resprouting adult trees still below the fire trap. However, unlike trees, they
do not need to escape. Both growth forms require seedlings to establish for continued
survival. Unlike savanna trees, grassland forbs do not seem to put much effort into
recruitment and appear to rely largely on persisting within the system utilising their ability
to store carbon beneath the ground (Zaloumis & Bond 2011). Grasslands produce a thick
mesh of grass roots under the soil and forbs have to survive frequent natural defoliation
events. Poor forb recruitment and long term persistence could be a response to these
environmental pressures as seedling recruitment becomes very difficult even under optimal
conditions.
Thus restoration by simply throwing forb seeds into secondary grassland is not going to
encourage successful forb species establishment. This project was also undertaken in
favourable conditions, with potting soil, sufficient water and within a greenhouse to all
simulate perfect growing conditions. How the results would change within a field
Univers
ity of
Cap
e Tow
n
Chapter 4 - Grass competition as a constraint for grassland forb seedling establishment
111
experiment needs to be investigated. One factor would be the already well-established
grassy layer within secondary grasslands. To provide regeneration opportunities for forbs a
competition gap may be required to create the chance for seedlings to establish in the
natural context. Other issues include the fact that the forbs used in this study were easily
available at a nursery because they are good at establishing and the seed is relatively easy
to find in the primary grassland. This is probably not the case for the majority of grassland
forbs.
When recruitment does occur, how does it occur? It would seem that forb seedlings would
need to wait for a recruitment gap. A gap may require a period of time or an episodic
process that results in the reduction of the high density of grass roots in the soil layer and
the above ground grass biomass. The forb seedling would then also require sufficient time
to establish adequate resources below the ground to ensure that it may survive the next fire
or grazing event. This is possibly why some grassland forb species are restricted to rocky
outcrops as their preferred habitat (Pooley, 1998). These outcrops may allow for more of these
‘gaps’ to form as rocks can be barriers to fire spread (Arno & Gruell 1983, Geldenhuys 1994,
Clarke 2002) and could reduce the competitive level of grass by limiting their root
occupancy of soils.
Grass competition poses a serious limitation on restoration efforts in grassland systems.
Further work needs to be done to determine how to create these gaps in a restoration
context. To extrapolate from these results one could set up a project that includes field
studies using a greater variety of species, including some dicot forbs. Different grass
treatments could be used to estimate the potential size of regeneration gaps and if these
sizes differ in secondary and primary grasslands. One would also need to test the effect of
different soil properties on forb establishment between the two.
Univers
ity of
Cap
e Tow
n
Chapter 4 - Grass competition as a constraint for grassland forb seedling establishment
112
Conclusion:
This project has helped confirm that grass competition plays a major role in limiting forb
establishment. Evidence suggests that forbs species can have different responses and
adaptations for coping with grass shading and root competition. If competition is high even
under these favourable glasshouse conditions, we can assume that it would be far more
difficult for forb seedlings to establish in the field. How forbs establish in the field and
identifying the conditions that are favourable to create a gap for them to do so still needs to
be investigated. How this differs between secondary and primary grasslands would also be
important. In a restoration context it would also help to determine which of either soil
properties or grass competition can be more constraining for forbs. Further investigation is
needed into the effect of different native grass species on forb establishment and whether
multi-species grass stands are better for facilitating grassland forb propagation.

Univers
ity of
Cap
e Tow
n
Chapter 4 - Grass competition as a constraint for grassland forb seedling establishment
113
References:
Arno, S. F. and Gruell G. F. 1983. Fire History at the Forest-Grassland Eco tone in
Southwestern Montana. Journal of Range Management. 36: 332-336.
Bond WJ & Parr CL. 2010. Beyond the forest edge: Ecology, diversity and conservation of the
grassy biomes. Biological Conservation. 143: 2395-2404.
Bond, W.J. 2008. What limits trees in C4 grasslands and savannas? Annual review of ecology,
evolution and systematics. 39: 641-593.
Clarke P. J. 2002. Habitat islands in fire-prone vegetation: do landscape features influence
community composition? Journal of Biogeography. 29: 677-684.
Collins, S.L. 1992. Fire Frequency and Community Heterogeneity in Tallgrass Prairie
Vegetation. Ecology. 73: 2001-2006.
Collins, S.L., Knapp, A.K., Briggs, J.M., Blair, J.M. & Steinauer, E.M. 1998. Modulation of
Diversity by Grazing and Mowing in Native Tallgrass Prairie. Science. 280: 745-747.
Cramer, M.D., van Cauter, A. & Bond, W. J. 2010. Growth of N2-fixing African savanna Acacia
species is constrained by below-ground competition with grass. Journal of Ecology. 98:
156-167.
Dickson T. L. & Busby W. H. 2008. Forb species establishment increases with decreased grass
seeding density and with increased forb seeding density in a Northeast Kansas, U.S.
A., experimental prairie restoration. Restoration Ecology. 17: 597-605.
Dwyer, D.D. 1958. Competition between Forbs and Grasses. Journal of Range Management.
11: 115-118.
Fynn, R.W.S., Wragg, P.D., Morris, C.D., Kirkman, K.P. & Naiken, J. 2009. Vegetative traits
predict grass species’ invasiveness and the invasibility of restored grassland. African
Journal of Range & Forage Science. 26: 59–68.
Fynn, R.W.S., Morris, C.D. & Kirkman, K.P. 2010. Plant strategies and trait trade-offs
influence trends in competitive ability along gradients of soil fertility and disturbance.
Journal of Ecology. 93: 384-394.
Fynn, R.W.S., Morris, C.D., Ward, D. & Kirkman, K.P. 2011. Trait–environment relations for
dominant grasses in South African mesic grassland support a general leaf economic
model. Journal of Vegetation Science. 22: 528–540.
Univers
ity of
Cap
e Tow
n
Chapter 4 - Grass competition as a constraint for grassland forb seedling establishment
114
Gillespie, I. G. & Allen, E. B. 2004. Fire and Competition in a Southern California Grassland:
Impacts on the Rare Forb Erodium macrophyllum. Journal of Applied Ecology. 41: 643-
652.
Harris, G.A. 1977. Root Phenology as a Factor of Competition among Grass Seedlings.
Journal of Range Management. 30: 172-177.
Geldenhuys, C. J. 1994. Bergwind Fires and the Location Pattern of Forest Patches in the
Southern Cape Landscape, South Africa. Journal of Biogeography. 21: 49-62.
Knapp, A.K., Smith, M.D., Collins, S.L., Zambatis, N., Peel, M., Emery, S., Wojdak, J., Horner-
Devine, M.C., Biggs, H., Kruger, J., & Andelman, S.J. 2004. Generality in Ecology:
Testing North American Grassland Rules in South African Savannas. Ecological Society
of America. 2: 483-491.
Leach, M.K. & Givnish, T.J. 1996. Ecological Determinants of Species Loss in Remnant
Prairies. Science. 273: 1555-1558.
Lunt, I. D. & Morgan J. W. 1999. Effect of Fire Frequency on Plant Composition at the
Laverton North Grassland Reserve, Victoria. The Victorian Naturalist. 116: 84-90.
Lunt, I. D. 1994. Variation in flower production of nine grassland species with time since fire,
and implications for grassland management and restoration. Pacific Conservation
Biology. 35: 359-366.
Lunt, I. D. 1995. Seed Longevity of Six Native Forbs in a Closed Themeda triandra Grassland.
Australian Journal of Botany. 43: 439-449.
Pooley E. 1998. A Field Guide to Wild Flowers KwaZulu-Natal & the Eastern Region. Natal
Flora Publications Trust, Durban, South Africa.
Morgan, J. W. 1999. Defining grassland fire events and the response of perennial plants to
annual fire in temperate grasslands of south-eastern Australia. Plant Ecology. 144:
127-144.
Olff, H. and Ritchie, M.E. 1998. Effects of herbivores on grassland plant diversity. Trends in
Ecology and Evolution. 13: 261-265.
Overbeck, G. E., Müller, S. C., Fidelisa, A., Pfadenhauera, J., Pillarb, V. D., Blancob, C. C. &
Boldrinic, I. I. 2007. Rogerio Bothd, Eduardo D. Forneckd 2007. Brazil’s neglected
biome: The South Brazilian Campos. Perspectives in Plant Ecology, Evolution and
Systematics. 9: 101-116.
Univers
ity of
Cap
e Tow
n
Chapter 4 - Grass competition as a constraint for grassland forb seedling establishment
115
Overbeck G. E. & Pfadenhauer, J. 2007. Adaptive strategies in burned subtropical grassland
in southern Brazil. Flora. 202: 27-49.
Scholes, R. J. & Archer, S. R. 1997. Tree-Grass Interactions in Savannas. Annual Review of
Ecology and Systematics. 28: 517-544.
Smith, T. M. and Shackleton, S. E. 1988. The effects of shading on the establishment and
growth of Acacia tortilis seedlings. South African journal of Botany. 54: 375-379.
Tedder, M., Morris, C., Fynn, R., & Kirkman, K. 2012. Do soil nutrients mediate competition
between grasses and Acacia saplings? Grassland Science. 58: 238-245.
Uys, R.G., Bond, W.J., and Everson, T.M. 2004. The effect of different fire regimes on plant
diversity in southern African grasslands. Biological Conservation. 118: 489-499.
Zaloumis N.P. and Bond, W. J. 2011. Grassland restoration after afforestation: No direction
home? Austral Ecology. 36: 357–366.
Univers
ity of
Cap
e Tow
n
Chapter 5 - Conclusion
116
Conclusion:
Grasslands have a history of being ignored in a conservation context and as a result have
suffered high levels of transformation and degradation (Matsika 2007, Oudtshoorn et al.
2011). Recent studies have suggested that, far from being recent and resilient, our
grasslands are possibly ancient and fragile systems (Meadows & Linder 1993, Bond & Parr
2010). The first objective of this study was to broaden our knowledge of South African mesic
grassland ecology with a focus on identifying how secondary grasslands differ from primary
grasslands. From a distance, natural and secondary grasslands can easily be confused. It was
hoped that this thesis could improve our understanding of grassland ecology and to identify
the differences between natural and disturbed grassland systems. The second objective was
to apply some of this knowledge to grassland restoration. Grassland restoration is difficult
and often not successful (Lubke et al. 1996, Prober & Thiele 2005). With a better knowledge
of South African grassland ecology we could increase the success of grassland restoration
projects.
What are the key differences between natural and secondary grasslands?
What is a reference grassland?
It is important to identify and sample the reference community that you are trying to
restore (Soc. Eco. Rest. 2004). From this you can determine how disturbance may have
changed the grassland ecology and what elements have been lost. The reference
community can also help you recognise any physical and biological constraints that you are
likely to face when trying to restore secondary grassland (Cole & Lunt 2005, Prober & Theile
2005).
Natural grasslands in South Africa are characterised by low lying, continuous grassy
vegetation cover. Both coastal and upland grasslands support a high diversity of non-grassy
plant growth forms called forbs. In coastal grasslands grass cover can give way to small
patches that are dominated by both grass and geoxylic suffrutice vegetative cover. This is
not as common in upland natural grasslands. The grass layer is usually kept heterogeneous
in height because of the diversity of grass species (Fynn et al. 2010).
Univers
ity of
Cap
e Tow
n
Chapter 5 - Conclusion
117
Secondary grasslands are dominated by a more or less continuous and low lying grassy layer
(Chapter 2). Upland areas in this study had a more homogeneous grass layer than natural
grasslands as they are dominated by mono-specific swards of Eragrostis curvula. When
coastal secondary grasslands were dominated by grass species, they included
Dactyloctenium australis, a lawn grass species, and less commonly Digitaria sp., a bunch
grass species. Often the woody shrub Helichrysum kraussii would also be prevalent in the
landscape. This gave coastal secondary grasslands a less homogenous structure than the
upland secondary grasslands when perceived from a distance. These observations suggest
that it can still be difficult to distinguish secondary from natural vegetation without taking a
closer look.
What are the key differences between natural and secondary grasslands?
Secondary grasslands differed from natural grasslands in several fundamental features
(Chapter 2). Key amongst these were depleted diversity within secondary grasslands with
much lower species richness and a different species composition compared to natural
grasslands. Secondary grasslands were missing resprouting species, a fact that was made
clear when they did not respond to fire disturbance in the same way as natural grasslands.
Secondary grasslands have much lower below ground root biomass, especially of forb
species, contrasting with the strikingly high below-ground biomass of natural grasslands.
Secondary grasslands resultant from afforestation and ploughing disturbances are thus
severely altered both above and below ground.
Do secondary grasslands recover?
There are many factors that can drive succession (Pywell 2002, Soc. Eco. Rest. 2004). It is
obvious that natural succession has failed to restore the composition of the secondary
grasslands in our study, even after 40 years (Chapter 2). In fact, there is little or no
vegetative difference between younger secondary grassland that have been recovering for
up to ten years and older secondary grassland that have been recovering between 15 and
40 years. It would seem that physical limitations related to soil attributes may not be the
main constraint on vegetation recovery. Coastal secondary grassland soil attributes were no
different from natural grasslands, even a year after the pine forests had been excised (James
Univers
ity of
Cap
e Tow
n
Chapter 5 - Conclusion
118
1998). Soil may be more important in upland secondary excised grasslands where a higher
risk of erosion results in the removal of top soil. Ex-arable land however, showed no
difference in the soil attributes tested. The upland soil differences were only briefly
explored in this thesis and soil changes and their effects warrant further study.
Biological constraints, in two respects, may be more important than physico-chemical
constraints in a grassland restoration context. First, grassland forbs are limited by their
reproductive capabilities which do not promote re-colonisation (Overbeck et al. 2007,
Zaloumis & Bond 2011). Grassland forbs live for long periods of time using their
underground storage organs to survive frequent defoliation events and are able to resprout
quickly after a fire and take advantage of the reduced grass biomass. This ability to persist
could have trade-offs with colonising ability because of different patterns of resource
allocation in persisters vs. recruiters (Bond & Midgley 2001). An additional cost to long
persistence by resprouting might be accumulation of genetic load from somatic mutations
leading to reduced viability and seed production (Lamont & Wiens 2003). The poor
colonising ability of highly persistent resprouting species in recovering vegetation has also
been noted before in mine restoration sites in Western Australia (Norman et al. 2006). A
second important biological constraint is that grasses are highly competitive plant growth
forms and can inhibit forb seedling establishment success (Chapter 3).
Can sods be used as a method to re-introduce native grasslands species into secondary
grasslands?
Can we restore South African grasslands?
What are the major constraints towards helping restore our grassland? It is obvious from
Chapter 2 that we need to take a more applied approach to grassland restoration if we want
to achieve any form of restoration at all. Chapter 2 has helped us better define what natural
grassland are and how it can be negatively affected by disturbance. We need to use this
knowledge to develop practical methods and take into account the restoration limitations
that South African grasslands face.
After the disturbance has been removed, restoration aims should include ensuring no
further degradation occurs and attempting to get the system to respond to natural
Univers
ity of
Cap
e Tow
n
Chapter 5 - Conclusion
119
disturbances again (Soc. Eco. Rest. 2004). Topsoil erosion and the encroachment of alien
species are just two examples that restoration efforts must look to avoid. This means that
the first phase of grassland restoration should aim to establish a vegetative layer as quickly
as possible. Unfortunately, to do so may require non-native species or a few fast growing
native species. The second phase is to restore community function and composition by
attempting to re-introduce as many native species, of all plant growth forms, into the
secondary grassland by overcoming their reproductive limitations (Chapter 2).
What restoration methods could we use in South African grasslands?
There are four main methods available to us; re-seeding, hay transfer, individual plant
transfer or sod/turf transfers (Cole & Lunt 2005, Buisson et al. 2006, Oudtshoorn et al. 2011,
Le Stradic 2012). Re-seeding and hay transfer rely on suitable seed availability in the
vegetation when seed or hay is harvested. This may be problematic where forb and grass
species flower throughout the growing season. One would have to decide on which species
to target for such an endeavour. Individual plant transfer could be done, but would require
some intensive man power and there is a transplant risk of damaging the plants. Both
methods may fail where the secondary environment is unfavourable for receiving the plants
or their propagules (Le Stradic 2012). Sod transfer has the benefit of bringing in multiple
species as well as a micro soil environment that is similar to that of the source grassland.
Sod transfer is also a destructive method and would result in the degradation of sod source
sites. All these methods rely on source natural grasslands which may not always be so easy
to locate (Ash et al. 1994, Bradshaw 1997, Le Stradic 2012). The sod transfer was what I
chose to test within the context of this study.
Was the method of introducing mixed species sods into secondary grasslands successful?
Forb and geoxylic suffrutex species were generally difficult to transplant due to their below
ground habits. Some forbs were very large and could not even fit in the sod dimensions,
while even smaller forbs were not always safe from being damaged in the transfers.
Graminoid species transferred successfully. Overall sod transfer was successful with many
species, even forbs, establishing and creating small source pockets of native species within
Univers
ity of
Cap
e Tow
n
Chapter 5 - Conclusion
120
the secondary grasslands. Monitoring these species in the future will inform us if they
continue to survive and spread.
How are grassland forb species affected by grass competition?
How important is grass competition?
In Chapter 2 we found that the majority of secondary grasslands are dominated by one or
two competitive grass species. How these grasses interact with potential native forb species
is important for determining how restricting they can be for introduced seedlings. Grasses
are important competitors for light in un-burnt natural grassland and can result in the
shading out of adult forbs (Fynn et al. 2004, Uys 2006). Grass competition is also an
important factor for limiting tree seedling establishment (Harris 1977, Scholes & Archer
1997, Bond 2008, Cramer et al. 2010) and one can assume that grasses could have the same
limiting interactions with forb seedlings. Forb seedlings, like tree seedlings, may require a
‘gap’ where they are free from grass competition to establish successfully.
Do grassland forb seedlings compete successfully with grass species?
Chapter 3 shows that forb seedlings are severely restricted by grass competition. Faced with
different grass species of differing competiveness, all the forb seedlings were negatively
affected. The forbs that were tested showed that there may be different growth responses
or restrictions to high levels of competition. This includes an inability to grow at all or
adjusting their growth habit to attempt to increase access to resources, such as light.
Univers
ity of
Cap
e Tow
n
Chapter 5 - Conclusion
121
Future research:
Soil attributes in upland grassland systems
The brief exploration of secondary grassland soil characteristics produced some interesting
but mixed results. It would be worth doing a thorough study on the soil differences between
natural and secondary upland grassland and take a closer look at soil succession when
comparing older and younger recovering areas. Soil attributes can play an influential role in
driving vegetative succession (Pywell 2002, Soc. Eco. Rest. 2004). Soil and disturbance
management for secondary grasslands needs to be better understood to optimise for a
natural succession of the environment. If we can confirm Chapter 2’s results that
mountainous secondary grassland soils start relatively unaltered, compared to natural soils,
but then begin to degrade after being left to recover for over 10 years then restoration
methods have to include applied mitigation measures to prevent this.
Lack of natural grassland propagule sources for re-colonisation
South African grasslands show evidence of lacking the typical necessary plant propagule
sources, such as available viable seed, which are generally not common in resprouter
dominated communities (Bond & Midgley 2001, Norman et al. 2006, Chapter 2). This type of
biological limitation can play an important role in limiting restoration activities (Kardol et al.
2008). For South African grasslands reproductive constraints may be the most important
driver influencing grassland restoration success. Resprouting grassland plants offer limited
opportunities for collecting sufficient viable seed for restoration. Further study into forb
reproductive biology could help us determine the most efficient method to collect plant
propagules and how best to use them in restoration projects. As it is entirely possible that
grassland forbs reproduce vegetatively through the expansion of underground storage
organs, we could identify methods that could utilise the cuttings from sampled grassland
species and successfully propagate native species back into secondary grasslands.
Increasing the application scale and practical feasibility of mixed species sod transfer
methods
Developing tools to create species pools in secondary grasslands could help us kick start
natural succession. One potential method is to develop artificial sods that include plants
Univers
ity of
Cap
e Tow
n
Chapter 5 - Conclusion
122
grown in nursery conditions close to secondary grassland sites. Propagules of common forb
species could then be collected from natural grasslands and used as sources to develop
these sods. This, in conjunction with multi-grass species seeding methods, could be effective
in re-establishing native grassland species in recovering areas.
Fire and grazing as management for restoration
Secondary grasslands do not respond to natural disturbances in the same way that intact
natural grassland do. Although the recovered grass layer does resprout relatively quickly,
the vegetation remains sparse for longer periods of time and is more susceptible to soil
erosion. If burning secondary grasslands can promote erosion, does it depend on the time of
year of the burn, or can other methods be used to control invasive grass cover while trying
to establish other native species?
Defining the grassland forb seedling gap
Further experiments into grassland competition and gap creation need to be done in a field
study context. Do gaps in natural and secondary grasslands differ in size? How do soil
attributes and disturbances help or hinder the ability of a forb seedling to utilise a gap? How
do gaps develop in natural grassland and how can one manage for their creation so that
they can be used to help restore secondary grasslands.
Univers
ity of
Cap
e Tow
n
Chapter 5 - Conclusion
123
Can secondary grasslands be restored?
This study has highlighted some key difficulties that restoration ecologists and managers
would face in practically restoring grasslands in South Africa. With a lot of money and effort
you could return the system to some partial state of natural grassland or at least initiate a
more natural succession for the future. If grasslands can recover, they will take decades, if
not centuries, to return to their natural state via succession. There are several methods we
could use to try and establish native species within secondary grasslands to encourage
higher species diversity and the replacement of lost traits. We at least know that grassland
species are transferable. The first phase is to re-establish an effective vegetative layer. Then
we should aim to create an environment that encourages natural forb re-colonisation and a
natural response to natural disturbances. Establishing the vegetative layer is important and
achievable, but returning any diversity and function may be far more difficult than
previously thought.
South African and Brazilian grassy biomes share distinct plant growth forms, geoxylic
suffrutices and persistent forbs with large underground storage organs, that are not
described in the North American Prairies or Australian and the European grasslands (White
1976, Overbeck et al. 2007 , Bond & Parr 2010, Simon & Pennington 2012). In the
restoration of South African grasslands these two growth forms do not easily re-colonise
secondary grasslands and are proving problematic (Zaloumis & Bond 2011, Chapter 2 & 3).
We could expect Brazilian grasslands to then face the same grassland restoration limitations
as South Africa. Is this context unique to South Africa and Brazil when compared to the
global grassland restoration literature? Within a different vegetation type similar constraints
to what Zaloumis and Bond (2010) and Chapter 2 describe in grassland recovery have been
observed during active restoration of resprouting forest species in recovering Australian
Bauxite mines sites (Norman et al. 2006). As restoration ecology becomes more popular
there is ample literature and case studies one can explore before planning a restoration
project. There is even sufficient literature available from Australia and European Grasslands
and North American Prairies (Leach & Givnish 1996, Pärtel et al 1998, Lunt & Morgan 1999,
Prober & Thiele 2005, Buisson et al. 2006, Dickson & Busby 2008, Kardol et al. 2008,
Piqueray et al. 2011 to mention a few).
Univers
ity of
Cap
e Tow
n
Chapter 5 - Conclusion
124
When attempted, grassland restoration techniques focus on re-introducing single or several
plant species through re-seeding, hay transfer, individual plant transplanting and turf
transplanting methods. How universal are these methods when they are applied to South
African grasslands? The re-seeding and hay transfer methods are the most common and
have been used in our upland grasslands with some success in establishing more preferable
grazing vegetation (Mentis 1999, Oudtshoorn et al. 2011). Currently, however, they hold
little practical opportunities in restoring diverse South African grassland. As far as we know
our South African mesic grasslands have no persistent seed bank, feature very little available
viable seed and there have no annuals. Transplanting individual plants, whether seeded or
from natural veld, and transplanting tufts or sods, so far also prove to be problematic in a
South African context.
South African grasslands are fascinating and diverse systems with much work still to be done
in understanding their ecology. Our understanding of South African grassland plant
biological traits is still limited and there is a lot of potential for further exploration. At the
same time however, work is needed to investigate practical grassland restoration methods
in South African grasslands. Although grassland restoration application may be limited in
South Africa for now, we can still apply our current knowledge into increasing the success of
basic grassland rehabilitation to prevent further landscape degradation. Until we can
successfully perform large scale restoration projects that return a large proportion of
grassland diversity and function we can still promote the value of the natural grassland
systems that we have left. This makes the conservation of our remaining and fragmented
grasslands a priority.
Univers
ity of
Cap
e Tow
n
Chapter 5 - Conclusion
125
References:
Ash H.J., Gremmell R.P. & Bradshaw A.D. 1994. The introduction of native plant species on
industrial waste heaps : a test of immigration and other factors affecting succession
primary. Journal of Applied Ecology. 31: 74-84.
Bond, W. J. & Midgley J. M. 2001. The persistence niche: ecology of sprouting in woody
plants. Trends Ecology and Evolution. 16: 45-51.
Bond, W.J. 2008. What limits trees in C4 grasslands and savannas? Annual review of ecology,
evolution and systematics. 39: 641-593.
Bond, WJ & Parr CL. 2010. Beyond the forest edge: Ecology, diversity and conservation of
the grassy biomes. Biological Conservation. 143: 2395-2404.
Buisson, E., Holl, K. D., Anderson, S., Corcket, E., Hayes, G. F., Torre, F., Peteers, A. & Dutoit,
T. 2006. Effect of seed source, topsoil removal, and plant neighbor removal on
restoring California coastal prairies. Restoration Ecology. 14: 569-577.
Bradshaw A.D. 1997. Restoration of mined lands - using natural processes. Ecological
Engineering. 8: 255-269.
Cole, I. & Lunt I.D. 2005. Restoring Kangaroo Grass (Themeda triandra) to grassland and
woodland understoreys: a review of establishment requirements and restoration
exercises in south-east Australia. Ecological Management and Restoration. 6: 28-33.
Cramer, M.D., van Cauter, A. & Bond, W. J. 2010. Growth of N2-fixing African savanna Acacia
species is constrained by below-ground competition with grass. Journal of Ecology. 98:
156-167.
Dickson T. L. & Busby W. H. 2008. Forb species establishment increases with decreased grass
seeding density and with increased forb seeding density in a Northeast Kansas, U.S.
experimental prairie restoration. Restoration Ecology. 17: 597-605.
Fynn, R.W. S., Morris C. D., Edwards T. J. & Skarpe C. 2004. Effect of burning and mowing on
grass and forb diversity in a long-term grassland experiment. Applied Vegetation
Science. 7: 1-10.
Fynn, R.W.S., Morris, C.D. & Kirkman, K.P. 2010. Plant strategies and trait trade-offs
influence trends in competitive ability along gradients of soil fertility and disturbance.
Journal of Ecology. 93: 384-394.
Univers
ity of
Cap
e Tow
n
Chapter 5 - Conclusion
126
Harris, G.A. 1977. Root Phenology as a Factor of Competition among Grass Seedlings.
Journal of Range Management. 30: 172-177.
James, B. M. 1998. Unpublished Data: vegetation succession and soil properties following
the removal of pine plantations on the eastern shores of Lake St. Lucia, South Africa.
Unpublished MSc thesis. In: Department of Range and Forage Resource p. 181.
University of Natal, Pietermaritzburg.
Kardol, P., Wal, A. V. D., Bezemer, T. M., Boer, W. D., Duyts, H., Holtkamp, R., & Putten, W.
H. 2008. Restoration of species-rich grasslands on ex-arable land: Seed addition
outweighs soil fertility reduction. Biological conservation: 2208-2217.
Lamont, B. B., & Wiens, D. 2003. Are seed set and speciation rates always low among
species that resprout after fire, and why? Evolutionary Ecology. 17: 277-292.
Le Stradic, S. 2012. Unpublished Data: Composition, phenology and restoration of campo
rupestre mountain grasslands - Brazil. Unpublished PhD thesis. In: Laboratório de
Ecologia Evolutiva e Biodiversidade, Resource p. 87. Institut Méditerranéen de
Biodiversité et d’Écologie, Brazil.
Leach M. K. & Givnish T. J. 1996. Ecological determinants of species loss in remnant prairies.
Science. 273: 1555-1558.
Lubke, R. A., Avis A. M. & Moll J. B. 1996. Post-mining rehabilitation of coastal sand dunes in
Zululand South Africa. Landscape Urban Planning. 34: 335-345.
Lunt D. L. & Morgan J.W. 1999. Effect of fire frequency on plant composition at the Laverton
North Grassland Reserve,Victoria. Victorian Naturalist. 116: 84-90.
Matsika, R. 2007. Unpublished Data: Land-cover Change: Threats to the grassland Biome of
South Africa. Unpublished MSc thesis. Pg. 131. University of Witwatersrand,
Johannesburg.
Meadows, M.E. & Linder, H.P. 1993. A palaeoecological perspective on the origin of
Afromontane grasslands. Journal of Biogeography. 20: 345-355.
Mentis, M. T. 1999. Diagnosis of the rehabilitation of opencast coal mines on the Highveld of
South Africa. South African journal of science. 95: 210-215.
Norman, M. A., Koch J. M., Grant C. D., Morald T. K. & Ward S. C. 2006. Vegetation
succession after bauxite mining in Western Australia. Restoration Ecology. 14: 278-
288.
Univers
ity of
Cap
e Tow
n
Chapter 5 - Conclusion
127
Overbeck, G. E. Müller, S. C. Fidelis, A., Pfadenhauer, J. Pillar, V. D., Blanco, C. C. & Forneck,
E. D. 2007. Brazil's neglected biome: The South Brazilian Campos: Perspectives in
Plant Ecology, Evolution and Systematics. 9: 101-116.
Pärtel, M., Kalamees, R., Zobel, M., & Rosén, E. 1998. Restoration of species-rich limestone
grassland communities from overgrown land: the importance of propagule
availability. Ecological Engineering. 10: 275-286.
Piqueray, J., Bottin, G., Delescaille, L. M., Bisteau, E., Colinet, G., & Mahy, G. 2011. Rapid
restoration of a species-rich ecosystem assessed from soil and vegetation indicators:
the case of calcareous grasslands restored from forest stands. Ecological Indicators,
11: 724-733.
Prober, S. M. & Thiele, K. R. 2005. Restoring Australia’s temperate grasslands and grassy
woodlands: integrating function and diversity. Ecological Management Restoration.
6: 16-27.
Pywell, R. F., Bullock J. M. & Hopkins, A. 2002. Restoration of species-rich grassland on
arable land: assessing the limiting processes using a multi-site experiment. Journal
Applied Ecology. 39: 294-309.
Scholes, R. J. & Archer, S. R. 1997. Tree-Grass Interactions in Savannas. Annual Review of
Ecology and Systematics. 28: 517-544.
Simon, M. F., & Pennington, T. 2012. Evidence for adaptation to fire regimes in the tropical
savannas of the Brazilian Cerrado. International Journal of Plant Sciences. 173: 711-
723.
Society for Ecological Restoration International Science Policy Working Group (Soc. Eco.
Rest.) 2004. The SER International Primer on Ecological Restoration. www.ser.org &
Tucson: Society for Ecological Restoration International.
Uys, R.G. 2006. Unpublished data: Patterns of plants diversity and their management across
South African rangelands. Unpublished PhD thesis. In: Department of Botany.
University of Cape Town, Cape Town.
Van Oudtshoorn, F. V., Brown, L., & Kellner, K. 2011. The effect of reseeding methods on
secondary succession during cropland restoration in the Highveld region of South
Africa. African Journal of Range & Forage Science. 28: 1-8.
Univers
ity of
Cap
e Tow
n
Chapter 5 - Conclusion
128
Wassenaar T. D., van Aarde R. J., Pimm S. L. & Ferreira S. M. 2005. Community convergence
in disturbed subtropical dune forests. Ecology. 86: 655–666.
White, F. 1976. The underground forests of Africa: a preliminary review. Gardens Bulletin,
Singapore. 29: 57-71.
Zaloumis, N.P. and Bond, W. J. 2011. Grassland restoration after afforestation: No direction
home? Austral Ecology. 36: 357–366.
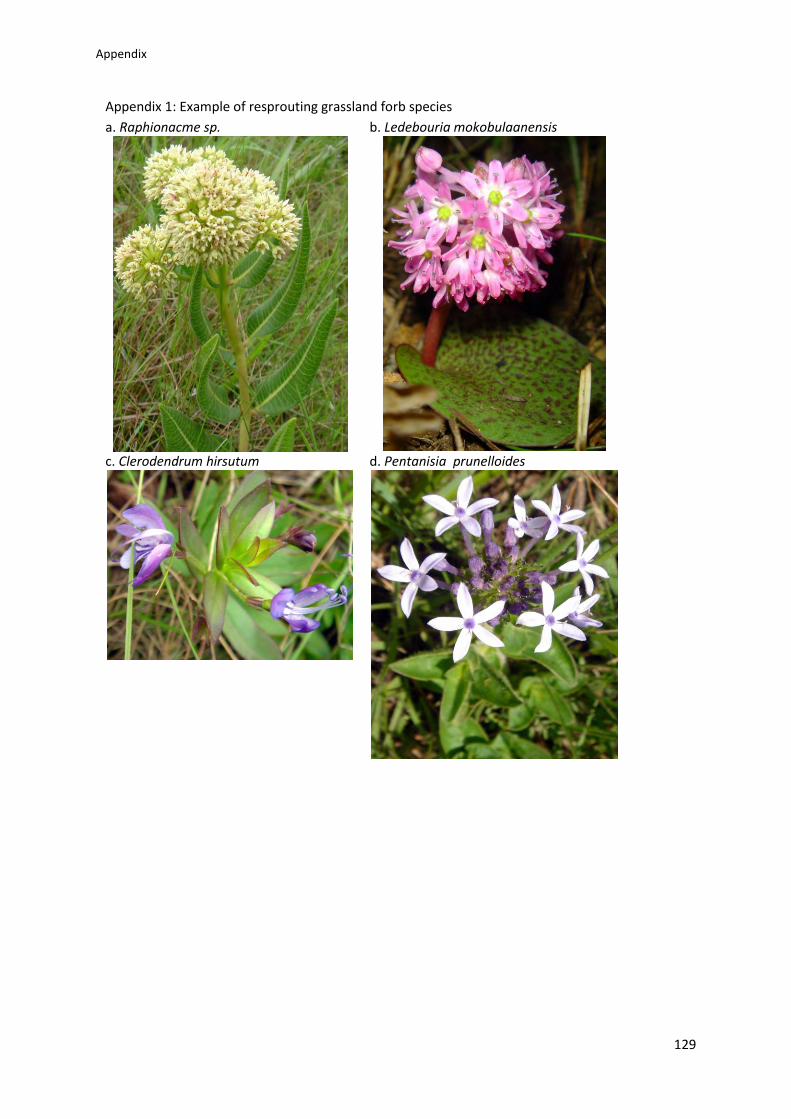
Univers
ity of
Cap
e Tow
n
Appendix
129
Appendix 1: Example of resprouting grassland forb species
a. Raphionacme sp.
b. Ledebouria mokobulaanensis
c. Clerodendrum hirsutum
d. Pentanisia prunelloides
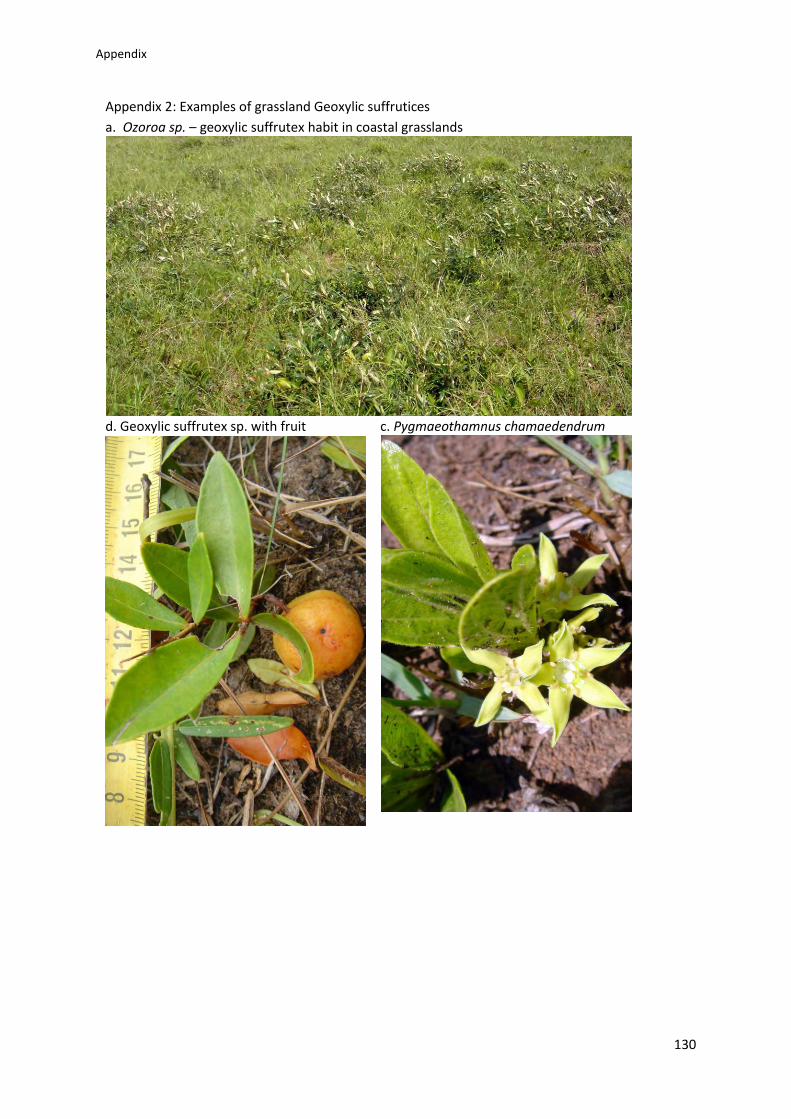
Univers
ity of
Cap
e Tow
n
Appendix
130
Appendix 2: Examples of grassland Geoxylic suffrutices
a. Ozoroa sp. – geoxylic suffrutex habit in coastal grasslands
d. Geoxylic suffrutex sp. with fruit
c. Pygmaeothamnus chamaedendrum
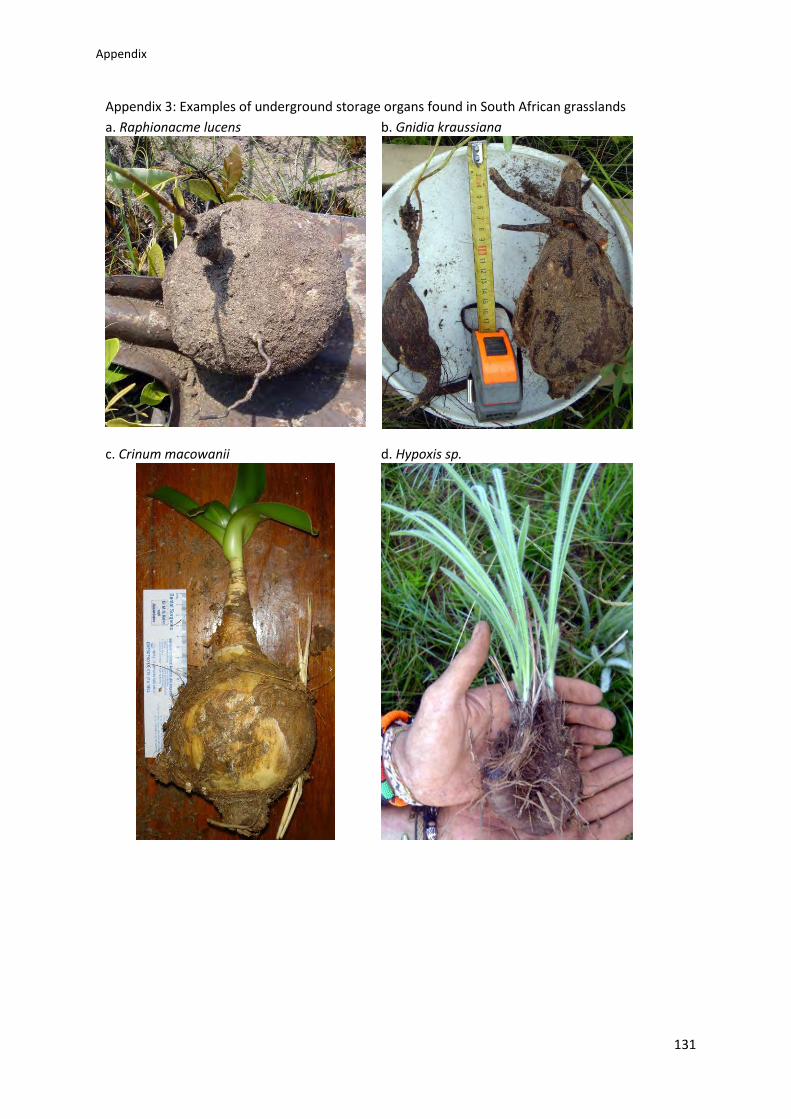
Univers
ity of
Cap
e Tow
n
Appendix
131
Appendix 3: Examples of underground storage organs found in South African grasslands
a. Raphionacme lucens
b. Gnidia kraussiana
c. Crinum macowanii
d. Hypoxis sp.
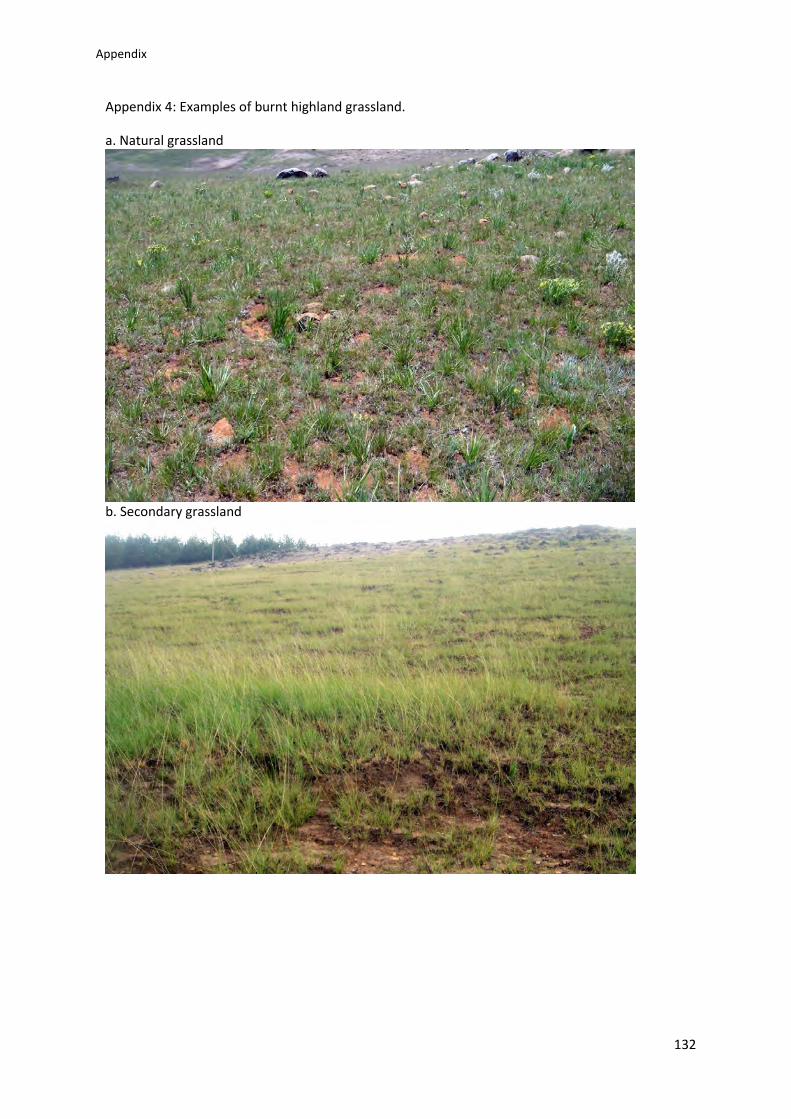
Univers
ity of
Cap
e Tow
n
Appendix
132
Appendix 4: Examples of burnt highland grassland.
a. Natural grassland
b. Secondary grassland
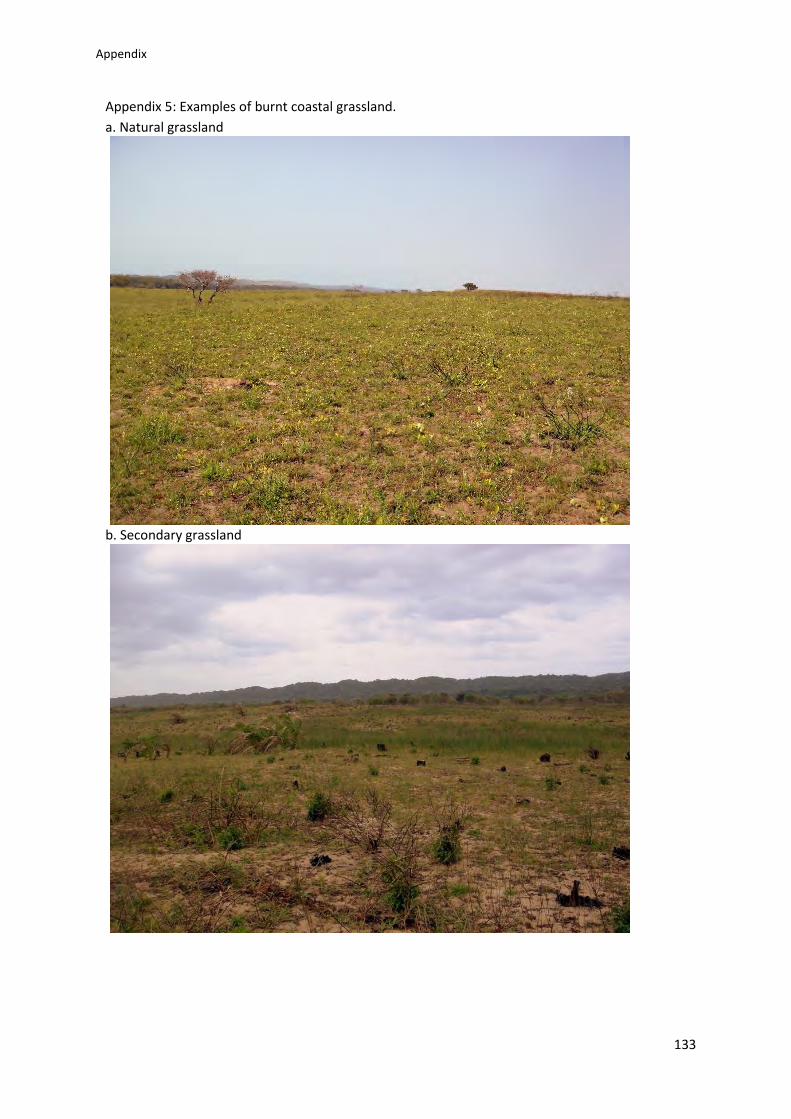
Univers
ity of
Cap
e Tow
n
Appendix
133
Appendix 5: Examples of burnt coastal grassland.
a. Natural grassland
b. Secondary grassland
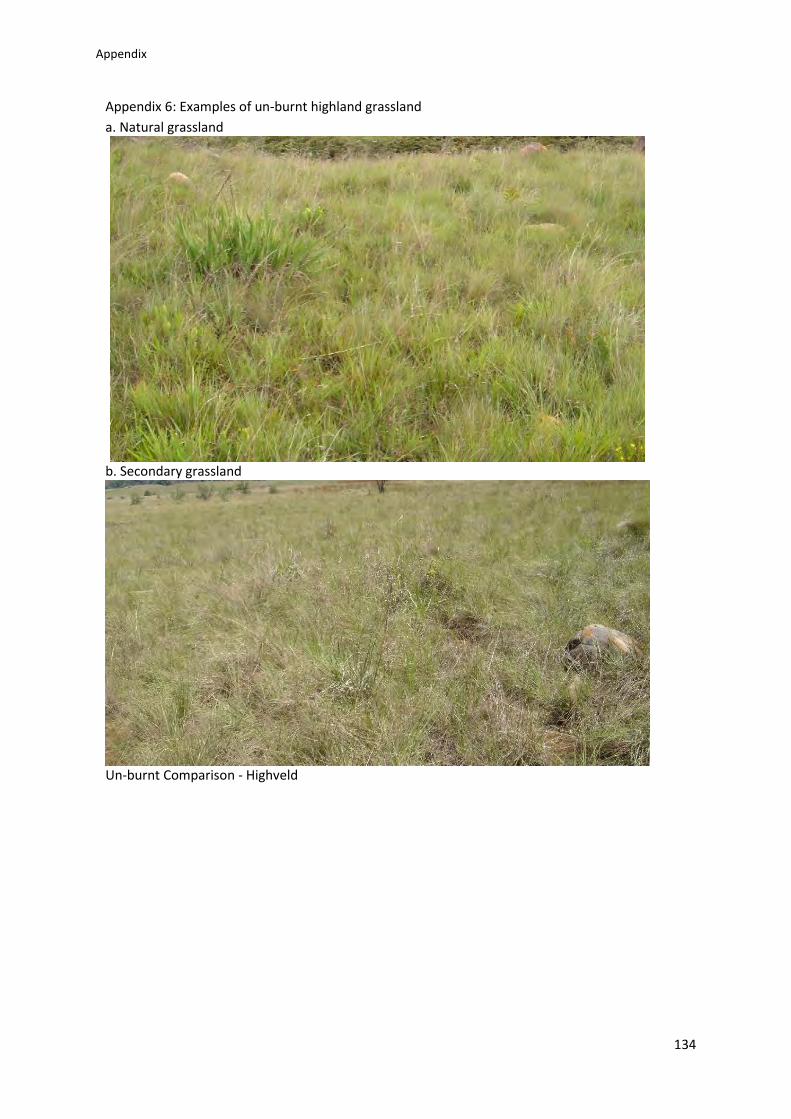
Univers
ity of
Cap
e Tow
n
Appendix
134
Appendix 6: Examples of un-burnt highland grassland
a. Natural grassland
b. Secondary grassland
Un-burnt Comparison - Highveld
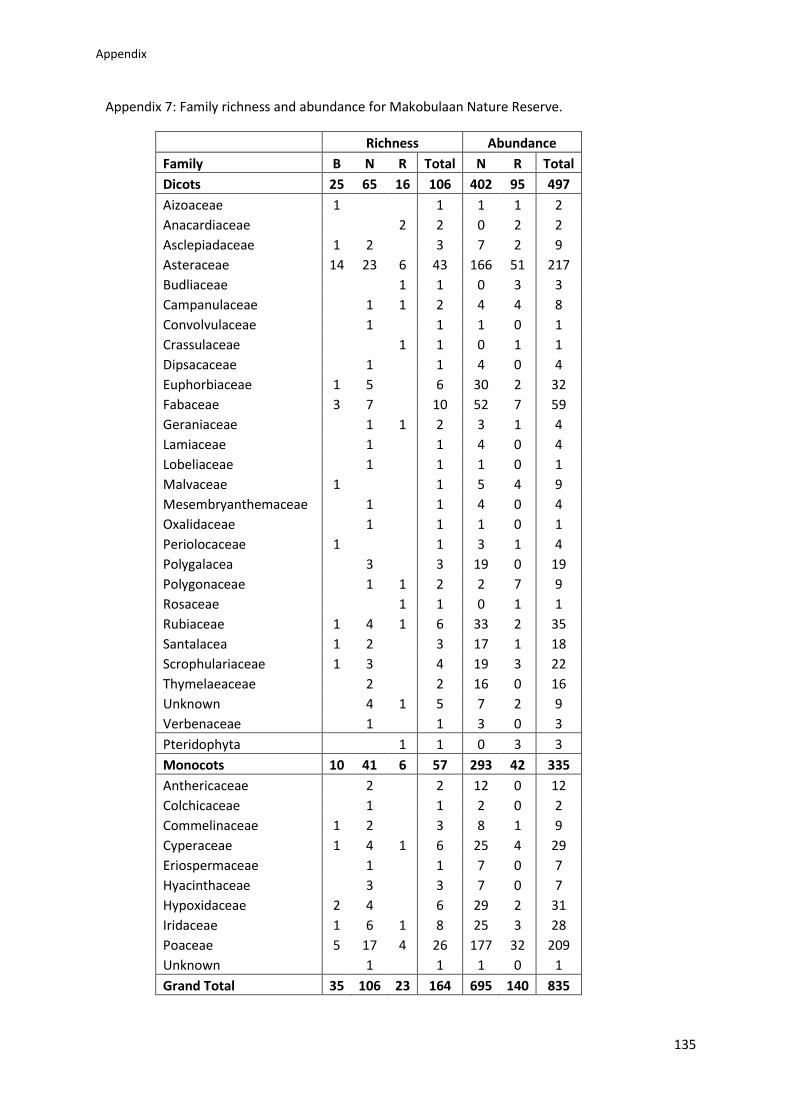
Univers
ity of
Cap
e Tow
n
Appendix
135
Appendix 7: Family richness and abundance for Makobulaan Nature Reserve.
Richness Abundance
Family B N R Total N R Total
Dicots 25 65 16 106 402 95 497
Aizoaceae 1
1 1 1 2
Anacardiaceae
2 2 0 2 2
Asclepiadaceae 1 2
3 7 2 9
Asteraceae 14 23 6 43 166 51 217
Budliaceae
1 1 0 3 3
Campanulaceae 1 1 2 4 4 8
Convolvulaceae 1
1 1 0 1
Crassulaceae
1 1 0 1 1
Dipsacaceae 1
1 4 0 4
Euphorbiaceae 1 5
6 30 2 32
Fabaceae 3 7
10 52 7 59
Geraniaceae 1 1 2 3 1 4
Lamiaceae 1
1 4 0 4
Lobeliaceae 1
1 1 0 1
Malvaceae 1
1 5 4 9
Mesembryanthemaceae 1
1 4 0 4
Oxalidaceae 1
1 1 0 1
Periolocaceae 1
1 3 1 4
Polygalacea 3
3 19 0 19
Polygonaceae 1 1 2 2 7 9
Rosaceae
1 1 0 1 1
Rubiaceae 1 4 1 6 33 2 35
Santalacea 1 2
3 17 1 18
Scrophulariaceae 1 3
4 19 3 22
Thymelaeaceae 2
2 16 0 16
Unknown 4 1 5 7 2 9
Verbenaceae 1
1 3 0 3
Pteridophyta 1 1 0 3 3
Monocots 10 41 6 57 293 42 335
Anthericaceae 2
2 12 0 12
Colchicaceae 1
1 2 0 2
Commelinaceae 1 2
3 8 1 9
Cyperaceae 1 4 1 6 25 4 29
Eriospermaceae 1
1 7 0 7
Hyacinthaceae 3
3 7 0 7
Hypoxidaceae 2 4
6 29 2 31
Iridaceae 1 6 1 8 25 3 28
Poaceae 5 17 4 26 177 32 209
Unknown 1
1 1 0 1
Grand Total 35 106 23 164 695 140 835
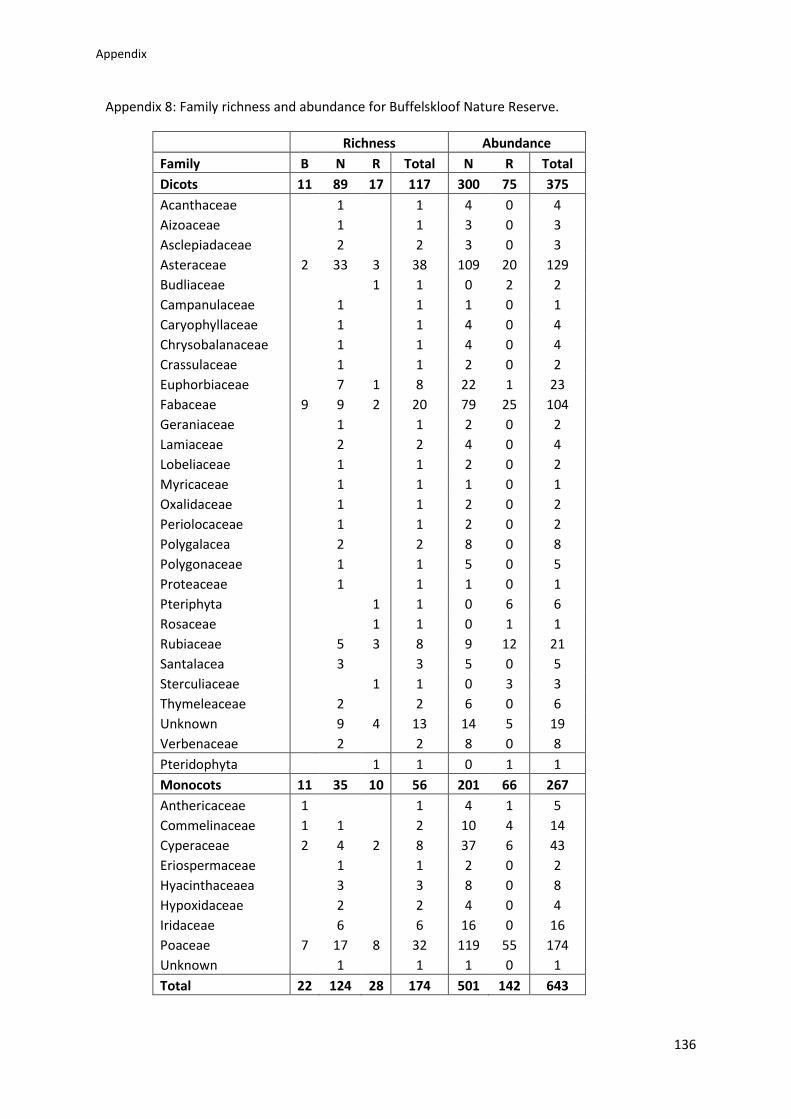
Univers
ity of
Cap
e Tow
n
Appendix
136
Appendix 8: Family richness and abundance for Buffelskloof Nature Reserve.
Richness Abundance
Family B N R Total N R Total
Dicots 11 89 17 117 300 75 375
Acanthaceae 1 1 4 0 4
Aizoaceae 1 1 3 0 3
Asclepiadaceae 2 2 3 0 3
Asteraceae 2 33 3 38 109 20 129
Budliaceae
1 1 0 2 2
Campanulaceae 1 1 1 0 1
Caryophyllaceae 1 1 4 0 4
Chrysobalanaceae 1 1 4 0 4
Crassulaceae 1 1 2 0 2
Euphorbiaceae 7 1 8 22 1 23
Fabaceae 9 9 2 20 79 25 104
Geraniaceae 1 1 2 0 2
Lamiaceae 2 2 4 0 4
Lobeliaceae 1 1 2 0 2
Myricaceae 1 1 1 0 1
Oxalidaceae 1 1 2 0 2
Periolocaceae 1 1 2 0 2
Polygalacea 2 2 8 0 8
Polygonaceae 1 1 5 0 5
Proteaceae 1 1 1 0 1
Pteriphyta
1 1 0 6 6
Rosaceae
1 1 0 1 1
Rubiaceae 5 3 8 9 12 21
Santalacea 3 3 5 0 5
Sterculiaceae
1 1 0 3 3
Thymeleaceae 2 2 6 0 6
Unknown 9 4 13 14 5 19
Verbenaceae 2 2 8 0 8
Pteridophyta 1 1 0 1 1
Monocots 11 35 10 56 201 66 267
Anthericaceae 1
1 4 1 5
Commelinaceae 1 1 2 10 4 14
Cyperaceae 2 4 2 8 37 6 43
Eriospermaceae 1 1 2 0 2
Hyacinthaceaea 3 3 8 0 8
Hypoxidaceae 2 2 4 0 4
Iridaceae 6 6 16 0 16
Poaceae 7 17 8 32 119 55 174
Unknown 1 1 1 0 1
Total 22 124 28 174 501 142 643
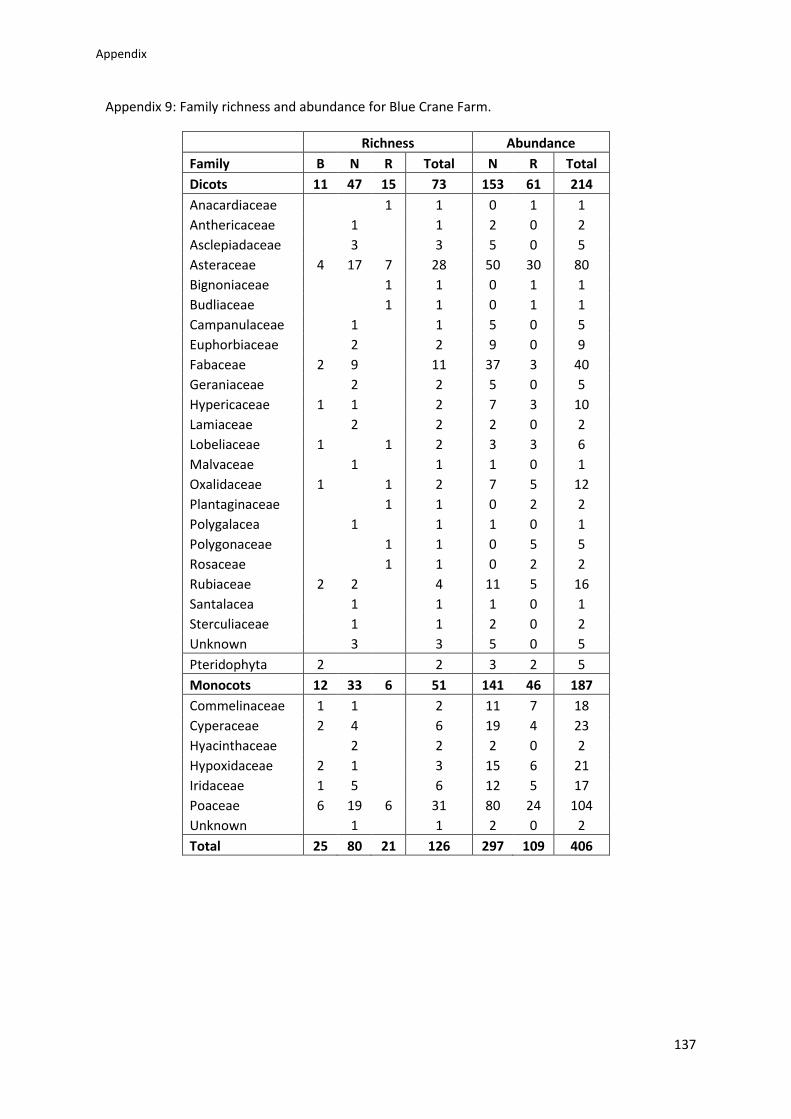
Univers
ity of
Cap
e Tow
n
Appendix
137
Appendix 9: Family richness and abundance for Blue Crane Farm.
Richness Abundance
Family B N R Total N R Total
Dicots 11 47 15 73 153 61 214
Anacardiaceae
1 1 0 1 1
Anthericaceae 1 1 2 0 2
Asclepiadaceae 3 3 5 0 5
Asteraceae 4 17 7 28 50 30 80
Bignoniaceae
1 1 0 1 1
Budliaceae
1 1 0 1 1
Campanulaceae 1 1 5 0 5
Euphorbiaceae 2 2 9 0 9
Fabaceae 2 9 11 37 3 40
Geraniaceae 2 2 5 0 5
Hypericaceae 1 1 2 7 3 10
Lamiaceae 2 2 2 0 2
Lobeliaceae 1
1 2 3 3 6
Malvaceae 1 1 1 0 1
Oxalidaceae 1
1 2 7 5 12
Plantaginaceae
1 1 0 2 2
Polygalacea 1 1 1 0 1
Polygonaceae
1 1 0 5 5
Rosaceae
1 1 0 2 2
Rubiaceae 2 2 4 11 5 16
Santalacea 1 1 1 0 1
Sterculiaceae 1 1 2 0 2
Unknown 3 3 5 0 5
Pteridophyta 2 2 3 2 5
Monocots 12 33 6 51 141 46 187
Commelinaceae 1 1 2 11 7 18
Cyperaceae 2 4 6 19 4 23
Hyacinthaceae 2 2 2 0 2
Hypoxidaceae 2 1 3 15 6 21
Iridaceae 1 5 6 12 5 17
Poaceae 6 19 6 31 80 24 104
Unknown 1 1 2 0 2
Total 25 80 21 126 297 109 406
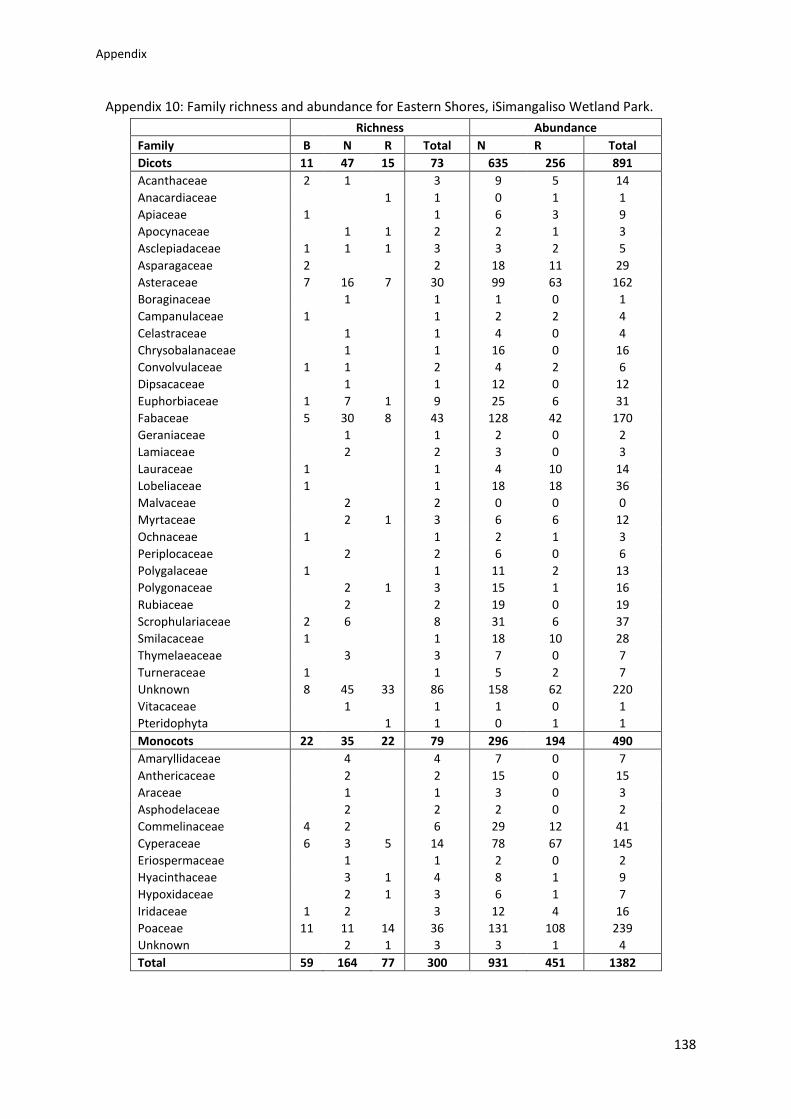
Univers
ity of
Cap
e Tow
n
Appendix
138
Appendix 10: Family richness and abundance for Eastern Shores, iSimangaliso Wetland Park.
Richness Abundance
Family B N R Total N R Total
Dicots 11 47 15 73 635 256 891
Acanthaceae 2 1 3 9 5 14
Anacardiaceae
1 1 0 1 1
Apiaceae 1
1 6 3 9
Apocynaceae 1 1 2 2 1 3
Asclepiadaceae 1 1 1 3 3 2 5
Asparagaceae 2
2 18 11 29
Asteraceae 7 16 7 30 99 63 162
Boraginaceae 1 1 1 0 1
Campanulaceae 1
1 2 2 4
Celastraceae 1 1 4 0 4
Chrysobalanaceae 1 1 16 0 16
Convolvulaceae 1 1 2 4 2 6
Dipsacaceae 1 1 12 0 12
Euphorbiaceae 1 7 1 9 25 6 31
Fabaceae 5 30 8 43 128 42 170
Geraniaceae 1 1 2 0 2
Lamiaceae 2 2 3 0 3
Lauraceae 1
1 4 10 14
Lobeliaceae 1
1 18 18 36
Malvaceae 2 2 0 0 0
Myrtaceae 2 1 3 6 6 12
Ochnaceae 1
1 2 1 3
Periplocaceae 2 2 6 0 6
Polygalaceae 1
1 11 2 13
Polygonaceae 2 1 3 15 1 16
Rubiaceae 2 2 19 0 19
Scrophulariaceae 2 6 8 31 6 37
Smilacaceae 1
1 18 10 28
Thymelaeaceae 3 3 7 0 7
Turneraceae 1
1 5 2 7
Unknown 8 45 33 86 158 62 220
Vitacaceae 1 1 1 0 1
Pteridophyta
1 1 0 1 1
Monocots 22 35 22 79 296 194 490
Amaryllidaceae 4 4 7 0 7
Anthericaceae 2 2 15 0 15
Araceae 1 1 3 0 3
Asphodelaceae 2 2 2 0 2
Commelinaceae 4 2 6 29 12 41
Cyperaceae 6 3 5 14 78 67 145
Eriospermaceae 1 1 2 0 2
Hyacinthaceae 3 1 4 8 1 9
Hypoxidaceae 2 1 3 6 1 7
Iridaceae 1 2 3 12 4 16
Poaceae 11 11 14 36 131 108 239
Unknown 2 1 3 3 1 4
Total 59 164 77 300 931 451 1382
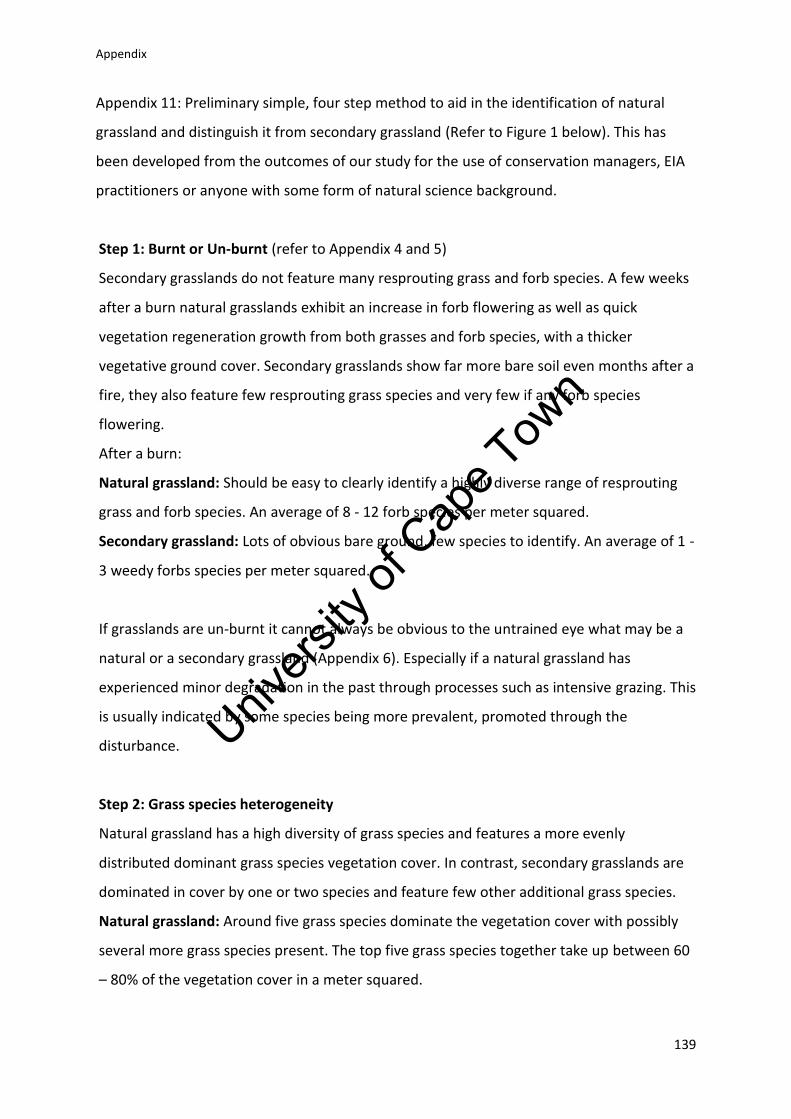
Univers
ity of
Cap
e Tow
n
Appendix
139
Appendix 11: Preliminary simple, four step method to aid in the identification of natural
grassland and distinguish it from secondary grassland (Refer to Figure 1 below). This has
been developed from the outcomes of our study for the use of conservation managers, EIA
practitioners or anyone with some form of natural science background.
Step 1: Burnt or Un-burnt (refer to Appendix 4 and 5)
Secondary grasslands do not feature many resprouting grass and forb species. A few weeks
after a burn natural grasslands exhibit an increase in forb flowering as well as quick
vegetation regeneration growth from both grasses and forb species, with a thicker
vegetative ground cover. Secondary grasslands show far more bare soil even months after a
fire, they also feature few resprouting grass species and very few if any forb species
flowering.
After a burn:
Natural grassland: Should be easy to clearly identify a highly diverse range of resprouting
grass and forb species. An average of 8 - 12 forb species per meter squared.
Secondary grassland: Lots of obvious bare ground, few species to identify. An average of 1 -
3 weedy forbs species per meter squared.
If grasslands are un-burnt it cannot always be obvious to the untrained eye what may be a
natural or a secondary grassland (Appendix 6). Especially if a natural grassland has
experienced minor degradation in the past through processes such as intensive grazing. This
is usually indicated by some species being more prevalent, promoted through the
disturbance.
Step 2: Grass species heterogeneity
Natural grassland has a high diversity of grass species and features a more evenly
distributed dominant grass species vegetation cover. In contrast, secondary grasslands are
dominated in cover by one or two species and feature few other additional grass species.
Natural grassland: Around five grass species dominate the vegetation cover with possibly
several more grass species present. The top five grass species together take up between 60
– 80% of the vegetation cover in a meter squared.
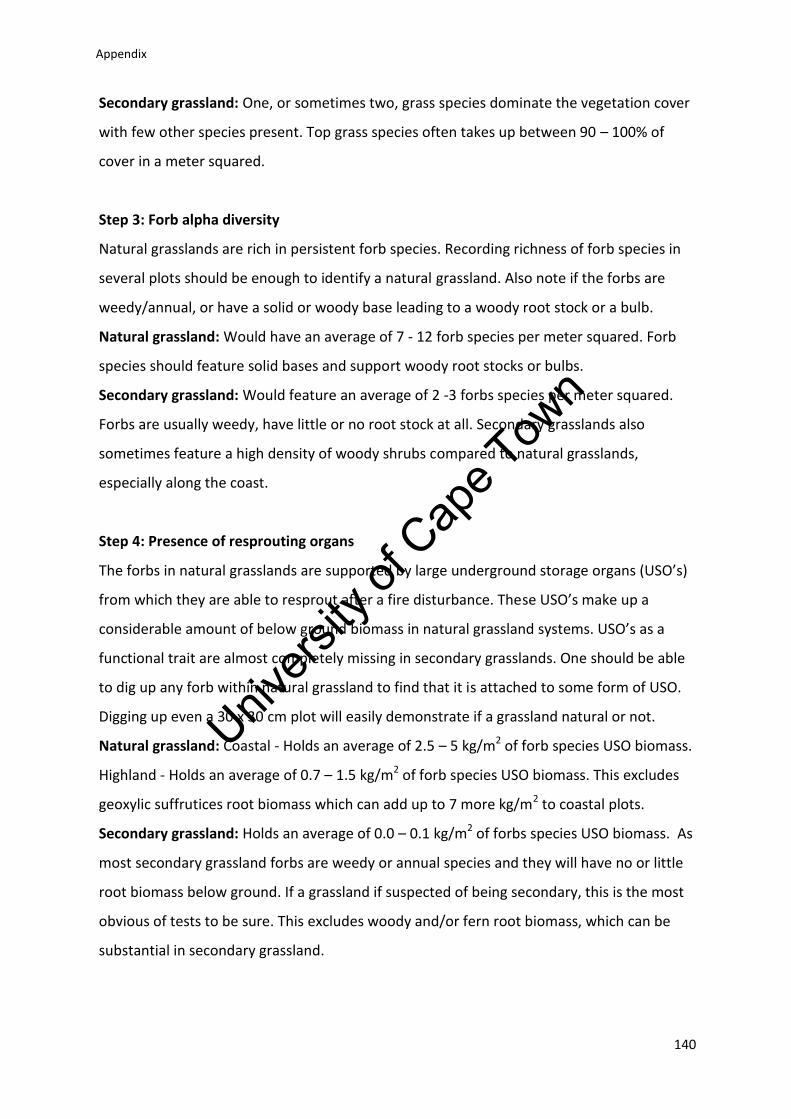
Univers
ity of
Cap
e Tow
n
Appendix
140
Secondary grassland: One, or sometimes two, grass species dominate the vegetation cover
with few other species present. Top grass species often takes up between 90 – 100% of
cover in a meter squared.
Step 3: Forb alpha diversity
Natural grasslands are rich in persistent forb species. Recording richness of forb species in
several plots should be enough to identify a natural grassland. Also note if the forbs are
weedy/annual, or have a solid or woody base leading to a woody root stock or a bulb.
Natural grassland: Would have an average of 7 - 12 forb species per meter squared. Forb
species should feature solid bases and support woody root stocks or bulbs.
Secondary grassland: Would feature an average of 2 -3 forbs species per meter squared.
Forbs are usually weedy, have little or no root stock at all. Secondary grasslands also
sometimes feature a high density of woody shrubs compared to natural grasslands,
especially along the coast.
Step 4: Presence of resprouting organs
The forbs in natural grasslands are supported by large underground storage organs (USO’s)
from which they are able to resprout after a fire disturbance. These USO’s make up a
considerable amount of below ground biomass in natural grassland systems. USO’s as a
functional trait are almost completely missing in secondary grasslands. One should be able
to dig up any forb within natural grassland to find that it is attached to some form of USO.
Digging up even a 30 x 30 cm plot will easily demonstrate if a grassland natural or not.
Natural grassland: Coastal - Holds an average of 2.5 – 5 kg/m2 of forb species USO biomass.
Highland - Holds an average of 0.7 – 1.5 kg/m2 of forb species USO biomass. This excludes
geoxylic suffrutices root biomass which can add up to 7 more kg/m2 to coastal plots.
Secondary grassland: Holds an average of 0.0 – 0.1 kg/m2 of forbs species USO biomass. As
most secondary grassland forbs are weedy or annual species and they will have no or little
root biomass below ground. If a grassland if suspected of being secondary, this is the most
obvious of tests to be sure. This excludes woody and/or fern root biomass, which can be
substantial in secondary grassland.
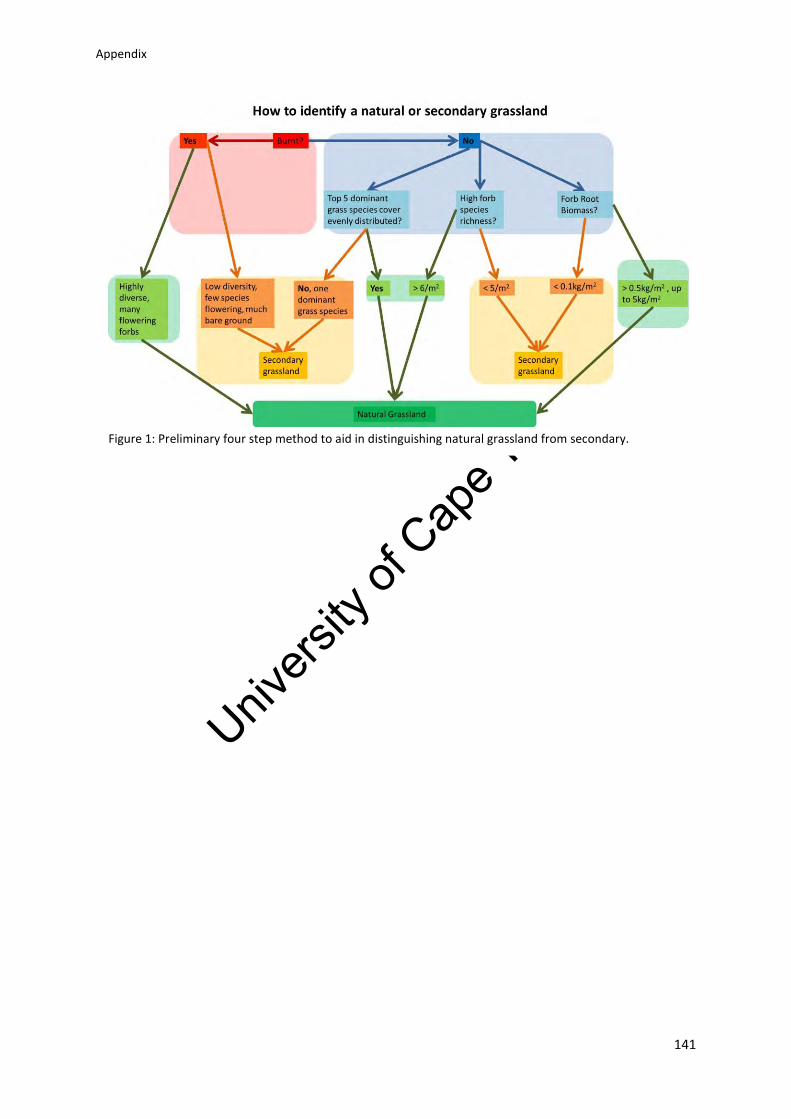
Univers
ity of
Cap
e Tow
n
Appendix
141
Figure 1: Preliminary four step method to aid in distinguishing natural grassland from secondary.
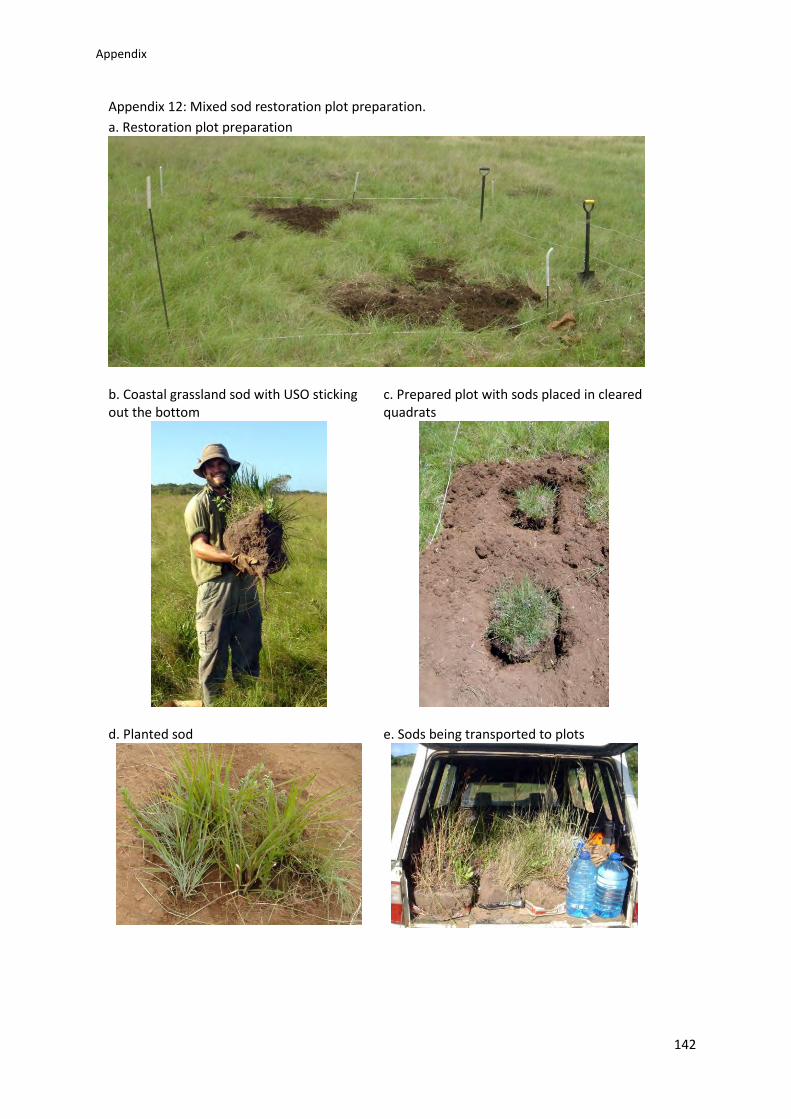
Univers
ity of
Cap
e Tow
n
Appendix
142
Appendix 12: Mixed sod restoration plot preparation.
a. Restoration plot preparation
b. Coastal grassland sod with USO sticking out the bottom
c. Prepared plot with sods placed in cleared quadrats
d. Planted sod
e. Sods being transported to plots