Embed Size (px)
Citation preview

Report No. 59
South Asia Human Development Sector
Improving Early Childhood Development through CommunityMobilization and Integrated Planning for ChildrenResults from the evaluation of Bachpan program, Ratlam District, Madhya Pradesh, India March 2013 Discussion Paper Series
Pub
lic D
iscl
osur
e A
utho
rized
Pub
lic D
iscl
osur
e A
utho
rized
Pub
lic D
iscl
osur
e A
utho
rized
Pub
lic D
iscl
osur
e A
utho
rized
Pub
lic D
iscl
osur
e A
utho
rized
Pub
lic D
iscl
osur
e A
utho
rized
Pub
lic D
iscl
osur
e A
utho
rized
Pub
lic D
iscl
osur
e A
utho
rized
Pub
lic D
iscl
osur
e A
utho
rized
Pub
lic D
iscl
osur
e A
utho
rized
Pub
lic D
iscl
osur
e A
utho
rized
Pub
lic D
iscl
osur
e A
utho
rized

Report No. 59
South Asia Human Development Sector
Improving Early Childhood Development through Community Mobilization
and Integrated Planning for Children
Results from the evaluation of Bachpan program, Ratlam District, Madhya Pradesh, India
Deepa Sankar
May 2013
_________________________________________________________________
Discussion Paper Series

Discussion Papers are published to communicate the results of the World Bank’s work to the
development community with the least possible delay. The typescript manuscript of this paper therefore
has not been prepared in accordance with the procedures appropriate to formally edited texts. Some
sources cited in the paper may be informal documents that are not readily available.
The findings, interpretations, and conclusions expressed herein do not necessarily reflect the views of the
International Bank for Reconstruction and Development / The World Bank and its affiliated
organizations, or those of the Executive Directors of the World Bank or the governments they represent.
The World Bank does not guarantee the accuracy of the data included in this work. The boundaries,
colors, denominations, and other information shown on any map in this work do not imply any judgment
on the part of The World Bank concerning the legal status of any territory or the endorsement or
acceptance of such boundaries.

Table of Contents
Acknowledgements ....................................................................................................................................... i
Glossary and Abbreviations ......................................................................................................................... ii
Executive Summary .................................................................................................................................... iv
Introduction .................................................................................................................................................. 1
Chapter 1: Background ................................................................................................................................ 2
Chapter 2: Evaluation of the Results of the Pilot Project............................................................................. 9
Chapter 3: Progress in Processes and Identified Outcomes/Milestones .................................................... 12
Chapter 4: Bachpan-Lessons Learned....................................................................................................... 40
Annex 1: Process Documentation – Consolidated Report 2005-2009 ...................................................... 43 Annex 2: Methodology-Evaluation through controlled and experimental design ..................................... 73 Annex 3: Socio Economic Milieu and household characteristics of the Study area .................................. 78 Results ........................................................................................................................................................ 80 Annex 4: International / National Evidences: ............................................................................................ 86 Annex 5: Consolidated Resource Mapping Data for Thikariya Gram Panchayat, Bajna, MP (A
Sample) ...................................................................................................................................................... 88 Annex 6 Village Micro Plan structure ....................................................................................................... 91 Annex 7: Monitoring and Evaluation Plan of Bachpan Plans: Naandi Foundation ................................. 92
i
Acknowledgements
Venita Kaul, Professor, Centre for Early Childhood Education and Development (CECED), Ambedkar
University, Delhi and formerly Senior Education Specialist, SASHD, World Bank New Delhi office, who
initiated the discussion around child-centered planning at the village-level, and who task-managed the
entire Bachpan pilot project from the World Bank side. Without Venita, the pilot and evaluation would
have remained a dream.
Sumit Bose, who, in his capacity as Principal Secretary of Finance, Government of Madhya Pradesh,
invited the World Bank and initiated the pilot project.
Anshu Vaish, Former Secretary, Department of School Education and Literacy, Ministry of Human
Resource Development (MHRD), who facilitated the coordination of the project when she was Secretary,
Education, Government of Madhya Pradesh.
Neelam Rao, Former Director, Sarva Shiksha Abhiyan (SSA), MHRD, who provided the much-needed
guidance and inputs in Madhya Pradesh to begin the pilot (in her previous capacity as State Project
Director, SSA).
Deepti Gaur Mukherjee, then Collector, Ratlam District, who facilitated the pilot at the district level.
Various officials in the departments of health, education, tribal welfare, nutrition, and social welfare, at
the district level in Ratlam, and block level in Bajna, for their inputs and facilitation.
Naandi Foundation, particularly Rohini Mukherjee and the Jan Mitras team, who implemented the
project in Bajna Block.
Education Resource Unit (ERU), particularly Nishi Mehrotra, Niti Saxena, and Vimala
Ramachandran, for meticulously documenting the processes of project implementation.
INDICUS Analytics for carrying out the baseline and end-line surveys in Bajna and Sailana, particularly
Aali Sinha, who anchored the baseline survey.
Karthika Radhakrishnan Nair and Tanusree Talukdar of the Bank for their unstinting support in
project management. G.N.V. Ramanna and Meera Priyadarshi for their involvement at various stages
of the project, and Michelle Riboud, for management support.
Paul Gertler, who provided guidance in the design of the impact evaluation. Amit Dar, for leadership
and support, and valuable comments on the draft report. Sam Carlson, Toby Linden, Luc Laviolitte,
Ashi Kathuria, and John Newman for their exhaustive review and suggestions on the draft report.
Education Program Development Fund (EPDF), for financing the pilot project and its evaluation.
Last, but not the least, the residents of 220 villages in Bajna for participating in the project, and residents
of Bajna and Sailana for cooperating with the surveys.

ii
Glossary and Abbreviations
ANM
Auxiliary Nurse Midwife
ANM
Auxiliary Nurse Midwife
AWC
Anganwadi Centre
AWW
Aanganwadi Worker
Bachpan
Means “childhood” in Hindi
Bal kosh
Children’s Fund
Bal Melas Children’s fair
Bal Mitra
A teacher who is a children’s friend
Bal Panchayat Children’s Panchayat (local self-governance by children)
BCG
Bacillus Calmette-Guérin (vaccine against tuberculosis)
BEO
Block Education Officer
CDPO
Chief District Programme Officer
CHC
Community Health Centre
CSS
Centrally Sponsored Scheme
Dai
Midwife
DM
District Magistrate
DPEP
District Primary Education Programme
DPT
Diphtheria, Pertussis (whooping cough) and Tetanus vaccine
ES
Ekta Samuh, or unity groups/a collective
HDR
Human Development Report
ICDS
Integrated Child Development Services
IEC
Information, Education, and Communication
IFA
Iron and Folic Acid
Jan Mitra
literally, “friends of the community” in Hindi
JM
Jan Mitra
Kishori Manch Adolescent girls’ group
Mahila Manch Women’s group
Mahotsav
Celebration
MDM
Mid-Day Meal
MGNREGA Mahatma Gandhi National Rural Employment Guarantee Act
MP
Madhya Pradesh
NCERT
National Council of Educational Research and Training
NGO
Non-Governmental Organization
NREGS
National Employment Guarantee Scheme
NRHM
National Rural Health Mission
PA
Project Associate
PRI
Panchayati raj Institutions
PTR
Pupil Teacher Ratio
RCH
Reproductive and Child Health
Sarpanch
Village head
SNP
Supplementary Nutrition Programme

iii
SSA
Sarva Shiksha Abhiyan (elementary education for all)
TBA
Traditional Birth Attendant
TLM
Teaching Learning Material
VPC
Village Plans for Children
VRG
Village Resource Group
Yuvak Mangal Dal Youth group

iv
Executive Summary
Introduction
This study reports the results of an impact evaluation of a pilot project implemented in 220 villages in
Bajna block, Ratlam district, Madhya Pradesh (MP), India. The 30-month pilot was designed to improve
early childhood development outcomes through: (a) creating awareness on child development issues
among households and the community; (b) strengthening linkages between different service providers; (c)
intensifying the connection between the community, Panchayat (local governments), and service
providers; (d) facilitating the formation of Village Resource Groups (VRGs) with representatives of the
community, Panchayat and service providers to ensure better convergence and coordination of service
delivery; (e) developing integrated village-level action plans around the needs of the child; and (f)
advocating and lobbying with local, district, and state administration for flexible allocation of resources.
Background
The pilot project was inspired by the World Bank report, Reaching out to the Child: An Integrated
Approach to Child Development (2004), which analyzed the reasons for the far from satisfactory status of
children in India, in spite of several significant policy and programmatic provisions. The report had
recommended the development of Village Plans for Children (VPC)— community-led, decentralized, and
cross-sectoral planning for children that would inform sectoral interventions and implementation.
Enthused by the VPC model for child development, in 2005 the Government of Madhya Pradesh (GoMP)
opted to pilot the concept in one of its blocks, and sought World Bank assistance to implement it. The
World Bank supported the pilot by: (i) engaging Naandi Foundation, an NGO, to work with the
community as catalysts; and (ii) designing and implementing a meticulous evaluation of the program.
Through a consultative process, Bajna, a remote backward tribal block with 220 villages, was identified
as the pilot site because: no other NGOs or private groups were active in the block; all the child
development programs—Reproductive and Child Health (RCH), Integrated Child Development Scheme
(ICDS), and Sarva Shiksha Abhiyan (SSA)—were being implemented in the area; and the Government of
MP felt that if the project could demonstrate success in this block, they could replicate it elsewhere in the
state.
The initial community meetings decided to call the project ‘Bachpan’ (childhood), with a vision to ensure
that every child enjoys a “happy, healthy, and learning childhood.”
Project implementation comprised the following components: (a) Participatory resource/service delivery
mapping; (b) Provision of information and educating the community on child development issues, as well
as managing service delivery; (c) Community mobilization aimed at bringing parents and service
providers on common platforms to discuss child development and service delivery issues; (d) Formation
of Village Resource Groups (VRGs) called Ekta Samuhs (unity groups), to discuss child advancement
issues, identify gaps and requirements, and formalize it in the form of village plans; (e) Facilitation of the
interactions between VRGs and block- and district-level health, nutrition and education officials, and
feeding the village plans into district plans for RCH, ICDS and SSA; (f) Enable specific service
provisions like the fixed day health checkup (a particular day in a month agreed between the health
worker and the community on which the health worker visits schools and the community brings the
children for regular checkup); and, (g) Provide training to frontline service providers (health workers,
anganwadi workers, and teachers) to manage service delivery records, deliver effective services, and
sensitize them to ensure enhanced accountability.
The project was implemented in Bajna from 2006 till 2009 The groundwork for resource mapping,
information, education and communication (IEC), and community mobilization took a year to take shape,
v
all the Village Resource Groups (VRGs) were formed by the end of the second year, followed by the
planning process and convergent service delivery in the third year.
Impact Evaluation Study
The evaluation assessed the impact of the project on health, education, and nutrition milestones or
outcomes/outputs identified for each stage of child development. The World Bank’s evaluation of the
pilot followed a quasi-experimental design. While the project interventions were administered in 220
villages in Bajna, an adjacent tribal block, Sailana, was identified as the control block. In both the control
and project blocks, a baseline survey was conducted in 2005-06, while an end-line survey was conducted
in 2009. The baseline and end-line surveys interviewed both households and providers.
Baseline Survey Findings
The baseline survey found low outcomes/developmental milestones in early childhood (education, health
and nutrition) in both Bajna and Sailana, though in general the situation was somewhat better in Sailana.
For example:
Very few pregnant women had availed of full antenatal care (9 percent in Bajna and 24 percent in
Sailana), and
Only a small minority of pregnant women underwent institutional delivery or deliveries attended to
by trained professionals (one-third in Bajna and one-quarter in Sailana).
The rate of child immunization was less than 10 percent in both communities, and malnourishment
was very high (about one-third of children in each block).
While 67 percent of children aged 3-5 years in Bajna and 59 percent in Sailana were enrolled in
anganwadis, daily participation in preschool activities were low (61 percent in Bajna and 71% in
Sailana attended anganwadis for less than an hour) and 5-year-olds fared inadequately in school
readiness competencies (mean score of only 50 percent in Bajna and 60 percent in Sailana; for
example, only 30 percent in Bajna and 50 percent children in Sailana could comprehend a simple
sentence; and 24% in Bajna and 37% in Sailana could do visual discrimination).
Though out of school children numbers were low and school attendance was surprisingly not bad (84
percent in Bajna and 72 percent in Sailana, children’s learning achievements were low, with a mean
overall score in mathematics and Hindi of 54.56 percent in Bajna and 65.10 percent in Sailana.
End-line Survey Findings
The end-line survey shows that the Bachpan program significantly improved outcomes for children, as
well as enhanced the community’s knowledge, awareness levels, and practices. These improvements
occurred across a very wide range of outcomes (see Table). These improvements meant that Bajna block
was able to catch up and, in some cases, surpass the developments outcomes found in the neighboring
Sailana block. The experience of the Sailana block shows that some progress is possible with different
programs targeted on specific issues. However, there is greater impact of these programs where, as was
the case in Bajna, there is a concerted effort at the local level to contextualize and coordinate these
programs.

vi
Table: Summary of Outcomes: "Difference in difference" between treatment and comparison blocks
Indicators on Outcome for various stages Progress better in
Bajna or Sailana
Stage 1
Percentage of pregnant women who received full ante-natal check-up Bajna
First ANC within first trimester Bajna
Percentage pregnant women regularly received Supplementary food Bajna
Percentage of deliveries assisted by institutionally trained Bajna
Decline in the percentage of children underweight Sailana
Stage 2
Percentage of children fully immunized by year 1 Bajna
Percentage of children who have completed all prophylaxis Vit A Bajna
Percentage of children with normal weight for age Bajna
Stages 3
& 4
Percentage of children entering in Grade 1 who have an adequate vocabulary in the school
language
Bajna
Percentage of Grade I children who have attended pre-school program Bajna
Percentage of children in school clean and neat Bajna
Percentage of children who wash hands before eating Bajna
Achievement levels in language and Mathematics in Grade II Bajna
Improvements were seen in particular in the following dimensions (see charts):
The proportion of pregnant women who had availed of full antenatal care tripled in Bajna to 23.8
percent.
The rate of home delivery where births were not attended to by trained professionals halved in
Bajna while barely shifting at all in Sailana.
The rate of child immunization in Bajna was 56.9 percent, up from just 5.2 percent at the baseline
and malnourishment dropped to 21.6 percent from 33.6 percent (while remaining at around 30
percent in Sailana).
The enrolment of 3-5 years in anganwadis improved (in Bajna from 67 percent at baseline to 91
percent by end-line survey compared to Sailana where it improved from 59 percent to 83
percent), of which those attending anganwadi early childhood education program for five days or
more improved significantly (in Bajna, from 48 percent at baseline to 71 percent by end-line
while in Sailana the improvement was from 31 percent to 60 percent), and “school readiness”
scores improved significantly (in Bajna, from 50 percent mean score at baseline to 67 percent by
end-line while in Sailana, the improvement was from 60 percent to 65 percent).
Children’s learning achievements improved significantly, with mean scores in Bajna now
marginal above those in Sailana (up from 54.56 to 74.60 percent); as importantly, the distribution
of Bajna mean scores has decreased so that many more children are closer to the mean (standard
deviation gone down from 10.50 to 8.08).

vii
Lessons from the Impact Evaluation of the Pilot
The impact evaluation and process documentation together provide an insight into what works better or
what does not, in geographical areas with many socio-cultural challenges for improving the quality of
children’s lives. The evaluation demonstrates that the interventions under the pilot led to significant
improvements in childcare-related behavior and delivery of services for children, which in turn lead to
child-related outcomes. The inferences from the results are as follows:
Dramatic improvements are possible even in the most disadvantaged communities, with the right
approach.
Greater progress is made through invigorating the local community and service providers by
informing communities and enabling them to make their voices heard, than through vertical projects
implemented in a top-down fashion.
Participatory planning, rather than a top-down approach, enables contextualization of interventions
and convergence and coordination in planning and implementation; both are important because child
development requires a slew of complementary interventions no single solutions.
Community participation is ensured when there is enough awareness and empowerment. This requires
change agents or catalysts, and this necessitates involving civil society organizations.
Interventions in the development sector can take time to show results. So the final assessment of their
success should take place after the initial enthusiasm of a pilot dies down and actual results are
visible.
An effective and informative evaluation was possible because the process was documented
meticulously. This can also enable any mid-course corrections that may be required.
The costs of this intervention were modest (the real investment was 20 youth (“Jan mitras”, the
change agents selected from within the community) who were paid Rs. 3000 per month, and the
training and material charges), as the focus was on improving the effectiveness of existing programs,
which themselves are large, rather than creating new ones. Hence, there are clear opportunities for
scaling up this approach to other blocks across Madhya Pradesh.
0%
10%
20%
30%
40%
50%
60%
70%
80%
90%
Bajna Sailana
Full Immunization excl measles by age 2 yrs
Baseline SurveyEndline survey
0%
10%
20%
30%
40%
50%
60%
70%
80%
Bajna Sailana
IFA supplement to children 2-5 yrs
Baseline SurveyEndline survey
0%
10%
20%
30%
40%
50%
60%
70%
80%
Bajna Sailana
Grade 2 Mean scores
Baseline SurveyEndline survey

1
Introduction
Making services for the poor work and result in desired outcomes has been a major challenge to social
development, as pointed out by the World Development Report (2004). When services meant for early
child development fail to reach children, the fallout is irreparable damage to building subsequent human
capital.
Every child deserves a “happy, healthy and learning” childhood, which facilitates her/his physical, social,
emotional, intellectual and educational growth. For any nation, developing human capability and hence,
human capital, is vital for economic growth and social development, and every rupee spent on a child is
an investment in the future. However, as the World Bank’s Reaching Out to the Child (2004) report
corroborated, despite several policy endorsements and substantial investments for nearly six decades
since independence, the child development outcomes are very poor. Further, the benefits accrued thus far
have not penetrated equitably, thus leaving out a large section of children, especially those from
marginalized groups and remote backward regions. The report also identified some factors responsible for
the limited impact of existing provisions. These include: (a) a fragmented, sectoral approach in
implementing schemes that do not capture the synergies across sectors; (b) over centralized and
standardized program designs that do not address contextual diversities; (c) inadequate financial resources
and incompetent implementation; (d) insufficient monitoring capacity; and (e) low accountability
resulting in service delivery issues. The absence of converging nodes close to service delivery points, and
the lack of stakeholder or community involvement (especially in the context of local settings), are major
challenges for effective service delivery.
Over and above its emphasis on the requirement for an integrated and life cycle approach to child
development, including basic education, the study also highlighted the need for locating planning and
monitoring within a comprehensive and holistic child development framework. Thus, one of the major
recommendations of the research was to move toward a decentralized and cross-sectoral approach to
program planning and monitoring, and improved coordination in implementation. It suggested that
informed communities come together around child development issues for planning in a convergent
manner. This concept deviates from the existing approach in two ways: (i) it is a bottom-up approach
involving participatory planning by each village community for its children and has the potential to be
more context specific and need based, and (ii) it is in accordance with a multi-sectoral convergence
approach that addresses the needs of the “whole child” and not on different aspects (health, nutrition,
education) in isolation from each other.
This report presents the results of one such innovative experiment aimed at improving early child
development (ECD) outcomes through energizing communities and enabling convergence of child-
related services at the village-level in 220 tribal villages in backward and remote Bajna block, in Ratlam
district, Madhya Pradesh. The report organization follows the logical framework of the program (Chart
3). While Section 1 provides a background to the pilot and the project activities and interventions, Section
2 details the evaluation design. Section 3 analyses the results of the evaluation of the pilot project in terms
of “outputs” and the results of the “impact” on ECD milestones/outcomes. Section 4 summarizes the
findings of the pilot project.

2
Chapter 1: Background
The World Bank (2004) Report Reaching Out to the Child proposed an integrated child development
conceptual framework, which detailed the health, education, nutrition, and child protection related
outcomes for each stage of early childhood (pre-natal to 1 month, 1 month-3 years, 3-6 years, 6-8 years
and 8-11+ years), and the indicators that manifest these outcomes. The framework also listed the possible
determinants of these outcomes. The framework is presented below (Chart 1). The report also proposed
a possible structure for developing village plans for children (Chart 2).
Chart 1 ICDS Conceptual Framework
Source: Reaching Out to the Child, World Bank, 2004

3
Chart 2 Village Plans for Children: A Possible Structure Advocated by World Bank (2004)
Source: Reaching Out to the Child, World Bank, 2004

4
Bachpan: From Concept to Pilot
The attempt to translate into reality the concept of an integrated approach to child development was not a
new one. In 1999, the Philippine Government launched an ECD project, adopting an integrated, multi-
sectoral approach to delivering a combination of services that included center-based and home-based
interventions. To link the two sets of interventions, a new service provider, the Child Development
Worker (CDW), was placed in all program areas (see the Process Documentation Report in Annex 1). In
India, the Integrated Child Development Scheme (ICDS) was aimed as an integrated approach to child
development, though, in practice, it remained at the level of yet another ring-fenced approach.
The Government of Madhya Pradesh (GoMP), bought into the report’s concept of decentralized and
cross-sectoral planning, coupled with coordinated implementation of child development programs (and
the village plans envisaged therein). They recognized it as a feasible route to address the state’s child
development issues, especially that of service delivery, and community awareness and mobilization at
grassroots levels. The GoMP suggested piloting the concept through Village-level Child Development
Plans, which would form the contextual plan document. At their invitation, the World Bank agreed to
facilitate the process in the state through a pilot, to be evaluated rigorously for impact.
Bajna, a tribal Community Development Block in Ratlam district with around 220 villages, was selected
as the administrative unit within which to implement the pilot (for details, see the Baseline reports and
Process Documentation by Education Resource Unit [ERU] in the Annex) selection method). Naandi
Foundation, a leading Non-Governmental Organization (NGO), was assigned the responsibility of
facilitating the interventions related to convergent and decentralized village-level planning. The
intervention under the pilot was titled Bachpan (see Process Documentation Report by ERU for details),
and was implemented from 2006 to 2009. The process documentation responsibilities were given to the
Education Resource Unit (ERU).
The Pilot Project
The first year of the project was devoted to conducting a needs and gaps assessment, and in mobilizing
the community. The major task of the implementing agency (Naandi Foundation) was to identify local
people who would work with the community in implementing the project. At this inception stage, the
project was only an idea, with no clear intervention plans or processes. Thus, the first step was to develop
a logical framework for implementing the pilot project (Chart 3).
Chart 3 Logical framework for the Pilot
The pilot was designed to address the inputs and process arms of the logical framework, keeping in mind
the outcomes and impact to follow. Thus, while one of the expected outcomes of the project was the
preparation of “village plans for children” that would feed into different centrally sponsored schemes’
Inputs Processes Outputs Outcomes Impact
Inputs / efforts by a facilitating
agency (possibly an NGO?)
Community mobilization,
participatory and multi-sectoral planning for
children
Community awareness,
village plans for children
Better service delivery, better
ECD related practices and uses of ECD
services
Improved child development
related outcomes
5
(CSS)/state schemes’ district plans, the major measurable outputs were in the nature of community
awareness, better childcare practices and behavior, and improved service delivery.
In the preparatory stage, the NGO identified around 20 young men and women (tribal and non-tribal,
both) who had recently completed high school, to work in the villages, so as to mobilize community,
educate them about the schemes and preparation of village plans. Educational levels (minimum education
of Class X for non-tribal) and some understanding of the area were the basic criteria for selection. Tribal
youths were accorded priority irrespective of their academic qualifications, as they belonged to the
villages/areas of the pilot. This band of young people, the Jana Mitras (friends of people/community),
and were given intensive training in village resource mapping (see Annex 2 for an example of village
resource mapping) and participatory planning. They were also informed about the various existing child-
related schemes and their set result targets: these included Sarva Shiksha Abhiyan (SSA), Integrated Child
Development Scheme (ICDS), Reproductive and Child Health (RCH), National Rural Health Mission
(NRHM), and others.
As part of their resource mapping exercise, the Jan Mitras conducted a rapid appraisal of service delivery
gaps in health, education, and nutrition. The Jan Mitras also carried out house-to-house visits to assess the
current child development outcomes and care practices, and to educate the community on child
development needs. To aid management and monitoring, the block was divided into three widely
scattered clusters—Bajna, Raoti and Kundanpur—each with specific geographical or service delivery
features. While Bajna is hilly and dry, the Raoti area is a fairly fertile river basin (of the river Mahi), and
Kundanpur is an area of sparsely scattered settlements with a poor communication network.
As a next step, the Jan Mitras brought together community and service providers of health, education, and
nutrition on common platforms to discuss individual and common concerns. This led to the formation of
Village Resource Groups (VRGs) or Ekta Samuhs (united communities/ solidarity groups). VRGs
facilitated the convergence points for various service providers, and many interventions/processes
common to different schemes were carried out in a coordinated way (for example, a census of children
who should be enrolled in ICDS and primary schooling, or the information, education and communication
(IEC) activities).
The communities came up with the project name (Bachpan), meaning childhood. The communities
(during VRG meetings, facilitated by the Jan Mitras), also formulated the vision and mission for the
project, including a list of objectives and the type of interventions required under the project. The
community also felt the need to address the life cycle continuum and, realizing the importance of child
development, the Ekta Samuhs came up with a vision for the pilot project—realizing a “happy, healthy
and learning childhood” for their wards (See Box 1).
The preparation of village-level plans for child development (see Annex 3 for a village child plan
structure), and feeding the plans into district level plans for SSA, RCH and ICDS was considered as the
next step forward in the process. By the end of the second year, more than half the villages had prepared
village-level plans and submitted it to the district authorities for further action (see Box 2 and 3). The
details of the Bachpan program, its administrative arrangement, project interventions, bottlenecks faced in
the process, etc., are detailed in the Process Documentation Reports (a total of 8 reports; see Annex 5 for
the consolidated report).

6
Box 1 Vision, Mission, Objectives and Activities of the Pilot Project “Bachpan”
Vision Happy, healthy, learning child
Mis
sio
n Facilitate integrated child development by (a) helping improved service delivery through
coordinated and convergent approach and (b) promoting better child care and development
practices by educating community and providing information about child care practices,
outcomes and availability of services and schemes.
Ob
ject
ives
Create awareness on child development with a focus on the girl child
Strengthen linkages between different service providers
Strengthen linkages between the community, panchayat and service Providers
Facilitate formation of Ekta Samuhs at village level (Village Resource Group) with
representatives of the community, panchayat and service providers
Develop integrated village level action plans around the needs of the child
Advocate and lobby with local, district and state administration for flexible allocation of
resources
Key
featu
res Address the life cycle continuum.
Establish convergence of provisions for children across health, nutrition and education
sectors.
Engender bottom-up planning through community participation.
Inte
rven
tion
s
Selection and training of village level facilitators (Jan Mitras) and orientation of Block
level functionaries
Participatory survey and resource mapping of the project area (in all 220 villages);
Collation of resource mapping data in all villages
Orientation of both service providers and community on the concept of integrated child
development, capacity building
Community mobilization through the formation Village Resource Groups (VRGs)
named by communities as “Ekta Samuhs”; Orientation of the VRGs on (a) Government
Schemes; (b) Specific outcomes desired for each sub stage of childhood with regard to
health, education and nutrition and related determinants; and (c) Their own role in
planning and monitoring at the village level; Sandesh Vahini Dals (Communicators
forums) were constituted from among local talent available for this purpose to make the
strategy folk theatre based.
Continuous interventions for building and sustaining community as well as service
providers’ awareness around nutrition, health and education issues; orientation and
training of service providers (AWW, health workers/ ANM and teachers); setting up
contextualized models (fixed day services in AWC/HC, setting up Maje ki Pathshala
models; melas, teacher motivation activities etc);
Workshop organized for block level functionaries of the three government departments
of Education, Health and Women and Child Development.
Development of Village plans (3 year plans from pre natal to 11 + years in each village)
and feeding the plans into sector specific plans each year.

7
Box 2 Evolving Village-level Plans for Children: Evidences from Process Documentation I: In
Keriapada village, the first tentative village plan was discussed amongst the members of the Ekta
Samuh, facilitated by a Jan Mitra.
The group focused attention on the problem of student dropouts, prenatal care for women, the
poor health status of children, heavy migration of families (50%) for economic sustainability,
alcoholism and smoking among men, and the issue of dowry.
They discovered that many children were in school but the parents were unaware of which
grade they were in. The irregularity of the schoolteacher was another problem discussed.
Ekta Samuh was fairly active in the village and had already taken a decision to work on certain
issues in the second meeting, in the presence of the team and the larger community.
They wanted to identify children of migrant families and motivate them to stay back in a
residential center when their parents migrated. The parents present had consented to this
proposal.
The Ekta Samuh wanted to organize a health check-up camp for village children during the
monsoon (rainy) season for preventive remedies. Subsequently, the community also wanted to
ensure that all children aged 3-6 year were in the anganwadi centre, and all children under six
were immunized.
The Ekta Samuh members, in the process of discouraging alcohol intake across the village, also
vowed to become teetotalers themselves.
The members considered setting up a Bal Kosh (Funds for children) in the village for the
children, by putting in fifty paisa per person per month, as a saving. This was to take care of the
health or educational needs of children.

8
Box 3. Evolving picture of village level plans for children:
Ekta Samuhs to take the initiative in respective villages: Planning at Panchayat level, Kundanpur cluster
– Chikni and Binti Panchayats
(Evidences from Process Documentation II)
Actions to be taken
Children < 5yrs Month 1 Month 2 Month 3
Immunization of
children whose
parents migrate
SNP irregular &
nutrition &
sanitation weak
AW children not
regular
Children have
poor nutrition
Make mothers aware
about immunization.
Door to door visits of
ANM. Set fixed place
for immunization in
village
Training on importance
of SNP
Discuss and motivate
mothers and ensure
AWC functioning is
regular
Get ANM and AWW to
speak about nutrition
from local foods
Awareness about pre-
school education to
parents
Move for fixed day
services
Follow up with AWC
and panchayat on SNP
Discussions with
mothers and follow up
activities
See that nutrition is
served in AWCs and ask
mothers whether
children eat at home
Inform parents about
meetings to follow up
on issues.
ES to follow up
motivation of parents
and track children.
Ensure fixed day
services become regular.
ES tracks AWC, AWW
ANM
Children in school
Children from
some hamlets
absent from
school even
though enrolled
Schools do not
open regularly
Talk to parents about
shifting of children
from sibling care
Community to track
children who are absent
frequently and speak to
parents
Mobilize parents for
enrolling children and
making them regular
Motivation of parents
hamlet wise
Discussions with
parents through
meetings and
discussions
PTA to track children in
the schools and ensure
that incentives are
available for them
ES to monitor use of
funds in schools
through PTA
PTA and ES to monitor
school regularity and
quality and report to
Education Department
PTA to convene timely
and follow up activities
– hamlet level meetings
and sharing of
experiences
Other village issues
Regular visits of
ANMs to AWC
Visits of pregnant
women to health
centre
School boundary
and beautification
Drinking water
facility
dysfunctional
Speak to ANMs telling
them of their problems
– at meetings
Identify and motivate
women through AWW
and ANM – in the
hamlets
PTA to become active –
speak to the teacher
Mobilise people for
action
Set a day for
examination of women
by the ANM
Inform them about
services at the health
centre
Children and parents get
involved in school
improvement
ES speaks to Sarpanch
Track the women and
ensure their records are
maintained
Ask Mahila Manch
(Women’s group /
forum) to track them in
the different hamlets
Function to showcase
school
Move to higher level if
Sarpanch does not take
action

9
Chapter 2: Evaluation of the Results of the Pilot Project
A rigorous evaluation of the results along with a detailed process documentation of the project was
planned at the conceptualization stage of the pilot itself, so that the efficacy of the pilot could be
measured and lessons learned could be replicated or emulated elsewhere in the state. Following the
logical framework of the project, it was expected that the inputs from the pilot, or the activities
undertaken under the project, could lead to the mobilization of the village community, including those
employed as frontline service providers in health, education, and the ICDS. This, in turn would result in
better interaction within the community and between the providers and beneficiaries, and improve
awareness about child development issues. Enhanced service delivery and child development practices,
and better use of services would lead to improved child development related outcomes. Hence, the impact
evaluation of the study needed to look at the improvements in child development related outputs and
outcomes, or the envisaged milestones of the project interventions.
Evaluation Study Objectives
The overall objectives of the study are:
To assess the changes in child development outcomes (specific milestones in each stage of child
development, related to health, education, and nutritional parameters) resulting from the project
interventions (informing and educating the community, community mobilization around child
development issues, and facilitating interface with frontline service providers), and the integrated
approach toward interventions.
To understand the changes in service delivery and community awareness arising from project
interventions.
To examine the changes in service delivery, community behavior, and child development outcomes in
the context of the interventions, in direct contrast to the absence of any convergence of planning or
coordination in sectoral implementation.
Methodology
This evaluation uses a quasi-experimental design. The concept note of the evaluation plan was reviewed
and agreed upon. The identification of the counterfactual is important for such studies. The impact of the
interventions is assessed as the net effects, or the difference-in-difference, whereby the changes in
outcome/output indicators between the pre-intervention and post-intervention periods are compared—an
intervention group against that of the non-intervention (counterfactual) group. The conceptualization of
the net effects is in terms of the comparable differences in the changes before and after the project
between the treatment group and the control group.
A detailed note on the design and methodology of the impact evaluation, sampling framework, and
questionnaires are provided in Annex 6.
Comparison of Bajna and Sailana
While identifying a perfect counterfactual area was difficult, Bajna and Sailana are a close enough match.
Both are tribal blocks in Ratlam district of Madhya Pradesh state, have around 220 villages each, and
display similar geographic, socio-economic, and ethnic profiles. The selection of these blocks by the
GoMP for the study was purposive—they believed that if the pilot interventions in one of these blocks
worked, then it could be similarly implemented anywhere else in the state with equal success. A

10
comparison of the situations and interventions in the two tribal blocks is provided in Box 4. A detailed
description of the socio-economic milieu of the two blocks is presented in Annex 2.
Box 4 Comparison of interventions in Bajna and Sailana
Child development
interventions BAJNA SAILANA
Education related
projects:
Sarva Shiksha Abhiyan (SSA)
Mid Day Meal Scheme (MDM)
State interventions
Sarva Shiksha Abhiyan (SSA)
Mid Day Meal Scheme (MDM)
State interventions
Health related
interventions
Reproductive & Child Health
(RCH)
National Rural Health Mission
(NRHM)
State interventions
Reproductive & Child Health
(RCH)
National Rural Health Mission
(NRHM)
State interventions
Nutrition related
interventions Integrated Child Development
Scheme (ICDS)
Integrated Child Development
Scheme (ICDS)
Nature of services/
activities BAJNA (with Bachpan) SAILANA (without Bachpan)
Planning Village level Child centered planning,
converging health, education and
nutrition interventions, village plans
feeding into district plans for
SSA/MDM, RCH/NRHM, ICDS;
expansion of services by starting new
ICDS centers, engaging more teachers
etc.
No consolidated village plans for
child development whatever is
planned at district level for the
block separately for health,
education and nutrition projects
Convergence in
service provision
Facilitated by VRG; specific fix day
services
Work in silos
Community
Mobilization
Through Village Resource Groups
(VRG); integrating Village Education
Committees (VEC), Village Health
Committees and ICDS related groups
with Panchayati Raj institutions and
providers.
Separate Committees like VECs,
Health Committees etc; extent of
their involvement is not known
Community awareness
programs
Bachpan, through the Sandesh Vahinis
and Kala Jathas; engagement of Jan
Mitras
Standard government IEC programs
through wall writing etc.; limited in
nature
Training of frontline
providers
Anganwadi workers, ANMs and
teachers trained for context specific
issues
Training of providers as by the CSS
plans
Child Development Outcomes/Milestones to be monitored
While the pilot was aimed at changing household behavior and practices, planning for children at the
grassroots level, and the convergence of service delivery modalities, the impact of the pilot is measured
on the changes in outcomes related to health, education and nutrition for various stages of child
development. The pilot monitored a variety of indicators for each milestone of development for the child
(Table 1). .

11
Table 1 Indicators on Outcome for Various Stages
Stage 1: Improved monitoring of
growth and development of
children and health of pregnant
women
Percentage of pregnant women who received full antenatal
check-up
Percentage of pregnant women who regularly received
supplementary food
Percentage of deliveries assisted by the institutionally trained
Percentage of children not underweight
Stage 2: Improved rates of
immunization by end of year 1;
completion of all prophylaxis of
Vitamin A; average daily time
spent on adult-child interaction
in families
Percentage of mothers of children under one year who have
provided six months exclusive breast-feeding
Percentage of children fully immunized by year 1
Percentage of children who have completed all prophylaxis of
Vitamin A
Percentage of children with appropriate weight-for-age
Average daily time spend on adult-child interaction in the
family
Stages 3/4 Quality of early
childhood education; teacher and
student attendance; rates of
dropouts and transition;
achievement levels in Grade 2
Percentage of children entering Grade 1 who have an adequate
vocabulary in the school language
Percentage of Grade I children who have attended preschool
program
Percentage of teacher and student attendance
Rate of dropout and transition to next stage
Achievement levels in language and Mathematics in Grade 2
Percentage of 6-11 year olds completing primary education

12
Chapter 3: Progress in Processes and Identified Outcomes/Milestones
The objectives of the interventions facilitated by the NGO in the treatment block (220 villages in Bajna)
included: (a) creating awareness on child development issues and needs; (b) strengthening linkages
between different service providers; (c) strengthening linkages between service providers and the
community; (d) formation of village resource groups that brought convergence of concerns, ideas and
plans regarding child development needs and service delivery modalities; (e) development of integrated
village plans around the needs of children; and (f) advocate and lobby with local, block and district
administration for provision and facilitation.
The changes expected could thus be perceived in: (i) the way communities participate and work together
in child development related activities; (ii) the processes of service delivery; (iii) knowledge and practices
of community/households regarding child care; and (iv) outputs and outcomes. In this section, the
changes in outputs and outcomes are taken up for detailed analysis.
3.1 Changes in Community Mobilization
Since the project interventions pay a great deal of attention to community energizing and mobilizing, it is
important to look at whether the interventions actually altered the way communities think and work on
child development issues and related service delivery improvements. During the baseline survey, what
emerged strongly was a lack of awareness/understanding on the part of households and the community of
what best methods to employ for child care and development. Additionally, there was a general apathy
and indifference toward the health/education/AWC providers. The focus group discussions and process
documentation in Bajna during the end-line survey show improvements in community awareness, child
care practices, and demand for better services. Focus group discussions in Sailana indicate the awareness
of people about the interventions taking place in the neighboring villages in Bajna, and a desire to emulate
some of the interventions, for which there were demands for a facilitating agency (like the NGO-
supported facilitators in Bajna).
One of the first measures used to understand the impact of the community-based interventions was to ask
people directly about the changes in service delivery. Using the “citizens’ report cards” type of questions,
during the end-line survey households were asked whether the provision of services had changed over the
last three years. In both control (Sailana) and treatment (Bajna) blocks, households reported
improvements, but those who reported improvements in service delivery, especially significant
improvements, were at least 5 times more in percentage terms in Bajna, when compared to Sailana. For
example, 36% of people in Bajna felt AWC services had improved significantly during the last three
years, while only 7% in Sailana reported the same. Regarding health care services, 91% of people
surveyed in Bajna mentioned improvements in service delivery, while only 51% felt the same in Sailana.
Only 13% people in Bajna reported that nothing had changed in schools during the three years of
intervention, as against 57% in Sailana. Improved community mobilization and activities were reported in
Bajna by 47% of respondents, whereas only 15% experienced the same in Sailana (Table 2).

13
Table 2 Changes in Service Provision Over the Last 3 Years
AWC Health care Schooling
Community
mobilization
Bajna Sailana Bajna Sailana Bajna Sailana Bajna Sailana
IMPROVED 88.9% 80.4% 90.55% 51.0% 87.3% 43.8% 47.0% 15.12%
(0.63) (0.85) (0.58) (1.1) (0.66) (1.05) (0.99) (0.76)
Improved significantly 35.5% 7.2% 18.3% 2.5% 25.6% 2.6% 5.3% 0.9%
(0.95) (0.5) (0.77) (0.33) (0.87) (0.33) (0.44) (0.2)
Improved somewhat 53.4% 73.2% 72.25% 48.5% 61.7% 41.2% 41.7% 14.12%
(0.99) (0.94) (0.89) (1.06) (0.97) (1.04) (0.98) (0.74)
No change/ worsened 11.1% 19.6% 9.45% 49.0% 12.7% 56.17% 53.02% 64.93%
(0.6) (0.84) (0.58) (1.1) (0.65) (1.04) (0.9) (0.7)
Figures in parentheses show standard errors
Source: Household Survey, 2005-06 and 2009
The evaluation attempted to understand community awareness about activities that the main intervention
in the trial region strove to improve: household knowledge/awareness of child related census and
planning, and the nature of their involvement in the process in the preceding one year. The analysis of
community/household awareness of child census/planning show that the percentage of households that
were aware of the child census and planning had improved from 51% to 85% between baseline and end-
line in Bajna (an increase by 35 percentage points), as compared to an increase by only 16 percentage
points in Sailana. In Bajna, the percentage of households with knowledge about who conducts
survey/census/planning and for what purpose the survey/planning was carried out, jumped from a mere
10% to 86%. This improvement is more significant than that reported in Sailana (Table 3).
Table 3 Awareness and Participation in health/education/AWC related activities
Baseline End-line
Bajna Sailana Bajna Sailana
Is the HH aware of any child census/planning 51.2% 46% 85.8% 62.0%
Who conducts the survey 10.3% 30.9% 85.6% 62.5%
Have you participated in any school/AWC/health
committee activities 2.87% 2.8% 52.9% 22.56%
Participated in school committee 0.5% 1.8% 24.19% 15.98%
Participated in AWC committee 0.2% 0.9% 43.9% 11.8%
Participated in Health Center committee 0% 0.9% 10.36% 1.24%
Participated in committees as a user/parent
0.04%
1.5%
51.54% 21.9%
Participated in committees as a member of the
community 4.5% 0.64%
Have a role in decision making 0.64% 1.33% 7.6% 2.45%
Attended most of the meetings 1.04% 2.22% 44.8% 18.6%
Having a committee good for community 73.9% 63.5%
Source: Household Survey, 2005-06 and 2009
While households who reported participation in school/AWC/heath center related committee activities
was around 2.8% during baseline survey in both blocks, the end-line survey shows that in Bajna, more
than 50% households now involve themselves in service delivery related discussions and activities, while
in Sailana, only a little more than one-fifth of the households participated in school/AWC/health center
related activities at the time of end-line survey. In Bajna, 52% households attended health/education
/nutrition related meetings as parents/users, compared to 21% in Sailana. Only 2.5% of the Sailana

14
households reported having ever been part of a decision making forum in any of the committees, while in
Bajna 7.6% households (14% of all households interviewed) reported being part of decision making
regarding heath/education/nutrition related service delivery.
3.2: Stage 1: Improved monitoring of growth and development of children and health of pregnant
women
In this stage, the main concerns revolve around the health of pregnant women and the initial growth of
infants.
1. Did pregnant women and their households prepare themselves enough to embrace a healthy,
responsive newborn?
How a pregnant woman and her family are taken care of during pregnancy has a bearing on the newborn’s
health. Health care during pregnancy (antenatal care, or ANC) is vital for the baby’s development in the
first few months. ANC is a complex mix of services ranging from advice on recommended diets,
monitoring and recording bodily changes, to counseling on precautions to be taken during pregnancy. The
aim is to identify, prevent and treat conditions that can endanger the life of the mother and the fetus.
Usually, the doctor or health worker provides ANC. Timely and adequate number of checkups is essential
for proper monitoring of a pregnancy. A basic (but complete) ANC schedule includes a minimum of
three antenatal care visits, consumption of the prescribed dosage of iron and folic acid, and vaccination
against tetanus.
(a) Anganwadi Centre checkups
Information on antenatal care was collected from mothers of children in the 0-12 months age group. The
following indicators were examined: (i) whether the pregnant woman availed of any (or at least one)
Anganwadi Centre (ANC); (ii) whether she went in for the full ANC; (iii) whether she availed of ANC
during the first trimester itself; (iv) whether she received various components of ANC checkups; (v)
average number of ANC visits by pregnant women; and (vi) whether mothers-to-be received post-ANC
feedback and support.
Any ANC: The indicator is a minimal measure, as it considers pregnant women who had made at least
one antenatal visit. The baseline survey results shows that in 2005-06, around 25% of the mothers in
Bajna and 80% of mothers in Sailana had at least one ANC during their pregnancy. The figures for in
these two blocks are comparable to the MP state average figures (77% in rural MP in 2005-06)
available from NFHS-3 (National Family Health Survey). The end line survey results show that by
2009, almost 98% of all mothers reported having at least one ANC checkup during their pregnancy.1
Full ANC: A full ANC includes a minimum of three ANC visits. In 2005-06, only 8% of mothers
had received full ANC in Bajna when compared to 23% in Sailana. As per the NFHS-3 survey of
2005-06, in rural MP, more than 34.6% of mothers made at least three antenatal visits during their
most recent pregnancy. An analysis of the end-line shows that 24% of mothers in Bajna and 32%
mothers in Sailana received full ANC treatment. Bajna’s improvements were significantly better than
those of Sailana.
First ANC: As per the baseline survey of 2005-06, in Bajna, 12% of pregnant women had their first
ANC during the first trimester, while in Sailana, 21% of women availed of ANC during the first
trimester itself. Around 49% of women in Bajna and 56% of women in Sailana had their first ANC
1 An analysis using the difference–in-difference approach shows that the improvements in ANC were more prominent in Bajna, though the improvements were not significant enough to be statistically better than the changes in Sailana.

15
checkup during the second trimester. Thus, in 2005-06, 61% of women in Bajna and 77% of women
in Sailana made their first ANC visit during the first two trimesters. The end-line survey shows
tremendous improvements in the first ANC visits during the first trimester itself (57% in Bajna and
87% Sailana). A comparative analysis of the indicator “time of first ANC visit by pregnant women”
of the two blocks shows that the improvements were significantly better in Sailana, but the proportion
of pregnant women who made the first ANC visit within the first six months was more or less the
same in both blocks.
Provision of different components of ANC: Pregnant women availing of ANC is a demand side
indicator, while the supply side indicator (or service delivery indicator) measures how many of those
who approached the health center/AWC received the various components of ANC. Of those who
received “any ANC,” the most common components provided were weight and height measurements,
blood pressure, and blood chemistry. It is interesting to note that the changes in the many components
of ANC provided were more prominent in Sailana than in Bajna. This is especially true for the three
most-commonly offered components. In Sailana, the baseline figures were lower than that in Bajna,
but the end-line demonstrates better indicators for Sailana. However, we found that for the abdomen
examination (the most important component of ANC), Bajna recorded a giant leap from less than
10% during baseline, to more than 60% by end-line. In Sailana, on the other hand, this declined from
a little less than 60% to around 11% by end-line. This poses an interesting issue. Was this result due
to Bajna health workers/AWCs/doctors relying on abdominal examinations, compared with Sailana,
where service providers prescribed a number of examinations without taking into account the basic,
abdominal examination? This study, given its quantitative data analysis focus, is not equipped to
decipher these differences.
Mean number of ANC visits: On average, pregnant women in Bajna had less than two ANC
checkups in 2005-06, which has now increased to at least two checkups (end-line survey, 2009). In
Sailana, the number of ANC checkups has improved slightly from 1.7 times to 2.2 times between
baseline and end-line surveys.
Feedback and follow up action post ANC: One of the key milestones that the project hoped to
achieve was an improvement in antenatal care. Availing of ANC services coupled with the
doctors/ANMs providing the right feedback for corrective action was intrinsic to the success of the
pilot. The baseline survey indicated that only 33% of pregnant women in Bajna and 36% in Sailana
received any feedback after their ANC. However, the end-line survey shows tremendous
improvement, with 85% of pregnant women in Bajna and 71% in Sailana reporting having received
feedback post ANC. The improvements in Bajna were significantly more than the advancements
made in Sailana. Any follow-up action post ANC was also improved significantly upon in Bajna,
when compared to Sailana during the period 2005/06-2009.
(b) Iron and Folic Acid Intake (IFA)
Since most of the women in the area are generally undernourished, it is important that they have sufficient
nutritional intakes, generally in the form of iron and folic acid (IFA) tablets. The baseline survey shows
that around 72% of the women in Bajna and 79% of women in Sailana had received IFA tablets during
their pregnancy. Our end-line survey revealed that the intake of IFA by pregnant women had improved,
and 97% of women in Bajna and 88% in Sailana took IFA tablets. The analysis shows that the
improvement in Bajna was significantly better than that in Sailana. It also revealed that the intake of IFA
was also significantly higher among mothers with full ANC. All mothers who had followed the full ANC
cycle received supplementary nutritional intake during their pregnancy, compared with only 70%
(baseline survey) and 77% (end-line survey) of those who had not. This meant that a majority of mothers
(75%) who had no ANC checkups did not receive supplementary nutrition intake during their pregnancy.

16
Clearly, the role of ANC checkups for identifying nutritional deficiencies and taking remedial measures
on the part of mothers is evident from these results.2
(c) Vaccination against tetanus
Neonatal tetanus is a very common cause of death among neonates, and is common among children who
are delivered in unhygienic environments, or when unsterilized instruments are used to cut the umbilical
cord. Hence, it is vital that in regions where there is a dearth of adequate health care, the mother is
vaccinated against tetanus to prevent the likelihood of neonatal tetanus. An analysis of the baseline and
end-line survey results show that in the block where Bachpan was implemented, the improvements were
significant when compared to the control block. Mothers who went in for a full ANC were also given the
Tetanus Toxoid vaccination during their ANC visits, whereas those with no ANC were mostly left out.
Table 4: Indicators Related to ANC (Sub-Stage 1 of Child Development)
Baseline Survey End-line Survey Regression
coefficients
Diff-in-
difference
Bajna Sailana Bajna Sailana Bajna Sailana coefficients
Percent of pregnant women who:
Did not receive/avail of any
ANC
24.9% 19.8% 1.3% 0.4% -0.22 -0.194 -0.033
(0.015) (0.017) (0.006) (0.003) (0.019) (0.018) (0.027)
Availed of at least one ANC 75.1% 80.2% 98.7% 99.5% 0.226 0.193 0.033
(0.015) (0.017) (0.006) (0.003) (0.019) (0.0.18) (0.027)
Availed of the full ANC 8.9% 23.8% 24.4% 32.5% 0.148 0.087 0.061*
(0.009) (0.018) (0.018) ((0.021) (0.019) (0.027) (0.032)
Mean number of ANC 1.4 1.7 2.05 2.26 0.627 0.578 0.04817
(0.035) (0.057) (0.03) (0.031) (0.052) (0.067) (0.084)
Of those who received some ANC, those who
Had their first ANC within
the first two trimesters
48.8% 55.3% 89.01% 98.1% 0.402 0.428 -0.026**
(0.017) (0.021) (0.014) (0.006) (0.024) (0.016) (0.034)
Had their first ANC during
the 1st trimester itself
11.8% 21.2% 56.3% 88.2% 0.444 0.670 0.225***
(0.011) (0.017) (0.022) (0.015) (0.022) (0.023) (0.032)
Those who received different components of ANC
Had their weight measured
during ANC
64.9% 59.2% 85.2% 83.9% 0.202 0.248 -0.045
(0.016) (0.021) (0.016) (0.017) (0.024) (0.027) (0.036)
Had their height taken
during ANC
46.5% 19.4% 56.7% 83.1% 0.092 0.637 -0.545***
(0.017) (0.017) (0.022) (0.017) (0.028) (0.023) (0.038)
Had their BP checked
during ANC
42.0% 20.5% 63.7% 76.8% 0.212 0.563 -0.351***
(0.017) (0.017) (0.021) (0.019) (0.027) (0.025) (0.038)
Had their blood tested
during ANC
23.6% 23.2% 53.6% 59.8% 0.300 0.365 -0.065*
(0.015) (0.018) (0.022) (0.022) (0.025) (0.028) (0.038)
Had their urine tested during
ANC
16.9% 12.3% 38.5% 38.6% 0.213 0.263 -0.050
(0.012) (0.014) (0.021) (0.022) (0.023) (0.025) (0.035)
Had their abdomen
examined during ANC
9.9% 58.6% 60.2% 10.5% 0.498 -0.481 0.978***
(0.010) (0.021) (0.022) (0.014) (0.021) (0.026) (0.033)
Had an internal examination 16. 9% 22.9% 11.3% 5.3% -0.057 -0.176 0.119***
2 However, it was not easy to ascertain whether they consumed these for 90 days or more when they were pregnant, as most of the mothers lacked recall on this.

17
Table 4: Indicators Related to ANC (Sub-Stage 1 of Child Development)
Baseline Survey End-line Survey Regression
coefficients
Diff-in-
difference
Bajna Sailana Bajna Sailana Bajna Sailana coefficients
during ANC (0.013) (0.018) (0.014) (0.01) (0.019) (0.021) (0.029)
Had their X-Ray done
during ANC
0.2% 0.7% 6.2% 6.7% 0.059 0.060 0.001
(0.001) (00.03) (0.01) (0.011) (0.008) (0.011) (0.01)
Other aspects
Intake of IFA 71.7% 78.6% 96.5% 87.8% 0.240 0.092 0.147***
(0.016) (0.017) (000.8) (0.015) (0.020) (0.023) (0.0312)
Vaccination of TT 77.1% 83.5% 95.0% 88.0% 0.178 0.045 0.133***
(0.015) (0.016) (0.009) (0.015) (0.019) (0.022) (0.029)
*Indicates significance at 0.01 confidence level (statistically significant at least at 90% level.
** Indicates significance at 0.05 level (statistically significant at least at 95% level.
*** Indicates significance at 0.001 level (statistically significant at 99% level).
Figures in parenthesis are standard errors.
2. How many of these pregnant women ensured a safe delivery?
Deliveries in a health facility under medical supervision, or at home but conducted by a health
professional (doctor/nurse/traditional birth attendant), are considered as safe deliveries. Even though
childbirth is a natural process, the presence of a trained assistant is important to handle any emergencies
that might arise, as quick and informed action can save the life of both the mother and the child. Using
this definition of safe delivery, according to an RCH survey (2005) the percentage of safe deliveries in
MP in 2004 was around 35.5%. This is lower than the national average of 48%. In Ratlam, however, the
corresponding figures were a little over 50%.
Table 5: Results related to improvements in Safe Delivery practices
BASELINE SURVEY END-LINE SURVEY
Regression
coefficients
Diff in
difference
Bajna Sailana Bajna Sailana Bajna Sailana Coefficients
Place of Delivery
Home 67.5% 74.9% 31.3% 71.3% -0.365 -0.036 -0.329***
(0.016) (0.018) (0.0203) (0.0204) (0.026) (0.027) (0.038)
Government Health Facility 29.8% 16.5% 67.7% 28.7% 0.372 0.121 0.251***
(0.0158) (0.0158) (0.021) (0.020) (0.025) (0.025) (0.036)
Institutional delivery 31.7% 24.5% 68.0% 28.6% 0.363 0.0415 0.321***
(0.016) (0.018) (0.02) (0.020) (0.026) (0.0273) (0.038)
Assistance during Delivery
Health Professional 34.5% 29.0% 76.7% 34.9% 0.415 0.059 0.358***
(0.016) (0.019) (0.019) (0.022) (0.025) (0.028) (0.038)
Traditional Birth Attendant 49.6% 61.2% 15.9% 32.1% -0.334 -0.29 -0.0436
(0.017) (0.021) (0.016) (0.021) (0.025) (0.029) (0.038)
Delivery not in govt. b’se it’s
far off 50.1% 51.7% 21.4% 27.3%
Orientation about child care and 14.8% 33.6% 64.2% 18.3% 0.49 -0.15 0.65***

18
Table 5: Results related to improvements in Safe Delivery practices
BASELINE SURVEY END-LINE SURVEY
Regression
coefficients
Diff in
difference
Bajna Sailana Bajna Sailana Bajna Sailana Coefficients
post-delivery care after delivery (0.012) (0.021) (0.021) (0.017) (0.022) (0.03) (0.034)
*indicates significance at 0.01 confidence level (statistically significant at least at 90% level); ** indicates significance at 0.05
level (statistically significant at least at 95% level); *** indicates significance at 0.001 level (statistically significant at 99%
level)
Figures in parentheses show standard errors in estimation
The baseline survey showed that in Bajna, home births constituted 68% of all deliveries, and in Sailana, it
stood at 75%. In keeping with this finding, it was noted that health professionals’ attendance at deliveries
was less than 35% in Bajna, and less than 30% in Sailana. The majority of deliveries (especially those at
home were attended to by a traditional birth attendant (TBA), the most accessible option. Interestingly, by
the time of the end-line survey, there were some changes: in Bajna, only 31% of the deliveries were at
home, whereas in Sailana, a large number (71%) continued to have home births. In Bajna, 77% of births
were attended to by a health professional, compared with only 35% in Sailana. Only 7% of deliveries in
Bajna were conducted without the presence of either a health professional or a trained/traditional birth
attendant, as against 33% in Sailana. The block-wise regression analysis of institutional deliveries shows
that the improvements from 2005-06 to 2009 were of the magnitude of 36% in Bajna, and only 4% in
Sailana, and a difference between the changes was to the extent of 32%, which is highly significant.
Similarly, deliveries attended to by a trained health professional improved by 41% in Bajna and by
around 6% in Sailana, a difference of 36% in improvements. See Table 5 for details.
3. Orientation post-delivery about subsequent health care and childcare
Since most of the deliveries, especially during the baseline survey, were not institutional (they took place
at home), any orientation regarding childcare from health workers/anganwadi workers/birth attendants or
even elders in the family, is crucial for the mother of the newborn. In keeping with the high rate of births
taking place at home and attended to by TBAs, the results show that very few mothers received some
orientation post delivery (15% in Bajna, and 30% in Sailana) at baseline. However, the end-line survey
results show that around 35% of mothers received orientation post delivery in both Bajna and Sailana.
The improvements in Bajna are significant not only because of their low levels in baseline indicators but
also because of the number of women catered to (the higher number of institutional deliveries in Bajna is
described in detail in the section that studies project outcomes/milestones).
4. Were the newborns taken care of properly?
It is important that wherever the child is born—at home or in an institutionalized set up—it is born
healthy and given the care that it deserves. Appropriate antenatal care has a considerable influence on the
health of the fetus and the newborn. Additionally, with adequate postnatal care, those born ‘not so
healthy’ display higher recovery rates.
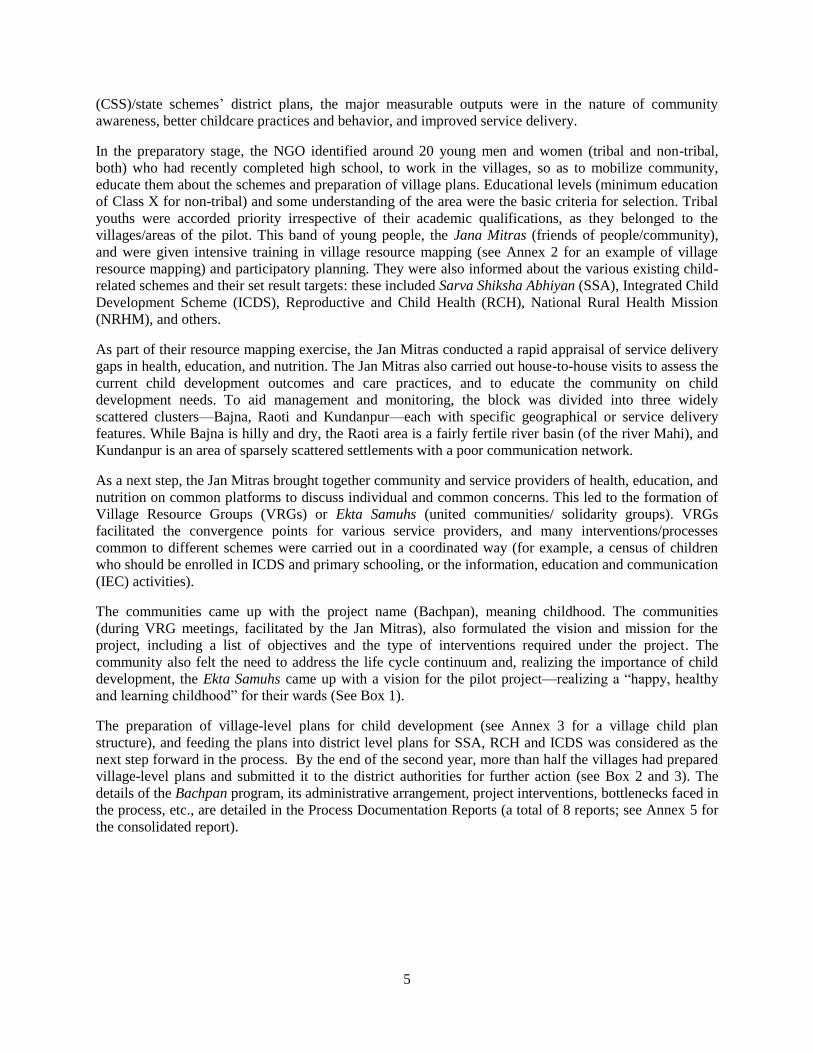
Newborns whose weights were recorded at birth: As a consequence of non-institutional deliveries, most
children’s weights were not taken at birth, even in the case of TBA-assisted births. The frequent fallout of
this negligence is that underweight babies are not identified at the appropriate time, and corrective
measures are overlooked. The baseline survey shows that weight was recorded at birth for only 34%
newborns in Bajna and 24% in Sailana. But the end-line shows that this has shot up to 79% in Bajna, and
gone up marginally to 29% in Sailana.

19
Breastfeeding and complementary feeding practices: Exclusive breastfeeding facilitates an infant’s initial
growth, but subsequently, the child should be provided with timely and appropriate complementary
feeding. It must be noted that the concept of exclusive breastfeeding, especially at birth, did not exist in
the communities under study (both Bajna and Sailana). Along with mother’s milk, infants were generally
fed goat milk and water, right from the first day itself. On the other hand, the custom in the area is that
often breast milk is not given to newborns immediately after birth. It was observed that breastfeeding was
started only after a few days after birth; this practice was rooted in tradition that believed mother’s milk to
be harmful for the newborn. In both villages, a large proportion of mothers (on average, about 41%)
squeezed out the milk rather than let their baby drink it. The end-line survey shows that in Bajna, 38% of
mothers did this in comparison to 75% mothers in Sailana. In such a context, the relevant question is
whether mother’s milk was given apart from other fluids within the first few hours of birth. In Bajna, 62%
of the newborns were breastfed at birth, while this was as low as 46% in Sailana. This percentage is, in
fact, much higher than MP state figures (overall 15%; in rural areas, only 13%).3 By the time of the end-
line survey, more than 77% of mothers in Bajna and 76% in Sailana had breastfed their newborns at birth.
Were children getting enough nutrition to ensure appropriate weight-for-age/height? In keeping with the
U.S. National Center for Health Statistics (NCHS) standard, in this report we follow three indices of
physical growth that describe the nutritional status of children: (a) height-for-age (stunting); (b) weight-
for-height (wasting); and (c) weight-for-age (underweight).4
In Bajna, the two indices of stunting and underweight improved faster than that in Sailana, whereas in the
case of wasting, there was no great improvement over Sailana. The baseline survey showed that only
around one-fifth of children in their early months had proper weight-for-age in both Bajna (21%) and
Sailana (22%). Another 15-20% infants in these blocks were mildly undernourished (weight-for-age is <-
1 SD). However, an alarming majority of children in their first year were found to be severely
malnourished (65% in Bajna, and 58% in Sailana). Worse, 34% in Bajna and 31% in Sailana were
acutely malnourished. Three years down the line, there is definite improvement in both blocks, but not to
the extent expected, especially in view of the focus given to this issue in Bajna during the project
interventions. The proportion of “normal” children improved from 21% in baseline to 27% at end-line in
Bajna and from 22% at baseline to 29% in the end-line survey in Sailana. However, it is heartening that
there is a reduction (in both blocks) in the proportion of children who were severely and acutely
malnourished, with significantly more reduction in Bajna. The decline in the proportion of underweight
children in households in Bajna was 22% and 12% respectively for severe (proportion of children with <-
2SD weight-for-age) and acute malnourishment cases (proportion of children with weight-for-age is <-
3SD). The same was in the order of 8% and 1% in Sailana, and the overall differences between the
changes in both blocks were of the magnitude of 13% for severe and 11% for acutely malnourished
children.
3 Data from NFHS-3, 2005-06. 4 This study was designed before the World Health Organisation (WHO) prescribed the new growth standards in 20064 that were adopted by the Government of India. Therefore, during the baseline analysis the only measure used for understanding the nutritional status of children was to look at age-related weight of children, as derived from the U.S. National Center for Health Statistics (NCHS) standard, and which was recommended at that time by the WHO. According to the NFHS-3, 2005-06 report, “The new WHO growth standard adopts a prescriptive approach, describing how healthy children should grow. The new standard is based on children around the world (Brazil, Ghana, India, Norway, Oman, and the United States) who are raised in healthy environments, whose mothers do not smoke, and who are fed with recommended feeding practices (exclusive breastfeeding for the first 6 months and appropriate complementary feeding from 6 to 23 months). The WHO growth standard identifies the breastfed child as the normative model for growth and development standards, depicts normal early childhood growth under optimal environmental conditions, and can be used to assess children everywhere, regardless of ethnicity, socioeconomic status, and type of feeding.” (NFHS-3, 2005-06, India Report Volume I, page 268).
20
Table 6. Improvements in reducing proportion of children underweight
BASELINE SURVEY END-LINE SURVEY
Regression
coefficients
Diff in
difference
Bajna Sailana Bajna Sailana Bajna Sailana coefficients
New born babies’ weight
measured
33.6% 24.5% 78.6% 28.6% 0.450 0.041 0.408***
(0.016) (0.018) (0.018) (0.020) (0.033) (0.027) (0.037)
Measures of physical growth that describe the nutritional status of children:
Proportion of children with :
Height-for-age (stunting)
=<-2SD
89.1% 62.3% 63.3% 62.2% -0.0005 -0.256 -0.255***
(0.01) (0.02) (0.02) (0.02) (0.030) (0.02) (0.013)
Weight-for-height (wasting)
=<-2SD
34.2% 50.8% 31.02% 41.66% -0.0915 -0.0318 0.059
(0.016) (0.02) (0.02) (0.02) (0.030) (0.026) (0.04)
Weight-for-age (underweight)
=<-2SD
64.8% 57.9% 43.3% 49.4% -0.215 -0.085 -0.129**
(0.016) (0.021) (0.022) (0.023) (0.027) (0.031) ((0.041)
No complementary food even
at 12+ months
30.0% 17.0% 3.9% 1.8% -0.26 -0.16 -1.012***
(0.018) (0.018) (0.008) (0.005) (2.0) (2.2) (3.03)
Mean height- in cm for boys 53.2 59.6 57.3 58 3.99 -1.59 5.59***
(0.005) (0.006) (0.005) (0.007) (0.75) (0.9) (1.16)
Mean height – in for girls 52.8 57.4 56.9 57.8 4.11 0.27 3.83***
(0.006) (0.006) (0.005) (0.007) (0.79) (0.90) (1.19)
*indicates significance at 0.01 confidence level (statistically significant at least at 90% level); ** indicates significance at 0.05
level (statistically significant at least at 95% level); *** indicates significance at 0.001 level (statistically significant at 99% level)
Figures in parentheses show standard errors in estimation
Who takes care of the child? In these regions, habitations primarily consist of close and distant relatives,
or those belonging to the same community. Hence, there is a strong bonding between members in a
household and also with the community. Traditionally, the newborn is either taken care of by the mother
herself, or by family members, including older siblings or grandparents. At baseline, the involvement of
the father in childcare was reported only in 20% in the 0-12 months age bracket in Bajna, in contrast to
61% of the households in Sailana reporting father’s role in infant care. However, in both blocks, the
involvement of fathers is largely limited to a short time period per day, and mainly involved “taking child
for a walk.” Very few households reported that the father was took his child for immunization and/or to
heath centers.
In the end-line survey, 88% of households in Bajna (a four-fold increase over the baseline) and 83%
households in Sailana (up 20 percentage points) reported that fathers are now more involved in infant care
in one way or another. Moreover, 27% of households in Bajna and around 40% households in Sailana
reported that fathers take care of infants for a sizeable amount of time.
Summary of Results: Stage 1
The analysis of antenatal care practices of pregnant women, and the modalities of delivery and post-
delivery practices and care for the newborn child shows mixed results in terms of the impact of the
Bachpan project. While some of the antenatal care related practices improved much more in the non-
project block, changes related to delivery and postnatal care practices were better in the project block than
in the control block.
Overall, the analysis demonstrates that practices related to antenatal care had improved in both Bajna and
Sailana, though the magnitude of change was of different scales for different components of ANC, and

21
hence have different meaning for the two blocks. Sailana showed equal or better changes than Bajna on
many counts, almost to the level of dismissing the role of interventions under the Bachpan project.
However, when the qualitative changes in practices are considered, the project’s value addition is borne
out. For example, while the numbers of women opting for ANC had gone up in Sailana, Bajna reflected
significantly more improvements in women going in for the full ANC checkup, crucial for improving the
gains from ANC (3.4% better than the gains in Sailana). Similarly, the gains in Bajna between baseline
and end-line with respect to IFA intake and TT vaccine of mothers were 9.8% and 10% better than the
gains in Sailana.
The interventions by ANMs and Anganwadi workers in both Bajna and Sailana seem to be generating
enhanced awareness among communities about the need for consultations with doctors, as is evident from
the increased demand for ANC checkups. The quality of service delivery is also improving, evident from
the fact that more pregnant women report feedback and follow up actions. These changes, indicative of
deep qualitative behavioral change (or change in practices), are further evident from the indicators related
to IFA intake and TT vaccination. While services provided and availed of improved in the control block,
the treatment block displayed more qualitative improvements.
3.3 Stage 2: Take off period? Children aged between 1-2 years
The foundation for a child’s development is ensured through appropriate antenatal care, safe delivery, and
the type of childcare provided to the infant. The first two years of a toddler’s life is critical for brain
development and for building cognitive and physical capabilities. Moreover, this period is important as
the child is now extremely susceptible to environmental influences. This is also the stage when corrective
measures should be acted upon to compensate for any nutritional inadequacies accumulated during the
later months of the first year. If the second year also passes by without correction, the deprivation may in
fact result in deficits that might be irreversible. During this period, immunization of the child against
various communicable diseases and other childhood illnesses becomes vital, as does the child’s nutritional
needs.
The indicators to gauge their development during this sub-stage are: (a) children in the 12-23 month (1-2
years) age groups received vaccinations against the 6 serious but preventable diseases (which are essential
for child survival); and (b) children who are not underweight for their age.
During the household survey, mothers were asked whether their children were immunized against
tuberculosis (BCG), diphtheria and tetanus (DPT), poliomyelitis, and measles. Full immunization of a
child includes BCG, Measles, three booster shots of DPT, and three polio shots excluding the Polio 0. The
NFHS-2 (1999) reported that 17% of the children aged 12-23 months in rural MP received all
immunization, and by 2005-06 (NFHS-3) this had improved to 32%. For Ratlam district, the number of
children fully immunized by the time they were 2-years-old was only 5.7% (NFHS-2). These rates of
immunization at baseline are low even when compared to the M.P state average (as available from NFHS-
2 and 3).
Immunization: During the baseline survey, in Bajna, only 5.2% of the children in the age group of 12-23
months had received full immunization, while Sailana stood at a marginally better 6.5%. Three years
later, these figures improved several-fold in both blocks.
A disaggregated analysis of the proportion of children receiving different doses of Polio and DPT
vaccines during the baseline survey highlights a major problem that existed with the immunization
scenario in these blocks, especially in Bajna. The baseline survey data show that the proportion of
children who received the successive three booster doses of Polio and DPT vaccines was low, particularly
in Bajna. In Bajna, while 77% of the children took the DPT 1 shot, only 16% availed of the DPT 3
vaccination, indicating that 61% children dropped out between DPT 1 and DPT 3. On the other hand, in

22
Sailana, 67% children took the DPT 1 vaccination, and 56% took the DPT 3 shot, a drop of only 11%.
Similarly, 89% of children in Bajna received the Polio 1 vaccine while only 20% received the Polio 3
vaccine, compared to Sailana, where 95% children were given Polio 1 and 88%, Polio 3. As a result, in
Bajna, while many children took one dose of these vaccines, those who received the complete stipulated
inoculation were far fewer. Only those with full immunization were actually protected from these
diseases.
Table 7: Details of immunization of children between 1- 2 years of age
BASELINE SURVEY END-LINE SURVEY
Regression
coefficients
Diff in
difference
Bajna Sailana Bajna Sailana Bajna Sailana coefficients
BCG 82.7% 77.2% 96.3% 94.9% 0.136 0.177 -0.04089
(0.015) (0.0202) (0.008) (0.011) (0.018) (0.023) (0.03)
DPT 1 77.4% 66.9% 95.6% 94.3% 0.182 0.274 -0.0924**
(0.017) (0.0227) (0.009) (0.01.2) (0.02) (0.03) (0.033)
DPT 2 47.6% 62.5% 83.1% 91.2% 0.355 0.288 0.0672*
(0.019) (0.023) (0.017) (0.01.4) (0.03) (0.03) (0.04)
DPT 3 16.4% 55.7% 68.3% 84.8% 0.519 0.291 0.228***
(0.015) (0.024) (0.021) (0.018) (0.025) (0.031) (0.039)
All 3 DPT 15.8% 54.8% 66.9% 83.8% 0.511 0.290 0.221***
(0.014) (0.024) (0.022) (0.019) (0.025) (0.031) (0.039)
Polio 0 70.5% 91.8% 94.6% 94.3% 0.241 0.025 0.216***
(0.018) (0.0132) (0.0103) (0.012) (0.022) (0.018) (0.031)
Polio 1 89.3% 94.6% 91.9% 94.3% 0.026 -0.003 0.029
(0.012) (0.011) (0.012) (0.012) (0.018) (0.016) (0.025)
Polio 2 65.9% 92.8% 81.7% 90.9% 0.157 -0.018 0.175***
(0.019) (0.013) (0.018) (0.015) (0.026) (0.019) (0.035)
Polio 3 20.2% 87.9% 69.8% 81.9% 0.496 -0.059 0.555***
(0.016) (0.0158) (0.021) (0.0195) (0.026) (0.025) (0.037)
ALL 3 POLIO 19.4% 87.9% 68.3% 81.2% 0.489 -0.067 0.556***
(0.0157) (0.0158) (0.0213) (0.02) (0.026) (0.025) (0.037)
Measles 26.3% 8.2% 72.1% 70.9% 0.457 0.627 -0.169***
(0.018) (0.013) (0.020) (0.023) (0.027) (0.026) (0.038)
Hepatitis B 2.4% 0.5% 28.3% 36.6% 0.260 0.361 -0.101**
(0.006) (0.003) (0.021) (0.024) (0.019) (0.024) (0.03)
Full imm. Excl measles 9.9% 53.4% 65.2% 79.4% 0.553 0.260 0.292***
(0.011) (0.024) (0.022) (0.021) (0.023) (0.032) (0.039)
Full Immunization 5.2% 6.5% 56.9% 66.8% 0.517 0.602 -0.086**
(0.008) (0.012) (0.023) (0.024) (0.022) (0.026) (0.034)
*indicates significance at 0.01 confidence level (statistically significant at least at 90% level); ** indicates significance at
0.05 level (statistically significant at least at 95% level); *** indicates significance at 0.001 level (statistically significant
at 99% level)
Figures in parenthesis are standard errors of estimation
The emerging lesson for health providers in Bajna was that while people were aware of the various
vaccines for babies, they were not cognizant with the components of the vaccines and the requirement to
provide all the different dozes within the stipulated timeframe. While this was an indication of the lack of

23
awareness among the community and parents, it also pointed to the inadequate IEC (information,
education and communication) efforts on the part of the schemes. The baseline survey results also
brought out the fatigue factor in campaigners, who lost the initial momentum and were not able to
mobilize the community to get the booster vaccines. Also, parental lethargy set in with successive doses.
This problem was more acute in Bajna than in Sailana. The interventions under Bachpan were aimed at
improving community awareness about the vaccination requirements and in motivating service providers
to enable synergies between supply and demand.
As is evident from the table, the percentage of children who took the required vaccines improved from
baseline to end-line in both Bajna and Sailana. While Sailana had better indicators overall, especially
with respect to the booster shots of DPT and Polio, the improvements in Bajna were much better,
especially given their low baseline indicators. However, in three years’ time, Bajna was able to accelerate
its vaccination related practices. There were significant improvements in the immunization of both boys
and girls, with better indicators in Sailana, but better improvements in Bajna. For a closer scrutiny, see
Table 8.
Table 8: Details of immunization of children between 1- 2 years of age: by gender
BOYS GIRLS
Baseline Survey End line survey DID Baseline Survey End line survey DID
Vaccination Bajna Sailana Bajna Sailana Coef Bajna Sailana Bajna Sailana Coef
BCG 81.9% 76.7% 96.5% 94.6% -0.033 83.6% 77.8% 95.9% 95.2% -0.049
All 3 DPT 15.3% 53.4% 68.9% 83.2% 0.238*** 16.4% 56.8% 64.6% 84.4% 0.205***
Polio 0 68.9% 92.5% 96.5% 95.1% 0.250*** 72.5% 90.9% 92.4% 93.6% 0.172***
ALL 3 POLIO 17.2% 87.8% 69.3% 80.7% 0.591*** 22.1% 88.1% 67.3% 81.7% 0.515***
Measles 26.8% 8.7% 72.4% 68.8% -0.145*** 25.7% 7.4% 71.8% 73.1% -0.196**
Hepatitis B 3.4% 0.4% 32.7% 38.6% -0.089 1.1% 0.6% 23.3% 34.4% -0.115**
Full Immu.zn 4.8% 6.7% 57.6% 65.8% -0.063 5.7% 6.3% 56.1% 67.7% -0.111*
Full imm. Excl
measles 9.3% 51.4% 66.5% 79.2% 0.293*** 10.7% 56.3% 63.7% 79.6% 0.296***
*indicates significance at 0.01 confidence level (statistically significant at least at 90% level); ** indicates significance at 0.05
level (statistically significant at least at 95% level); *** indicates significance at 0.001 level (statistically significant at 99% level)
Nutrition Status: Are Bajna and Sailana children growing up healthy and well nourished in their first and
second years? Are they compensated for the undernourishment accumulated in their first year? A
comparison of growth and malnutrition status (using the three growth indicators of height-for-age,
weight-for-height, and weight-for-age) of children aged 12-24 months with that of infants (0-12 months),
is carried out here.
Baseline survey data shows that the health status of children had not improved after they turned one;
rather, they further deteriorated in their second year. If in their first twelve months only 41% of children
were severely malnourished in Bajna and 33% in Sailana, by the time they completed their second year,
their share went up to 66% in Bajna and 51% in Sailana. This is quite similar to the figures for rural MP
(62.6% in 2005-06) as reported by NFHS-3. On the other hand, the proportion of children who had
desirable weight-for-age (>-2SD) reduced from 34% in Bajna and 53% in Sailana in the 0-12 months age
group to less than 16% in Bajna and 22% Sailana.
However, the situation improved significantly between baseline and three years later. A comparison of the
weight-for-age status of children aged 12-24 months in both blocks showed marginal improvements
overall, but a comparison of the indicator between the baseline survey and end-line survey reveals that the
proportion of children with severe malnutrition (proportion of children with less than 2SD weight-for-

24
age) declined significantly in the intervention block, when compared to the control block (improvements
are 7 percentage points better in Bajna than in Sailana). However, the improvements in reducing moderate
malnourishment were better in Sailana.
Table 9: Improvements in measures of weight for age for children 12-24 months
BASELINE SURVEY END-LINE SURVEY
Regression
coefficients Diff in difference
Bajna Sailana Bajna Sailana Bajna Sailana coefficients
Height-for-age (stunting)
=<-2SD
85.66% 74.77% 76.8% 68.79% -0.115 -0.059 -0.013
(0.009) (0.02) (0.011) (0.02) (0.031) (0.023) (0.037
Weight-for-height (wasting)
=<-2SD
24.04% 51.53% 47.48% 41.49% 0.23 -0.100 0.334***
(0.017) (0.024) (0.022) (0.025) (0.028) (0.035) (0.044)
Weight-for-age
(underweight)=<-2SD
85.65% 78.32% 82.08% 67.01% -0.036 -0.113 0.077*
(0.014) (0.02) (0.02) (0.023) (0.022) (0.031) (0.037)
Mean height – in cm for
boys
68.2cm 72.1cm 70.33cm 70.4cm 2.13 -1.69 3.820***
(0.43) (0.4) (0.45) (0.98) (0.63) (0.96) (1.11)
Mean height – in cm for
girls
66.5cm 70.4cm 68.8cm 70.4cm 2.28 0.32 1.970
(0.46) (0.4) (0.46) (1.01) (0.66) (1.1) (1.21)
*indicates significance at 0.01 confidence level(statistically significant at least at 90% level) ; ** indicates significance at 0.05
level (statistically significant at least at 95% level); *** indicates significance at 0.001 level (statistically significant at 99%
level)
Figures in parenthesis are standard errors of estimation
We examine here the various possible factors for this decline in children’s health status. In both Bajna and
Sailana, less than 7% of the parents thought that their ward was underweight. Since more than 80% of the
parents in these blocks are illiterate, their only source of learning about their children’s weight-for-age
appropriateness was through the anganwadis or health workers. The statistics from the household survey
shows that among this group of children (12-23 months), only 42% children in Bajna and 57% children in
Sailana had their height and weight measured regularly at anganwadi centers (AWCs). More literate
parents than illiterate parents ensured that their children’s growth monitoring was regularly taken at
AWCs.
Parental knowledge about child malnutrition: Parents learned about their children’s weight-for-age status
from AWCs when the children were measured as part of the regular growth monitoring exercise managed
by the AWC. However, during the baseline survey, it was found that around 9% households in Bajna and
2% in Sailana were unaware of such services delivered by AWCs. About half of the respondents (54% in
Bajna, and 44% in Sailana) reported that regular growth monitoring was not taking place at AWCs, and
hence their ward’s growth was not screened.
For the small proportion of children whose growth was monitored on a regular basis, an even smaller
proportion of parents (12% in Bajna, and 26% in Sailana) kept a record of their children’s growth. In
Sailana, the figures stand at 23% among illiterates and 40% among literates.
Table 10: Regular monitoring of Child health related indicators
BASELINE SURVEY END-LINE SURVEY
Regression
coefficients Diff in difference
Bajna Sailana Bajna Sailana Bajna Sailana coefficients
Regular measure of height
& weight
41.96% 56.64% 65.21% 73.45% 0.232 0.17 0.064
(0.02) (0.023) (0.021) (0.022) (0.029) (0.033) (0.044)

25
Table 10: Regular monitoring of Child health related indicators
BASELINE SURVEY END-LINE SURVEY
Regression
coefficients Diff in difference
Regular growth monitoring 37.54% 53.85% 52.29% 69.07% 0.147 0.152 -0.004
(0.019) (0.024) (0.023) (0.024) (0.029) (0.033) (0.045)
Figures in parenthesis are standard errors of estimation
The practice of regular measuring of height and weight of children at AWCs improved between baseline
and end-line survey periods, and more evidently in the intervention block (5 percentage points better than
that in the control block).
In a scenario where the majority of children are underweight, and not identified, for the most part,
remedial action becomes a challenge. Counter measures include providing adequate supplementary
nutrition, either through additional food supplements at home, or from micro- nutrients at AWCs. The
baseline survey shows that at home, around 34% of the households in Bajna and 53% in Sailana gave
their children watered-down goat’s milk in addition to breast milk. Around 33% households in Bajna and
35% in Sailana reported that they fed their children the usual cereals and pulses everyone else took at
home—rice, roti (unleavened flat bread), dals (pulses), etc. In addition to this, 4% households in Bajna
and 5% in Sailana reported that the children were also given some vegetables in addition to cereals.
However, 29% households in Bajna and 8% in Sailana reported no supplementary food for the children in
this age group, which is quite alarming.
The end-line survey shows tremendous improvements in the supplementary food provided. As many as
92% households in Bajna and 97% in Sailana reported feeding rice/roti and dal to children in this age
group. Similarly, 77% of households in Bajna and 75% of the households in Sailana reported that breast
milk was supplemented with fruits and vegetables for children in this age bracket. Interestingly, the
tendency to feed baby food like Cerelac and Lactogen is increasing in these communities—around 39%
of households (27% in Bajna, and 54% in Sailana) reported topping up their children’s diet with either
one of these.
Households who fed the child cereals, pulses, and vegetables fell proportionately more among the high
asset group than in the lower income groups, a clear indication that feeding habits are very much a
reflection of a household’s prosperity level. The differences were also obvious with respect to the social
groups—more non-tribals than tribals (the majority population in this area) tended to feed their children
supplementary food. However, there was no significant difference (between parents who supplemented
their child’s food as against those who didn’t) in terms of literacy of the parents. Also, there were no
gender differences in terms of what was fed to the children.
Summary of Outcomes: Stage 2
The analysis of net gains (in improving immunization practices and children’s weight-for-age outcomes)
shows that in Bajna, the improvements were better than in Sailana. This is especially notable with respect
to the indicators related to complete doses of DPT and Polio, as well as in reducing the severe
underweight among children. It appears that the interventions under Bachpan have served to accelerate
the pace of child development at this stage in the trial villages.
Use of Services
For the children in the age group of 12-23 months, immunization and care are important services provided
at anganwadis. During the baseline survey, only 36% of the households in Bajna and 41% percent in
Sailana availed of these services. Accessing AWCs seems to have been a major issue, especially in

26
Bajna, where parents were reluctant to take their toddlers to a distant center. In Sailana, half of those who
did not use AWCs for this age group stated that since there were no activities in AWCs for their children,
they saw no reason to send them there. By the time of the end-line survey, 59% in Bajna and 56% in
Sailana reported availing of AWC childcare services, and another 20% in Bajna and 16% in Sailana
reported using the health sub-center services instead.
At end-line, parents stated they had started taking measures to ensure that the child stays clean and
healthy. These included: keeping the home clean and neat; regular bathing of children and washing of
their clothes; providing timely and healthy diet; and regular checkups with doctors around the toddler’s
health. These measures were reportedly more prevalent in Bajna than in Sailana: the most notable
differences were in the proportion of parents who reported that they took these measures; as well as in
scheduled checkups with doctors.
Table 11: Measures taken care of by Households to ensure that the child stays clean and healthy: End line
Survey
BAJNA SAILANA
Measures To a great
extent
To some
extent
Not
done
To a great
extent
To some
extent Not done
Keep home clean and relatively germ free 41.04% 51.46% 7.5% 14.95% 67.8% 17.3%
Proper care of sanitation of the child 23.96% 59.2% 16.9% 6.44% 67.5% 26.03%
Regular bath 52.92% 39.8% 7.29% 17.8% 54.9% 27.3%
Regular wash of child’s clothes and other
materials used by the child (such as bottles,
utensils etc.) 19.4% 46.3% 34.4% 13.7% 57.99% 28.4%
Regular wash of clothes/other materials
used by the person taking care of the child 23.75% 48.13% 28.13% 7.7% 57.99% 34.3%
Keeping the child away from people having
any infection 10.2% 60% 29.8% 5.9% 57.99% 36.08%
Healthy diet 38.13% 51.04% 10.83% 17.53% 67.3% 15.21%
Timely diet 23.96% 52.1% 23.96% 16.24% 63.92% 19.9%
Scheduled check-up of the child by
qualified doctor/person 10.6% 63.96% 25.42% 3.4% 34.5% 62.11%
3.4: Stage 3: Children Aged Between 2-5 Years—Time to go to an Anganwadi?
The early years of a child’s life determine its physical growth and health, with nutrition playing a
significant role in child development. This is also the time to inculcate social skills in children, and
prepare them for school. The evidence presented so far shows that there was significant improvement in
the child development indicators in the first two years of children’s lives in Bajna, though there remain
significant challenges for a minority of children. Did the accumulated deficits of the first two years affect
the subsequent growth years of a child? Or, were these deficits compensated by corrective actions and
care during this stage? Did improvements in early childcare outcomes benefit the later child years? This
section of the report chronicles a child’s development during this stage (2-5 years). Here, we look at five
key child development indicators: (a) growth monitoring and weight-for-age of children, (b)
supplementary nutrition provision, (c) attendance at anganwadi centers, (d) participation in preschool
education, and (e) school readiness of children.
(a) Growth monitoring and weight-for-age of children: Regular monitoring of weight and height, both
by parents and at the anganwadi center, improved tremendously between the baseline and end-line
surveys in both Bajna and Sailana, but the greater rate of improvement in Bajna meant that it was able to
catch up with Sailana on this indicator.

27
However, the proportion of children who were severely underweight for their age remained more or less
stagnant between baseline and end-line in Bajna, as against a slight decline in Sailana. This finding
demands attention—it shows that regular monitoring of weight-for-age did not lead to improved
nutritional status. Another matter of concern was also the higher proportion of severely underweight
children among girls, which indicates lingering gender discrimination .
During the baseline survey, 46% of the parents in Bajna and 61% of the parents in Sailana reported that
their ward’s height and weight were measured regularly at the anganwadi center. By the time of the end-
line survey, the percentage of parents reporting regular monitoring of height and weight of children
increased to 84% and 86%, respectively, in Bajna and Sailana. The growth monitoring practices were
better for this age group when compared to Sub-Stage 2 (1-2 years of age) in both blocks for a variety of
reasons, chief among them being the increase in AWC attendance by children, both for supplementary
nutrition as well as for preschool education. During the baseline survey, it was observed that growth
monitoring by AWC on a regular basis happened for 51% of children as reported in Bajna, and around
59% children in Sailana. In the three-year period that followed, this improved to 71% and 74% in Bajna
and Sailana, though the magnitude of improvements was more in the former.
(b) Supplementary nutrition provision: The findings, pointing to the worsening of severe malnutrition
among children at this stage compared to earlier in life (as indicated by the high proportion of children
with less than median weight-for-age), suggest that there is a need to compensate the deficits by
supplementary nutrition and food. At the baseline survey, parents of 43% children in this age group in
Bajna, and 44% in Sailana reported that their children were administered Vitamin A drops from AWCs.
Similarly, 44% children in Bajna and 43% in Sailana reportedly received IFA supplements. However,
given the high proportion of children who were severely and mildly underweight, the percentage of
children receiving these supplements should have been higher. The need and supply/demand gap could be
the result of low utilization of AWCs in Bajna and Sailana.
The end line survey results indicate large improvements in the proportion of children who received
Vitamin A and IFA supplements. Parents of more than 82% children in Bajna and 76% children in
Sailana reported receiving Vitamin A supplements, while 71% in Bajna and 49% in Sailana reported that
their wards were provided with IFA supplements. The increase in the provision of Vitamin A
supplements and IFA were significantly more in Bajna, indicating improved proactive efforts to
compensate for poor nutrition of children.
Table 12: Regular monitoring of Child health related indicators (2+-5 years)
BASELINE SURVEY END-LINE SURVEY
Regression
coefficients Diff in difference
Bajna Sailana Bajna Sailana Bajna Sailana coefficients
Height-for-age (stunting)
=<-2SD
83.86% 74.54% 76.8% 68.79% -0.070 -0.057 -0.0128
(0.009) (0.011) (0.011) (0.012) (0.014) (0.017) (0.022)
Weight for age <-2SD 82.71% 79.64% 81.18% 75.4% 0.064 -0.042 -0.042***
(0.109) (0.11) (0.10) (0.012) (0.015) (0.016) (0.016)
Weight-for-height (wasting)
=<-2SD
19.8% 47.44% 42.66% 38.57%
(0.010) (0.013) (0.012) (0.013)
Measure height and weight 45.68% 61.29% 84.04% 85.57% 0.384 0.243 0.141***
(0.012) (0.0132) (0.009) (0.009) (0.016) (0.016) (0.023)
AWC growth monitoring 48.79% 58.85% 71.47% 73.73% 0.227 0.149 0.078***
(0.0126) (0.013) (0.012) (0.012) (0.017) (0.018) (0.025)

28
Table 12: Regular monitoring of Child health related indicators (2+-5 years)
BASELINE SURVEY END-LINE SURVEY
Regression
coefficients Diff in difference
Vitamin A Supplement 42.57% 43.82% 82.61% 76.46% 0.400 0.326 0.074***
(0.012) (0.0135) (0.009) (0.012) (0.016) (0.018) (0.024)
IFA supplement 44.35% 43.3% 71.2% 48.67% 0.269 0.054 0.215***
(0.013) (0.013) (0.011) (0.014) (0.017) (0.02) (0.026)
Attending AWC 48.34% 41.7% 90.35% 83.45% 0.42 0.418 0.002
(0.013) (0.013) (0.007) (0.010) (0.015) (0.017) (0.022)
Mean days children
attending AWC
3.39 2.15 4.74 4.2 1.35 2.05 -0.69***
(0.067) (0.073) (0.047) (0.01) (0.083) (0.09) (0.126)
*indicates significance at 0.01 confidence level(statistically significant at least at 90% level) ; ** indicates significance at 0.05
level (statistically significant at least at 95% level); *** indicates significance at 0.001 level (statistically significant at 99%
level)
Figures in parenthesis are standard errors of estimation
(c) Attendance at anganwadi centers: The baseline survey showed that 51% of children in Bajna and
58% of children in Sailana had not visited any AWC for regular monitoring of health / nutrition.
Specifically among the 5-year-olds, only 73% in Bajna and 48% in Sailana were going to anganwadi
centers during the baseline survey, which improved to 89% and 85%, respectively, at end-line three years
later. Reportedly, of the children in both blocks (in both baseline and end-line surveys) who attended
AWCs, they did so a minimum of five days a week.
(d) Participation in preschool education: Preschools play a leading role in facilitating the psychosocial
development of children in this age group. Additionally, preschool education is complementary to
primary education. Anecdotal evidences show that preschool attendance reduces underage enrolment in
schools, enhances school readiness and retention of children in school, and facilitates school attendance of
elder siblings by freeing them of their sibling care responsibilities.
The anganwadi workers undertake a yearly census of children in the preschool age which increase school
enrollment. However, enrolment does not always translate into school attendance – for example, though
67.2 percent of Bajna children aged 3-5 years old were enrolled in an AWC, only 48.3 percent attended
the centre. The baseline data show that the attendance was well below the universal in both blocks, as
many children were still not attending preschool. Of those who did attend, some children showed up at
preschools only a couple of days a week. Children who attended anganwadi preschools spent an average
of 2-3 hours per day at the centers (14 hours per week as reported in Bajna, and 10 hours in Sailana). As
the areas under study are located on undulating terrain with households spread across vast areas, the
location of the anganwadi center emerged as a critical factor in determining access.
Three years down the line, the end-line survey data show that attendance at AWCs/balwadis (preschools)
improved vastly in both blocks.. The major increases in both blocks were in the proportion of children
whose parents reported that their wards spent more than two hours at the AWC.
Attractiveness of AWCs for children depends in part on the availability of play materials. At baseline,
43% of parents whose children were currently attending preschool in Bajna, and 34% in Sailana, reported
that there were some toys at the AWC for their children to play with. At the end-line survey, around 64%
of parents each in both Bajna and Sailana reported availability of toys for children.

29
Table 13: Details of attendance of Anganwadi by 3-5 year old children BASE LINE
SURVEY
END LINE
SURVEY
Regression
coefficients
D-i-D
Bajna Sailana Bajna Sailana Bajna Sailana
Child (3-5years) enrolled
in any AWC/ balwadi
67.2% 59% 90.96% 83.5% 0.48*** 0.42*** 0.42
(0.011) (0.013) (0.007) (0.10) (0.010) (0.11) (0.11)
Child attending AWC 48.3% 41.7% 90.35% 83.45% 0.58*** 0.33*** 0.33***
(0.013) (0.013) (0.007) (0.010) (0.011) (0.12) (0.12)
Attending AWC for 5+
days
48.3% 31.2% 70.65% 59.8%
(0.013) (0.013) (0.012) (0.013)
% of children spending >2
hours at AWC
38.8% 28.7% 94.95% 84.9%
(0.012) (0.012) (0.006) (0.010)
Anganwadi open for 5+
days
54.2% 40.24% 88.31% 81.09%
(0.013) (0.013) (0.008) (0.0107)
Supplementary nutrition
provided every day
59.7% 48.7% 88.5% 80.9%
(0.012) (0.013) (0.008) (0.011)
Provision of toys at AWC 42.7% 34.8% 64.5% 64.2%
(0.012) (0.013) (0.012) (0.013)
Parents able to report what
child learns at AWC 28.4% 11.25% 86.2% 37.9%
(0.11) (0.008) (0.009) (0.013) Figures in parenthesis are the standard errors
(e) Testing children for school readiness: School readiness tests, as prepared by the NCERT (National
Council of Educational Research and Training), are for children in the age group of 4-5 years. In both
Bajna and Sailana, especially in the former, it was noticed that children were generally enrolled in school
at the age of five. This (verbal) test attempts to determine children’s school readiness and preparedness
by checking their abilities to differentiate between various shapes, pictures, sizes, numbers, and sounds.
The tests were originally designed to be used by school to assess incoming grade 1 students, to capture
the competencies acquired through pre-school education in anganwadis. In this study, children were
tested while they attended the anganwadi centre, before entering class 1. However, the age differences
between students tested in AWC and the normal testing in class 1 is not significant. In any case, the main
comparison is whether children in the AWCs at the beginning and the end of the Bachpan project were
more ready for school (rather than evaluating whether AWC children were ready compared to children in
class 1).
Another option would have been to test the children at home, but for the fact that all children are
“enrolled” in anganwadis (when the anganwadi workers undertake regular child census, all eligible
children were automatically enrolled in both anganwadis and primary schools, (meaning children’s names
were enumerated in the pre-school enrolment records). Thus, it was found that all children less than 5-
years-old were on anganwadi rolls. Therefore, the only difference in school readiness would have
emerged from those who attend preschool regularly and “those who did not” attend regularly. In order to
ascertain whether or not children have reached the desirable levels of school readiness, we chose the
anganwadi as our focal point, as its pupils aged 4-5 years (the oldest age group in anganwadis) would
have received preschool education. For capturing the levels of school readiness of those children who
were enrolled, but not attending regularly, households were asked to bring the child to the anganwadi on
the day of the school readiness test. Thus, even those pupils who did not regularly attend were tested.

30
To indicate changes that occur between baseline and end-line, a classic indicator is the ability of children
to follow the instruction to “touch their left ear with their right hand” (as mentioned earlier, this question
was not posed as part of the test, but to make children comfortable with the administrator of the test).
During the baseline survey, in Bajna, only 27% children could respond correctly to the challenge of
touching their left ear with their right hand (which is a simple task taught by AWC workers), while in
Sailana, 73% children knew their left ear and right hand and could follow the instructions on doing this.
But by the time of the end-line survey, 95% children attending AWCs in Bajna could do this, while the
figures remained more or less the same in Sailana In terms of improvements, Bajna recorded
significantly better improvements than Sailana.
With respect to the school readiness test, the children were asked 32 questions, of which half tested them
on reading readiness and the rest tested their number readiness. The 16 reading readiness questions
included (a) 4 sets of two questions each aimed at capturing (i) sentence comprehension (for example, a
question was in the form of a statement and the child was asked to point out a picture corroborating the
statement), (ii) visual perception (for example, here children had to match visually similar pictures /
activities), (iii) visual discrimination (children had to identify one picture from many which was
dissimilar), (iv) words with the same sounds (two words where there are at least one sound is similar; for
example words like “wall” and “ball”); and, (b) two sets of 4 questions each on (v) figure recognition, and
(vi) sound recognition. Number readiness questions sought to test the following: (i) number concept, (ii)
space concept, (iii) more or less numbers, (iv) near or far distances, (v) thinness or thickness, and (vi)
classification of tangible and intangible items.
The end line survey showed that children in Bajna had not only improved dramatically overall in their
school readiness – going from an average of 50.4 percent to 67.3 percent, but had improved to such an
extent that they now were more ready for school than their peers in Sailana (average score of 64.7 percent
was barely better than their baseline average). In addition to scoring better overall, Bajna students
improved their schools at a much faster rate than Sailana children across almost all dimensions of school
readiness (Table 14).
Table 14: Improvements in School readiness of children of 5 years age
BASELINE SURVEY END-LINE SURVEY
Regression
coefficients Diff in difference
Bajna Sailana Bajna Sailana Bajna Sailana coefficients
Child confident to tell his /
her name
96.39% 95.99% 99.85% 97.52% 0.035 0.015 0.019*
(0.006) (0.006) (0.002) (0.005) (0.007) (0.009) (0.011)
Child confident to tell his/
her parents name
77.27% 87.26% 98.78% 93.68% 0.215 0.064 0.151***
(0.014) (0.011) (0.004) (0.009) (0.017) (0.014) (0.022)
Mean score
Sentence comprehension 58.62% 67.47% 82.32% 79.55% 0.236 0.121 0.116***
(0.011) (0.011) (0.012) (0.011) (0.016) (0.016) (0.023)
visual perception 44.41% 51.39% 75.91% 69.27% 0.315 0.178 0.136***
(0.0102) (0.012) (0.013) (0.013) (0.016) (0.017) (0.024)
Visual discrimination 36.07% 49.90% 79.88% 65.92% 0.438 0.16 0.278***
(0.014) ((0.014) (0.013) (0.013) (0.02) (0.19) (0.028)
Number concepts 58.45% 78.31% 62.50% 64.81% 0.041 -0.135 0.176***
(0.013) (0.01) (0.013) (0.011) (0.02) (0.015) (0.024)
Space Concepts 67.13% 79.60% 84.53% 82.22% 0.174 0.026 0.148***
(0.01) (0.099) (0.010) (0.011) (0.015) (0.015) (0.021)
Concept of "more"/ "less" 51.28% 62.64% 67.99% 67.66% 0.167 0.050 0.117***
31
Table 14: Improvements in School readiness of children of 5 years age
BASELINE SURVEY END-LINE SURVEY
Regression
coefficients Diff in difference
(0.013) (0.0128) (0.013) (0.012) (0.018) (0.017) (0.026)
Concept of "near"/ "far" 30.65% 59.82% 52.59% 55.39% 0.219 -0.044 0.264**
(0.014) (0.014) (0.0114) (0.014) (0.019) (0.02) (0.027)
Concept of "thick"/"thin" 57.52% 76.36% 77.82% 84.14% 0.203 0.077 0.125**
(0.013) (0.011) (0.012) (0.010) (0.019) (0.015) (0.024)
Concept of Classification 1 78.98% 80.64% 94.05% 83.44% 0.151 0.027 0.123**
(0.008) (0.009) (0.006) (0.009) (0.011) (0.012) (0.017)
Concept of Classification 2 83.02% 84.69% 91.51% 86.25% 0.085 0.015 0.069**
(0.009) (0.008) (0.009) (0.009) (0.013) (0.012) (0.017)
Give words for letters 7.75% 11.15% 12.80% 17.60% 0.051 0.064 -0.014
(0.012) (0.01) (0.013) (0.012) (0.015) (0.015) (0.022)
Reading readiness 55.7% 61.29% 75.61% 69.5% 0.199 0.084 0.115***
(0.006) (0.006) (0.006) (0.006) (0.008) (0.008) (0.011)
Number readiness 63.5% 75.6% 78.0% 76.0% 0.145 0.005 0.14***
(0.006) (0.006) (0.005) (0.005) (0.008) (0.008) (0.012)
Total Score 50.4% 60.4% 67.3% 64.7% 0.169 0.043 0.126***
(0.005) (0.005) (0.005) (0.005) (0.007) (0.007) (0.009)
PERCENTAGE OF CHILDREN WHO HAVE MASTERED THE CONCEPT
Sentence comprehension 30.19% 48.51% 70.58% 65.8% 0.404 0.173 0.231***
(0.016) (0.016) (0.018) (0.017) (0.024) (0.023) (0.033)
visual perception 12.94% 28.16% 61.74% 53.04% 0.49 0.25 0.239***
(0.011) (0.0144) (0.019) (0.018) (0.021) (0.022) (0.031)
Visual discrimination 23.78% 36.49% 71.04% 49.81% 0.473 0.133 0.339***
(0.015) (0.0154) (0.018) (0.0176) (0.023) (0.023) (0.033)
Number concepts 40.56% 63.51% 39.48% 37.05% -0.010 -0.26 0.254***
(0.017) (0.015) (0.019) (0.017) (0.025) (0.023) (0.034)
Space Concepts 40.79% 65.67% 72.41% 72.61% 0.316 0.069 0.247***
(0.017) (0.015) (0.017) (0.016) (0.025) (0.022) (0.033)
Concept of "more"/"less" 28.9% 48% 46.95% 45.6% 0.18 -0.024 0.204***
(0.015) (0.016) (0.02) (0.18) (0.025) (0.024) (0.034)
Concept of "near"/ "far" 20.4% 47.58% 19.97% 37.79% -0.004 -0.097 0.094**
(0.014) (0.016) (0.016) (0.017) (0.021) (0.023) (0.032)
Concept of "thick"/"thin" 39.74% 62.08% 61.59% 74.6% 0.218 0.125 0.093**
(0.017) (0.016) (0.019) (0.015) (0.025) (0.022) (0.033)
*indicates significance at 0.01 confidence level(statistically significant at least at 90% level) ; ** indicates significance at 0.05
level (statistically significant at least at 95% level); *** indicates significance at 0.001 level (statistically significant at 99%
level)
Figures in parenthesis are standard errors of estimation
Mean scores: Children who attended anganwadis were expected to be proficient in most of these skills as
these are the aptitudes that the children are required to possess before entering school, as a result of

32
preparation in AWCs. The NCERT’s baseline study for primary achievement had envisaged at least 80%
children attaining 80% or more skills. For school readiness, tests do not have such prescriptions.
The mean score for reading readiness was 50% in Bajna at baseline, which improved to 67% after the
interventions. On the other hand, the reading readiness mean score in Sailana was 60% during the
baseline survey, which reached only 65% at end-line. In the case of number readiness, mean scores of 5-
year-olds in Bajna improved from 64% to 78% between baseline and end-line surveys, while in Sailana, it
remained more or less stagnant at 76%.
An analysis of competency-wise gains achieved in Bajna and Sailana in preparing these children for
school show that gains in mean score for school readiness were significantly more in Bajna, though
children in Sailana gained more when it came to figure and sound recognition.
Parental interest in preschool education: The improvement in children’s attendance at anganwadi
centers and schools (and proportionately better gains in this in the intervention block, Bajna) is clearly an
indication of better service provisions and how parental demand for preschool and school education is on
the rise. What also improved tremendously was the neatness and cleanliness of pupils. For example, at
baseline, it was observed that while parents were sending their children to AWCs, they did not ensure
their children’s personal hygiene, as is evident from the fact that more than half the children attending
AWCs did not look clean (56% children in Bajna and 52% in Sailana). However, a similar measure
during end-line shows that 97% of children in Bajna looked neat and clean when compared to only 68%
in Sailana (Table 15).
The baseline survey also indicated that children were not trained in practicing the hygiene required at this
stage of their development. In the AWCs in Bajna, only 15% of the children in the 4-6 years age groups
and attending preschool reported that they washed hands before and after eating food, compared with
67% children in Sailana. The end-line survey demonstrates a significant impact of Bachpan’s education
campaigns, as almost all children in Bajna now reported washing hands before eating food (an
improvement by 83 percentage points), as against only 81% in Sailana (13 percentage points change).
Table 15: Improvements in School readiness of children of 5 years age
BASELINE SURVEY END-LINE SURVEY
Regression
coefficients Diff in difference
Bajna Sailana Bajna Sailana Bajna Sailana coefficients
Child looks neat and clean 55.83% 52.11% 96.65% 68.03% 0.408 0.159 0.249***
(0.017) (0.016) (0.007) (0.016) (0.023) (0.023) (0.0313)
Children washing hands
before eating food
15.38% 67.01% 99.39% 80.67% 0.840 0.137 0.703***
(0.012) (0.015) (0.003) (0.014) (0.014) (0.021) (0.026)
*** indicates significance at 0.001 level (statistically significant at 99% level)
Figures in parenthesis are standard errors of estimation
Parental perception of whether any preschool ‘learning’ activity took place in the AWC also varied
between the baseline and end-line surveys. The baseline survey indicates that around 56-57% parents in
Bajna and Sailana were unaware of whether ANCs imparted any new learning for children. In Bajna, a
third of parents of preschoolers at AWCs had no information about preschool activities. In Bajna, only
one-fourth of the parents believed that their preschool children were learning new things at the AWC.
However, a third of the parents in Bajna and two-thirds of the parents in Sailana who believed that their
children were gaining knowledge had no idea of what comprised this “new teaching and learning.”

33
Table 16. How important are the services and facilities available at AWC for parents of 3-5 years old children? Results
from end line survey
BAJNA SAILANA
Very
important
Somewhat
important
Not
important
Very
important
Somewhat
important
Not
important
Supplementary food 73.34% 24.79% 1.87% 31.35% 50.24% 18.41%
Homely atmosphere 36.29% 53.58% 10.13% 7.45% 32.2% 60.46%
Better learning facilities - drawing 8.87% 47.87% 43.25% 3.33% 17.37% 79.3%
Better learning facilities – counting 13.5% 61.15% 25.35% 1.82% 22.1% 76.1%
Story telling/narrating 19.54% 52.57% 27.89% 1.35% 8.25% 90.4%
Modern teaching practices 8.13% 43.10% 48.77% 4.57% 24.71% 70.7%
Playing/amusement facilities 25.43% 47.13% 27.44% 14.83% 11.9% 84.5%
Close to home 52.24% 35.37% 12.4% 5.95% 17.1% 77%
However, by the time of the end-line survey, most of the parents were able to gauge the importance of
preschools, or at least express the importance they assigned to the preschool activities in the anganwadis.
For 73% parents in Bajna, the mid-day meal or supplementary food was very important as against only
31% parents in Sailana. A homely atmosphere in the AWC was important for 90% parents in Bajna, as
against only 40% parents in Sailana. Better learning facilities (in terms of drawing, counting, story-telling
and narrating, and playing and amusement facilities) were important for a majority of parents in Bajna
(almost 70%), as against more than 70% parents in Sailana who considered these as unimportant. Having
an AWC closer to home was important for parents in Bajna, while it was not an important consideration
for parents in Sailana (Table 16).
During the baseline survey, it was found that around half of the households in Bajna and around 41%
households in Sailana were happy with the preschool education provided by AWCs in their area. This
satisfaction level was higher among households whose children regularly attended preschool. By the time
of the end-line survey, parents could articulate the degree of satisfaction/dissatisfaction with the various
services provided by AWCs (see Table 17 for details).
Table 17: Parental opinion about AWC provision as evident from end line survey
Bajna Sailana
Good / very
good Average
Not
satisfactory
Good /
very good Average
Not
satisfactory
Individual attention to child 48.02% 33.42% 21.6% 41.1% 37.7% 23.5%
AWW are well-trained 25.56% 39.9% 34.5% 10.10% 36.1% 53.8%
AWW adequately qualified 18.14% 45.3% 36.5% 6.99% 28.6% 64.1%
Cleanliness of AWC 51.5% 26.02% 21.5% 34.9% 35.4% 48.1%
Quality of food 67% 20.1% 12.6% 28% 39.56% 32.4%
The surveys also attempted to get in-depth information on households’ concerns regarding AWC
functioning. The baseline survey found that 96% of households in Bajna and 98% of households in
Sailana could not articulate a single issue that they thought was a cause for concern and that demanded
attention. This is probably the result of a lack of awareness about their entitlements, and what was
expected from a preschool as was shown above. However, the small proportion of households who could
express their concerns mentioned the following: (a) no proper preschool education; (b) inadequacy of
supplementary nutrition, (c) irregular functioning of the center, (d) irregular and disinterested anganwadi
worker (AWW), and (e) lack of facilities. Some responses were candid: “AWW is not literate. What will
she teach?” Or, “Children are not allowed to play with toys, what they will learn?”
As a result of their lack of knowledge regarding the functioning of AWCs and provisions of preschool
education in the centers, 98% of the households in Bajna and 95% in Sailana were unable to make
suggestions to improve the functioning of AWCs at baseline. Those households that made suggestions

34
recommended the appointment of skilled workers and regular provisioning of supplementary food. The
suggestions included: “AWW should visit homes more frequently,” “Open AWC for more hours,” and
“AWW should use learning materials like colors, charts, etc., to teach”.
However, any propositions to close down the AWC were not welcome among the households in both
Bajna and Sailana. Many people felt that such an action would adversely affect the health, education and
nutrition of children in the area. During the baseline survey, we also tried to investigate how often the
parents interacted with the anganwadi worker for following up with their ward’s health and educational
progress, or even generally. Less than 10% of the households reported that they had regular interactions
with the AWW. Even among households whose children attended AWCs regularly, only around 15% of
the households mentioned that they had regular interactions with AWWs. Another 15% of households
whose children attended preschools in Bajna mentioned that they had occasional interactions with
AWWs. The end-line survey reveals a change in this. However, the changes were not significantly
different in Bajna and Sailana (see table 18).
During the end-line survey, parents in Bajna reported that their wards spent an average of 160 minutes (2
hours, 40 minutes) in AWCs. In Sailana, parents reported on an average of 137 minutes (2 hours, 17
minutes). This is an improvement from the time reported by parents during the baseline survey (1 hour,
40 minutes in Bajna, and 1 hour, 50 minutes in Sailana).
Table 18: Nature of interaction with Anganwadi worker, as reported by parents: End line survey BAJNA SAILANA
Interaction Rarely Some-
times
Frequently Rarely Some-
times
Frequently
Regarding child’s improvement and
problems 38.2% 50.5% 11.3% 62.4% 31.7% 5.8%
Reg. quality of teaching 36.8% 46.5% 16.7% 43.4% 45.3% 11.4%
Reg. quality of food 38.9% 42.7% 18.3% 33.3% 47.1% 19.6%
Reg. problems created by other children 31.7% 52.8% 15.5% 43.23% 31.6% 25.1%
Reg. general problems of the aganwadi is
facing 32.4% 53.8% 12.8% 47.9% 26.6% 25.4%
General discussion 26.0% 63.3% 10.7% 43.3% 34.1% 22.63%
Summary: Stage 3
This stage is a critical period in the life of children because this is when they begin to interact with others
beyond their family and immediate surroundings. A child’s weight-for-age is a key measure to gauge
nutritional adequacy at this stage, and the socio-cognitive development in terms of school readiness. The
analyses so far demonstrate critical net gains in Bajna, especially in terms of preschool learning gains.
The impact of reaching out to the community as well as to anganwadi workers to make them (community
as well as frontline providers) aware of the needs of the stage under project Bachpan have resulted in
better childcare practices.
3.5. Stage 4: Children in School—In Pursuit of an Unfinished Agenda, a “Happy, Healthy, Learning
Child”
In this sub-stage, we examine the impact of the interventions through the key indicators of enrolment,
attendance, learning outcomes, and completion of primary school. The analysis shows improvements in
school participation and learning achievements. However, the available data is limited in that it cannot
gauge the completion rates, especially in the context of continued migration and over-representation of
overage children in lower grades.

35
Table 19: Details of Schooling: 6-10 years old children
BASELINE SURVEY END-LINE SURVEY
Regression
coefficients Diff in difference
Bajna Sailana Bajna Sailana Bajna Sailana coefficients
Out of School Children
(OOSC) among 6-10 years
old
10.4% 9.01% 1.14% 13.55% -0.09 0.045 -0.13***
(0.007) (0.007) (0.002) (0.007) (0.006) (0.01) (0.011)
Child attended AWC before
joining primary
55.5% 62.99% 95.1% 55.3% 0.396 -0.076 0.472***
(0.017) (0.016) (0.007) (0.017) (0.018) (0.023) (0.029)
Attending school regularly 84.5% 71.6% 94.14% 85.8% 0.096 0.141 -0.046
(0.012) (0.015) (0.007) (0.011) (0.014) (0.019) (0.024)
Enrolment in age
appropriate grades 65.86% 68.95% 74.19% 72.55%
% of 10-11 years already
completed primary 43.35% 31.53%
*** indicates significance at 0.001 level (statistically significant at 99% level)
Figures in parenthesis are standard errors of estimation
The results show that the incidence of regular school attendance increased significantly in both blocks.
However, the percentage of children “out of school” (those who were “never enrolled” and those who
dropped out) has reduced tremendously in Bajna, resulting in virtually all children attending school. Also,
the proportion of children who attended anganwadis for preschool education increased vastly in Bajna,
compared to a decline in Sailana. While analyzing results in this stage, one should keep various factors in
mind: (a) unlike the previous stages where the development is seamless (no preconditions), in this stage,
the status of school attendance depend to a large extent on the school calendar and the variance in terms
of the time of the survey (as attendance during school vacation time as against school functioning time is
different) (b) there could be overage and underage enrolments (as children who is supposed to be
attending pre-school may be attending school for various reasons including the availability of mid day
meal; and children who are supposed to be attending higher grades may be attending primary grades due
to (i) late entry into the system; and (ii) repetition) (c) many children enter school by the age of five in
MP as against the national average of six years (as age at entry in MP was not six, but five while six is the
national norm); and (d) various other factors such as migration and participation in agriculture work can
affect school attendance.
The most significant indicator in this stage is the level of learning outcomes. In order to assess the
learning levels of the students, Grade 2 students were tested using the tools prepared by the Madhya
Pradesh Education Board, which are based on the formats prepared by the NCERT. The tools were
equipped to assess the learning levels of children as per the syllabus of the grade they were in, in
congruence with the Madhya Pradesh Education Board’s curriculum. While designing the tests, it was
expected that at least 80% of the children should be able to achieve 80% of the skills required.
The tests were conducted at the school level rather than at the household level, and students were
examined on their language (Hindi) and Math abilities. The Hindi test required the student to recognize
the word that correctly fit with the corresponding picture. The Math test involved simple calculations and
number recognition. The tests were of 25 minutes’ duration each.
Mean learning achievement levels: The analysis (see Table 20) shows how mean learning levels of Grade
2 children in both Bajna and Sailana improved between the baseline and end-line survey periods.

36
Table 20. Learning achievement levels of Grade II students in Government primary schools in Bajna and
Sailana (overall total score achievable in each subject: 20; overall: 40)
Baseline End line
Obs.
Mean
score
% mean
score
Std.
Deviation Obs.
Mean
score
% mean
score
Std.
Deviation
Bajna
Total
Overall 873 22.06 55.15% 10.5 871 29.4 73.50% 8.08
Boys 429 22.63 56.58% 10.55 437 29.95 74.88% 7.41
Girls 444 21.53 53.83% 10.44 434 28.84 72.10% 8.68
Hindi
Overall 873 11.73 58.65% 5.68 871 14.53 72.65% 4.76
Boys 429 12.02 60.10% 5.60 437 14.79 73.95% 4.5
Girls 444 11.44 57.20% 5.75 434 14.28 71.40% 4.9
Math
Overall 873 10.33 51.65% 6.48 871 14.86 74.30% 4.35
Boys 429 10.6 53.00% 6.57 437 15.16 75.80% 3.9
Girls 444 10.01 50.05% 6.39 434 14.56 72.80% 4.71
Sailana
Total
Overall 871 21.85 54.63% 8.84 874 29.05 72.63% 8.48
Boys 495 26.43 66.08% 8.87 442 29.24 73.10% 8.12
Girls 376 25.09 62.73% 8.76 432 28.86 72.15% 8.8
Hindi
Overall 871 13.04 65.20% 4.91 874 16.83 84.15% 5.01
Boys 495 13.08 65.40% 4.89 442 17.04 85.20% 4.82
Girls 376 13 65.00% 4.90 432 16.62 83.10% 5.2
Math
Overall 871 12.88 64.40% 5.64 874 12.21 61.05% 4.58
Boys 495 13.34 66.70% 5.56 442 12.2 61.00% 4.54
Girls 376 12.09 60.45% 5.69 432 12.22 61.10% 4.6
Proportion of children with learning outcomes: The proportion of children achieving higher learning
outcomes increased between baseline and end-line, and more so in Bajna than in Sailana, especially in the
case of Math. In Hindi, the increase in the proportion of children scoring more than 60% correct is better
in Bajna, and the increase in the proportion of children scoring more than 70% is more in Sailana. Most
interesting is the increase in the coefficients presenting difference in difference or, the difference in the
improvements between experimental and comparison groups, both in Math and in overall scores. The
extent of difference in relative gains also improves systematically until 70%, and then it comes down.
Table 21: Learning Achievement levels of Grade 2 students in Bajna and Sailana: Overall (Language + Math)
BASELINE
SURVEY
END-LINE
SURVEY
Regression
coefficients
Difference in
difference
Bajna Sailana Bajna Sailana Bajna Sailana coefficients
Total Score: more than/equal to 50% 56.55% 75.03% 91.27% 90.73% 0.347 0.157 0.190***
(0.017) (0.015) (0.010) (0.010) (0.019) (0.018) (0.026)
Total Score: more than/equal to 60% 43.34% 61.75% 83.35% 84.10% 0.40 0.223 0.176***
(0.017) (0.016) (0.013) (0.012) (0.021) (0.021) (0.029)
Total Score: more than/equal to 70% 32.56% 47.90% 71.87% 69.11% 0.393 0.212 0.181***
(0.016) (0.017) (0.015) (0.016) (0.022) (0.023) (0.032)
Total Score: more than/equal to 80% 24.10% 32.01% 50.06% 47.48% 0.259 0.154 0.105***
(0.015) (0.016) (0.017) (0.017) (0.022) (0.022) (0.032)
Total Score: more than/equal to 90% 11.70% 17.25% 21.28% 9.61% 0.115 0.040 0.075***

37
(0.011) (0.013) (0.014) (0.014) (0.018) (0.019) (0.026)
Total Score: 100% 2.00% 3.9% 3.2% 2.7% 0.011 -0.012 0.235*
(0.005) (0.007) (0.006) (0.006) (0.007) (0.009) (0.114)
Mean score 54.56% 65.1% 74.6% 72.96% 0.200 0.0785 0.121***
(0.008) (0.007) (0.006) (0.007) (0.011) (0.0102) (0.015)
*indicates significance at 0.01 confidence level(statistically significant at least at 90% level) ; ** indicates significance at 0.05
level (statistically significant at least at 95% level); *** indicates significance at 0.001 level (statistically significant at 99% level)
Figures in parenthesis are standard errors of estimation
Table 22: Learning Achievement levels of Grade 2 students in Bajna and Sailana: Math
BASELINE
SURVEY END-LINE SURVEY
Regression
coefficients
Difference in
difference
Bajna Sailana Bajna Sailana Bajna Sailana coefficients
Math Score: more than/equal to 50% 51.22% 69.81% 91.16% 75.51% 0.399 0.057 0.342***
(0.017) (0.015) (0.009) (0.015) (0.019) (0.021) (0.029)
Math Score: more than/equal to 60% 44.15% 60.95% 83.81% 63.62% 0.396 0.026 0.37**
(0.017) (0.016) (0.012) (0.016) (0.021) (0.023) (0.031)
Math Score: more than/equal to 70% 38.47% 51.87% 74.86% 46.57% 0.363 -0.053 0.416***
(0.017) (0.017) (0.015) (0.017) (0.022) (0.024) (0.033)
Math Score: more than/equal to 80% 30.01% 41.43% 54.08% 26.77% 0.240 -0.146 0.387***
(0.016) (0.017) (0.017) (0.015) (0.023) (0.022) (0.032)
Math Score: more than/equal to 90% 19.81% 28.38% 28.93% 9.61% 0.091 -0.187 0.278***
(0.014) (0.015) (0.015) (0.01) (0.021) (0.018) (0.027)
Math Score: 100% 6.26% 13.62% 13.2% 3.32% 0.069 -0.103 0.172***
(0.008) (0.012) (0.011) (0.006) (0.014) (0.013) (0.192)
Mean Math score 51.12% 64.4% 75.44% 61.359% 0.243 -0.031 0.274***
(0.011) (0.010) (0.007) (0.008) (0.013) (0.012) (0.0178)
Table 23: Learning Achievement levels of Grade 2 students in Bajna and Sailana: Hindi
BASELINE
SURVEY END-LINE SURVEY
Regression
coefficients
Difference in
difference
Bajna Sailana Bajna Sailana Bajna Sailana coefficients
Hindi Score: more than/equal to 50% 62.1% 73.78% 88.86% 91.53% 0.267 0.177 0.090***
(0.017) (0.015) (0.011) (0.009) (0.019) (0.018) (0.026)
Hindi Score: more than/equal to 60% 49.8% 62.43% 79.68% 89.47% 0.298 0.270 0.028
(0.017) (0.016) (0.014) (0.010) (0.022) (0.019) (0.029)
Hindi Score: more than/equal to 70% 40.3% 50.06% 69.23% 85.01% 0.289 0.349 -0.060*
(0.017) (0.017) (0.016) (0.012) (0.022) (0.021) (0.03)
Hindi Score: more than/equal to 80% 31.9% 38.14% 52.35% 75.86% 0.204 0.377 -0.172***
(0.016) (0.016) (0.017) (0.014) (0.023) (0.022) (0.032)
Mean Hindi score 58.0% 65.8% 73.764% 84.58% 0.158 0.188 -0.0302***
(0.009) (0.008) (0.008) (0.008) (0.012) (0.012) (0.017)

38
In addition to the above outcomes, the study also looked at some enabling conditions in education in
terms of: (a) provision of midday meal and free text books; (b) support at home for learning and
homework; (c) parental (and teachers’) interest and follow up; and (d) receiving preschool education
before joining school.
a) Mid Day meal: The study found that a major incentive for school attendance was the Government of
India’s Mid-Day Meal (MDM) scheme, initiated with the aim of improving attendance of children in
schools as well as to ensure them of at least one full nutritional meal per day. At baseline, around 91% of
households in both blocks whose children were enrolled in schools reported that their wards were
receiving the meal. The end-line survey shows that 93% of parents in Bajna and 85% of parents in Sailana
reported that their children were receiving MDM from school.
Another inducement for students is the provision of free textbooks. Under the SSA and state schemes, all
children belonging to Schedule Caste and Scheduled Tribe communities (both formally recognized as
disadvantaged) are eligible to receive free textbooks. During the baseline survey, only around 4% (3% in
Bajna, and 5% in Sailana) of the children belonging to SC and ST communities reported that they did not
receive free textbooks. Similarly, around 3% of the girls who were eligible to receive textbooks also
reported not receiving free textbooks. Though the majority of households stated that their children
received textbooks in time (in June-July), around one-fifth of households reported their children received
textbooks at a later period. The end-line survey shows that almost all parents report receiving free
textbooks, in spite of the survey being conducted around the time of the start of the academic year.
All primary schools are mandated to provide health checkups of students by government doctors, and a
monthly visit by the ANM to these schools is also compulsory. The baseline survey showed that 45% of
the households in Bajna and 50% of the households in Sailana reported that schools did not conduct such
checkups. A fourth of the households in Bajna and 36% in Sailana reported monthly health checkups in
schools during the three months prior to the survey. Others reported occasional health checkups. By the
time of the end-line survey, 71% of households in Bajna reported regular health checkups in school, as
against only 53% in Sailana.
b) Support at home for learning and homework: It is a well-documented fact that enhanced learning
outcomes are facilitated by at-home learning. Around 47% of the households in Bajna and 71% of the
households in Sailana reported that their school-going child carved out some time at home for learning
and homework. At end-line, this pattern went up to 60% in Bajna (a 13-percentage point improvement),
but barely changed to 72% in Sailana. There were no significant differences between boys and girls.
The help provided at home for learning activities lends an additional boost to knowledge. The baseline
survey results showed that overall, only 24% school-going children (14% in Bajna, and 38% in Sailana)
received some assistance at home for studies.5 Not surprisingly, students with literate parents received
more inputs (48%), as against only 18% in the case of students who had illiterate parents. The end-line
survey shows that in Bajna, more than 50% of children have support from someone at home all the time,
while in Sailana, 31% children get such sustained support.
c) Parental and teacher interest and follow-up: Parental interest in a child’s schooling and learning is
reflected not only in families following up with their child’s studies at home, but also in demanding from
teachers an assessment regarding their child’s progress. In the predominantly high-illiteracy assessment
blocks, without educated and empowering parents, such inputs were not expected. Thus, it was no
surprise that during baseline, only around 3% of the households/parents enquired after their children’s
5 For the most part, however, this assistance was not in form of paying for private tuition. Both baseline and end line surveys show that only less than 2% of the students were getting private tuitions, paying on average, a monthly tuition fee of INR 52 (baseline survey) and INR 58 or around USD 1.28 (end-line survey).

39
progress. However, they mentioned that teachers took the initiative in reporting their ward’s progress to
them. In Bajna, 54% of the parents averred that the schools made available their children’s progress
report, while in Sailana, around 46% of the parents reported the same. Similarly, 35% parents in Bajna
and 31% in Sailana reported that they were informed about the performance of their child once
(annually), though this primarily had to do with whether or not the child has been promoted to the next
level. Only around 3% of the households reported that they received periodical information about their
child’s learning levels. However, most of the parents were under the impression that their children were
making good progress in their studies and were happy with that (Bajna, 86%, and Sailana, 75%). The
end-line survey shows improvements in parental demand for understanding their child’s progress in
learning (98% in Bajna, and 96% in Sailana).
Summary: Sub-Stage 4
Though we did not have data to look at the completion and dropout rates, the analysis of school
attendance and learning assessment scores provides an important insight into the progress made by
children in the project area. The test scores show significant improvements in Bajna, especially a high net
gain in Math learning levels in Grade 2, compared to students in Sailana.

40
Chapter 4: Bachpan-Lessons Learned
Project Bachpan was an effort to understanding whether the community—together with a range of service
providers—can work for the improvement of child development outcomes in a more holistic manner. The
process documentations (please see Annex 5 for a summary report of all 7 process documentation reports
by ERU) detail the lessons from the various processes of engaging community and different sectors
together. The documentation also provides an account of factors that needs to be kept in mind at various
stages in such a project.
The evaluation study demonstrated that the improvements in child development outcomes and practices
were better in Bajna than in Sailana, in most cases dramatically so. These differences can be attributed to
Project Bachpan (Table 22). These impressive results hold even for other developments in the two blocks,
such as improved road connectivity, electrification, and the introduction of other Centrally Sponsored
Schemes (CSSs) like the Mahatma Gandhi National Rural Employment Guarantee Act (MGNREGA).
Table 22: Summary of Outcomes: "Difference in difference" between treatment and comparison blocks
Indicators on Outcome for various stages
Changes in
treatment –
changes in control
(Coefficient)
Stage 1
Percentage of pregnant women who received full ante-natal check-up 0.06**
First ANC within first trimester 0.225***
Percentage pregnant women regularly received Supplementary food 0.147***
Percentage of deliveries assisted by institutionally trained 0.358***
Decline in the percentage of children underweight -0.129**
Stage 2
Percentage of children fully immunized by year 1 0.292***
Percentage of children who have completed all prophylaxis Vit A 0.074**
Percentage of children with normal weight for age 0.108***
Stages 3
& 4
Percentage of children entering in Grade 1 who have an adequate vocabulary in the school
language 0.127***
Percentage of Grade I children who have attended pre-school program 0.472***
Percentage of children in school clean and neat 0.249***
Percentage of children who wash hands before eating 0.703***
Achievement levels in language and Mathematics in Grade II 0.121***
*indicates significance at 0.01 confidence level (statistically significant at least at 90% level); ** indicates significance at
0.05 level (statistically significant at least at 95% level); *** indicates significance at 0.001 level (statistically significant at
99% level)
The gains in these outcomes were possible for a number of reasons:
The project interventions were developed in keeping with the especial needs of the population, and
rooted in the conditions and circumstances of the area. It drew heavily from the understanding and
opinions of local people. The results reflect the fruits of a highly contextualized program.
The project and impact evaluation design took into account the experiences of previous singular
interventions, which had little impact (an experience repeated in this study by Sailana). So, the pilot
comprised a bouquet of interventions, chief among them being community information and the
forming of Village Resource Groups (VRG). VRG-drawn village plans, if any, were considered as

41
additional interventions. The success of Bachpan lies not in singular interventions, but in a complete,
well-rounded engagement package.
There was a gap of three years between the baseline and end-line surveys, which ensured that the
interventions had enough space and time to consolidate some of the outcomes. It also neutralized the
impact that might have had resulted from initial energy and enthusiasm, especially in terms of process
indicators.
The logical results framework of the pilot allowed for measuring milestones at each stage of a child’s
development; rather than aiming at evaluating outcomes that are long term, and that could be resultant
of various factors that are perhaps invisible in the context of the interventions.
Lessons from the Pilot
The entire process of implementing the pilot Bachpan and the outcomes seen thereafter provide
meaningful lessons for interventions in the social sector. These are listed below.
Contextualization of interventions is important for improving processes and outcomes. For example,
information, education and communication (IEC) of child development related messages should be in
a manner and language identifiable to the community.
Similarly, convergence and coordination in planning and implementation are key to improving
outcomes, not least because there is no single solution to child development. A slew of
complementary and interactive interventions are necessary for impact.
Community participation is central to better implementation and results, and can be ensured when
there is enough awareness and empowerment built into a program. For that to take place, it is
important to create local change agents or catalysts, typically by involving civil society organizations.
By invigorating the local community and service providers through the provision of information and
by facilitating their role in shaping sectoral plans, rapid progress in child related outcomes can be
made. It is important to affect a decentralized approach to planning for such a program, especially
when incorporating the local context. Thus, it is important to identify and capacitate local resources
that can act both as change agents and bridge builders. The government does not have the leverage to
ensure prompt action on issues raised in the field, which is why .the mediating role of the
implementing NGO becomes critical to ensure that local issues receive the attention they deserve.
For any intervention in the development sector to show results, a critical minimum gestation period is
necessary. This pilot demonstrates the importance of providing that space before final evaluation so
that the initial enthusiasm of a pilot dies down and actual results are visible.
An evaluation of the impact of a program will not give the desired insights if the process is not
documented fully and correctly. Understanding the direction in which a program is moving and to
initiate any mid-course correction, is where monitoring plays a significant role.
Expanding resources is not sufficient to ensure maximum impact of programs. During the period of
this pilot, child development programs were escalating thanks to the country’s Centrally Sponsored
Schemes. But, despite the same range of programs in the two blocks, significantly better results were
obtained with an integrated, community-driven approach.
Designing bottom-up planning into a program requires attention to the implementation arrangements.
Expansion programs were all planned as decentralized, bottom-up interventions, with active
community participation – this is true for (Sarva Shiksha Abhiyan (SSA – Elementary Education for
All), Reproductive and Child Health (RCH), National Rural Health Mission (NRHM) and Integrated
Child Development Scheme (ICDS). However, the problem was that: (a) most village communities in

42
India could not do bottom-up planning due to lack of information and deficiency in coherent action;
and (b) each program’s committees were in silos, resulting in a fragmented approach to fund
management, and piecemeal program planning and implementation. Bachpan demonstrates that: (a)
community mobilization and facilitating frontline providers and community interaction is an
important component to enact better service delivery and behavioral changes; and (b) making the
community think and plan for child development more holistically (an outcomes-based approach
rather than inputs-based) reaps higher dividends.
The costs of this intervention were modest, as the focus was on improving the effectiveness of
existing programs, which themselves are large, rather than creating new ones. Hence, there are clear
opportunities for scaling up this approach to other blocks across Madhya Pradesh.
Limitations of the Study
There was no attempt to explain the specific reasons why there were improvements in the control
block (Sailana) or the magnitude of these improvements. The presence of the same programs in
Sailana made it likely that there would be some improvements. However, as we have seen, there
were greater improvements on most indicators for Bajna. The fact that in a few cases there were
better outcomes in Sailana indicates that some significant changes in the implementation of some
programs did take place in that block, perhaps due to political or staffing changes and spillover
effects. But the precise reasons for these changes are not available from this study.
The evaluation design was not structured to test how each of the separate elements of the
intervention actually worked, or which one or which set of interventions had the biggest impact.
This would have required a quite different (and more complex) approach, with different
communities being exposed to different bundles of interventions. Instead, the core comparison was
between a community-driven, integrated approach and an approach which worked with different
interventions separately.
The full impact of the Bachpan program will likely be felt beyond the time period of this study. The
results identified by the evaluation study seem to be because of community mobilization and
increased awareness about childcare. However, community mobilization and awareness building is
a process that took almost 18 months. While communities had prepared convergent, child
development plans by the end of the second year, at national level, the fund flows were designed
and continued to flow in sectoral silos, and hence the child plans had to feed into separate district
health, education and nutrition plans of the district and not into an integrated child plan. The full
impact of the holistic child development plans feeding into the sectoral plans will likely be felt only
after a few years.

43
Annex 1: Process Documentation – Consolidated Report 2005-2009
Nishi Mehorotra, Kameshwari Jandhyala and Niti Saxena ERU Consultants Pvt./ Ltd
New Delhi
Contents
I. Background
II. Concept to Pilot
II.1 The design
II.2 The project area
III. Rolling out the project
III.1 The baseline survey
III.2 Initial vertical and horizontal dynamics from the field
III.3 Management structure
III.4 Evolving a shared vision and understanding:
What’s in a name?
IV. Translating visions into action
IV.1 Enabling a community understanding: a dynamic information & communication strategy
IV.2 Forming Ekta Samuhs and laying the foundations for convergent action
IV.3. Energizing service providers and emerging outcomes
IV.3.i Example of building cross- sectoral linkages & understanding
IV.4. The Ekta Samuhs
IV.4.i Village plans for children
IV.5 Working with children
V. Monitoring and review
VI. Insights from Project Bachpan

44
1. Background
Despite several significant policy and programmatic provisions for children, the status of poor children
continues to be a matter of grave concern. Child malnutrition and the lack of access to quality education
for poor children have been widely commented on. This has also been borne out by the multi-sectoral
research of the World Bank, ‘Reaching out to the Child’6.The research reviewed the progress in the status
of children over the last decade in comparison to other developing countries and also with reference to the
programmes on the ground for children in the health, education and nutrition sectors. Some factors
identified as responsible for the limited impact of existing provisions included:
A fragmented, sectoral approach in implementing the schemes, which does not capture the
synergies across sectors;
Over centralized and standardized programmme designs which do not address contextual
diversities;
Inadequate finances and inefficient implementation;
Inadequate monitoring capacity; and
Low accountability and issues of service delivery.
One of the major recommendations of the study was to move towards a decentralized and cross-sectoral
approach to planning and monitoring of programmes, so that even with sectoral implementation better
coordination can be ensured.
In this context the concept of Village/Ward Plans for Children had been proposed as the basis for
financing and implementation of programmes for children in the age range of pre-natal to 11+ years. This
concept deviates from the current approaches in two ways:
1) It is a bottom up approach for involving participatory planning by each village community for its
children to ensure that it is context specific and need based.
2) Also, it is in accordance with a multi-sectoral approach which addresses needs of the “Whole Child”
and not of health, nutrition and education in isolation.
The research provided a holistic conceptual framework within which the determinants of developmental
milestones along a continuum from pre- birth to the primary schooling stage have been laid out. This
framework would allow for a more synergistic approach even within the current programmatic
arrangements for children sponsored by the Government. See Figure 1, ICD Conceptual Framework
below, spelling out children’s developmental milestones along a continuum from pre-birth to the primary
schooling stage.
6 World Bank, (2004) Reaching Out to The Child- An Integrated Approach to Child Development, New Delhi

45

46
II. From a Concept to a Pilot
While recommendations of the need for a convergent and holistic approach to address the developmental
needs of children are passé, there are not too many examples of actually trying out the strategy in a
sustained manner on the ground. Before designing the pilot other similar interventions were studied. A
similar convergent approach was undertaken by UNICEF in collaboration with the Government of
Maharashtra. The study and analysis of this experiment also fed into the design of the World Bank pilot.
The UNICEF Project in Maharashtra7 -Practicing Participation in UNICEF Programming: Bridging the
Gap between Rhetoric and Reality (2000) was an early attempt to empower local communities to address
and resolve local problems, especially schooling. UNICEF, India’s Master Plan of Operation (1999-2002)
focused on improving the quality of education through enhancing school-community partnerships. The
effort was to link parents, community members and educators around the goal of full, equal and
meaningful participation by all children in good learning experiences. The Bachpan project in Madhya
Pradesh drew upon this experience in designing the pilot. The purpose of the pilot was to assess the
feasibility and cost effectiveness of such a holistic and coordinated effort for children throughout the
childhood development continuum - prenatal to elementary education. This experience, it was anticipated
would inform advocacy with the government for a similar approach to be adopted.
II.1 The Design
Box 1: Key features of the Pilot Project
The key features of the Pilot were to:
Address the life cycle continuum.
Establish convergence of provisions for children across health, nutrition and education sectors.
Engender bottom-up planning through community participation.
It was also expected that the following will be explored and addressed during the course of the pilot:
Assess how the four programmes for children – Integrated Child Development (ICDS),
Reproductive Child Health (RCH), Sarva Shiksha Abhiyan (SSA) and Mid Day Meal Scheme
(MDM) of the three sectors – health, nutrition and education – can lend themselves to micro
planning in a convergent mode involving the community and service providers.
Envisage what adjustments may be required in the existing administrative arrangements o
allowing for greater convergence and coordination and greater participation of the
beneficiaries.
Explore to what extent convergence and participatory approach with an outcome-focused
model could improve service delivery and thereby impact on child related outcomes.
There were other dimensions of the pilot as well - it was to be rolled out through a dynamic partnership of
the government and an implementing NGO partner. Further, as this pilot was seen as a learning initiative,
the role of external support agencies was also envisaged- an independent agency (Indicus Analyticus), to
do the baseline and end line, and another agency (Educational Resource Unit), to undertake a detailed
process documentation of the pilot as it unfolded.
7 ERU, Assessment Study of Community Participation in Selected UNICEF supported Educational Programmes, 2003

47
II. 2 The Project Area
Madhya Pradesh was selected as the state for rolling out this pilot. The selection of the project area was
determined by several factors- 1) Naandi, the implementing agency was already working in Madhya
Pradesh in partnership with the government of Madhya Pradesh. 2) The Government of Madhya Pradesh
was very supportive of such an initiative. 3) Finally, given the low child development indicators of the
state, it seemed the right place to pilot a convergent approach. (See annexure I).
The Madhya Pradesh Integrated Child Development Pilot project was initiated in Ratlam district,
identified on the basis of a cumulative development index computed for this purpose.8 See Table 1 below
for details:
Table 1: Indicators for Ratlam district, 2001 Census
Population 1215000
Growth rate 25%
Literacy % 67.2 %
Male 80.1 %
Female 54.3%
Rural literacy rate 61.0%
Urban literacy rate 82.2%
SC population 13.4%
ST population 25.9 % (2 tribal blocks)
HDI .630
Rank in MP - HDI 6
8 Ratlam is divided into 6 Tehsils (sub- district divisions) and 6 Blocks

48
GDI .633
Rank in MP 2
Sex ratio 959
“ rural 965
“ urban 943
Juvenile sex ratio 960
Life expectancy at birth 59.3
IMR Girls 132- 1991 ( up to 1 yr) 151 ( up to 5 yrs)
Within Ratlam district, Bajna one of the 2 tribal blocks with over 95% tribal population (Bheel), was
selected for project implementation. Like most tribal areas, Bajna has a comparatively better sex ratio of
989 than the district average. However, the female literacy is at a low of 21%. (MP HDR 2003). The close
proximity with Gujarat and Rajasthan is clearly visible in the language of the area where the local dialect
is Bagadi. The entire population of the block is rural, living in a geographically difficult terrain – hilly,
rocky and with sparse green cover. Apart from having low socio-economic indicators this region is also
agriculturally poor, relying mainly on rain fed crops like maize, soya beans and cotton. In 2005, due to
poor rains, Bajna region experienced severe drought, affecting children’s and people’s lives in terms of
health and nutrition.
The project coverage extends to 220 villages, over the entire Bajna Block. For the convenience of
management and monitoring, the block has been divided into three clusters – Bajna, Raoti and Kundanpur
– each having specific geographical features, since the habitations are widely scattered. While Bajna is
hilly and dry, the Raoti area is a fairly fertile river basin (river Mahi) and Kundanpur is an area of
sparsely scattered settlements with a poor communication network.
III. Rolling out the pilot
III.1 the Baseline Survey
As mentioned above Indicus Analyticus, an independent agency, was hired to do a baseline survey of 2
blocks, i.e. Sailana and Bajna (which are control and implementation blocks respectively), with a view to
provide the basic information for the 8 cross-sectoral child development outcome indicators along the age
continuum- from the prenatal stage to 11 years age group for impact evaluation of the initiative.
The baseline conducted in November –December of 2005, included collection of qualitative and
quantitative information through intensive questionnaires for households, Aganwadi centers, sub- centre
health facilities and primary schools. Each block, with approximately 200 villages was selected to afford
socio- economic and socio-cultural comparability. It was ensured that both blocks have the presence of
the three centrally sponsored schemes—Integrated Child Development Services (ICDS), Reproductive
Child Health (RCH) and Sarva Shiksha Abhiyan (SSA).
Simultaneously, Naandi conducted a resource mapping exercise through its project facilitators to help
them get an idea of the situation in the villages. While the baseline by design was a separate academic
exercise altogether, with no intermingling with the implementation of the project, some field level
government functionaries were evidently confused regarding collection of similar kind of information by
the representatives of the two agencies.

49
III.2 Initial vertical and horizontal dynamics in the field
The coordination meetings held at the state level set the tone for the initiation of the project. The
administrative arrangements, indicating clear guidelines for implementation and partnership were drawn
up at various levels to roll out the project. See Box 2 below for details:
Box 2: Administrative arrangements
State level
Constitution of a state-level co-ordination committee by Government of Madhya Pradesh which
shall have representatives from Naandi Foundation and the Department of Education, Government
of Madhya Pradesh; Department of Health and Family Welfare, Government of Madhya Pradesh;
Department of Women and Child Development, Government of Madhya Pradesh (the concerned
Departments). The committee shall be primarily responsible for providing guidance on policy
issues, reviewing progress and addressing issues, if any, related to the convergence and coordination
arrangements. The committee shall meet at least once every six months to ensure smooth
implementation of the Project.
Institutionalizing measures to ensure day-to-day support and cooperation on all matters related to
execution of the Project from the concerned Departments. In particular, the concerned Departments
shall identify the roles and responsibilities of the officials at the district and block levels in Project
implementation and shall ensure their cooperation to facilitate implementation of the Project. The
concerned Departments shall also develop and implement effective communication strategies for
this purpose.
District-level
A planning and co-ordination committee shall be constituted at the district level which shall be headed by
the District Collector or his /her nominee and be required to meet once in 3 months. The convener of this
committee may be selected in the first meeting. This committee shall include district level officials of the
concerned Departments, representative from the Naandi Foundation and other stake-holders. This
committee shall be responsible for the following:
Review of the implementation plan (activity plan)
Quarterly progress review of the action research project
Finalization of Monitoring Indicators for the action research project
Facilitate convergence of all programmes that are meant for children, namely ICDS, RCH,
Elementary Education, Early Childhood Education and Water / Sanitation (Public Health). This
will include:
Human resource mapping
Financial resource mapping
Activity mapping to ensure convergence (household survey, fixed day services, immunization /
health campaigns)
Management of supplies (ICDS SNP, Mid-day meal, textbooks, Vitamin A etc.)
Logistics
Share data/ information amongst each other and with Naandi Foundation.

50
Block-level
A Block level coordination committee shall be constituted with the chairperson from the Block Panchayat.
Naandi Foundation’s representative shall be the convener of this committee. This committee shall meet
as frequently as necessary (at least once in 2 months), and shall be responsible for facilitating convergence
and coordination among all programmes that are meant for children, namely ICDS, RCH, Elementary
Education, Early Childhood Education and Water / Sanitation (Public Health) etc. The specific activities
requiring coordination shall include:
Human Resource Mapping
Financial Resource Mapping
Activity Mapping to ensure convergence (house hold survey, fixed day services, immunization /
health campaigns
Management of supplies (ICDS SNP, Mid-day meal, textbooks, Vitamin A etc.
Logistics
Share data / information amongst each other and with Naandi Foundation
The coordination steps taken at the state level during the two meetings held in April and May 2005
definitely facilitated the vertical linkages. This was followed by a series of meetings during October and
December 2005 at district and block levels with all the 3 departments - Women and Child Development,
Education and Health participating These meetings served several purposes- to introduce the project,
create a common understanding of the objectives and thrust as well as to develop a rapport and
communication between Naandi and the different departments. Further, these were also the fora in which
information and data from the government could be gathered in a non-threatening fashion.
The Government of MP was interested in replicating this Integrated Child Development model in other
districts of the State with poor child development indicators. This pilot was seen as a first step towards a
large-scale programme for decentralized bottom up planning for holistic child development. At the district
level, the Assistant Education Director and acting DPO SSA, were nominated by the District Magistrate
as the nodal officer for the project.
These initial efforts at establishing the vertical linkages were not as easily replicated at the horizontal
level. The horizontal partnership between Naandi programme functionaries and the village functionaries
like the AWWs, the ANMs, the teachers and PRI members took time to evolve and develop.
III.3 Management Structure
The team is led by a State level Project Manager who is in overall charge for supervision and provides
guidance. There are three Programme Associates (PAs) for each of the three Clusters – Raoti, Bajna and
Kundanpur in the Block. And for every cluster of 10-12 villages there is a local village level facilitator
called Jan Mitra (Friend of the community). See Figure 3 below for details.
As the project got grounded, greater role clarity evolved. While in the initial phases, everyone was in the
field and seemed to be performing the same tasks, by the beginning of year 2 there was a better
understanding and appreciation of the complementary roles that a supervisor and field staff play. Table 2
below, spells out some of the detailing of the roles and responsibilities done by the Bajna team.
To start up the project, 12 local people were identified as volunteers for resource mapping. The basic
criteria for selection were qualification (at least 10th pass) with some understanding about the area and
were identified from among the local tribal and non- tribal community. Tribals were given priority even if
their qualification levels were low, as they belonged to the villages/areas of their operation. Even though
this is a predominantly tribal region, the minority non-tribal population, being more educated and
economically enabled, was prominent. Gradually the team grew to 20 and the facilitators were named as

51
Jan Mitras (JMs) – friends of the community. The team comprised of both men and women, of whom 6
were women. Their education levels range from High School to Post Graduation; of course very few of
them are post graduates. Over the course of their work the JMs grew to understand their work and were
able to define their roles and responsibilities.
It was expected that as the project matures and the Ekta Samuhs (community level collectives) develop a
stronger identity the roles and responsibilities would undergo further changes. The vision was that the
Ekta Samuhs emerge as local community institutions that promote, nurture and further the cause of
integrated child development. The vision for the field functionaries is that they grow into a resource
group at cluster/block level to extend support through training, planning and resource facilitation on a
larger scale both within the project area and elsewhere, should the programme expand.
Figure 3: The Programe Management Structure
Programme Manager for the State of Madhya Pradesh who is also in charge of the Naandi project at Sheopur, based in that district
3 Programme Associates (PAs in charge of supervision, based in Bajna and Raoti
20 Jan Mitras Based in villages
of Bajna block
In 2007 a Project Manager who divided her time equally between Bajna and Sheopur was appointed and a part time accounts person
Point person at Naandi HO

52
Table 2: Roles and responsibilities
Programme Associates Jan Mitras
Roles
Friends of the community and the JMs
Team leaders at cluster level
Coordinators of meetings and linkages at
Block level
Facilitates flow of data and information from
the district and block offices
Facilitators for issues and conflicts at village
level
Coordinators/ guides of JMs at cluster level
Provide motivation, guidance and support to
the JMs
Responsibilities
Work with the JMs to plan and monitor their
activities
Maintain reports and other documentation in
the office
Hold regular meetings with the JMs
Obtain information from the block level and
share with JMs
Make filed visits in the villages with JMs or
other wise
Review the work plans and activities of JMs
on a fortnightly basis
Conduct meetings with service providers
Roles
Friends of the community
Motivators/community mobilisers
Facilitate formation of Ekta Samuhs
Facilitators of information, resources
Coordinate linkages among the community
and service providers
Trainers at different levels
Responsibilities
Work closely with the Ekta Samuhs for the
integrated development of children
Assist in the development of village plans and
follow up activities
Network at community level with the different
service providers
Take up initiatives for awareness generation
and activities of the community
Undertake trainings of PTA, ES, Mahila
Manch, Kishori Manch, AWWs, teachers
Disseminate information about government
schemes and programmes for children
Prepare reports of field activities, write case
studies
Provide feedback on problems in the villages Source: This was developed through an interactive exercise with the field team September 2006, by ERU
III.4 Evolving a shared vision and understanding: What’s in a name?
Initially, though the team was worked intensively in the field, but it lacked the clarity of the vision,
mission and objectives of he project, which resulted in several activities that did not seem to lead to any
concrete outcomes. It was expected that this would sharpen as the programme matures or spreads to other
areas. There were several other problems as well. The project title and other terms in the project design
made little sense. Initially they were used uncritically and were being parroted at various levels. As long
as the messages were in an alien tongue i.e. English creating an ownership as well as internalization of the
overall programme objectives both within the implementing team as well as the local communities
seemed difficult There was a suggestion that the project have an identity in a local idiom and language,
understood by all and at the same time capturing the essence of the project objectives. After a great deal
of discussion, a consensus developed around the word Bachpan, which meant childhood, as a name for
the pilot project. As this exercise took place, almost a year after the start of the programme, the Bajna
team was able to relate the objectives much more directly to the work in the field. See Box 3, for details.

53
Box 3: Vision, Mission and Objectives
Vision Happy, healthy, learning child
Mission Facilitate integrated child development through convergent community and government
action
Objectives
Create awareness on child development with a focus on the girl child
Strengthen linkages between different service providers
Strengthen linkages between the community, panchayat and service Providers
Facilitate formation of Ekta Samuhs at village level (Village Resource Group) with
representatives of the community, panchayat and service providers
Develop integrated village level action plans around the needs of the child
Advocate and lobby with local, district and state administration for flexible allocation
of resources
The roll out of this vision was further detailed as shown in Figure 4 below. The importance of language
and translation of other terms into language commonly used and understood by people came up sharply
during the field visit of ERU to Piplipada village in 2006. In the project, one of the key strategies is the
formation of village resource groups which would be the fulcrum around which it would revolve. The
literal translation of Village Resource Group resulted in a difficult and infelicitous name,
incomprehensible to most and very low on recall. When the people were asked to come up with a name
they suggested Ekta Samuh (the literal meaning being solidarity group), which in a sense took the concept
of Village Resource Group (VRG) beyond mere resource support, but also underlined the community
level solidarity that is essential, if resource support is to be provided. Hence, it was decided to name the
Village Resource Groups as Ekta Samuhs since the people would identify with the name.

54
Figure 4: Visualizing the objectives
IV. Translating visions into action
IV.1 Enabling a community understanding: A dynamic information and communication strategy
The success of an initiative rests often on the depth of community level understanding and support.
Information dissemination and communication is an area that the Bachpan project focused a lot of
attention on especially in the first year. The challenges were many- to develop an understanding of the
needs of the children, to confront the status of children, to comprehend the concept of integrated child
development that underpinned the project, the role of parents and the community in this process, and the
need for a dynamic partnership between local communities and service providers.
Communication was given top priority as a strategy of community mobilization, to reach out to a
community that has by and large remained outside the mainstream. A variety of strategies have been
employed- entertainment, rallies, activities in the village, etc. Since the population in Bajna is
predominantly illiterate, it was decided to focus on audio-visual folk media for communication. Different
aspects of child development, health, nutrition and education components of government programmes
were selected for information dissemination.
The innovative medium of Sandesh Vahini Dals (SVD) was used here too, after seeing its success in the
Naandi project in Sheopur district of Madhya Pradesh. Local persons familiar with folk drama theatre and
music were identified in preparation of the Bajna based Sandesh Vahini Dals. The team also collected
information on local melas and weekly bazaars to make use of these public events for reaching out to the
community. This group with orientation on the objectives of the project and some basic theatre and music
skills put up low cost, high-powered performances (comprising songs, plays and interactive sessions) in
villages.
In Bajna a youth group was identified and a three-day comprehensive cultural workshop was organised
for them. The group put up 14 performances in different villages across the area. The creation of Bajna
Supportive/ responsive community
Proactive Panchayat
Healthy
mother.
Complete Immunisatio
n
Functional
ICDS, Quality Mid Day
meal
Aware parents; Active women’s and youth
groups
Healthy
Happy
Learning
CHILD
Sensitive Service providers- ANM
Anganwadi worker
School teacher
Functional
inclusive school
Gender and equity sensitive
classroom
practice Focus on child
Responsive Block &
District administration- preferential and flexible
resource allocations
Assured rights
and Dignity of
the child
Starting
life as a
healthy person
Improved nutrition
Guarantee of
quality
education
Assured rights of children

55
based SVDs has resulted in the formation of a resource pool from within the community, which should be
a sustainable resource for the future. The SVD performances attracted a large number of women as well.
The block level officials, especially the Block Medical Officer (BMO) and the Child Development Project
Officer (CDPO), made it a point to be present at some of performances and to give support to the
programme. Some local musicians and writers were invited to enrich the creation of skits and songs.
Box 4: Impact of Sandesh Vahini Dals
Interactions with the community in Kundanpur revealed that people did remember and retain messages
from the Sandesh Vahinis. Sandesh Vahini Dals (SVDs) have had an enduring impact on the memory of
the local people. Most people the ERU team met remember messages like – water must be filtered with a
cloth, hands must be washed.
Impact of SVD messages as identified by the community-
More institutional deliveries
Increase in the enrolment at schools
Rise in the enrolment of girls
Increased awareness about iodised salt and clean drinking water.
IV.1.i Need for sustained communication
The impact of the Sandesh Vahinis was widely appreciated by the community, as the information at that
time was useful and handy. Its outreach was limited but impact was tremendous in informing people and
raising their awareness. This good practice for community mobilization needed to be used at different
stages of the project with appropriate messages as per the needs of the people.
What was required was a strategy to disseminate focused and issue specific messages rather than a
multiple volley of messages and also to give seasonal messages for example information on diarrhea
prevention and management during the summer. These should either target specific attitudinal changes
like sanitation and hygiene promotion, health etc or at a specific audience like the frequently migrating
families. SVDs should perform closest to the habitations of difficult to reach sections of the community.
Within the Bachpan project, however, this environment building strategy was budgeted for the first year.
Since this component was not budgeted for in subsequent years, it meant that this powerful tool could not
be used for deepening the awareness of the community.. Local cultural media are powerful and tend to
leave a greater impact than a meeting, rally or campaign as it enables the implementer to intermix serious
information and messages along with an entertainment element.
IV.2 Forming Ekta Samuhs and laying the foundation for convergent action
The Bachpan project was designed with the express purpose of enabling convergent action at the village
level to ensure that children have the best possible chance of being healthy, have access to schooling and
successfully complete elementary education.
The project aimed at developing convergence between the various service providers and the local
communities, to enable them to come together to achieve common goals of holistic child development.
The objective was to create a common forum at the village level called the Ekta Samuh. The expectation
was that this Ekta Samuh would look at the issues facing children, and accordingly develop a village plan
for children spelling out what each of the service sectors needs to do and what is the responsibility of the
community.

56
Planning and designing for convergent action is easier than trying to put it into practice. There are several
roadblocks that come in the way. Generally service providers work in discrete ways with little cross
interaction, starting from the village level going up to the highest level such as the department. The bigger
roadblock is actually working with the community and viewing it as an equal partner. Even before getting
to the stage of forming an Ekta Samuh, several steps had to be taken:
Step 1: Working with each of the service provider groups separately, to introduce the concept of
integrated child development, providing inputs and building capacities to improve the service and
essentially providing encouragement and support through the way.
Working with the community, building awareness on children’s needs, rights and the role that the
community can play.
Step 2: Organizing common meetings with service providers and representatives of the community to
discuss issues of children in the community and begin a dialogue of how each can support the other to
improve the situation of children. Mooting the idea of an Ekta Samuh among the people.
Step 3: Focusing on the Ekta Samuhs. Organizing common meetings, enabling the Ekta Samuh to
visualize its role and function, facilitating a common action plan to evolve. Strengthening Ekta Samuhs
through building linkages across villages, through panchayat level interactions.
IV.3 Energizing service providers and emerging outcomes
An important first step towards the empowering process of Ekta Samuhs was developing linkages across
sectors and with the community was energizing the service providers and services in various ways-
through training, dissemination of information and hand holding. The training inputs were particularly
useful for the Anganwadi workers, as almost all were illiterate and welcomed the training. From the first
reports from the field it appears that the outcomes were encouraging. See Figure 5 below for details:

57
Figure 5: Energizing service providers
Quite obviously energizing the service providers had its impact on the services themselves. What was
important in the strategy was the dual approach- not only the direct inputs to the service provider but also
inputs to strengthen the environment and supportive activities. For instance, both in the case of the ICDS
and health services, the strong community awareness campaigns not only increased community
understanding of the services but also highlighted the manner in which children could benefit and the
specific role of the parents and community in ensuring that children access and benefit from these
services. In the case of health, the success of the fixed day services depended again not only on the
regularity of the service provider, but also the eagerness of the community to access it. Where the
community sensitization had a direct impact was in the greater use of the services of the CHC which had
a committed doctor and was a vibrant health centre. In the case of the school the work with the PTAs and
the Maje Ke Pathshalas (Fun learning centres for children before and after schools), were a great push
role in sending larger numbers of children into school.
IV.3.i An example of building cross- sectoral linkages and understanding
In the middle of June 2006, a workshop for teachers, ANMs and AWWs was held to enable a common
action plan to evolve. The participative methodology evoked a good response. The group discussed inputs
for children which were mainly identified as –
Good health
Quality education
Nutrition
Good school environment
Proper implementation of government schemes
Adequate means for economic sustainability/livelihoods
ICDS
Healt
h
Schoo
l
Inputs Training of AWWs in child centred activities, games and songs Orientation of CDPOs and supervisors Dissemination of information on entitlements and the service itself
Emerging Outcomes Increase in community demand Monitoring by community Increase in children attending Improvement in regularity and quality of service
Inputs Community awareness through cultural programmes Orientation of ANMs and Supervisors Facilitating Fixed Day services Linkages with PHC
Emerging Outcomes Increase in immunization and institutional deliveries Increased access Increased monitoring and increase in demands for accountability
Inputs Building awareness on value of education Creating alternatives for migrant children to attend school PTA activation Setting up Maje ki Pathshalas as models Creating opportunities for child development through Bal Panchayats, melas, rallies etc Teacher motivation School improvement
Emerging Outcomes Increase in enrolment, especially girls Improvement in attendance Start of Shiksha Ghars, (residential facilities) for migrant children. Linkages between community and school

58
To enable children to grow up in a holistically conducive environment keeping the above points in mind
the ANMs, AWWs and teachers put forth their commitments. See Table 3:
Table 3: Commitments of teachers, ANMs and AWWs
Teachers ANMs AWWs
Focus on enrollment
Welcome new children
Practice multi-level teaching
Contact PTAs and parents for
girls’ enrolment
Develop awareness regarding
social evils through parents
and Ekta Samuhs
Make efforts to enroll dropouts
and out of school children
Arrange bridge courses for
children- 12 have been
sanctioned in Bajna
Facilitate Shiksha Ghars and
KGBV
Honestly implement the MDM
scheme
Reach out to pregnant women
and register them
Take up institutional deliveries
and facilitate incentives for them
Accomplish total immunization
Promote breast feeding and semi
-solid food for infants
Disseminate information about
hygiene and cleanliness
Create awareness about family
planning and spacing of children
Inform women of all health
related government schemes
Actively take up pre school
education in AWCs
Ensure that children eat the SNP
given to them. Continue to give
double nutrition share to the
malnourished children
Ensure that women also
consume the nutrition given to
them
Open the AWCs timely
Weigh the children regularly to
monitor growth
Facilitate birth, death and
marriage registration
Promote health and hygiene in
the village through general
health awareness
A consolidated joint action plan was developed for the forthcoming quarter on the basis of the above
commitments. What emerged was as follows:
Environment creation through communication/advocacy for children’s health, education and
development through – rallies, campaigns, bal/health melas, IEC materials, folk media etc.
Fixed day activities/meetings of AWWs, ANMs and teachers at designated places. 100 % registration
of pregnant women and 100% immunization of children through fixed day services.
Village plans to be developed with all three government functionaries at the village level.
Compulsory departmental cooperation for health, sanitation and education at village level.
Ensure 10% increase in institutional deliveries.
Ensure that all 0-5year old children are registered in AWCs.
Examination of pregnant women on a regular basis.
Ensuring that all schools and AWCs function with regularity.
Motivation of parents to send their children regularly to AWCs and schools.
All service providers to support and ensure that all children over 5 years get admitted in Primary
schools.
Teachers to maintain regular and fair attendance of children in schools.
Non-enrolled and dropout children to be enrolled in school/ bridge courses/ Shiksha Ghars through
joint efforts of service providers and the community.
Monthly PTA meetings with teachers.
Motivation of older children to bring siblings to school and help them to study at home.
Provide a more joyful learning environment in the school for children through use of TLM and
activities.
Ensure that children receive all the incentives that are meant for them.

59
Teachers went a step further and identified some key indicators for themselves:
Developing attractive schools
All schools function regularly
Joyful learning in schools/AWCs
Increase in TLM usage in schools
Games and sports equipment used in schools
All children get the incentives meant for them
All children attend regularly
No dropout children
The gap here was the inability to take this momentum to a next plane of purposively following up on it.
The assumption that since the plan had been made by the service providers it would be followed through
was questionable. While subsequent feedback suggested that action had taken along the lines indicated
above, the universality of approach and potential impact remained a moot issue. This was to change in the
subsequent periods when there was a better appreciation of the need to bring the Naandi plan in line with
that of the service providers.
IV.4 The Ekta Samuhs
The gradual movement of Ekta Samuhs from loose groups to focused action groups over time, with some
clarity about village and panchayat level plans for children evolved over a period of two years. See Table
5, for the process and timeline of formation and consolidation of Ekta Samuhs
Table 5: Time line of formation and consolidation of Ekta Samuhs
December 2005 The Bajna villages relatively unaware of what Naandi was doing. Neither the
baseline survey by Indicus Analyticus or resource mapping by Naandi seemed to
have evoked any interest or curiosity.
January to
March 2006
Village level meetings organized and in the process began the formation of the
Village resource group. During this period the low conceptual clarity and
understanding of the Jan Mitras reflected itself in the field.
Active involvement in the field, built up the trust and confidence in the Jan
Mitras.
April to
December 2006 Changed the name of village resource group to Ekta Samuh, thereby
increasing the understanding among the local communities.
Increase in the frequency of village level meeting.
112 Ekta Samuhs constituted and oriented regarding their roles and
responsibilities. JMs held over 600 community meetings in the villages with
the assistance of Ekta Samuhs (ES)
Village planning exercises were completed in about 50 percent of the
villages, where dropout and never enrolled children, especially those from
migrant families were identified to be targeted by the community for
enrolment.
ES still unclear about how to take these plans forward.

60
Gradual definition of roles started emerging:
The roles and responsibilities of Ekta Samuhs
Create awareness in the community about health hygiene and cleanliness.
Motivate irregular service providers to be more regular in discharging their
functions.
Inform the concerned department about the problems being faced in the
village.
Motivate women to adopt institutional deliveries.
Render support for immunization of children and motivate the community to
adopt it for children.
Ensure enrolment of all children in the 6-14 age group and motivate parents
for schooling of their children.
Be informed about the learning levels of children in schools.
Some indicators of a strong ES also began to be articulated:
Parameters of a strong Ekta Samuh
Has a perspective for holistic child development.
Complete knowledge of the village.
Aware of the problems of the village.
Knowledge of all government schemes and programmes.
Actively ensures that all children are in AWCs/ schools.
Some ES began to play an active role in identification and selection of dropout
girls and boys for bridge courses and monitoring of schools and AWCs.
April to July
2007
Around 35% of ES were proactive.
In order to strengthen the ES, there was a change in strategy moving from village
level meetings to facilitating panchayat level interactions between ES. Such
workshops were held in 50% of the panchayats with fairly large participation and
in some cases with large number of women coming to the meetings.
August to
December 2007
ES more confident and reflective. In a self assessment during workshops in all
the 3 clusters, ES representatives measured impact in terms of greatest benefit in
the following priority order- Children, Anganwadi centres, school, health,
Community /ES. 30-35% of ES reported that they are confident of ensuring
immunization, ensuring school enrollment, holding ES meetings on their own,
and in 2 out of the 3 clusters monitor the school and Maje ki pathshalas.
2008 During the course of a meeting in all the 3 clusters in mid-2008, ES
representatives were very enthusiastic in reporting what they saw as changes
happening and were also willing to articulate problem areas where they are not
making any headway:
Education
o Earlier a large number of children were out of school, now many
more are in school. School timings are more regular and many
61
present said that in their villages, schools now ran from 10 to 4
pm. Teacher attitudes they said had a great influence on the
functioning of the school as well as on attendance of children. In
Semilkhedi village for instance a sensitive and regular teacher
impacted the attendance which went up significantly. In this
same village young man offers tuition to 30 children who have
just joined the school to ensure that they do not drop out.
o Sensitivity to the problem of out of school children has been
built. The Raoti cluster representatives reported that in their
villages of 72 enrolment was as follows:
28 villages with 100% enrolment
11 villages with 25% out of school children
5 villages with 10% out of school children
2 villages with 50% out of school children
All the 50 villages whose representatives came to the
meeting reported that all girls in their village of primary
school age were attending school. Quite obviously now
the spotlight needs to be thrown on the older girls.
o In Amlipur village for instance 4 years ago only about 8-9
children would take exams. Now around 80 children take exams
in the same village.
In Jharaniakela, village in Kundanpur cluster, the situation of the absentee
teacher was tackled by the PTA. The PTA took immediate action by confronting
the teacher about absenteeism, noted the daily attendance in the register and then
complained to the BEO. After the complaint a new teacher was attached, which
improved the situation as the children too became regular after this. In
Kewdakhurd village, the school had two women teachers who were not so
regular, but the ES was active and demanded accountability so they became
regular gradually.
In 3-4 villages the situation of schools had not improved as the teachers and the
students, both were irregular. This is because the people who are residing in
these scattered hamlets migrate during the working season along with their
children. For instance in Karakela village, almost 80 children were not going to
school, as reported by the ES members. They said that people in this village were
poor and less aware about educating their children. They would send their
children to school if they had a hostel facility. In such a situation it becomes
imperative for the Bachpan team to raise this issue with SSA to explore the
possibility of organizing such a hostel.
ICDS
o In several villages where the location of the ICDS centre was changed it
has had a positive impact on improving attendance and access. The
AWWs reported that now with community support 40-50 children come
to the ICDS centre. The AWWs were also very appreciative of the
training inputs provided by Naandi and wanted more sustained inputs.
o A major problem the community is faced with is corruption in the

62
The proactive role of the Ekta Samuh is also borne out by the feedback from government functionaries.
At the Block level meeting in 2006, the senior functionaries of the three departments assured support for
coordination of activities under the leadership of the Chief Block Officer at Bajna. All the members
present acknowledged that people had become far more aware about facilities and schemes of the
government. There was a change in the environment at village level, as there was a growing demand for
more transparency by the community in the delivery of services.
Health Department - Dr. Verma from the CHC said that more and more people, particularly women
were coming for availing health care. He informed that health check up camps for children could be
facilitated within a 3Km radius of middle schools on fixed days.
Education Department – The BEO, Mr. Aliya informed that AWC and School timings could be
coordinated where the AWCs were running in the school premises. Mr. Pachauri the BRC Coordinator
was amenable to support Shiksha Ghars for migrant children if a consolidated list of the needs in the
block was given for each village. The idea of training teachers for multi-grade teaching and activity
based joyful learning was given a positive go ahead by him and the BEO.
ICDS Department – The CDPO, Mr. Bohra was appreciative of the quality of training given to AWWs.
He also informed that the construction of 36 AWCs had been sanctioned for which the Ekta Samuhs could
play critical role in their location so as to ensure transparency by Sarpanches.
Chief Block Officer – Mr. Dandotia was extremely positive about the efforts of the project in the Block
saying that, “If you can work and succeed in Bajna you can do it anywhere.” He supported the idea of an
orientation of Sarpanches because they play a pivotal role in village politics and development. He
suggested that the administration would consider transferring employment guarantee schemes to those
villages suggested by the Naandi team where population migration was between 50-75%, in order to
purchase of the nutritional supplement. Everyone is aware that money
for nutrition is being salted away, corruption is rampant and the big
question is what to do? “Money meant for children should reach
children. We will not tolerate misuse”. Quite obviously the challenge
before the Bachpan team is to empower the ES to an extent that they can
take independent action. What perhaps needs to be done from the project
side is to increase opportunities for interactions between ES and officials
at various levels so such issues can be raised in the right fora.
Health
o The practice of institutional deliveries is quite evidently
becoming common. In Labanipura village for instance over the
past year there were 12 institutional deliveries
o In Bijli village for instance an interesting development is the
manner in which the ES and youth groups are adopting an
organic and integrated approach to issues of health, livelihoods
and schooling., wherein the implementation of NREGS,
promotion of institutional deliveries and ensuring children’s
education are all seen as the key and strategic interventions that
the ES and youth group would focus on. They ensured that 2
very poor families received 100 days work under NREGA. A
nursing mother was paid full wages for 6 weeks after delivery as
per norms.

63
ensure some livelihood opportunities, besides containing migration.(Source: ERU Report III, September
2006).
In mid 2008 the Block Education Officer (BEO), Mr. Pachauri informed that frequently the members of
the ES come to him about school related issues in their villages. So not only does he get a feedback about
the functioning of the school, but also the support of the community in tackling errant teachers, who
otherwise would use other pressures to neglect their duties. The BEO was also amenable to providing
hostels under SSA for migrant children at block level if the ES would give lists of children from various
migrant families in the villages. He gave heed to the idea of setting up model primary schools in some
clusters where the community, PTA, teachers and Bal Panchayats could wor together to achieve quality
education.
IV.4.i Village plans for children
The development of village level child development plans was one of the pivotal components of the
programme as envisioned in the design of the pilot. It was expected that the Ekta Samuhs would develop
such plans which would inform all activities and interventions for children at the village level. It was also
expected that such plans would be used to lobby with block and district level authorities for targeted
interventions and allocation of necessary resources.
In the initial phase of the project because of poor understanding of the project, its approach and strategies,
the whole process of development of village plans was done in a top down fashion with little involvement
of the community. Further the village plan once having been made by the project staff did not figure in
any of the inputs or interventions at the field level. The process of Ekta Samuh formation was seen as a
process independent of the village plan. As the community was mobilized and the ES started
understanding their roles and identifying the problems with regard to their children and became proactive,
a broad plan of action began to develop in some areas by the middle of 2006.
In Keriapada village, the first tentative village plan was discussed amongst the members of the Ekta
Samuh, with facilitation by the JM.
The group focused attention on the problem of drop out children, pre- natal care for women and
poor health status of children, heavy migration of families (50%) for economic sustainability,
alcoholism and smoking among men and the issue of dowry.
They also discovered that many children were in school but the parents did not know in which class
they were. The irregularity of the school teacher was another problem they faced.
Here, the Ekta Samuh was fairly active and had already taken a decision to work on certain issues
in the second meeting, in the presence of the team and the larger community.
They wanted to identify children from migrant families and motivate them to stay back in a
residential centre when the parents migrated. The parents present had consented to this proposal.
The second thing they wanted to organize was a health check- up camp for children of the village in
the monsoon season for preventive remedies. Subsequently, they wanted to ensure that all 3-6 year
olds were in the AWC and all children under six years were immunized.
The Ekta Samuh members also vowed to become teetotalers themselves while encouraging the
practice across the village. The members considered setting up a Bal Kosh in the village for the
children, by putting in fifty paisa per person as a saving on a monthly basis. This would go towards
the needs of any child/ or children for health or educational needs.

64
Though as mentioned above, when the strategies for strengthening of Ekta Samuhs shifted from a village
focus to a panchayat focus by middle of 2007, the possibilities of evolving a village plan of action were
better grasped. For instance the series of cluster level meetings in mid 2008 underscored this possibility as
indicated in Table 4 below:
Table 4: Planning at Panchayat level, Kundanpur cluster – Chikni and Binti Panchayats (ES to
take the initiative in respective villages)
Actions to be taken
Children below
5yrs
Month 1 Month 2 Month 3
Immunisation of
children whose
parents migrate
SNP irregular and
nutrition and
sanitation weak
AW children not
regular
Children have poor
nutrition
Make mothers aware
about immunisation.
Door to door visits of
ANM. Set fixed place
for immunization in
village
Training on importance
of SNP
Discuss and motivate
mothers and ensure
AWC is regular
Get ANM and AWW
to speak about nutrition
from local foods
Awareness about pre
school education to
parents
Move for fixed day
services
Follow up with AWC and
panchayat on SNP
Discussions with mothers
and follow up activities
See that nutrition is
served in AWCs and ask
mothers whether children
eat at home
Inform parents about
meetings to follow up on
issues.
ES to follow up
motivation of parents
and track children.
Ensure fixed day
services become regular.
ES tracks AWC, AWW
ANM
Children going to school
Children from some
hamlets absent from
school even though
enrolled
Schools do not open
regularly
Talk to parents about
shifting of children
from sibling care
Community to track
children who are
absent frequently and
speak to parents
Mobilse parents for
enrolling children and
making them regular
Motivation of parents
hamlet wise
Discussions with parents
through meetings and
discussions
PTA to track children in
the schools and ensure
that incentives are
available for them
ES to monitor use of
funds in schools through
PTA
PTA and ES to monitor
school regularity and
quality and report to
Education Department
PTA to convene timely
and follow up activities
– hamlet level meetings
and sharing of
experiences
Other village issues
Regular visits of
ANMs to AWC
Visits of pregnant
women to health
centre
School boundary and
beautification
Speak to ANMs telling
them of their problems
– at meetings
Identify and motivate
women through AWW
and ANM – in the
hamlets
PTA to become active
– speak to the teacher
Set a day for examination
of women by the ANM
Inform them about
services at the health
centre
Children and parents get
involved in school
improvement
ES speaks to Sarpanch
Track the women and
ensure their records are
maintained
Ask Mahila Manch to
track them in the
different hamlets
School function to
showcase school

65
Drinking water
facility dysfunctional
Mobilise people for
action
Move to higher level if
Sarpanch does not take
action
While individual Ekta Samuhs began to address several child related issues and in many cases with
success, the translation of this into village plans did not take place. The idea of village level child plans
that should have grown from the initiatives and commitment of the community as above took root only
sporadically, in some villages where the leaders of ES were active and the community was mobilized. The
development of such plans across the board could not translate on a wider scale as the team itself was not
quite clear on the principles and steps for developing village plans. It must be said, however, that the
whole process of formation of the Ekta Samuh itself took considerable time. The concept of the village
plan evolving into an actual plan of action at the village level and moving up into a block level plan did
not take place as anticipated. What the Bajna experience suggests is, that to expect that such a process
would get grounded within a 3 year time frame is unrealistic.
IV.5 Working with Children
Enabling environment for children’s participation
The creation of an enabling environment for children’s participation and empowerment in the earlier
phase of the project through the Bal Melas with competitions, games, songs and rallies provided them an
opportunity to come forth with their talents. This helped parents to feel connected, when their children
won prizes awarded by the panchayats, showing a first step in people recognizing the potential of
children. The subsequent, Bal Mahotsavs, celebrated on or around Children’s Day, at the block level,
brought different school children and teachers together along with the Bal Mitras. This was a successful
strategy in building a relationship between children across schools. These events received both support
and appreciation from parents and the community. The school teachers saw their involvement with
children as something tangible, besides encouraging the students to be recognized through the village
community in general and parents in particular.
The creation of Bal Panchayats in 60 schools, where Bal Mitras were attached, helped in tracking drop
out children, maintaining school cleanliness, monitoring of regularity of children and in a couple of cases
have raised their problems at the community level. This positive move created a platform and an
environment where children’s voices could be heard in public domains.
Alternative models – Maje ki Pathshalas
Maje ki pathshalas (Fun learning centres) as models in order to demonstrate qualitative education to the
village community were set up in 60 primary schools where schools did not have sufficient teachers
and/or teacher/ student absenteeism was high. The purpose of running the Maje ki pathshala was to
demonstrate to the community and the school system that significant changes can be brought about in the
education of the children through a regular and focused approach and adopting a joyful and innovative
pedagogy. Volunteer teachers called Bal Mitras were appointed. As in other parts of the country where
similar strategies were adopted, in the initial phase a gradual dependency on the Bal Mitras increased with
teachers often shirking their responsibilities. This led to a change in the strategy whereby the role of the
Bal Mitra and Maje ki pathshala was changed. The focus now was to provide special sessions or
assistance to the children weak in studies before or after school hours. Interestingly, this intervention has
made both a negative and positive impact on the community and the education system. Positive impact
has been in the form of communities coming together to pool in money to pay an honorarium to Bal
Mitras and teachers became more proactive in some schools. However, on the flip side some teachers
became further careless and unburdened their responsibilities on the Bal Mitras.

66
An evaluation of children of Maje ki pathshala, by Jan Mitras to assess the progress made by the children
against indicators for language- Hindi/English, reading and writing, understanding and recollection of
numbers, tables etc was shared with the communities. The assessment results were made public, pasted in
the classrooms, and shared with parents.
During a meeting with various community groups in all the 3 clusters during mid- 2008, change in
various forms was reported.
o Earlier a large number of children were out of school, now many more are in school. School
timings are more regular and many present said that in their villages, schools now ran from 10 to 4
pm. Teacher attitudes they said had a great influence on the functioning of the school as well as on
attendance of children. In Semilkhedi village, for instance, a sensitive and regular teacher impacted
the attendance which went up significantly. In this same village young man offers tuition to 30
children who have just joined the school to ensure that they do not drop out.
o Sensitivity to the problem of out of school children has been built. In the villages represented in the
cluster meeting, it was reported that enrolment was as follows:
28 villages with 100% enrolment
11 villages with 25% out of school children
5 villages with 10% out of school children
2 villages with 50% out of school children
All the 50 villages whose representatives came to the meeting reported that all girls in their
village of primary school age were attending school. Quite obviously now the spotlight needs
to be thrown on the older girls.
o In Amlipur village for instance 4 years ago only about 8-9 children would take exams. Now around
80 children take exams in the same village.
o When parents go out of the village for work, arrangements are being made to leave their children
with relatives so that the schooling is not interrupted. While this is happening in some villages,
everyone present felt that this is a good practice to be emulated elsewhere as well.
o The Village headman of Malwasi village was very appreciative of the manner in which children
were being encouraged to take on leadership roles at the community level through the Bal
Panchayats. The Kishori sarpanch of the Bal Panchayat brought the issue of poor quality MDM
being served in the school to the notice of the panchayat. The panchayat warned the cook and also
brought the issue to the notice of the block authorities, consequently the cook was changed and now
there are no problems with the MDM quality.
o To ensure sustainability of the Maje ki pathsahala, the teachers in 16 villages were selected by the
community, which pays them Rs 10/20/50 per child as per the decision of the ES. Parents feel that
if Naandi is not there in the near future then they will keep the BMs to help the children do well in
school.
In Manpura village the ES selected the BalMitra (BM) in the village meeting, identified the children who
needed remedial children and decided the amount each parent would contribute for the teacher. They
also resolved to test the children to see if they are learning before paying the BM. For motivating the
children they distributed gifts to them in the functions/events organised at village level. To the newly
enrolled children the ES gave slates to encourage them and to ensure that they do not feel left out.
In another village – Ratangarh Peeth, the Panchayat and villagers held a rally to celebrate the
enrollment of children and invited the government functionaries and teachers. They distributed pens to all
children from class 1-8th, while the Panchayat arranged for the tea and snacks for the event.

67
Yuvak Mangal Dals and Kishori Manches
The Yuvak Mangal Dals and Kishori Manches initiated in some villages, started the process of a dialogue
with them to take on village level development issues. During Ekta Samuh meetings some active young
boys took the lead in writing minutes, following up agendas and tracking out of school children. Young
adults have aspirations for themselves, as the area does not offer much by way of work or educational
opportunities. They perceived that meeting together as a forum would help them to move ahead regarding
their own future. Adolescent girls also began to get interested as well. Some sporadic inputs on health
were provided with the assistance of ANMs. Within Bachpan no clear strategy for local youth, however,
evolved, nor was there a clear understanding of how youth could be mobilized and made an integral part
of the Ekta Samuhs.
V. Monitoring and review
Monitoring and review have been problematic issues through out the project .During the rolling out of the
pilot, in the initial first six months there were start up problems. There was the problem in setting up a
fully functional block level office to carry forward the implementation of the pilot as Bajna was a very
backward block. Even the newly selected coordinator left within a few months due to health problems;
and the Project Manager was able to give only half his time to Bajna, as he was also in charge of another
project in another district in MP. It was difficult to find facilitators, later called JMs, to work in the
villages with the community, as no such work had been done by any NGO in the area.
The lack of perspective building and organized training at the beginning of the project led to considerable
confusion in understanding the project vision and objectives, as well as their own roles in this process.
The entire team of PAs and JMs did not have a clear understanding about their specific roles and tracking
milestones and actions taken in convergence, how to build and sustain linkages, etc. The list is long.
Therefore, in the first year of implementation of the pilot, the management and monitoring systems were
fragile, as activities and strategies were being tested and evolved, as reported by the ERU team in its
quarterly report of April-July 2006. Planning and review of activities was ad hoc, with management and
administration carried out on an as is where is basis. Since the entire team was inexperienced and fairly
new, it took time to come to grips with such a process oriented project. The entire need based, bottom up
planning and tracking evolved through intensive discussions and dialogue over a two year period.
Firstly, the Jan Mitras and the Programme Associates took some time to adjust to the concept of data /
information gathering through resource mapping and surveys as they had no focused training on how to
go about doing this. Further on, the collation of field data was also an issue as the team lacked the skills
and competencies to do such an exercise. Gradually, through on the job training, doing qualitative
documentation of field processes, trainings, events and issues the functionaries understood the purpose of
documenting activities and events on a timely basis. Even monthly, quarterly and six monthly progress
reports evolved through a gradual process of learning, which drew them into the habit of recording,
reporting and reviewing. The JMs started writing brief reports of major field events like Sandesh Vahini
programmes, jathas/ rallies, launch of activities etc. During the first year of the project, everyone in the
team was involved in a hands-on fashion, so the project was monitored on a ‘learning by experience’
basis.
One of the first attempts to assess the work of JMs was through self appraisal when they did a SWOT
analysis of their work with reference to project activities in July 2007. Most Jan Mitras identified their
weak areas - ineffective communication skills, lack of planning abilities and time management, inability
to write reports, no data assessment/collation skills and inability to organise the community. While on the
other side they spoke of how they had grown as field workers with defined roles and responsibilities (see
table 2 above) and had acquired new skills.

68
The team chalked out a plan (as below), to effectively reach out to the hard to reach hamlets after
assessing that they had been left out. See Figure 4.
Figure 4: Schedule to reach out to the unreached
(Source ERU Process Documentation Report January - March 2007).
At the same time they learnt to define the parameters of qualitative improvement for each of the
components, including Ekta Samuhs by tracking progress in their respective villages based on the
parameters they had evolved. See Table 5 below. Using these parameters they ranked the villages vis a vis
issues on a scale of A-D:
A : 76 - 100% of the parameters visible
B : 51 - 75% of the parameters visible
C : 26 - 50% of the parameters visible
D : 1 - 25% of the parameters visible
Jan Mitras were able to rank each issue in relation to the progress made in each of their villages. During
this process they were able to visualize and understand that the education component and in some cases
Ekta Samuhs obtained high ranking (mostly Bs and A in some 3 villages), while Anganwadi and health
components scored poorly (mostly Cs and Ds). This confirmed that the programme emphasis was more
on the education component than the other two. Later, each JM graded each of his/ her villages against
four issues – health, education, AWC and strength of Ekta Samuh. Once the JMs learnt to do this they
were able to qualitatively assess the villages and ES they were working with over each subsequent
quarter.
However, this was not an easy task as the team lacked the skills to conduct a comparative analysis of
achievements and data quarter-wise. A need was felt for simple pictorial tools to enable Ekta Samuh’s to
monitor and document what was happening in their villages. This was, however, not taken forward.
Monitoring and tracking by Ekta Samuhs began in some villages but was not sustained in a very
systematic manner. Another issue that emerged subsequently was that while a lot of data had been
collected, its collation, analysis and assessing achievements continued to be weak among the Naandi
team. An attempt was made to sharpen this by helping JMs to assess and grade their own work in the
villages that they were operating in.
Following this, in May 2007 Naandi sought the assistance of one of the team members of ERU to help
develop monthly and quarterly reporting formats and parameters for information/data collection. The
Programme Manager, PAs met in Hyderabad to collectively develop the formats, which were shared with
the JMs, tested in the field before being finalised.
40% to 50%
households of
marginalized groups
Messages and other
communication specially
designed to address the target
group through SVD Review and assess all project activities
in the context of village plans and
resource maps
Participate in the
social, religious and
cultural activities
Disseminate information about
government schemes, scholarships;
GVT activities include registration
in the Palayan Kendras
Interpersonal communication
strategies-house to house
visits and night stays

69
By 2008 April, with a new manager in place certain administrative changes were brought in. Firstly the
monitoring, review and reporting responsibilities of PAs was spelt out. Several systems were now put in
place. In addition to the fortnightly/monthly reviews, the team met every quarter to review the previous
quarter and develop a detailed plan of action, spelling out the activities and responsibilities of each level.
This quarterly plan then became the basis for monitoring. These quarterly reviews also serve the purpose
of bringing data collection up-to date along with specific success stories and case studies of significant
developments and events. Action plans were developed for individuals and for field activities in terms of
deliverables every fortnight so as to keep a track of the progress of planned initiatives. Now specific
formats have been developed for reporting, with Jan Mitras submitting their written reports.
9 ERU process Documentation Report IV, Mach 2007
Table 5: Parameters of qualitative improvement9
Education Anganwadi Centres Health Ekta Samuh
100 % enrolment of
children
Regular attendance
of teachers and
children
Teaching with fun/
activities
Children from class
1-5 have
competencies of
their levels
Monthly evaluation
of children in
school
Proper usage of
library by the
children
Drinking water,
toilets facilities in
schools
Sports events and
cultural programs
Regular health
checkups in schools
Motivation of
parents whose
children are
irregular
Ensure parents
participation
Ensure
participation of
members of the
community in the
PTA
Ensure
participation of
children in school
activities
Work for PTR with
the BEO
Regular attendance of all
children between the age of 3-
5
The AWW should regularly
teach the children
Mainstream the children in
schools
AWCs use the distributed
material regularly
Administer polio and Vitamin
A drops
Distribute nutrition regularly,
as prescribed - quantity &
quality
Regular weight / height
measurements of children
Tracking of underweight/
grade III/IV children
Registration of all pregnant
and lactating mothers
All three examinations before
the deliveries (even those
women who migrate)
Distribution of quality food to
the pregnant and lactating
mothers
Distribution of IFA tablets and
its consumption by the
pregnant women
Registration and vaccination
of all new born children
Grading of the malnourished
children and their proper
treatment
Note – many points overlap
for AWCs and ANMs
Complete vaccination
and nutritious food to
the pregnant women
Intake of IFA by
pregnant women
Institutional
deliveries
Ensure all children
breastfed
immediately after
birth and exclusive
breast feeding of
children till 6 months
Complete vaccination
of children between
the age group of 0-5
years
Spacing of at least
three years between
the children
Proper weight, height
and growth
measurements
Knowledge of
diarrhea control/
management
Drinking clean water
Consuming iodized
salt
Regular visits by the
ANM to AWC for
check up and
immunization
Punctual/Regular
Good coordination
amongst members
Committed
Knowledge about
child development
programmes
Knowledge about
the village
Unbiased
Good
understanding and
clarity about their
roles and
responsibilities
Decision making
ability
Support activities
in the AWC &
schools
Support health
related
interventions
Ensure
participation of
women &
representation of
the poorest of the
poor in the group

70
Planning is now a monthly process, split into fortnightly tranches for both PAs and JMs, done along with
the Programme Coordinator. This takes into account both activities and budget so as not to face delays in
fund flow for field activities. Consequently, reports as per deliverables for each planned activity against
set targets are prepared by the JMs and PAs themselves. The JMs maintain records of hamlet wise
meetings and Ekta Samuh meetings along with their agendas and plans. The same is done for Panchayat
level workshops which are held at cluster level.
Decentralized management, evolved over the course of the project. What started as ad hoc, top down,
centralized planning and management slowly turned around to need based, focused planning with
constant reviewing on a fortnightly/ monthly basis. The PAs who earlier worked more like the JMs,
evolved as team leaders becoming more responsible and accountable within the whole project. They also
learnt to handle administration, project coordination and administration on a two monthly rotation basis.
They not only have additional roles and responsibilities, but gradually developed management skills
setting the trend for accountability and transparency, besides obtaining on the job training.
This illustrates that once a team has been given an opportunity to perform against its own set targets and
deliverables, review and monitoring can take place simultaneously. The decentralization of roles and
functions and roles had a salutary effect on programme implementation. In mid 2008 during a process
documentation meeting the perceptions of change were captured through an interactive exercise. See
Table 6:
Table 6: Change as perceived by the JMs and PAs in their areas
Words used to
describe change
Some brief Illustrations
Achievement In one Ekta Samuh meeting, a member had all relevant information at hand
Facilitation,
Responsibility
In 3 villages the ES is active in addressing health issues, children’s immunisation
and as well as ensuring children’s education
Excellent In one village, Gadikala, a decision was taken that if children are not sent to
school the family cannot benefit from NREGS
Progress In 4 villages ES are holding meetings on their own
Change (Many
examples were
given by the team)
AWWs and community in one village very articulate about a corrupt
ICDS supervisor. The issue was raised in the Lok Kalyan Samiti meeting
at the cluster level. Ways of tackling this issue very problematic
In several villages the location of the ICDS centre was shifted as a result
of community action
In one area wages under NREGS were not received for 3 months. The
issue was discussed by the ES and a decision taken that collectively they
would raise the issue and get it resolved
New field strategies of organizing hamlet-wise meetings thereby
extending the reach of the project. This is especially helpful for far flung
and isolated hamlets. At the same time efforts would be made to get 2
representatives from each hamlet to become a member of the ES thereby
making the ES representative body
In several villages many more people interested in coming to meetings.
Overall a greater sense of ownership at all levels, at the level of the Bajna
team as well at the community level
Change in the
office/work With new people coming into the organization, things have changed for
the better in the office
Work is more target oriented and systematized

71
Documentation has been tightened and actually takes place- minutes of
meetings. Follow up on future plans is happening
Field visits are now planned activities with an agenda
The fortnightly review is helping sharing and discussion of each other’s
problems
Unity Evident in the field in the office as well as at the field
Many ES are active and unified in deciding what to do for example if the
school or ICDS centre is closed without notice
Leadership Community leadership emerging in addressing issues
Feeling Greater sensitivity to the programme and to individual problems and concerns
Source: ERU Process Documentation Report, January – June 2008
VI. Insights from Project Bachpan
The experience of Project Bachpan has a lot to offer in terms of insights and learning of what worked,
gaps, problems in the design itself, the potential of such approaches and areas where there are
insurmountable obstacles and barriers.
The project site
The selection of Bajna for project implementation at one level was a strategically good choice as the area
was far removed and isolated from any developmental activity and needed such interventions. There was
little resistance from local communities to the Bachpan initiatives and on the contrary was welcomed in
almost all villages. On the flip side there were many hurdles to overcome. Finding local people with some
work experience was difficult. In such a context training and capacity building become critical
components. Within the governmental system such areas do not have the leverage to ensure prompt
government action on issues raised in the field. In such a situation the mediating role of the implementing
NGO becomes critical to ensure that local issues receive the attention they need.
Building in time and space for start up processes
The lack of any start up time in the project design for recruitment and training of staff, putting systems in
place and generally for the implementation team to gain some conceptual grasp of the project design,
objectives and strategies, before launching into implementation was a major drawback. A clear 3-6 month
time is needed to be built in, especially when dealing with a completely inexperienced team, a difficult
terrain and a project that was being remotely managed
Sustained perspective and capacity building
The absence of consistent inputs to the Bajna team was a major drawback. Often one tends to believe that
an understanding of the project could be gained while working in the field. While this is true to an extent,
there is a need for specific training in developing a conceptual understanding of the project and the
implications that the project vision has for strategies and roles. There are other dimensions to the problem.
The vision of the project and its design was not shared with the team during the start up phase and hence
it was not fully internalized by the team. This delayed both the start up phase and consequently impacted
the implementation in the first year. It is essential for the implementing team to know of the vision,
mission and objectives of the project to have a sense of ownership of what they are doing, with clarity of
purpose.
Training cannot be a one time input but requires to be provided over a period of time. This would then
have enabled the team to provide inputs appropriate to a specific stage of maturity of the programme.

72
Strengthening linkages with the block and district administration
Bachpan was set up in consultation with the government, with clear guidelines regarding the quarterly
review and sharing arrangement to both enlist support from the government and to share the issues and
successes in the field. While this interaction took place at the village level and to some extent at the block
level, it did not happen at the district and state level. In the absence of such consistent communication and
interactions, the project was unable to leverage the flow of resources and support to the field level.
Embedding the concept of child centred planning at the community level
The time frame of 3 years is insufficient to enable a village community to understand, and develop the
ownership of the idea of developing a community child development plan. What the Bachpan project has
shown is that a 3 year period is barely enough to enable the Ekta Samuhs to be formed and begin to work
in solidarity and gain the confidence to plan and see through a plan for children on their own. What the
Bajna project requires is another 2 to 3 years before Ekta Samuhs can function in an empowered and
proactive ways.

73
Annex 2: Methodology-Evaluation through controlled and experimental
design
The impact on “outcomes” will be measured based on agreed cross-sectoral indicators estimated from
data collected at the beginning and end of the pilot. Since it is a program targeted at difficult-to-reach
poor groups which encounter a wide range of social, cultural, economic, and organizational problems, it
will throw light into the extent to which planning can be need specific and ensure better service delivery
to the poor. The conceptualization of the net effects (in terms of positive behavior changes of households
and service delivery of the frontline providers) in the evaluation is in terms of the difference between
those who participated in the project (treatment group - those in the participating villages) and
comparable group (the non-participating villages – comparison group) in a quasi-experimental design.
Since this project evaluation is not done as a randomized evaluation, participation and output processes
could be modeled using the standard econometric techniques to arrive at an unbiased estimate of pilot’s
impact. The analysis could involve propensity score matching and multivariate regression methods to
control for selection on observables and instrumental variable methods to control for selection on
unobservable. The general idea is to compare pilot participants and non-participants holding selection
processes constant.
Objective of the Impact Analysis: The impact analysis aimed to capture the net effects of introducing the
convergent approach to child development culminating in the development and implementation of village
plans for children through micro planning as against the sectoral approach, through both pre and post
project comparison and control- experimental design.
Method: The impact to be assessed based on the net effects estimated on the basis of outcomes on cross-
sectoral indicators identified for milestones for each age group, generated through baseline survey data
and end project (end of third year) for the control and experimental blocks.
Data collection: As per the design, data was collected for baseline at the beginning the project (2006) and
for comparison at the end of the third year of implementation (2009).
Survey tools: Data will be collected through household survey schedules to assess child development
indicators as well as household behavior indicators and facility survey tools to assess service delivery
indicators.
Research questions: The impact evaluation addresses the following main concerns:
Will the intervention lead to enhanced client/ community power and more enabled service providers?
Will the resulting impact improve service delivery in terms of better targeting and utilization of funds
and services?
Will the improved service delivery and utilization result in better child development outcomes?
Is a multi-sectoral intervention as envisaged in the pilot more effective in comparison with the
conventional sectoral approach?
Sampling for the Baseline and End line Surveys
The choice of the block from one of the 45 districts of the state for piloting the interventions related to
micro-planning and Village Plans for children was based on certain criteria, including a few
administrative ones, and as a result, it was a purposive sample rather than an out and out random
selection. Ratlam district was identified based on a cumulative development index computed for this

74
purpose10
. The district shares its western and northern boundaries with Rajasthan. The sex ratio for the
district is 959 and literacy rate stands at 55.77, with female literacy rate at 45.05. For all administrative
purposes, Ratlam is divided into Six Tehsils (sub- district divisions) and six Blocks.
Selection of blocks
One of the criteria used for identifying the district and blocks were the absence of any specific
interventions by non-governmental organizations and agencies for programs that address children’s
health, nutrition or education issues. Secondly, the GOMP expressed its desire to have the pilot in one of
the tribal blocks, the most backward in the state, because it was felt that if the pilot could make some
effect on the service delivery model or in the behavior of the beneficiaries, it could be replicated
elsewhere in the state. Within the district, two comparable blocks were identified (using the same criteria)
one to serve as control block (Sailana) and the other as the experimental block (Bajna). Both blocks are
designated tribal blocks by the Government of India. Each block, with approximately 200 villages was
selected to afford socio- economic and socio-cultural comparability. It was ensured that both blocks have
the presence of the three centrally sponsored schemes—Integrated Child Development Services (ICDS),
Reproductive Child Health (RCH) and Sarva Shiksha Abhiyan (SSA).
Both Bajna and Sailana have more than 95% tribal population (Bheel). Both blocks are on the border of
Gujarat and Rajasthan states. The most commonly used local dialect is Bagadi. Though the sex ratios in
the blocks are better than the state average, only 15-18% of the female population is literate (overall
district literacy rate being 26.84).
Sampling Villages
For baseline and end line survey, a total 114 villages out of 220 villages in Bajna block were surveyed.
Villages were randomly chosen from each of the 45 Gram Panchayats covered among the identified
program villages. This ensured that the sample was spread throughout the program area. A total of 93
control villages were randomly sampled in Sailana out of a total of 234 villages. These were also spread
across the whole of Sailana block. This was ensured by dividing the block into 5 sub-regions and
sampling from each sub-region.
Sampling of Households
Size of the villages in terms of population: The average village size in Bajna block was about 100
households. Only a handful of villages had more than 250-300 households. Only a few very small villages
were encountered during the survey i.e. less than 50 households. Initially the samples size was about 2000
households. However, applying the power analysis for sample size estimation11
for determining the
10
The choice of the location for the Pilot study required the choice of 2 blocks that (i) are not very different from the state in general (ii) are close to each other and (iii) are not predominantly urban. In addition the districts where the pilot could be conducted should also (iv) have had no education and health related experiments going on currently or in the recent past. The following were the main categories of issues that were considered to be important and for which the analysis of finding the most ‘average’ block was conducted:
Infrastructure: % Villages with all weather approach road Health Services: % Deliveries by Docs and Nurses, Immunization (BCG, DPT, Measles) Education: Literacy Rate, % of out of school who are girls Demography: % SC population, % Rural Population, Gender ratio
11 Formula used for estimating required target sample n = 4*p*(1-p)*deff/e^2; Using the estimated prevalence of certain indicators at 0.05 estimation margin, number of children needed to be covered and the hence the number of households to be covered were estimated. Indicators used for the target age group covered were DPT3 coverage, BCG coverage,

75
number of the children to be covered, the total number of households was doubled. Finally, in Bajna 2500
households are being surveyed and 2000 in Sailana. For the end line survey, the same procedure was
followed, and it was also ensured that half of the households covered were from the same sample as the
base line survey.
The sampling plan undertaken for the household survey was as following:
Table 1. Sampling Plan for the household survey
Village Size
Maximum
Sample to be
taken Sampling Rule
Number of Villages
Surveyed
Bajna Sailana
Greater than 100 households 25 Sampling every 4-5th household 41 42
50-100 households 20 Sampling every 3rd household 51 45
20-50 households 15 Sampling every 2nd household 20 4
Less than 20 households 50% 2 2
Total Villages Surveyed 114 93
Source: Baseline Survey (January – February 2006)
Table 2. Details of the Survey
Baseline End line Required target
sample as per power
analysis
Bajna Sailana Bajna Sailana
Number of Households covered 2506 2003 2000 2000
0-12 months children covered 836 552 560 520 550
12-24 months children covered 634 429 530 519 520
24-60 months children covered 1602 1453 1472 1317 690
5-10 years children covered 2182 1854 2627 2257 660
Primary Schools 112 105 112 105
Testing children in Language & Maths
in Grade II 863 881 871 874
Sub-Health Centres 23 25 23 25
Anganwadi Centres 109 147 109 102
School readiness tests for 4-5 year olds 858 973 851 958
Source: Baseline Survey (December 2005-February 2006), End line Survey ( May – September 2009)
The household schedule takes information for children in the 0-10 years age group. Only those
households that had a child in the same age group were sampled. The household schedule is divided into
4 blocks based on the age group of the child. In brief, the major indicators covered in each section are
listed below.
0-12 month’s age group: ANC, IFA and Tetanus inoculation by the mother, place of delivery of
the child, trained assistance during birth and breast-feeding practices are the major issues dealt in
this section. These variables basically look into pregnancy related health care issues and other
factors influencing child survival in early infancy.
12-24 months age group: Child immunization, intake of Vitamin A and IFA, supplementary
nutrition is discussed through questionnaire.
24-60 months age group: This section primarily deals with early childhood education,
supplementary nutrition, Vitamin A and IFA intake.
Vitamin A coverage, under-weight percentage, pre-school attendance, and school enrolment; data for indicators were from MICS2 survey.

76
5-10 years of age: Access to schooling, availability of midday meals are the questions raised in this
section.
Sampling of Facilities
The facilities that were surveyed are anganwadi centers, primary schools and sub-health centers. Most of
the villages have an anganwadi centre and a primary school that serve it. There are 26 sub health centers
in Bajna and 24 in Sailana. Of these 23-sub health centres which cater to the 200 project villages in Bajna
have been surveyed. The same number was covered in the control block. Only those facilities have been
studied that served a sampled village. Generally these are the facilities closest or within the village.
Testing of Children
Testing of Grade II students: Achievement level tests were conducted for Grade II in the primary schools
that were surveyed. Though grade V is the final grade of the primary cycle, it was decided to test grade II
mainly due to two reasons. One, this facilitates the tracking of the progress of some of the students in the
same cohort three years down the line; second, changes in the learning levels of those who would attend
anganwadi now could be traced.
Students present were asked to take the test. Testing of children in Grade II involved testing them for: (a)
Hindi; and (b) Math, using tools prepared by NCERT and adapted by the Department of Education in
Madhya Pradesh. As the children would be studying under the syllabus designed by the Madhya Pradesh
Education Board these tools would be of the same level as their classes.
The Hindi test requires the student to recognize the correct word with the corresponding picture. In the
math test simple calculations are to be solved by the student along with recognizing numbers. The tests
are 25 minutes each. Initially the children were introduced to the team in an informal manner. Simple
games were then played to make them feel comfortable. The children were then asked to answer the
questionnaire; the teacher was present in the classroom but was not involved in testing.
Testing children for School Readiness: The school readiness tests, as prepared by the NCERT, are for
children in the 4 to 5 years age group. In both Bajna and Sailana, especially in Bajna, it was noticed that
children were generally enrolled in school at the age of 5. The test attempts to see whether the children in
anganwadis are “prepared” enough to attend school, to capture if a child can differentiate between
different shapes, pictures, sizes, numbers and sounds. It is a verbal test. The school readiness tests were
originally designed to be conducted with grade I students to capture the component of pre-schooling in
the anganwadi centers. The academic year begins in June and finishes in April. The present class of grade
I students would have had about 6 months of school teaching when the survey happened and hence the
results from the tests would also reflect on the schooling that they would have received. That is, a better
alternative was to capture those children who would be joining school in the coming session in 2006 to
test the levels of pre-school education received by them This, for obvious reasons, necessitated the
evaluation of anganwaadi students and not those in the first grade.
Another option would have been testing the children at home, but the fact that all children are “enrolled”
in anganwadis (as the anganwadi workers undertake regular child census and all eligible children are
automatically enrolled in both anganwadi and primary school). There was no child under the 5-year age
group who was not on the roll of anganwadi. Hence the only difference in school readiness tests would
have emerged from those who attend pre-school regularly and those who do not. During household
survey, it would have been difficult to test the pre-school attending children since they were in
anganwadis and not at home. Hence it was decided that the ideal situation is test the children at
anganwadis, and see whether these children have really reached the desirable levels of school readiness.
Those children in the 4 to 5 years age group are the oldest age group at an anganwadi centre and would
have received pre-school education. For this exercise we chose the anganwadi as our focal point. For

77
capturing the levels of school readiness of those children who were enrolled, but not attending regularly,
the households were asked to bring the child to the anganwadi on the day of the school readiness tests –
thus even those not regularly attended were also tested.

78
Annex 3: Socio Economic Milieu and household characteristics of the Study
area
Both Bajna and Sailana shares borders with two other
states - Gujarat and Rajasthan and more than 95 percent of
its population are tribals (Bheel) who uses a local dialect,
Bagadi. Each block consists of around 200-220 villages
each and the number of households differs from village to
village, ranging from villages with less than 20 households
to villages with more than 100 households. The entire
population of these two blocks lives in rural areas with
geographically difficult terrain – hilly, rocky and with
sparse green cover. Around 90 percent of the villages in
these two blocks do not have all weather approach roads,
and even the existing ones are not congenial for vehicular
transport. That makes these villages completely remote
and inaccessible. These blocks are among the most backward in terms of socio-economic indicators
within the state of MP, which itself is among the least developed states in the country. The main crops in
the area are Maize, Soya bean and Cotton.
What is the living style and standard of the people in Bajna and Sailana?
Majority of the households in these two blocks belong to the “below poverty line” (BPL) category. Most
of the households are engaged in subsistence farming or are agricultural or wage laborers. Generally
drought prone, these areas have large number of households who migrates seasonally to other parts of the
state for a living. Literacy rates among people are very low, with less than 1/4th of the people who could
read and write. The sex ratio is highly skewed and there are only 76 girls for 100 boys in the age group of
0-10 in the area (in Bajna, the sex ratio is 77 girls to 100 boys, while in Sailana, it is 75 girls for every 100
boys).
Households in general do not have many general amenities such as private water supply or private toilets.
(See table 2 which provides information about household characteristics and physical amenities of the
households in Bajna and Sailana, as derived from the analysis of household survey data).
While most of the households lacked several items that are considered as essential for a reasonable
standard of living, the relatively ‘better off’ within these more-or-less homogenous societies made
differences in terms of the power structure in the society – especially in political and developmental
decision making. Hence, it made sense to see which households belonged to the ‘relatively better off’
category, identified using an asset index. The asset index was generated using the information available
from these household amenities and ‘assets’. Most of the households belonging to low and middle
economic group of the area do not own any items, even a clock, bicycle or mattress. Any households that
had some of these items belonged to the “well-to-do” category in these blocks. Very few households have
communication and entertainment devises such as telephone, radio or television. Hence, any information
about world outside their habitation/village or government schemes reaches the people only through
mouth– to-mouth communication. Much socio-economic and development related behavioral aspects get
reflected in their practices and facilities – such as not purifying water for drinking purpose or using
iodized salt for cooking.

79
Table. Household Characteristics and Physical Amenities
Percentage of Households: Bajna Sailana Overall
knew their BPL status 53.87 62.91 57.88
belonging to ST 95.09 87.57 91.75
temporarily migrate to other places 44.43 22.1 34.5
where the respondents could read and write 17.24 21.02 18.9
reporting that they avail the provision under PDS 65.08 84.67 73.79
with electricity connection 50.2 58.7 53.98
with a watch/ clock in the house 24.34 32.05 27.8
with telephone 1.04 1.75 1.35
with a bicycle 16.12 19.02 17.4
with a radio/ transistor 5.91 7.89 6.79
with B&W/ color TV 3.24 5.04 4.04
with scooter/motor cycle/ moped 3.1 4.09 3.55
with pucca roof for the house 3.6 3.25 3.45
with pucca wall for the house 7.0 6.45 6.75
with pucca floor for the house 3.74 3.7 3.72
with private toilet facilities 3.03 3.74 3.35
who depend on public taps for drinking water 72.7 73.04 72.85
who use no methods for purifying water 48.6 42.5 45.9
who strain water with a cloth before using it for drinking 41.7 56.8 45.9
Who uses iodized salt for cooking 18.12 26.66 21.9
Average Monthly Household Expenditure (in Rs) 953 1680 1277
Source: Household Survey of the Baseline Survey, December 2005 – February 2007

80
Results
BASELINE
SURVEY
ENDLINE
SURVEY
Regression
coefficients
Difference in
difference
Bajna Sailana Bajna Sailana Bajna Sailana coefficients
Sub-Stage 1
Percent of pregnant women who:
Did not receive / availed
any ANC
24.9% 19.8% 1.3% 0.4% -0.22 -0.194 -0.033
(0.0149) (0.017) (0.006) (0.003) (0.019) (0.018) (0.027)
Availed at least one ANC 75.1% 80.2% 98.7% 99.5% 0.226 0.193 0.033
(0.015) (0.017) (0.006) (0.003) (0.019) (0.0.18) (0.027)
Availed Full ANC 8.9% 23.8% 24.4% 32.5% 0.148 0.087 0.061*
(0.009) (0.018) (0.018) ((0.021) (0.019) (0.027) (0.032)
Mean number of ANC 1.4 1.7 2.05 2.26 0.627 0.578 0.04817
(0.035) (0.057) (0.03) (0.031) (0.052) (0.067) (0.084)
Of those who received some ANC, those who
Had their first ANC within
the first two trimesters
48.8% 55.3% 89.01% 98.1% 0.402 0.428 -0.026**
(0.017) (0.021) (0.014) (0.006) (0.024) (0.016) (0.034)
Had their first ANC during
1st Trimester itself
11.8% 21.2% 56.3% 88.2% 0.444 0.670 0.225***
(0.011) (0.017) (0.022) (0.015) (0.022) (0.023) (0.032)
Those who received different components of ANC
Had their weight measured
during ANC
64.9% 59.2% 85.2% 83.9% 0.202 0.248 -0.045
(0.016) (0.021) (0.016) (0.017) (0.024) (0.027) (0.036)
Had their height measured
during ANC
46.5% 19.4% 56.7% 83.1% 0.092 0.637 -0.545***
(0.017) (0.017) (0.022) (0.017) (0.028) (0.023) (0.038)
Had their BP checked
during ANC
42.0% 20.5% 63.7% 76.8% 0.212 0.563 -0.351***
(0.017) (0.017) (0.021) (0.019) (0.027) (0.025) (0.038)
Had their Blood Tested
during ANC
23.6% 23.2% 53.6% 59.8% 0.300 0.365 -0.0652*
(0.015) (0.018) (0.022) (0.022) (0.025) (0.028) (0.038)
Had their Urine Tested
during ANC
16.9% 12.3% 38.5% 38.6% 0.213 0.263 -0.0499
(0.012) (0.014) (0.021) (0.022) (0.023) (0.025) (0.035)
Had their Abdomen
examined during ANC
9.9% 58.6% 60.2% 10.5% 0.498 -0.481 0.978***
(0.010) (0.021) (0.022) (0.014) (0.021) (0.026) (0.033)
Had their Internal
examined during ANC
16. 9% 22.9% 11.3% 5.3% -0.057 -0.176 0.119***
(0.013) (0.018) (0.014) (0.01) (0.019) (0.021) (0.029)
Had their X-ray done
during ANC
0.2% 0.7% 6.2% 6.7% 0.059 0.060 0
(0.001) (00.03) (0.01) (0.011) (0.008) (0.011) (0.01)
Other aspects of ANC
Intake of IFA 71.7% 78.6% 96.5% 87.8% 0.240 0.092 0.147***
(0.016) (0.017) (000.8) (0.015) (0.020) (0.023) (0.0312)
Vaccination of TT 77.1% 83.5% 95.0% 88.0% 0.178 0.045 0.133***
(0.015) (0.016) (0.009) (0.015) (0.019) (0.0218) (0.029)
Place of Delivery
Home 67.5% 74.9% 31.3% 71.3% -0.365 -0.036 -0.329***
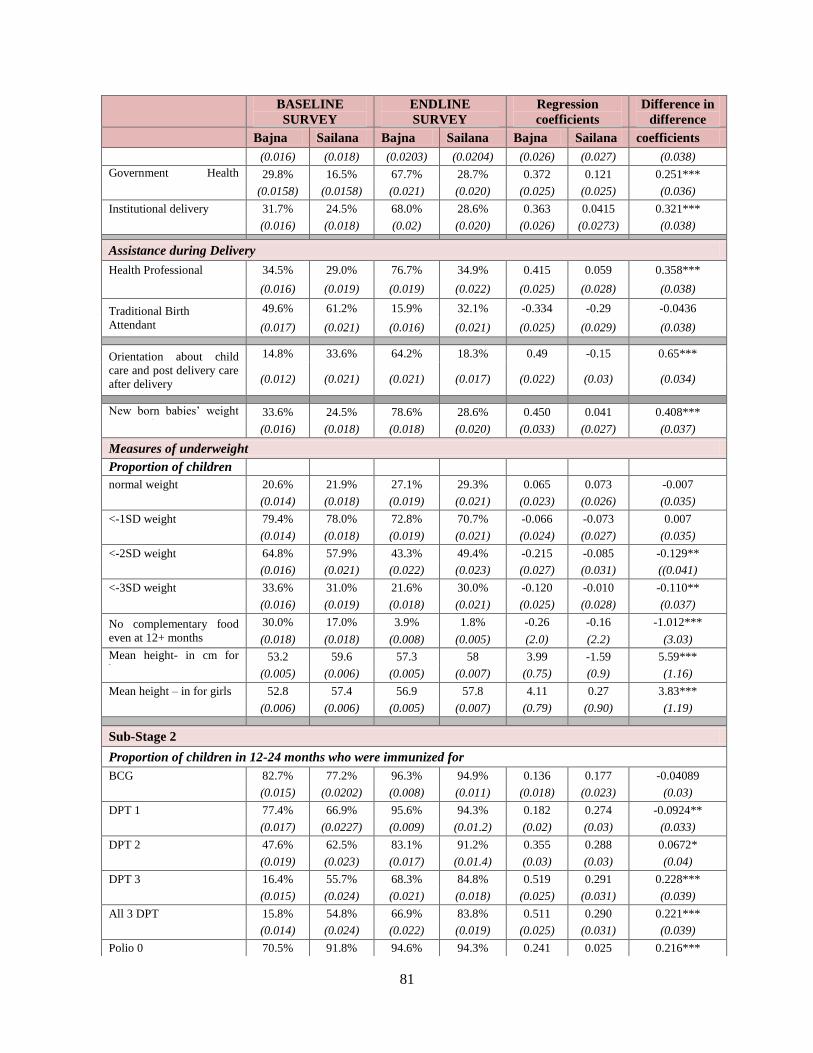
81
BASELINE
SURVEY
ENDLINE
SURVEY
Regression
coefficients
Difference in
difference
Bajna Sailana Bajna Sailana Bajna Sailana coefficients
(0.016) (0.018) (0.0203) (0.0204) (0.026) (0.027) (0.038)
Government Health
Facility 29.8% 16.5% 67.7% 28.7% 0.372 0.121 0.251***
(0.0158) (0.0158) (0.021) (0.020) (0.025) (0.025) (0.036)
Institutional delivery 31.7% 24.5% 68.0% 28.6% 0.363 0.0415 0.321***
(0.016) (0.018) (0.02) (0.020) (0.026) (0.0273) (0.038)
Assistance during Delivery
Health Professional 34.5% 29.0% 76.7% 34.9% 0.415 0.059 0.358***
(0.016) (0.019) (0.019) (0.022) (0.025) (0.028) (0.038)
Traditional Birth
Attendant
49.6% 61.2% 15.9% 32.1% -0.334 -0.29 -0.0436
(0.017) (0.021) (0.016) (0.021) (0.025) (0.029) (0.038)
Orientation about child
care and post delivery care
after delivery
14.8% 33.6% 64.2% 18.3% 0.49 -0.15 0.65***
(0.012) (0.021) (0.021) (0.017) (0.022) (0.03) (0.034)
New born babies’ weight
measured 33.6% 24.5% 78.6% 28.6% 0.450 0.041 0.408***
(0.016) (0.018) (0.018) (0.020) (0.033) (0.027) (0.037)
Measures of underweight
Proportion of children
with :
normal weight 20.6% 21.9% 27.1% 29.3% 0.065 0.073 -0.007
(0.014) (0.018) (0.019) (0.021) (0.023) (0.026) (0.035)
<-1SD weight 79.4% 78.0% 72.8% 70.7% -0.066 -0.073 0.007
(0.014) (0.018) (0.019) (0.021) (0.024) (0.027) (0.035)
<-2SD weight 64.8% 57.9% 43.3% 49.4% -0.215 -0.085 -0.129**
(0.016) (0.021) (0.022) (0.023) (0.027) (0.031) ((0.041)
<-3SD weight 33.6% 31.0% 21.6% 30.0% -0.120 -0.010 -0.110**
(0.016) (0.019) (0.018) (0.021) (0.025) (0.028) (0.037)
No complementary food
even at 12+ months
30.0% 17.0% 3.9% 1.8% -0.26 -0.16 -1.012***
(0.018) (0.018) (0.008) (0.005) (2.0) (2.2) (3.03)
Mean height- in cm for
boys 53.2 59.6 57.3 58 3.99 -1.59 5.59***
(0.005) (0.006) (0.005) (0.007) (0.75) (0.9) (1.16)
Mean height – in for girls 52.8 57.4 56.9 57.8 4.11 0.27 3.83***
(0.006) (0.006) (0.005) (0.007) (0.79) (0.90) (1.19)
Sub-Stage 2
Proportion of children in 12-24 months who were immunized for
BCG 82.7% 77.2% 96.3% 94.9% 0.136 0.177 -0.04089
(0.015) (0.0202) (0.008) (0.011) (0.018) (0.023) (0.03)
DPT 1 77.4% 66.9% 95.6% 94.3% 0.182 0.274 -0.0924**
(0.017) (0.0227) (0.009) (0.01.2) (0.02) (0.03) (0.033)
DPT 2 47.6% 62.5% 83.1% 91.2% 0.355 0.288 0.0672*
(0.019) (0.023) (0.017) (0.01.4) (0.03) (0.03) (0.04)
DPT 3 16.4% 55.7% 68.3% 84.8% 0.519 0.291 0.228***
(0.015) (0.024) (0.021) (0.018) (0.025) (0.031) (0.039)
All 3 DPT 15.8% 54.8% 66.9% 83.8% 0.511 0.290 0.221***
(0.014) (0.024) (0.022) (0.019) (0.025) (0.031) (0.039)
Polio 0 70.5% 91.8% 94.6% 94.3% 0.241 0.025 0.216***

82
BASELINE
SURVEY
ENDLINE
SURVEY
Regression
coefficients
Difference in
difference
Bajna Sailana Bajna Sailana Bajna Sailana coefficients
(0.018) (0.0132) (0.0103) (0.012) (0.022) (0.018) (0.031)
Polio 1 89.3% 94.6% 91.9% 94.3% 0.026 -0.003 0.029
(0.012) (0.011) (0.012) (0.012) (0.018) (0.016) (0.025)
Polio 2 65.9% 92.8% 81.7% 90.9% 0.157 -0.018 0.175***
(0.019) (0.013) (0.018) (0.015) (0.026) (0.019) (0.035)
Polio 3 20.2% 87.9% 69.8% 81.9% 0.496 -0.059 0.555***
(0.016) (0.0158) (0.021) (0.0195) (0.026) (0.025) (0.037)
ALL 3 POLIO 19.4% 87.9% 68.3% 81.2% 0.489 -0.067 0.556***
(0.0157) (0.0158) (0.0213) (0.02) (0.026) (0.025) (0.037)
Measles 26.3% 8.2% 72.1% 70.9% 0.457 0.627 -0.169***
(0.018) (0.013) (0.020) (0.023) (0.027) (0.026) (0.038)
Hepatitis B 2.4% 0.5% 28.3% 36.6% 0.260 0.361 -0.101**
(0.006) (0.003) (0.021) (0.024) (0.019) (0.024) (0.03)
Full imm. Excl measles 9.9% 53.4% 65.2% 79.4% 0.553 0.260 0.292***
(0.011) (0.024) (0.022) (0.021) (0.023) (0.032) (0.039)
Full Immunization 5.2% 6.5% 56.9% 66.8% 0.517 0.602 -0.086**
(0.008) (0.012) (0.023) (0.024) (0.022) (0.026) (0.034)
Measures of weight for
age
Weight <-2SD 85.65% 78.32% 82.08% 67.01% -0.036 -0.113 0.077*
(0.014) (0.02) (0.02) (0.023) (0.022) (0.031) (0.037)
Mean height – in cm for
boys 68.2cm 72.1cm 70.33cm 70.4cm 2.13 -1.69 3.82***
(0.43) (0.4) (0.45) (0.98) (0.63) (0.96) (1.11)
Mean height – in cm for
girls 66.5cm 70.4cm 68.8cm 70.4cm 2.28 0.32 1.97
(0.46) (0.4) (0.46) (1.01) (0.66) (1.1) (1.21)
Monitoring of child
growth
Regular measure of height
& weight
41.96% 56.64% 65.21% 73.45% 0.232 0.17 0.064
(0.02) (0.023) (0.021) (0.022) (0.029) (0.033) (0.044)
Regular growth
monitoring
37.54% 53.85% 52.29% 69.07% 0.147 0.152 -0.004
(0.019) (0.024) (0.023) (0.024) (0.029) (0.033) (0.045)
Sub-Stage 3
Weight for Age: 2+ to 5years
Weight for age <-2SD 82.71% 79.64% 81.18% 75.4% 0.064 -0.042 -0.042***
(0.109) (0.11) (0.10) (0.012) (0.015) (0.016) (0.016)
Growth monitoring: 2+ 5
Measure height and weight 45.68% 61.29% 84.04% 85.57% 0.384 0.243 0.141***
(0.012) (0.0132) (0.009) (0.009) (0.016) (0.016) (0.023)
AWC growth monitoring 48.79% 58.85% 71.47% 73.73% 0.227 0.149 0.078***
(0.0126) (0.013) (0.012) (0.012) (0.017) (0.018) (0.025)
Vitamin A Supplement 42.57% 43.82% 82.61% 76.46% 0.400 0.326 0.074***
(0.012) (0.0135) (0.009) (0.012) (0.016) (0.018) (0.024)
IFA supplement 44.35% 43.3% 71.2% 48.67% 0.269 0.054 0.215***
(0.013) (0.013) (0.011) (0.014) (0.017) (0.02) (0.026)
Attending AWC 48.34% 41.7% 90.35% 83.45% 0.42 0.418 0.002
(0.013) (0.013) (0.007) (0.010) (0.015) (0.017) (0.022)
Mean days children
attending AWC
3.39 2.15 4.74 4.2 1.35 2.05 -0.69***
(0.067) (0.073) (0.047) (0.01) (0.083) (0.09) (0.126)

83
BASELINE
SURVEY
ENDLINE
SURVEY
Regression
coefficients
Difference in
difference
Bajna Sailana Bajna Sailana Bajna Sailana coefficients
School Readiness
Child confident to tell his /
her name
96.39% 95.99% 99.85% 97.52% 0.035 0.015 0.019*
(0.006) (0.006) (0.002) (0.005) (0.007) (0.009) (0.011)
Child confident to tell his/
her parents name
77.27% 87.26% 98.78% 93.68% 0.215 0.064 0.151***
(0.014) (0.011) (0.004) (0.009) (0.017) (0.014) (0.022)
Mean score
Sentence comprehension 58.62% 67.47% 82.32% 79.55% 0.236 0.121 0.116***
(0.011) (0.011) (0.012) (0.011) (0.016) (0.016) (0.023)
Visual perception 44.41% 51.39% 75.91% 69.27% 0.315 0.178 0.136***
(0.0102) (0.012) (0.013) (0.013) (0.016) (0.017) (0.024)
Visual discrimination 36.07% 49.90% 79.88% 65.92% 0.438 0.16 0.278***
(0.014) ((0.014) (0.013) (0.013) (0.02) (0.19) (0.028)
Number concepts 58.45% 78.31% 62.50% 64.81% 0.041 -0.135 0.176***
(0.013) (0.01) (0.013) (0.011) (0.02) (0.015) (0.024)
Space Concepts 67.13% 79.60% 84.53% 82.22% 0.174 0.026 0.148***
(0.01) (0.099) (0.010) (0.011) (0.015) (0.015) (0.021)
Concept of "more"/ "less" 51.28% 62.64% 67.99% 67.66% 0.167 0.050 0.117***
(0.013) (0.0128) (0.013) (0.012) (0.018) (0.017) (0.026)
Concept of "near"/ "far" 30.65% 59.82% 52.59% 55.39% 0.219 -0.044 0.264***
(0.014) (0.014) (0.0114) (0.014) (0.019) (0.02) (0.027)
Concept of "thick"/"thin" 57.52% 76.36% 77.82% 84.14% 0.203 0.077 0.125***
(0.013) (0.011) (0.012) (0.010) (0.019) (0.015) (0.024)
Concept of Classification
1 78.98% 80.64% 94.05% 83.44% 0.151 0.027 0.123***
(0.008) (0.009) (0.006) (0.009) (0.011) (0.012) (0.017)
Concept of Classification
2 83.02% 84.69% 91.51% 86.25% 0.085 0.015 0.069***
(0.009) (0.008) (0.009) (0.009) (0.013) (0.012) (0.017)
Give words for letters 7.75% 11.15% 12.80% 17.60% 0.051 0.064 -0.014
(0.012) (0.01) (0.013) (0.012) (0.015) (0.015) (0.022)
Reading readiness 55.7% 61.29% 75.61% 69.5% 0.199 0.084 0.115***
(0.006) (0.006) (0.006) (0.006) (0.008) (0.008) (0.011)
Number readiness 63.5% 75.6% 78.0% 76.0% 0.145 0.005 0.14***
(0.006) (0.006) (0.005) (0.005) (0.008) (0.008) (0.012)
Total Score 50.4% 60.4% 67.3% 64.7% 0.169 0.043 0.126***
(0.005) (0.005) (0.005) (0.005) (0.007) (0.007) (0.009)
PERCENTAGE OF CHILDREN WHO HAVE MASTERED THE CONCEPT
Sentence comprehension 30.19% 48.51% 70.58% 65.8% 0.404 0.173 0.231***
(0.016) (0.016) (0.018) (0.017) (0.024) (0.023) (0.033)
visual perception 12.94% 28.16% 61.74% 53.04% 0.49 0.25 0.239***
(0.011) (0.0144) (0.019) (0.018) (0.021) (0.022) (0.031)
Visual discrimination 23.78% 36.49% 71.04% 49.81% 0.473 0.133 0.339***
(0.015) (0.0154) (0.018) (0.0176) (0.023) (0.023) (0.033)
Number concepts 40.56% 63.51% 39.48% 37.05% -0.010 -0.26 0.254***
(0.017) (0.015) (0.019) (0.017) (0.025) (0.023) (0.034)

84
BASELINE
SURVEY
ENDLINE
SURVEY
Regression
coefficients
Difference in
difference
Bajna Sailana Bajna Sailana Bajna Sailana coefficients
Space Concepts 40.79% 65.67% 72.41% 72.61% 0.316 0.069 0.247***
(0.017) (0.015) (0.017) (0.016) (0.025) (0.022) (0.033)
Concept of "more"/"less" 28.9% 48% 46.95% 45.6% 0.18 -0.024 0.204***
(0.015) (0.016) (0.02) (0.18) (0.025) (0.024) (0.034)
Concept of "near"/ "far" 20.4% 47.58% 19.97% 37.79% -0.004 -0.097 0.094**
(0.014) (0.016) (0.016) (0.017) (0.021) (0.023) (0.032)
Concept of "thick"/"thin" 39.74% 62.08% 61.59% 74.6% 0.218 0.125 0.093**
(0.017) (0.016) (0.019) (0.015) (0.025) (0.022) (0.033)
Child looks neat and clean
55.83% 52.11% 96.65% 68.03% 0.408 0.159 0.249***
(0.017) (0.016) (0.007) (0.016) (0.023) (0.023) (0.0313)
Children washing hands
before eating food
15.38% 67.01% 99.39% 80.67% 0.840 0.137 0.703***
(0.012) (0.015) (0.003) (0.014) (0.014) (0.021) (0.026)
Sub-Stage 4
Out of School Children
(OOSC) among 6-10 years
old
10.4% 9.01% 1.14% 13.55% -0.09 0.045 -0.13***
(0.007) (0.007) (0.002) (0.007) (0.006) (0.01) (0.011)
Child attended AWC
before joining primary
55.5% 62.99% 95.1% 55.3% 0.396 -0.076 0.472***
(0.017) (0.016) (0.007) (0.017) (0.018) (0.023) (0.029)
Attending school regularly 84.5% 71.6% 94.14% 85.8% 0.096 0.141 -0.046
(0.012) (0.015) (0.007) (0.011) (0.014) (0.019) (0.024)
Enrolment in age
appropriate grades 65.86% 68.95% 74.19% 72.55%
% of 10-11 years already
completed primary 43.35% 31.53%
Learning achievement of Grade 2 students: Overall for Math and Language
Total Score: more
than/equal to 50%
56.55% 75.03% 91.27% 90.73% 0.347 0.157 0.190***
(0.017) (0.015) (0.010) (0.010) (0.019) (0.018) (0.026)
Total Score: more
than/equal to 60%
43.34% 61.75% 83.35% 84.10% 0.40 0.223 0.176***
(0.017) (0.016) (0.013) (0.012) (0.021) (0.021) (0.029)
Total Score: more
than/equal to 70%
32.56% 47.90% 71.87% 69.11% 0.393 0.212 0.181***
(0.016) (0.017) (0.015) (0.016) (0.022) (0.023) (0.032)
Total Score: more
than/equal to 80%
24.10% 32.01% 50.06% 47.48% 0.259 0.154 0.105***
(0.015) (0.016) (0.017) (0.017) (0.022) (0.022) (0.032)
Total Score: more
than/equal to 90%
11.70% 17.25% 21.28% 9.61% 0.115 0.040 0.075***
(0.011) (0.013) (0.014) (0.014) (0.018) (0.019) (0.026)
Total Score: 100% 2.00% 3.9% 3.2% 2.7% 0.011 -0.012 0.235*
(0.005) (0.007) (0.006) (0.006) (0.007) (0.009) (0.114)
Mean score 54.56% 65.1% 74.6% 72.96% 0.200 0.0785 0.121***
(0.008) (0.007) (0.006) (0.007) (0.011) (0.0102) (0.015)
Learning achievement of Grade 2 students: Overall for Math
Math Score: more
than/equal to 50%
51.22% 69.81% 91.16% 75.51% 0.399 0.057 0.342***
(0.017) (0.015) (0.009) (0.015) (0.019) (0.021) (0.029)
Math Score: more
than/equal to 60%
44.15% 60.95% 83.81% 63.62% 0.396 0.026 0.37**
(0.017) (0.016) (0.012) (0.016) (0.021) (0.023) (0.031)
Math Score: more
than/equal to 70%
38.47% 51.87% 74.86% 46.57% 0.363 -0.053 0.416***
(0.017) (0.017) (0.015) (0.017) (0.022) (0.024) (0.033)
Math Score: more 30.01% 41.43% 54.08% 26.77% 0.240 -0.146 0.387***

85
than/equal to 80% (0.016) (0.017) (0.017) (0.015) (0.023) (0.022) (0.032)
Math Score: more
than/equal to 90%
19.81% 28.38% 28.93% 9.61% 0.091 -0.187 0.278***
(0.014) (0.015) (0.015) (0.01) (0.021) (0.018) (0.027)
Math Score: 100% 6.26% 13.62% 13.2% 3.32% 0.069 -0.103 0.172***
(0.008) (0.012) (0.011) (0.006) (0.014) (0.013) (0.192)
Mean Math score 51.12% 64.4% 75.44% 61.359% 0.243 -0.031 0.274***
(0.011) (0.010) (0.007) (0.008) (0.013) (0.012) (0.0178)
Learning achievement of Grade 2 students: Overall for Hindi
Hindi Score: more
than/equal to 50%
62.11% 73.78% 88.86% 91.53% 0.267 0.177 0.090***
(0.017) (0.015) (0.011) (0.009) (0.019) (0.018) (0.026)
Hindi Score: more
than/equal to 60%
49.83% 62.43% 79.68% 89.47% 0.298 0.270 0.028
(0.017) (0.016) (0.014) (0.010) (0.022) (0.019) (0.029)
Hindi Score: more
than/equal to 70%
40.32% 50.06% 69.23% 85.01% 0.289 0.349 -0.060*
(0.017) (0.017) (0.016) (0.012) (0.022) (0.021) (0.03)
Hindi Score: more
than/equal to 80%
31.87% 38.14% 52.35% 75.86% 0.204 0.377 -0.172***
(0.016) (0.016) (0.017) (0.014) (0.023) (0.022) (0.032)
Mean Hindi score 58.0% 65.8% 73.764% 84.58% 0.158 0.188 -0.030***
(0.009) (0.008) (0.008) (0.008) (0.012) (0.012) (0.017)
*indicates significance at 0.01 confidence level(statistically significant at least at 90% level) ; ** indicates
significance at 0.05 level (statistically significant at least at 95% level); *** indicates significance at 0.001 level
(statistically significant at 99% level)
Figures in parenthesis are standard errors.

86
Annex 4: International / National Evidences:
While there have been several attempts before to implement programs targeted at same beneficiaries in a
much more coordinated way, very few evidences are available that describe the impact of such efforts,
and much less on early child development. One study that evaluated an integrated approach to ECD on
child related outcomes is from Philippines, which is briefly described below.
a. Early Childhood Development through Integrated Programs: Evidence from the
Philippines (Graeme Armecin, Jere R Behrman, Paulita Duazo, Sharon Ghuman, Socorro
Gultiano, Elizabeth M. King and Nanette Lee, April 2006)
In 1999, the Philippine Government launched a five year ECD Project in thirteen provinces covering 2.2.
million households, which in 2002 became part of a broader governmental program that was formally
adopted through the ECCD Act. The program’s overarching goal was to get better the survival and
developmental potential of children, particularly those who are most vulnerable and disadvantaged by (a)
minimizing the health risks to very young children; (b) contributing to the knowledge of parents and
community about child development and encouraging their active involvement; (c) advocating for child
friendly policy and legislation; (d) improving the ability and attitude of child related service providers;
and (e) mobilizing resources and establishing viable financing mechanisms for ECD projects. The
program spans a wide range of health, nutrition, early education and social service programs.
In contrast to some other ECD programs, the Philippine project did not introduce new services; rather, its
innovation was to adopt an integrated, multi-sectoral approach to delivering a combination of services
that included center-based and home-based interventions. To link the center-based and home-based
services, a new service provider, the Child Development Worker (CDW), was placed in all program
areas. The CDWs have the task of complementing the roles of midwives and health workers in providing
food and nutritional supplements and monitoring children’s health status, and were responsible for
community based parent education about ECD.
The impact evaluation (using difference in difference propensity score matching “intent-to-treat” program
impact estimates) shows that there were nine indicators which showed predominantly positive program
impacts (such as cognitive skills, expressive language skills, gross motor skills, self help skills, fine motor
skills, weight for height z score, receptive language, and proportion wasted), four indicators with mixed
or virtually no program impacts (proportion of children with diarrhea, proportion of children with worms,
proportion of children stunted, and proportion of height for age z score) and two indicators with
predominantly negative program impacts (proportion of children who are anemic and hemoglobin count).
Practicing Participation in UNICEF Programming: Bridging the Gap between Rhetoric and Reality”
(2000) (ERU, Assessment Study of Community participation in Selected UNICEF Supported Education
Programs, 2003.
The UNICEF Project in Maharashtra was an early attempt to empower local communities to address and
resolve local problems, especially schooling. The intervention focused on improving the quality of
education through enhancing school-community partnerships. The effort was to link parents, community
members and educators around the goal of full, equal and meaningful participation by all children in good
learning experiences. However, the evaluation of the program was more in terms of a descriptive report
than a rigorous one where the net effects were captured visa-vis a counterfactual.
b. Building Multi-Sectoral Partnerships To Address Complex Problems: Lessons from the
Partnership for Child Nutrition and the Bhavishya Alliance, India; Surita Sandosham and
David Winder, November 2008 .

87
Global Partnership for Child Nutrition (PCN) by Uniliver and the Indian partnership Bhavishya Alliance
(BA) have taken a multi-sectoral approach to fostering innovation in addressing child malnutrition in
India. The lessons from their experiences are listed below:
(a) The process of forming multi-sector partnerships is complex and often requires more time than
expected;
(b) Local ownership and a credible and neutral host organization are critical to partnership success;
(c) It is important early in the partnership to have thorough knowledge of the underlying causes of the
problem to be addressed and solutions already tried;
(d) It is important to identify and nurture leaders who can act both as change agents and bridge builders;
(e) Key players in the partnership should possess a range of other skills needed to create strong
management and governance systems;
(f) New interventions should be tested before scaling up;
(g) Opportunities for reflection should be constantly provided during the Partnership Lifecycle;
(h) To ensure sustainability resources should be diversified;
(i) An appropriate mix of qualitative and quantitative instruments needs to be designed to evaluate the
impact of the partnership; and
(j) Communication and documentation policies need to be developed for each phase of the partnership.

88
Annex 5: Consolidated Resource Mapping Data for Thikariya Gram
Panchayat, Bajna, MP (A Sample)
Thikariya Bazana Block - Ratlam, MP
Panchayat Resource mapping - Jan 06
Population
Age group Male Female
0-3 year old 98 86
3-5 year old 63 58
5-11 year old 135 126
Households: 340 Caste:
Population: 1830 Male Literates: 128
Population/Household: 5.4 Female literates: 84
Male: Female ratio 1000:966 Male: Female 0-5 year age group 1000:894
Panchayat/
village level Panchayat Thikariya Khora Bhandariya Kotharia
Hlakara
Khurd
House holds 340 150 85 51 30 24
Population 1830 327 408 450 290 355
Panchayat
level
Male
^
Female
^ Graduate 3 1
10+2 pass 4 4
10 pass 4 2
8th pass 13 11
Traditional
(Jari Buti) 13 0
Allopathic 0 0
Daai (trained) 0 5
Pharmacist 1 0
Health services and Accessibility
Panchayat and village
level Panchayat Thikariya Khora Bhandariya Kotharia
Hlakara
Khurd
Medicine shop
(Pharmacist) 1 0 1 0 0 0
No. of Trained Daai 5 1 1 1 1 1
Basic Facility available Up Kendra Up Kendra Up Kendra ANM Up Kendra
Emergency service
distance+ 8 7 10
ANM visits in a month 1 1 1 1
Child Birth & Health
(Panchayat & village
level)
Panchayat Thikariya Khora Bhandariya Kotharia Hlakara
Khurd Child birth at center 5 0 0 2 2 1
Child birth (dai
observation) 5 0 2 1 1 1
Child birth conventionally 0 0 0 0 0 0
Malnutrition 12 2 2 5 1 2
Secondary + graduates

89
Child death 1 0 1 0 0 0
During pregnancy, child
deaths 0 0 0 0 0 0
Aanganwadi/ICDS/IEC Panchayat Thikariya Khora Bhandariya Kotharia Hlakara
Khurd
0-5 year old children enrolled 307 60 68 43 86 50
Pregnant women enrolled 33 5 5 10 9 4
Education level of karyakarta std. 6 std. 5 std. 5 std. 2 std. 2
Space available at center 20 30 20 40 0
Center open daily? Daily Daily Daily Daily Not daily
Nutrition food to child Yes 80 Gram 80 Gram Yes Yes
Care to Pregnant woman attended attended attended attended attended
Govt. Primary(std.I-V) /mid.
Schools(std I-VIII) Panchayat Thikariya Khora Bhandariya Kotharia
Hlakara
Khurd
School Mid. Sch. Pri. Sch. Pri. Sch.
Attendance/Enrollment 248/341 124/176 37/46 33/41 13/40 41/38
Child-teacher ratio(On Enrollment) 56.8 88 46 41 40 38
No. of teachers available 6 2 1 1 1 1
No. of rooms 10 3 2 2 2 1
School timing followed yes yes yes yes yes
Text book to children Yes Yes Yes Yes Yes
Learning tools in schools - in use ^^ 4/4 1/1 2/2 2/2 2/1
School building * 6 6 5 6 4
Drinking water in use in use unavailable available unavailable in use
Toilet facility for girls in use not in use not in use not in use unavailable In use
Mid day meal given 00-Jan yes yes yes yes
School management committee
training
given
training
given
training
given
training
given
training
given
Enrollment
%
Attendance
ICDS/age 3-
5.
Girls 65
Boys 58
std. 1-2.
Girls 79 75.9
Boys 75 77.3
std. 3-5
Girls 60 66.7
Boys 62 69.4
std. 6-8
Girls 24 75.0
Boys 41 70.7
Out of school/Irregular children (number)
Panchayat
total Girls Boys
3-5 year 0 0
6-11 year 1 3
11-14 year old 5 5
TOTAL 6 8
6-14 years old out of school

90
Attendance in test & pass children - No. of children (panchayat
total)
ICDS
children
graduated
Std 1-II Std III-V Std VI -VIII
Out of school
children
Girls Boys Girls Girls Boys Boys Girls
Attendance
73 89 47 71 38 37 6 8
Pass 20 55 62 41 43 16 27

91
Annex 6 Village Micro Plan structure
FORMAT FOR THE MICRO-LEVEL VILLAGE PLANNING, BAJNA
SL
NO
.
SE
CT
OR
SUCCESS INDICATOR
PRESENT
STATUS
(Mention
both
quantitativ
e and
qualitative
form)
ACTION PLAN FOR NEXT SIX
MONTHS ROLE
OF
EKTA
SAMU
HA
ROLE OF
NAANDI
ROLE OF
GOVT
LINE
DEPT. Activiti
es 1 2 3 4 5 6
1
HE
AL
TH
Percentage of Pregnant Women go
for Regular ANC .
Percentage of Pregnant Regular
consumption of IFA tablets
Immunization of pregnant women
on time.
Registration of pregnant women in AWW
Institutional Delivery
Percentage of Practice of breast
feeding
Infant mortality rate (%)
Maternal mortality rate (%)
Monthly measurement of height
and weight pregnant women and Children.
Availability of Fixed Day Service
Regular Mangal Divas
Percentage of Children completes full Immunization Dozes.
2
ICD
S
Regular running of AWC (mention
no of days in a month)
Availability of Supplementary Nutrition to children. (mention no
of days in a month)
Percentage of Malnourished
children
Attendance of children in AWC
Percentage of Children availing Pre
School Education
3
ED
UC
AT
ION
Percentage Children enrolled in school(Class1-5)
Percentage of Children out of
school(Class 1-5)
Attendance of children in school
(Class 1-5)
No. of teachers present in school.
Attendance of teachers in school.
Regular meeting of PTA .
Initiative of PTA to improve
Education standard..
Functional Bal Panchayat

92
Increase in learning level of
Academically Poor Children in
MKK.
4
ST
RE
NG
TH
EN
IN
G O
F
EK
TA
SA
MU
HA
Regular Meeting of EKTA SAMUHA.
Major decisions taken to access facilities for well being of women
and children
5
AN
Y
OT
HE
R
S
Percentage of families Migrate.
Percentage of Families getting
benefits under Rojgar Guarantee
program.
Annex 7: Monitoring and Evaluation Plan of Bachpan Plans: Naandi
Foundation
SNO. 1 2 3 4
OBJECTIVE
To develop integrated
village level action
plans around the needs
of the child.
To create awareness on
child development
amongst community and
service providers
To strengthen linkages
between the different
service providers
To build capacity and
strengthen the Ekta
Samooh
OUTCOME
Completion village level
plan in 221 villages,
integration of village
level plan with the
Panchayat Plan
Increased awareness
among the community
members and service
providers towards
integrated child
development
Improved service
delivery and
government
infrastructure through
convergence of
community with service
providers in the project
area
Ekta Samooh started
monitor effective
implementation of the
schemes related to
integrated child
development. Integration
of the village level
integrated child
development plan with the
Panchayat Plan.
INDICATOR
S No. of village plans
developed
Community
participation in ES
meeting, change brought
about in the quantitative
data collected from the
villages, reaching the
target as set by the
previous half yearly
village level micro plan
No of FDS started with
the active participation
of ES and the service
providers. No of PTA
collaborating working in
improving enrolment,
regularise the children.
No of ES started regular
monitoring of the
implementation of the
child development
schemes. No of villages
achieved target set in the
village level integrated
child development plan.
No of village level
integrated child
development plan
incorporated in the
Panchayat level plan.
TARGET 221 villages
80% community
participation
improvement in
quantitative data in all 3
sectors by 20%
80% villages 80% in 60% villages

93
INFORMATI
ON SOURCE Ekta Samooh
Ekta Samooh village
registers, statistical
record, Jan Mitra report,
Observation report,
visitor's feedback, ERU
report
Ekta Samooh village
registers, statistical
record, Jan Mitra report,
Observation report,
visitor's feedback, ERU
report, feed back from
the block and district
administrations.
Ekta Samooh village
registers, statistical record,
Jan Mitra report,
Observation report,
visitor's feedback, ERU
report, feed back from the
block and district
administrations.
DISAGGRE
GATION
Set indicators in the area
of health, education and
ICDS
Attendance (men and
women), decisions
made, follow up,
contribution in
implementation
Dept wise data,
achievements in the set
indicators of the project
Set indicators in the area
of health, education and
ICDS
FREQUENC
Y Half yearly Monthly Monthly, Quarterly Monthly
PERSON
RESPONSIB
LE
Members of the Ekta
Samooh and Jan Mitra Jan Mitra
Jan Mitra and Program
Associates. Jan Mitra
TEMPLATE
numerical (data
collection) and
descriptive (individual
interview, group
discussion and non
participant observation
numerical (data
collection) and
descriptive (individual
interview, group
discussion and non
participant observation
numerical (data
collection) and
descriptive (individual
interview, group
discussion and non
participant observation
numerical (data collection)
and descriptive (individual
interview, group
discussion and non
participant observation
STATISTIC
AL TOOLS
micro level planning
format, mean, mode,
percentage
statistical format,
progress report format,
concept building, mean,
percentage
statistical format,
progress report format,
concept building, mean,
percentage
statistical format, progress
report format, concept
building, mean, percentage
NATURE OF
ANALYSIS
Need assessment in
accordance to different
sectors
Nature of community
participation on the
basis of indicators,
improvement brought
about in the three
sectors of child
development in
coordination with the
community
Areas of decisions
taken, output, follow-up
and achievement
recorded in the area of
integrated child
development
Measurement of decisions
taken by the ES,
achievement against same,
coordination between the
ES and the different line
departments
PRESENTAT
ION MODE
pie chart, bar diagrams,
graphical
representations, tables
pie chart, bar diagrams,
graphical
representations, tables
pie chart, bar diagrams,
graphical
representations, tables
pie chart, bar diagrams,
graphical representations,
tables
USE OF
INFORMATI
ON
To utilize the document
for the development of
the action plan at the
village level. To analyse
the current status of the
ES, to monitor the
implementation process,
training of ES members
To bring about an
improvement in the
desired area, to develop
the action plan for the
ES and the Jan Mitra
To utilize the document
for developing child
development approach
and incorporate the
same in the Panchayat
level Plan. To make the
ES self-sustainable and
provide the necessary
training where ever
required.
To utilize the document
for developing child
development approach and
incorporate the same in the
Panchayat level Plan. To
take ahead the
coordination at the district
level to plan for further
expansion of the project.