Embed Size (px)
Citation preview
Final Draft Project Working Paper Bangladesh and the WTO Project
South Asian Free Trade Area An Analysis of the Policy Options for Bangladesh
By
M. Asaduazzaman
Nazneen Ahmed
Sharif M. Hossain
Subrata Sarker
July 2003
Bangladesh Institute of Development Studies (BIDS)
E-17, Agargaon, Sher-e-Bangla Nagar, Dhaka Bangladesh
2
South Asian Free Trade Area: An Analysis of the Policy Options for Bangladesh
By
M. Aasduzzaman1
Nazneen Ahmed
Sharif M. Hossain
Subrata Sarker
E-mail: [email protected]
Abstract
The creation of a South Asian Free Trade Area is a widely discussed policy issue in this
region. The lack of consensus among the nations in the region on the rules of such an
arrangement restrains its entry into force. In the mean time, India and Sri Lanka have
signed a bilateral free trade agreement, which may have negative impact on Bangladesh.
Against this backdrop, Bangladesh is considering a bilateral free trade agreement with
India. Another proposal is to have a free trade arrangement with Sri Lanka. The present
paper compares the outcomes of such policy options for Bangladesh. Simulation results
with the Global Trade Analysis Project (GTAP) model indicate that it may be harmful for
the economy to wait for a consensus on SAFTA rules because of the prevailing free trade
arrangements between India and Sri Lanka. Bangladesh may continue with SAFTA
negotiation and at the same time give more stress on building up strategies to gain from
multilateral arrangements. As a second best option, immediate initiatives to form
Bangladesh- India FTA may compensate for the welfare loss from existing India – Sri
Lanka FTA. However, if non-tariff barriers (NTBs) such as complex procedural matters
continue despite tariff withdrawal, the expected benefits are unlikely.
1 The Authors are respectively Research Director, Bangladesh Institute of Development Studies (BIDS); Research Fellow, BIDS; Research Officer, Bangladesh and the WTO Project, BIDS and Research Associate, BIDS.
3
1. Introduction
In recent years, one important policy concern regarding trade relations among South Asian
countries is whether the creation of South Asian Free Trade Area (SAFTA) would ensure
gains for its member countries or not. In December 1985, seven countries of South Asia
i.e. Bangladesh, Bhutan, India, Maldives, Nepal, Pakistan and Sri Lanka formed the South
Asian Association for Regional Cooperation (SAARC) to promote economic, social and
cultural cooperation. In 1993, the South Asian Preferential Trade Agreement (SAPTA)
was initiated by the SAARC to promote greater regional economic cooperation, which
came into effect from December 1995. Subsequently, the member countries of SAARC
planned to transform SAPTA into a South Asian Free Trade Area (SAFTA), which is
expected to be in place by ( in a complete form) 2008. The main motivation behind the
creation of SAFTA is to enhance intra-regional trade among SAARC members through
the removal of tariff and non-tariff barriers and thereby to enjoy the gains of regional
integration and at the same time to become more competitive in the global market.
Previous studies (Srinivasan: 1994, Samaratunga: 1999, Bandara and Yu: 2001 and some
others) have expressed divergent views about the possible impact of SAFTA on its
members. While some have expressed optimism about the impact, others are skeptical.
Recently there has been proposal, mainly from the business community, to initiate
bilateral free trade arrangements with India. Another proposal is to go for a bilateral free
trade arrangement with Sri Lanka. The question is whether such initiatives will benefit the
nation as a whole or only a few segments in the society. To reach a conclusion and to
suggest policy advice, a quantitative assessment is needed of the impacts of SAFTA and
other policy options on Bangladesh as well as on other SAARC countries. This paper aims
to fulfill that need by assessing the impacts of the South Asian Free Trade Area (SAFTA)
and other alternative policy options on the Bangladesh economy as well as on other
SAARC member countries. There is no study to compare the outcomes of SAFTA vis- a –
vis alternative bilateral free trade proposals. The Global Trade Analysis Project (GTAP)
model, – a global Applied General Equilibrium (AGE) model is used for the analysis.
This paper is organized as follows. Section 2 provides the intra-regional trade structure
within South Asia. Section 3 presents a brief review of some existing studies on SAFTA
4
as well as on regional integration. Section 4 points out some salient features of proposed
SAFTA agreements. These three sections provide the background against which the
results of later analysis have to be assessed and understood. An overview of the GTAP
model and data is provided in Section 5. Policy simulation scenarios are also presented in
this section. Simulation results are discussed in Section 6, while Section 7 provides a
discussions on the results and offers some concluding remarks.
2. Current Intra-South Asian Trade Structure
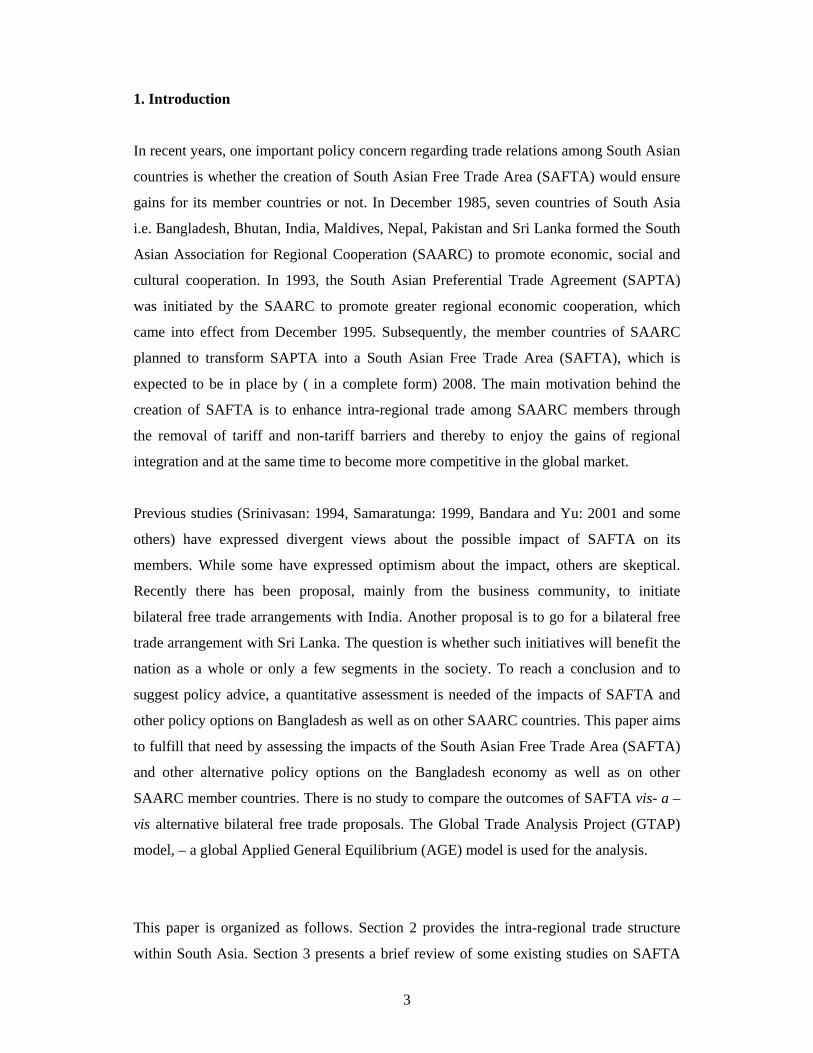
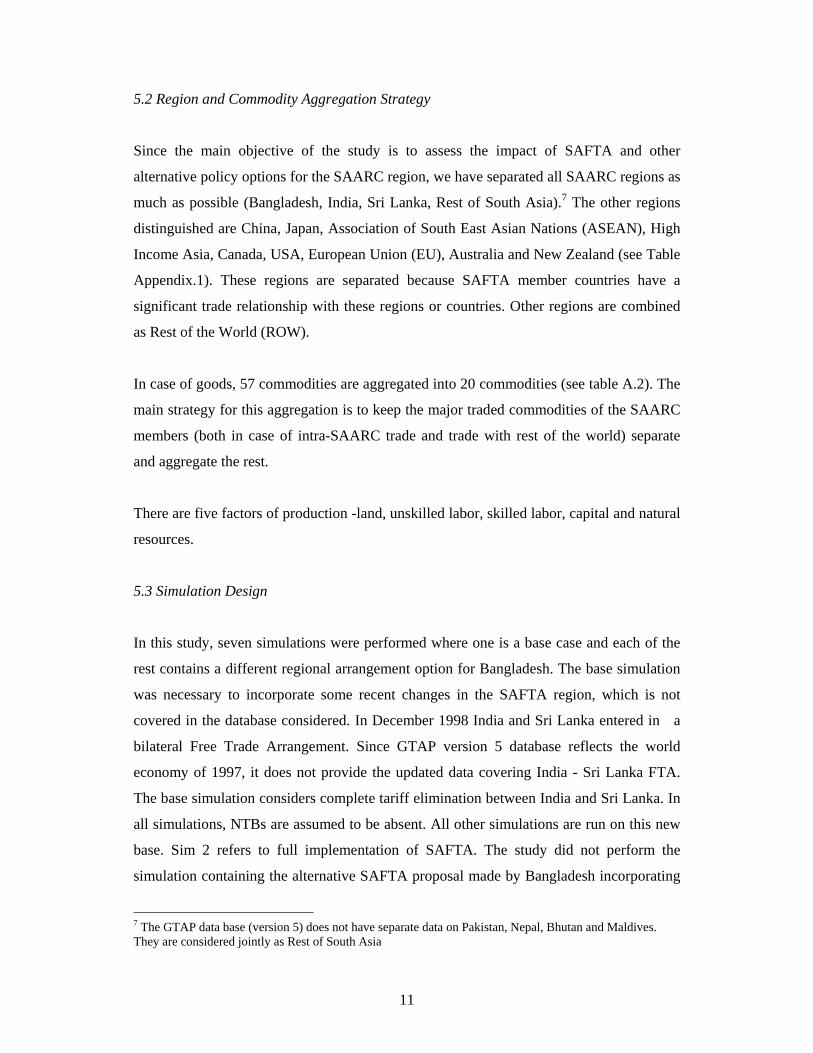
The level of intra-regional trade in South Asia is insignificant compared to such trade in
other parts of the world. Figure 1 provides the intra-regional import and export shares in
South Asia in the region’s total trade. It shows that the intra-regional import share is
slightly higher than the export share but both are rather low, about 8 and 4 percent of the
total values of import and export respectively. The trade structure has remained largely
unchanged overtime. Thus both for their import and export the South Asian countries
depend mainly on countries outside the region.
Figure 1: Share of Intra-Regional Trade in Total Trade of South Asia (Percentage)
0
2
4
6
8
10
12
1994 1995 1996 1997 1998 1999 2000
Export Share
Import Share
Source: Based on Direction of Trade Statistics, IMF, Different Issues
5
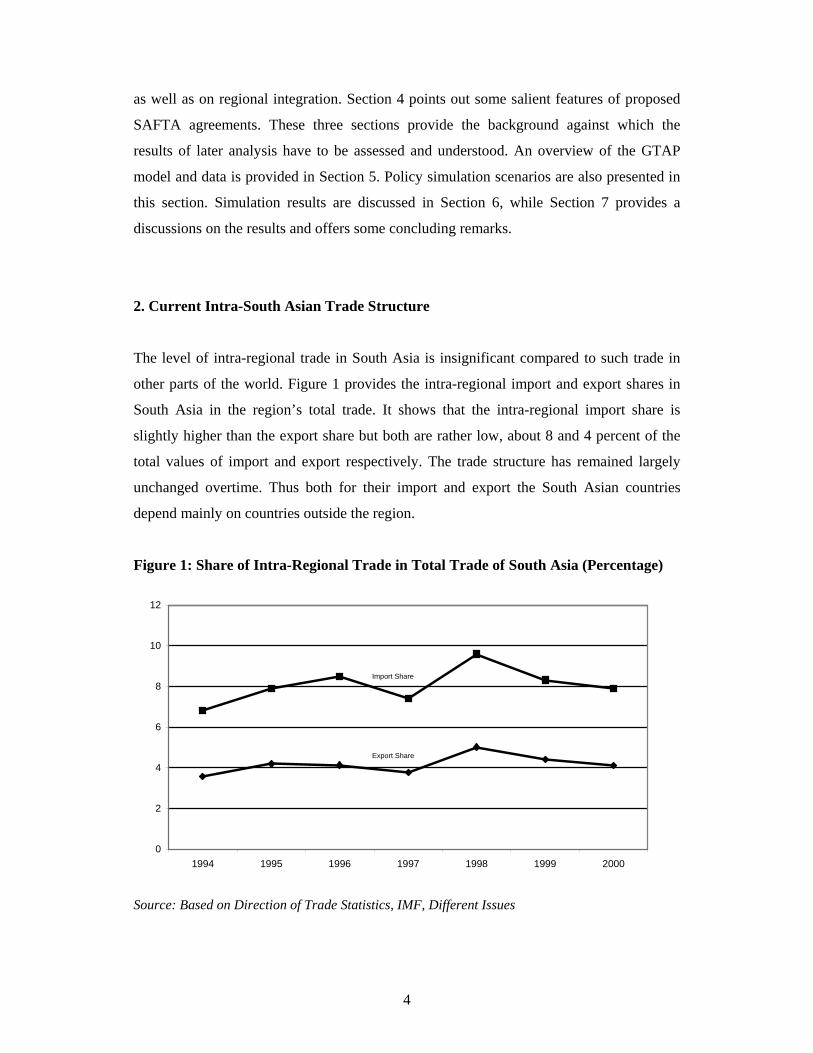
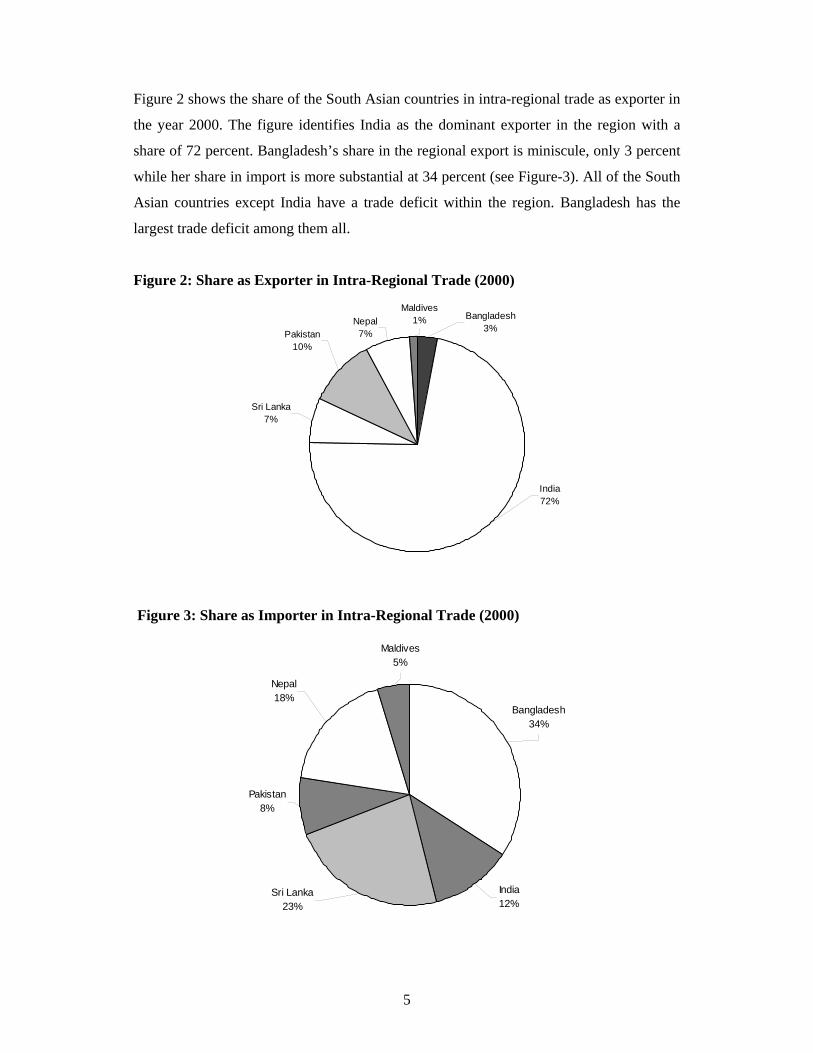
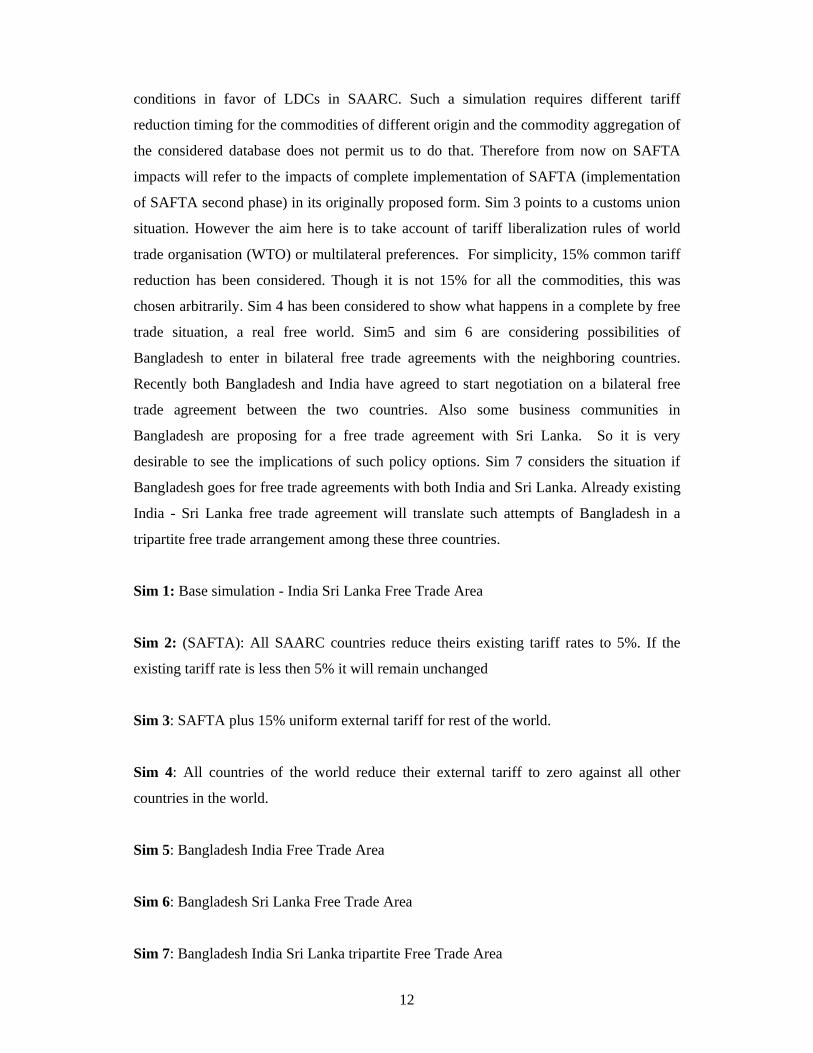
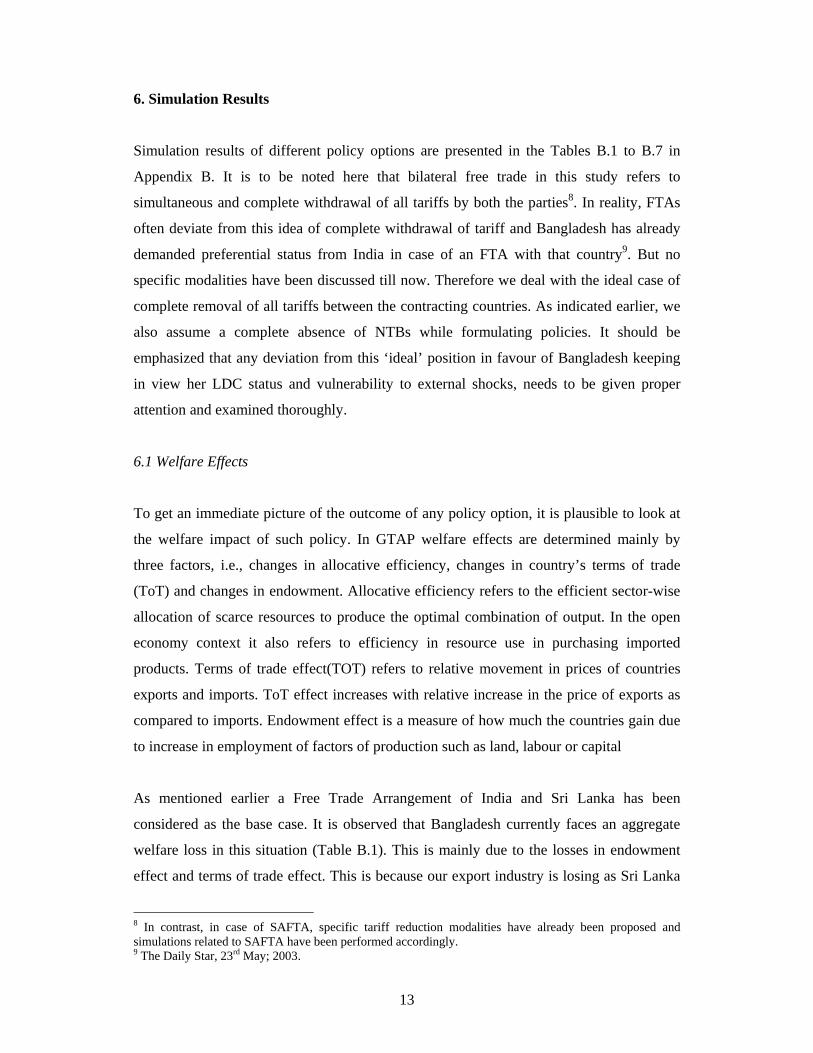
Figure 2 shows the share of the South Asian countries in intra-regional trade as exporter in
the year 2000. The figure identifies India as the dominant exporter in the region with a
share of 72 percent. Bangladesh’s share in the regional export is miniscule, only 3 percent
while her share in import is more substantial at 34 percent (see Figure-3). All of the South
Asian countries except India have a trade deficit within the region. Bangladesh has the
largest trade deficit among them all.
Figure 2: Share as Exporter in Intra-Regional Trade (2000)
Maldives1% Bangladesh
3%Nepal
7%
Sri Lanka7%
Pakistan10%
India72%
Figure 3: Share as Importer in Intra-Regional Trade (2000)
Bangladesh34%
Maldives5%
Nepal18%
Pakistan8%
India12%
Sri Lanka23%
6
For Bangladesh, import from India comprises a significant share of the country’s total
import. Bangladesh’s major imports from India are rice, grains, vegetable, fruit, nuts,
fibers, sugar, textile, chemical, rubber, plastic products and capital intensive
manufacturing. On the other hand Bangladesh’s major export to India is limited to fish,
textile, leather and capital intensive manufacturing. Bangladesh has probably a very large
unofficial trade with India. Informal import from India to Bangladesh constitutes more
than 100 percent of the formal import level between these two countries and in case of
export the corresponding figure is around 600%2. The main items Bangladesh informally
imports from India are primary products, which include livestock, fishery, pulses, spices,
rice etc. A significant part of Bangladesh's informal exports to India consist of items
imported from non-SAARC countries. These include synthetic fabrics, spices, VCPs/
VCRs, other electronic goods, ball bearings, metal scrap etc.
3. Some Existing Studies on South Asian Regional Trade
The impacts of both SAPTA and SAFTA have received attention in different studies. Only
a few studies, however, have attempted to quantify the possible economic impacts on the
member countries. Such impact assessment is necessary to decide upon an arrangement,
which at least, will not be harmful for any of the members. The existing studies reflect the
lack of consensus about the outcomes of preferential trade arrangements in the SAARC
region on its member countries. Studies by Srinivasan (1994) and Srinivasan and
Canonero (1995) have used the gravity model to estimate the impact of regional
integration in South Asia. They conclude that multilateral trade liberalization on a global
basis would yield higher return for the region compared to preferential trade arrangements
within the region. Their studies also suggest that small economies in the region would gain
much more from preferential trade liberalization than larger economies. Samaratunga
(1999) has also used the gravity model to explore the impacts of SAARC-Asia-Pacific
Economic Cooperation (APEC) trade relations. The study indicates that the prospect for
export expansion of SAARC region into APEC countries is narrow within the 1991-1995
policy framework. However the same method used by Rajapakse and Arunatilake (1997)
2 Bakht Z. and Sen B. (2002)
7
to study the implications of SAPTA for Sri Lanka depicts that Sri Lanka would gain from
SAPTA.
After the SAPTA turned to SAFTA, some studies looked at the potential impacts of the
latter. Pigato et. al. (1997) found SAFTA to be ‘highly desirable’ notifying that this would
result in significant welfare gains specially for small countries. However, Tennagoon
(2001) concludes that SAFTA would generate significant benefits for Sri Lanka and India,
while it would have adverse welfare effects for other SAARC members.
Bandara and Yu (2001) examined whether SAFTA is a desirable Preferential Trade
Arrangement (PTA) or not. They analyzed the necessary conditions for forming a PTA
and later used the GTAP model to quantify the effects of SAFTA compared to other policy
options. Their results suggest that, South Asian countries may gain much more from
multilateral trade liberalization than from the current SAPTA or the proposed SAFTA.
However their study did not consider what would happen if SAFTA incorporates
preferential treatments to the LDCs among its members.
Hossain and Duncan (1998) considered prospects for forming a Discriminatory Trading
Area (DTA) in South Asia from a political economy perspective. They argued that the
South Asian region would gain from such an initiative. They also pointed out that the
economic asymmetry prevailing in the region may be considered as a favorable rather than
unfavorable factor in the formation of DTA.
One may highlight one or two points from the above studies. First, even with a similar
model results may vary. Secondly, general equilibrium modeling is comparatively rare in
the regions. Third, multilateral trade may be more desirable than regional trading
arrangements. None of these studies focus on Bangladesh, nor do there explicitly treat
bilateral free trade as another policy option. The present paper tries to fill up with the gap
in a modest way.
8
4. Some Salient Features of SAFTA3
4.1 Proposals by Committee of experts on SAFTA
At the Male summit in 1997, the SAARC member countries agreed to establish a South
Asian Free Trade Area (SAFTA) by 2001. In accordance with the decision taken at the
Tenth Summit in Colombo in 1998, a Committee of Experts was set up to draft a
comprehensive treaty regime for creating a free trade area within the region. The
committee agreed upon a schedule of tariff reduction and other rules to be followed under
SAFTA.4 To enhance trade through the free movement of goods, the Committee of
Experts proposed the tariff reduction schedule in two phases.
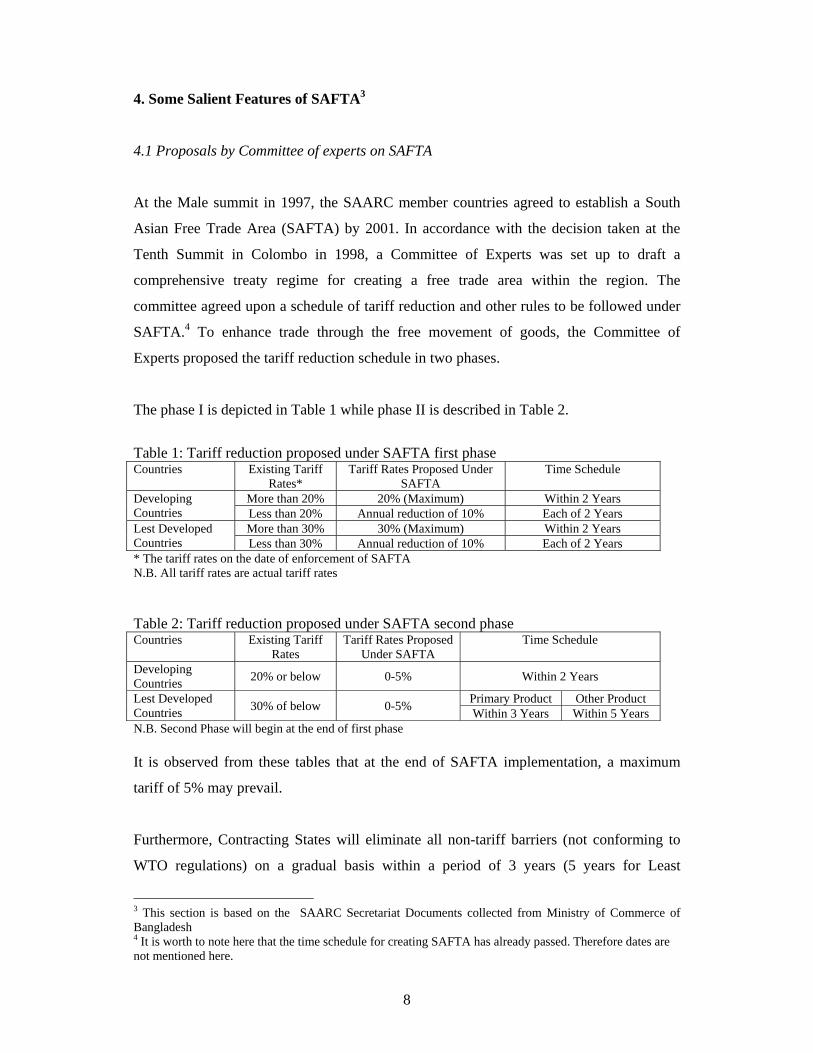
The phase I is depicted in Table 1 while phase II is described in Table 2.
Table 1: Tariff reduction proposed under SAFTA first phase Countries Existing Tariff
Rates* Tariff Rates Proposed Under
SAFTATime Schedule
Developing Countries
More than 20% 20% (Maximum) Within 2 Years Less than 20% Annual reduction of 10% Each of 2 Years
Lest Developed Countries
More than 30% 30% (Maximum) Within 2 Years Less than 30% Annual reduction of 10% Each of 2 Years
* The tariff rates on the date of enforcement of SAFTA N.B. All tariff rates are actual tariff rates Table 2: Tariff reduction proposed under SAFTA second phase Countries Existing Tariff
Rates Tariff Rates Proposed
Under SAFTA Time Schedule
Developing Countries 20% or below 0-5% Within 2 Years
Lest Developed Countries 30% of below 0-5% Primary Product Other Product
Within 3 Years Within 5 Years N.B. Second Phase will begin at the end of first phase It is observed from these tables that at the end of SAFTA implementation, a maximum
tariff of 5% may prevail.
Furthermore, Contracting States will eliminate all non-tariff barriers (not conforming to
WTO regulations) on a gradual basis within a period of 3 years (5 years for Least
3 This section is based on the SAARC Secretariat Documents collected from Ministry of Commerce of Bangladesh 4 It is worth to note here that the time schedule for creating SAFTA has already passed. Therefore dates are not mentioned here.
9
Developing Contracting States), beginning from the date of the enforcement of the
Agreement.
4.2 Alternative proposed by Bangladesh
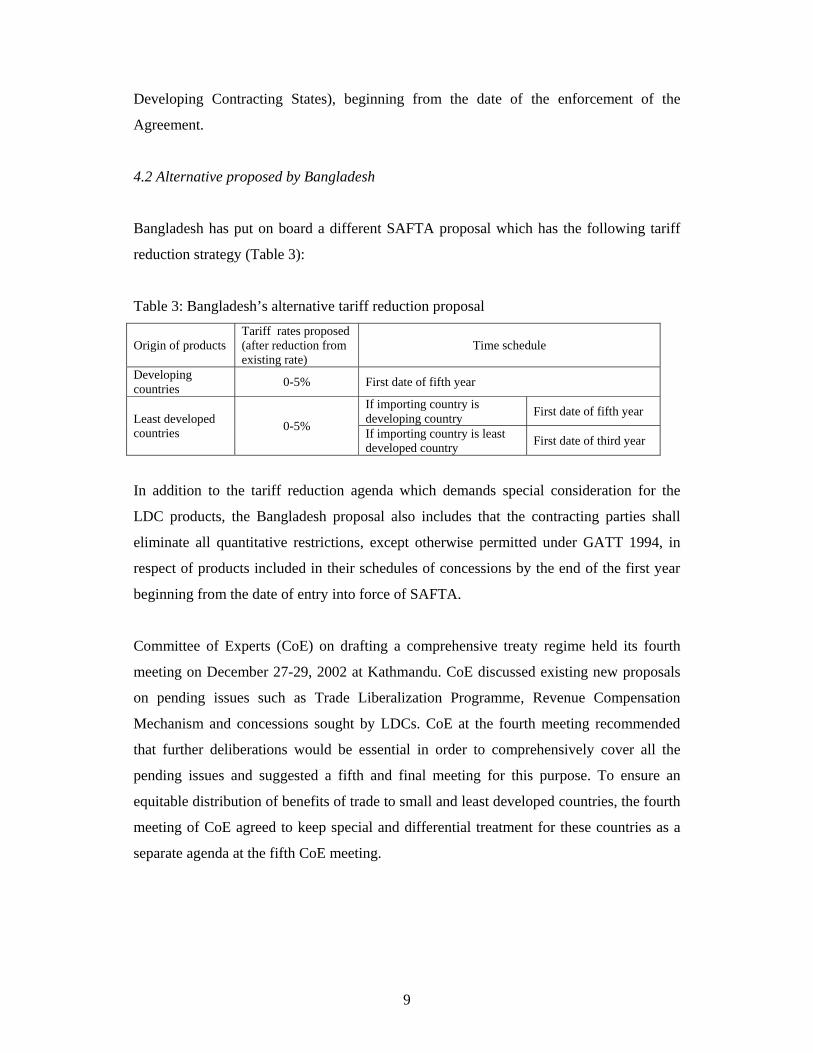
Bangladesh has put on board a different SAFTA proposal which has the following tariff
reduction strategy (Table 3):
Table 3: Bangladesh’s alternative tariff reduction proposal
Origin of products Tariff rates proposed (after reduction from existing rate)
Time schedule
Developing countries 0-5% First date of fifth year
Least developed countries 0-5%
If importing country is developing country First date of fifth year
If importing country is least developed country First date of third year
In addition to the tariff reduction agenda which demands special consideration for the
LDC products, the Bangladesh proposal also includes that the contracting parties shall
eliminate all quantitative restrictions, except otherwise permitted under GATT 1994, in
respect of products included in their schedules of concessions by the end of the first year
beginning from the date of entry into force of SAFTA.
Committee of Experts (CoE) on drafting a comprehensive treaty regime held its fourth
meeting on December 27-29, 2002 at Kathmandu. CoE discussed existing new proposals
on pending issues such as Trade Liberalization Programme, Revenue Compensation
Mechanism and concessions sought by LDCs. CoE at the fourth meeting recommended
that further deliberations would be essential in order to comprehensively cover all the
pending issues and suggested a fifth and final meeting for this purpose. To ensure an
equitable distribution of benefits of trade to small and least developed countries, the fourth
meeting of CoE agreed to keep special and differential treatment for these countries as a
separate agenda at the fifth CoE meeting.
10
5. Estimation Method
5.1 The Data and the Model
The current study has used the data and the modeling framework given under the Global
Trade Analysis Project (GTAP). GTAP is a multi-regional Applied General Equilibrium
(AGE) model, which captures various aspects of world economic activity (Hertel, 1997).
At present, the GTAP model has become a useful tool for analyzing the effects of PTAs.5
Since the main objective of this paper is to assess the impact of SAFTA on its member
countries, a multi-regional AGE model is an appropriate analytical tool.
The GTAP database covers all the bilateral trade, transport and protection data, that link
66 country/regional economic databases. The latest version (Version 5) of the GTAP
database represents the world economy in 1997.6 This version has 66 regions, 57
commodities and 5 factors of production. The current study has combined 66 regions into
14 aggregated regions and 57 commodities into 20 aggregated commodities. The strategy
and logic behind such aggregation is discussed below. There is also a change in the
closure in the present study. In the default setting of the GTAP modeling framework,
labour is assumed to be employed fully. However in reality, large scale unemployment of
unskilled labour is a major feature in the SAARC region. For example in Bangladesh the
nation wide unemployment rate is 4.3% (LFS: 2002) of the total labour force. What is
more alarming is the high rate of underemployment – defined as working population
working less than 35 hours during the reference week, which is around 16.6 percent
according to the Labour Force Survey (2002). Therefore this study has assumed that
supply of unskilled labour for the SAARC member countries as well as for China is
perfectly elastic. Thus in this case the wage is fixed for the unskilled labour of the SAARC
region and China.
5 Fordetails about the GTAP modeling framework and the sources and characteristics of the data , see Hertel (1997) 6 The regional data bases have been derived from individual country domestic data bases or input-output tables. The individual country input-output tables then have been reconstructed in a form of sectoral Disagreegation
11
5.2 Region and Commodity Aggregation Strategy
Since the main objective of the study is to assess the impact of SAFTA and other
alternative policy options for the SAARC region, we have separated all SAARC regions as
much as possible (Bangladesh, India, Sri Lanka, Rest of South Asia).7 The other regions
distinguished are China, Japan, Association of South East Asian Nations (ASEAN), High
Income Asia, Canada, USA, European Union (EU), Australia and New Zealand (see Table
Appendix.1). These regions are separated because SAFTA member countries have a
significant trade relationship with these regions or countries. Other regions are combined
as Rest of the World (ROW).
In case of goods, 57 commodities are aggregated into 20 commodities (see table A.2). The
main strategy for this aggregation is to keep the major traded commodities of the SAARC
members (both in case of intra-SAARC trade and trade with rest of the world) separate
and aggregate the rest.
There are five factors of production -land, unskilled labor, skilled labor, capital and natural
resources.
5.3 Simulation Design
In this study, seven simulations were performed where one is a base case and each of the
rest contains a different regional arrangement option for Bangladesh. The base simulation
was necessary to incorporate some recent changes in the SAFTA region, which is not
covered in the database considered. In December 1998 India and Sri Lanka entered in a
bilateral Free Trade Arrangement. Since GTAP version 5 database reflects the world
economy of 1997, it does not provide the updated data covering India - Sri Lanka FTA.
The base simulation considers complete tariff elimination between India and Sri Lanka. In
all simulations, NTBs are assumed to be absent. All other simulations are run on this new
base. Sim 2 refers to full implementation of SAFTA. The study did not perform the
simulation containing the alternative SAFTA proposal made by Bangladesh incorporating
7 The GTAP data base (version 5) does not have separate data on Pakistan, Nepal, Bhutan and Maldives. They are considered jointly as Rest of South Asia
12
conditions in favor of LDCs in SAARC. Such a simulation requires different tariff
reduction timing for the commodities of different origin and the commodity aggregation of
the considered database does not permit us to do that. Therefore from now on SAFTA
impacts will refer to the impacts of complete implementation of SAFTA (implementation
of SAFTA second phase) in its originally proposed form. Sim 3 points to a customs union
situation. However the aim here is to take account of tariff liberalization rules of world
trade organisation (WTO) or multilateral preferences. For simplicity, 15% common tariff
reduction has been considered. Though it is not 15% for all the commodities, this was
chosen arbitrarily. Sim 4 has been considered to show what happens in a complete by free
trade situation, a real free world. Sim5 and sim 6 are considering possibilities of
Bangladesh to enter in bilateral free trade agreements with the neighboring countries.
Recently both Bangladesh and India have agreed to start negotiation on a bilateral free
trade agreement between the two countries. Also some business communities in
Bangladesh are proposing for a free trade agreement with Sri Lanka. So it is very
desirable to see the implications of such policy options. Sim 7 considers the situation if
Bangladesh goes for free trade agreements with both India and Sri Lanka. Already existing
India - Sri Lanka free trade agreement will translate such attempts of Bangladesh in a
tripartite free trade arrangement among these three countries.
Sim 1: Base simulation - India Sri Lanka Free Trade Area
Sim 2: (SAFTA): All SAARC countries reduce theirs existing tariff rates to 5%. If the
existing tariff rate is less then 5% it will remain unchanged
Sim 3: SAFTA plus 15% uniform external tariff for rest of the world.
Sim 4: All countries of the world reduce their external tariff to zero against all other
countries in the world.
Sim 5: Bangladesh India Free Trade Area
Sim 6: Bangladesh Sri Lanka Free Trade Area
Sim 7: Bangladesh India Sri Lanka tripartite Free Trade Area
13
6. Simulation Results
Simulation results of different policy options are presented in the Tables B.1 to B.7 in
Appendix B. It is to be noted here that bilateral free trade in this study refers to
simultaneous and complete withdrawal of all tariffs by both the parties8. In reality, FTAs
often deviate from this idea of complete withdrawal of tariff and Bangladesh has already
demanded preferential status from India in case of an FTA with that country9. But no
specific modalities have been discussed till now. Therefore we deal with the ideal case of
complete removal of all tariffs between the contracting countries. As indicated earlier, we
also assume a complete absence of NTBs while formulating policies. It should be
emphasized that any deviation from this ‘ideal’ position in favour of Bangladesh keeping
in view her LDC status and vulnerability to external shocks, needs to be given proper
attention and examined thoroughly.
6.1 Welfare Effects
To get an immediate picture of the outcome of any policy option, it is plausible to look at
the welfare impact of such policy. In GTAP welfare effects are determined mainly by
three factors, i.e., changes in allocative efficiency, changes in country’s terms of trade
(ToT) and changes in endowment. Allocative efficiency refers to the efficient sector-wise
allocation of scarce resources to produce the optimal combination of output. In the open
economy context it also refers to efficiency in resource use in purchasing imported
products. Terms of trade effect(TOT) refers to relative movement in prices of countries
exports and imports. ToT effect increases with relative increase in the price of exports as
compared to imports. Endowment effect is a measure of how much the countries gain due
to increase in employment of factors of production such as land, labour or capital
As mentioned earlier a Free Trade Arrangement of India and Sri Lanka has been
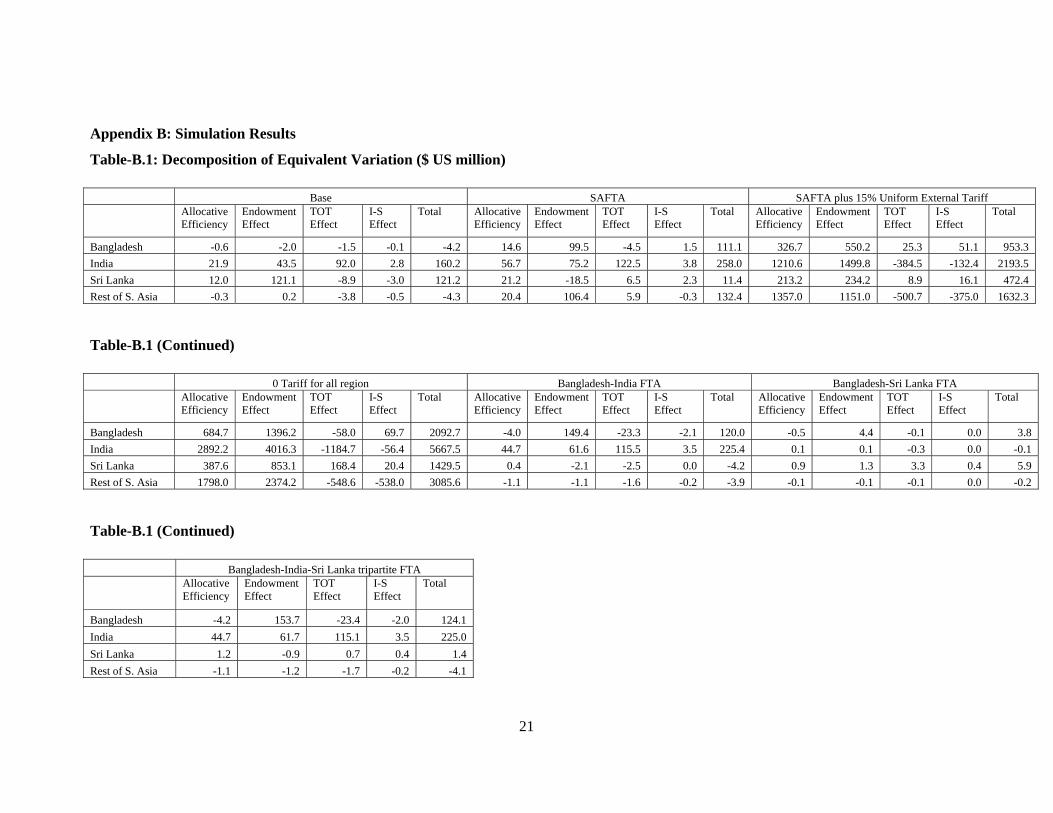
considered as the base case. It is observed that Bangladesh currently faces an aggregate
welfare loss in this situation (Table B.1). This is mainly due to the losses in endowment
effect and terms of trade effect. This is because our export industry is losing as Sri Lanka
8 In contrast, in case of SAFTA, specific tariff reduction modalities have already been proposed and simulations related to SAFTA have been performed accordingly. 9 The Daily Star, 23rd May; 2003.
14
is now better poised to reap the benefits of the large Indian market as duty-free import of
raw materials by the Sri Lankan export industry is making them more competitive than
Bangladeshi exporters. Both India and Sri Lanka experience welfare gain as expected.
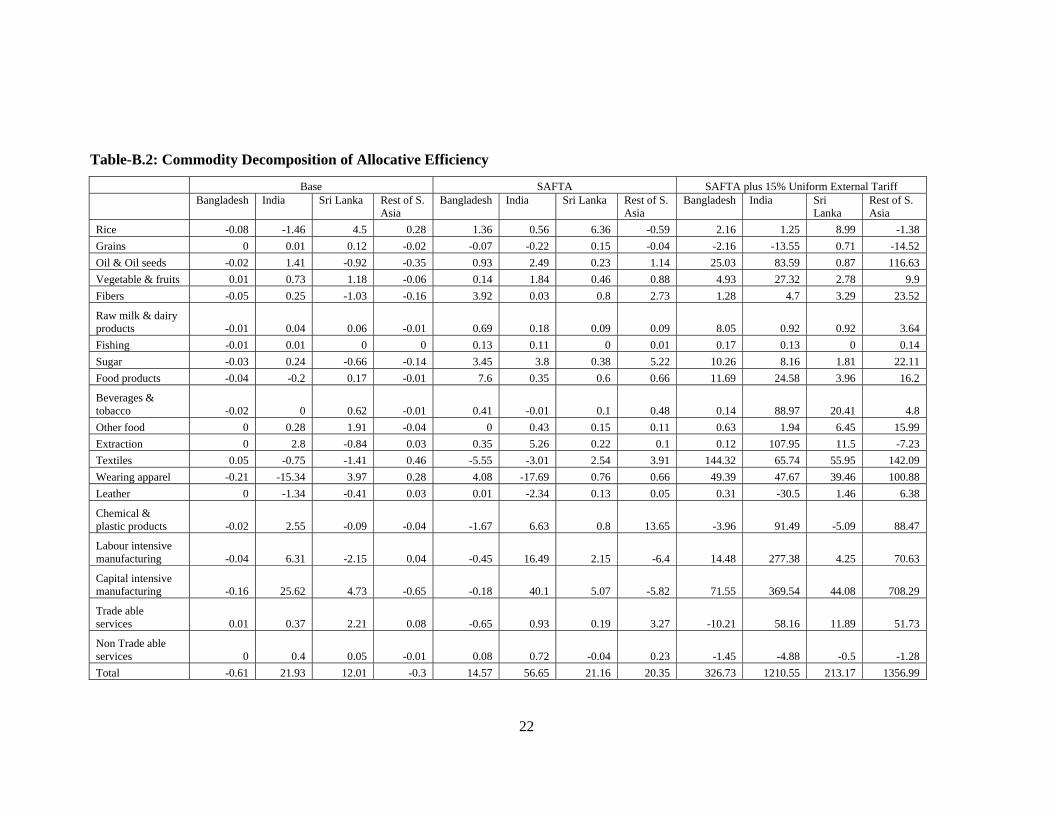
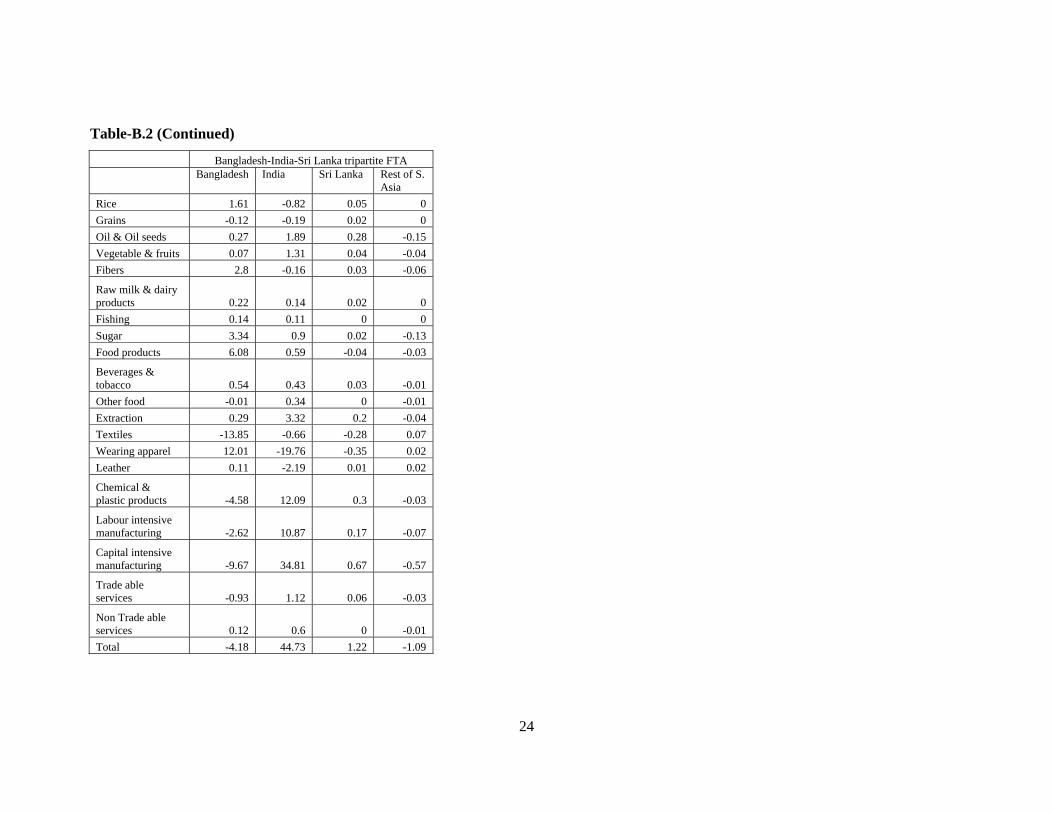
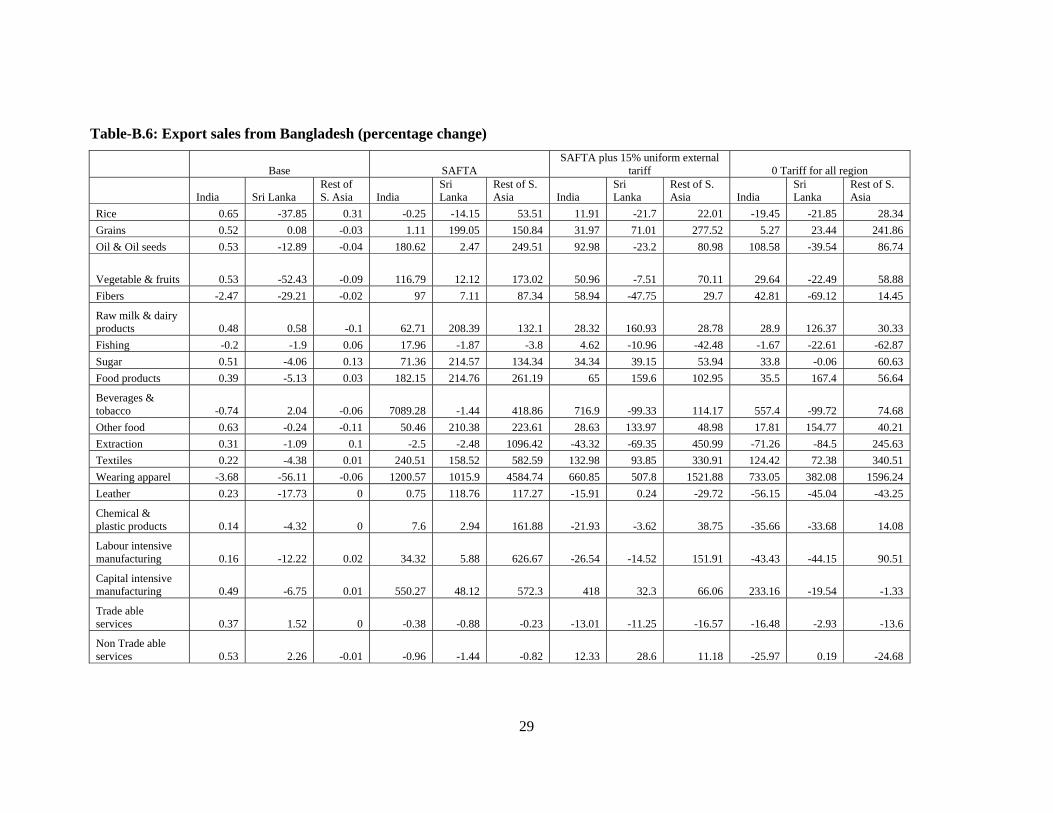
Commodity decomposition of allocative efficiency loss (Table B2) shows that the highest
allocative efficiency loss for Bangladesh occurs in the wearing apparel sector. Export of
wearing apparel from Bangladesh to both India and Sri Lanka is declining (Table B6)
which points to the trade diversion impacts of India Sri Lanka FTA.
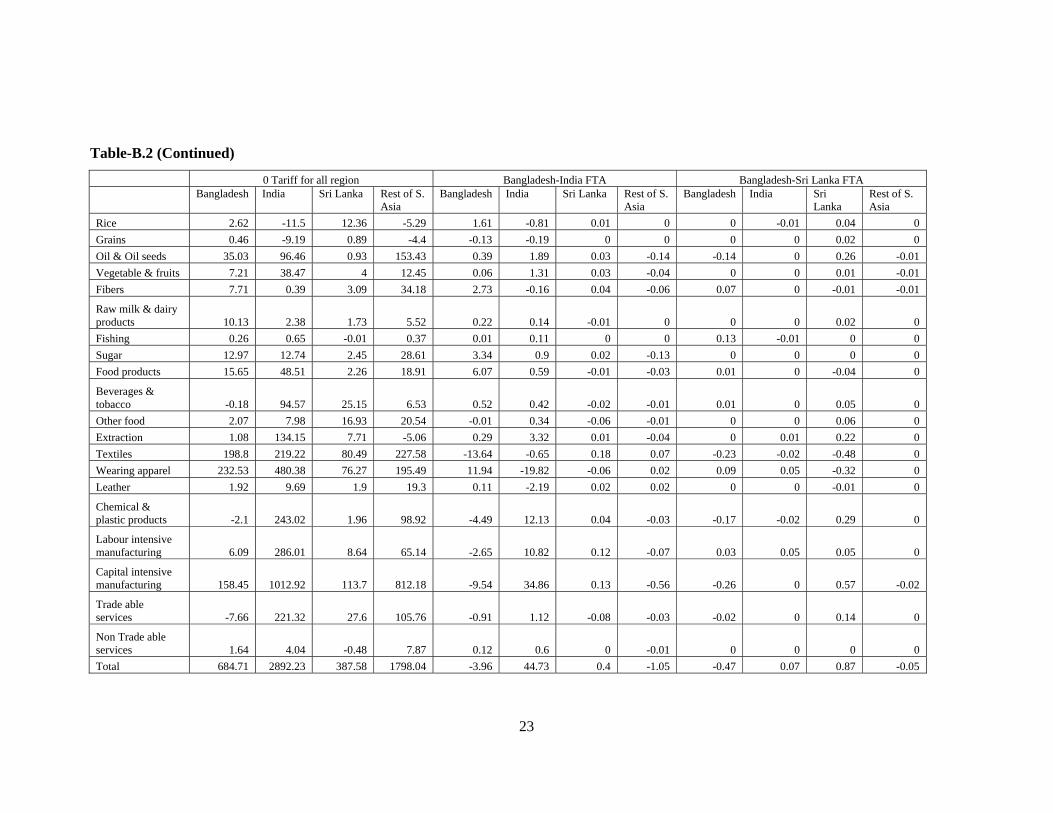
From the welfare impacts in Table B.1, we observe that multilateral tariff reduction (zero
tariffs for all regions) for the whole world has better outcomes for all SAARC countries
than those from the preferential arrangements and bilateral arrangements. Though this was
the general conclusion of Banadara and Yu (2001), the current findings do not reproduce
their finding of negative gains for Bangladesh under SAFTA. Our simulation indicates that
SAFTA indeed generates positive outcome for Bangladesh as well as for other SAARC
members. Bandara and Yu generates different results possibly due to their assumption of
full employment of unskilled labour.
A combination of preferential arrangements under SAFTA and some uniform tariff
concession to ROW (Sim 3) generates much better outcome than SAFTA alone10. For
Bangladesh, a free trade agreement with only Sri Lanka (Sim 6) as has been proposed
recently by some policy makers generates only a small welfare gain for Bangladesh.
However this is not an efficient solution as it leads to losses in allocative efficiency and
terms of trade loss despite some marginal gain in the endowment effect due to a slight
expansion in the export industries.
Among the regional preferential arrangement options, the best scenario is a tripartite free
trade arrangement between Bangladesh, India and Sri Lanka (sim7). This not only
compensates for the existing loss of welfare due to India-Sri Lanka FTA but also leads to
relatively large welfare gain for the country by creating more employment for the
unskilled labour category (Table B1 and B3) which is reflected in the large positive
endowment effect in the aggregate welfare. A free trade agreement with only India largely
mimics this scenario (sim 5). In both the cases there is some loss in terms of trade and 10 This scenario seems more realistic in possible future in consideration of the implementation of the WTO rules.
15
allocative efficiency effect for Bangladesh as compared to the base situation of India-Sr
Lanka FTA. .
In the SAFTA and multilateral tariff reduction simulations, a large part of welfare impact
emerges from the allocative efficiency gain.11 We also notice that India’s gain is more than
double the gain for Bangladesh, while countries in rest of south Asia are gaining almost
the same as that of Bangladesh.
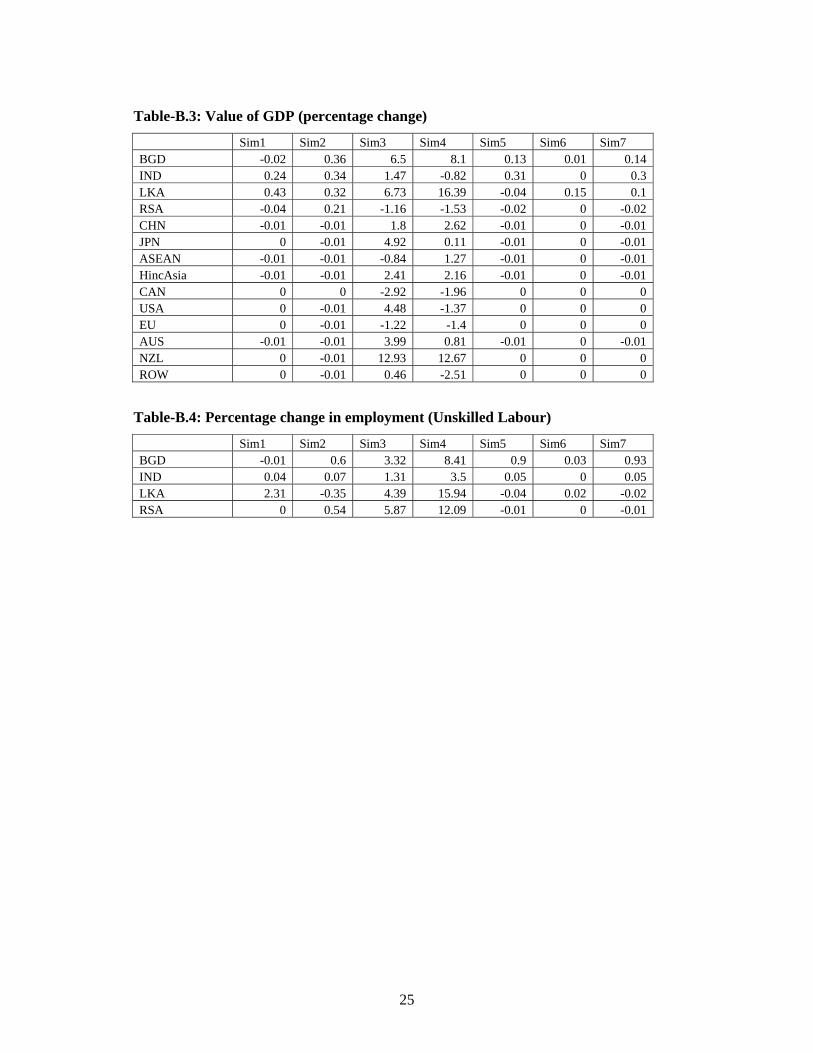
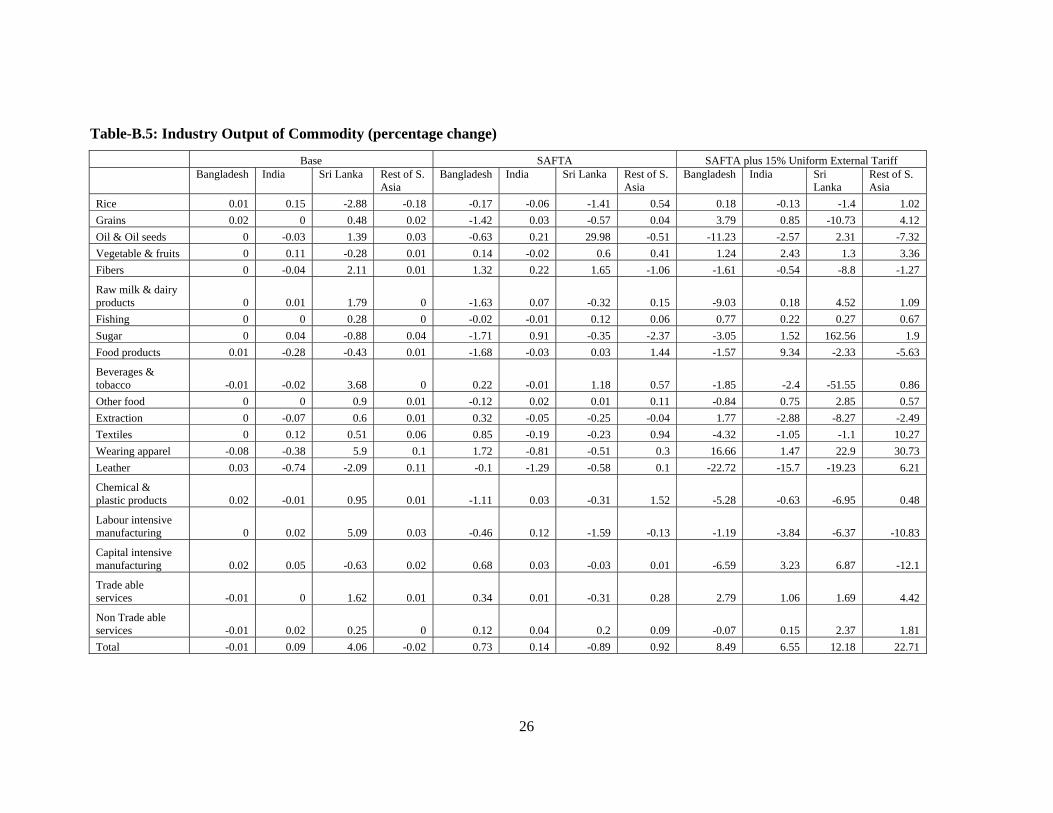
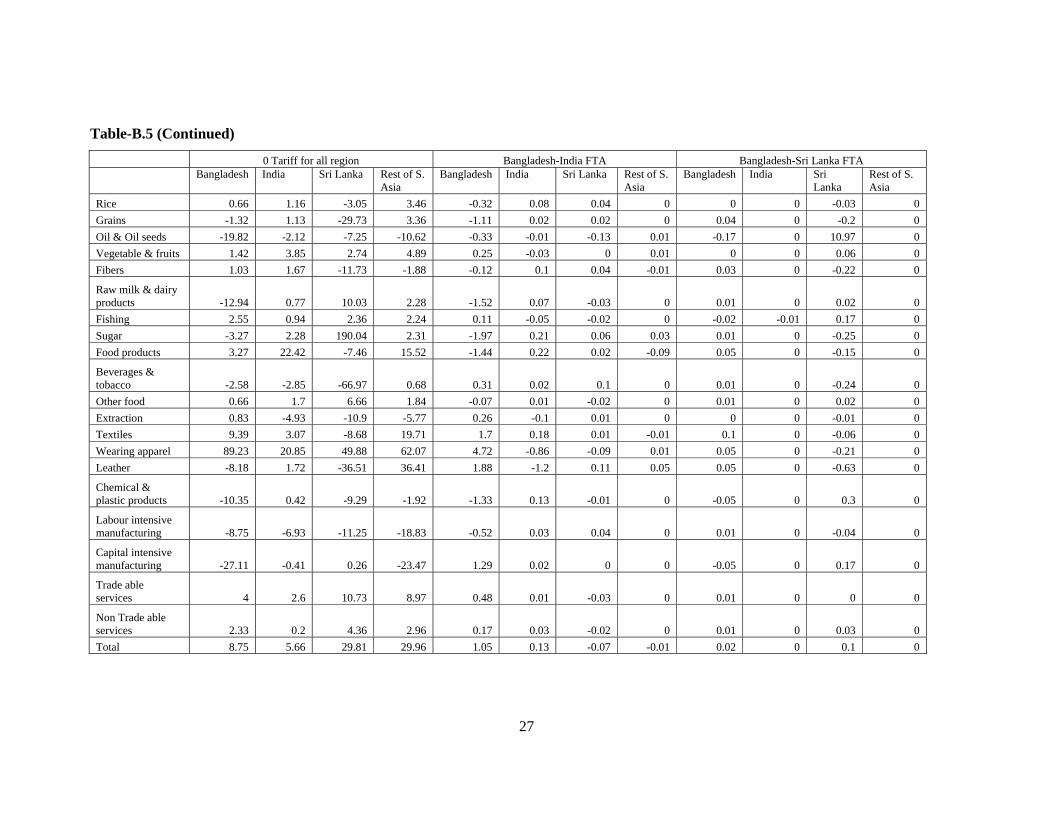
6.2 Changes in Output and Unskilled Labour Employment
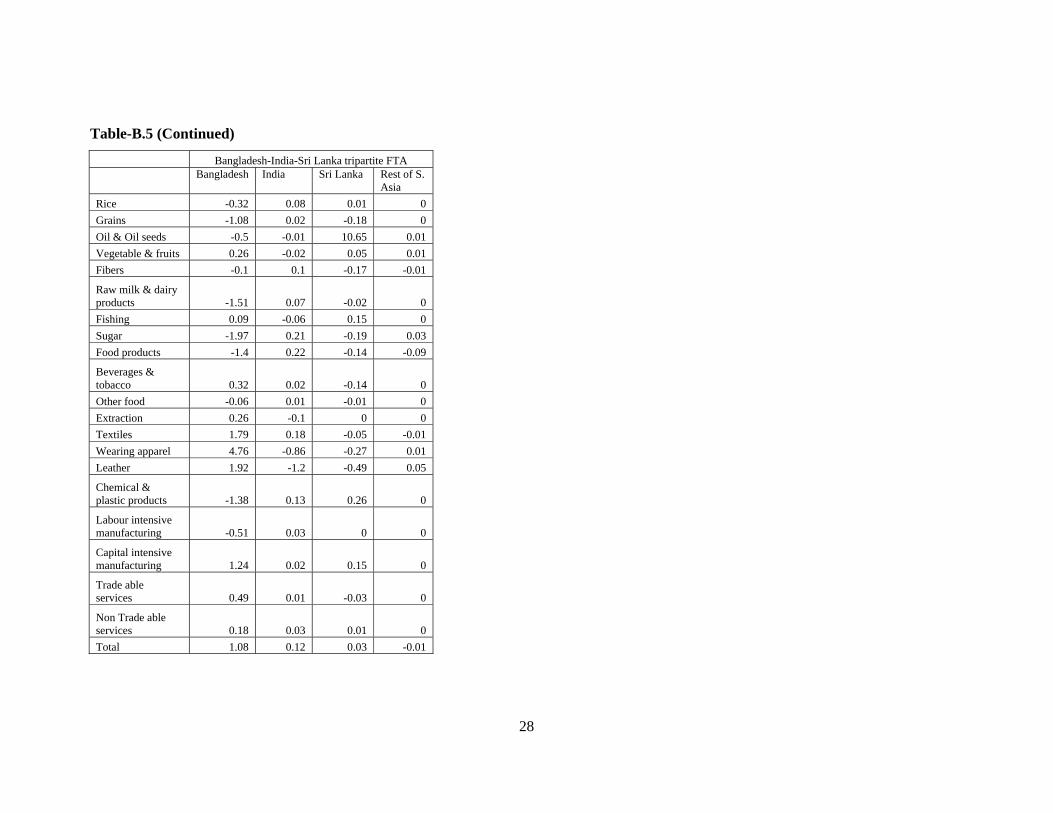
Table B5 presents the percentage change in output under different simulations. Under the
heading ‘Base’ in that table, we have shown the changes in output due to the existing
India-Sr Lanka FTA compared to the situation in the original GTAP database of 1997
when there was no FTA between these two countries. For all other simulations in Table
B5, changes in output as compared to the existing base of India-Sri Lanka FTA have been
shown. In case of textile and wearing apparel (the single most important export sector of
Bangladesh), Bangladesh mainly experiences increases (with one or two exceptions).
However the increase in case of multilateral tariff reduction is much higher than in the
case of SAFTA. There is not much output changes from SAFTA or Bangladesh Sri Lanka
free trade arrangements though there is a better outcome from Bangladesh – India FTA or
Bangladesh – India – Sri Lanka tripartite arrangements. Even in these cases the effect on
output is very marginal for all commodities except some positive impact on textile,
wearing apparel, leather and capital intensive manufacturing sector. Output agricultural
commodities such as rice, grains, oil and oil seeds, raw milk and dairy products decline
marginally. Rice production of Bangladesh experiences marginal increases for multilateral
tariff reduction, but marginal declines for SAFTA or bilateral arrangements.
The change in unskilled labour use is less than 1 percent for SAFTA and bilateral
arrangements, but quite high for multilateral arrangements including SAFTA plus 15%
tariff against ROW. India also experiences similarly. It should, however, be noted that
small percentage changes in labour use lead to significant positive endowment effect as
11 The allocative efficiency gain is achieved by the dual effects of both a shift to the production of more efficient products and shift to production with more efficient use of inputs.
16
shown in Table B1. This is indicative of the scope of welfare increase by expanding the
regional market for employing the large pool of unemployed labours in the region.
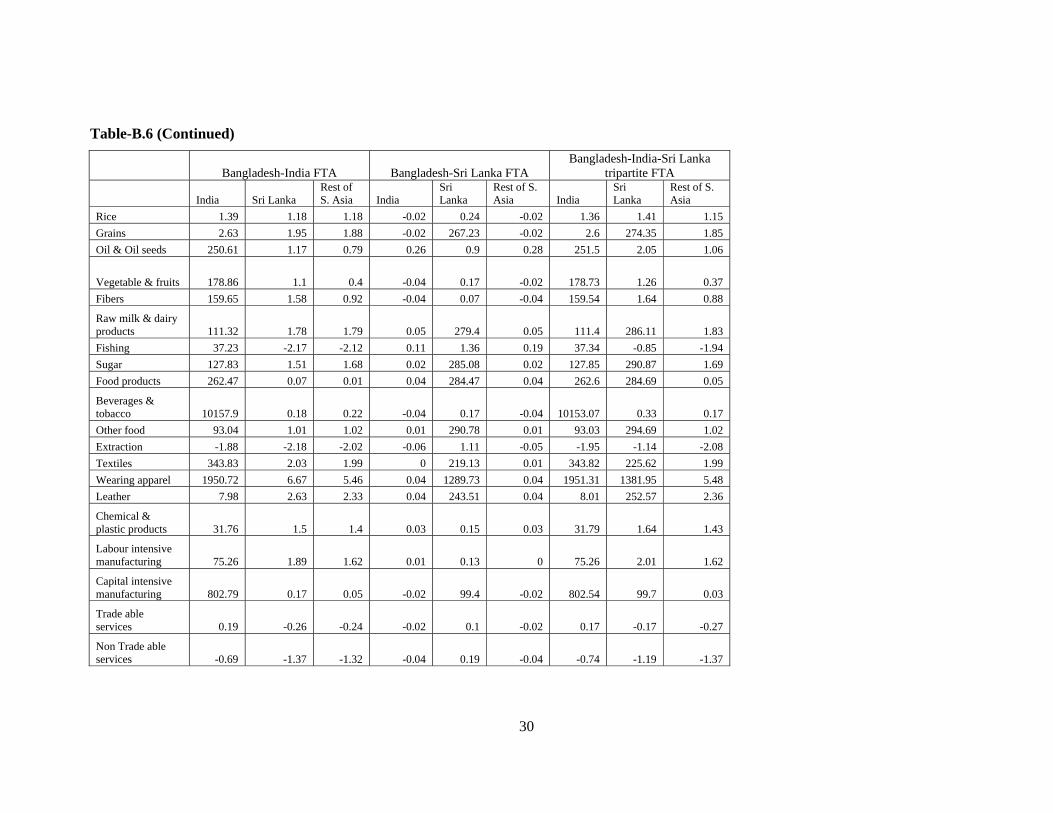
6.3 Changes in selected Macro Scenario
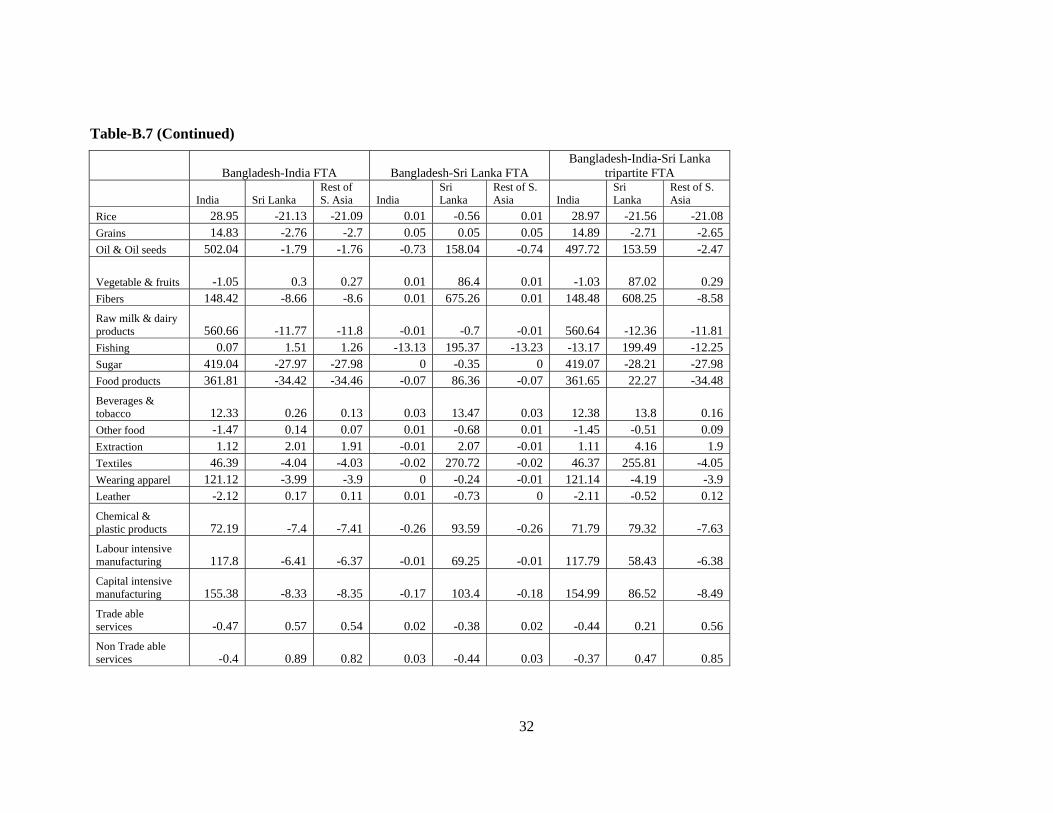
Bangladesh’s export of wearing apparel to India increases in all the simulations but the
base case (Table B6). For most of the commodities Bangladesh’s export to India rises in
all simulations. Removal of comparatively higher tariffs in India makes it more profitable
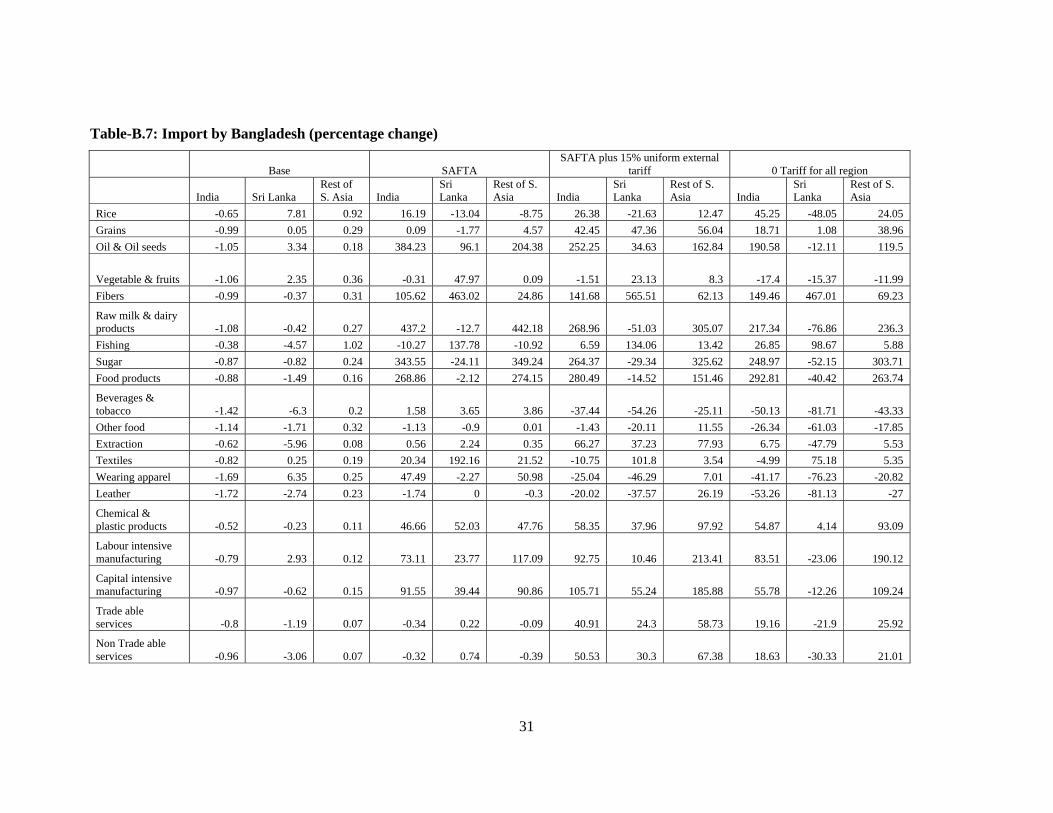
to export to India rather than to other SAFTA countries. Imports of textile goods (raw
material for the wearing apparel industry of Bangladesh) from India rises under both
SAFTA and Bangladesh-India bilateral free trade agreements, but declines under
multilateral tariff reduction cases (Table B7). This indicates that Bangladesh shifts to other
sources of textile imports rather than India, when the multilateral tariff reduction takes
place.
7. Discussions and Conclusion
The modeling tool that has been used here is neo-classical. Any trade liberalizations under
such models will always be welfare increasing. In that sense the result depicting welfare
increase is not surprising. What is important, however, is the source of the gain.
As South-Asia is in general a labour surplus region with high unemployment, the
conventional model has been modified to reflect this ground reality. Much of the welfare
gain occurs due to increased employment of unskilled labour. While the changes in output
is not substantial, the total unemployment pool is so large that even a small increase in
labour employment may have resulted in large aggregate welfare gains as in case of tri-
lateral free trade among Bangladesh, India and Sri Lanka. Only in case of regional free
trade or customs union or completely free multilateral trade does other source such as
allocative efficiency become important.
Do all these results mean that multilateralism should be sacrificed in favour of more
regional or bilateral free trade. Remembering that at present much of Bangladesh’s origins
of import and destinations of export lie outside the region, multilateralism or a more broad
based custom union may be the goal. Bilateral free trade may only be a stepping stone
towards that end.

17
Finally all these depend on free trade in its real sense i.e. goods and services are free to
move without any tariff or non-tariff barriers whatsoever. Unfortunately the lessons so far
indicate that while everybody agrees to tariff removals, actual trade has to cross sometime
much tougher tariff barriers which under no stretch of imagination can be touted as free
trade. Till such a situation of unfettered movement of goods and services occur, the ‘gains’
from free trade will only remain a dream.
18
8. References
Bandara S. J. and Wusheng Yu (2001), ‘How Desirable is the South Asian Free Trade
Area? – A Quantitative Economic Assessment.’, SJFI – Working Paper no. 16.
Bakht Z. and Sen B. (2002), ‘Border Trade In the South Asian Growth Quadrangle
(Bangladesh, Bhutan, India and Nepal)’, Bangladesh Institute of Development
Studies, (mimeo), Bangladesh.
Brockkmeier, M. (2001), ‘A Graphical Exposition of the GTAP Model’. GTAP Technical
Paper No. 8.
Hertel, T. W. (ed) (1997), ‘Global Trade Analysis: Modeling and Applications’, New
York: Cambridge University Press.
Hossain, M. M. and Duncan, R. C. (1998), ‘The Political Economy of Regionalism in
South Asia’, Economic Division Working Papers, SA 98/1. NCDS Publications
Online.
LFS (2002), ‘Report of the Labour Force Survey Bangladesh 1999-2000’, Bangladesh
Bureau of Statistics
Pigato, M., Farah, C., Itakura, ., Jun, K., Martin, W., Murrell, K. and T. G. Srinivasan
(1997), ‘South Asia’s Integration into the World Economy’, Washington, D.C.:
World Bank.
Rahman M. (1998), ‘Bangladesh India Bilateral Trade: Current Trends, New Perspectives,
New Challenges’, BIISS Journal, VOL. 19, NO. 1.
Rajapakse, P. and Arunatilleke, N. (1997), ‘Would a Reduction in Trade Barriers Promote
Intra-SAARC Trade? A Sri Lankan Perspective’, Journal of Asian Economics, 8,
1, 95-115.
Samaratunga, R. H. S. (1999), Essays in Trade Policy and Economic Integration with
Special Reference to South Asia, Unpublished PhD Thesis, La Trobe University,
Melbourne.
Srinivasan, T.N. (1994), ‘Regional Trading Arrangements and Beyond: Exploring Some
Options for South Asia, Theory, Empirics, and Policy’, Report No. IDP-142
(Washington, D.C.: World Bank).
Srinivasan, T.N. and G. Canonero (1995), ‘Preferential Agreements in South Asia:
Theory, Empirics and Policy’, Yale Growth Centre, Yale University (mimeo).
19
Tennagoon, A., (2001), ‘The Welfare Impact of Trade Liberalization on Sri Lanka: A
CGE Analysis’, Paper presented for the Association of Pacific Rim Universities 2nd
Annual Doctoral Students Conference 1-4, February 2001, Auckland, New
Zealand.
20
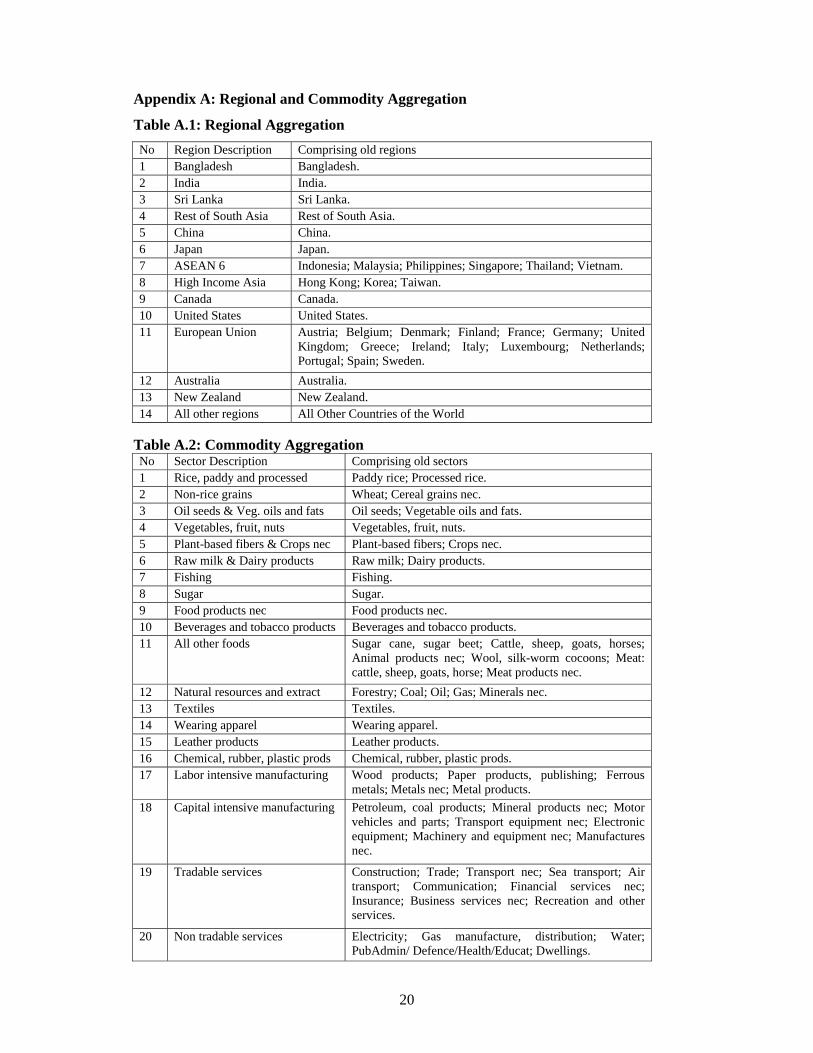
Appendix A: Regional and Commodity Aggregation
Table A.1: Regional Aggregation No Region Description Comprising old regions 1 Bangladesh Bangladesh. 2 India India. 3 Sri Lanka Sri Lanka. 4 Rest of South Asia Rest of South Asia. 5 China China. 6 Japan Japan. 7 ASEAN 6 Indonesia; Malaysia; Philippines; Singapore; Thailand; Vietnam. 8 High Income Asia Hong Kong; Korea; Taiwan. 9 Canada Canada. 10 United States United States. 11 European Union Austria; Belgium; Denmark; Finland; France; Germany; United
Kingdom; Greece; Ireland; Italy; Luxembourg; Netherlands; Portugal; Spain; Sweden.
12 Australia Australia. 13 New Zealand New Zealand. 14 All other regions All Other Countries of the World
Table A.2: Commodity Aggregation No Sector Description Comprising old sectors 1 Rice, paddy and processed Paddy rice; Processed rice. 2 Non-rice grains Wheat; Cereal grains nec. 3 Oil seeds & Veg. oils and fats Oil seeds; Vegetable oils and fats. 4 Vegetables, fruit, nuts Vegetables, fruit, nuts. 5 Plant-based fibers & Crops nec Plant-based fibers; Crops nec. 6 Raw milk & Dairy products Raw milk; Dairy products. 7 Fishing Fishing. 8 Sugar Sugar. 9 Food products nec Food products nec. 10 Beverages and tobacco products Beverages and tobacco products. 11 All other foods Sugar cane, sugar beet; Cattle, sheep, goats, horses;
Animal products nec; Wool, silk-worm cocoons; Meat: cattle, sheep, goats, horse; Meat products nec.
12 Natural resources and extract Forestry; Coal; Oil; Gas; Minerals nec. 13 Textiles Textiles. 14 Wearing apparel Wearing apparel. 15 Leather products Leather products. 16 Chemical, rubber, plastic prods Chemical, rubber, plastic prods. 17 Labor intensive manufacturing Wood products; Paper products, publishing; Ferrous
metals; Metals nec; Metal products. 18 Capital intensive manufacturing Petroleum, coal products; Mineral products nec; Motor
vehicles and parts; Transport equipment nec; Electronic equipment; Machinery and equipment nec; Manufactures nec.
19 Tradable services Construction; Trade; Transport nec; Sea transport; Air transport; Communication; Financial services nec; Insurance; Business services nec; Recreation and other services.
20 Non tradable services Electricity; Gas manufacture, distribution; Water; PubAdmin/ Defence/Health/Educat; Dwellings.
21
Appendix B: Simulation Results
Table-B.1: Decomposition of Equivalent Variation ($ US million)
Table-B.1 (Continued)
Table-B.1 (Continued)
Base SAFTA SAFTA plus 15% Uniform External Tariff
Allocative Efficiency
Endowment Effect
TOT Effect
I-S Effect
Total Allocative Efficiency
Endowment Effect
TOT Effect
I-S Effect
Total Allocative Efficiency
Endowment Effect
TOT Effect
I-S Effect
Total
Bangladesh -0.6 -2.0 -1.5 -0.1 -4.2 14.6 99.5 -4.5 1.5 111.1 326.7 550.2 25.3 51.1 953.3 India 21.9 43.5 92.0 2.8 160.2 56.7 75.2 122.5 3.8 258.0 1210.6 1499.8 -384.5 -132.4 2193.5 Sri Lanka 12.0 121.1 -8.9 -3.0 121.2 21.2 -18.5 6.5 2.3 11.4 213.2 234.2 8.9 16.1 472.4 Rest of S. Asia -0.3 0.2 -3.8 -0.5 -4.3 20.4 106.4 5.9 -0.3 132.4 1357.0 1151.0 -500.7 -375.0 1632.3
0 Tariff for all region Bangladesh-India FTA Bangladesh-Sri Lanka FTA
Allocative Efficiency
Endowment Effect
TOT Effect
I-S Effect
Total Allocative Efficiency
Endowment Effect
TOT Effect
I-S Effect
Total Allocative Efficiency
Endowment Effect
TOT Effect
I-S Effect
Total
Bangladesh 684.7 1396.2 -58.0 69.7 2092.7 -4.0 149.4 -23.3 -2.1 120.0 -0.5 4.4 -0.1 0.0 3.8 India 2892.2 4016.3 -1184.7 -56.4 5667.5 44.7 61.6 115.5 3.5 225.4 0.1 0.1 -0.3 0.0 -0.1 Sri Lanka 387.6 853.1 168.4 20.4 1429.5 0.4 -2.1 -2.5 0.0 -4.2 0.9 1.3 3.3 0.4 5.9 Rest of S. Asia 1798.0 2374.2 -548.6 -538.0 3085.6 -1.1 -1.1 -1.6 -0.2 -3.9 -0.1 -0.1 -0.1 0.0 -0.2
Bangladesh-India-Sri Lanka tripartite FTA
Allocative Efficiency
Endowment Effect
TOT Effect
I-S Effect
Total
Bangladesh -4.2 153.7 -23.4 -2.0 124.1 India 44.7 61.7 115.1 3.5 225.0 Sri Lanka 1.2 -0.9 0.7 0.4 1.4 Rest of S. Asia -1.1 -1.2 -1.7 -0.2 -4.1
22
Table-B.2: Commodity Decomposition of Allocative Efficiency
Base SAFTA SAFTA plus 15% Uniform External Tariff Bangladesh India Sri Lanka Rest of S.
Asia Bangladesh India Sri Lanka Rest of S.
Asia Bangladesh India Sri
Lanka Rest of S. Asia
Rice -0.08 -1.46 4.5 0.28 1.36 0.56 6.36 -0.59 2.16 1.25 8.99 -1.38 Grains 0 0.01 0.12 -0.02 -0.07 -0.22 0.15 -0.04 -2.16 -13.55 0.71 -14.52 Oil & Oil seeds -0.02 1.41 -0.92 -0.35 0.93 2.49 0.23 1.14 25.03 83.59 0.87 116.63 Vegetable & fruits 0.01 0.73 1.18 -0.06 0.14 1.84 0.46 0.88 4.93 27.32 2.78 9.9 Fibers -0.05 0.25 -1.03 -0.16 3.92 0.03 0.8 2.73 1.28 4.7 3.29 23.52
Raw milk & dairy products -0.01 0.04 0.06 -0.01 0.69 0.18 0.09 0.09 8.05 0.92 0.92 3.64 Fishing -0.01 0.01 0 0 0.13 0.11 0 0.01 0.17 0.13 0 0.14 Sugar -0.03 0.24 -0.66 -0.14 3.45 3.8 0.38 5.22 10.26 8.16 1.81 22.11 Food products -0.04 -0.2 0.17 -0.01 7.6 0.35 0.6 0.66 11.69 24.58 3.96 16.2
Beverages & tobacco -0.02 0 0.62 -0.01 0.41 -0.01 0.1 0.48 0.14 88.97 20.41 4.8Other food 0 0.28 1.91 -0.04 0 0.43 0.15 0.11 0.63 1.94 6.45 15.99Extraction 0 2.8 -0.84 0.03 0.35 5.26 0.22 0.1 0.12 107.95 11.5 -7.23 Textiles 0.05 -0.75 -1.41 0.46 -5.55 -3.01 2.54 3.91 144.32 65.74 55.95 142.09 Wearing apparel -0.21 -15.34 3.97 0.28 4.08 -17.69 0.76 0.66 49.39 47.67 39.46 100.88 Leather 0 -1.34 -0.41 0.03 0.01 -2.34 0.13 0.05 0.31 -30.5 1.46 6.38
Chemical & plastic products -0.02 2.55 -0.09 -0.04 -1.67 6.63 0.8 13.65 -3.96 91.49 -5.09 88.47
Labour intensive manufacturing -0.04 6.31 -2.15 0.04 -0.45 16.49 2.15 -6.4 14.48 277.38 4.25 70.63
Capital intensive manufacturing -0.16 25.62 4.73 -0.65 -0.18 40.1 5.07 -5.82 71.55 369.54 44.08 708.29
Trade able services 0.01 0.37 2.21 0.08 -0.65 0.93 0.19 3.27 -10.21 58.16 11.89 51.73
Non Trade able services 0 0.4 0.05 -0.01 0.08 0.72 -0.04 0.23 -1.45 -4.88 -0.5 -1.28 Total -0.61 21.93 12.01 -0.3 14.57 56.65 21.16 20.35 326.73 1210.55 213.17 1356.99
23
Table-B.2 (Continued)
0 Tariff for all region Bangladesh-India FTA Bangladesh-Sri Lanka FTA Bangladesh India Sri Lanka Rest of S.
Asia Bangladesh India Sri Lanka Rest of S.
Asia Bangladesh India Sri
Lanka Rest of S. Asia
Rice 2.62 -11.5 12.36 -5.29 1.61 -0.81 0.01 0 0 -0.01 0.04 0 Grains 0.46 -9.19 0.89 -4.4 -0.13 -0.19 0 0 0 0 0.02 0 Oil & Oil seeds 35.03 96.46 0.93 153.43 0.39 1.89 0.03 -0.14 -0.14 0 0.26 -0.01 Vegetable & fruits 7.21 38.47 4 12.45 0.06 1.31 0.03 -0.04 0 0 0.01 -0.01 Fibers 7.71 0.39 3.09 34.18 2.73 -0.16 0.04 -0.06 0.07 0 -0.01 -0.01
Raw milk & dairy products 10.13 2.38 1.73 5.52 0.22 0.14 -0.01 0 0 0 0.02 0Fishing 0.26 0.65 -0.01 0.37 0.01 0.11 0 0 0.13 -0.01 0 0 Sugar 12.97 12.74 2.45 28.61 3.34 0.9 0.02 -0.13 0 0 0 0 Food products 15.65 48.51 2.26 18.91 6.07 0.59 -0.01 -0.03 0.01 0 -0.04 0
Beverages & tobacco -0.18 94.57 25.15 6.53 0.52 0.42 -0.02 -0.01 0.01 0 0.05 0 Other food 2.07 7.98 16.93 20.54 -0.01 0.34 -0.06 -0.01 0 0 0.06 0Extraction 1.08 134.15 7.71 -5.06 0.29 3.32 0.01 -0.04 0 0.01 0.22 0 Textiles 198.8 219.22 80.49 227.58 -13.64 -0.65 0.18 0.07 -0.23 -0.02 -0.48 0 Wearing apparel 232.53 480.38 76.27 195.49 11.94 -19.82 -0.06 0.02 0.09 0.05 -0.32 0 Leather 1.92 9.69 1.9 19.3 0.11 -2.19 0.02 0.02 0 0 -0.01 0
Chemical & plastic products -2.1 243.02 1.96 98.92 -4.49 12.13 0.04 -0.03 -0.17 -0.02 0.29 0
Labour intensive manufacturing 6.09 286.01 8.64 65.14 -2.65 10.82 0.12 -0.07 0.03 0.05 0.05 0
Capital intensive manufacturing 158.45 1012.92 113.7 812.18 -9.54 34.86 0.13 -0.56 -0.26 0 0.57 -0.02
Trade able services -7.66 221.32 27.6 105.76 -0.91 1.12 -0.08 -0.03 -0.02 0 0.14 0
Non Trade able services 1.64 4.04 -0.48 7.87 0.12 0.6 0 -0.01 0 0 0 0 Total 684.71 2892.23 387.58 1798.04 -3.96 44.73 0.4 -1.05 -0.47 0.07 0.87 -0.05
24
Table-B.2 (Continued)
Bangladesh-India-Sri Lanka tripartite FTA Bangladesh India Sri Lanka Rest of S.
Asia Rice 1.61 -0.82 0.05 0 Grains -0.12 -0.19 0.02 0 Oil & Oil seeds 0.27 1.89 0.28 -0.15 Vegetable & fruits 0.07 1.31 0.04 -0.04Fibers 2.8 -0.16 0.03 -0.06
Raw milk & dairy products 0.22 0.14 0.02 0 Fishing 0.14 0.11 0 0 Sugar 3.34 0.9 0.02 -0.13 Food products 6.08 0.59 -0.04 -0.03
Beverages & tobacco 0.54 0.43 0.03 -0.01 Other food -0.01 0.34 0 -0.01 Extraction 0.29 3.32 0.2 -0.04 Textiles -13.85 -0.66 -0.28 0.07 Wearing apparel 12.01 -19.76 -0.35 0.02 Leather 0.11 -2.19 0.01 0.02
Chemical & plastic products -4.58 12.09 0.3 -0.03
Labour intensive manufacturing -2.62 10.87 0.17 -0.07
Capital intensive manufacturing -9.67 34.81 0.67 -0.57
Trade able services -0.93 1.12 0.06 -0.03
Non Trade able services 0.12 0.6 0 -0.01 Total -4.18 44.73 1.22 -1.09
25
Table-B.3: Value of GDP (percentage change)
Sim1 Sim2 Sim3 Sim4 Sim5 Sim6 Sim7 BGD -0.02 0.36 6.5 8.1 0.13 0.01 0.14 IND 0.24 0.34 1.47 -0.82 0.31 0 0.3 LKA 0.43 0.32 6.73 16.39 -0.04 0.15 0.1 RSA -0.04 0.21 -1.16 -1.53 -0.02 0 -0.02 CHN -0.01 -0.01 1.8 2.62 -0.01 0 -0.01 JPN 0 -0.01 4.92 0.11 -0.01 0 -0.01 ASEAN -0.01 -0.01 -0.84 1.27 -0.01 0 -0.01 HincAsia -0.01 -0.01 2.41 2.16 -0.01 0 -0.01 CAN 0 0 -2.92 -1.96 0 0 0 USA 0 -0.01 4.48 -1.37 0 0 0 EU 0 -0.01 -1.22 -1.4 0 0 0 AUS -0.01 -0.01 3.99 0.81 -0.01 0 -0.01 NZL 0 -0.01 12.93 12.67 0 0 0 ROW 0 -0.01 0.46 -2.51 0 0 0
Table-B.4: Percentage change in employment (Unskilled Labour)
Sim1 Sim2 Sim3 Sim4 Sim5 Sim6 Sim7 BGD -0.01 0.6 3.32 8.41 0.9 0.03 0.93 IND 0.04 0.07 1.31 3.5 0.05 0 0.05 LKA 2.31 -0.35 4.39 15.94 -0.04 0.02 -0.02 RSA 0 0.54 5.87 12.09 -0.01 0 -0.01
26
Table-B.5: Industry Output of Commodity (percentage change)
Base SAFTA SAFTA plus 15% Uniform External Tariff Bangladesh India Sri Lanka Rest of S.
Asia Bangladesh India Sri Lanka Rest of S.
Asia Bangladesh India Sri
Lanka Rest of S. Asia
Rice 0.01 0.15 -2.88 -0.18 -0.17 -0.06 -1.41 0.54 0.18 -0.13 -1.4 1.02 Grains 0.02 0 0.48 0.02 -1.42 0.03 -0.57 0.04 3.79 0.85 -10.73 4.12 Oil & Oil seeds 0 -0.03 1.39 0.03 -0.63 0.21 29.98 -0.51 -11.23 -2.57 2.31 -7.32 Vegetable & fruits 0 0.11 -0.28 0.01 0.14 -0.02 0.6 0.41 1.24 2.43 1.3 3.36Fibers 0 -0.04 2.11 0.01 1.32 0.22 1.65 -1.06 -1.61 -0.54 -8.8 -1.27
Raw milk & dairy products 0 0.01 1.79 0 -1.63 0.07 -0.32 0.15 -9.03 0.18 4.52 1.09 Fishing 0 0 0.28 0 -0.02 -0.01 0.12 0.06 0.77 0.22 0.27 0.67 Sugar 0 0.04 -0.88 0.04 -1.71 0.91 -0.35 -2.37 -3.05 1.52 162.56 1.9 Food products 0.01 -0.28 -0.43 0.01 -1.68 -0.03 0.03 1.44 -1.57 9.34 -2.33 -5.63
Beverages & tobacco -0.01 -0.02 3.68 0 0.22 -0.01 1.18 0.57 -1.85 -2.4 -51.55 0.86 Other food 0 0 0.9 0.01 -0.12 0.02 0.01 0.11 -0.84 0.75 2.85 0.57 Extraction 0 -0.07 0.6 0.01 0.32 -0.05 -0.25 -0.04 1.77 -2.88 -8.27 -2.49 Textiles 0 0.12 0.51 0.06 0.85 -0.19 -0.23 0.94 -4.32 -1.05 -1.1 10.27 Wearing apparel -0.08 -0.38 5.9 0.1 1.72 -0.81 -0.51 0.3 16.66 1.47 22.9 30.73 Leather 0.03 -0.74 -2.09 0.11 -0.1 -1.29 -0.58 0.1 -22.72 -15.7 -19.23 6.21
Chemical & plastic products 0.02 -0.01 0.95 0.01 -1.11 0.03 -0.31 1.52 -5.28 -0.63 -6.95 0.48
Labour intensive manufacturing 0 0.02 5.09 0.03 -0.46 0.12 -1.59 -0.13 -1.19 -3.84 -6.37 -10.83
Capital intensive manufacturing 0.02 0.05 -0.63 0.02 0.68 0.03 -0.03 0.01 -6.59 3.23 6.87 -12.1
Trade able services -0.01 0 1.62 0.01 0.34 0.01 -0.31 0.28 2.79 1.06 1.69 4.42
Non Trade able services -0.01 0.02 0.25 0 0.12 0.04 0.2 0.09 -0.07 0.15 2.37 1.81 Total -0.01 0.09 4.06 -0.02 0.73 0.14 -0.89 0.92 8.49 6.55 12.18 22.71
27
Table-B.5 (Continued)
0 Tariff for all region Bangladesh-India FTA Bangladesh-Sri Lanka FTA Bangladesh India Sri Lanka Rest of S.
Asia Bangladesh India Sri Lanka Rest of S.
Asia Bangladesh India Sri
Lanka Rest of S. Asia
Rice 0.66 1.16 -3.05 3.46 -0.32 0.08 0.04 0 0 0 -0.03 0 Grains -1.32 1.13 -29.73 3.36 -1.11 0.02 0.02 0 0.04 0 -0.2 0 Oil & Oil seeds -19.82 -2.12 -7.25 -10.62 -0.33 -0.01 -0.13 0.01 -0.17 0 10.97 0 Vegetable & fruits 1.42 3.85 2.74 4.89 0.25 -0.03 0 0.01 0 0 0.06 0Fibers 1.03 1.67 -11.73 -1.88 -0.12 0.1 0.04 -0.01 0.03 0 -0.22 0
Raw milk & dairy products -12.94 0.77 10.03 2.28 -1.52 0.07 -0.03 0 0.01 0 0.02 0 Fishing 2.55 0.94 2.36 2.24 0.11 -0.05 -0.02 0 -0.02 -0.01 0.17 0 Sugar -3.27 2.28 190.04 2.31 -1.97 0.21 0.06 0.03 0.01 0 -0.25 0 Food products 3.27 22.42 -7.46 15.52 -1.44 0.22 0.02 -0.09 0.05 0 -0.15 0
Beverages & tobacco -2.58 -2.85 -66.97 0.68 0.31 0.02 0.1 0 0.01 0 -0.24 0 Other food 0.66 1.7 6.66 1.84 -0.07 0.01 -0.02 0 0.01 0 0.02 0 Extraction 0.83 -4.93 -10.9 -5.77 0.26 -0.1 0.01 0 0 0 -0.01 0 Textiles 9.39 3.07 -8.68 19.71 1.7 0.18 0.01 -0.01 0.1 0 -0.06 0 Wearing apparel 89.23 20.85 49.88 62.07 4.72 -0.86 -0.09 0.01 0.05 0 -0.21 0 Leather -8.18 1.72 -36.51 36.41 1.88 -1.2 0.11 0.05 0.05 0 -0.63 0
Chemical & plastic products -10.35 0.42 -9.29 -1.92 -1.33 0.13 -0.01 0 -0.05 0 0.3 0
Labour intensive manufacturing -8.75 -6.93 -11.25 -18.83 -0.52 0.03 0.04 0 0.01 0 -0.04 0
Capital intensive manufacturing -27.11 -0.41 0.26 -23.47 1.29 0.02 0 0 -0.05 0 0.17 0
Trade able services 4 2.6 10.73 8.97 0.48 0.01 -0.03 0 0.01 0 0 0
Non Trade able services 2.33 0.2 4.36 2.96 0.17 0.03 -0.02 0 0.01 0 0.03 0 Total 8.75 5.66 29.81 29.96 1.05 0.13 -0.07 -0.01 0.02 0 0.1 0
28
Table-B.5 (Continued)
Bangladesh-India-Sri Lanka tripartite FTA Bangladesh India Sri Lanka Rest of S.
Asia Rice -0.32 0.08 0.01 0 Grains -1.08 0.02 -0.18 0 Oil & Oil seeds -0.5 -0.01 10.65 0.01 Vegetable & fruits 0.26 -0.02 0.05 0.01Fibers -0.1 0.1 -0.17 -0.01
Raw milk & dairy products -1.51 0.07 -0.02 0 Fishing 0.09 -0.06 0.15 0 Sugar -1.97 0.21 -0.19 0.03 Food products -1.4 0.22 -0.14 -0.09
Beverages & tobacco 0.32 0.02 -0.14 0 Other food -0.06 0.01 -0.01 0 Extraction 0.26 -0.1 0 0 Textiles 1.79 0.18 -0.05 -0.01 Wearing apparel 4.76 -0.86 -0.27 0.01 Leather 1.92 -1.2 -0.49 0.05
Chemical & plastic products -1.38 0.13 0.26 0
Labour intensive manufacturing -0.51 0.03 0 0
Capital intensive manufacturing 1.24 0.02 0.15 0
Trade able services 0.49 0.01 -0.03 0
Non Trade able services 0.18 0.03 0.01 0 Total 1.08 0.12 0.03 -0.01
29
Table-B.6: Export sales from Bangladesh (percentage change)
Base SAFTA SAFTA plus 15% uniform external
tariff 0 Tariff for all region
India Sri Lanka Rest of S. Asia India
Sri Lanka
Rest of S. Asia India
Sri Lanka
Rest of S. Asia India
Sri Lanka
Rest of S. Asia
Rice 0.65 -37.85 0.31 -0.25 -14.15 53.51 11.91 -21.7 22.01 -19.45 -21.85 28.34 Grains 0.52 0.08 -0.03 1.11 199.05 150.84 31.97 71.01 277.52 5.27 23.44 241.86 Oil & Oil seeds 0.53 -12.89 -0.04 180.62 2.47 249.51 92.98 -23.2 80.98 108.58 -39.54 86.74
Vegetable & fruits 0.53 -52.43 -0.09 116.79 12.12 173.02 50.96 -7.51 70.11 29.64 -22.49 58.88 Fibers -2.47 -29.21 -0.02 97 7.11 87.34 58.94 -47.75 29.7 42.81 -69.12 14.45
Raw milk & dairy products 0.48 0.58 -0.1 62.71 208.39 132.1 28.32 160.93 28.78 28.9 126.37 30.33 Fishing -0.2 -1.9 0.06 17.96 -1.87 -3.8 4.62 -10.96 -42.48 -1.67 -22.61 -62.87 Sugar 0.51 -4.06 0.13 71.36 214.57 134.34 34.34 39.15 53.94 33.8 -0.06 60.63 Food products 0.39 -5.13 0.03 182.15 214.76 261.19 65 159.6 102.95 35.5 167.4 56.64
Beverages & tobacco -0.74 2.04 -0.06 7089.28 -1.44 418.86 716.9 -99.33 114.17 557.4 -99.72 74.68Other food 0.63 -0.24 -0.11 50.46 210.38 223.61 28.63 133.97 48.98 17.81 154.77 40.21Extraction 0.31 -1.09 0.1 -2.5 -2.48 1096.42 -43.32 -69.35 450.99 -71.26 -84.5 245.63 Textiles 0.22 -4.38 0.01 240.51 158.52 582.59 132.98 93.85 330.91 124.42 72.38 340.51 Wearing apparel -3.68 -56.11 -0.06 1200.57 1015.9 4584.74 660.85 507.8 1521.88 733.05 382.08 1596.24 Leather 0.23 -17.73 0 0.75 118.76 117.27 -15.91 0.24 -29.72 -56.15 -45.04 -43.25
Chemical & plastic products 0.14 -4.32 0 7.6 2.94 161.88 -21.93 -3.62 38.75 -35.66 -33.68 14.08
Labour intensive manufacturing 0.16 -12.22 0.02 34.32 5.88 626.67 -26.54 -14.52 151.91 -43.43 -44.15 90.51
Capital intensive manufacturing 0.49 -6.75 0.01 550.27 48.12 572.3 418 32.3 66.06 233.16 -19.54 -1.33
Trade able services 0.37 1.52 0 -0.38 -0.88 -0.23 -13.01 -11.25 -16.57 -16.48 -2.93 -13.6
Non Trade able services 0.53 2.26 -0.01 -0.96 -1.44 -0.82 12.33 28.6 11.18 -25.97 0.19 -24.68
30
Table-B.6 (Continued)
Bangladesh-India FTA Bangladesh-Sri Lanka FTA Bangladesh-India-Sri Lanka
tripartite FTA
India Sri Lanka Rest of S. Asia India
Sri Lanka
Rest of S. Asia India
Sri Lanka
Rest of S. Asia
Rice 1.39 1.18 1.18 -0.02 0.24 -0.02 1.36 1.41 1.15 Grains 2.63 1.95 1.88 -0.02 267.23 -0.02 2.6 274.35 1.85 Oil & Oil seeds 250.61 1.17 0.79 0.26 0.9 0.28 251.5 2.05 1.06
Vegetable & fruits 178.86 1.1 0.4 -0.04 0.17 -0.02 178.73 1.26 0.37 Fibers 159.65 1.58 0.92 -0.04 0.07 -0.04 159.54 1.64 0.88
Raw milk & dairy products 111.32 1.78 1.79 0.05 279.4 0.05 111.4 286.11 1.83 Fishing 37.23 -2.17 -2.12 0.11 1.36 0.19 37.34 -0.85 -1.94 Sugar 127.83 1.51 1.68 0.02 285.08 0.02 127.85 290.87 1.69 Food products 262.47 0.07 0.01 0.04 284.47 0.04 262.6 284.69 0.05
Beverages & tobacco 10157.9 0.18 0.22 -0.04 0.17 -0.04 10153.07 0.33 0.17 Other food 93.04 1.01 1.02 0.01 290.78 0.01 93.03 294.69 1.02 Extraction -1.88 -2.18 -2.02 -0.06 1.11 -0.05 -1.95 -1.14 -2.08 Textiles 343.83 2.03 1.99 0 219.13 0.01 343.82 225.62 1.99 Wearing apparel 1950.72 6.67 5.46 0.04 1289.73 0.04 1951.31 1381.95 5.48 Leather 7.98 2.63 2.33 0.04 243.51 0.04 8.01 252.57 2.36
Chemical & plastic products 31.76 1.5 1.4 0.03 0.15 0.03 31.79 1.64 1.43
Labour intensive manufacturing 75.26 1.89 1.62 0.01 0.13 0 75.26 2.01 1.62
Capital intensive manufacturing 802.79 0.17 0.05 -0.02 99.4 -0.02 802.54 99.7 0.03
Trade able services 0.19 -0.26 -0.24 -0.02 0.1 -0.02 0.17 -0.17 -0.27
Non Trade able services -0.69 -1.37 -1.32 -0.04 0.19 -0.04 -0.74 -1.19 -1.37
31
Table-B.7: Import by Bangladesh (percentage change)
Base SAFTA SAFTA plus 15% uniform external
tariff 0 Tariff for all region
India Sri Lanka Rest of S. Asia India
Sri Lanka
Rest of S. Asia India
Sri Lanka
Rest of S. Asia India
Sri Lanka
Rest of S. Asia
Rice -0.65 7.81 0.92 16.19 -13.04 -8.75 26.38 -21.63 12.47 45.25 -48.05 24.05 Grains -0.99 0.05 0.29 0.09 -1.77 4.57 42.45 47.36 56.04 18.71 1.08 38.96 Oil & Oil seeds -1.05 3.34 0.18 384.23 96.1 204.38 252.25 34.63 162.84 190.58 -12.11 119.5
Vegetable & fruits -1.06 2.35 0.36 -0.31 47.97 0.09 -1.51 23.13 8.3 -17.4 -15.37 -11.99 Fibers -0.99 -0.37 0.31 105.62 463.02 24.86 141.68 565.51 62.13 149.46 467.01 69.23
Raw milk & dairy products -1.08 -0.42 0.27 437.2 -12.7 442.18 268.96 -51.03 305.07 217.34 -76.86 236.3 Fishing -0.38 -4.57 1.02 -10.27 137.78 -10.92 6.59 134.06 13.42 26.85 98.67 5.88 Sugar -0.87 -0.82 0.24 343.55 -24.11 349.24 264.37 -29.34 325.62 248.97 -52.15 303.71 Food products -0.88 -1.49 0.16 268.86 -2.12 274.15 280.49 -14.52 151.46 292.81 -40.42 263.74
Beverages & tobacco -1.42 -6.3 0.2 1.58 3.65 3.86 -37.44 -54.26 -25.11 -50.13 -81.71 -43.33Other food -1.14 -1.71 0.32 -1.13 -0.9 0.01 -1.43 -20.11 11.55 -26.34 -61.03 -17.85Extraction -0.62 -5.96 0.08 0.56 2.24 0.35 66.27 37.23 77.93 6.75 -47.79 5.53 Textiles -0.82 0.25 0.19 20.34 192.16 21.52 -10.75 101.8 3.54 -4.99 75.18 5.35 Wearing apparel -1.69 6.35 0.25 47.49 -2.27 50.98 -25.04 -46.29 7.01 -41.17 -76.23 -20.82 Leather -1.72 -2.74 0.23 -1.74 0 -0.3 -20.02 -37.57 26.19 -53.26 -81.13 -27
Chemical & plastic products -0.52 -0.23 0.11 46.66 52.03 47.76 58.35 37.96 97.92 54.87 4.14 93.09
Labour intensive manufacturing -0.79 2.93 0.12 73.11 23.77 117.09 92.75 10.46 213.41 83.51 -23.06 190.12
Capital intensive manufacturing -0.97 -0.62 0.15 91.55 39.44 90.86 105.71 55.24 185.88 55.78 -12.26 109.24
Trade able services -0.8 -1.19 0.07 -0.34 0.22 -0.09 40.91 24.3 58.73 19.16 -21.9 25.92
Non Trade able services -0.96 -3.06 0.07 -0.32 0.74 -0.39 50.53 30.3 67.38 18.63 -30.33 21.01
32
Table-B.7 (Continued)
Bangladesh-India FTA Bangladesh-Sri Lanka FTA Bangladesh-India-Sri Lanka
tripartite FTA
India Sri Lanka Rest of S. Asia India
Sri Lanka
Rest of S. Asia India
Sri Lanka
Rest of S. Asia
Rice 28.95 -21.13 -21.09 0.01 -0.56 0.01 28.97 -21.56 -21.08 Grains 14.83 -2.76 -2.7 0.05 0.05 0.05 14.89 -2.71 -2.65 Oil & Oil seeds 502.04 -1.79 -1.76 -0.73 158.04 -0.74 497.72 153.59 -2.47
Vegetable & fruits -1.05 0.3 0.27 0.01 86.4 0.01 -1.03 87.02 0.29 Fibers 148.42 -8.66 -8.6 0.01 675.26 0.01 148.48 608.25 -8.58 Raw milk & dairy products 560.66 -11.77 -11.8 -0.01 -0.7 -0.01 560.64 -12.36 -11.81 Fishing 0.07 1.51 1.26 -13.13 195.37 -13.23 -13.17 199.49 -12.25 Sugar 419.04 -27.97 -27.98 0 -0.35 0 419.07 -28.21 -27.98 Food products 361.81 -34.42 -34.46 -0.07 86.36 -0.07 361.65 22.27 -34.48 Beverages & tobacco 12.33 0.26 0.13 0.03 13.47 0.03 12.38 13.8 0.16 Other food -1.47 0.14 0.07 0.01 -0.68 0.01 -1.45 -0.51 0.09 Extraction 1.12 2.01 1.91 -0.01 2.07 -0.01 1.11 4.16 1.9 Textiles 46.39 -4.04 -4.03 -0.02 270.72 -0.02 46.37 255.81 -4.05 Wearing apparel 121.12 -3.99 -3.9 0 -0.24 -0.01 121.14 -4.19 -3.9 Leather -2.12 0.17 0.11 0.01 -0.73 0 -2.11 -0.52 0.12 Chemical & plastic products 72.19 -7.4 -7.41 -0.26 93.59 -0.26 71.79 79.32 -7.63 Labour intensive manufacturing 117.8 -6.41 -6.37 -0.01 69.25 -0.01 117.79 58.43 -6.38 Capital intensive manufacturing 155.38 -8.33 -8.35 -0.17 103.4 -0.18 154.99 86.52 -8.49 Trade able services -0.47 0.57 0.54 0.02 -0.38 0.02 -0.44 0.21 0.56Non Trade able services -0.4 0.89 0.82 0.03 -0.44 0.03 -0.37 0.47 0.85