Embed Size (px)
Citation preview

SOUTH AUSTRALIAN RENEWABLE ENERGY REPORT
SOUTH AUSTRALIAN ADVISORY FUNCTIONS
Published: November 2017
SOUTH AUSTRALIAN RENEWABLE ENERGY REPORT
Australian Energy Market Operator Ltd ABN 94 072 010 327 www.aemo.com.au [email protected]
NEW SOUTH WALES QUEENSLAND SOUTH AUSTRALIA VICTORIA AUSTRALIAN CAPITAL TERRITORY TASMANIA WESTERN AUSTRALIA
IMPORTANT NOTICE
Purpose
The purpose of this publication is to provide information to the South Australian Minister for Mineral
Resources and Energy about renewable generation in South Australia. This publication is based on
information available to AEMO as at 30 June 2017, although AEMO has endeavoured to incorporate
more recent information where practical.
AEMO publishes this report in accordance with its additional advisory functions under section 50B of
the National Electricity Law.
Disclaimer
AEMO has made every effort to ensure the quality of the information in this publication but cannot
guarantee that information, forecasts and assumptions are accurate, complete or appropriate for your
circumstances. This publication does not include all of the information that an investor, participant or
potential participant in the National Electricity Market might require, and does not amount to a
recommendation of any investment.
Anyone proposing to use the information in this publication (including information and reports provided
by third parties) should independently verify and check its accuracy, completeness and suitability for
that purpose, and obtain independent and specific advice from appropriate experts.
Accordingly, to the maximum extent permitted by law, AEMO and its officers, employees and
consultants involved in the preparation of this publication:
make no representation or warranty, express or implied, as to the currency, accuracy, reliability or
completeness of the information in this publication; and
are not liable (whether by reason of negligence or otherwise) for any statements, opinions,
information or other matters contained in or derived from this publication, or any omissions from it,
or in respect of a person’s use of the information in this publication.
Acknowledgement
AEMO acknowledges the support, co-operation and contribution of all participants in providing data and
information used in this publication.
Version control
Version Release date Changes
1 23/11/2017
© 2017 Australian Energy Market Operator Limited. The material in this publication may be used in
accordance with the copyright permissions on AEMO’s website.

SOUTH AUSTRALIAN RENEWABLE ENERGY REPORT
© AEMO 2017 1
EXECUTIVE SUMMARY
The 2017 South Australian Renewable Energy Report (SARER) focuses on the performance of
wind and rooftop photovoltaic (PV) generation in South Australia over the last five financial years
(2012–13 to 2016–17).
South Australia had the highest penetration of renewable generation of all NEM regions
in the last five years.
Total renewable generation in South Australia (including wind and rooftop PV) for
2016–17 was 5,359 gigawatt hours (GWh), the highest production in the last five years.
Both wind generation capacity and rooftop PV capacity have increased in the five years
to 2016–17:
Rooftop PV installed capacity rapidly increased from 402 megawatts (MW) in 2012–13 to
781 MW in 2016–17. More than 30% of dwellings in South Australia now have rooftop PV
systems installed.1
Registered wind capacity increased about 41%, from 1,203 MW in 2012–13 to 1,698 MW
in 2016–17.
Instantaneous wind penetration (the ratio of wind generation to operational demand2 at
any point in time) continues to increase.
In 2016–17, wind generation exceeded demand from the grid for around 139 hours in total
spread across 30 separate days, with surplus wind generation available for export to Victoria.
In 2016–17, maximum instantaneous rooftop PV penetration (ratio of rooftop PV
generation to underlying demand3) reached 41% during the middle of the day, the highest
ratio in the past five years.
Renewable generation and its contribution to peak demand
Total installed wind generation capacity increased from 1,576 MW in 2015–16 to 1,698 MW in 2016–17,
with Waterloo Wind Farm’s expansion (19.8 MW) and Hornsdale Stage 2 Wind Farm (102.4 MW) being
registered in October 2016 and February 2017 respectively.
Total generation from both semi-scheduled and significant non-scheduled wind farms in South Australia
for the year was 4,343 GWh.
Total installed rooftop PV generation capacity is estimated4 to have increased 95 MW in 2016–17, to
781 MW. Total rooftop PV generation5 in South Australia for the year was 1,016 GWh, 12% higher than
in 2015–16.
1 Analysis taken from the Australian PV Institute (APVI) Solar Map, funded by the Australian Renewable Energy Agency, accessed from pv-
map.apvi.org.au. Viewed 31 July 2017. 2 Operational reporting includes the electrical energy supplied by scheduled, semi-scheduled, and significant non-scheduled generating units. 3 Underlying electricity demand refers to 30-minute as-generated operational demand plus estimated 30-minute rooftop PV output, so it is an
estimation of that region's total electricity requirement, excluding small non-scheduled generation. 4 Historical installed capacity for rooftop PV was extracted from a data set provided by the Clean Energy Regulator (CER). CER publishes an update
on the capacity of rooftop PV systems every month. For each system, there can be a delay of up to 12 months between the installation of the system and its appearance in the CER data. This is due to the fact that participants in the scheme are permitted up to 12 months to register the system and claim the Small-scale Technology Certificate subsidy.
5 The energy generated by a rooftop PV system was estimated using a model developed by the University of Melbourne. For each half-hour, the generation model takes into account solar radiation and cloud coverage. It models inefficiencies related to shading effects and takes into account the geographic distribution of the rooftop PV installations at that time.

SOUTH AUSTRALIAN RENEWABLE ENERGY REPORT
© AEMO 2017 2
Both wind and rooftop PV generation technologies are intermittent, with output dependent on
weather conditions:
The wind contribution to peak demand analysis6 shows that on average, for 85% of summer peak
demand periods, wind generation contributed at least 9.4% of South Australia’s registered wind
capacity (and for winter, 6.7%).
Similar analysis of expected rooftop PV generation over the past five years indicates that on
average, for 85% of summer underlying peak demand periods, rooftop PV generation contributed
at least 1.6% of its estimated capacity.
Instantaneous penetration
‘Instantaneous penetration’ is a measure of the maximum observed ratio of generation output to
operational demand at any instant in time during the year.
Wind penetration was over 100% for 139 hours across the 2016–17 year, on 30 separate days across
the year. On these occasions, South Australia could have supplied its local demand entirely from wind
generation, with surplus wind generation available to export to Victoria.
Table 1 summarises the change from 2015–16 to 2016–17 in maximum instantaneous wind and rooftop
PV penetration and a number of other internationally-recognised generation indices.7 Because
minimum demand decreased in 2016–17 relative to 2015–16 and installed capacity increased, the
maximum possible instantaneous penetration of wind increased in 2016–17.
Table 1 South Australian penetration indices
Description Wind value for South Australia
Rooftop PV value for South Australia
2015–16 2016–17 2015–16 2016–17
Capacity penetration: installed capacity as a percentage of total installed generationA 31% 36% 13% 14%
Energy penetration: ratio of annual energy to annual total energy consumptionB 32% 34% 6% 7%
Maximum instantaneous penetration (excluding exports): maximum observed ratio of energy to demand at any instant in time during the year B
119% 143% 37% 41%
Maximum possible instantaneous penetration: the ratio of installed capacity to minimum demand C
170% 213% NA NA
Periods of 100% (or greater) instantaneous penetration 24 hours 139
hours 0 hours 0 hours
A. Wind calculations are based on AEMO registered capacity for all South Australian generating systems at the end of the financial year. However, excluded are generating units that are effectively mothballed for more than six months of the financial year, and wind farms whose output did not yet reach 90% of registered capacity by end of the financial year. Rooftop PV capacity penetration is calculated by adding estimated rooftop PV capacity at end of the financial year to registered capacity. B. Wind generation analysis is based on operational demand as generated, while rooftop PV is based on underlying demand. C. Maximum possible instantaneous penetration for rooftop PV is not a valid metric, given minimum underlying demand can occur at periods when rooftop PV could never generate at its maximum capacity.
The maximum instantaneous wind penetration in 2016–17 reached 143% on 30 October 2016 in the
five-minute period ending 1:55 pm. At the same time, there were only three thermal generating units
online in South Australia, producing a combined total of approximately 87 MW, and a total of
approximately 410 MW was being exported to Victoria across the two interconnectors (Heywood
and Murraylink).
6 AEMO computes the wind contribution to peak demand to be the 85th percentile level of expected wind generation across summer or winter peak
periods (that is, the top 10% of five-minute demand dispatch intervals) over the past five years. 7 The period of the South Australian black system event has been excluded for all instantaneous penetration analysis.

SOUTH AUSTRALIAN RENEWABLE ENERGY REPORT
© AEMO 2017 3
Wind generation is generally slightly higher overnight than during the day. Because of this, average
wind penetration levels are greatest between 2:00 am and 5:00 am, when average operational demand
is normally lowest. In contrast, the impact of rooftop PV generation only occurs during daylight hours.
Figure 1 shows wind generation, estimated rooftop PV generation8, demand from the grid, and
instantaneous wind penetration, for 30 October 2016, the day maximum wind penetration occurred.
The figure illustrates the interaction between wind generation and operational demand. Depending on
the time of day, rooftop PV will affect operational demand and wind output will dictate the instantaneous
penetration. In 2016–17, maximum wind instantaneous penetration occurred in the middle of the day
when both wind and rooftop PV generation were very high and demand was low. By contrast, in
2015–16, maximum wind instantaneous penetration occurred in the early hours of the morning when
wind output was very high and demand was low.
Figure 1 South Australian wind generation, demand, rooftop PV, and wind penetration on
30 October 2016
8 Rooftop PV generation is seen as a reduction in demand, as it is not metered by AEMO.
0
200
400
600
800
1000
1200
1400
1600
1800
2000
2200
2400
2600
2800
3000
3200
0%
10%
20%
30%
40%
50%
60%
70%
80%
90%
100%
110%
120%
130%
140%
150%
SA
de
ma
nd
, w
ind
ge
ne
rati
on
an
d r
oo
fto
p P
V (
MW
)
Win
d P
en
etr
ati
on
(%
)
Time of Day
Rooftop PV (estimated) (MW) Wind Penetration (%)
Wind Generation (MW) Demand (MW)
Wind total registered capacity (MW) Rooftop PV estimated capacity (MW)

SOUTH AUSTRALIAN RENEWABLE ENERGY REPORT
© AEMO 2017 4
Renewable generation variation
Due to the intermittent nature of wind and rooftop PV, there is potential for sudden variations
in generation.
Analysis of output in 2016–17 shows that:
The maximum variation of all South Australian wind generation was 763 MW (44.9% of registered
capacity) across five-minute periods, and 963 MW (56.7% of registered capacity) across
30-minute periods.
Wind farms located in the mid-north of South Australia showed lower wind variation than those
installed in the south-east and coastal peninsula areas.
The aggregated South Australian wind variation is lower than any single area, reflecting the
smoothing effect of geographic diversity across the region.
In 2016–17, South Australian estimated rooftop PV generation varied by up to 190 MW (24.3% of
estimated capacity) across 30-minute periods. The analysis of summer and winter daily generation
profiles shows the rate of change in generation, particularly during mornings and evenings, increasing
year on year, concurrent with growth in installed capacity.
This high variability in wind and rooftop PV generation means there is a greater variability of the
residual demand9, which must be met by more responsive dispatchable capacity in South Australia, or
by changes in power flow from Victoria on the Heywood and Murraylink interconnectors.
9 Residual demand refers to demand that is met by generation other than wind generators and rooftop PV.

SOUTH AUSTRALIAN RENEWABLE ENERGY REPORT
© AEMO 2017 5
CONTENTS
EXECUTIVE SUMMARY 1
1. INTRODUCTION 8
1.1 Information sources and assumptions 8
1.2 Treatment of wind farms during commissioning period 9
1.3 Generating systems maps 9
1.4 Recent renewable generation and network developments 12
2. WIND FARMS 13
2.1 Summary 13
2.2 Wind contribution during peak demand 13
2.3 Wind penetration 16
3. ROOFTOP PV 20
3.1 Rooftop PV capacity 20
3.2 Generation 22
3.3 Rooftop PV contribution during maximum underlying demand 22
3.4 Rooftop PV penetration 24
4. INTERMITTENCY AND DEMAND VARIATIONS 26
4.1 Wind, rooftop PV, and demand variation 26
4.2 Rooftop PV variation 30
4.3 Wind forecast performance 31
5. RENEWABLE GENERATION AND MARKET PRICES 34
APPENDIX A. WIND FARM STATISTICS 41
A.1 Wind farm capacities 41
A.2 Wind farm capacity factors 42
A.3 Wind generation variation 43
MEASURES AND ABBREVIATIONS 44
Units of measure 44
Abbreviations 44
GLOSSARY 45
TABLES
Table 1 South Australian penetration indices 2
Table 2 SARER data sources summary 8
Table 3 South Australian registered capacity by fuel type as at 30 June 2017 12
Table 4 Publicly announced and committed renewable generation projects by energy source as at
5 June 2017 12
Table 5 Total South Australian wind generation 13

SOUTH AUSTRALIAN RENEWABLE ENERGY REPORT
© AEMO 2017 6
Table 6 85th percentile wind contribution factor (wind generation as a % of registered wind
capacity) during top 10% seasonal peak demand 14
Table 7 Expected wind contribution during peak demand (wind generation as a % of registered
wind capacity) 14
Table 8 South Australian wind penetration indices (%) 16
Table 9 South Australian rooftop PV installed capacity forecasts 21
Table 10 South Australian rooftop PV generation estimates 22
Table 11 Rooftop PV contribution during periods of maximum underlying peak demand 22
Table 12 Rooftop PV generation (% of estimated capacity) during top 10% of summer peak demand
periods 23
Table 13 South Australian rooftop PV penetration indices 25
Table 14 Total registered capacity and historical maximum variation outputs (MW) by area 30
Table 15 Total installed capacity and estimated historical maximum variation outputs (MW) 31
Table 16 Registered capacities of South Australian wind farms 41
Table 17 Financial year capacity factors of South Australian wind farms 42
Table 18 Key statistical characteristics of wind generation variation for 2016–17 43
Table 19 Key statistical characteristics of wind generation variation for 2015–16 43
FIGURES
Figure 1 South Australian wind generation, demand, rooftop PV, and wind penetration on 30
October 2016 3
Figure 2 Location and capacity of South Australian generating systems as at 5 June 2017 10
Figure 3 Location and capacity of proposed South Australian generation projects as 5 June 2017 11
Figure 4 Summer peak demand wind generation duration curve (% of registered wind capacity) 15
Figure 5 Winter peak demand wind generation duration curve (% of registered wind capacity) 15
Figure 6 Daily demand, wind generation, and penetration profile 17
Figure 7 South Australian wind generation, demand, rooftop PV, and wind penetration on 30
October 2016 18
Figure 8 Instantaneous wind penetration duration curves 19
Figure 9 South Australian rooftop PV installed capacity forecasts at the end of each financial year 21
Figure 10 Summer peak demand rooftop PV generation duration curve (% of estimated rooftop PV
capacity) 23
Figure 11 Winter peak demand rooftop PV generation duration curve (% of estimated rooftop PV
capacity) 24
Figure 12 Rooftop PV generation compared to total South Australian generation 25
Figure 13 South Australian wind generation, operational demand, and residual demand from
2012–13 to 2016–17 (variation distribution) 26
Figure 14 South Australian residual demand (variation distribution) 27
Figure 15 Five-minute and 10-minute absolute wind generation variation for 2016–17 28
Figure 16 Absolute wind variation as percentage of registered capacity 29
Figure 17 Daily estimated rooftop PV generation profile 31
Figure 18 Normalised mean absolute error of AWEFS forecasts for South Australia from 2012–13 to
2016–17 32
Figure 19 South Australian average wind generation and spot prices (30-minute data for 2012–13 to
2016–17) 34

SOUTH AUSTRALIAN RENEWABLE ENERGY REPORT
© AEMO 2017 7
Figure 20 South Australian estimated rooftop PV generation and spot prices (30-minute data for
2012–13 to 2016–17) 35
Figure 21 South Australian 30-minute spot prices and average wind generation (positive market
prices) 36
Figure 22 South Australian 30-minute spot prices and estimated rooftop PV generation (positive
market prices) 37
Figure 23 South Australian 30-minute spot prices and average wind generation (negative market
prices) 38
Figure 24 South Australian 30-minute spot prices and estimated rooftop PV generation (negative
market prices) 39
Figure 25 Negative South Australian spot price, average wind and rooftop PV generation by time of
day (2016–17) 40
SOUTH AUSTRALIAN RENEWABLE ENERGY REPORT
© AEMO 2017 8
1. INTRODUCTION
The South Australian Renewable Energy Report (SARER) analyses the region’s historical wind farm
and rooftop photovoltaic (PV) performance, including electricity market pricing insights, over the five
years 2012–13 to 2016–17, and winter 2017 where applicable.
1.1 Information sources and assumptions
The SARER reports on electricity generated by South Australian renewable generating systems that
operate in the National Electricity Market (NEM):
Wind farms are typically greater than or equal to 30 megawatts (MW) registered capacity, and are
described in Appendix A.1.
Historical estimates of rooftop PV installed capacity and generation output are taken from the 2017
Electricity Statement of Opportunities (ESOO)10 for the NEM, to illustrate its impact on operational
consumption and pricing.11
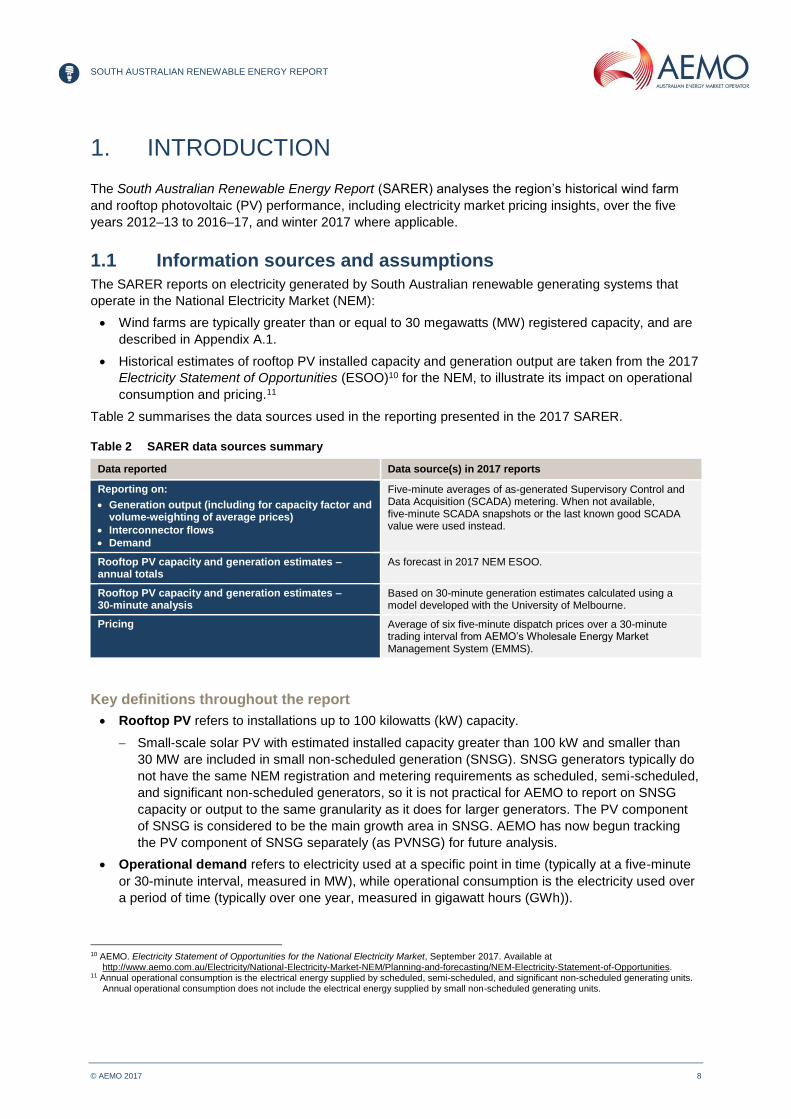
Table 2 summarises the data sources used in the reporting presented in the 2017 SARER.
Table 2 SARER data sources summary
Data reported Data source(s) in 2017 reports
Reporting on:
Generation output (including for capacity factor and volume-weighting of average prices)
Interconnector flows
Demand
Five-minute averages of as-generated Supervisory Control and Data Acquisition (SCADA) metering. When not available, five-minute SCADA snapshots or the last known good SCADA value were used instead.
Rooftop PV capacity and generation estimates – annual totals
As forecast in 2017 NEM ESOO.
Rooftop PV capacity and generation estimates – 30-minute analysis
Based on 30-minute generation estimates calculated using a model developed with the University of Melbourne.
Pricing Average of six five-minute dispatch prices over a 30-minute trading interval from AEMO’s Wholesale Energy Market Management System (EMMS).
Key definitions throughout the report
Rooftop PV refers to installations up to 100 kilowatts (kW) capacity.
Small-scale solar PV with estimated installed capacity greater than 100 kW and smaller than
30 MW are included in small non-scheduled generation (SNSG). SNSG generators typically do
not have the same NEM registration and metering requirements as scheduled, semi-scheduled,
and significant non-scheduled generators, so it is not practical for AEMO to report on SNSG
capacity or output to the same granularity as it does for larger generators. The PV component
of SNSG is considered to be the main growth area in SNSG. AEMO has now begun tracking
the PV component of SNSG separately (as PVNSG) for future analysis.
Operational demand refers to electricity used at a specific point in time (typically at a five-minute
or 30-minute interval, measured in MW), while operational consumption is the electricity used over
a period of time (typically over one year, measured in gigawatt hours (GWh)).
10 AEMO. Electricity Statement of Opportunities for the National Electricity Market, September 2017. Available at
http://www.aemo.com.au/Electricity/National-Electricity-Market-NEM/Planning-and-forecasting/NEM-Electricity-Statement-of-Opportunities. 11 Annual operational consumption is the electrical energy supplied by scheduled, semi-scheduled, and significant non-scheduled generating units.
Annual operational consumption does not include the electrical energy supplied by small non-scheduled generating units.

SOUTH AUSTRALIAN RENEWABLE ENERGY REPORT
© AEMO 2017 9
Underlying demand refers to electricity consumed by customers at their premises, supplied from
both the grid and rooftop PV combined. In this report, it is estimated to be the sum of operational
demand plus rooftop PV generation.
South Australian demand refers to the as-generated operational demand met by local scheduled,
semi-scheduled, and significant non-scheduled generating systems12 plus interconnector imports
from Victoria, and excludes demand supplied by rooftop PV generation.
Time has been expressed in Australian Eastern Standard Time (AEST) with no daylight savings
applied. This is referred to as NEM time (or market time).
Summer has been defined as the period from 1 November to 31 March, and winter from 1 June
to 31 August.
Due to changes in scheduling type in 2015–16, Angaston, Lonsdale, and Port Stanvac power stations
are included in operational demand and generation analysis from 12 January 2016. Angaston power
station is included in reporting on individual generator outputs and capacity factors before this date.
The South Australian black system event period over September and October 2016 has been excluded
for all instantaneous penetration analysis.
1.2 Treatment of wind farms during commissioning period
Wind farms typically take several months to ramp up their generation from very small amounts to their
full capacity during commissioning. AEMO attempts to minimise the impact of this commissioning period
on analysis that involves generator capacity, as wind farm output during this period is non-typical.13
The following methodology applies throughout this report, except where specifically noted:
Wind farms are considered to be in their commissioning period from the time they are registered
with AEMO until their five-minute generation value first reaches 90% of their registered capacity.
Wind farms in their commissioning period are included in calculations of:
Operational demand, as supplied by scheduled, semi-scheduled and significant non-scheduled
generating units.
Individual and total wind generation (except for wind contribution during peak demand, as
stated below).
Wind farms in their commissioning period are excluded from:
Calculations of capacity factor.
Calculations of capacity penetration and maximum possible instantaneous penetration.
Any capacity calculations of wind variation analysis (but are included in the generation
calculations, as stated above).
The capacity and generation calculations of wind contribution during peak demand analysis (but
included in the demand calculations, as stated above).
For the 2017 SARER, four wind farms in South Australia are affected by the above methodology, and
are described in various analyses throughout the report. These are the Hallett 5 (the Bluff), Snowtown
Stage 2, Hornsdale Stage 1, and Hornsdale Stage 2 wind farms.
1.3 Generating systems maps
Figure 2 shows the location, nameplate capacity, and energy source of registered operational
generators in South Australia (all scheduled, semi-scheduled, and significant non-scheduled generators
12 Significant non-scheduled generating units in South Australia are all non-scheduled wind farms, as their capacity exceeds 30 MW. 13 Capacity factor calculations would be especially distorted if no consideration was made for the commissioning period.

SOUTH AUSTRALIAN RENEWABLE ENERGY REPORT
© AEMO 2017 10
used in operational reporting). Figure 3 shows the location and capacity of publicly announced
generation projects as at 5 June 2017.14
Figure 2 Location and capacity of South Australian generating systems as at 5 June 2017
14 AEMO Generation Information for South Australia, 5 June 2017. Available at: http://www.aemo.com.au/Electricity/Planning/Related-
Information/Generation-Information.

SOUTH AUSTRALIAN RENEWABLE ENERGY REPORT
© AEMO 2017 11
Figure 3 Location and capacity of proposed South Australian generation projects as 5 June 2017

SOUTH AUSTRALIAN RENEWABLE ENERGY REPORT
© AEMO 2017 12
Local generation capacity
Table 3 summarises the capacity mix of fuel types for all registered generation in South Australia, as at
30 June 2017.
In South Australia, in 2016–17, local wind generation was the second largest proportion of registered
capacity, at approximately 31.2% of total registered capacity.
Table 3 South Australian registered capacity by fuel type as at 30 June 2017
Fuel Type Registered capacity (MW) % of total capacity
Gas 2,668 49.1%
Wind 1,698 31.2%
Rooftop PVA 781 14.4%
Diesel + SNSGB 289 5.3%
Total 5,436 100%
A. Rooftop PV installations are not registered with AEMO, but are included here given their material contribution to generation in 2016–17. Rooftop PV capacity and generation estimates as listed build on those presented in the 2017 NEM ESOO forecasts.
B. Diesel + SNSG includes small and large diesel, small landfill methane, hydro generating systems and the PV systems larger than 100 kW and smaller than 30 MW.
1.4 Recent renewable generation and network developments Generation investment interest in South Australia continues to be focused largely on renewable energy
proposals. As at 5 June 2017, AEMO’s generation information page listed 25 publicly announced
renewable electricity generation developments in South Australia, totalling 4,708 MW.
Table 4 aggregates the new renewable developments by energy source.15
Table 4 Publicly announced and committed renewable generation projects by energy source as at
5 June 2017
Energy source Number of projects Capacity (MW) Capacity (%)
Solar 9A 1,515 B 32.2%
Biomass 1 15 0.3%
Wind 15 A 3,178 67.5%
Total 25 4,708 100.0%
A. Port Augusta Renewable Energy Park (combined wind and solar PV project) capacity is split between both the solar and wind categories, but is counted once in the total number of projects.
B. This does not include the newly announced 150 MW solar thermal power plant for Port Augusta.
There are four new publicly announced solar generation developments since the 2016 SARER:
Riverland Solar (330 MW).
Tailem Bend Solar (100 MW).
Whyalla Solar – Adani (140 MW).
Whyalla Solar Farm – Energy Pacific (100 MW).
AEMO is not aware of any NEM-connected geothermal power plant proposals currently being pursued
in South Australia. For further information about generating systems and withdrawals, please refer to
the latest AEMO Generation Information page.16
15 AEMO. Generation Information for South Australia, 18 November 2016. Available at: http://www.aemo.com.au/Electricity/Planning/Related-
Information/Generation-Information. Viewed: 18 November 2016. 16 AEMO. Generation Information page: https://www.aemo.com.au/Electricity/National-Electricity-Market-NEM/Planning-and-forecasting/Generation-
information.

SOUTH AUSTRALIAN RENEWABLE ENERGY REPORT
© AEMO 2017 13
2. WIND FARMS
2.1 Summary This chapter presents a historical analysis of South Australian wind generation performance, including
information highlighting the relationship between wind generation and consumption (aggregated across
a financial year), and wind generation and maximum demand (measured at five-minute intervals).
Table 5 below summarises annual wind generation and its annual change from 2012–13 to 2016–17.
For further information on wind farm generation and capacity factors, please refer to the 2017 South
Australian Historical Markets Information Report (SAHMIR).17
Table 5 Total South Australian wind generation
Financial year Annual South Australian wind generation (GWh)
Annual change in wind generation (%)
Annual capacity factor A (%)
2012–13 3,475 33
2013–14 4,088 +18 32
2014–15 4,223 +3 33
2015–16 4,322 +2 31
2016–17 4,343 +0 29
A. Capacity factor means the annual wind generation compared to the theoretical maximum possible, assuming the annual capacity reported.
Key observations include:
Annual wind generation in South Australia increased in line with installed capacity increases from
2012–13 to 2016–17.
The total wind generation only increased 21 GWh from 4,322 GWh to 4,343 GWh in 2016–17 due
to lower wind quality for sustained periods.
2.2 Wind contribution during peak demand Wind generation during peak demand depends on both wind speed and the operational limitations of
wind turbines across the region. Wind is intermittent by nature, with periods of low wind (and in some
cases very high wind18) resulting in low generation output.
When these situations arise in South Australia, residual demand must be met by other types of
generation within the region, or by imports from Victoria.
A review of wind generation performance for the top 10% of five-minute demand dispatch intervals, over
a five-year period, highlights that the output from wind generation is variable between seasons and
across years.
Table 6 provides the 85th percentile level of expected wind generation across summer and winter peak
periods over the past five years.19 On average, for 85% of summer peak demand periods, wind
generation contributed at least 9.4% of its registered capacity (and for winter, 6.7%). The wind
contribution factor is generally higher in summer than in winter.
17 AEMO. 2016 South Australian Historical Market Information Report. Available at: http://aemo.com.au/Electricity/National-Electricity-Market-
NEM/Planning-and-forecasting/South-Australian-Advisory-Functions. 18 The occurrence of high winds, potentially in combination with high temperatures, can often result in mechanical and thermal design limitations
being reached. In extreme cases this may result in individual units shutting down to prevent physical damage. 19 Analysis for wind contribution factors excludes wind generation from the period before a new wind farm first reached 90% of registered capacity.

SOUTH AUSTRALIAN RENEWABLE ENERGY REPORT
© AEMO 2017 14
Table 6 85th percentile wind contribution factor (wind generation as a % of registered wind capacity)
during top 10% seasonal peak demand
Summer peak period % of registered capacity Winter peak period % of registered capacity
2012–13 8.1% 2012 8.9%
2013–14 9.3% 2013 6.0%
2014–15 11.5% 2014 6.1%
2015–16 8.9% 2015 4.9%
2016–17 9.1% 2016 7.7%
Five-year summer average 9.4% Five-year winter average 6.7%
Table 7 compares the minimum expected contribution of wind generation during peak demand periods
across different NEM regions.20
Table 7 Expected wind contribution during peak demand (wind generation as a % of registered
wind capacity)
Minimum expected wind contribution during peak demand A
South Australia Victoria Tasmania New South Wales
Five-year summer average 9.4% 8.1% 10.5% 6.7%
Five-year winter average 6.7% 7.3% 7.3% 3.7%
A. Expressed as a percentage of registered capacity, with peak demand defined as the top 10% of demand periods.
Figures 4 and 5 show wind generation duration curves over the top 10% summer and winter demand
periods for South Australia, with the 85th percentile point indicated. The duration curves provide
additional insight into wind generation during peak demand periods. These figures illustrate that:
For 10% of summer peak demand periods, wind generation contributes about 49.3–54.5% of
its registered capacity, and for 50% of summer peak demand periods, it contributes about
21.8–27.1% of its registered capacity.
For 10% of winter peak demand periods, wind generation contributes about 76.7–83.6% of its
registered capacity, and for 50% of winter peak demand periods, it contributes about 30.7–40.9%
of its registered capacity.
20 Victorian analysis excludes the smaller non-scheduled wind farms in that region, which are registered with AEMO, but not reportable.
Queensland is not included in the analysis at all, as there are no reportable wind farms for that region.

SOUTH AUSTRALIAN RENEWABLE ENERGY REPORT
© AEMO 2017 15
Figure 4 Summer peak demand wind generation duration curve (% of registered wind capacity)
Figure 5 Winter peak demand wind generation duration curve (% of registered wind capacity)
0%
10%
20%
30%
40%
50%
60%
70%
80%
90%
100%
0% 10% 20% 30% 40% 50% 60% 70% 80% 90% 100%
Win
d g
en
era
tio
n (
pe
rce
nta
ge
of
reg
iste
red
ca
pa
cit
y)
Cumulative percentage of time (top 10% demand periods)
2012-13 2013-14 2014-15 2015-16 2016-17 85th percentile
0%
10%
20%
30%
40%
50%
60%
70%
80%
90%
100%
0% 10% 20% 30% 40% 50% 60% 70% 80% 90% 100%
Win
d g
en
era
tio
n (
pe
rce
nta
ge
of
reg
iste
red
ca
pa
cit
y)
Cumulative percentage of time (top 10% demand periods)
2012 2013 2014 2015 2016 85th percentile

SOUTH AUSTRALIAN RENEWABLE ENERGY REPORT
© AEMO 2017 16
2.3 Wind penetration
2.3.1 Wind penetration indices
Internationally, a number of indices are used to measure wind penetration. Table 8 sets out the
calculations for South Australian wind penetration using four common indices. Corresponding with
increases in installed wind generation capacity, all other indices have tended to increase over time. The
increasing trends in energy and instantaneous penetration are also partly attributable to:
The region’s decreasing operational consumption and increasing rooftop PV generation.
Withdrawal of gas- and coal-fired generation.
Changes in minimum demand from year to year.
Table 8 South Australian wind penetration indices (%)
2012–13 2013–14 2014–15 2015–16 2016–17
Capacity penetration: installed capacity as a percentage of total installed generation A
26 30 30 31 36
Energy penetration: ratio of annual wind energy to annual total energy consumption
25 31 32 32 34
Maximum instantaneous penetration (excluding exports): maximum observed ratio of wind energy to demand at any instant in time during the year
87 99 109 119 143
Maximum possible instantaneous penetration: the ratio of installed capacity to minimum demand B
116 126 189 170 213
A. Calculations are based on AEMO registered capacity for all South Australian generating systems at the end of the financial year. However, excluded are generating units that are effectively mothballed for more than six months of the financial year, and wind farms whose output did not yet reach 90% of registered capacity by the end of the financial year.
B. Minimum demand outside the black system event in South Australia.
With reduced consumption and higher wind installed capacity, 2016–17 saw the highest wind
penetration indices compared to the previous four years. Maximum instantaneous penetration reached
143% in 2016–17, and wind supplied 34% of the region’s consumption from the grid.
In 2016–17, the maximum instantaneous wind penetration reached 143% on 30 October 2016 at
around 1:55 pm. At the same time, there were only three thermal generating units online in South
Australia, producing a combined total of approximately 87 MW, and a total of approximately 410 MW
was being exported to Victoria across the two interconnectors (Heywood and Murraylink). Wind
penetration was over 100% on 30 separate days across the year. On these occasions, South Australia
could have supplied its local demand entirely from wind generation, with surplus wind generation
available to export to Victoria.
Periods of 100% (or greater) instantaneous wind penetration occurred for around 139 hours in
2016–17, compared to 24 hours in 2015–16, coinciding with decreased operational consumption and
increased wind generation.
2.3.2 Daily demand, wind generation, and penetration profile
Wind generation and demand vary both seasonally and throughout the day. When high wind generation
coincides with low operational demand, instantaneous wind penetration tends to be maximised.
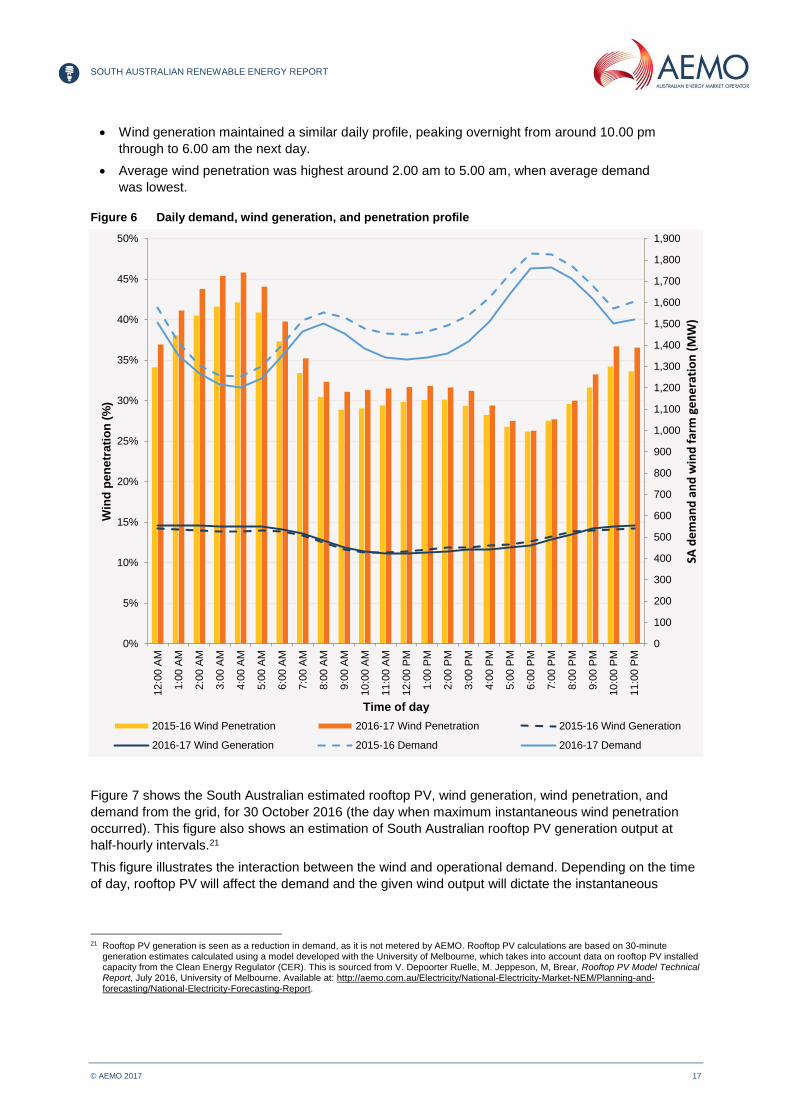
Figure 6 illustrates the average South Australian demand, wind generation, and wind penetration values
throughout the day for 2015–16 and 2016–17. It indicates that:
The average daily demand profile decreased in 2016–17 relative to 2015–16, especially between
8.00 am and 6.00 pm (coinciding with periods of increasing rooftop PV generation, which reduces
demand during the middle of the day).
SOUTH AUSTRALIAN RENEWABLE ENERGY REPORT
© AEMO 2017 17
Wind generation maintained a similar daily profile, peaking overnight from around 10.00 pm
through to 6.00 am the next day.
Average wind penetration was highest around 2.00 am to 5.00 am, when average demand
was lowest.
Figure 6 Daily demand, wind generation, and penetration profile
Figure 7 shows the South Australian estimated rooftop PV, wind generation, wind penetration, and
demand from the grid, for 30 October 2016 (the day when maximum instantaneous wind penetration
occurred). This figure also shows an estimation of South Australian rooftop PV generation output at
half-hourly intervals.21
This figure illustrates the interaction between the wind and operational demand. Depending on the time
of day, rooftop PV will affect the demand and the given wind output will dictate the instantaneous
21 Rooftop PV generation is seen as a reduction in demand, as it is not metered by AEMO. Rooftop PV calculations are based on 30-minute
generation estimates calculated using a model developed with the University of Melbourne, which takes into account data on rooftop PV installed capacity from the Clean Energy Regulator (CER). This is sourced from V. Depoorter Ruelle, M. Jeppeson, M, Brear, Rooftop PV Model Technical Report, July 2016, University of Melbourne. Available at: http://aemo.com.au/Electricity/National-Electricity-Market-NEM/Planning-and-forecasting/National-Electricity-Forecasting-Report.
0
100
200
300
400
500
600
700
800
900
1,000
1,100
1,200
1,300
1,400
1,500
1,600
1,700
1,800
1,900
0%
5%
10%
15%
20%
25%
30%
35%
40%
45%
50%
12:0
0 A
M
1:0
0 A
M
2:0
0 A
M
3:0
0 A
M
4:0
0 A
M
5:0
0 A
M
6:0
0 A
M
7:0
0 A
M
8:0
0 A
M
9:0
0 A
M
10:0
0 A
M
11:0
0 A
M
12:0
0 P
M
1:0
0 P
M
2:0
0 P
M
3:0
0 P
M
4:0
0 P
M
5:0
0 P
M
6:0
0 P
M
7:0
0 P
M
8:0
0 P
M
9:0
0 P
M
10:0
0 P
M
11:0
0 P
M
SA d
em
and
an
d w
ind
far
m g
en
era
tio
n (
MW
)
Win
d p
en
etr
ati
on
(%
)
Time of day
2015-16 Wind Penetration 2016-17 Wind Penetration 2015-16 Wind Generation
2016-17 Wind Generation 2015-16 Demand 2016-17 Demand

SOUTH AUSTRALIAN RENEWABLE ENERGY REPORT
© AEMO 2017 18
penetration. In 2016–17, maximum wind instantaneous penetration occurred in the middle of the day,
when both wind and rooftop PV generation were very high and demand was low.
Figure 7 South Australian wind generation, demand, rooftop PV, and wind penetration on 30 October 2016
2.3.3 Wind penetration duration curves
Figure 8 shows wind penetration duration curves for the past five financial years, indicating that
penetration levels have increased over time. This is due to a combination of increasing wind generation
and declining operational consumption and minimum demand.22
Overall, extremely high penetration levels occur for a small percentage of time, as indicated by the
steep gradient at the left-hand side of the curves.
22 Details of operational consumption and minimum demand trends can be found in the 2017 South Australian Electricity Report (SAER). Available
at: http://www.aemo.com.au/Electricity/National-Electricity-Market-NEM/Planning-and-forecasting/South-Australian-Advisory-Functions.
0
200
400
600
800
1000
1200
1400
1600
1800
2000
2200
2400
2600
2800
3000
3200
0%
10%
20%
30%
40%
50%
60%
70%
80%
90%
100%
110%
120%
130%
140%
150%
SA
de
ma
nd
, w
ind
ge
ne
rati
on
an
d r
oo
fto
p P
V (
MW
)
Win
d P
en
etr
ati
on
(%
)
Time of Day
Rooftop PV (estimated) (MW) Wind Penetration (%)
Wind Generation (MW) Demand (MW)
Wind total registered capacity (MW) Rooftop PV estimated capacity (MW)

SOUTH AUSTRALIAN RENEWABLE ENERGY REPORT
© AEMO 2017 19
Figure 8 Instantaneous wind penetration duration curves
0%
10%
20%
30%
40%
50%
60%
70%
80%
90%
100%
110%
120%
130%
140%
150%
0% 5% 10% 15% 20% 25% 30% 35% 40% 45% 50% 55% 60% 65% 70% 75% 80% 85% 90% 95% 100%
Ins
tan
tan
eo
us
win
d p
en
etr
ati
on
le
ve
l
Percentage of time
2012-13 2013-14 2014-15 2015-16 2016-17

SOUTH AUSTRALIAN RENEWABLE ENERGY REPORT
© AEMO 2017 20
3. ROOFTOP PV
3.1 Rooftop PV capacity Since 2009, South Australian total installed rooftop PV capacity has grown strongly. This is primarily
due to government incentives in the form of rebates and feed-in tariffs, the Small-scale Technology
Certificate (STC) multiplier, falling system costs, and increasing electricity prices. These factors helped
reduce payback periods for consumers, making rooftop PV generation an attractive option for
households, particularly from 2010 to 2012. South Australia’s installed rooftop PV penetration per
household is higher than in any other NEM region.23 More than 30% of South Australian dwellings now
have rooftop PV systems installed.24
In South Australia, the rate of growth of residential rooftop PV systems is forecast25 to decline
because saturation has been reached in some areas, however the business sector is forecast to
have steady growth.
Different drivers between residential and business installations are now becoming important,
particularly:
Residential rooftop PV system uptake continues to be driven by the Federal Small-scale
Renewable Energy Scheme (SRES) and the increasing retail cost of electricity.
Additionally, declining installation costs has improved economic viability for residential rooftop PV
and Integrated PV and Storage Systems (IPSS). For rooftop PV systems, short term cost
reductions are expected to come mainly in non-hardware related “soft costs”, including marketing
and customer acquisition, system design, installation labour, permit and inspection costs, and
installer margins. In the longer term, cost reductions are expected to come from better system
efficiencies and improvements from research and development.26
Uptake in the business sector has been more recent, driven by a combination of programs such as
the Clean Technology Investment Fund and SRES, as well as the continued decrease in PV costs
making the business case more attractive, a continuing focus by businesses on sustainability
initiatives, and an increased marketing push by installers into this sector.
In the 2017 NEM ESOO and 2017 South Australian Electricity Report (SAER)27, AEMO illustrated a
detailed impact of rooftop PV. The breakdown of rooftop PV installed generation capacity by sector with
estimated actuals and forecasts for South Australia from the 2017 NEM ESOO forecast are shown in
Figure 9 and broken down by sector in Table 9.
23 This refers to the proportion of dwellings with a PV system. Source: Australian PV Institute (APVI) Solar Map, funded by the Australian Renewable
Energy Agency, accessed from pv-map.apvi.org.au on 24 August 2015. 24 Analysis taken from: Australian PV Institute (APVI) Solar Map, funded by the Australian Renewable Energy Agency, accessed from pv-
map.apvi.org.au on 11 Aug 2017. 25 AEMO’s forecast of capacity for rooftop PV is based on advice from external consultancy Jacobs. Jacob’s consultancy report “Projections of
uptake of small-scale systems” is available on AEMO’s website: https://www.aemo.com.au/-/media/Files/Electricity/WEM/Planning_and_Forecasting/ESOO/2017/2017-WEM-ESOO-Methodology-Report---Projections-of-Uptake-of-Small-scale-Systems.pdf.
26 Refer to footnote 25. 27 AEMO. 2017 South Australian Electricity Report, October 2017. Available at http://www.aemo.com.au/Electricity/National-Electricity-Market-
NEM/Planning-and-forecasting/South-Australian-Advisory-Functions.

SOUTH AUSTRALIAN RENEWABLE ENERGY REPORT
© AEMO 2017 21
Figure 9 South Australian rooftop PV installed capacity forecasts at the end of each financial year
Table 9 South Australian rooftop PV installed capacity forecasts
Year
Installed capacity (MW)
Residential Business Total
Estimated Actual
Neutral sensitivity
Estimated Actual
Neutral sensitivity
Estimated Actual
Neutral sensitivity
2012–13 389
14
402
2013–14 504
35
539
2014–15 560
53
613
2015–16 613
73
686
2016–17 682
100
781
2017–18
705
112
817
2018–19
751
129
880
2019–20
804
148
952
2020–21
857
166
1,023
2021–22
909
186
1,096
2022–23
962
206
1,168
2023–24
1,016
226
1,242
2024–25
1,071
246
1,316
2025–26
1,125
265
1,390
2026–27
1,179
285
1,464
0
100
200
300
400
500
600
700
800
900
1,000
1,100
1,200
1,300
1,400
1,500
1,600
1,700
1,800
Ins
tall
ed
ca
pa
cit
y (
MW
)
Financial year
Weak Neutral Strong Estimated actuals

SOUTH AUSTRALIAN RENEWABLE ENERGY REPORT
© AEMO 2017 22
3.2 Generation In the NEM, South Australia has the highest ratio of rooftop PV generation to operational consumption.
This is attributed to the region’s high penetration of rooftop PV installations, good solar resources, and
the second lowest operational consumption of all NEM regions.
Table 10 shows the breakdown of estimated rooftop PV generation by sector for the last five years.
Table 10 South Australian rooftop PV generation estimates
Year Estimated generation (GWh)
Business Residential Total
2012–13 12 470 482
2013–14 34 638 672
2014–15 62 758 820
2015–16 87 821 908
2016–17 121 896 1,016
3.3 Rooftop PV contribution during maximum underlying demand
As rooftop PV capacity has increased its penetration into the South Australian market, so too has its
generation contribution to underlying peak demand, increasing at an average of 1.37% a year for the
past five years.
Table 11 shows the percentage of estimated rooftop PV contribution during periods of maximum
underlying demand in South Australia. Rooftop PV calculations are based on 30-minute generation
estimates calculated using a model developed with the University of Melbourne, which takes into
account data on rooftop PV installed capacity from the Clean Energy Regulator (CER).28
Table 11 Rooftop PV contribution during periods of maximum underlying peak demand
Year Contribution of rooftop PV (%) A
Date of underlying peak demand
Total installed rooftop PV capacity as at 30 June (MW)
Total estimated rooftop PV output at time of underlying peak demand (MW)
2012–13 4.05 18/02/2013 16:30 402 130
2013–14 6.13 16/01/2014 16:30 539 211
2014–15 10.06 07/01/2015 13:30 613 304
2015–16 9.91 17/12/2015 16:00 686 315
2016–17 9.52 08/02/2017 16:30 781 313
A. The amount rooftop PV is contributing to the maximum underlying demand per financial year. I.e. rooftop PV generation estimate / (rooftop PV generation estimate plus operational demand), at the time of maximum (rooftop PV generation estimate plus operational demand). Rooftop PV values differ from 2016 SAHMIR due to an improvement in the process to estimate actual generation was performed in AEMO’s 2017 demand forecasts
Figure 10 provides a review of rooftop PV generation performance for the top 10% of 30-minute trading
intervals, over a five-year period. It highlights that the output from rooftop PV generation is variable
between seasons and across years.
28 Rooftop PV methodology paper: : http://aemo.com.au/Electricity/National-Electricity-Market-NEM/~/-/media/CEDBBF70073149ABAD19F3021A17E733.ashx

SOUTH AUSTRALIAN RENEWABLE ENERGY REPORT
© AEMO 2017 23
Table 12 provides the 85th percentile level of expected rooftop PV generation across summer peak
periods over the past five years. On average, for 85% of summer underlying peak demand periods,
rooftop PV generation contributed at least 1.6% of its estimated capacity29.
As expected, the contribution in winter was much lower compared to summer due to fewer daylight
hours. Figure 11 illustrates that at the 85th percentile level of underlying winter peak demand periods,
there was no contribution from rooftop PV.
Figure 10 Summer peak demand rooftop PV generation duration curve (% of estimated rooftop PV
capacity)
Table 12 Rooftop PV generation (% of estimated capacity) during top 10% of summer peak demand
periods
Summer peak period % of estimated capacity at the 85th percentile for summer
2012–13 0.0
2013–14 0.0
2014–15 1.7
2015–16 3.2
2016–17 3.3
Five-year summer average 1.6
29 The contribution factor is a capacity metric, not to be confused with contribution to reducing the peak electricity demand. It presents how much of
rooftop PV was contributing, as a percentage of its estimated installed capacity, during the top 10% of the peak periods of total electricity requirement, over each summer.
0%
10%
20%
30%
40%
50%
60%
70%
80%
90%
100%
0% 10% 20% 30% 40% 50% 60% 70% 80% 90% 100%
Ro
oft
op
PV
ge
ne
rati
on
(p
erc
en
tag
e o
f e
sti
ma
ted
ro
oft
op
PV
ca
pa
cit
y)
Cumulative percentage of time (top 10% of summer demand periods)
2012-13 2013-14 2014-15 2015-16 2016-17 85th Percentile

SOUTH AUSTRALIAN RENEWABLE ENERGY REPORT
© AEMO 2017 24
Figure 11 Winter peak demand rooftop PV generation duration curve (% of estimated rooftop PV capacity)
3.4 Rooftop PV penetration
Figure 12 shows the rooftop PV contribution to total generation in South Australia over the last five
financial years. It highlights that rooftop PV is contributing more each year. Since rooftop PV can only
operate during daylight hours, about 50% of the time there is no generation output.
0%
10%
20%
30%
40%
50%
60%
70%
80%
90%
100%
0% 10% 20% 30% 40% 50% 60% 70% 80% 90% 100%
Ro
oft
op
PV
ge
ne
rati
on
(p
erc
en
tag
e o
f e
sti
ma
ted
ro
oft
op
PV
ca
pa
cit
y)
Cumulative percentage of time (top 10% of winter demand periods)
2013 2014 2015 2016 2017 85th Percentile

SOUTH AUSTRALIAN RENEWABLE ENERGY REPORT
© AEMO 2017 25
Figure 12 Rooftop PV generation compared to total South Australian generation
Table 13 sets out the calculations for South Australian estimated rooftop PV penetration using three
indices. Corresponding with increases in installed rooftop PV generation capacity, all indices have
tended to increase over time.
Table 13 South Australian rooftop PV penetration indices
Description South Australian value
2012–13 2013–14 2014–15 2015–16 2016–17
Capacity penetration: installed capacity as a percentage of total installed generation A
8% 10% 11% 13% 14%
Energy penetration: ratio of annual rooftop PV energy to annual total energy consumption
3% 5% 6% 6% 7%
Maximum instantaneous penetration (excluding exports): maximum observed ratio of rooftop PV energy to demand at any instant in time during the year
21% 29% 37% 37% 41%
A. Calculations are based on AEMO registered capacity for all South Australian generating systems at the end of the financial year, with rooftop PV capacity based on estimates as reported in the 2017 SAER. However, excluded are generating units that are effectively mothballed for more than six months of the financial year, and wind farms whose output did not yet reach 90% of registered capacity by end of the financial year.
In 2016–17, maximum instantaneous rooftop PV penetration (ratio of rooftop PV generation to
underlying demand30) reached 41% during the middle of the day, the highest ratio in the past five years.
30 In this report, it is estimated to be the sum of operational demand plus rooftop PV generation
0%
10%
20%
30%
40%
50%
60%
70%
80%
90%
100%
0% 10% 20% 30% 40% 50% 60% 70% 80% 90% 100%
So
lar
PV
co
ntr
ibu
tio
n (
pe
rce
nta
ge
of
tota
l g
en
era
tio
n)
Cumulative percentage of time
2012-13 2013-14 2014-15 2015-16 2016-17
SOUTH AUSTRALIAN RENEWABLE ENERGY REPORT
© AEMO 2017 26
4. INTERMITTENCY AND DEMAND VARIATIONS
This section provides statistical information on aggregate wind and rooftop PV generation output
variations occurring in response to changing weather conditions. Variation is calculated as the
difference in generation between each five-minute dispatch interval (for wind) and each 30-minute
dispatch interval (for rooftop PV).
The intermittency of wind and rooftop PV generation, leading to sudden changes in the supply and
demand balance, makes managing the power system more challenging.
In terms of power system operation, AEMO considers aggregate wind farm generation variation, rather
than individual wind farm variation. Geographic diversity across a number of wind farms allows for
smoothing, where variation in individual wind farms is partially offset by other nearby wind farms.
Three geographical areas are used across South Australia to facilitate analysis of the impact of
geographical diversity: mid-north31, south-east, and coastal peninsula. The areas are described in
Appendix Section A.1, noting that the term “all South Australian wind farms” in this report refers to all
semi-scheduled and non-scheduled wind farms in the region.
4.1 Wind, rooftop PV, and demand variation
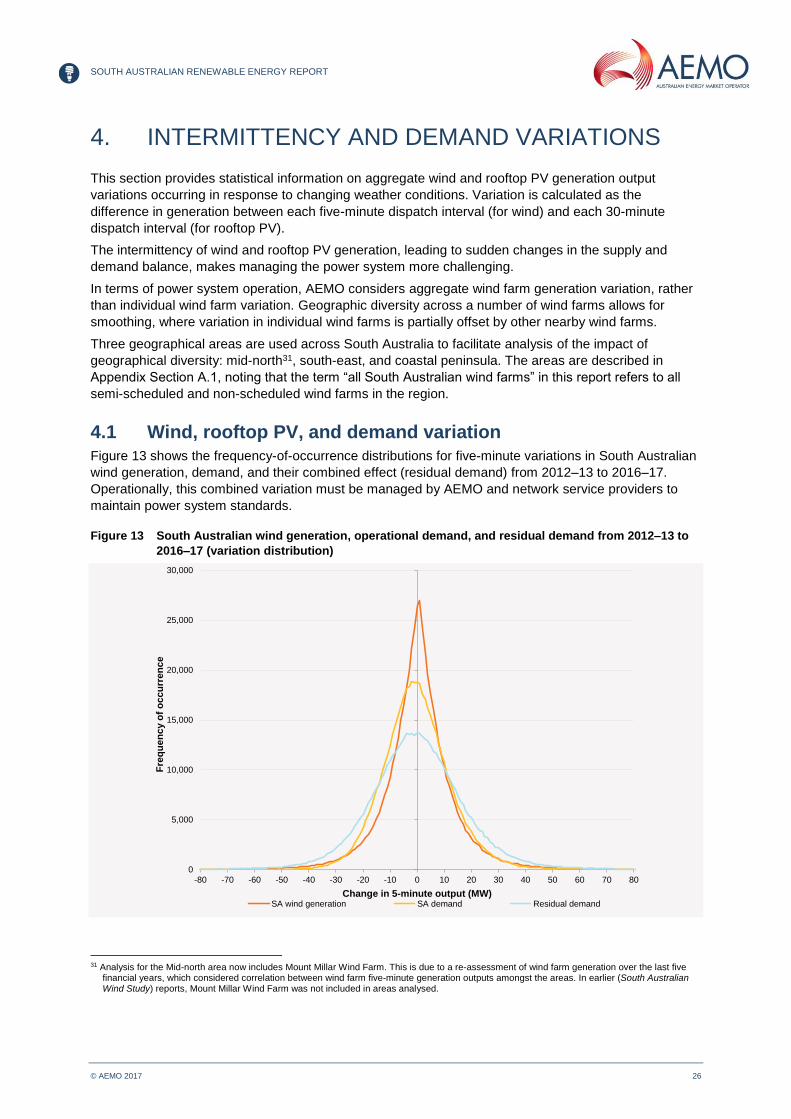
Figure 13 shows the frequency-of-occurrence distributions for five-minute variations in South Australian
wind generation, demand, and their combined effect (residual demand) from 2012–13 to 2016–17.
Operationally, this combined variation must be managed by AEMO and network service providers to
maintain power system standards.
Figure 13 South Australian wind generation, operational demand, and residual demand from 2012–13 to
2016–17 (variation distribution)
31 Analysis for the Mid-north area now includes Mount Millar Wind Farm. This is due to a re-assessment of wind farm generation over the last five
financial years, which considered correlation between wind farm five-minute generation outputs amongst the areas. In earlier (South Australian Wind Study) reports, Mount Millar Wind Farm was not included in areas analysed.
0
5,000
10,000
15,000
20,000
25,000
30,000
-80 -70 -60 -50 -40 -30 -20 -10 0 10 20 30 40 50 60 70 80
Fre
qu
en
cy o
f o
cc
urr
en
ce
Change in 5-minute output (MW)SA wind generation SA demand Residual demand

SOUTH AUSTRALIAN RENEWABLE ENERGY REPORT
© AEMO 2017 27
Wider and flatter distributions indicate a higher frequency of larger changes in output between
five-minute intervals, while steeper and taller distributions indicate a higher frequency of smaller
changes in output. While the wind generation is slightly less variable than South Australian
demand (which has rooftop PV variability included), its combined effect on the residual demand is
more noteworthy.
This residual demand is met by generation other than wind and rooftop PV, with wider distributions
requiring more responsive generating units, which are able to manage large demand variations.
Residual demand change can also be met by changes in power flow on the Heywood or Murraylink
interconnectors.
Analysis of the residual demand each year from 2012–13 to 2016–17, shown in Figure 14 below,
indicates that the distribution has flattened over this period, with fewer changes in the plus or minus
10 MW range, and more changes occurring across larger ranges. This means that, as more wind farms
come online, and rooftop PV installations increase, the residual demand changes in South Australia are
becoming more variable.
Figure 14 South Australian residual demand (variation distribution)
4.1.1 Wind variation across geographical areas
Figure 15 presents key statistical information about five-minute and 10-minute wind generation variation
for the mid-north32, south-east, and coastal peninsula areas in South Australia, and all South Australian
wind farms in aggregate, for 2016–17. Appendix Section A.3 shows tables of the statistics for 2015–16
and 2016–17.
32 Analysis for the mid-north area now includes Mount Millar Wind Farm; in earlier (South Australian Wind Study) reports, Mount Millar Wind Farm
was not included in areas analysed. This is due to a re-assessment of wind farm generation over the last five financial years, which considered correlation between wind farm five-minute generation outputs among the areas.
0
250
500
750
1,000
1,250
1,500
1,750
2,000
2,250
2,500
2,750
3,000
-80 -70 -60 -50 -40 -30 -20 -10 0 10 20 30 40 50 60 70 80
Fre
qu
en
cy o
f o
cc
urr
en
ce
Change in 5-minute output (MW)
2012-13 2013-14 2014-15 2015-16 2016-17

SOUTH AUSTRALIAN RENEWABLE ENERGY REPORT
© AEMO 2017 28
In 2016–17, the mean five-minute variation for all South Australian wind farms in aggregate was
11 MW, and the maximum variation was 763 MW.
Key observations from Figure 15 are:
Wind generation variation differed by area. For 90% of the time, the variation across a 10-minute
period for south-east area was no more than 6% of registered capacity, whereas total South
Australian absolute wind generation variation was no more than 2.6%.
The mean was higher than the median for all areas and all South Australian wind farms, indicating
that while occurrences were skewed toward the lower values, larger fluctuations (though less
frequent) did exist.
Figure 15 Five-minute and 10-minute absolute wind generation variation for 2016–17
Figure 16 shows the full distribution of the five-minute absolute wind generation variation for the
mid-north, south-east, and coastal peninsula areas, and all South Australian wind farms, for 2016–17.
Key observations are:
South Australian wind farms in aggregate had lower absolute wind variation than the individual
areas, indicating that greater wind generation geographical diversity led to lower absolute
wind variation.
The coastal peninsula had the highest absolute wind variation of the three areas for around 80% of
the time. The south-east had the highest absolute wind variation around 8.7% of the time.
In the south-east area, a maximum wind farm variation of 60.3% was observed from one five-
minute period to another.
0.0%
0.5%
1.0%
1.5%
2.0%
2.5%
3.0%
3.5%
4.0%
4.5%
5.0%
5.5%
6.0%
6.5%
5-minute 10-minute 5-minute 10-minute 5-minute 10-minute 5-minute 10-minute
Mid-North South-East Coastal Peninsula Total South Australia
Ab
so
lute
va
ria
tio
n a
s %
of
reg
iste
red
ca
pa
cit
y
10th and 90th Percentile Mean Median

SOUTH AUSTRALIAN RENEWABLE ENERGY REPORT
© AEMO 2017 29
Figure 16 Absolute wind variation as percentage of registered capacity
4.1.2 Maximum wind generation increase and decrease
Table 14 below shows variations in wind generation for three operational timeframes (five-minute,
30-minute, and 60-minute) for the three geographical areas and all South Australian wind farms in
aggregate, from 2012–13 to 2016–17.
Variations at the 30-minute and 60-minute timeframe are larger than within the five-minute timeframe.
South Australian wind farm variations from 2012–13 to 2016–17 show differences year on year, which
can be attributed to seasonal variations in wind speeds, as well as increases in capacity.
0%
5%
10%
15%
20%
25%
30%
35%
40%
45%
50%
55%
60%
65%
0% 10% 20% 30% 40% 50% 60% 70% 80% 90% 100%
5-m
inu
te a
bs
olu
te w
ind
va
ria
tio
n b
y a
rea
(p
erc
en
tag
e o
f re
gis
tere
d c
ap
ac
ity)
Percent of time
Mid-NorthArea
South-EastArea
Coastal PeninsulaArea
Total South Australia
0%
5%
10%
15%
20%
25%
30%
35%
40%
45%
50%
55%
60%
65%
0% 1% 2% 3%

SOUTH AUSTRALIAN RENEWABLE ENERGY REPORT
© AEMO 2017 30
Table 14 Total registered capacity and historical maximum variation outputs (MW) by area
Area 2012–13 2013–14 2014–15 2015–16 2016–17
Mid-north
Registered capacity 688 958 958 958 1,182
Max. 5-minute increase 117 140 170 202 195
Max. 5-minute decrease 122 129 248 200 546
Max. 30-minute increase 275 367 410 366 502
Max. 30-minute decrease 223 381 381 373 656
Max. 60-minute increase 404 434 539 483 540
Max. 60-minute decrease 279 449 416 466 853
South-east
Registered capacity 325 325 325 325 325
Max. 5-minute increase 142 166 169 196 188
Max. 5-minute decrease 158 149 148 174 213
Max. 30-minute increase 275 273 291 294 296
Max. 30-minute decrease 264 268 266 253 314
Max. 60-minute increase 278 268 297 294 316
Max. 60-minute decrease 286 277 287 302 314
Coastal peninsula
Registered capacity 191 191 191 191 191
Max. 5-minute increase 47 65 57 51 58
Max. 5-minute decrease 74 70 61 65 71
Max. 30-minute increase 94 119 93 89 91
Max. 30-minute decrease 136 103 89 104 104
Max. 60-minute increase 104 126 113 110 127
Max. 60-minute decrease 136 132 91 117 103
All South Australia
Registered capacity 1,203 1,473 1,473 1,473 1,698
Max. 5-minute increase 152 162 177 236 248
Max. 5-minute decrease 193 166 215 264 763
Max. 30-minute increase 369 406 408 461 502
Max. 30-minute decrease 325 442 400 534 963
Max. 60-minute increase 489 566 548 571 607
Max. 60-minute decrease 414 490 456 506 1,168
4.2 Rooftop PV variation Figure 17 shows the average daily profile for estimated South Australian rooftop PV generation for the
last five summers and winters. Wider and flatter distributions indicate a higher frequency of larger
changes in output between 30-minute intervals, while steeper and taller distributions indicate a higher
frequency of smaller changes in output.
The figure shows there has been greater generation in the summer months, due to longer daylight
hours and greater solar irradiance. The maximum average rooftop PV output in summer is 450 MW,
which is 135 MW higher than winter.
The increase across financial years is a function of growth in rooftop PV installed capacity. This growth
is shifting the timing of maximum operational peak demand to later in the day.

SOUTH AUSTRALIAN RENEWABLE ENERGY REPORT
© AEMO 2017 31
Figure 17 Daily estimated rooftop PV generation profile
4.2.1 Maximum rooftop PV generation increase and decrease
Analysis of summer and winter daily generation profiles shows the rate of change in generation,
particularly during mornings and evenings, increasing year on year, concurrent with growth in
installed capacity.
Table 15 shows the estimated historical maximum variation in outputs in the last five years. In 2016–17,
South Australian estimated rooftop PV generation varied by up to 190 MW (24.3% of estimated
capacity) across 30-minute periods.
Table 15 Total installed capacity and estimated historical maximum variation outputs (MW)
2012–13 2013–14 2014–15 2015–16 2016–17
Installed capacity 402 539 613 686 781
Max. 30-minute increase 64 236 109 244 190
Max. 30-minute decrease 80 251 118 192 188
4.3 Wind forecast performance This section presents information on the forecast accuracy of the Australian Wind Energy Forecasting
System (AWEFS) for South Australian wind farms.
0
25
50
75
100
125
150
175
200
225
250
275
300
325
350
375
400
425
450
12:0
0 A
M
1:0
0 A
M
2:0
0 A
M
3:0
0 A
M
4:0
0 A
M
5:0
0 A
M
6:0
0 A
M
7:0
0 A
M
8:0
0 A
M
9:0
0 A
M
10:0
0 A
M
11:0
0 A
M
12:0
0 P
M
1:0
0 P
M
2:0
0 P
M
3:0
0 P
M
4:0
0 P
M
5:0
0 P
M
6:0
0 P
M
7:0
0 P
M
8:0
0 P
M
9:0
0 P
M
10:0
0 P
M
11:0
0 P
M
Es
tim
ate
d r
oo
fto
p P
V g
en
era
tio
n (
MW
)
Time of day
Summer 2016-17 Summer 2015-16 Summer 2014-15 Summer 2013-14
Summer 2012-13 Winter 2017 Winter 2016 Winter 2015
Winter 2014 Winter 2013
SOUTH AUSTRALIAN RENEWABLE ENERGY REPORT
© AEMO 2017 32
Under National Electricity Rules clause 3.7B(a), AEMO is required to prepare forecasts of the available
capacity of semi-scheduled generation for the purposes of projected assessment of system adequacy,
dispatch and pre-dispatch (see explanations of these terms below).
This system aims to improve the efficiency of overall NEM dispatch. Greater AWEFS accuracy results
in more accurate and efficient scheduling of other forms of generation.
South Australia has the highest wind penetration in the NEM, so AWEFS accuracy in forecasting South
Australian wind generation may affect the market by contributing to determination of pre-dispatch levels
at different forecast time horizons.
AWEFS produces wind generation forecasts for all NEM semi-scheduled and significant non-scheduled
wind farms, for all NEM forecasting timeframes:
Dispatch (five minutes ahead).
Five-minute pre-dispatch (five-minute resolution, one hour ahead).
Pre-dispatch (30-minute resolution, up to 40 hours ahead).
Short-term Projected Assessment of System Adequacy (ST PASA) (30-minute resolution, seven
days ahead).
Medium-term Projected Assessment of System Adequacy (MT PASA) (daily resolution, two years
ahead).33
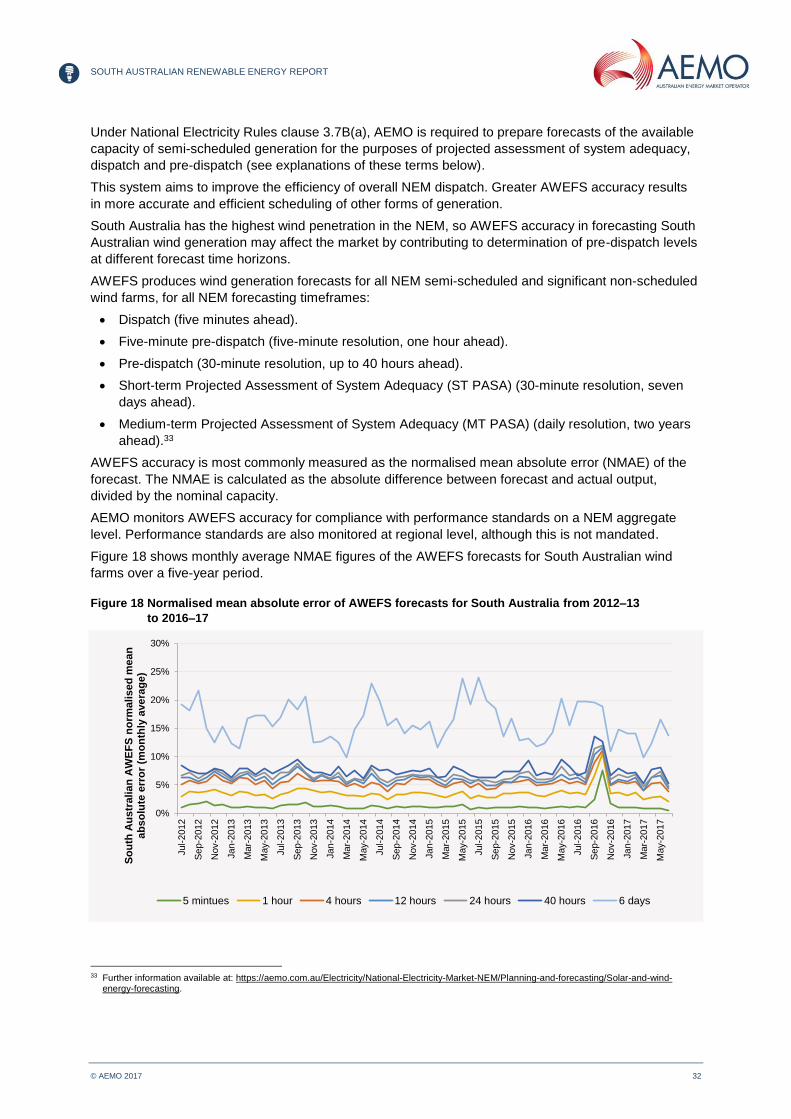
AWEFS accuracy is most commonly measured as the normalised mean absolute error (NMAE) of the
forecast. The NMAE is calculated as the absolute difference between forecast and actual output,
divided by the nominal capacity.
AEMO monitors AWEFS accuracy for compliance with performance standards on a NEM aggregate
level. Performance standards are also monitored at regional level, although this is not mandated.
Figure 18 shows monthly average NMAE figures of the AWEFS forecasts for South Australian wind
farms over a five-year period.
Figure 18 Normalised mean absolute error of AWEFS forecasts for South Australia from 2012–13
to 2016–17
33 Further information available at: https://aemo.com.au/Electricity/National-Electricity-Market-NEM/Planning-and-forecasting/Solar-and-wind-
energy-forecasting.
0%
5%
10%
15%
20%
25%
30%
Jul-2
012
Se
p-2
012
Nov-2
012
Jan
-2013
Mar-
2013
May-2
013
Jul-2
013
Se
p-2
013
Nov-2
013
Jan
-2014
Mar-
2014
May-2
014
Jul-2
014
Se
p-2
014
Nov-2
014
Jan
-2015
Mar-
2015
May-2
015
Jul-2
015
Se
p-2
015
Nov-2
015
Jan
-2016
Mar-
2016
May-2
016
Jul-2
016
Se
p-2
016
Nov-2
016
Jan
-2017
Mar-
2017
May-2
017
So
uth
Au
str
ali
an
AW
EF
S n
orm
ali
se
d m
ea
n
ab
so
lute
err
or
(mo
nth
ly a
ve
rag
e)
5 mintues 1 hour 4 hours 12 hours 24 hours 40 hours 6 days

SOUTH AUSTRALIAN RENEWABLE ENERGY REPORT
© AEMO 2017 33
Forecast accuracy decreases as the forecast horizon extends, corresponding with the decreasing
accuracy of the input weather models. Uncharacteristic NMAE values occurred around September
2016, due to the South Australian black system event.
The Energy Conversion Model (ECM) Guidelines define the static and dynamic information that
semi-scheduled generators provide to AEMO for use in AWEFS and ASEFS. Formal consultation34 on
amendments to the ECM Guidelines for wind and solar farms was completed in late 2016, after which
the ECM Guidelines were updated. AEMO held a stakeholder meeting in early 2017 to progress
implementation of the changes to the ECM.
These amendments were designed to increase accuracy of the AWEFS dispatch forecast by:
Adding a new Supervisory Control and Data Acquisition (SCADA) signal for generators to
communicate any local limitations to their capacity.
Adding a new SCADA signal for generators to communicate any wind turbines being in high wind
speed cut-out.
Refining the definition of the Wind Speed SCADA signal, to recommend the use of a reading that is
an average of all turbine wind speeds.
AEMO continues to work with stakeholders to improve AWEFS dispatch forecasts by improving or
implementing new SCADA signals.
34 Further information available at: http://aemo.com.au/Stakeholder-Consultation/Consultations/Energy-Conversion-Model-Guidelines-Consultation---
Wind-and-Solar-Farms

SOUTH AUSTRALIAN RENEWABLE ENERGY REPORT
© AEMO 2017 34
5. RENEWABLE GENERATION AND MARKET
PRICES
This section provides information on wind and rooftop PV generation and market prices in South
Australia. More general market pricing information is available in the 2017 SAHMIR35.
Figure 19 and Figure 20 plot South Australian average wind generation and estimated rooftop PV
against spot prices for all periods over the past five financial years. All prices are in nominal dollars
unless otherwise indicated.
Market prices are not typically set by renewable generators, however, the volume of wind and rooftop
PV generation does have some influence on spot prices. High spot prices are generally happening at
times with low wind output. Negative prices were most likely to occur when wind generation was high.
Separate analysis on positive and negative prices is provided in sections 5.1.1 and 5.1.2 respectively.
Figure 19 South Australian average wind generation and spot prices (30-minute data for 2012–13
to 2016–17)
35 AEMO. 2016 South Australian Historical Market Information Report. Available at: http://aemo.com.au/Electricity/National-Electricity-Market-
NEM/Planning-and-forecasting/South-Australian-Advisory-Functions.
-$1,000
$0
$1,000
$2,000
$3,000
$4,000
$5,000
$6,000
$7,000
$8,000
$9,000
$10,000
$11,000
0 100 200 300 400 500 600 700 800 900 1,000 1,100 1,200 1,300 1,400
So
uth
Au
str
ali
an
sp
ot
pri
ce
(n
om
ina
l $
/MW
h)
Total South Australian average wind generation (MW)
2012-13 2013-14 2014-15 2015-16 2016-17

SOUTH AUSTRALIAN RENEWABLE ENERGY REPORT
© AEMO 2017 35
Figure 20 South Australian estimated rooftop PV generation and spot prices (30-minute data for 2012–13
to 2016–17)
5.1.1 Positive spot price trading intervals
Figures 21 and 22 show spot prices for the South Australian region, and the corresponding average
wind and estimated rooftop PV generation levels, for each 30-minute dispatch interval from 2012–13 to
2016–17. Spot prices are plotted on a logarithmic axis to better represent the variance.
The volume-weighted average spot price (in nominal dollars) for South Australia wind generation over
each 12-month period is also displayed (as a horizontal line) on each graph for reference.
Excluding very high and very low prices, Figure 21 illustrates that:
Most prices cluster around the mean, and decrease as wind generation output increases.
Very high prices tend to occur when wind generation is low, while low prices tend to occur when
wind generation is high.
In contrast, Figure 22 does not show any correlation between price and the generation level of
rooftop PV.
-$1,000
$0
$1,000
$2,000
$3,000
$4,000
$5,000
$6,000
$7,000
$8,000
$9,000
$10,000
$11,000
0 50 100 150 200 250 300 350 400 450 500 550 600
So
uth
Au
str
ali
an
sp
ot
pri
ce
(n
om
ina
l $
/MW
h)
Total South Australian estimated rooftop PV generation (MW)
2012-13 2013-14 2014-15 2015-16 2016-17

SOUTH AUSTRALIAN RENEWABLE ENERGY REPORT
© AEMO 2017 36
Figure 21 South Australian 30-minute spot prices and average wind generation (positive market prices)
Note: Logarithmic axis
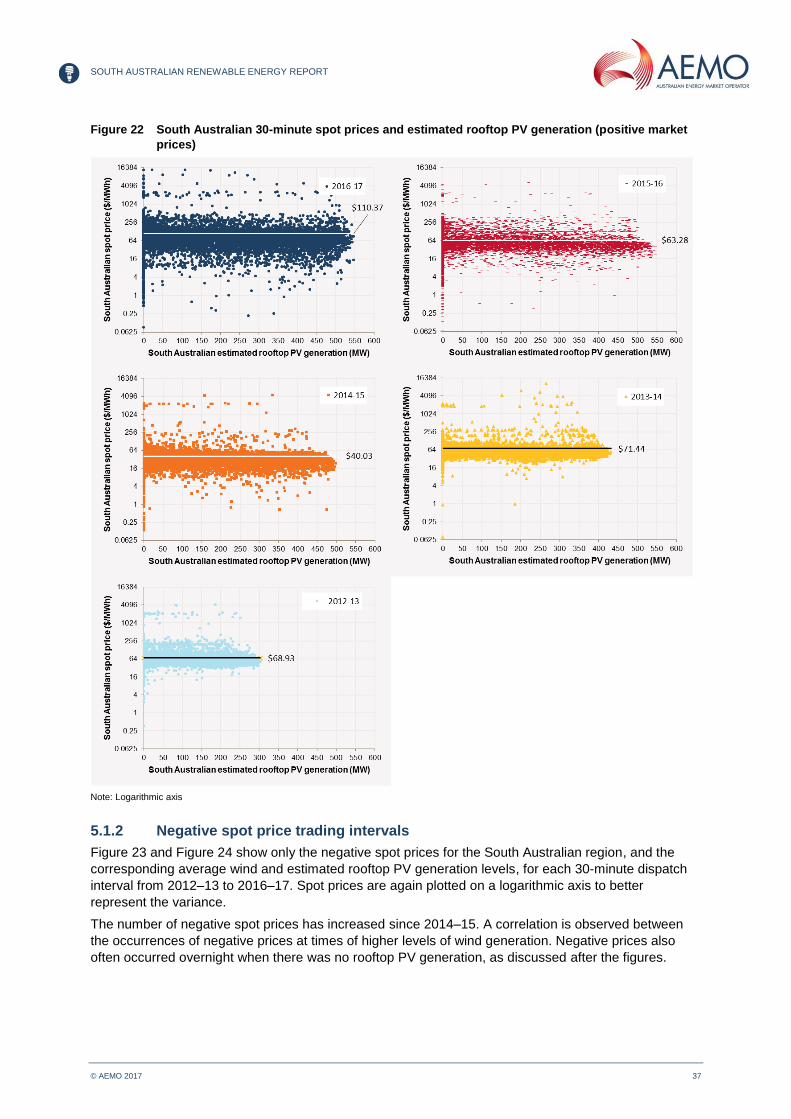
SOUTH AUSTRALIAN RENEWABLE ENERGY REPORT
© AEMO 2017 37
Figure 22 South Australian 30-minute spot prices and estimated rooftop PV generation (positive market
prices)
Note: Logarithmic axis
5.1.2 Negative spot price trading intervals
Figure 23 and Figure 24 show only the negative spot prices for the South Australian region, and the
corresponding average wind and estimated rooftop PV generation levels, for each 30-minute dispatch
interval from 2012–13 to 2016–17. Spot prices are again plotted on a logarithmic axis to better
represent the variance.
The number of negative spot prices has increased since 2014–15. A correlation is observed between
the occurrences of negative prices at times of higher levels of wind generation. Negative prices also
often occurred overnight when there was no rooftop PV generation, as discussed after the figures.

SOUTH AUSTRALIAN RENEWABLE ENERGY REPORT
© AEMO 2017 38
Figure 23 South Australian 30-minute spot prices and average wind generation (negative market prices)
Note: Logarithmic axis

SOUTH AUSTRALIAN RENEWABLE ENERGY REPORT
© AEMO 2017 39
Figure 24 South Australian 30-minute spot prices and estimated rooftop PV generation (negative
market prices)
Note: Logarithmic axis
Negative spot prices by time of day
Figure 25 shows the time of day and wind generation level36 for negative spot prices in 2016–17.
Most negative spot prices occurred either early in the morning, when wind generation was relatively
high, or during the middle of the day when high wind generation coincides with rooftop PV generation at
the peak of daylight hours.
36 Five-minute wind generation data, averaged across the 30-minute interval.

SOUTH AUSTRALIAN RENEWABLE ENERGY REPORT
© AEMO 2017 40
Figure 25 Negative South Australian spot price, average wind and rooftop PV generation by time of
day (2016–17)
Note: Wind total registered capacity excludes Hornsdale stage 1 (102.4 MW) as it was registered late in the financial year and had no material contribution to the analysis.
-$400
-$350
-$300
-$250
-$200
-$150
-$100
-$50
$0
$50
$100
$150
$200
$250
$300
$350
$400
$450
$500
$550
$600
$650
0
100
200
300
400
500
600
700
800
900
1,000
1,100
1,200
1,300
1,400
1,50012:0
0 A
M
1:0
0 A
M
2:0
0 A
M
3:0
0 A
M
4:0
0 A
M
5:0
0 A
M
6:0
0 A
M
7:0
0 A
M
8:0
0 A
M
9:0
0 A
M
10:0
0 A
M
11:0
0 A
M
12:0
0 P
M
1:0
0 P
M
2:0
0 P
M
3:0
0 P
M
4:0
0 P
M
5:0
0 P
M
6:0
0 P
M
7:0
0 P
M
8:0
0 P
M
9:0
0 P
M
10:0
0 P
M
11:0
0 P
M
So
uth
Au
str
ali
an
sp
ot
pri
ce
(n
om
ina
l $
/MW
h)
So
uth
Au
str
ali
an
win
d a
nd
ro
oto
p P
V g
en
era
tio
n (
MW
)
Time of DayWind total registered capacity Wind generationEstimated rooftop PV generation Rooftop PV estimated capacitySpot price (RHS)

SOUTH AUSTRALIAN RENEWABLE ENERGY REPORT
© AEMO 2017 41
APPENDIX A. WIND FARM STATISTICS
A.1 Wind farm capacities
Table 16 Registered capacities of South Australian wind farms
Wind farm Dispatchable unit identifier (DUID)
Registered capacity (MW)A
Classification Area for SARER analysis
Canunda Wind Farm CNUNDAWF 46 Non-scheduled South-east
Cathedral Rocks Wind Farm CATHROCK 66 Non-scheduled Coastal peninsula
Clements Gap Wind Farm CLEMGPWF 57 Semi-scheduled Mid-north
Hallett 1 (Brown Hill) HALLWF1 94.5 Semi-scheduled Mid-north
Hallett 2 (Hallett Hill) HALLWF2 71.4 Semi-scheduled Mid-north
Hallett 4 (North Brown Hill Wind Farm) NBHWF1 132.3 Semi-scheduled Mid-north
Hallett 5 (The Bluff) Wind Farm BLUFF1 52.5 Semi-scheduled Mid-north
Hornsdale Stage 1 Wind Farm HDWF1 102.4 Semi-scheduled Mid-north
Hornsdale Stage 2 Wind Farm HDWF2 102.4 Semi-scheduled Mid-north
Lake Bonney 2 LKBONNY2 159 Semi-scheduled South-east
Lake Bonney 3 LKBONNY3 39 Semi-scheduled South-east
Lake Bonney Wind Farm LKBONNY1 80.5 Non-scheduled South-east
Mount Millar Wind Farm MTMILLAR 70 Non-scheduled Mid-northB
Snowtown Stage 2 Wind Farm North SNOWNTH1 144 Semi-scheduled Mid-north
Snowtown Stage 2 Wind Farm South SNOWSTH1 126 Semi-scheduled Mid-north
Snowtown Wind Farm SNOWTWN1 99 Semi-scheduled Mid-north
Starfish Hill Wind Farm STARHLWF 34.5 Non-scheduled Coastal peninsula
Waterloo Wind Farm WATERLWF 131 Semi-scheduled Mid-north
Wattle Point Wind Farm WPWF 90.75 Non-scheduled Coastal peninsula
A. Registered capacity sourced from AEMO’s NEM Registration and Exemption List, 28 September 2017. Available: https://www.aemo.com.au/Electricity/National-Electricity-Market-NEM/Participant-information/Current-participants/Current-registration-and-exemption-lists.
B. Mount Millar Wind Farm has been reclassified to the mid-north analysis area – it was not included in area analysis in the 2015 South Australian Wind Study Report.

SOUTH AUSTRALIAN RENEWABLE ENERGY REPORT
© AEMO 2017 42
A.2 Wind farm capacity factors
Table 17 Financial year capacity factors of South Australian wind farms
Wind farm Schedule type
DUID 2012–13 2013–14 2014–15 2015–16 2016–17
Capacity factor (%)
Capacity factor (%)
Capacity factor (%)
Capacity factor (%)
Capacity factor (%)
Canunda Non-scheduled
CNUNDAWF 28.2 31.0 29.3 27.9 27.9
Cathedral Rocks Non-scheduled
CATHROCK 30.3 34.0 29.4 29.1 26.1
Clements Gap Semi-scheduled
CLEMGPWF 33.4 36.0 33.8 34.6 31.7
Hallett 1 (Brown Hill) Semi-scheduled
HALLWF1 40.1 42.2 37.2 37.8 33.6
Hallett 2 (Hallett Hill) Semi-scheduled
HALLWF2 41.0 40.9 37.3 38.7 34.9
Hallett 4 (North Brown Hill) Semi-scheduled
NBHWF1 36.7 40.8 36.2 38.3 33.1
Hallett 5 (The Bluff) Semi-scheduled
BLUFF1 33.8 36.4 29.6 32.6 26.6
Hornsdale Stage 1 Semi-scheduled
HDWF1
38.2
Hornsdale Stage 2 Semi-scheduled
HDWF2
25.8
Lake Bonney Non-scheduled
LKBONNY1 27.0 29.2 27.2 25.8 25.7
Lake Bonney Stage 2 Semi-scheduled
LKBONNY2 27.2 29.7 28.4 27.4 27.5
Lake Bonney Stage 3 Semi-scheduled
LKBONNY3 27.8 29.0 27.4 27.1 27.9
Mount Millar Non-scheduled
MTMILLAR 30.2 33.3 30.5 29.8 26.2
Snowtown Semi-scheduled
SNOWTWN1 43.1 44.7 38.4 39.2 34.9
Snowtown Stage 2A Semi-scheduled
SNOWNTH1 and SNOWSTH1
0.0 52.5 34.9 37.0 34.2
Starfish Hill Non-scheduled
STARHLWF 22.6 31.3 28.4 28.5 19.8
Waterloo Semi-scheduled
WATERLWF 32.0 34.8 30.1 30.7 28.2
Wattle Point Non-scheduled
WPWF 31.2 37.0 33.3 33.8 29.3
Data taken from the 2017 SAHMIR. Available at: http://aemo.com.au/Electricity/National-Electricity-Market-NEM/Planning-and-forecasting/South-Australian-Advisory-Functions. A. Snowtown Stage 2 capacity factor is calculated for Snowtown Stage 2 North and Snowtown Stage 2 South wind farms combined.

SOUTH AUSTRALIAN RENEWABLE ENERGY REPORT
© AEMO 2017 43
A.3 Wind generation variation
Table 18 Key statistical characteristics of wind generation variation for 2016–17
South Australian wind farm area
Mid-north South-east Coastal peninsula Total South Australia
5-minute 10-minute 5-minute 10-minute 5-minute 10-minute 5-minute 10-minute 30-minute
Key statistical characteristics of absolute variation (% of registered capacity)
Mean 0.8 1.3 1.4 2.4 1.2 1.9 0.7 1.1 2.4
Median 0.5 0.8 0.7 1.1 0.7 1.1 0.5 0.8 1.7
Standard deviation 1.0 1.5 2.4 3.9 1.5 2.5 0.8 1.3 2.5
Key statistical characteristics of absolute variation (megawatt equivalent)
Mean 8.5 13.7 4.7 7.8 2.2 3.6 11 18.1 38.6
Median 5.3 8.8 2.1 3.5 1.3 2.1 7.1 11.9 26.8
Standard deviation 10.6 16.3 7.8 12.8 2.9 4.7 13.1 20.5 39.9
Absolute variation (%)
90th percentile 0.1 0.1 0.0 0.0 0.0 0.1 0.1 0.1 0.2
10th percentile 1.8 3.0 3.6 6.0 2.7 4.5 1.6 2.6 5.6
5th percentile 2.5 4.0 5.5 9.2 3.8 6.3 2.2 3.5 7.3
1st percentile 4.5 7.1 11.6 19.3 7.0 11.6 3.9 6.1 11.6
Maximum 51.5 61.9 65.7 92.9 37.3 51.3 48.4 61.1 61.1
Table 19 Key statistical characteristics of wind generation variation for 2015–16
South Australian wind farm area
Mid-north South-east Coastal peninsula Total South Australia
5-minute 10-minute 5-minute 10-minute 5-minute 10-minute 5-minute 10-minute 30-minute
Key statistical characteristics of absolute variation (% of registered capacity)
Mean 0.7 1.3 1.2 2.2 1.3 2.1 0.6 1.1 2.5
Median 0.5 0.9 0.6 1.1 0.8 1.3 0.4 0.8 1.8
Standard deviation 0.9 1.5 1.9 3.3 1.6 2.5 0.7 1.2 2.4
Key statistical characteristics of absolute variation (megawatt equivalent)
Mean 7.2 12.6 4.0 7.0 2.5 4.1 9.4 16.4 36.5
Median 4.8 8.4 2.1 3.6 1.6 2.6 6.4 11.3 25.9
Standard deviation 8.3 14.2 6.2 10.6 3.0 4.9 10.2 17.4 36.1
Absolute variation
90th percentile 0.1 0.1 0.0 0.0 0.1 0.1 0.1 0.1 0.3
10th percentile 1.7 3.0 3.0 5.2 3.0 5.0 1.4 2.5 5.6
5th percentile 2.3 4.0 4.4 7.8 4.2 6.9 1.9 3.3 7.3
1st percentile 3.9 6.8 9.0 15.7 7.4 12.0 3.2 5.4 11.1
Maximum 21.1 31.3 60.3 74.7 34.0 46.6 17.9 30.7 36.2

SOUTH AUSTRALIAN RENEWABLE ENERGY REPORT
© AEMO 2017 44
MEASURES AND ABBREVIATIONS
Units of measure
Abbreviation Unit of measure
$ Australian dollar
GWh gigawatt hour
hr hour
kW kilowatt
MW megawatt
MWh megawatt hour
Abbreviations
Abbreviation Expanded name
AEMO Australian Energy Market Operator
ASEFS Australian Solar Energy Forecasting System
AWEFS Australian Wind Energy Forecasting System
DUID Dispatchable unit identifier
ECM Energy Conversion Model
ESOO Electricity Statement of Opportunities
MT PASA Medium-term Projected Assessment of System Adequacy
NEM National Electricity Market
NER National Electricity Rules
NMAE Normalised Mean Absolute Error
PV Photovoltaic
RRP Regional Reference Price
SAER South Australian Electricity Report
SAHMIR South Australian Historical Market Information Report
SAWSR South Australian Wind Study Report
SCADA Supervisory Control and Data Acquisition
ST PASA Short-term Projected Assessment of System Adequacy
SOUTH AUSTRALIAN RENEWABLE ENERGY REPORT
© AEMO 2017 45
GLOSSARY
The 2017 SARER uses many terms that have meanings defined in the National Electricity Rules (NER).
The NER meanings are adopted unless otherwise specified. Other key terms used in the 2017 SARER
are listed below.
Term Definition
Absolute variation The total variation, regardless of whether it is positive (an increase) or negative (a decrease).
ASEFS Australian Solar Energy Forecasting System. An AEMO system that produces solar generation forecasts for large solar power stations.
AWEFS Australian Wind Energy Forecasting System. A system used by AEMO to produce wind generation forecasts ranging from five minutes ahead to two years ahead.
Capacity penetration The ratio of registered wind capacity to registered total generation capacity, excluding generating units that were effectively mothballed for at least the last six months of the financial year in consideration. This gives a relative measure of wind generation potential compared to the rest of the generating systems.
Cleared supply The National Electricity Market Dispatch Engine (NEMDE) dispatches generation at five-minute intervals. Cleared Supply represents the dispatched supply values.
Energy penetration The ratio of annual wind generation to annual total consumption from the grid (excludes any net interconnector exports).
Maximum demand An absolute value (MW) of demand, observed to be the maximum during a specified time period. Generally the maximum demand is the maximum over an annual or summer period, though any period (e.g. daily) can be defined.
Maximum instantaneous penetration
The maximum observed ratio of wind generation output to demand during the year. This captures the extreme of wind generation relative to other generation, including interconnector exports.
Maximum possible instantaneous penetration
The ratio of maximum possible wind generation output (registered capacity) to minimum demand, assuming zero interconnector exports. Wind capacity is the total registered at the time of minimum demand during the year.
Minimum demand An absolute value (MW) of demand, the lowest amount of electrical power delivered, or forecast to be delivered, over a defined period (day, week, month, season, or year).
MT PASA Medium-term Projected Assessment of System Adequacy. The projected assessment of system adequacy covering two years and in a daily resolution.
Mothballed A generation unit that has been withdrawn from operation but may return to service at some point in the future.
Nameplate capacity The maximum continuous output or consumption in MW of an item of equipment as specified by the manufacturer, or as subsequently modified.
Operational Operational reporting includes the electrical energy used by all residential, commercial, and large industrial consumption, and transmission losses (as supplied by scheduled, semi-scheduled and significant non-scheduled generating units). Significant non-scheduled generating units in South Australia are Angaston, Port Stanvac 1, Port Stanvac 2 and all non-scheduled wind farms. It does not include the output of small non-scheduled generating systems, typically less than 30 MW capacity.
Peak demand The time period over which demand is observed to peak above a nominal value, during the total time period specified.
SCADA Supervisory Control and Data Acquisition. A system that gathers real-time data from remote terminal units and other communication sources in the field and enables operators to control field devices from their consoles.
ST PASA Short-term Projected Assessment of System Adequacy. The projected assessment of system adequacy covering seven days ahead and in a 30-minute resolution.
Spot price The price in a trading interval for one megawatt hour (MWh) of electricity at a regional reference node. Prices are calculated for each dispatch interval (five minutes) over the length of a trading interval (a 30-minute period). The six dispatch prices are averaged each half hour to determine the price for the trading interval.
Summer For the purposes of the analysis in this report, 1 November to 31 March.
Summer peak The top 10% of demand over the summer period on a five-minute basis.

SOUTH AUSTRALIAN RENEWABLE ENERGY REPORT
© AEMO 2017 46
Term Definition
Wind penetration The relative amount of wind energy or capacity compared to total energy or capacity. This can be measured in a number of different ways (see Section 2.6). Also see glossary entries for Capacity penetration, Energy penetration, Maximum instantaneous penetration, and Maximum possible instantaneous penetration.
Winter For the purposes of the analysis in this report, 1 June to 31 August.
Winter peak The top 10% of demand over the winter period on a five-minute basis.