Embed Size (px)
Citation preview
SouthCarolina's
Forests, 2011Anita K. Rose
United States Department of Agriculture
Forest Service
SouthernResearch Station
Resource BulletinSRS–208
About the Author
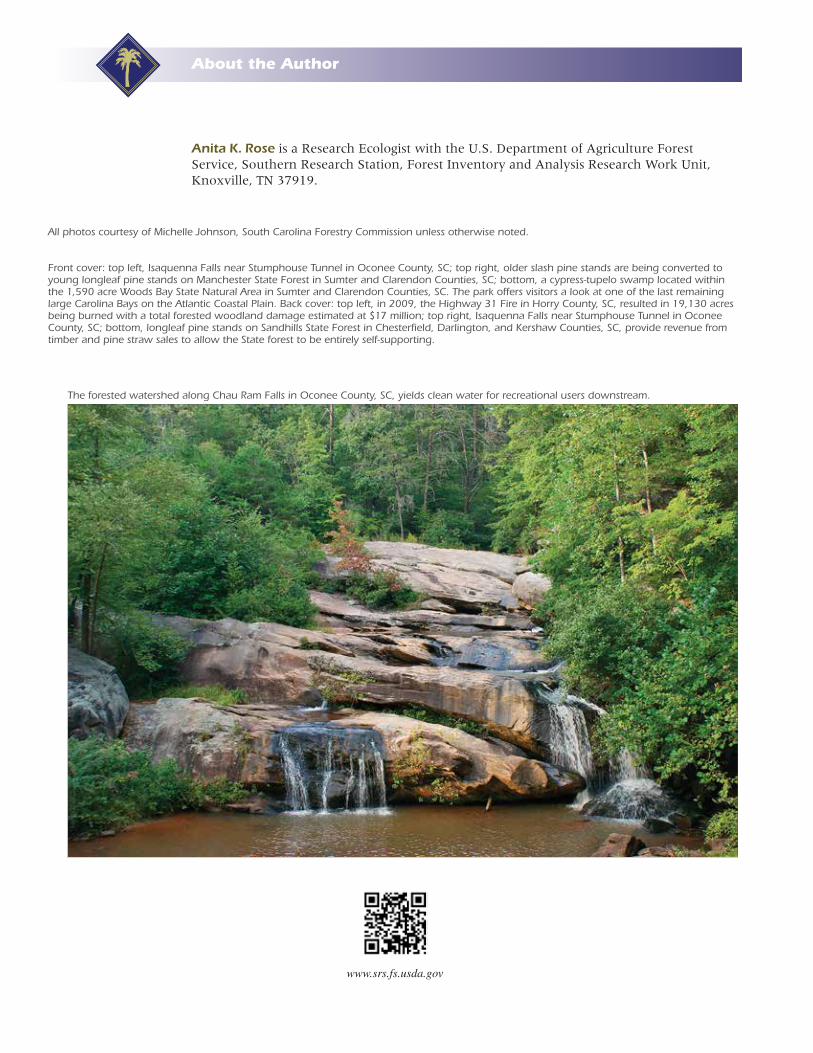
All photos courtesy of Michelle Johnson, South Carolina Forestry Commission unless otherwise noted.
Front cover: top left, Isaquenna Falls near Stumphouse Tunnel in Oconee County, SC; top right, older slash pine stands are being converted to young longleaf pine stands on Manchester State Forest in Sumter and Clarendon Counties, SC; bottom, a cypress-tupelo swamp located within the 1,590 acre Woods Bay State Natural Area in Sumter and Clarendon Counties, SC. The park offers visitors a look at one of the last remaining large Carolina Bays on the Atlantic Coastal Plain. Back cover: top left, in 2009, the Highway 31 Fire in Horry County, SC, resulted in 19,130 acres being burned with a total forested woodland damage estimated at $17 million; top right, Isaquenna Falls near Stumphouse Tunnel in Oconee County, SC; bottom, longleaf pine stands on Sandhills State Forest in Chesterfield, Darlington, and Kershaw Counties, SC, provide revenue from timber and pine straw sales to allow the State forest to be entirely self-supporting.
Anita K. Rose is a Research Ecologist with the U.S. Department of Agriculture Forest Service, Southern Research Station, Forest Inventory and Analysis Research Work Unit, Knoxville, TN 37919.
www.srs.fs.usda.gov
The forested watershed along Chau Ram Falls in Oconee County, SC, yields clean water for recreational users downstream.
SOUTHCAROLINA'S
Forests, 2011Anita K. Rose
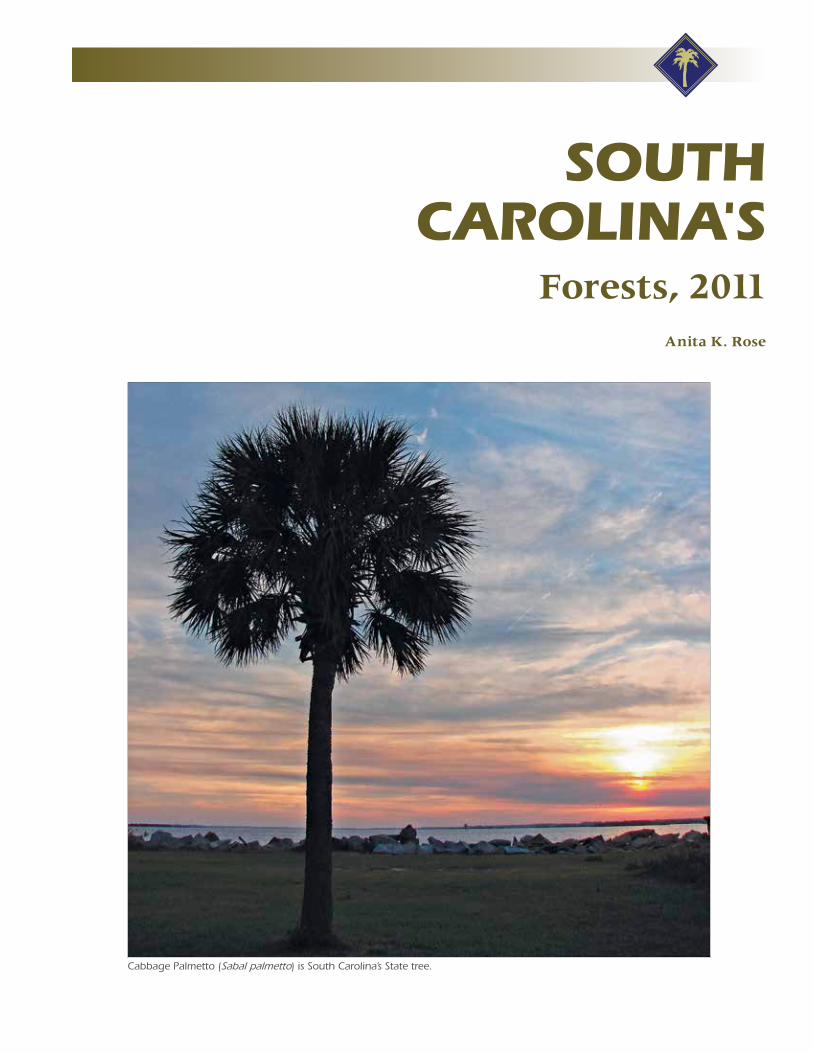
Cabbage Palmetto (Sabal palmetto) is South Carolina’s State tree.

ii
FOREWORD
The U.S. Department of Agriculture Forest Service, Southern Research Station’s Forest Inventory and Analysis (FIA) research work unit and cooperating State forestry agencies conduct annual forest inventories of resources in the 13 Southern States (Alabama, Arkansas, Florida, Georgia, Kentucky, Louisiana, Mississippi, North Carolina, Oklahoma, South Carolina, Tennessee, Texas, and Virginia), the Commonwealth of Puerto Rico, and the U.S. Virgin Islands. In order to provide more frequent and nationally consistent information on America’s forest resources, all research stations and their respective FIA work units conduct annual surveys with a common sample design. These surveys are mandated by law through the Agricultural Research Extension and Education Reform Act of 1998 (Farm Bill).
The primary objective in conducting these inventories is to gather the multi-resource information needed to formulate sound forest policies, provide information for economic development, develop forest programs, and provide a scientific basis to monitor forest ecosystems. These data are used to provide an overview of forest resources that may include, but are not limited to, forest area, forest ownership, forest type, stand structure, timber volume, growth, removals, mortality, management activity, down woody material, and invasive species. The information presented is applicable at the State and survey unit level;
although it provides the background for more intensive studies of critical situations, it is not designed to reflect resource conditions at small scales.
More information about Forest Service resource inventories is available in “Forest Resource Inventories: An Overview” (U.S. Department of Agriculture Forest Service 1992). More detailed information about sampling methodologies used in the annual FIA inventories can be found in “The Enhanced Forest Inventory and Analysis Program–National Sampling Design and Estimation Procedures” (Bechtold and Patterson 2005).
Data tables included in FIA reports are designed to provide an array of forest resource estimates, but additional tables can be obtained at http://fia.fs.fed.us/tools-data/default.asp. Additional information about the FIA program can be obtained at http://fia.fs.fed.us/.
Additional information about any aspect of this or other FIA surveys may be obtained from:
Forest Inventory and AnalysisResearch Work UnitU.S. Department of AgricultureForest ServiceSouthern Research Station4700 Old Kingston PikeKnoxville, TN 37919Telephone: 865-862-2000William G. BurkmanProgram Manager
About Forest Inventory and Analysis Inventory Reports
iii
ACKNOWLEDGMENTS
The author gratefully acknowledges the staff of the South Carolina Forestry Commission (SCFC) who provided reviews and comments on an earlier draft of this report. In addition, Helen Beresford was instrumental in providing many of the tables contained within this report. I would also like to thank Anne Jenkins and her staff, Janet Griffin and Charlene Walker. Their efforts in checking for errors and in formatting text, tables, and figures are greatly appreciated. FIA thanks the SCFC for partnering with our program in conducting data collection for the survey that the author reports here. FIA also thanks other public agencies and the many private landowners who provided access to measurement plots.
The following people made field measurements for this survey. FIA appreciates their hard work and their consistent efforts to obtain high-quality data.
Wesley BouknightAlan BowenClay ChaplinTrey CoxPhil DunhamDustin GibbonsRyan McCrackenRyan McIntyreMatt MyersJeff RigginJeremy RogersByron RomingerGretchen SpauldingDena Whitesides
About Forest Inventory and Analysis Inventory Reports
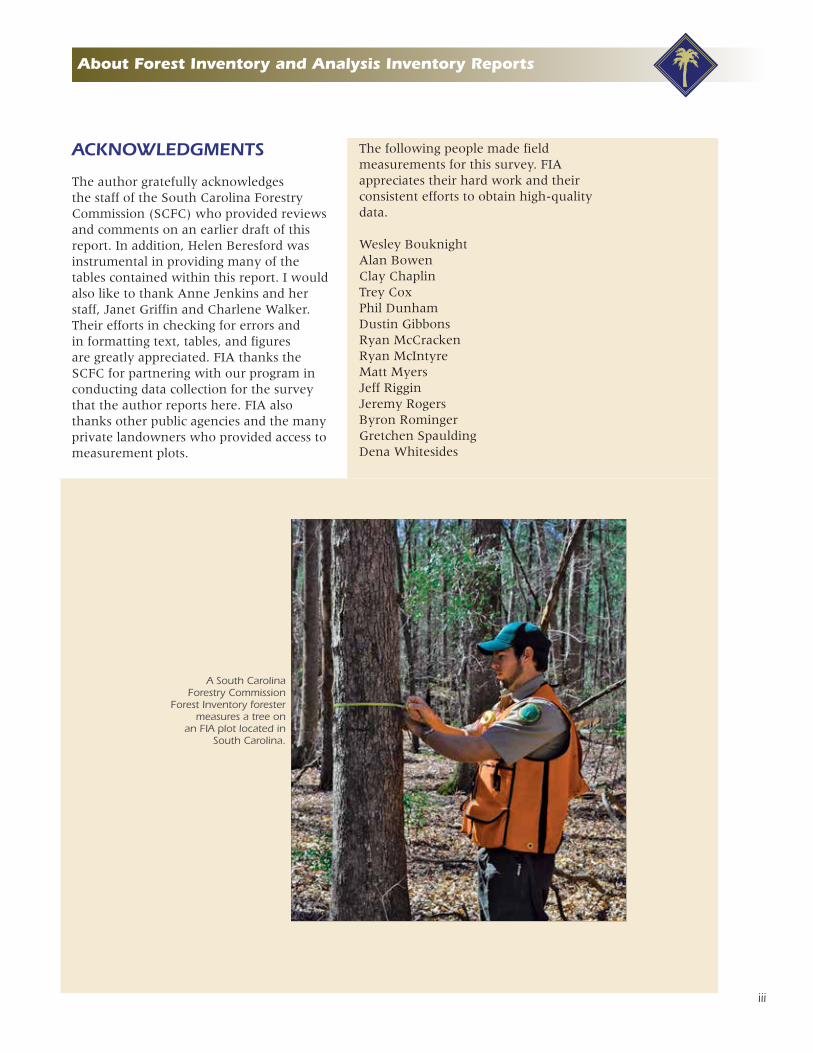
A South Carolina Forestry Commission
Forest Inventory forester measures a tree on
an FIA plot located in South Carolina.
iv
Table Rock watershed in Pickens County, SC.

v
Contents
Page
Foreword ....................................................................................................................... ii
Acknowledgments ........................................................................................................ iii
List of Figures ............................................................................................................... vi
List of Tables ................................................................................................................. vii
Highlights from the Tenth Forest Inventory of South Carolina .................................. xi
Introduction .................................................................................................................. 1
Forest Area .................................................................................................................... 2
Number of Trees, Volume, and Biomass...................................................................... 10
Growth and Removals .................................................................................................. 13
Forest Health ................................................................................................................ 15
Literature Cited ............................................................................................................. 20
Glossary ......................................................................................................................... 23
Appendix A—Inventory Methods ................................................................................ 33
Appendix B—Data Reliability....................................................................................... 36
Appendix C—Supplemental Tables .............................................................................. 42
vi
Text Figures
Figure 1—Counties and forest survey units in South Carolina ......................................... 1
Figure 2—Area of forest land by private owner category and survey year, South Carolina ................................................................................................................ 3
Figure 3—Distribution of the area and owners of family owned private forest land by amount of forest land owned, National Woodland Owner Survey, South Carolina, 2013 ........................................................................................... 4
Figure 4—Area of forest land by forest-type group (not including nonstocked stands) and survey year, South Carolina .......................................................................... 7
Figure 5—Area of timberland by stand-size class (not including nonstocked stands) and survey year, South Carolina. Timberland is used here for comparison purposes, as forest land estimates are not available for surveys prior to 2001................... 8
Figure 6—Forest land area by stand age class (not including nonstocked stands) and survey year, South Carolina ...................................................................................... 9
Figure 7—All-live softwood volume on forest land by diameter class and survey year, South Carolina ............................................................................................. 11
Figure 8—All-live hardwood volume on forest land by diameter class and survey year, South Carolina ............................................................................................. 11
Figure 9—Average annual net growth and removals by major species group and survey year, South Carolina ...................................................................................... 13
Appendix Figures
Figure A.1—Layout of fixed-radius plot .......................................................................... 34
List of Figures
Page
vii
List of Tables
Page
Text Tables
Table 1—Area of forest land by survey unit and year, South Carolina .............................. 2
Table 2—Estimated area and number of family forest and woodland ownerships (10+ acres) in South Carolina by size of forest/woodland holdings, 2011–13 ..................... 3
Table 3—Estimated area and number of family forest and woodland ownerships (10+ acres) in South Carolina by reason for owning forest and woodland, 2011–13. Numbers include ownerships that rated an objective as very important or important on a five-point Likert scale. ............................................................................. 5
Table 4—Estimated area and number of family forest and woodland ownerships (10+ acres) in South Carolina by recent (past 5 years) forestry activity, 2011–13 ................ 6
Table 5—Estimated area and number of family forest and woodland ownerships (10+ acres) in South Carolina by future (next 5 years) forestry activity, 2011–13. Numbers include ownerships that rated an activity as extremely likely or likely on a five-point Likert scale .................................................................................................... 7
Table 6—Area of forest land by forest-type group and survey unit, South Carolina, 2011 ....................................................................................................... 8
Table 7—Area of forest land treated and regenerated annually by survey period, South Carolina ................................................................................................................ 9
Table 8—Top 25 tree species dominant for number of stems (≥1.0 inch d.b.h.) on forest land by survey year, South Carolina .................................................................. 10
Table 9—Top 25 tree species dominant for all live volume (≥5.0 inch d.b.h.) on forest land by survey year, South Carolina .................................................................. 11
Table 10—Volume of live trees per acre on forest land by survey year, unit, and ownership group, South Carolina............................................................................. 12
Table 11—Average annual net growth per acre by major species group and stand origin, South Carolina, 2011 .................................................................................. 13
Table 12—Occurrence of nonnative invasive plants by species, South Carolina, 2011 ....................................................................................................... 15
Table 13—Crown density, crown dieback, and foliage transparency of trees (≥5.0inches d.b.h., n ≥10) by species, South Carolina, 2010 ............................................. 17
Table 14—Volume of down woody material by survey unit, South Carolina, 2010 .......... 18
Table 15—Mean fuel loading on forest land by forest-type group (n ≥5 conditions) and fuel class, South Carolina, 2010 ................................................................................ 19
Table 16—Number of biosites and plants evaluated for ozone-induced foliar injury, by year, South Carolina ................................................................................................... 19
viii
List of Tables
Page
Appendix Tables
Table B.1—Results of various blind checks for South Carolina and the Southern Region, 2011 .................................................................................................... 37
Table B.2—Results of various blind checks for South Carolina and the Southern Region, 2011 .................................................................................................... 39
Table B.3—Results of various blind checks for South Carolina and the Southern Region, 2011 .................................................................................................... 40
Table B.4—Statistical reliability for South Carolina, 2011 .................................................. 41
Table C.1—Area by survey unit and land status, South Carolina, 2011............................. 42
Table C.2—Area of forest land by ownership class and land status, South Carolina, 2011 ....................................................................................................... 43
Table C.3—Area of forest land by forest-type group and site productivity class, South Carolina, 2011 ....................................................................................................... 44
Table C.4—Area of forest land by forest-type group and ownership group, South Carolina, 2011 ....................................................................................................... 45
Table C.5—Area of forest land by forest-type group and stand-size class, South Carolina, 2011 ....................................................................................................... 46
Table C.6—Area of forest land by forest-type group and stand age class, South Carolina, 2011 ....................................................................................................... 47
Table C.7—Area of forest land by forest-type group and stand origin, South Carolina, 2011 ....................................................................................................... 48
Table C.8—Area of forest land disturbed annually by forest-type group and disturbance class, South Carolina, 2011 .................................................................... 49
Table C.9—Area of forest land treated annually by forest-type group and treatment class (cutting), South Carolina, 2011................................................................. 50
Table C.10—Area of forest land treated annually by forest-type group and treatment class (regeneration), South Carolina, 2011 ........................................................ 51
Table C.11—Number of live trees on forest land by species group and diameter class, South Carolina, 2011 ................................................................................ 52
Table C.12—Net volume of live trees on forest land by ownership class and land status, South Carolina, 2011 .................................................................................... 53
Table C.13—Net volume of live trees on forest land by forest-type group and stand-size class, South Carolina, 2011 .............................................................................. 54
ix
List of Tables
Page
Table C.14—Net volume of live trees on forest land by species group and ownership group, South Carolina, 2011 ........................................................................... 55
Table C.15—Net volume of live trees on forest land by species group and diameter class, South Carolina, 2011 ............................................................................... 56
Table C.16—Net volume of live trees on forest land by forest-type group and stand origin, South Carolina, 2011 ................................................................................... 57
Table C.17—Net volume of growing-stock trees on timberland by species group and diameter class, South Carolina, 2011 ................................................... 58
Table C.18—Net volume of sawtimber trees on timberland by species group and diameter class, South Carolina, 2011 ......................................................................... 59
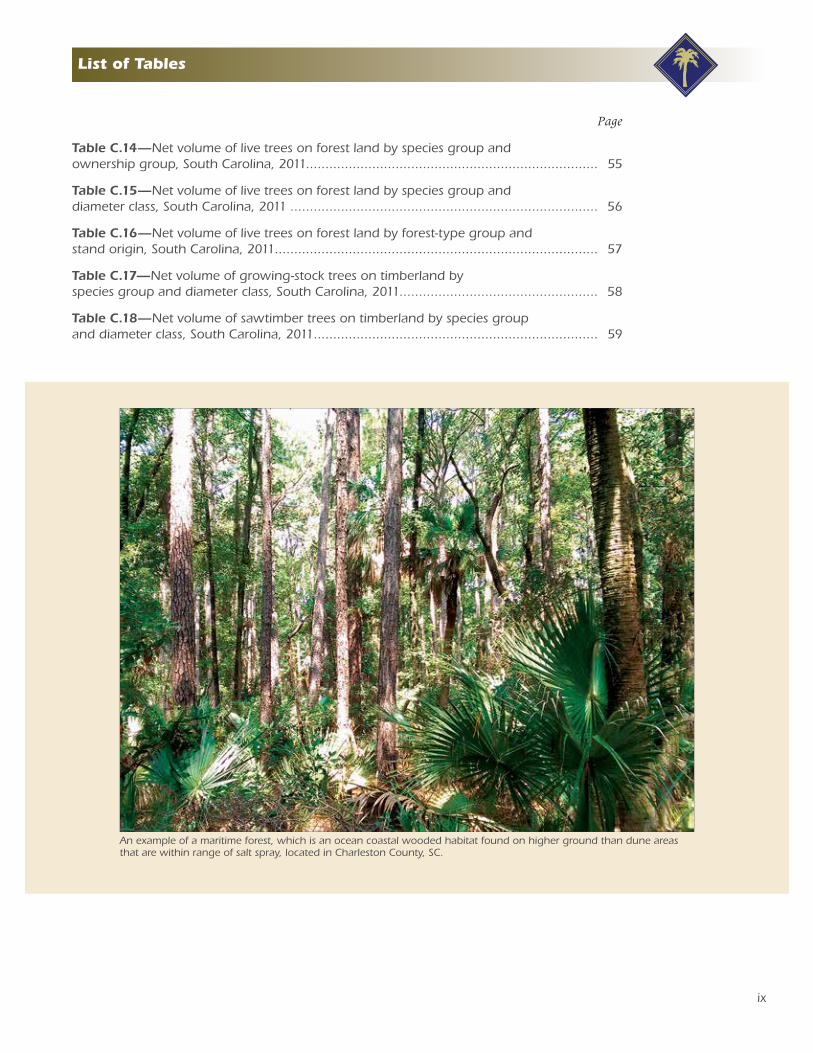
An example of a maritime forest, which is an ocean coastal wooded habitat found on higher ground than dune areas that are within range of salt spray, located in Charleston County, SC.

x
List of Tables
Table C.19—Net volume of sawtimber trees on timberland by species group and ownership group, South Carolina, 2011 .................................................................... 60
Table C.20—Aboveground dry weight of live trees on forest land by ownership class and land status, South Carolina, 2011 .................................................... 61
Table C.21—Total carbon of live trees on forest land by ownership class and land status, South Carolina, 2011 ..................................................................................... 62
Table C.22—Average annual net growth of live trees by ownership class and land status, South Carolina, 2011 (2002–06 to 2007–11) .................................................. 63
Table C.23—Average annual net growth of live trees on forest land by forest-type group and stand-size class, South Carolina, 2011 (2002–06 to 2007–11) ................... 64
Table C.24—Average annual net growth of live trees on forest land by species group and ownership group, South Carolina, 2011 (2002–06 to 2007–11) ....................... 65
Table C.25—Average annual mortality of live trees by ownership class and land status, South Carolina, 2011 (2002–06 to 2007–11) .................................................. 66
Table C.26—Average annual mortality of live trees on forest land by forest-type group and stand-size class, South Carolina, 2011 (2002–06 to 2007–11) ................... 67
Table C.27—Average annual mortality of live trees on forest land by species group and ownership group, South Carolina, 2011 (2002–06 to 2007–11) ....................... 68
Table C.28—Average annual net removals of live trees by ownership class and land status, South Carolina, 2011 (2002–06 to 2007–11) ........................................... 69
Table C.29—Average annual removals of live trees on forest land by forest-type group and stand-size class, South Carolina, 2011 (2002–06 to 2007–11) ................... 70
Table C.30—Average annual removals of live trees on forest land by species group and ownership group, South Carolina, 2011 (2002–06 to 2007–11) ....................... 71
Page
xi
Highlights from the Tenth Forest Inventory of South Carolina
HIGHLIGHTS FROM THE TENTH FOREST INVENTORY OF SOUTH CAROLINA
• In 2011, about 13.1 million acres, or 68 percent, of South Carolina’s land area was forested. This was a slight increase from the 2006 survey.
• The majority (71 percent) of the family-owned private forest land acreage is controlled by only 20 percent of private owners.
• The loblolly-shortleaf pine group was the predominant forest-type group in South Carolina. It covered an estimated 5.5 million acres (42 percent) of forest land, which was a 2.6-percent increase from 2006.
• Approximately one-half of the forest land in South Carolina was in large diameter stands (6.5 million acres), which was an increase of 8.3 percent since 2006.
• Despite a 7.0-percent decrease, loblolly pine continued to rank first for number of live trees ≥1.0 inch diameter at breast height with 2.4 billion stems, which represented 24 percent of the total.
• As of 2011, total all-live volume on forest land was estimated to be 24.1 billion cubic feet, the most ever reported for the State. This was an increase of 10 percent over the 2006 survey.
• Annual net growth averaged 1,289.5 million cubic feet per year. Annual removals averaged 834.0 million cubic feet per year, and mortality averaged 171.3 million cubic feet per year.
• The growth-to-removals ratio averaged 1.5:1.0.
• Nonnative invasive plants occurred on 58 percent of forested plots. Japanese honeysuckle was the most common.
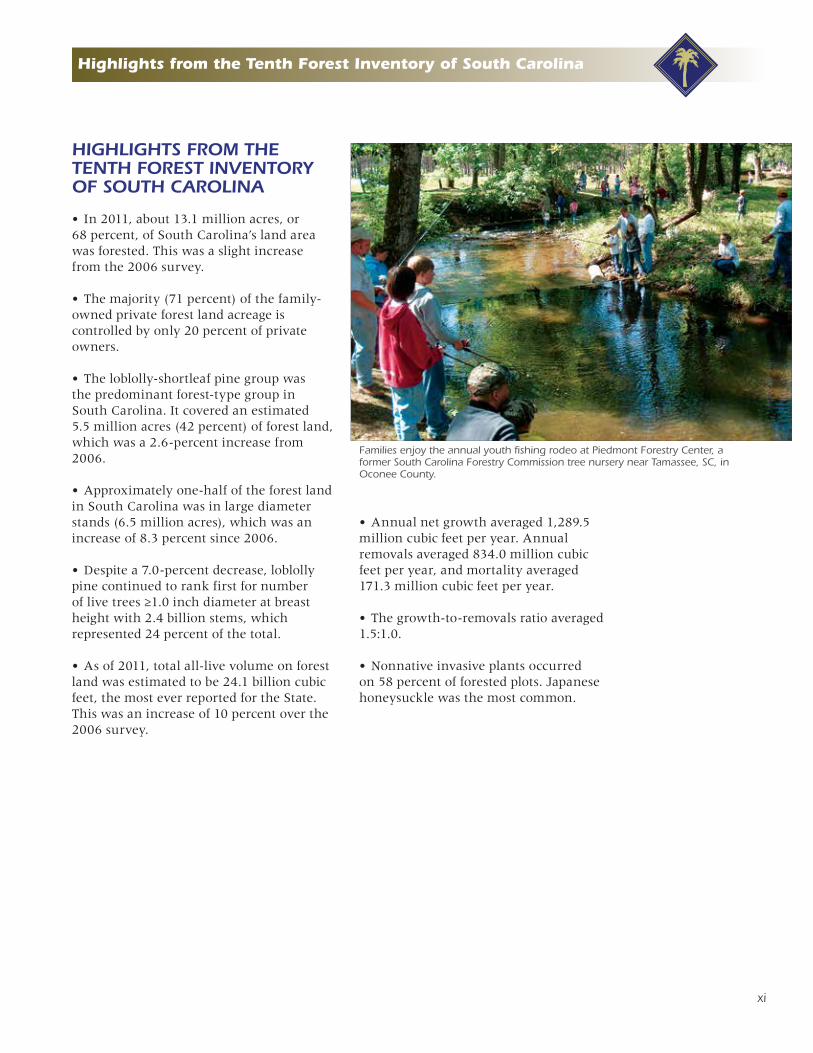
Families enjoy the annual youth fishing rodeo at Piedmont Forestry Center, a former South Carolina Forestry Commission tree nursery near Tamassee, SC, in Oconee County.
xii
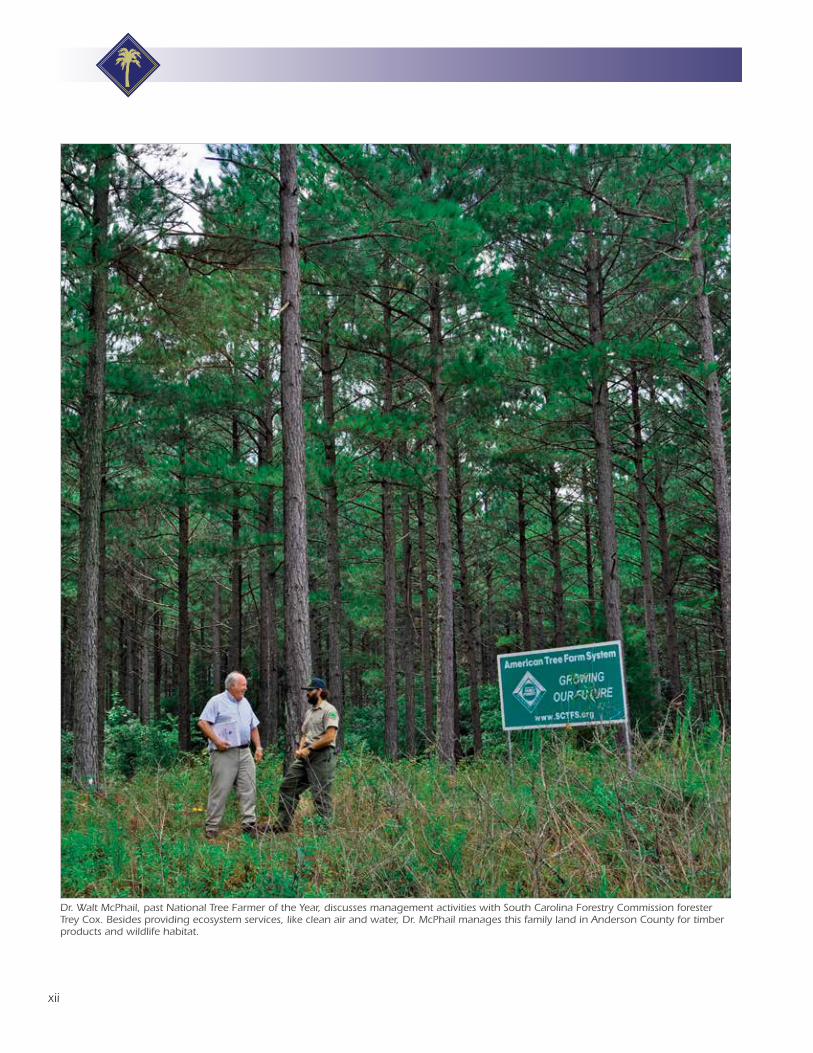
Dr. Walt McPhail, past National Tree Farmer of the Year, discusses management activities with South Carolina Forestry Commission forester Trey Cox. Besides providing ecosystem services, like clean air and water, Dr. McPhail manages this family land in Anderson County for timber products and wildlife habitat.
Introduction
INTRODUCTION
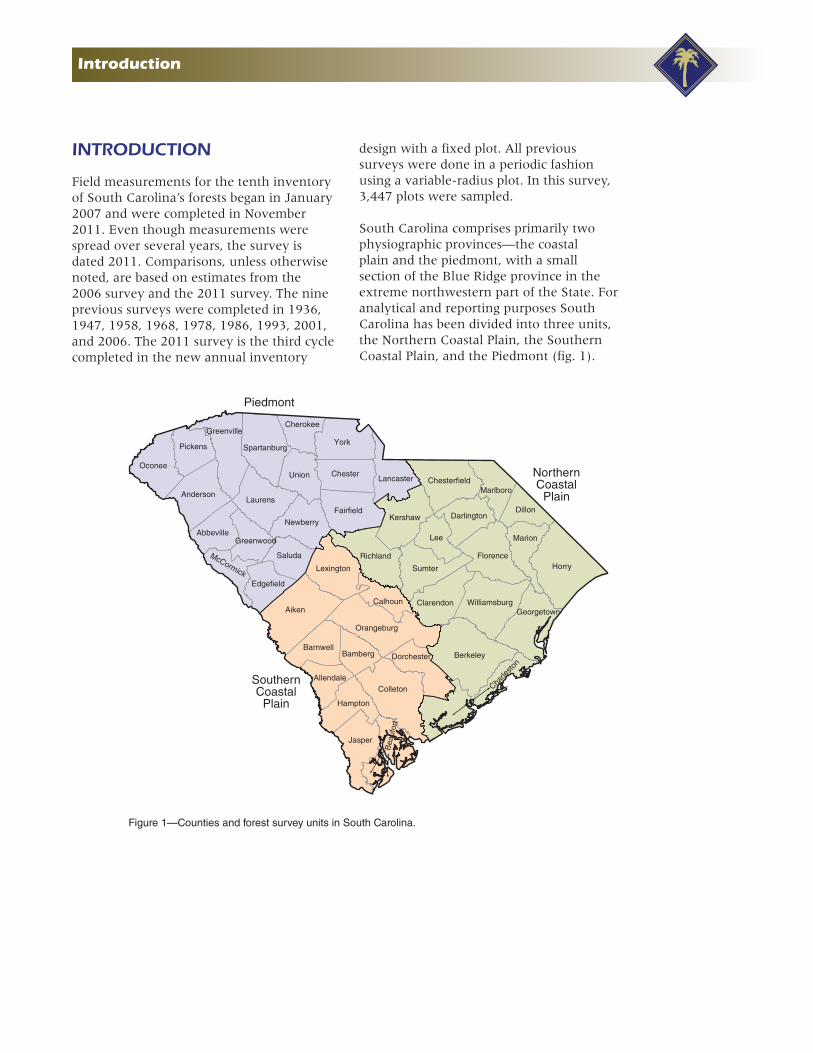
Field measurements for the tenth inventory of South Carolina’s forests began in January 2007 and were completed in November 2011. Even though measurements were spread over several years, the survey is dated 2011. Comparisons, unless otherwise noted, are based on estimates from the 2006 survey and the 2011 survey. The nine previous surveys were completed in 1936, 1947, 1958, 1968, 1978, 1986, 1993, 2001, and 2006. The 2011 survey is the third cycle completed in the new annual inventory
design with a fixed plot. All previous surveys were done in a periodic fashion using a variable-radius plot. In this survey, 3,447 plots were sampled.
South Carolina comprises primarily two physiographic provinces—the coastal plain and the piedmont, with a small section of the Blue Ridge province in the extreme northwestern part of the State. For analytical and reporting purposes South Carolina has been divided into three units, the Northern Coastal Plain, the Southern Coastal Plain, and the Piedmont (fig. 1).
Figure 1—Counties and forest survey units in South Carolina.
Calhoun
Lexington
Aiken
Barnwell
Allendale
Bamberg
Orangeburg
Hampton
Colleton
Jasper
Bea
ufor
t
Dorchester
Pickens
Greenwood
McCormick
Oconee
Anderson
Greenville
Spartanburg
Abbeville
Laurens
Cherokee
York
Union ChesterLancaster
Fairfield
Newberry
Saluda
Edgefield
Charle
ston
Berkeley
GeorgetownWilliamsburgClarendon
Sumter
Richland
Kershaw
Lee
Chesterfield
Darlington
Marlboro
Florence
Dillon
Marion
Horry
Piedmont
NorthernCoastal
Plain
SouthernCoastal
Plain
2
Forest Area
FOREST AREA
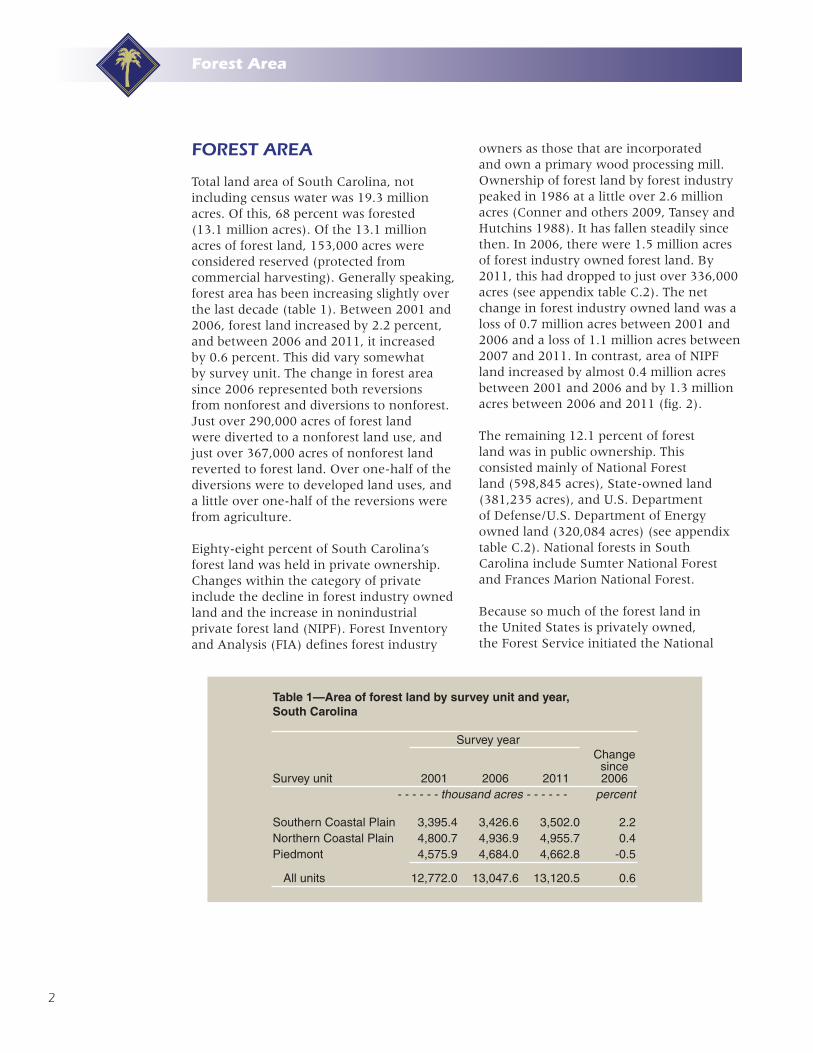
Total land area of South Carolina, not including census water was 19.3 million acres. Of this, 68 percent was forested (13.1 million acres). Of the 13.1 million acres of forest land, 153,000 acres were considered reserved (protected from commercial harvesting). Generally speaking, forest area has been increasing slightly over the last decade (table 1). Between 2001 and 2006, forest land increased by 2.2 percent, and between 2006 and 2011, it increased by 0.6 percent. This did vary somewhat by survey unit. The change in forest area since 2006 represented both reversions from nonforest and diversions to nonforest. Just over 290,000 acres of forest land were diverted to a nonforest land use, and just over 367,000 acres of nonforest land reverted to forest land. Over one-half of the diversions were to developed land uses, and a little over one-half of the reversions were from agriculture.
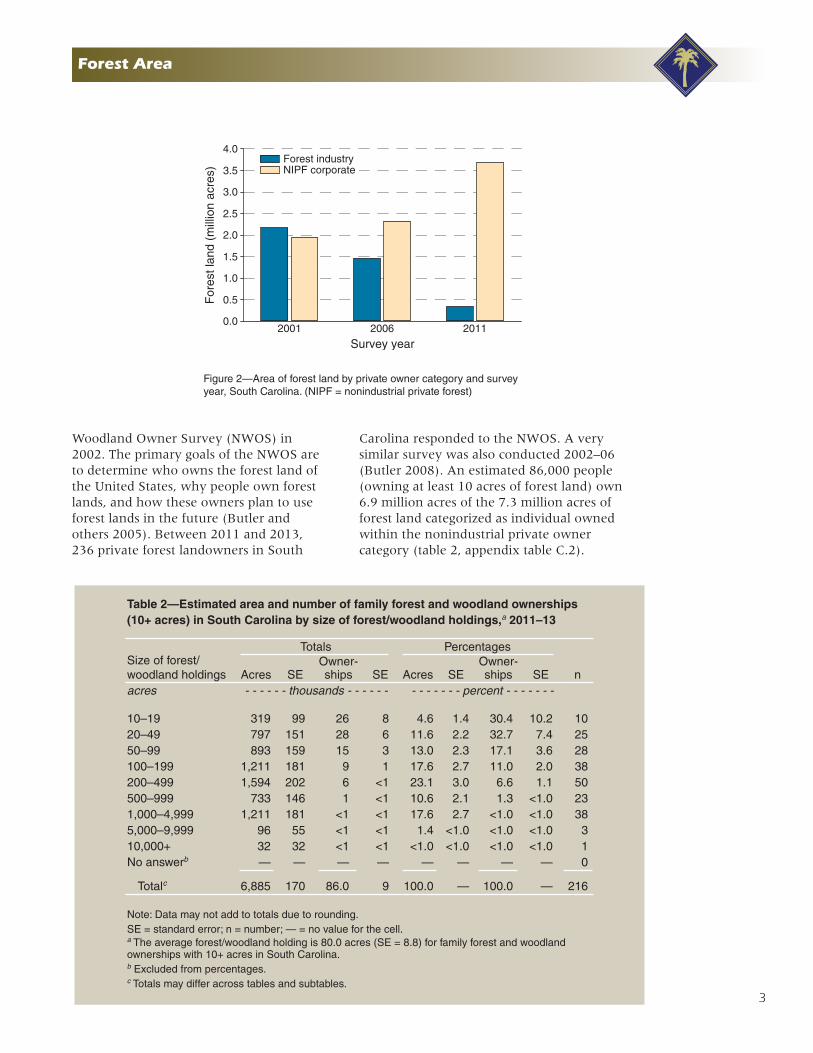
Eighty-eight percent of South Carolina’s forest land was held in private ownership. Changes within the category of private include the decline in forest industry owned land and the increase in nonindustrial private forest land (NIPF). Forest Inventory and Analysis (FIA) defines forest industry
owners as those that are incorporated and own a primary wood processing mill. Ownership of forest land by forest industry peaked in 1986 at a little over 2.6 million acres (Conner and others 2009, Tansey and Hutchins 1988). It has fallen steadily since then. In 2006, there were 1.5 million acres of forest industry owned forest land. By 2011, this had dropped to just over 336,000 acres (see appendix table C.2). The net change in forest industry owned land was a loss of 0.7 million acres between 2001 and 2006 and a loss of 1.1 million acres between 2007 and 2011. In contrast, area of NIPF land increased by almost 0.4 million acres between 2001 and 2006 and by 1.3 million acres between 2006 and 2011 (fig. 2).
The remaining 12.1 percent of forest land was in public ownership. This consisted mainly of National Forest land (598,845 acres), State-owned land (381,235 acres), and U.S. Department of Defense/U.S. Department of Energy owned land (320,084 acres) (see appendix table C.2). National forests in South Carolina include Sumter National Forest and Frances Marion National Forest.
Because so much of the forest land in the United States is privately owned, the Forest Service initiated the National
Table 1—Area of forest land by survey unit and year, South Carolina
Survey unit
Survey yearChange
since20062001 2006 2011
- - - - - - thousand acres - - - - - - percent
Southern Coastal Plain 3,395.4 3,426.6 3,502.0 2.2Northern Coastal Plain 4,800.7 4,936.9 4,955.7 0.4Piedmont 4,575.9 4,684.0 4,662.8 -0.5
All units 12,772.0 13,047.6 13,120.5 0.6
3
Forest Area
Woodland Owner Survey (NWOS) in 2002. The primary goals of the NWOS are to determine who owns the forest land of the United States, why people own forest lands, and how these owners plan to use forest lands in the future (Butler and others 2005). Between 2011 and 2013, 236 private forest landowners in South
Carolina responded to the NWOS. A very similar survey was also conducted 2002–06 (Butler 2008). An estimated 86,000 people (owning at least 10 acres of forest land) own 6.9 million acres of the 7.3 million acres of forest land categorized as individual owned within the nonindustrial private owner category (table 2, appendix table C.2).
Table 2—Estimated area and number of family forest and woodland ownerships (10+ acres) in South Carolina by size of forest/woodland holdings,a 2011–13
Size of forest/woodland holdings
Totals Percentages
nAcres SEOwner-ships SE Acres SE
Owner-ships SE
acres - - - - - - thousands - - - - - - - - - - - - - percent - - - - - - -
10–19 319 99 26 8 4.6 1.4 30.4 10.2 1020–49 797 151 28 6 11.6 2.2 32.7 7.4 2550–99 893 159 15 3 13.0 2.3 17.1 3.6 28100–199 1,211 181 9 1 17.6 2.7 11.0 2.0 38200–499 1,594 202 6 <1 23.1 3.0 6.6 1.1 50500–999 733 146 1 <1 10.6 2.1 1.3 <1.0 231,000–4,999 1,211 181 <1 <1 17.6 2.7 <1.0 <1.0 385,000–9,999 96 55 <1 <1 1.4 <1.0 <1.0 <1.0 310,000+ 32 32 <1 <1 <1.0 <1.0 <1.0 <1.0 1No answerb — — — — — — — — 0
Totalc 6,885 170 86.0 9 100.0 — 100.0 — 216
Note: Data may not add to totals due to rounding.SE = standard error; n = number; — = no value for the cell.a The average forest/woodland holding is 80.0 acres (SE = 8.8) for family forest and woodland ownerships with 10+ acres in South Carolina.b Excluded from percentages.c Totals may differ across tables and subtables.
Survey year2001 2006 2011
For
est l
and
(mill
ion
acre
s)
0.0
0.5
1.0
1.5
2.0
2.5
3.0
3.5
4.0Forest industry NIPF corporate
Figure 2—Area of forest land by private owner category and survey year, South Carolina. (NIPF = nonindustrial private forest)
4
Forest Area
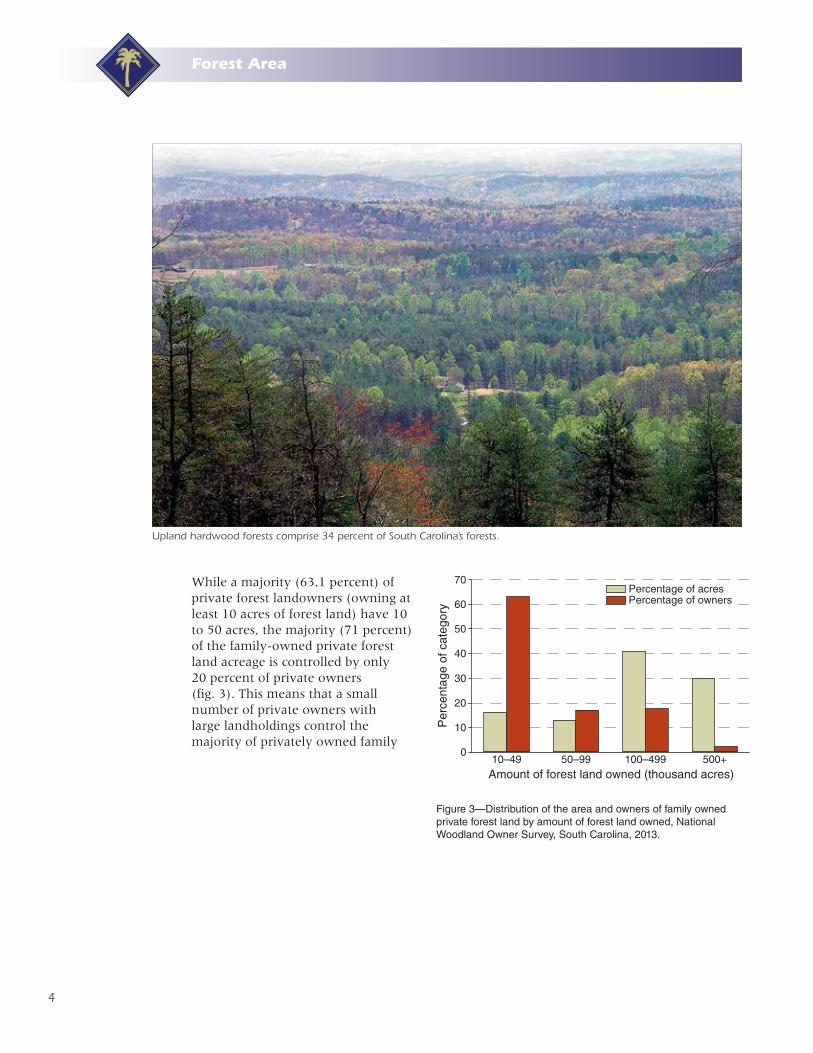
While a majority (63.1 percent) of private forest landowners (owning at least 10 acres of forest land) have 10 to 50 acres, the majority (71 percent) of the family-owned private forest land acreage is controlled by only 20 percent of private owners (fig. 3). This means that a small number of private owners with large landholdings control the majority of privately owned family
Figure 3—Distribution of the area and owners of family owned private forest land by amount of forest land owned, National Woodland Owner Survey, South Carolina, 2013.
Amount of forest land owned (thousand acres)10–49 50–99 100–499 500+
Per
cent
age
of c
ateg
ory
0
10
20
30
40
50
60
70
Percentage of owners Percentage of acres
Upland hardwood forests comprise 34 percent of South Carolina’s forests.
5
Forest Area
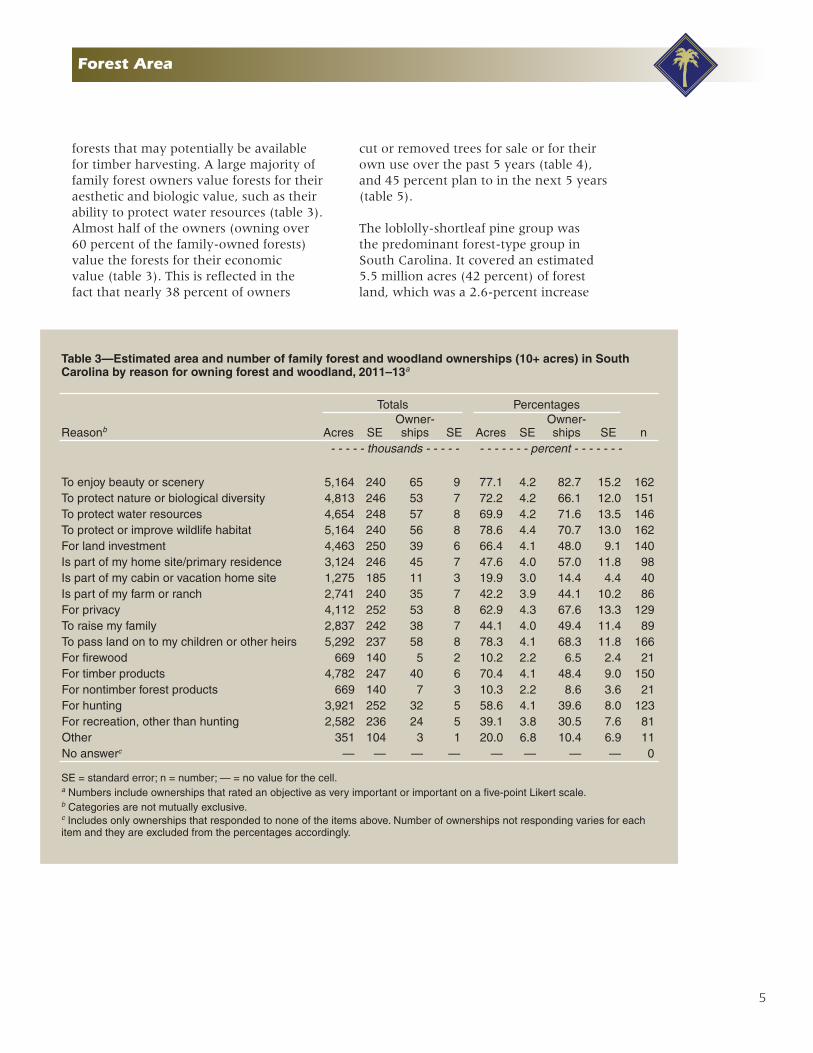
forests that may potentially be available for timber harvesting. A large majority of family forest owners value forests for their aesthetic and biologic value, such as their ability to protect water resources (table 3). Almost half of the owners (owning over 60 percent of the family-owned forests) value the forests for their economic value (table 3). This is reflected in the fact that nearly 38 percent of owners
cut or removed trees for sale or for their own use over the past 5 years (table 4), and 45 percent plan to in the next 5 years (table 5).
The loblolly-shortleaf pine group was the predominant forest-type group in South Carolina. It covered an estimated 5.5 million acres (42 percent) of forest land, which was a 2.6-percent increase
Table 3—Estimated area and number of family forest and woodland ownerships (10+ acres) in South Carolina by reason for owning forest and woodland, 2011–13a
Reasonb
Totals Percentages
nAcres SEOwner-ships SE Acres SE
Owner-ships SE
- - - - - thousands - - - - - - - - - - - - percent - - - - - - -
To enjoy beauty or scenery 5,164 240 65 9 77.1 4.2 82.7 15.2 162To protect nature or biological diversity 4,813 246 53 7 72.2 4.2 66.1 12.0 151To protect water resources 4,654 248 57 8 69.9 4.2 71.6 13.5 146To protect or improve wildlife habitat 5,164 240 56 8 78.6 4.4 70.7 13.0 162For land investment 4,463 250 39 6 66.4 4.1 48.0 9.1 140Is part of my home site/primary residence 3,124 246 45 7 47.6 4.0 57.0 11.8 98Is part of my cabin or vacation home site 1,275 185 11 3 19.9 3.0 14.4 4.4 40Is part of my farm or ranch 2,741 240 35 7 42.2 3.9 44.1 10.2 86For privacy 4,112 252 53 8 62.9 4.3 67.6 13.3 129To raise my family 2,837 242 38 7 44.1 4.0 49.4 11.4 89To pass land on to my children or other heirs 5,292 237 58 8 78.3 4.1 68.3 11.8 166For firewood 669 140 5 2 10.2 2.2 6.5 2.4 21For timber products 4,782 247 40 6 70.4 4.1 48.4 9.0 150For nontimber forest products 669 140 7 3 10.3 2.2 8.6 3.6 21For hunting 3,921 252 32 5 58.6 4.1 39.6 8.0 123For recreation, other than hunting 2,582 236 24 5 39.1 3.8 30.5 7.6 81Other 351 104 3 1 20.0 6.8 10.4 6.9 11No answerc — — — — — — — — 0
SE = standard error; n = number; — = no value for the cell.a Numbers include ownerships that rated an objective as very important or important on a five-point Likert scale.b Categories are not mutually exclusive. c Includes only ownerships that responded to none of the items above. Number of ownerships not responding varies for each item and they are excluded from the percentages accordingly.
6
Forest Area
Table 4—Estimated area and number of family forest and woodland ownerships (10+ acres) in South Carolina by recent (past 5 years) forestry activity,a 2011–13
Type of activityb
Totals Percentages
nAcres SEOwner-ships SE Acres SE
Owner-ships SE
- - - - - - thousands - - - - - - - - - - - - - percent - - - - - - -
Cut and/or remove trees for sale 3,953 252 24 4 58.5 4.0 27.7 6.0 124Cut and/or remove trees for own use 1,530 199 13 3 22.6 3.0 15.0 4.4 48Cut and/or remove trees for sale or own usec 4,399 250 32 5 65.1 4.1 37.7 7.4 138Collect nontimber forest products 893 159 6 2 13.2 2.4 7.3 2.6 28Reduce fire hazard 1,976 218 11 3 29.2 3.3 12.5 3.5 62Controlled burn/prescribed fire 2,104 222 5 <1 31.1 3.4 6.3 1.3 66Eliminated or reduced invasive plants 1,753 209 21 6 25.9 3.2 24.5 7.3 55Eliminated or reduced unwanted insects or diseases 924 162 8 3 13.7 2.4 9.4 3.8 29Road construction or maintenance 1,817 212 7 2 26.9 3.2 7.7 2.4 57Trail construction or maintenance 1,434 194 13 4 21.2 2.9 14.7 5.0 45Road or trail construction or maintenancec 2,582 236 18 4 38.2 3.6 20.9 5.6 81Improved wildlife habitat 2,933 243 15 3 43.4 3.8 18.1 3.9 92Livestock grazing 638 137 6 3 9.4 2.0 7.6 3.7 20None of the above 1,020 169 26 6 15.1 2.5 30.6 7.9 32No answerd 128 63 <1 <1 — — — — 4
SE = standard error; n = number; — = no value for the cell.a The acre values represent the estimated amount of forest/woodland owned by people who have done the specific activity, not the total acres on which the activity occurred.b Categories are not mutually exclusive. c Includes ownerships that reported doing either of the two preceding activities. Included primarily for comparisons with the 2002–06 results.d Excluded from percentages.
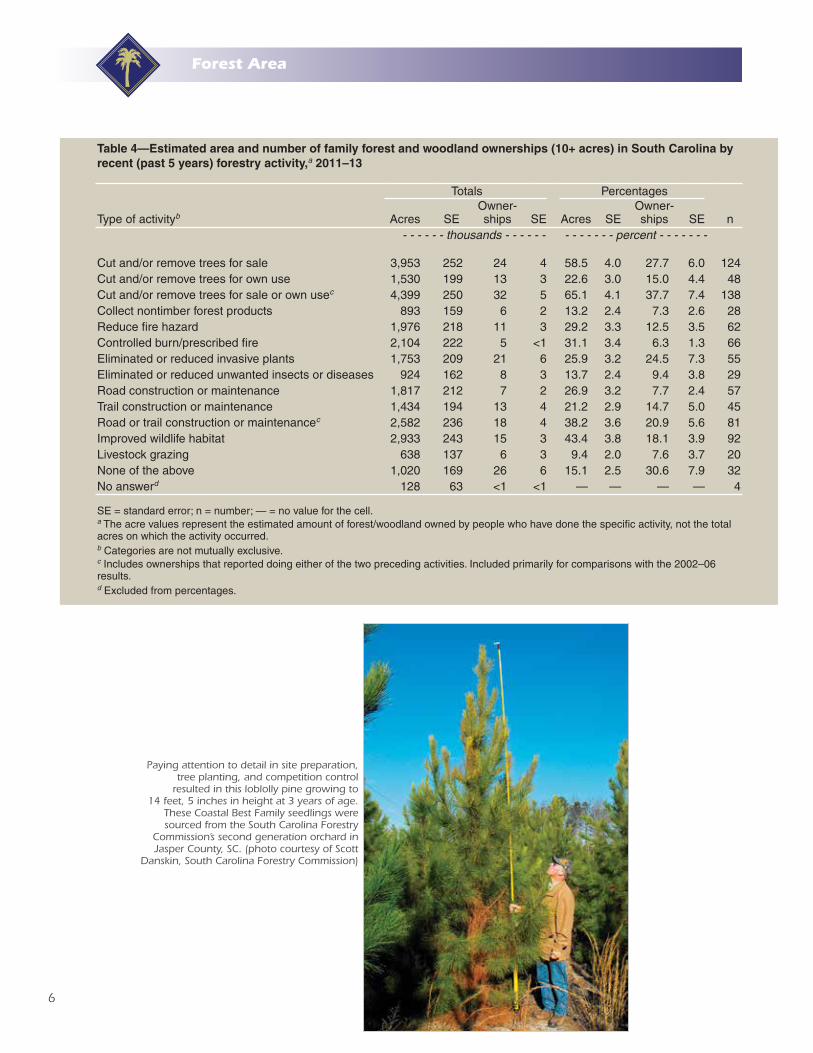
Paying attention to detail in site preparation, tree planting, and competition control
resulted in this loblolly pine growing to 14 feet, 5 inches in height at 3 years of age.
These Coastal Best Family seedlings were sourced from the South Carolina Forestry
Commission’s second generation orchard in Jasper County, SC. (photo courtesy of Scott
Danskin, South Carolina Forestry Commission)
7
Forest Area
Table 5—Estimated area and number of family forest and woodland ownerships (10+ acres) in South Carolina by future (next 5 years) forestry activity,a 2011–13b
Type of activityc
Totals Percentages
nAcres SEOwner-ships SE Acres SE
Owner-ships SE
- - - - - - thousands - - - - - - - - - - - - - percent - - - - - - -
Cut and/or remove trees for sale 3,831 275 25 6 57.2 4.4 31.7 8.4 99Cut and/or remove trees for own use 1,548 220 15 4 26.8 4.0 21.1 6.6 40Cut and/or remove trees for sale or own used 4,411 273 36 7 65.9 4.5 44.8 10.1 114Collect nontimber forest products 1,045 188 11 4 18.4 3.4 16.2 5.9 27Reduce fire hazard 3,328 272 24 5 56.6 5.2 35.3 9.1 86Controlled burn/prescribed fire 2,863 265 10 2 46.5 4.7 13.5 2.9 74Eliminate or reduce invasive plants 2,167 247 22 6 36.8 4.5 30.9 9.4 56Eliminate or reduce unwanted insects or diseases 1,703 228 18 5 28.8 4.0 25.6 8.4 44Road construction or maintenance 2,360 253 12 4 40.9 4.8 17.1 5.8 61Trail construction or maintenance 1,857 235 12 4 32.2 4.3 17.5 5.7 48Road or trail construction or maintenanced 2,825 265 15 4 47.1 4.8 20.8 6.0 73Improve wildlife habitat 4,295 274 35 6 70.3 5.3 48.3 11.1 111Livestock grazing 697 157 10 4 12.4 2.9 14.1 6.2 18None of the above 851 172 27 7 12.5 2.5 33.1 9.2 22No answere 155 77 1 <1 — — — — 4
SE = standard error; n = number; — = no value for the cell.a The acre values represent the estimated amount of forest/woodland owned by people who have done the specific activity, not the total acres on which the activity occurred.b Numbers include ownerships that rated an activity as extremely likely or likely on a five-point Likert scale.c Categories are not mutually exclusive. d Includes ownerships that reported either of the two preceding activities were extremely likely or likely.e Includes only ownerships that responded to none of the items above. Number of ownerships not responding varies for each item and they are excluded from the percentages accordingly.
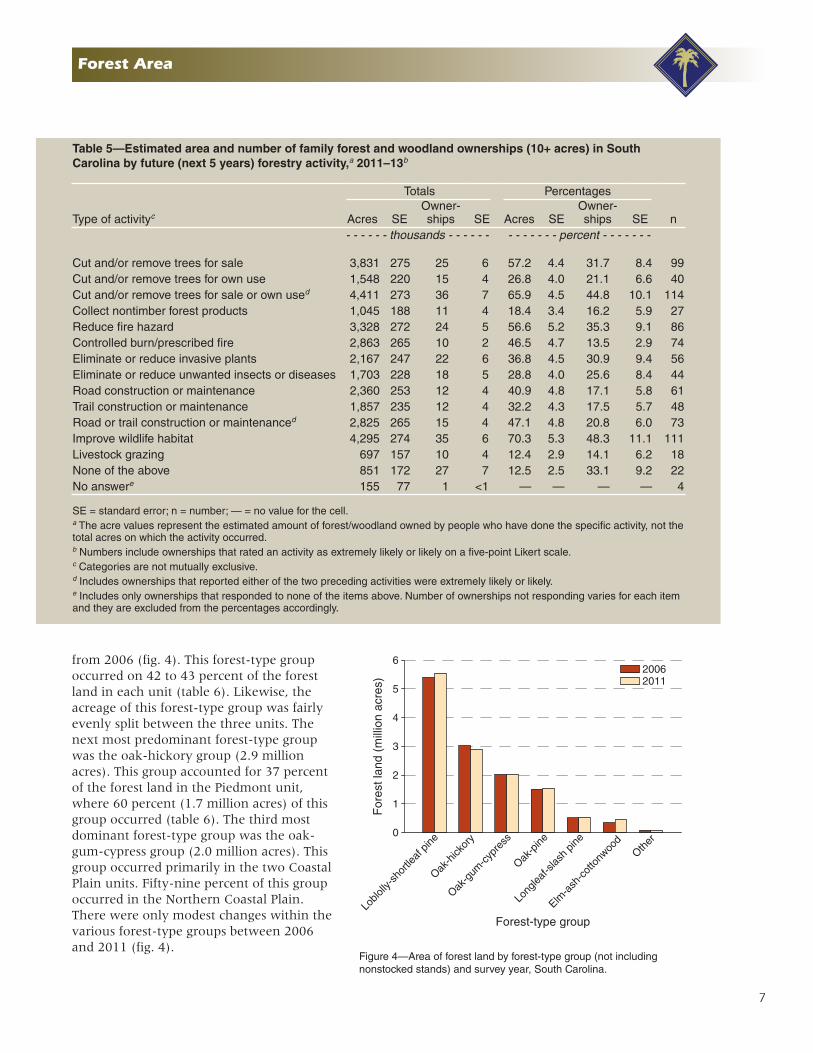
from 2006 (fig. 4). This forest-type group occurred on 42 to 43 percent of the forest land in each unit (table 6). Likewise, the acreage of this forest-type group was fairly evenly split between the three units. The next most predominant forest-type group was the oak-hickory group (2.9 million acres). This group accounted for 37 percent of the forest land in the Piedmont unit, where 60 percent (1.7 million acres) of this group occurred (table 6). The third most dominant forest-type group was the oak-gum-cypress group (2.0 million acres). This group occurred primarily in the two Coastal Plain units. Fifty-nine percent of this group occurred in the Northern Coastal Plain. There were only modest changes within the various forest-type groups between 2006 and 2011 (fig. 4).
Forest-type groupLo
blolly
-sho
rtlea
f pine
Oak-h
ickor
y
Oak-g
um-c
ypre
ss
Oak-p
ine
Long
leaf-s
lash
pine
Elm-a
sh-c
otto
nwoo
dOth
er
For
est l
and
(mill
ion
acre
s)
0
1
2
3
4
5
62006 2011
Figure 4—Area of forest land by forest-type group (not including nonstocked stands) and survey year, South Carolina.
8
Forest Area
Table 6—Area of forest land by forest-type group and survey unit, South Carolina, 2011
Forest-type group
Survey unit
All unitsSouthern
Coastal PlainNorthern
Coastal Plain Piedmontthousand acres
White-red-jack pine 0.0 1.0 2.0 3.0Longleaf-slash pine 242.9 268.2 13.6 524.7Loblolly-shortleaf pine 1,506.0 2,075.7 1,960.2 5,541.9Other eastern softwoods 0.0 4.7 10.6 15.4Oak-pine 421.3 506.8 616.7 1,544.9Oak-hickory 473.6 676.4 1,724.8 2,874.8Oak-gum-cypress 756.8 1,188.9 77.7 2,023.4Elm-ash-cottonwood 56.7 189.1 205.8 451.7Other hardwoods 0.0 0.0 10.3 10.3Tropical hardwoods 1.5 0.0 0.0 1.5Exotic hardwoods 5.8 7.3 9.2 22.3Nonstocked 37.4 38.5 18.2 94.2
Total groups 3,502.0 4,955.7 4,662.8 13,120.5
Numbers in rows and columns may not sum to totals due to rounding.0.0 = no sample for the cell or a value of >0.0 but <0.05.
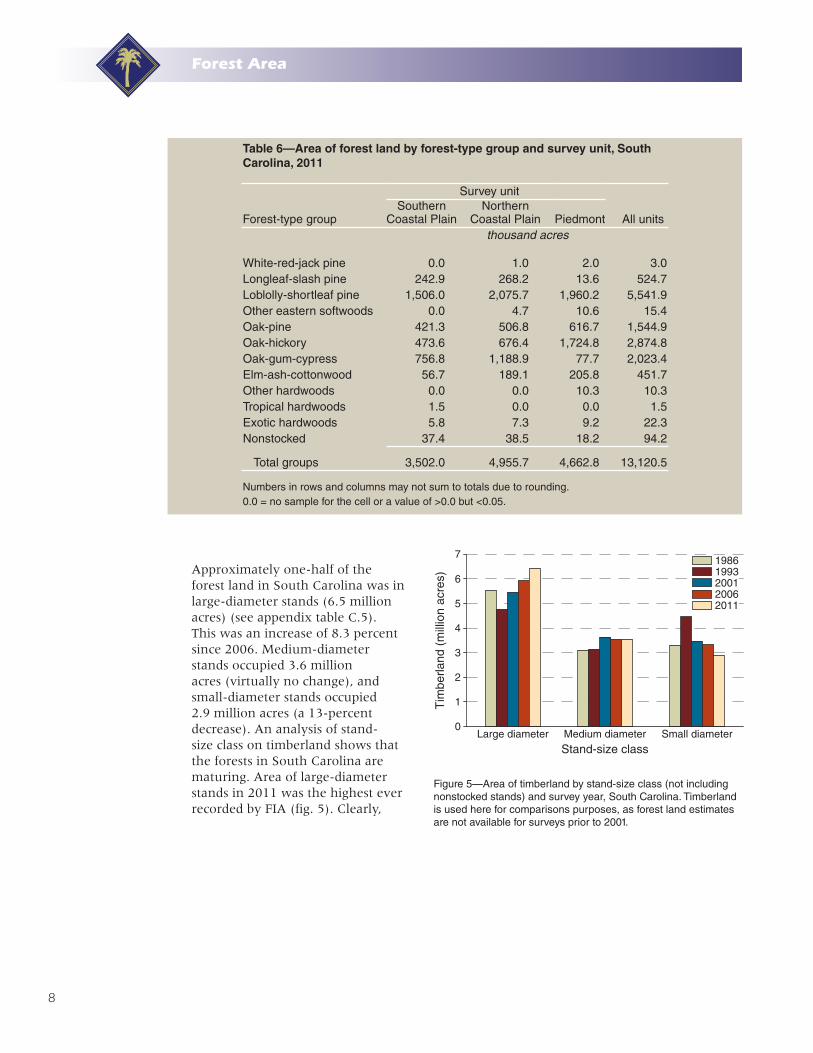
Approximately one-half of the forest land in South Carolina was in large-diameter stands (6.5 million acres) (see appendix table C.5). This was an increase of 8.3 percent since 2006. Medium-diameter stands occupied 3.6 million acres (virtually no change), and small-diameter stands occupied 2.9 million acres (a 13-percent decrease). An analysis of stand-size class on timberland shows that the forests in South Carolina are maturing. Area of large-diameter stands in 2011 was the highest ever recorded by FIA (fig. 5). Clearly,
Stand-size class
Tim
berla
nd (
mill
ion
acre
s)
0
1
2
3
4
5
6
7
Large diameter Medium diameter Small diameter
1986 1993 2001 2006 2011
Figure 5—Area of timberland by stand-size class (not including nonstocked stands) and survey year, South Carolina. Timberland is used here for comparisons purposes, as forest land estimates are not available for surveys prior to 2001.
9
Forest Area
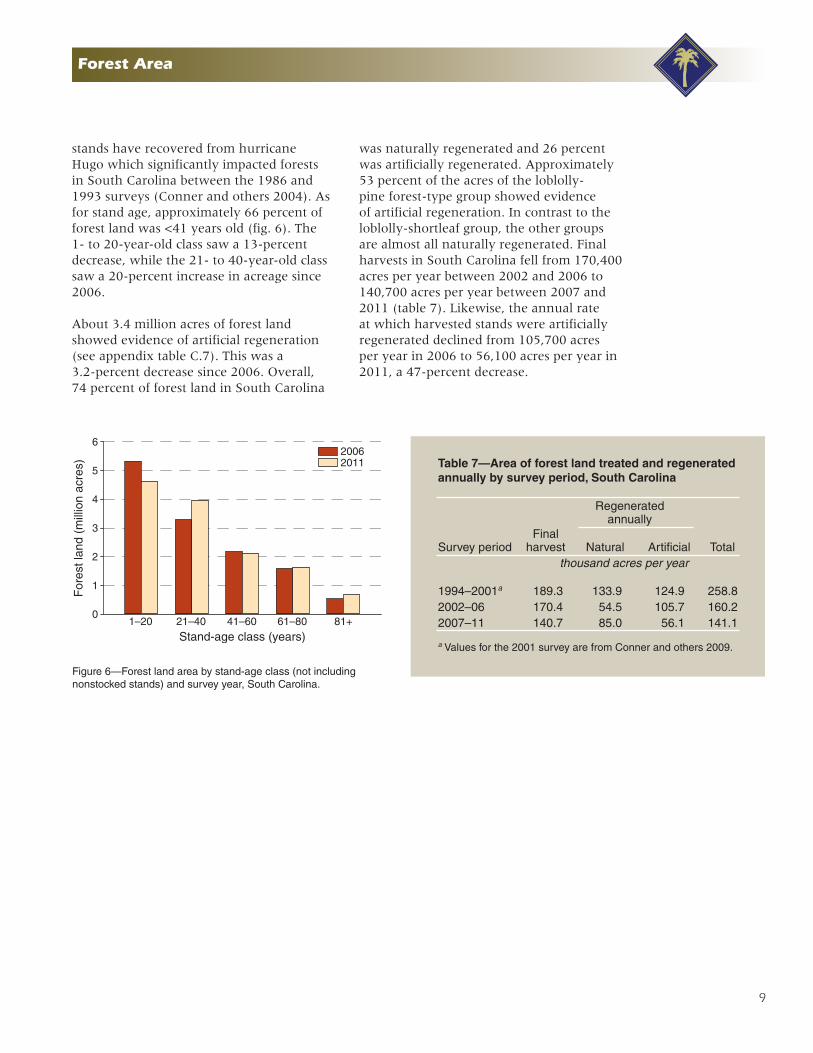
stands have recovered from hurricane Hugo which significantly impacted forests in South Carolina between the 1986 and 1993 surveys (Conner and others 2004). As for stand age, approximately 66 percent of forest land was <41 years old (fig. 6). The 1- to 20-year-old class saw a 13-percent decrease, while the 21- to 40-year-old class saw a 20-percent increase in acreage since 2006.
About 3.4 million acres of forest land showed evidence of artificial regeneration (see appendix table C.7). This was a 3.2-percent decrease since 2006. Overall, 74 percent of forest land in South Carolina
was naturally regenerated and 26 percent was artificially regenerated. Approximately 53 percent of the acres of the loblolly-pine forest-type group showed evidence of artificial regeneration. In contrast to the loblolly-shortleaf group, the other groups are almost all naturally regenerated. Final harvests in South Carolina fell from 170,400 acres per year between 2002 and 2006 to 140,700 acres per year between 2007 and 2011 (table 7). Likewise, the annual rate at which harvested stands were artificially regenerated declined from 105,700 acres per year in 2006 to 56,100 acres per year in 2011, a 47-percent decrease.
Stand-age class (years)1–20 21–40 41–60 61–80 81+
For
est l
and
(mill
ion
acre
s)
0
1
2
3
4
5
62006 2011
Figure 6—Forest land area by stand-age class (not including nonstocked stands) and survey year, South Carolina.
Table 7—Area of forest land treated and regenerated annually by survey period, South Carolina
Survey periodFinal
harvest
Regeneratedannually
TotalNatural Artificialthousand acres per year
1994–2001a 189.3 133.9 124.9 258.82002–06 170.4 54.5 105.7 160.22007–11 140.7 85.0 56.1 141.1
a Values for the 2001 survey are from Conner and others 2009.
10
Number of Trees, Volume, and Biomass
NUMBER OF TREES, VOLUME, AND BIOMASS
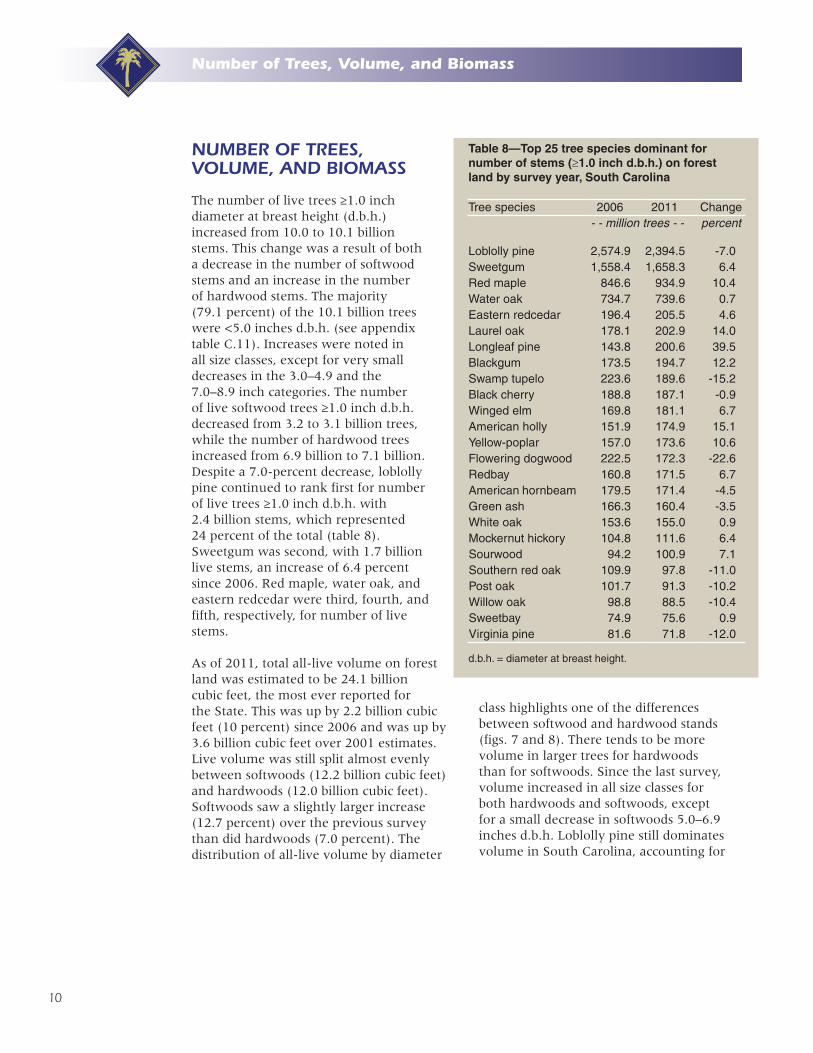
The number of live trees ≥1.0 inch diameter at breast height (d.b.h.) increased from 10.0 to 10.1 billion stems. This change was a result of both a decrease in the number of softwood stems and an increase in the number of hardwood stems. The majority (79.1 percent) of the 10.1 billion trees were <5.0 inches d.b.h. (see appendix table C.11). Increases were noted in all size classes, except for very small decreases in the 3.0–4.9 and the 7.0–8.9 inch categories. The number of live softwood trees ≥1.0 inch d.b.h. decreased from 3.2 to 3.1 billion trees, while the number of hardwood trees increased from 6.9 billion to 7.1 billion. Despite a 7.0-percent decrease, loblolly pine continued to rank first for number of live trees ≥1.0 inch d.b.h. with 2.4 billion stems, which represented 24 percent of the total (table 8). Sweetgum was second, with 1.7 billion live stems, an increase of 6.4 percent since 2006. Red maple, water oak, and eastern redcedar were third, fourth, and fifth, respectively, for number of live stems.
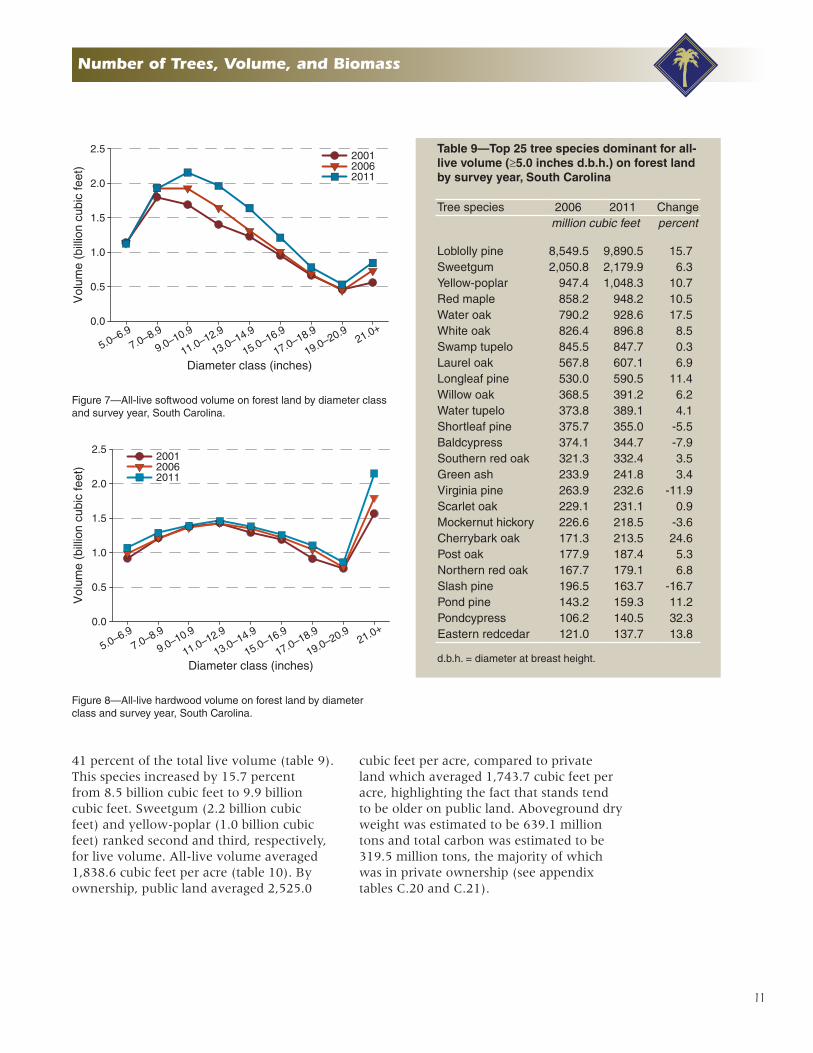
As of 2011, total all-live volume on forest land was estimated to be 24.1 billion cubic feet, the most ever reported for the State. This was up by 2.2 billion cubic feet (10 percent) since 2006 and was up by 3.6 billion cubic feet over 2001 estimates. Live volume was still split almost evenly between softwoods (12.2 billion cubic feet) and hardwoods (12.0 billion cubic feet). Softwoods saw a slightly larger increase (12.7 percent) over the previous survey than did hardwoods (7.0 percent). The distribution of all-live volume by diameter
Table 8—Top 25 tree species dominant for number of stems (≥1.0 inch d.b.h.) on forest land by survey year, South Carolina
Tree species 2006 2011 Change- - million trees - - percent
Loblolly pine 2,574.9 2,394.5 -7.0Sweetgum 1,558.4 1,658.3 6.4Red maple 846.6 934.9 10.4Water oak 734.7 739.6 0.7Eastern redcedar 196.4 205.5 4.6Laurel oak 178.1 202.9 14.0Longleaf pine 143.8 200.6 39.5Blackgum 173.5 194.7 12.2Swamp tupelo 223.6 189.6 -15.2Black cherry 188.8 187.1 -0.9Winged elm 169.8 181.1 6.7American holly 151.9 174.9 15.1Yellow-poplar 157.0 173.6 10.6Flowering dogwood 222.5 172.3 -22.6Redbay 160.8 171.5 6.7American hornbeam 179.5 171.4 -4.5Green ash 166.3 160.4 -3.5White oak 153.6 155.0 0.9Mockernut hickory 104.8 111.6 6.4Sourwood 94.2 100.9 7.1Southern red oak 109.9 97.8 -11.0Post oak 101.7 91.3 -10.2Willow oak 98.8 88.5 -10.4Sweetbay 74.9 75.6 0.9Virginia pine 81.6 71.8 -12.0
d.b.h. = diameter at breast height.
class highlights one of the differences between softwood and hardwood stands (figs. 7 and 8). There tends to be more volume in larger trees for hardwoods than for softwoods. Since the last survey, volume increased in all size classes for both hardwoods and softwoods, except for a small decrease in softwoods 5.0–6.9 inches d.b.h. Loblolly pine still dominates volume in South Carolina, accounting for
11
Number of Trees, Volume, and Biomass
Diameter class (inches)
5.0–6.97.0–8.9
9.0–10.9
11.0–12.9
13.0–14.9
15.0–16.9
17.0–18.9
19.0–20.921.0+
Vol
ume
(bill
ion
cubi
c fe
et)
0.0
0.5
1.0
1.5
2.0
2.52001 2006 2011
Figure 7—All-live softwood volume on forest land by diameter class and survey year, South Carolina.
Figure 8—All-live hardwood volume on forest land by diameter class and survey year, South Carolina.
Diameter class (inches)
Vol
ume
(bill
ion
cubi
c fe
et)
0.0
0.5
1.0
1.5
2.0
2.5
5.0–6.97.0–8.9
9.0–10.9
11.0–12.9
13.0–14.9
15.0–16.9
17.0–18.9
19.0–20.921.0+
2001 2006 2011
Table 9—Top 25 tree species dominant for all-live volume (≥5.0 inches d.b.h.) on forest land by survey year, South Carolina
Tree species 2006 2011 Changemillion cubic feet percent
Loblolly pine 8,549.5 9,890.5 15.7Sweetgum 2,050.8 2,179.9 6.3Yellow-poplar 947.4 1,048.3 10.7Red maple 858.2 948.2 10.5Water oak 790.2 928.6 17.5White oak 826.4 896.8 8.5Swamp tupelo 845.5 847.7 0.3Laurel oak 567.8 607.1 6.9Longleaf pine 530.0 590.5 11.4Willow oak 368.5 391.2 6.2Water tupelo 373.8 389.1 4.1Shortleaf pine 375.7 355.0 -5.5Baldcypress 374.1 344.7 -7.9Southern red oak 321.3 332.4 3.5Green ash 233.9 241.8 3.4Virginia pine 263.9 232.6 -11.9Scarlet oak 229.1 231.1 0.9Mockernut hickory 226.6 218.5 -3.6Cherrybark oak 171.3 213.5 24.6Post oak 177.9 187.4 5.3Northern red oak 167.7 179.1 6.8Slash pine 196.5 163.7 -16.7Pond pine 143.2 159.3 11.2Pondcypress 106.2 140.5 32.3Eastern redcedar 121.0 137.7 13.8
d.b.h. = diameter at breast height.
41 percent of the total live volume (table 9). This species increased by 15.7 percent from 8.5 billion cubic feet to 9.9 billion cubic feet. Sweetgum (2.2 billion cubic feet) and yellow-poplar (1.0 billion cubic feet) ranked second and third, respectively, for live volume. All-live volume averaged 1,838.6 cubic feet per acre (table 10). By ownership, public land averaged 2,525.0
cubic feet per acre, compared to private land which averaged 1,743.7 cubic feet per acre, highlighting the fact that stands tend to be older on public land. Aboveground dry weight was estimated to be 639.1 million tons and total carbon was estimated to be 319.5 million tons, the majority of which was in private ownership (see appendix tables C.20 and C.21).
12
Number of Trees, Volume, and Biomass
Table 10—Volume of live trees per acre on forest land by survey year, unit, and ownership group, South Carolina
Survey year and unitAll
groups
Ownership group
Public Privatecubic feet per acre
2001Southern Coastal Plain 1,854.1 2,868.3 1,771.8Northern Coastal Plain 1,406.6 1,479.3 1,397.7Piedmont 1,633.2 2,462.1 1,543.5
All units 1,606.7 2,126.0 1,551.6
2006Southern Coastal Plain 1,758.1 2,824.7 1,666.6Northern Coastal Plain 1,607.0 1,737.5 1,587.0Piedmont 1,709.3 2,644.4 1,571.4
All units 1,683.4 2,287.2 1,603.3
2011Southern Coastal Plain 1,912.7 2,877.5 1,825.8Northern Coastal Plain 1,736.6 2,041.2 1,686.9Piedmont 1,891.3 2,909.6 1,738.3
All units 1,838.6 2,525.0 1,743.7
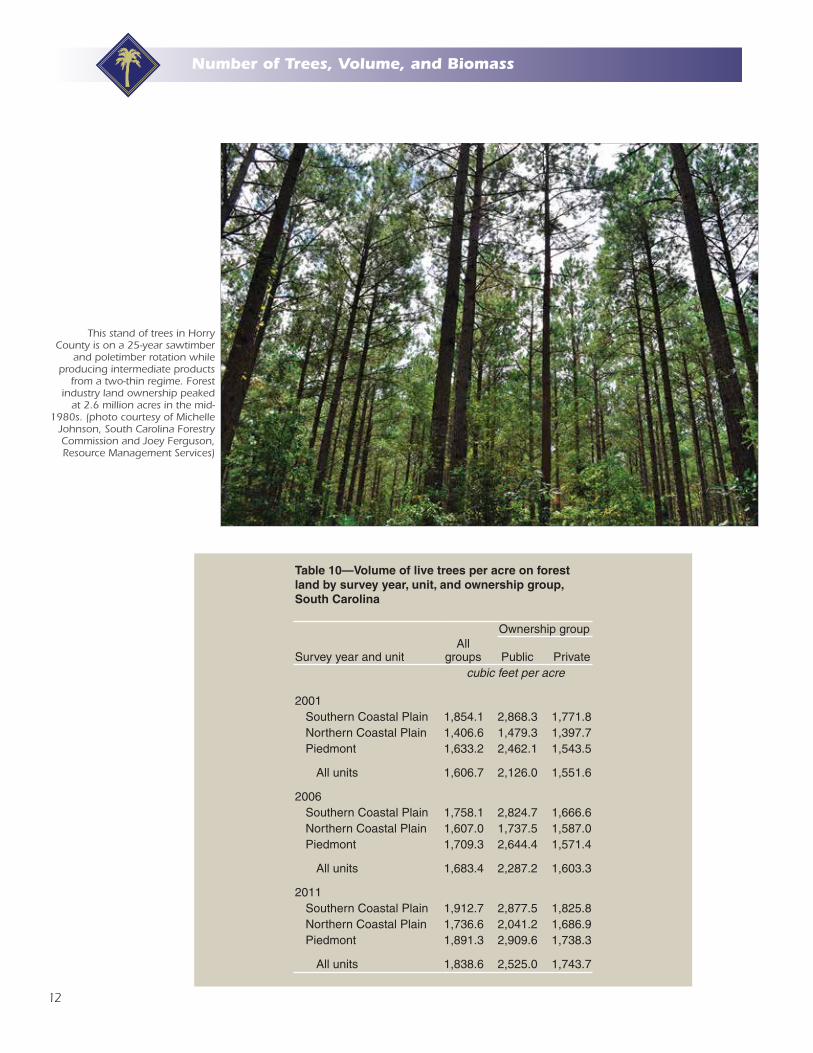
This stand of trees in Horry County is on a 25-year sawtimber
and poletimber rotation while producing intermediate products
from a two-thin regime. Forest industry land ownership peaked
at 2.6 million acres in the mid-1980s. (photo courtesy of Michelle
Johnson, South Carolina Forestry Commission and Joey Ferguson, Resource Management Services)
13
Growth and Removals
GROWTH AND REMOVALS
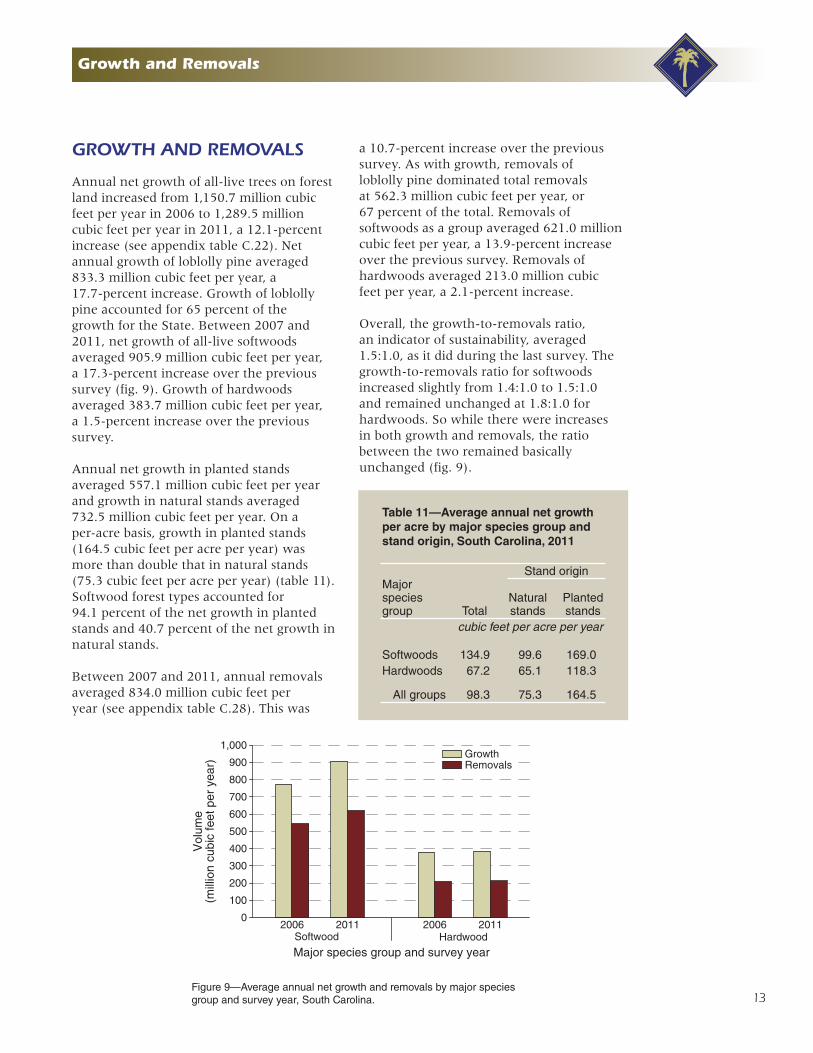
Annual net growth of all-live trees on forest land increased from 1,150.7 million cubic feet per year in 2006 to 1,289.5 million cubic feet per year in 2011, a 12.1-percent increase (see appendix table C.22). Net annual growth of loblolly pine averaged 833.3 million cubic feet per year, a 17.7-percent increase. Growth of loblolly pine accounted for 65 percent of the growth for the State. Between 2007 and 2011, net growth of all-live softwoods averaged 905.9 million cubic feet per year, a 17.3-percent increase over the previous survey (fig. 9). Growth of hardwoods averaged 383.7 million cubic feet per year, a 1.5-percent increase over the previous survey.
Annual net growth in planted stands averaged 557.1 million cubic feet per year and growth in natural stands averaged 732.5 million cubic feet per year. On a per-acre basis, growth in planted stands (164.5 cubic feet per acre per year) was more than double that in natural stands (75.3 cubic feet per acre per year) (table 11). Softwood forest types accounted for 94.1 percent of the net growth in planted stands and 40.7 percent of the net growth in natural stands.
Between 2007 and 2011, annual removals averaged 834.0 million cubic feet per year (see appendix table C.28). This was
a 10.7-percent increase over the previous survey. As with growth, removals of loblolly pine dominated total removals at 562.3 million cubic feet per year, or 67 percent of the total. Removals of softwoods as a group averaged 621.0 million cubic feet per year, a 13.9-percent increase over the previous survey. Removals of hardwoods averaged 213.0 million cubic feet per year, a 2.1-percent increase.
Overall, the growth-to-removals ratio, an indicator of sustainability, averaged 1.5:1.0, as it did during the last survey. The growth-to-removals ratio for softwoods increased slightly from 1.4:1.0 to 1.5:1.0 and remained unchanged at 1.8:1.0 for hardwoods. So while there were increases in both growth and removals, the ratio between the two remained basically unchanged (fig. 9).
Figure 9—Average annual net growth and removals by major species group and survey year, South Carolina.
Major species group and survey year
Vol
ume
(mill
ion
cubi
c fe
et p
er y
ear)
0
100
200
300
400
500
600
700
800
900
1,000Growth Removals
2006 2011Softwood
2006 2011Hardwood
Table 11—Average annual net growth per acre by major species group and stand origin, South Carolina, 2011
Major species group Total
Stand origin
Natural stands
Planted stands
cubic feet per acre per year
Softwoods 134.9 99.6 169.0Hardwoods 67.2 65.1 118.3
All groups 98.3 75.3 164.5

14
Growth and Removals
Piles of logging slash from a recent clearcut located in Fairfield County, SC.
15
Forest Health
FOREST HEALTH
Mortality on South Carolina’s forest land averaged 171.3 million cubic feet per year for the 2011 survey (see appendix table C.25). This was a decrease of 13.5 percent over the previous survey when mortality averaged 198.1 million cubic feet per year. At the species level, some species saw decreases in mortality, while others saw increases. Loblolly pine had the highest mortality (as would be expected, as this species accounted for the most volume) at 59.2 million cubic feet per year. This was a decrease of 20.4 percent from the previous survey. Sweetgum (12.6 million cubic feet per year) and red maple (11.7 million cubic feet per year) were second and third, respectively, for mortality.
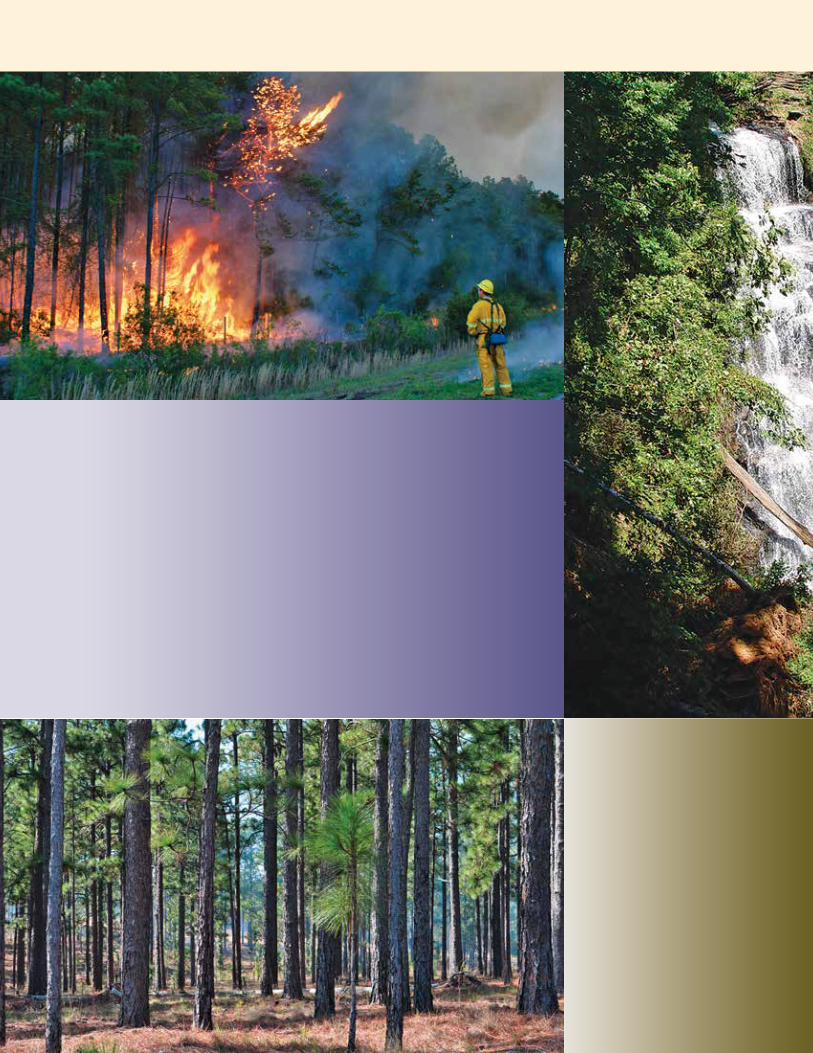
Fire (from all causes) affected an estimated 103,900 acres of forest land per year in South Carolina between 2007 and 2011 (see appendix table C.8). This was a significant increase over the previous survey when fire affected an estimated 60,400 acres of forest land per year.
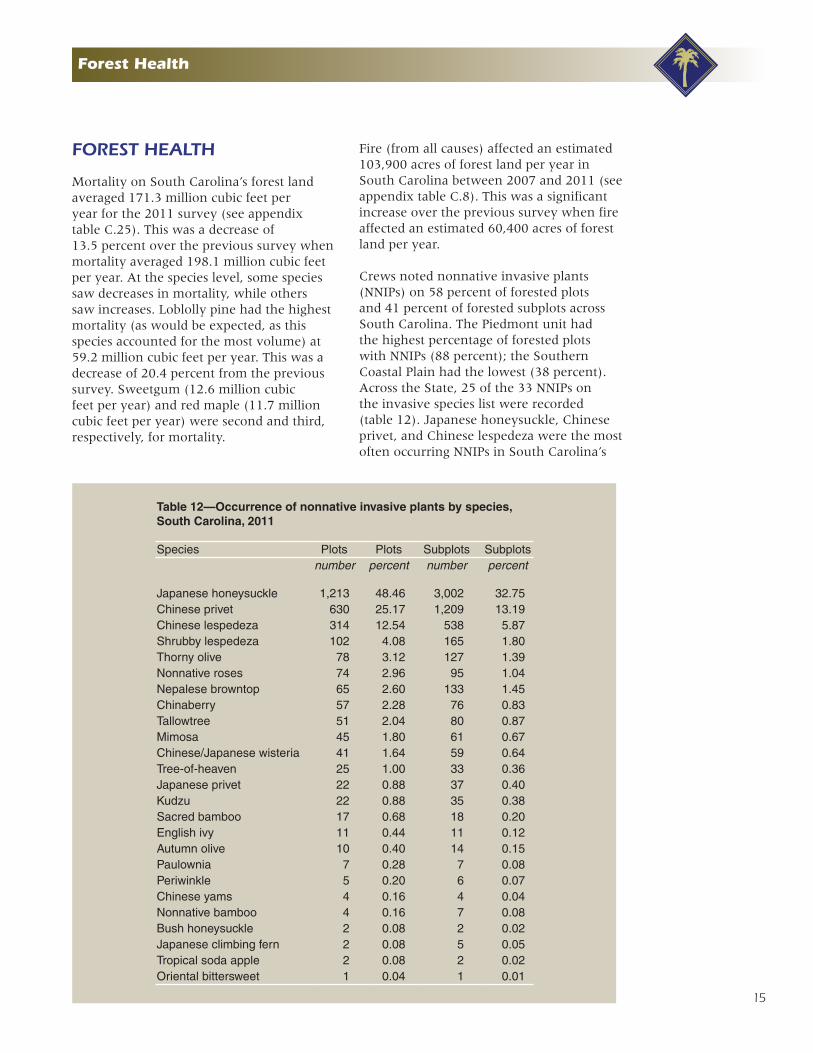
Crews noted nonnative invasive plants (NNIPs) on 58 percent of forested plots and 41 percent of forested subplots across South Carolina. The Piedmont unit had the highest percentage of forested plots with NNIPs (88 percent); the Southern Coastal Plain had the lowest (38 percent). Across the State, 25 of the 33 NNIPs on the invasive species list were recorded (table 12). Japanese honeysuckle, Chinese privet, and Chinese lespedeza were the most often occurring NNIPs in South Carolina’s
Table 12—Occurrence of nonnative invasive plants by species, South Carolina, 2011
Species Plots Plots Subplots Subplotsnumber percent number percent
Japanese honeysuckle 1,213 48.46 3,002 32.75Chinese privet 630 25.17 1,209 13.19Chinese lespedeza 314 12.54 538 5.87Shrubby lespedeza 102 4.08 165 1.80Thorny olive 78 3.12 127 1.39Nonnative roses 74 2.96 95 1.04Nepalese browntop 65 2.60 133 1.45Chinaberry 57 2.28 76 0.83Tallowtree 51 2.04 80 0.87Mimosa 45 1.80 61 0.67Chinese/Japanese wisteria 41 1.64 59 0.64Tree-of-heaven 25 1.00 33 0.36Japanese privet 22 0.88 37 0.40Kudzu 22 0.88 35 0.38Sacred bamboo 17 0.68 18 0.20English ivy 11 0.44 11 0.12Autumn olive 10 0.40 14 0.15Paulownia 7 0.28 7 0.08Periwinkle 5 0.20 6 0.07Chinese yams 4 0.16 4 0.04Nonnative bamboo 4 0.16 7 0.08Bush honeysuckle 2 0.08 2 0.02Japanese climbing fern 2 0.08 5 0.05Tropical soda apple 2 0.08 2 0.02Oriental bittersweet 1 0.04 1 0.01
16
Forest Health
forests. These three NNIPs occurred on 48, 25, and 13 percent of forested plots, respectively. There was one new species recorded (oriental bittersweet), and two species that were recorded during the 2006 survey, but not during the 2011 survey (tall fescue and winged burning bush). This does not necessarily mean, however, that these two species disappeared from South Carolina. During the 2011 survey, crews only recorded the four most prevalent NNIPs present on a subplot, so while tall fescue may have been present, it may not have been recorded due to a lower prevalence than other NNIPs that were also present on the subplot.
FIA assesses several additional indicators to aid in the detection of potential forest health issues that may warrant further evaluation. These Phase 3 (P3) indicators include ozone-induced injury, crown condition, and down woody material. Readers should be
aware that these indicators are based on a smaller plot population than the regular, Phase 2 (P2), sample, where approximately 1 out of every 16 P2 plots is a P3 plot, or 1 plot per 96,000 acres. In addition, no P3 data were collected during the 2011 field season due to budgetary constraints.
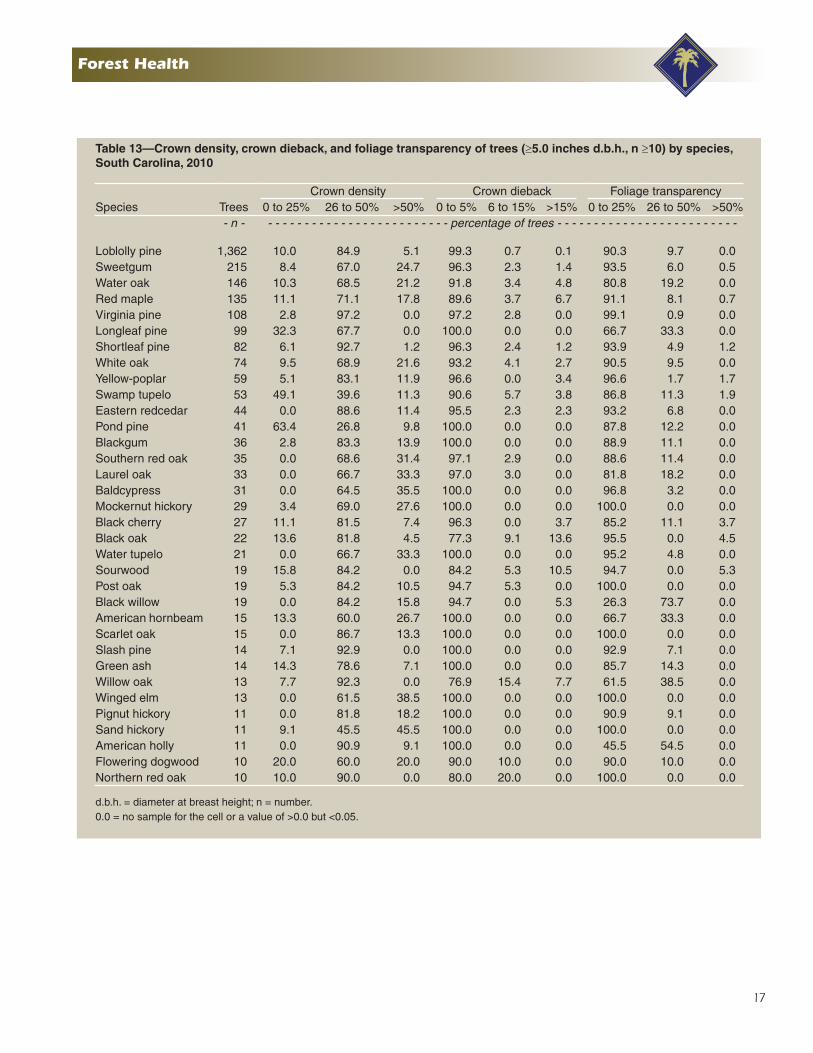
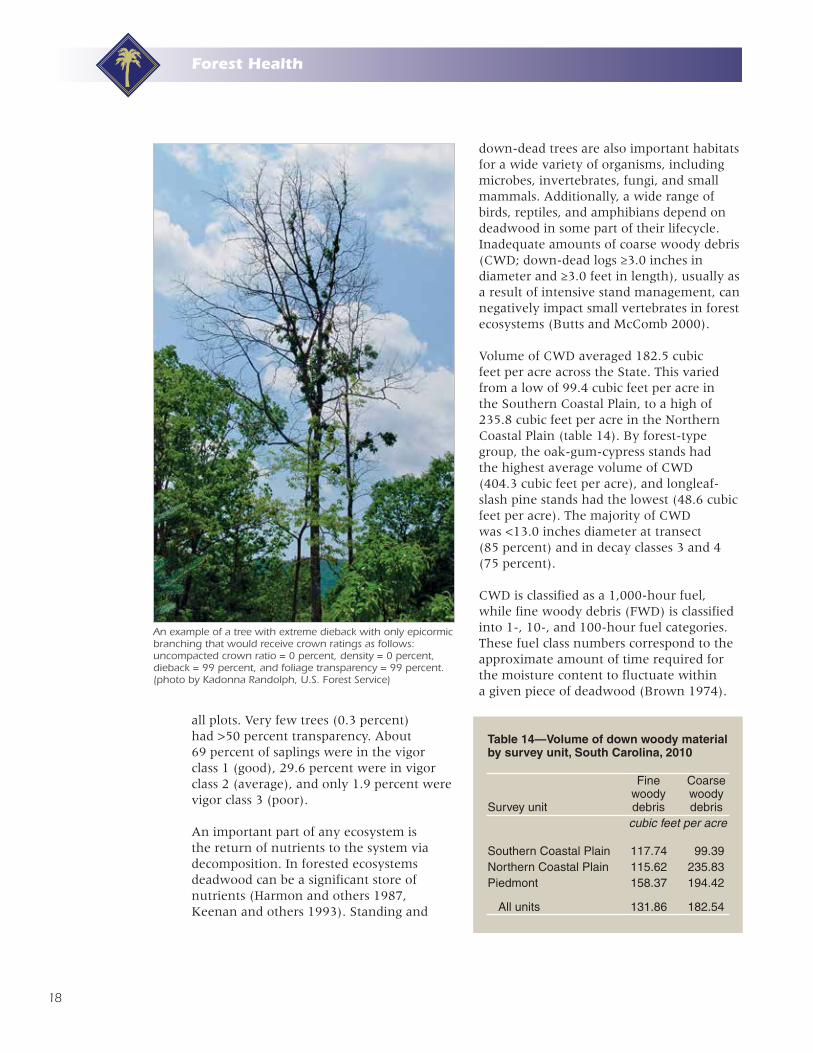
Tree crown condition is a potential indicator of forest health. Unusually poor crown conditions or changes in crown conditions through time can indicate areas of concern that may warrant further investigation. Crown density averaged 42 percent across all plots. There were six species (three softwoods and three hardwoods) that had no trees with a crown density >50 percent (table 13). Crown dieback averaged 1.3 percent across all plots. Black oak, sourwood, and willow oak had the highest percentage of trees with >15 percent dieback (table 13). Foliage transparency averaged 20.3 percent across
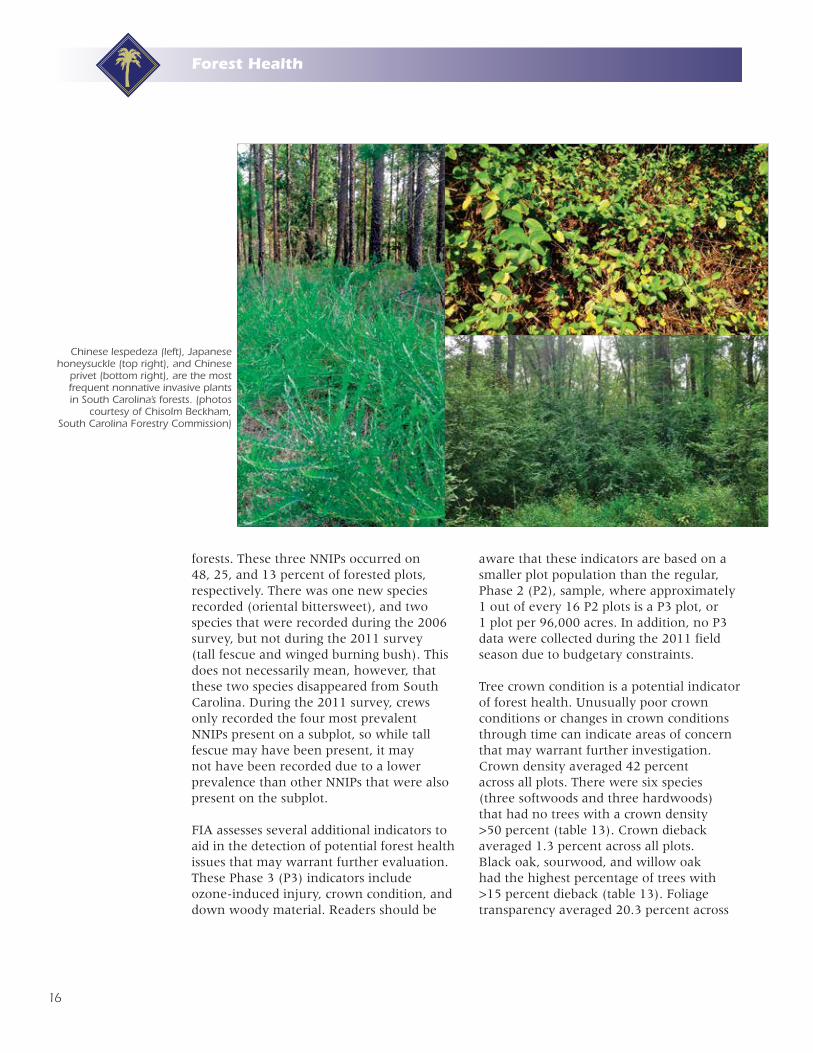
Chinese lespedeza (left), Japanese honeysuckle (top right), and Chinese
privet (bottom right), are the most frequent nonnative invasive plants in South Carolina’s forests. (photos
courtesy of Chisolm Beckham, South Carolina Forestry Commission)
17
Forest Health
Table 13—Crown density, crown dieback, and foliage transparency of trees (≥5.0 inches d.b.h., n ≥10) by species, South Carolina, 2010
Species TreesCrown density Crown dieback Foliage transparency
0 to 25% 26 to 50% >50% 0 to 5% 6 to 15% >15% 0 to 25% 26 to 50% >50%- n - - - - - - - - - - - - - - - - - - - - - - - - - - percentage of trees - - - - - - - - - - - - - - - - - - - - - - - - -
Loblolly pine 1,362 10.0 84.9 5.1 99.3 0.7 0.1 90.3 9.7 0.0Sweetgum 215 8.4 67.0 24.7 96.3 2.3 1.4 93.5 6.0 0.5Water oak 146 10.3 68.5 21.2 91.8 3.4 4.8 80.8 19.2 0.0Red maple 135 11.1 71.1 17.8 89.6 3.7 6.7 91.1 8.1 0.7Virginia pine 108 2.8 97.2 0.0 97.2 2.8 0.0 99.1 0.9 0.0Longleaf pine 99 32.3 67.7 0.0 100.0 0.0 0.0 66.7 33.3 0.0Shortleaf pine 82 6.1 92.7 1.2 96.3 2.4 1.2 93.9 4.9 1.2White oak 74 9.5 68.9 21.6 93.2 4.1 2.7 90.5 9.5 0.0Yellow-poplar 59 5.1 83.1 11.9 96.6 0.0 3.4 96.6 1.7 1.7Swamp tupelo 53 49.1 39.6 11.3 90.6 5.7 3.8 86.8 11.3 1.9Eastern redcedar 44 0.0 88.6 11.4 95.5 2.3 2.3 93.2 6.8 0.0Pond pine 41 63.4 26.8 9.8 100.0 0.0 0.0 87.8 12.2 0.0Blackgum 36 2.8 83.3 13.9 100.0 0.0 0.0 88.9 11.1 0.0Southern red oak 35 0.0 68.6 31.4 97.1 2.9 0.0 88.6 11.4 0.0Laurel oak 33 0.0 66.7 33.3 97.0 3.0 0.0 81.8 18.2 0.0Baldcypress 31 0.0 64.5 35.5 100.0 0.0 0.0 96.8 3.2 0.0Mockernut hickory 29 3.4 69.0 27.6 100.0 0.0 0.0 100.0 0.0 0.0Black cherry 27 11.1 81.5 7.4 96.3 0.0 3.7 85.2 11.1 3.7Black oak 22 13.6 81.8 4.5 77.3 9.1 13.6 95.5 0.0 4.5Water tupelo 21 0.0 66.7 33.3 100.0 0.0 0.0 95.2 4.8 0.0Sourwood 19 15.8 84.2 0.0 84.2 5.3 10.5 94.7 0.0 5.3Post oak 19 5.3 84.2 10.5 94.7 5.3 0.0 100.0 0.0 0.0Black willow 19 0.0 84.2 15.8 94.7 0.0 5.3 26.3 73.7 0.0American hornbeam 15 13.3 60.0 26.7 100.0 0.0 0.0 66.7 33.3 0.0Scarlet oak 15 0.0 86.7 13.3 100.0 0.0 0.0 100.0 0.0 0.0Slash pine 14 7.1 92.9 0.0 100.0 0.0 0.0 92.9 7.1 0.0Green ash 14 14.3 78.6 7.1 100.0 0.0 0.0 85.7 14.3 0.0Willow oak 13 7.7 92.3 0.0 76.9 15.4 7.7 61.5 38.5 0.0Winged elm 13 0.0 61.5 38.5 100.0 0.0 0.0 100.0 0.0 0.0Pignut hickory 11 0.0 81.8 18.2 100.0 0.0 0.0 90.9 9.1 0.0Sand hickory 11 9.1 45.5 45.5 100.0 0.0 0.0 100.0 0.0 0.0American holly 11 0.0 90.9 9.1 100.0 0.0 0.0 45.5 54.5 0.0Flowering dogwood 10 20.0 60.0 20.0 90.0 10.0 0.0 90.0 10.0 0.0Northern red oak 10 10.0 90.0 0.0 80.0 20.0 0.0 100.0 0.0 0.0
d.b.h. = diameter at breast height; n = number.0.0 = no sample for the cell or a value of >0.0 but <0.05.
18
all plots. Very few trees (0.3 percent) had >50 percent transparency. About 69 percent of saplings were in the vigor class 1 (good), 29.6 percent were in vigor class 2 (average), and only 1.9 percent were vigor class 3 (poor).
An important part of any ecosystem is the return of nutrients to the system via decomposition. In forested ecosystems deadwood can be a significant store of nutrients (Harmon and others 1987, Keenan and others 1993). Standing and
down-dead trees are also important habitats for a wide variety of organisms, including microbes, invertebrates, fungi, and small mammals. Additionally, a wide range of birds, reptiles, and amphibians depend on deadwood in some part of their lifecycle. Inadequate amounts of coarse woody debris (CWD; down-dead logs ≥3.0 inches in diameter and ≥3.0 feet in length), usually as a result of intensive stand management, can negatively impact small vertebrates in forest ecosystems (Butts and McComb 2000).
Volume of CWD averaged 182.5 cubic feet per acre across the State. This varied from a low of 99.4 cubic feet per acre in the Southern Coastal Plain, to a high of 235.8 cubic feet per acre in the Northern Coastal Plain (table 14). By forest-type group, the oak-gum-cypress stands had the highest average volume of CWD (404.3 cubic feet per acre), and longleaf-slash pine stands had the lowest (48.6 cubic feet per acre). The majority of CWD was <13.0 inches diameter at transect (85 percent) and in decay classes 3 and 4 (75 percent).
CWD is classified as a 1,000-hour fuel, while fine woody debris (FWD) is classified into 1-, 10-, and 100-hour fuel categories. These fuel class numbers correspond to the approximate amount of time required for the moisture content to fluctuate within a given piece of deadwood (Brown 1974).
Forest Health
An example of a tree with extreme dieback with only epicormic branching that would receive crown ratings as follows: uncompacted crown ratio = 0 percent, density = 0 percent, dieback = 99 percent, and foliage transparency = 99 percent. (photo by Kadonna Randolph, U.S. Forest Service)
Table 14—Volume of down woody material by survey unit, South Carolina, 2010
Survey unit
Fine woody debris
Coarse woody debris
cubic feet per acre
Southern Coastal Plain 117.74 99.39Northern Coastal Plain 115.62 235.83Piedmont 158.37 194.42
All units 131.86 182.54
19
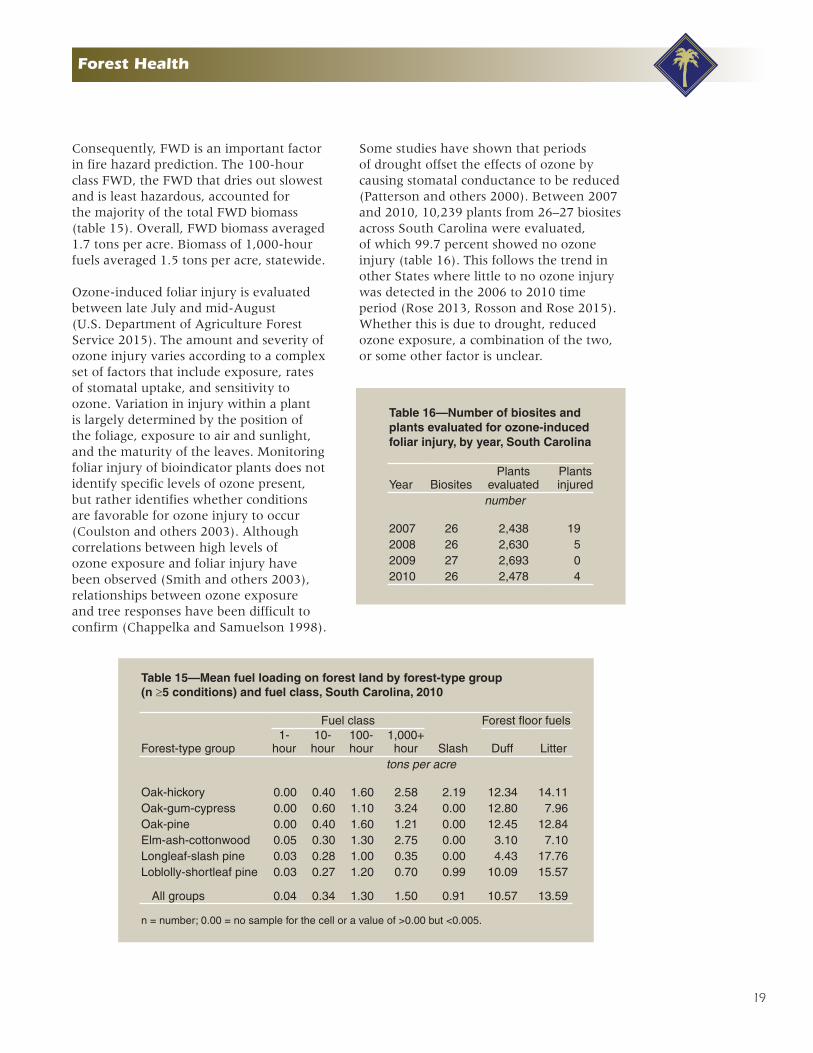
Consequently, FWD is an important factor in fire hazard prediction. The 100-hour class FWD, the FWD that dries out slowest and is least hazardous, accounted for the majority of the total FWD biomass (table 15). Overall, FWD biomass averaged 1.7 tons per acre. Biomass of 1,000-hour fuels averaged 1.5 tons per acre, statewide.
Ozone-induced foliar injury is evaluated between late July and mid-August (U.S. Department of Agriculture Forest Service 2015). The amount and severity of ozone injury varies according to a complex set of factors that include exposure, rates of stomatal uptake, and sensitivity to ozone. Variation in injury within a plant is largely determined by the position of the foliage, exposure to air and sunlight, and the maturity of the leaves. Monitoring foliar injury of bioindicator plants does not identify specific levels of ozone present, but rather identifies whether conditions are favorable for ozone injury to occur (Coulston and others 2003). Although correlations between high levels of ozone exposure and foliar injury have been observed (Smith and others 2003), relationships between ozone exposure and tree responses have been difficult to confirm (Chappelka and Samuelson 1998).
Forest Health
Some studies have shown that periods of drought offset the effects of ozone by causing stomatal conductance to be reduced (Patterson and others 2000). Between 2007 and 2010, 10,239 plants from 26–27 biosites across South Carolina were evaluated, of which 99.7 percent showed no ozone injury (table 16). This follows the trend in other States where little to no ozone injury was detected in the 2006 to 2010 time period (Rose 2013, Rosson and Rose 2015). Whether this is due to drought, reduced ozone exposure, a combination of the two, or some other factor is unclear.
Table 15—Mean fuel loading on forest land by forest-type group (n ≥5 conditions) and fuel class, South Carolina, 2010
Forest-type group
Fuel class
Slash
Forest floor fuels1-
hour10-hour
100-hour
1,000+ hour Duff Litter
tons per acre
Oak-hickory 0.00 0.40 1.60 2.58 2.19 12.34 14.11Oak-gum-cypress 0.00 0.60 1.10 3.24 0.00 12.80 7.96Oak-pine 0.00 0.40 1.60 1.21 0.00 12.45 12.84Elm-ash-cottonwood 0.05 0.30 1.30 2.75 0.00 3.10 7.10Longleaf-slash pine 0.03 0.28 1.00 0.35 0.00 4.43 17.76Loblolly-shortleaf pine 0.03 0.27 1.20 0.70 0.99 10.09 15.57
All groups 0.04 0.34 1.30 1.50 0.91 10.57 13.59
n = number; 0.00 = no sample for the cell or a value of >0.00 but <0.005.
Table 16—Number of biosites and plants evaluated for ozone-induced foliar injury, by year, South Carolina
Year BiositesPlants
evaluatedPlants injured
number
2007 26 2,438 192008 26 2,630 52009 27 2,693 02010 26 2,478 4
20
Literature Cited
LITERATURE CITED
Bechtold, W.A.; Patterson, P.L., eds. 2005. The enhanced Forest Inventory and Analysis program—national sampling design and estimation procedures. Gen. Tech. Rep. SRS–80. Asheville, NC: U.S. Department of Agriculture Forest Service, Southern Research Station. 85 p.
Brown, J.K. 1974. Handbook for inventorying downed woody material. Gen. Tech. Rep. INT–16. Ogden, UT: U.S. Department of Agriculture Forest Service, Intermountain Forest and Range Experiment Station. 24 p.
Butler, B.J. 2008. Family forest owners of the United States, 2006. Gen. Tech. Rep. NRS–GTR–27. Newtown Square, PA: U.S. Department of Agriculture Forest Service, Northern Research Station. 73 p.
Butler, B.J.; Leatherberry, E.C.; Williams, M.S. 2005. Design, implementation, and analysis methods for the national woodland owner survey. Gen. Tech. Rep. NE–336. Newtown, PA: U.S. Department of Agriculture Forest Service, Northeastern Research Station. 43 p.
Butts, S.R.; McComb, W.C. 2000. Associations of forest-floor vertebrates with coarse woody debris in managed forests of western Oregon. Journal of Wildlife Management. 64(1): 95–104.
Chappelka, A.H.; Samuelson, L.J. 1998. Ambient ozone effects on forest trees of the Eastern United States: a review. New Phytologist. 139(1): 91–108.
Conner, R.C.; Adams, T.; Butler, B. [and others]. 2004. The State of South Carolina’s forests, 2001. Resour. Bull. SRS–96. Asheville, NC: U.S. Department of Agriculture Forest Service, Southern Research Station. 67 p.
Conner, R.C.; Adams, T.O.; Johnson, T.G.; Oswalt, S.N. 2009. South Carolina’s forests, 2006. Resour. Bull. SRS–158. Asheville, NC: U.S. Department of Agriculture Forest Service, Southern Research Station. 57 p.
Coulston, J.W.; Smith, G.C.; Smith, W.D. 2003. Regional assessment of ozone sensitive tree species using bioindicator plants. Environmental Monitoring and Assessment. 83: 113–127.
Harmon, M.E.; Cromack, K., Jr.; Smith, B.G. 1987. Coarse woody debris in mixed-conifer forests, Sequoia National Park, California. Canadian Journal of Forest Research. 17: 1265–1272.
Keenan, R.J.; Prescott, C.E.; Kimmins, J.P. 1993. Mass and nutrient content of woody debris and forest floor in western red cedar and western hemlock forests on northern Vancouver Island. Canadian Journal of Forest Research. 23: 1052–1059.
Patterson, M.C.; Samuelson, L.; Somers, G.; Mays, A. 2000. Environmental control of stomatal conductance in forest trees of the Great Smoky Mountains National Park. Environmental Pollution. 110: 225–233.
Rose, A.K. 2013. Virginia’s forests, 2011. Resour. Bull. SRS–197. Asheville, NC: U.S. Department of Agriculture Forest Service, Southern Research Station. 92 p.
Rosson, J.F., Jr.; Rose, A.K. 2015. Arkansas’ forests, 2010. Resour. Bull. SRS–203. Asheville, NC: U.S. Department of Agriculture Forest Service, Southern Research Station. 100 p.
21
Smith, G.; Coulston, J.; Jepsen, E.; Prichard, T. 2003. A national ozone biomonitoring program—results from field surveys of ozone sensitive plants in northeastern forests (1994–2000). Environmental Monitoring and Assessment. 87(3): 271–291.
Tansey, J.B.; Hutchins, C.C., Jr. 1988. South Carolina’s forests. Resour. Bull. SE–103. Asheville, NC: U.S. Department of Agriculture Forest Service, Southeastern Forest Experiment Station. 96 p.
U.S. Department of Agriculture Forest Service. 1992. Forest Service resource inventories: an overview. Washington, DC: U.S. Department of Agriculture Forest Service, Forest Inventory, Economics, and Recreation Research. 39 p.
U.S. Department of Agriculture Forest Service. 2015. FIA field methods for phase 2 and phase 3 measurements. Arlington, VA: U.S. Department of Agriculture Forest Service, Forest Inventory and Analysis Program. [Not paged]. http://fia.fs.fed.us/library/field-guides-methods-proc/. [Date accessed: June 3, 2015].
Literature Cited
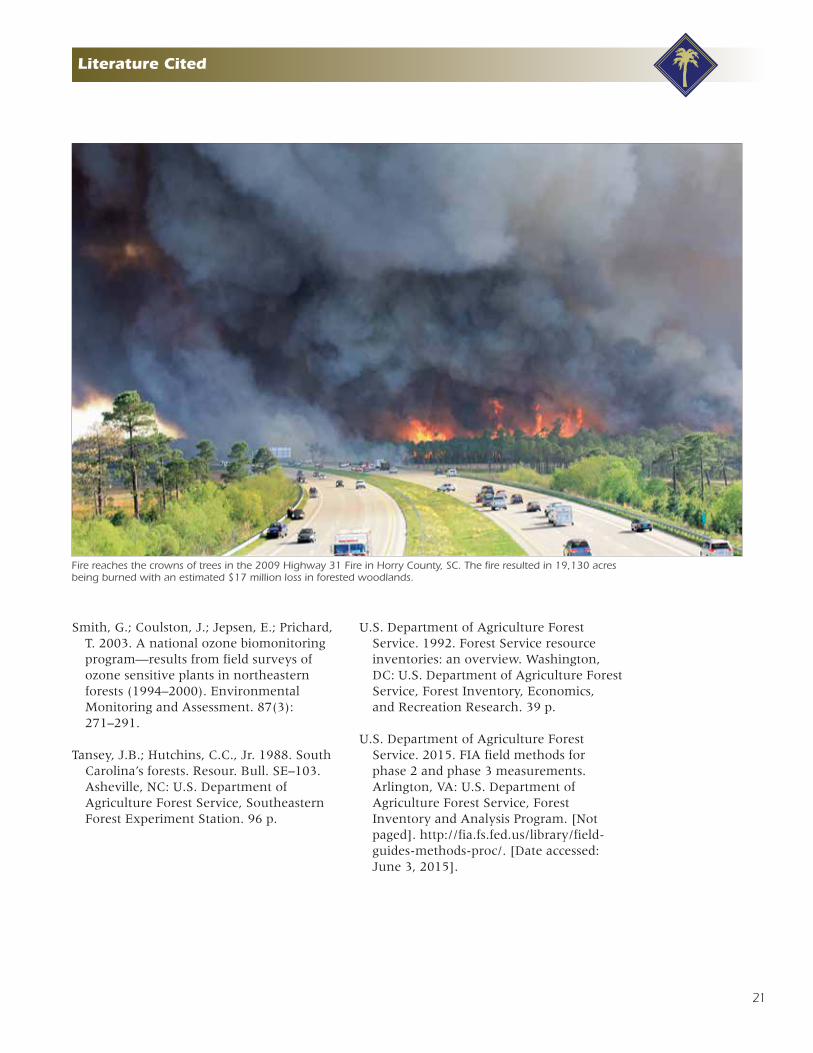
Fire reaches the crowns of trees in the 2009 Highway 31 Fire in Horry County, SC. The fire resulted in 19,130 acres being burned with an estimated $17 million loss in forested woodlands.
22
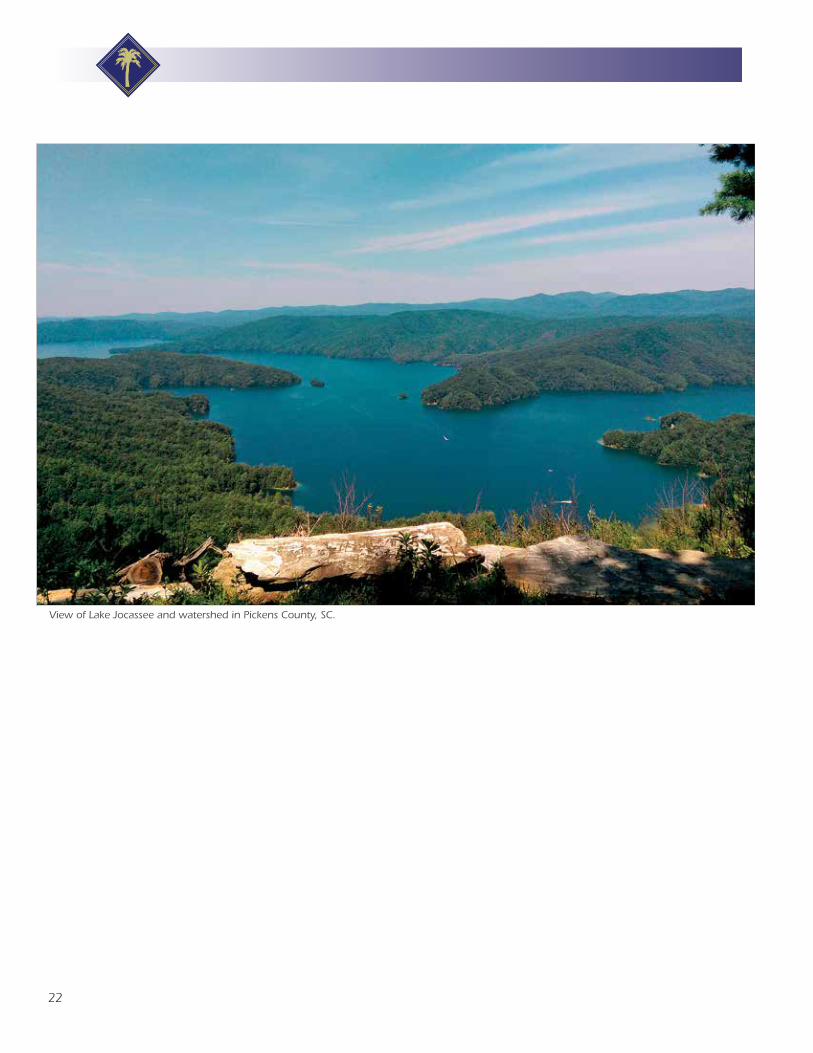
View of Lake Jocassee and watershed in Pickens County, SC.
23
Glossary
GLOSSARY
All-live tree—All living trees. All size classes, all tree classes, and both saw-log and nonsaw-log species are included. See: FIA tree species list in the field manual.
Average annual mortality—Average annual volume of trees ≥5.0 inches d.b.h. that died from human and natural causes during the intersurvey period, excluding those removed by harvesting, cultural operations, land clearing or changes in land use.
Average annual removals—Average annual volume of trees ≥5.0 inches d.b.h. removed from the inventory by harvesting, cultural operations (such as timber-stand improvement), land clearing, or changes in land use during the intersurvey period.
Average net annual growth—Average annual net change in volume of trees ≥5.0 inches d.b.h./d.r.c. without taking into account losses from cutting (gross growth minus mortality) during the intersurvey period.
Biomass—For the southern region, total aboveground biomass is estimated using allometric equations and is defined as the aboveground weight of wood and bark in live trees ≥1.0 inch d.b.h./d.r.c. from the ground to the tip of the tree, excluding all foliage (leaves, needles, buds, fruit, and limbs <0.5 inch in diameter). Biomass is expressed as oven-dry weight and the units are tons.
Note: the weight of wood and bark in limbs <0.5 inch in diameter is included in the biomass of small-diameter trees.
Blind check—A reinstallation done by a qualified inspection crew without production crew data on hand; at least two full subplots are completely remeasured along with all the plot level information. The two datasets are maintained separately. Discrepancies between the two sets of data are not reconciled. See: Quality assurance and quality control.
Bole—Trunk or main stem of a tree. See: Main stem.
Census water—See: Land use.
Coarse woody debris (CWD)—Downed, dead tree and shrub boles, large limbs, and other woody pieces with a minimum small-end diameter of ≥3 inches and a length of ≥3 feet not attached to a living or standing dead source.
Cold check—An inspection done either as part of the training process, or as part of the ongoing quality control program. Normally the installation crew is not present at the time of inspection. The inspector has the completed data in-hand at the time of inspection. The inspection can include the whole plot or a subset of the plot. Data errors are corrected. See: Quality assurance and quality control.
Condition class—The combination of discrete landscape and forest attributes that identify, define, and stratify the area associated with a plot. Examples of such attributes include condition status, forest type, stand origin, stand size, owner group, reserve status and stand density.
Crown—The part of a tree or woody plant bearing live branches or foliage.

24
Glossary
Crown vigor class—A visual assessment of the apparent crown vigor of saplings. The purpose is to separate excellent saplings with superior crowns from stressed individuals with poor crowns.
Crown density—The amount of crown stem, branches, twigs, shoots, buds, foliage, and reproductive structures that block light penetration through the projected crown outline. Measured as a percentage.
Crown dieback—Recent mortality of branches with fine twigs, which begins at the terminal portion of a branch and proceeds toward the trunk. Dieback is only considered when it occurs in the upper and outer portions of the tree. Dead branches in the lower live crown are not considered as part of crown dieback, unless there is continuous dieback from the upper and outer crown down to those branches.
Cycle—One sequential and complete set of panels.
Diameter at breast height (d.b.h.)—The diameter for tree stem, located at 4.5 feet above the ground (breast height) on the uphill side of a tree. The point of diameter measurement may vary on abnormally formed trees.
Diameter class—A classification of trees based on diameter outside bark, measured at breast height (d.b.h.) above the ground or at root collar (d.r.c.). Note: Diameter classes are commonly in 2-inch increments, beginning with 2-inches. Each class provides a range of values with the class name being the approximate midpoint. For example, the 6-inch class includes trees 5.0 through 6.9 inches d.b.h.
Disturbance—Natural or human-caused disruption that is ≥1.0 acre in size and results in mortality and/or damage to 25 percent of all trees in a stand or 50 percent of an individual species’ count or, in the case when the disturbance does not initially affect tree growth or health (e.g. grazing, browsing, flooding, etc.),
affects 25 percent of the soil surface or understory vegetation. For initial forest plot establishment the disturbance must be within the last 5 years. For remeasured plots only those disturbances that have occurred since the previous inventory are recognized.
Down woody material (DWM)—DWM is dead material on the ground in various stages of decay. It includes coarse and fine woody material. Previously named down woody debris (DWD). The depth of duff layer, litter layer, and overall fuelbed; fuel loading on the microplot; and residue piles are also measured as part of the DWM indicator for FIA.
Dry weight—The oven-dry weight of biomass.
Federal land—An ownership class of public lands owned by the U.S. Government. See: Ownership.
Fine woody debris (FWD)—Downed, dead branches, twigs, and small tree or shrub boles <3 inches in diameter not attached to a living or standing dead source.
Fixed-radius plot—A circular sampled area with a specified radius in which all trees of a given size, shrubs, or other items are tallied.
Foliage transparency—The amount of skylight visible through microholes in the live portion of the crown, i.e. where you see foliage, normal or damaged, or remnants of its recent presence. Recently defoliated branches are included in foliage transparency measurements. Macroholes are excluded unless they are the result of recent defoliation. Dieback and dead branches are always excluded from the estimate. Foliage transparency is different from crown density because it emphasizes foliage and ignores stems, branches, fruits, and holes in the crown.
Forest floor—The entire thickness of organic material overlying the mineral soil, consisting of the litter and the duff (humus).

25
Glossary
Forest industry land—See: Ownership.
Forest land—Land that is at least 10 percent stocked by forest trees of any size, or land formerly having such tree cover, and is not currently developed for a nonforest use. The minimum area for classification as forest land is 1 acre. Roadside, streamside, and shelterbelt strips of timber must be at least 120 feet wide to qualify as forest land. Unimproved roads and trails, streams and other bodies of water, or natural clearings in forested areas shall be classified as forest, if <120 feet in width or 1.0 acre in size. Forest land is divided into timberland, reserved forest land, and other forest land (such as woodland).
Forest type—A classification of forest land based upon and named for the tree species that forms the plurality of live-tree stocking. A forest-type classification for a field location indicates the predominant live-tree species cover for the field location; hardwoods and softwoods are first grouped to determine predominant group, and forest type is selected from the predominant group.
Forest-type group—A combination of forest types that share closely associated species or site requirements.
Examples for the Southern Region include:
Elm-ash-cottonwood—Forests in which elm, ash, or cottonwood, singly or in combination, constitute a plurality of the stocking. (Common associates include willow, sycamore, beech, and maple.)
Loblolly-shortleaf pine—Forests in which loblolly pine, shortleaf pine, or other southern yellow pines, except longleaf or slash pine, singly or in combination, constitute a plurality of the stocking. (Common associates include oak, hickory, and gum.)
Longleaf-slash pine—Forests in which longleaf or slash pine constitute a
majority of the stocking (Common associates include: loblolly pine, shortleaf pine, various oak species and well as a variety of hardwoods.)
Maple-beech-birch—Forests in which maple, beech, or yellow birch, singly or in combination, constitute a plurality of the stocking. (Common associates include hemlock, elm, basswood, and white pine.)
Oak-gum-cypress—Bottomland forests in which tupelo, blackgum, sweetgum, oaks, or southern cypress, singly or in combination, constitute a plurality of the stocking, except where pines account for 25 to 50 percent of stocking, in which case the stand is classified as oak-pine. (Common associates include cottonwood, willow, ash, elm, hackberry, and maple.)
Oak-hickory—Forests in which upland oaks or hickory, singly or in combination, constitute a plurality of the stocking, except where pines account for 25 to 50 percent, in which case the stand is classified oak-pine. (Common associates include yellow-poplar, elm, maple, and black walnut.)
Oak-pine—Forests in which hardwoods (usually upland oaks) constitute a plurality of the stocking but in which pines account for 25 to 50 percent of the stocking. (Common associates include gum, hickory, and yellow-poplar.)
Fuel class—Categories of forest fire fuels defined by the approximate amount of time it takes for moisture conditions to fluctuate. Large coarse woody debris pieces take longer to dry out than smaller fine woody pieces.
1,000-hour fuels—Coarse woody debris with a transect diameter ≥3.0 inches in diameter and ≥3.0 feet long.
100-hour fuels—Fine woody debris with a transect diameter between 1.0 and 2.9 inches.
26
Glossary
10-hour fuels—Fine woody debris with a transect diameter between 0.25 and 0.9 inches.
1-hour fuels—Fine woody debris with a transect diameter ≤0.24 inches.
Growing-stock trees—Live large-diameter timber species (excludes nonsaw-log species) trees with one-third or more of the gross board-foot volume in the entire saw-log portion meeting grade, soundness, and size requirements or the potential to do so for medium-diameter and small-diameter trees. A growing-stock tree must have one 12-foot log or two noncontiguous 8-foot merchantable logs, now (large diameter) or prospectively (medium diameter and small diameter), to qualify as growing stock.
Hardwoods—Tree species belonging to the botanical divisions Magnoliophyta, Ginkgophyta, Cycadophyta, or Pteridophyta, usually angiospermic, dicotyledonous, broad-leaved and deciduous.
Soft hardwoods—Hardwood species with an average specific gravity of ≤0.50, such as gums, yellow-poplar, cottonwoods, red maple, basswoods, and willows.
Hard hardwoods—Hardwood species with an average specific gravity >0.50, such as oaks, hard maples, hickories, and beech.
Hot check—An inspection normally done as part of the training process. The inspector is present on the plot with the trainee and provides immediate feedback regarding data quality. Data errors are corrected. Hot checks can be done on training plots or production plots. See: Quality assurance and quality control.
Land—The area of dry land and land temporarily or partly covered by water, such as marshes, swamps, and river flood plains.
Land cover—The dominant vegetation or other kind of material that covers the land surface. A given land cover may have many land uses.
Land use—The purpose of human activity on the land; it is usually, but not always, related to land cover.
Southern regional present land use categories are as follows:
Accessible timberland—Land that is within the population of interest, is accessible, is on a subplot that can be occupied at subplot center, can safely be visited, and meets the criteria for forest land (see: forest land).
Accessible other forest land—Land that meets the definition of accessible forest land, but is incapable of producing 20 cubic feet per acre per year of industrial wood under natural conditions because of adverse site conditions. Adverse conditions include sterile soils, dry climate, poor drainage, high elevation, steepness and soil rockiness.
Agricultural land—Land managed for crops, pasture, or other agricultural use. The area must be at least 1.0 acre in size and 120 feet wide (with the exception of windbreak/shelterbelt, which has no minimum width). This land use includes cropland, pasture (improved through cultural practices), idle farmland, orchard, Christmas tree plantation, maintained wildlife opening, and windbreak/shelterbelt.
Rangeland—Land primarily composed of grasses, forbs, or shrubs. This includes lands vegetated naturally or artificially to provide a plant cover managed like native vegetation and does not meet the definition of pasture. The area must be at least ≥1.0 acre in size and ≤120 feet wide.
Developed—Land used primarily by humans for purposes other than forestry or agriculture. This land use includes cultural (business, industrial/commercial, residential, and other places of intense human activity), rights-of-way (improved roads, railway, power lines, maintained canal), recreation (parks, skiing, golf courses), and mining.
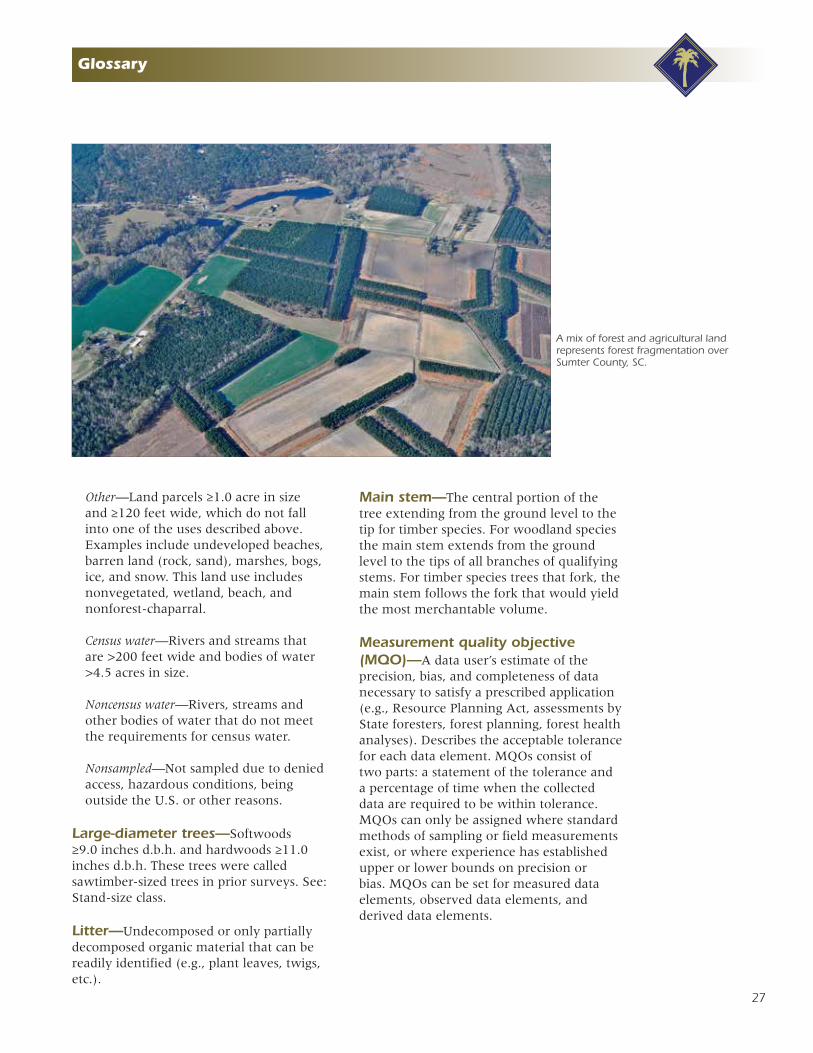
27
Glossary
Other—Land parcels ≥1.0 acre in size and ≥120 feet wide, which do not fall into one of the uses described above. Examples include undeveloped beaches, barren land (rock, sand), marshes, bogs, ice, and snow. This land use includes nonvegetated, wetland, beach, and nonforest-chaparral.
Census water—Rivers and streams that are >200 feet wide and bodies of water >4.5 acres in size.
Noncensus water—Rivers, streams and other bodies of water that do not meet the requirements for census water.
Nonsampled—Not sampled due to denied access, hazardous conditions, being outside the U.S. or other reasons.
Large-diameter trees—Softwoods ≥9.0 inches d.b.h. and hardwoods ≥11.0 inches d.b.h. These trees were called sawtimber-sized trees in prior surveys. See: Stand-size class.
Litter—Undecomposed or only partially decomposed organic material that can be readily identified (e.g., plant leaves, twigs, etc.).
Main stem—The central portion of the tree extending from the ground level to the tip for timber species. For woodland species the main stem extends from the ground level to the tips of all branches of qualifying stems. For timber species trees that fork, the main stem follows the fork that would yield the most merchantable volume.
Measurement quality objective (MQO)—A data user’s estimate of the precision, bias, and completeness of data necessary to satisfy a prescribed application (e.g., Resource Planning Act, assessments by State foresters, forest planning, forest health analyses). Describes the acceptable tolerance for each data element. MQOs consist of two parts: a statement of the tolerance and a percentage of time when the collected data are required to be within tolerance. MQOs can only be assigned where standard methods of sampling or field measurements exist, or where experience has established upper or lower bounds on precision or bias. MQOs can be set for measured data elements, observed data elements, and derived data elements.
A mix of forest and agricultural land represents forest fragmentation over Sumter County, SC.
28
Glossary
Medium-diameter tree—Softwood timber species 5.0 to 8.9 inches d.b.h. and hardwood timber species 5.0 to 10.9 inches d.b.h. These trees were called poletimber-sized trees in prior surveys. See: Stand-size class.
Microplot—A circular, fixed-radius plot with a radius of 6.8 feet (0.003 acre) that is used to sample trees <5.0 inches d.b.h./d.r.c., as well as other vegetation. Point center is 90 degrees and 12 feet offset from point center of each subplot.
National forest land—See: Ownership.
Noncensus water—See: Land use.
Nonforest land—Land that does not support or has never supported, forests, and lands formerly forested where use for timber management is precluded by development for other uses. Includes areas used for crops, improved pasture, residential areas, city parks, improved roads of any width and adjoining rights-of-way, power line clearings of any width, and noncensus water. If intermingled in forest areas, unimproved roads and nonforest strips must be ≥120 feet wide, and clearings, etc., ≥1.0 acre in size, to qualify as nonforest land.
Nonindustrial private forest land—See: Ownership.
Other forest land—Forest land other than timberland and reserved forest land. It includes available and reserved forest land that is incapable of producing 20 cubic feet per acre per year of wood under natural conditions because of adverse site conditions such as sterile soils, dry climate, poor drainage, high elevation, steepness, or rockiness.
Other public land—See: Ownership.
Other removals—The volume of trees removed from the inventory by cultural operations such as timber stand improvement, land clearing, and other changes in land use, resulting in the removal of the trees from timberland.
Ownership—A legal entity having control of a parcel or group of parcels of land. An ownership may be an individual; a combination of persons; a legal entity such as corporation, partnership, club, or trust; or a public agency.
National forest land—Federal land that has been legally designated as national forests or purchase units, and other land under the administration of the Forest Service, including experimental areas and Bankhead-Jones Title III land.
Forest industry land—An ownership class of private lands owned by a company or an individual(s) operating a primary wood-processing plant.
Nonindustrial private forest (NIPF) land—Privately owned land excluding forest industry land.
Corporate—Owned by corporations, including incorporated farm ownerships.
Individual—All lands owned by individuals, including farm operators.
Other public—An ownership class that includes all public lands except national forests.
Miscellaneous Federal land—Federal land other than national forests.
State, county, and municipal land—Land owned by States, counties, and local public agencies or municipalities, or land leased to these governmental units for 50 years or more.
29
Glossary
Phase 1 (P1)—FIA activities related to remote sensing, the primary purpose of which is to label plots and obtain stratum weights for population estimates.
Phase 2 (P2)—FIA activities conducted on the network of ground plots. The primary purpose is to obtain field data that enable classification and summarization of area, tree, and other attributes associated with forest land uses.
Phase 3 (P3)—A subset of Phase 2 plots where additional attributes related to forest health are measured.
Plantation—Stands that currently show evidence of being planted or artificially seeded.
Poletimber-sized tree—Softwood timber species 5.0 to 8.9 inches d.b.h. and hardwood timber species 5.0 to 10.9 inches d.b.h. Now referred to as medium-diameter trees.
Private land—See: Ownership.
Productivity class—A classification of forest land in terms of potential annual cubic-foot volume growth per acre at culmination of mean annual increment (MAI) in fully stocked natural stands.
Quality assurance (QA)—The total integrated program for ensuring that the uncertainties inherent in FIA data are known and do not exceed acceptable magnitudes, within a stated level of confidence. Quality assurance encompasses the plans, specifications, and policies affecting the collection, processing, and reporting of data. It is the system of activities designed to provide program managers and project leaders with independent assurance that total system quality control is being effectively implemented.
Quality control (QC)—The routine application of prescribed field and laboratory procedures (e.g., random check cruising, periodic calibration, instrument maintenance, use of certified standards, etc.) in order to reduce random and systematic errors and ensure that data are generated within known and acceptable performance limits. Quality control also ensures the use of qualified personnel; reliable equipment and supplies; training of personnel; good field and laboratory practices; and strict adherence to standard operating procedures.
Reserved forest land—Forest land where management for the production of wood products is prohibited through statute or administrative designation. Examples include national forest wilderness areas and national parks and monuments.
Reversion—Land that reverts from a nonforest land use to a forest land use.
Sapling—Live trees 1.0 to 4.9 inches d.b.h./d.r.c.
Seedling—Live trees <1.0 inch d.b.h./d.r.c. that are ≥6.0 inches in height for softwoods and ≥12.0 inches in height for hardwoods and >0.5 inch d.b.h./d.r.c. at ground level for longleaf pine.
Site index—The average total height that dominant and codominant trees in fully-stocked, even-aged stands will obtain at key ages (usually 25 or 50 years).
Small-diameter trees—Trees 1.0 to 4.9 inches in d.b.h./d.r.c. These were called sapling-seedling sized trees in prior surveys. See: Stand-size class.
Softwoods—Tree species belonging to the botanical division Coniferophyta, usually evergreen having needles or scale-like leaves.
30
Glossary
Species group—A collection of species used for reporting purposes.
Stand—Vegetation or a group of plants occupying a specific area and sufficiently uniform in species composition, age arrangement, structure, and condition as to be distinguished from the vegetation on adjoining areas.
Stand age—A stand descriptor that indicates the average age of the live dominant and codominant trees in the predominant stand-size class of a condition.
Standing dead tree—A dead tree ≥5.0 inches d.b.h. that has a bole which has an unbroken actual length of at least 4.5 feet, and lean <45 degrees from vertical as measured from the base of the tree to 4.5 feet.
Stand origin—A classification of forest stands describing their means of origin.
Planted—Planted or artificially seeded.
Natural—No evidence of artificial regeneration.
Stand-size class—A classification of forest land based on the diameter-class distribution of live trees in the stand. See definitions of large-, medium-, and small-diameter trees.
Large-diameter stands—Stands at least 10 percent stocked with live trees, with one-half or more of total stocking in large- and medium-diameter trees, and with large-diameter tree stocking at least equal to medium-diameter tree stocking.
Medium-diameter stands—Stands at least 10 percent stocked with live trees, with one-half or more of total stocking in medium- and large-diameter trees, and with medium-diameter tree stocking exceeding large-diameter tree stocking.
Small-diameter stands—Stands at least 10 percent stocked with live trees, in
which small-diameter trees account for more than one-half of total stocking.
Nonstocked stands—Stands <10 percent stocked with live trees.
State, county, and municipal land—See: Ownership.
Stocking—(1) At the tree level, stocking is the density value assigned to a sampled tree (usually in terms of numbers of trees or basal area per acre), expressed as a percent of the total tree density required to fully utilize the growth potential of the land. (2) At the stand level, stocking refers to the sum of the stocking values of all trees sampled.
Subplot—A circular area with a fixed horizontal radius of 24.0 feet (1⁄24 acre), primarily used to sample trees ≥5.0 inches at d.b.h./d.r.c.
Survivor tree—A sample tree alive at both the current and previous inventories.
Timberland—Forest land that is producing or capable of producing 20 cubic feet per acre or more per year of wood at culmination of MAI. Timberland excludes reserved forest lands.
Treatment—Forestry treatments are a form of human disturbance. The term treatment further implies that a silvicultural application has been prescribed. This does not include occasional stumps of unknown origin or sparse removals for firewood, Christmas trees, or other miscellaneous purposes. The area affected by any treatment must be at least 1.0 acre in size.
None—No observable treatment.
Cutting—The removal of one or more trees from a stand. SRS FIA categories are the following:
Clearcut harvest—The removal of the majority of the merchantable trees in a
31
Glossary
stand; residual stand stocking is under 50 percent.
Partial harvest—Removal primarily consisting of highest quality trees. Residual consists of lower quality trees because of high grading or selection harvest (e.g. uneven aged, group selection, high grading, species selection).
Seed-tree/shelterwood harvest—Crop trees are harvested leaving seed source trees either in a shelterwood or seed tree. Also includes the final harvest of the seed trees.
Commercial thinning—The removal of trees (usually of medium-diameter) from medium-diameter stands leaving sufficient stocking of growing-stock trees to feature in future stand development. Also included are thinning in large-diameter stands where medium-diameter trees have been removed to improve quality of those trees featured in a final harvest.
Timber stand improvement (cut trees only)—The cleaning, release, or other stand improvement involving noncommercial cutting applied to an immature stand that leaves sufficient stocking.
Salvage cutting—The harvesting of dead or damaged trees or of trees in danger of being killed by insects, disease, flooding, or other factors in order to save their economic value.
Site preparation—Clearing, slash burning, chopping, disking, bedding, or other practices clearly intended to prepare a site for either natural or artificial regeneration.
Artificial regeneration—Following a disturbance or treatment (usually cutting), a new stand where at least 50 percent of the live trees present resulted from planting or direct seeding.
Natural regeneration—Following a disturbance or treatment (usually cutting), a new stand where at least 50 percent of the live trees present (of any size) were established through the growth of existing trees and/or natural seeding or sprouting.
Other silvicultural treatment—The use of fertilizers, herbicides, girdling, pruning, or other activities designed to improve the commercial value of the residual stand, or chaining, which is a practice used on woodlands to encourage wildlife forage.
Tree—A woody perennial plant, typically large, with a single well-defined stem carrying a more or less definite crown; sometimes defined as attaining a minimum diameter of 3 inches and a minimum height of 15 feet at maturity. For FIA, any plant on the tree list in the current field manual is measured as a tree.
Tree class—An assessment of the general quality of a tree.
Cull species—Species measured at d.r.c. and timber species (measured at d.b.h.) that would not produce saw-logs. See national list of nonsaw-log species.
Growing stock—Live large-diameter timber species (excludes nonsaw-log species) trees with one-third or more of the gross board-foot volume in the entire saw-log portion meeting grade, soundness, and size requirements or the potential to do so for medium-diameter trees. A growing-stock tree must have one 12-foot log or two noncontiguous 8-foot merchantable logs, now (large-diameter) or prospectively (medium-diameter), to qualify as growing stock.
Rough cull—Trees that do not contain at least one 12-foot saw log or two 8-foot logs now or prospectively, primarily because of roughness or poor form. Less than 1⁄3 of its gross board-foot volume meets size, soundness, and grade
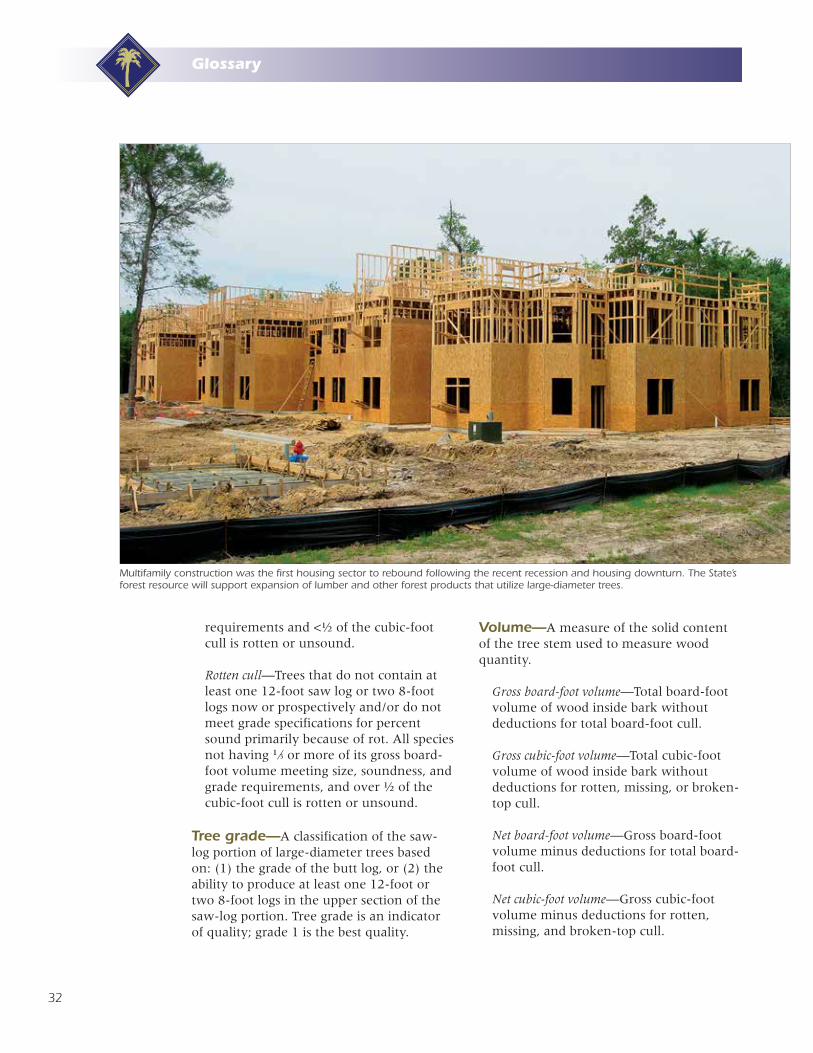
32
Glossary
requirements and <½ of the cubic-foot cull is rotten or unsound.
Rotten cull—Trees that do not contain at least one 12-foot saw log or two 8-foot logs now or prospectively and/or do not meet grade specifications for percent sound primarily because of rot. All species not having 1⁄3 or more of its gross board-foot volume meeting size, soundness, and grade requirements, and over ½ of the cubic-foot cull is rotten or unsound.
Tree grade—A classification of the saw-log portion of large-diameter trees based on: (1) the grade of the butt log, or (2) the ability to produce at least one 12-foot or two 8-foot logs in the upper section of the saw-log portion. Tree grade is an indicator of quality; grade 1 is the best quality.
Volume—A measure of the solid content of the tree stem used to measure wood quantity.
Gross board-foot volume—Total board-foot volume of wood inside bark without deductions for total board-foot cull.
Gross cubic-foot volume—Total cubic-foot volume of wood inside bark without deductions for rotten, missing, or broken-top cull.
Net board-foot volume—Gross board-foot volume minus deductions for total board-foot cull.
Net cubic-foot volume—Gross cubic-foot volume minus deductions for rotten, missing, and broken-top cull.
Multifamily construction was the first housing sector to rebound following the recent recession and housing downturn. The State’s forest resource will support expansion of lumber and other forest products that utilize large-diameter trees.
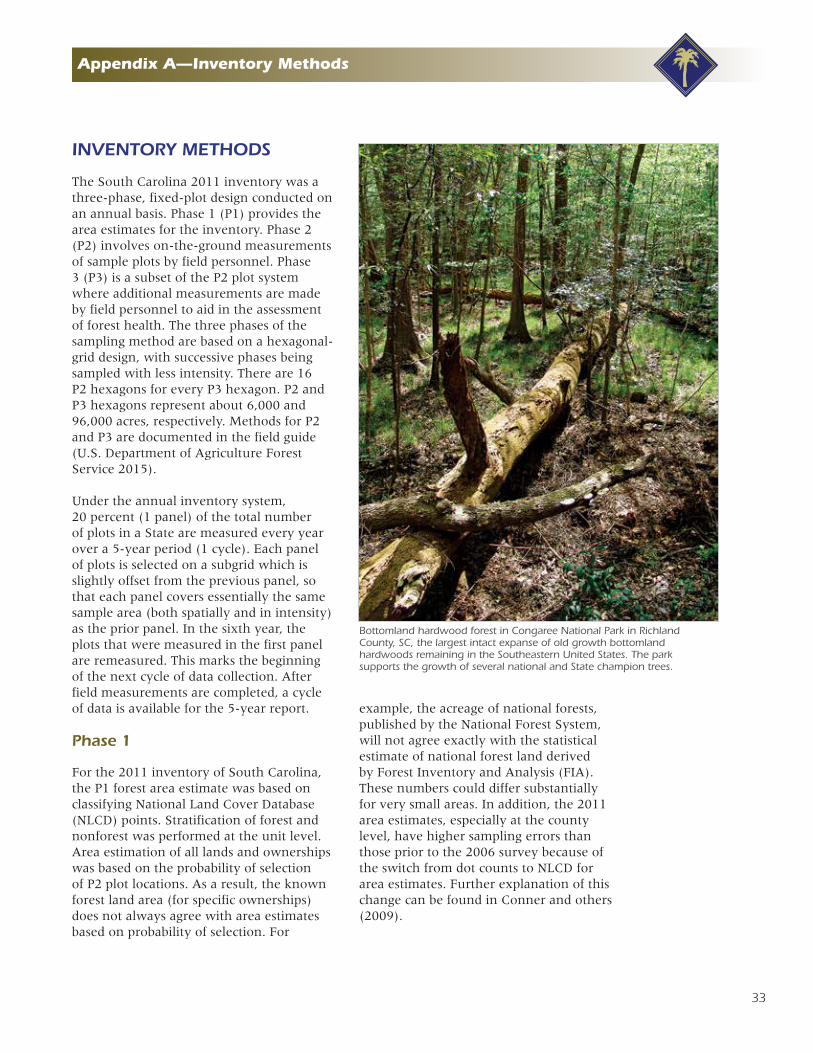
33
Appendix A—Inventory Methods
INVENTORY METHODS
The South Carolina 2011 inventory was a three-phase, fixed-plot design conducted on an annual basis. Phase 1 (P1) provides the area estimates for the inventory. Phase 2 (P2) involves on-the-ground measurements of sample plots by field personnel. Phase 3 (P3) is a subset of the P2 plot system where additional measurements are made by field personnel to aid in the assessment of forest health. The three phases of the sampling method are based on a hexagonal-grid design, with successive phases being sampled with less intensity. There are 16 P2 hexagons for every P3 hexagon. P2 and P3 hexagons represent about 6,000 and 96,000 acres, respectively. Methods for P2 and P3 are documented in the field guide (U.S. Department of Agriculture Forest Service 2015).
Under the annual inventory system, 20 percent (1 panel) of the total number of plots in a State are measured every year over a 5-year period (1 cycle). Each panel of plots is selected on a subgrid which is slightly offset from the previous panel, so that each panel covers essentially the same sample area (both spatially and in intensity) as the prior panel. In the sixth year, the plots that were measured in the first panel are remeasured. This marks the beginning of the next cycle of data collection. After field measurements are completed, a cycle of data is available for the 5-year report.
Phase 1
For the 2011 inventory of South Carolina, the P1 forest area estimate was based on classifying National Land Cover Database (NLCD) points. Stratification of forest and nonforest was performed at the unit level. Area estimation of all lands and ownerships was based on the probability of selection of P2 plot locations. As a result, the known forest land area (for specific ownerships) does not always agree with area estimates based on probability of selection. For
example, the acreage of national forests, published by the National Forest System, will not agree exactly with the statistical estimate of national forest land derived by Forest Inventory and Analysis (FIA). These numbers could differ substantially for very small areas. In addition, the 2011 area estimates, especially at the county level, have higher sampling errors than those prior to the 2006 survey because of the switch from dot counts to NLCD for area estimates. Further explanation of this change can be found in Conner and others (2009).
Bottomland hardwood forest in Congaree National Park in Richland County, SC, the largest intact expanse of old growth bottomland hardwoods remaining in the Southeastern United States. The park supports the growth of several national and State champion trees.
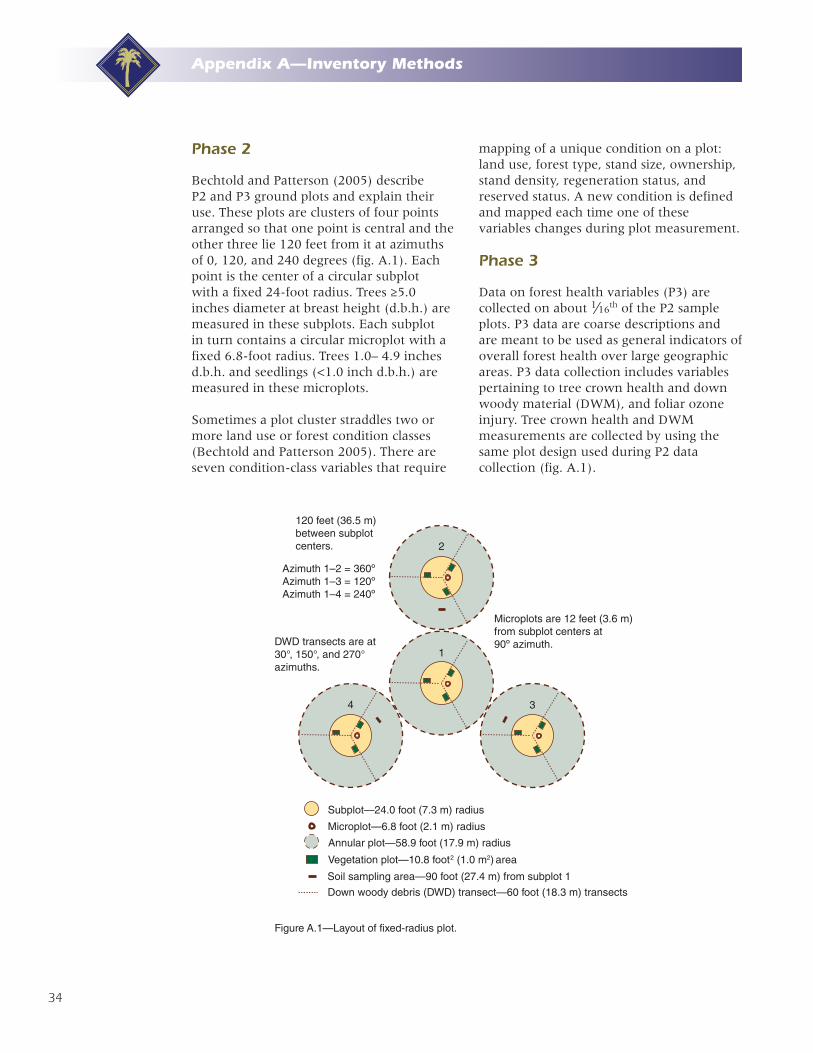
34
Appendix A—Inventory Methods
Figure A.1—Layout of fixed-radius plot.
Subplot—24.0 foot (7.3 m) radius
Microplot—6.8 foot (2.1 m) radius
Soil sampling area—90 foot (27.4 m) from subplot 1
Vegetation plot—10.8 foot2 (1.0 m2) area
Down woody debris (DWD) transect—60 foot (18.3 m) transects
Annular plot—58.9 foot (17.9 m) radius
Microplots are 12 feet (3.6 m) from subplot centers at 90º azimuth.
4
1
3
2
DWD transects are at 30°, 150°, and 270° azimuths.
Azimuth 1–2 = 360ºAzimuth 1–3 = 120ºAzimuth 1–4 = 240º
120 feet (36.5 m) between subplot centers.
Phase 2
Bechtold and Patterson (2005) describe P2 and P3 ground plots and explain their use. These plots are clusters of four points arranged so that one point is central and the other three lie 120 feet from it at azimuths of 0, 120, and 240 degrees (fig. A.1). Each point is the center of a circular subplot with a fixed 24-foot radius. Trees ≥5.0 inches diameter at breast height (d.b.h.) are measured in these subplots. Each subplot in turn contains a circular microplot with a fixed 6.8-foot radius. Trees 1.0– 4.9 inches d.b.h. and seedlings (<1.0 inch d.b.h.) are measured in these microplots.
Sometimes a plot cluster straddles two or more land use or forest condition classes (Bechtold and Patterson 2005). There are seven condition-class variables that require
mapping of a unique condition on a plot: land use, forest type, stand size, ownership, stand density, regeneration status, and reserved status. A new condition is defined and mapped each time one of these variables changes during plot measurement.
Phase 3
Data on forest health variables (P3) are collected on about 1∕16th of the P2 sample plots. P3 data are coarse descriptions and are meant to be used as general indicators of overall forest health over large geographic areas. P3 data collection includes variables pertaining to tree crown health and down woody material (DWM), and foliar ozone injury. Tree crown health and DWM measurements are collected by using the same plot design used during P2 data collection (fig. A.1).
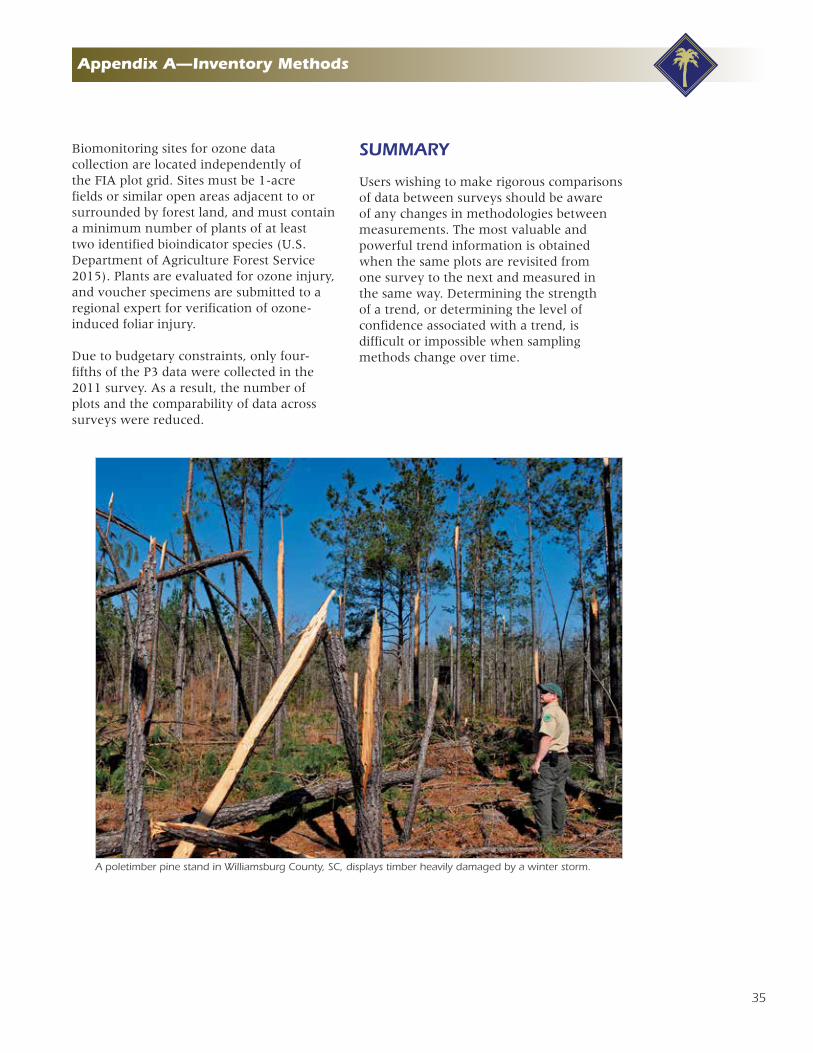
35
Appendix A—Inventory Methods
Biomonitoring sites for ozone data collection are located independently of the FIA plot grid. Sites must be 1-acre fields or similar open areas adjacent to or surrounded by forest land, and must contain a minimum number of plants of at least two identified bioindicator species (U.S. Department of Agriculture Forest Service 2015). Plants are evaluated for ozone injury, and voucher specimens are submitted to a regional expert for verification of ozone-induced foliar injury.
Due to budgetary constraints, only four-fifths of the P3 data were collected in the 2011 survey. As a result, the number of plots and the comparability of data across surveys were reduced.
SUMMARY
Users wishing to make rigorous comparisons of data between surveys should be aware of any changes in methodologies between measurements. The most valuable and powerful trend information is obtained when the same plots are revisited from one survey to the next and measured in the same way. Determining the strength of a trend, or determining the level of confidence associated with a trend, is difficult or impossible when sampling methods change over time.
A poletimber pine stand in Williamsburg County, SC, displays timber heavily damaged by a winter storm.

36
Appendix B—Data Reliability
DATA RELIABILITY
A relative standard of accuracy has been incorporated into the forest survey. This standard satisfies user demands, minimizes human and instrumental sources of error, and keeps costs within prescribed limits. The two primary types of error are measurement error and sampling error.
Measurement Error
There are three elements of measurement error: (1) biased error, caused by instruments not properly calibrated; (2) compensating error, caused by instruments of moderate precision; and (3) accidental error, caused by human error in measuring and compiling. All of these are held to a minimum by the Forest Inventory and Analysis (FIA) quality assurance (QA) program. The goal of the QA program is to provide a framework of quality control procedures to assure the production of complete, accurate, and unbiased forest assessments for given standards. These methods include use of nationally standardized field manuals, use of portable data recorders, thorough entry-level training, periodic review training, supervision, use of check plots, editing checks, and an emphasis on careful work. Additionally, data quality is assessed and documented by using performance measurements and post-survey assessments. These assessments are then used to identify
areas of the data collection process that need improvement or refinement in order to meet the program’s quality objectives.
Each variable collected by FIA is assigned a measurement quality objective (MQO) and a measurement tolerance level. The MQOs are documented in the FIA National Field Manual (U.S. Department of Agriculture Forest Service 2015). In some instances, the MQOs are a “best guess” of what experienced field crews should be able to consistently achieve. Tolerances are somewhat arbitrary and are based on the crews’ ability to make repeatable measurements or observations within the assigned MQO.
Evaluation of field crew performance is accomplished by calculating the differences between data collected by the field crew and data collected by the QA crew on blind-check plots. Results of these calculations are compared to the established MQOs. In the analysis of blind-check data, an observation is within tolerance when the difference between the field crew observation and the QA crew observation does not exceed the assigned tolerance for that variable. For many categorical variables, the tolerance is “no error” allowed, so only observations that are identical are within the tolerance level. Tables B.1, B.2, and B.3 show the results of various blind checks for South Carolina.
A young hardwood stand located in the 1,590 acre Woods Bay
State Natural Area in Sumter and Clarendon Counties, SC.
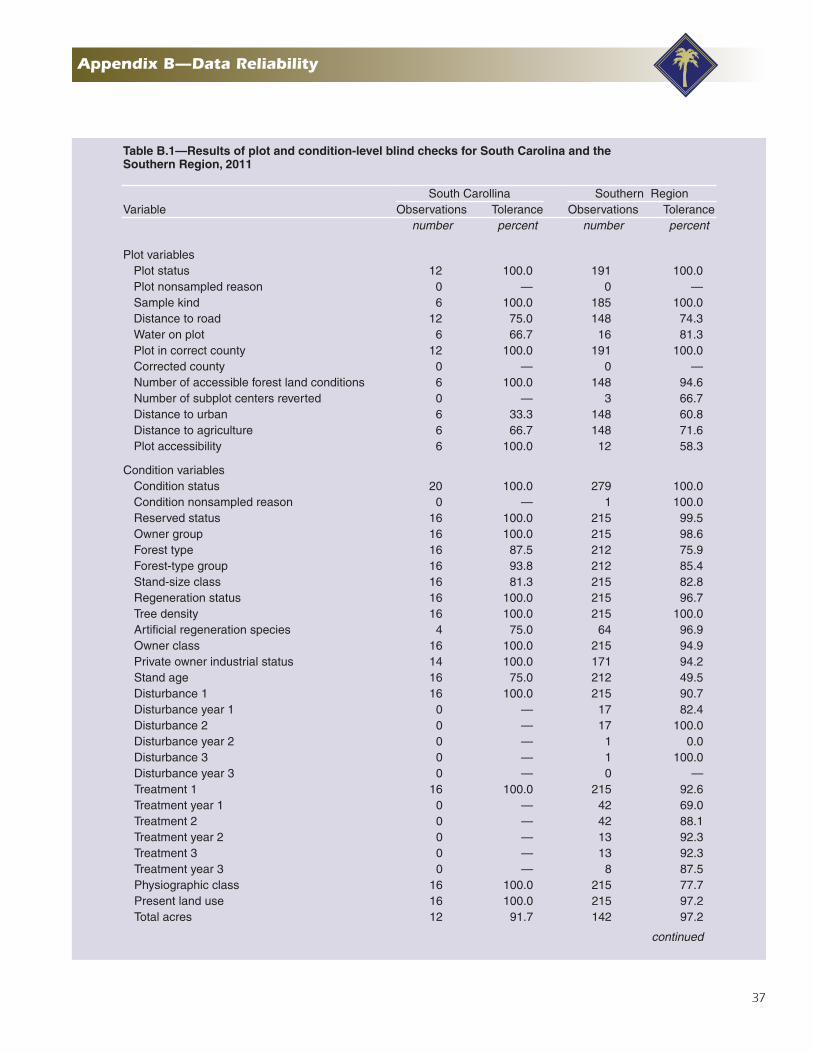
37
Appendix B—Data Reliability
Table B.1—Results of plot and condition-level blind checks for South Carolina and the Southern Region, 2011
VariableSouth Carollina Southern Region
Observations Tolerance Observations Tolerancenumber percent number percent
Plot variablesPlot status 12 100.0 191 100.0Plot nonsampled reason 0 — 0 —Sample kind 6 100.0 185 100.0Distance to road 12 75.0 148 74.3Water on plot 6 66.7 16 81.3Plot in correct county 12 100.0 191 100.0Corrected county 0 — 0 —Number of accessible forest land conditions 6 100.0 148 94.6Number of subplot centers reverted 0 — 3 66.7Distance to urban 6 33.3 148 60.8Distance to agriculture 6 66.7 148 71.6Plot accessibility 6 100.0 12 58.3
Condition variablesCondition status 20 100.0 279 100.0Condition nonsampled reason 0 — 1 100.0Reserved status 16 100.0 215 99.5Owner group 16 100.0 215 98.6Forest type 16 87.5 212 75.9Forest-type group 16 93.8 212 85.4Stand-size class 16 81.3 215 82.8Regeneration status 16 100.0 215 96.7Tree density 16 100.0 215 100.0Artificial regeneration species 4 75.0 64 96.9Owner class 16 100.0 215 94.9Private owner industrial status 14 100.0 171 94.2Stand age 16 75.0 212 49.5Disturbance 1 16 100.0 215 90.7Disturbance year 1 0 — 17 82.4Disturbance 2 0 — 17 100.0Disturbance year 2 0 — 1 0.0Disturbance 3 0 — 1 100.0Disturbance year 3 0 — 0 —Treatment 1 16 100.0 215 92.6Treatment year 1 0 — 42 69.0Treatment 2 0 — 42 88.1Treatment year 2 0 — 13 92.3Treatment 3 0 — 13 92.3Treatment year 3 0 — 8 87.5Physiographic class 16 100.0 215 77.7Present land use 16 100.0 215 97.2Total acres 12 91.7 142 97.2
continued
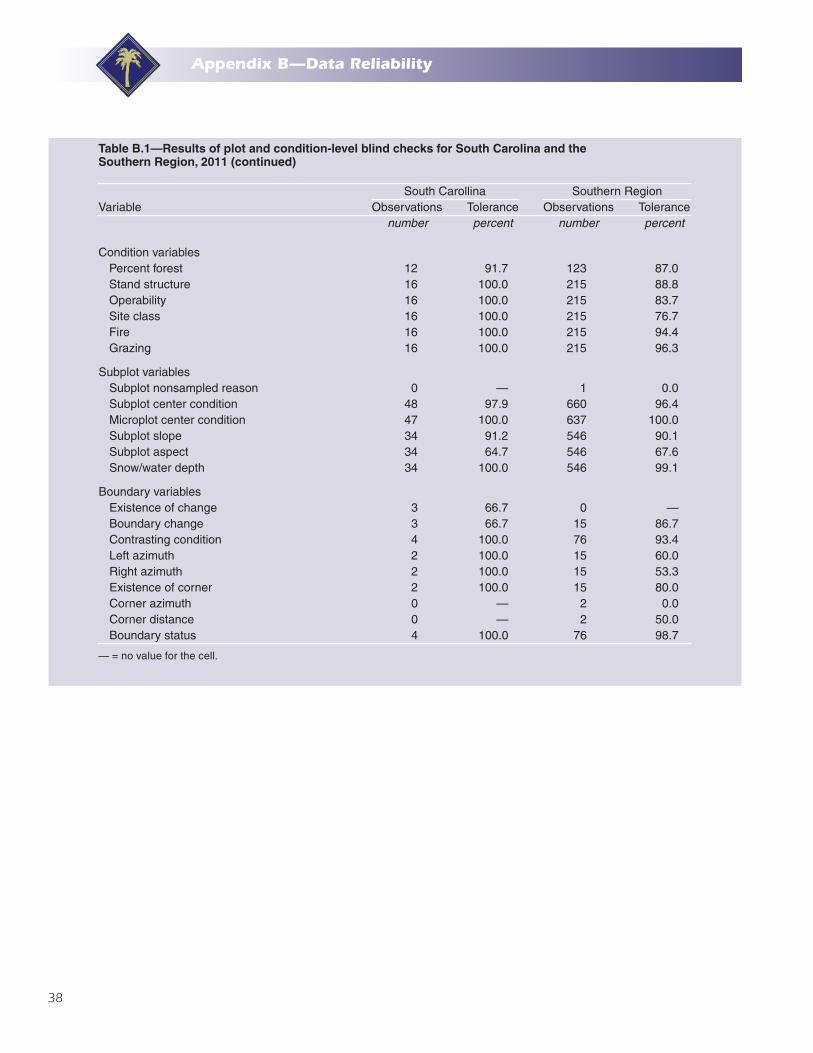
38
Appendix B—Data Reliability
Table B.1—Results of plot and condition-level blind checks for South Carolina and the Southern Region, 2011 (continued)
VariableSouth Carollina Southern Region
Observations Tolerance Observations Tolerancenumber percent number percent
Condition variables Percent forest 12 91.7 123 87.0Stand structure 16 100.0 215 88.8Operability 16 100.0 215 83.7Site class 16 100.0 215 76.7Fire 16 100.0 215 94.4Grazing 16 100.0 215 96.3
Subplot variablesSubplot nonsampled reason 0 — 1 0.0Subplot center condition 48 97.9 660 96.4Microplot center condition 47 100.0 637 100.0Subplot slope 34 91.2 546 90.1Subplot aspect 34 64.7 546 67.6Snow/water depth 34 100.0 546 99.1
Boundary variablesExistence of change 3 66.7 0 —Boundary change 3 66.7 15 86.7Contrasting condition 4 100.0 76 93.4Left azimuth 2 100.0 15 60.0Right azimuth 2 100.0 15 53.3Existence of corner 2 100.0 15 80.0Corner azimuth 0 — 2 0.0Corner distance 0 — 2 50.0Boundary status 4 100.0 76 98.7
— = no value for the cell.
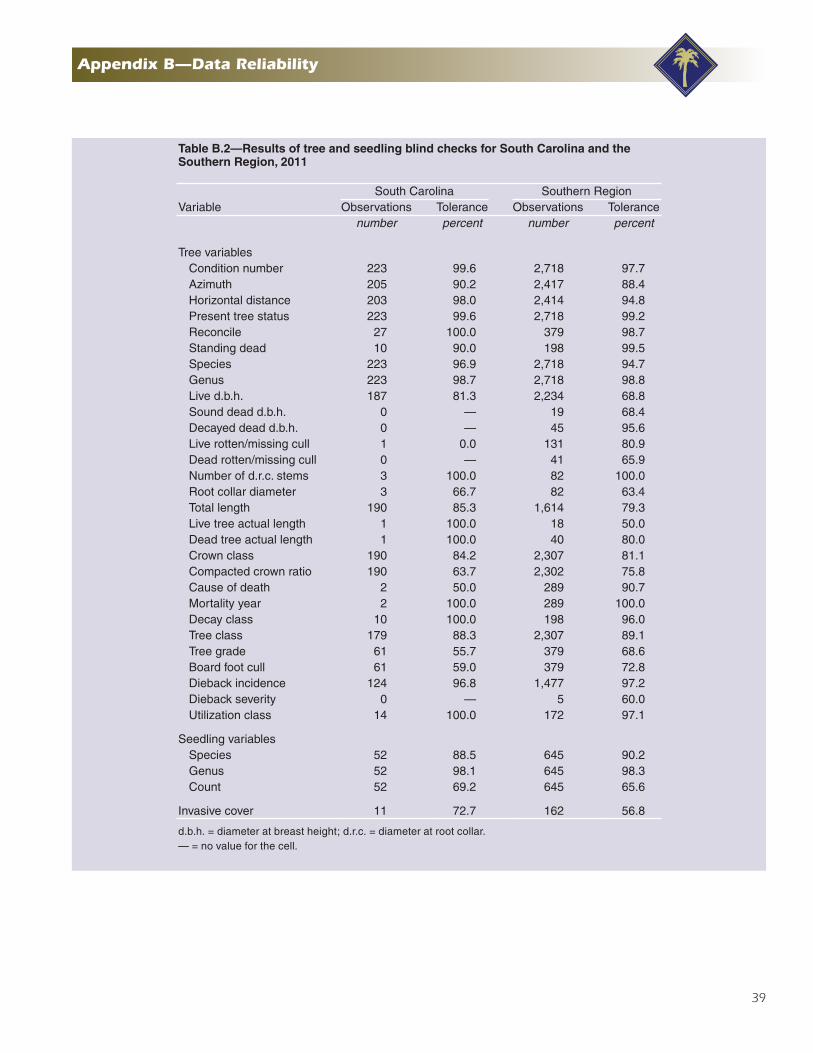
39
Appendix B—Data Reliability
Table B.2—Results of tree and seedling blind checks for South Carolina and the Southern Region, 2011
VariableSouth Carolina Southern Region
Observations Tolerance Observations Tolerancenumber percent number percent
Tree variablesCondition number 223 99.6 2,718 97.7Azimuth 205 90.2 2,417 88.4Horizontal distance 203 98.0 2,414 94.8Present tree status 223 99.6 2,718 99.2Reconcile 27 100.0 379 98.7Standing dead 10 90.0 198 99.5Species 223 96.9 2,718 94.7Genus 223 98.7 2,718 98.8Live d.b.h. 187 81.3 2,234 68.8Sound dead d.b.h. 0 — 19 68.4Decayed dead d.b.h. 0 — 45 95.6Live rotten/missing cull 1 0.0 131 80.9Dead rotten/missing cull 0 — 41 65.9Number of d.r.c. stems 3 100.0 82 100.0Root collar diameter 3 66.7 82 63.4Total length 190 85.3 1,614 79.3Live tree actual length 1 100.0 18 50.0Dead tree actual length 1 100.0 40 80.0Crown class 190 84.2 2,307 81.1Compacted crown ratio 190 63.7 2,302 75.8Cause of death 2 50.0 289 90.7Mortality year 2 100.0 289 100.0Decay class 10 100.0 198 96.0Tree class 179 88.3 2,307 89.1Tree grade 61 55.7 379 68.6Board foot cull 61 59.0 379 72.8Dieback incidence 124 96.8 1,477 97.2Dieback severity 0 — 5 60.0Utilization class 14 100.0 172 97.1
Seedling variablesSpecies 52 88.5 645 90.2Genus 52 98.1 645 98.3Count 52 69.2 645 65.6
Invasive cover 11 72.7 162 56.8
d.b.h. = diameter at breast height; d.r.c. = diameter at root collar.— = no value for the cell.
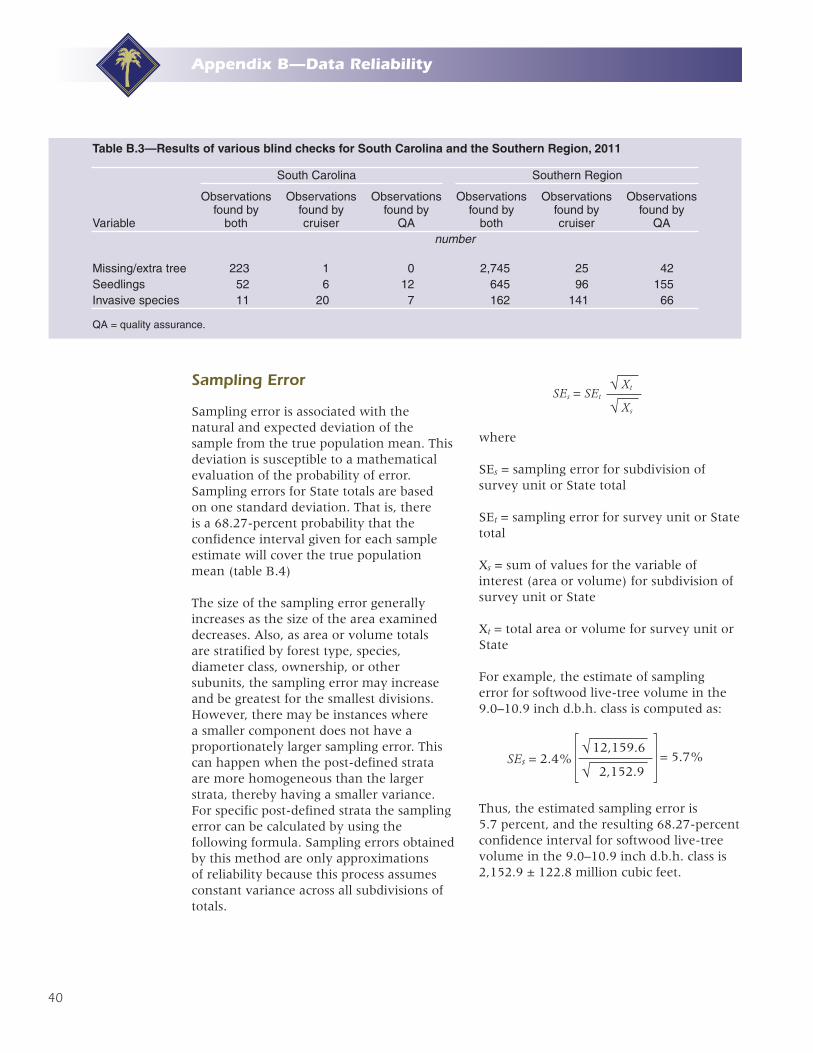
40
Appendix B—Data Reliability
Table B.3—Results of various blind checks for South Carolina and the Southern Region, 2011
Variable
South Carolina Southern Region
Observations found by
both
Observations found by cruiser
Observations found by
QA
Observations found by
both
Observations found by cruiser
Observations found by
QAnumber
Missing/extra tree 223 1 0 2,745 25 42Seedlings 52 6 12 645 96 155Invasive species 11 20 7 162 141 66
QA = quality assurance.
Sampling Error
Sampling error is associated with the natural and expected deviation of the sample from the true population mean. This deviation is susceptible to a mathematical evaluation of the probability of error. Sampling errors for State totals are based on one standard deviation. That is, there is a 68.27-percent probability that the confidence interval given for each sample estimate will cover the true population mean (table B.4)
The size of the sampling error generally increases as the size of the area examined decreases. Also, as area or volume totals are stratified by forest type, species, diameter class, ownership, or other subunits, the sampling error may increase and be greatest for the smallest divisions. However, there may be instances where a smaller component does not have a proportionately larger sampling error. This can happen when the post-defined strata are more homogeneous than the larger strata, thereby having a smaller variance. For specific post-defined strata the sampling error can be calculated by using the following formula. Sampling errors obtained by this method are only approximations of reliability because this process assumes constant variance across all subdivisions of totals.
√ XtSEs = SEt
√ Xs
where
SEs = sampling error for subdivision of survey unit or State total
SEt = sampling error for survey unit or State total
Xs = sum of values for the variable of interest (area or volume) for subdivision of survey unit or State
Xt = total area or volume for survey unit or State
For example, the estimate of sampling error for softwood live-tree volume in the 9.0–10.9 inch d.b.h. class is computed as:
SEs = 2.4% = 5.7%√ 12,159.6
√ 2,152.9
Thus, the estimated sampling error is 5.7 percent, and the resulting 68.27-percent confidence interval for softwood live-tree volume in the 9.0–10.9 inch d.b.h. class is 2,152.9 ± 122.8 million cubic feet.
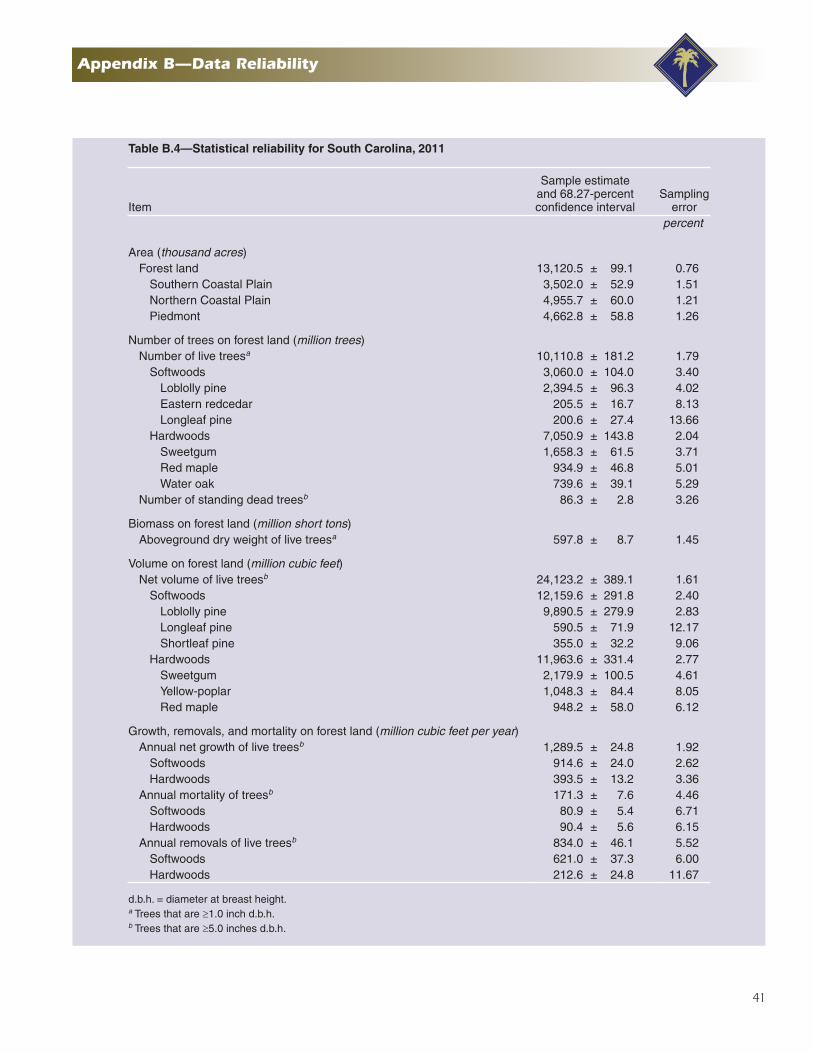
41
Appendix B—Data Reliability
Table B.4—Statistical reliability for South Carolina, 2011
Item
Sample estimate and 68.27-percent confidence interval
Sampling error
percent
Area (thousand acres)Forest land 13,120.5 ± 99.1 0.76
Southern Coastal Plain 3,502.0 ± 52.9 1.51Northern Coastal Plain 4,955.7 ± 60.0 1.21Piedmont 4,662.8 ± 58.8 1.26
Number of trees on forest land (million trees)Number of live treesa 10,110.8 ± 181.2 1.79
Softwoods 3,060.0 ± 104.0 3.40Loblolly pine 2,394.5 ± 96.3 4.02Eastern redcedar 205.5 ± 16.7 8.13Longleaf pine 200.6 ± 27.4 13.66
Hardwoods 7,050.9 ± 143.8 2.04Sweetgum 1,658.3 ± 61.5 3.71Red maple 934.9 ± 46.8 5.01Water oak 739.6 ± 39.1 5.29
Number of standing dead treesb 86.3 ± 2.8 3.26
Biomass on forest land (million short tons)Aboveground dry weight of live treesa 597.8 ± 8.7 1.45
Volume on forest land (million cubic feet)Net volume of live treesb 24,123.2 ± 389.1 1.61
Softwoods 12,159.6 ± 291.8 2.40Loblolly pine 9,890.5 ± 279.9 2.83Longleaf pine 590.5 ± 71.9 12.17Shortleaf pine 355.0 ± 32.2 9.06
Hardwoods 11,963.6 ± 331.4 2.77Sweetgum 2,179.9 ± 100.5 4.61Yellow-poplar 1,048.3 ± 84.4 8.05Red maple 948.2 ± 58.0 6.12
Growth, removals, and mortality on forest land (million cubic feet per year)Annual net growth of live treesb 1,289.5 ± 24.8 1.92
Softwoods 914.6 ± 24.0 2.62Hardwoods 393.5 ± 13.2 3.36
Annual mortality of treesb 171.3 ± 7.6 4.46Softwoods 80.9 ± 5.4 6.71Hardwoods 90.4 ± 5.6 6.15
Annual removals of live treesb 834.0 ± 46.1 5.52Softwoods 621.0 ± 37.3 6.00Hardwoods 212.6 ± 24.8 11.67
d.b.h. = diameter at breast height.a Trees that are ≥1.0 inch d.b.h.b Trees that are ≥5.0 inches d.b.h.
42
Appendix C—Supplemental Tables
Table C.1—Area by survey unit and land status, South Carolina, 2011
Survey unitTotal area
All forestland
Unreserved Reserved
Nonforest land
Census waterTotal
Timber- land
Un-productive Total Productive
Un-productive
thousand acres
Southern Coastal Plain 5,516.3 3,502.0 3,481.6 3,477.5 4.1 20.4 20.4 0.0 1,661.9 352.4
Northern Coastal Plain 8,112.8 4,955.7 4,868.5 4,854.7 13.8 87.2 87.2 0.0 2,493.2 663.9
Piedmont 6,863.8 4,662.8 4,617.6 4,609.3 8.3 45.2 45.2 0.0 2,035.1 165.9
All survey units 20,492.8 13,120.5 12,967.7 12,941.5 26.2 152.8 152.8 0.0 6,190.1 1,182.2
Numbers in rows and columns may not sum to totals due to rounding.0.0 = no sample for the cell or a value of >0.0 but <0.05.
The scenic Little Eastatoee Creek at Long Shoals Wayside Park on Poe Creek State Forest in Pickens County, SC.

43
Appendix C—Supplemental Tables
Table C.2—Area of forest land by ownership class and land status, South Carolina, 2011
Ownership classAll forest
land
Unreserved Reserved
Total TimberlandUn-
productive Total ProductiveUn-
productivethousand acres
U.S. Forest ServiceNational forest 598.8 581.1 581.1 0.0 17.8 17.8 0.0Other Forest Service 6.1 6.1 6.1 0.0 0.0 0.0 0.0
Total 604.9 587.1 587.1 0.0 17.8 17.8 0.0
Other FederalNational Park Service 34.1 0.0 0.0 0.0 34.1 34.1 0.0U.S. Fish and Wildlife Service 72.7 0.0 0.0 0.0 72.7 72.7 0.0Dept. of Defense/Dept. of Energy 320.1 314.4 308.2 6.3 5.6 5.6 0.0Other Federal 3.2 3.2 3.2 0.0 0.0 0.0 0.0
Total 430.1 317.7 311.4 6.3 112.4 112.4 0.0
State and local governmentState 381.2 381.2 381.2 0.0 0.0 0.0 0.0Local 177.1 154.5 154.5 0.0 22.6 22.6 0.0
Total 558.3 535.7 535.7 0.0 22.6 22.6 0.0
Forest industryCorporate 336.4 336.4 336.4 0.0 0.0 0.0 0.0
Total 336.4 336.4 336.4 0.0 0.0 0.0 0.0
Nonindustrial privateCorporate 3,671.6 3,671.6 3,657.2 14.4 0.0 0.0 0.0
Conservation/natural resources organization 60.6 60.6 60.6 0.0 0.0 0.0 0.0
Unincorporated local partnership/association/club 116.2 116.2 116.2 0.0 0.0 0.0 0.0
Native American 6.3 6.3 6.3 0.0 0.0 0.0 0.0Individual 7,336.1 7,336.1 7,330.5 5.5 0.0 0.0 0.0
Total 11,190.8 11,190.8 11,170.9 19.9 0.0 0.0 0.0
All classes 13,120.5 12,967.7 12,941.5 26.2 152.8 152.8 0.0
Numbers in rows and columns may not sum to totals due to rounding.0.0 = no sample for the cell or a value of >0.0 but <0.05.
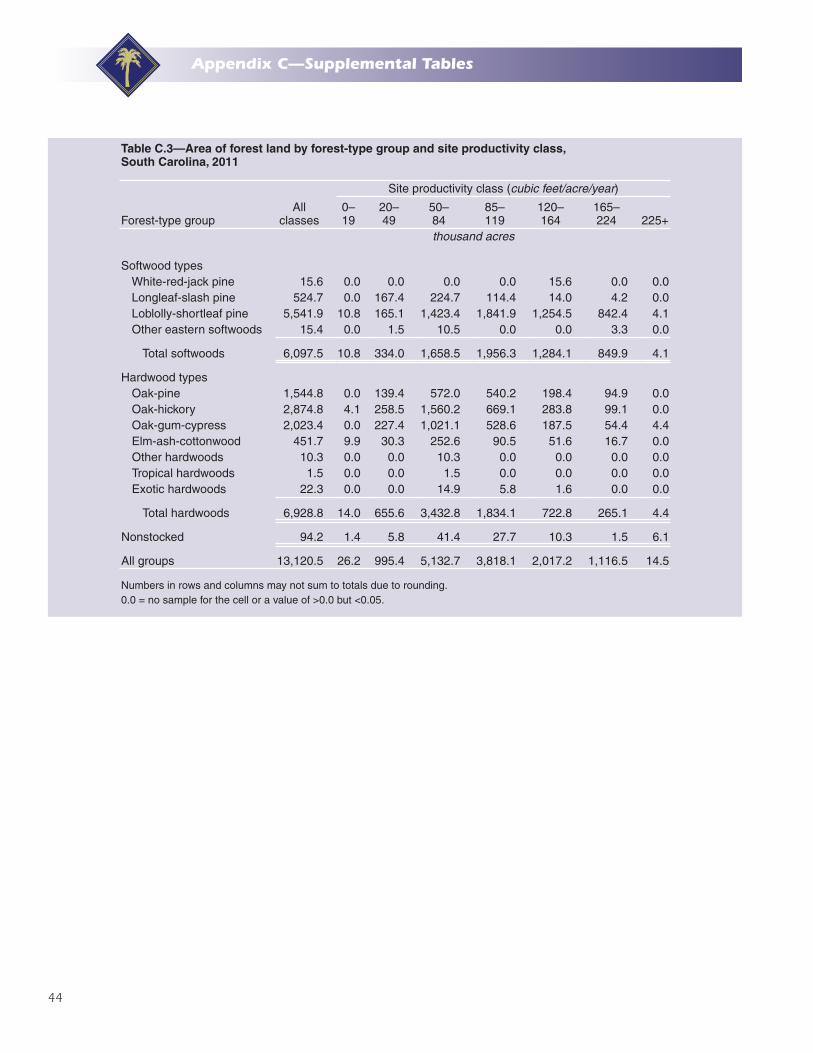
44
Appendix C—Supplemental Tables
Table C.3—Area of forest land by forest-type group and site productivity class, South Carolina, 2011
Forest-type groupAll
classes
Site productivity class (cubic feet/acre/year)
0–19
20–49
50–84
85–119
120–164
165–224 225+
thousand acres
Softwood typesWhite-red-jack pine 15.6 0.0 0.0 0.0 0.0 15.6 0.0 0.0Longleaf-slash pine 524.7 0.0 167.4 224.7 114.4 14.0 4.2 0.0Loblolly-shortleaf pine 5,541.9 10.8 165.1 1,423.4 1,841.9 1,254.5 842.4 4.1Other eastern softwoods 15.4 0.0 1.5 10.5 0.0 0.0 3.3 0.0
Total softwoods 6,097.5 10.8 334.0 1,658.5 1,956.3 1,284.1 849.9 4.1
Hardwood typesOak-pine 1,544.8 0.0 139.4 572.0 540.2 198.4 94.9 0.0Oak-hickory 2,874.8 4.1 258.5 1,560.2 669.1 283.8 99.1 0.0Oak-gum-cypress 2,023.4 0.0 227.4 1,021.1 528.6 187.5 54.4 4.4Elm-ash-cottonwood 451.7 9.9 30.3 252.6 90.5 51.6 16.7 0.0Other hardwoods 10.3 0.0 0.0 10.3 0.0 0.0 0.0 0.0Tropical hardwoods 1.5 0.0 0.0 1.5 0.0 0.0 0.0 0.0Exotic hardwoods 22.3 0.0 0.0 14.9 5.8 1.6 0.0 0.0
Total hardwoods 6,928.8 14.0 655.6 3,432.8 1,834.1 722.8 265.1 4.4
Nonstocked 94.2 1.4 5.8 41.4 27.7 10.3 1.5 6.1
All groups 13,120.5 26.2 995.4 5,132.7 3,818.1 2,017.2 1,116.5 14.5
Numbers in rows and columns may not sum to totals due to rounding.0.0 = no sample for the cell or a value of >0.0 but <0.05.
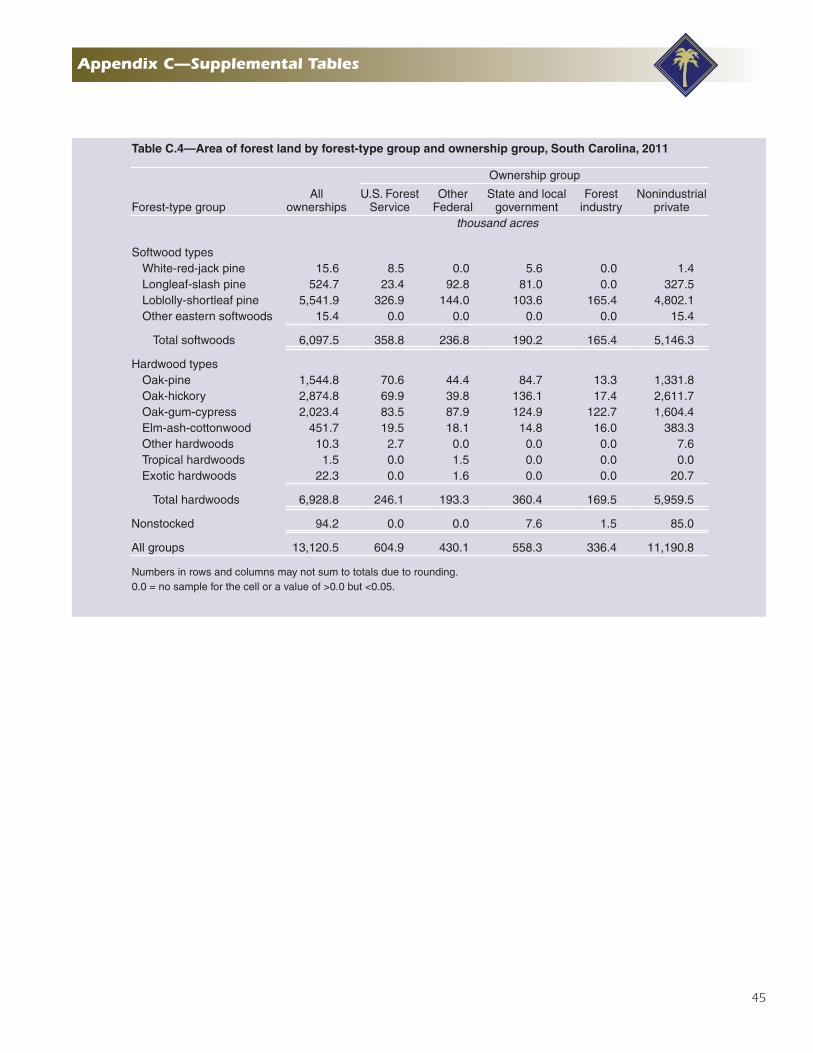
45
Appendix C—Supplemental Tables
Table C.4—Area of forest land by forest-type group and ownership group, South Carolina, 2011
Forest-type groupAll
ownerships
Ownership group
U.S. Forest Service
Other Federal
State and local government
Forest industry
Nonindustrial private
thousand acres
Softwood typesWhite-red-jack pine 15.6 8.5 0.0 5.6 0.0 1.4Longleaf-slash pine 524.7 23.4 92.8 81.0 0.0 327.5Loblolly-shortleaf pine 5,541.9 326.9 144.0 103.6 165.4 4,802.1Other eastern softwoods 15.4 0.0 0.0 0.0 0.0 15.4
Total softwoods 6,097.5 358.8 236.8 190.2 165.4 5,146.3
Hardwood typesOak-pine 1,544.8 70.6 44.4 84.7 13.3 1,331.8Oak-hickory 2,874.8 69.9 39.8 136.1 17.4 2,611.7Oak-gum-cypress 2,023.4 83.5 87.9 124.9 122.7 1,604.4Elm-ash-cottonwood 451.7 19.5 18.1 14.8 16.0 383.3Other hardwoods 10.3 2.7 0.0 0.0 0.0 7.6Tropical hardwoods 1.5 0.0 1.5 0.0 0.0 0.0Exotic hardwoods 22.3 0.0 1.6 0.0 0.0 20.7
Total hardwoods 6,928.8 246.1 193.3 360.4 169.5 5,959.5
Nonstocked 94.2 0.0 0.0 7.6 1.5 85.0
All groups 13,120.5 604.9 430.1 558.3 336.4 11,190.8
Numbers in rows and columns may not sum to totals due to rounding.0.0 = no sample for the cell or a value of >0.0 but <0.05.
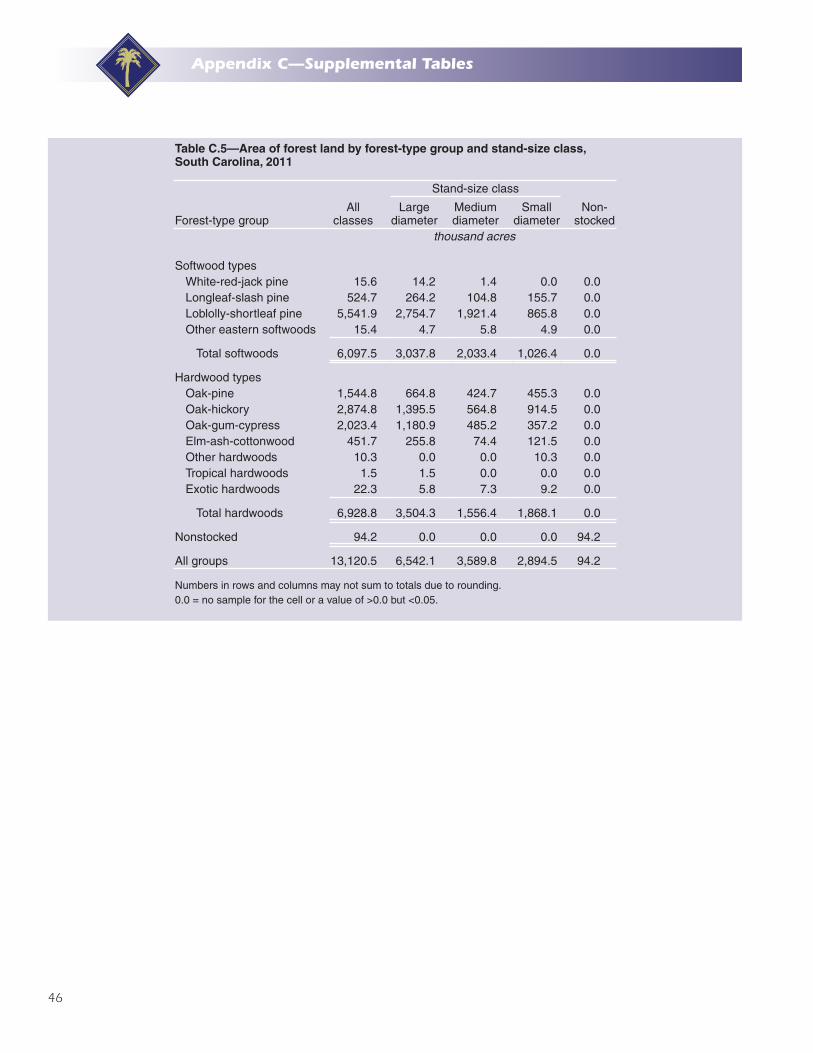
46
Appendix C—Supplemental Tables
Table C.5—Area of forest land by forest-type group and stand-size class, South Carolina, 2011
Forest-type groupAll
classes
Stand-size class
Non-stocked
Large diameter
Medium diameter
Small diameter
thousand acres
Softwood typesWhite-red-jack pine 15.6 14.2 1.4 0.0 0.0Longleaf-slash pine 524.7 264.2 104.8 155.7 0.0Loblolly-shortleaf pine 5,541.9 2,754.7 1,921.4 865.8 0.0Other eastern softwoods 15.4 4.7 5.8 4.9 0.0
Total softwoods 6,097.5 3,037.8 2,033.4 1,026.4 0.0
Hardwood typesOak-pine 1,544.8 664.8 424.7 455.3 0.0Oak-hickory 2,874.8 1,395.5 564.8 914.5 0.0Oak-gum-cypress 2,023.4 1,180.9 485.2 357.2 0.0Elm-ash-cottonwood 451.7 255.8 74.4 121.5 0.0Other hardwoods 10.3 0.0 0.0 10.3 0.0Tropical hardwoods 1.5 1.5 0.0 0.0 0.0Exotic hardwoods 22.3 5.8 7.3 9.2 0.0
Total hardwoods 6,928.8 3,504.3 1,556.4 1,868.1 0.0
Nonstocked 94.2 0.0 0.0 0.0 94.2
All groups 13,120.5 6,542.1 3,589.8 2,894.5 94.2
Numbers in rows and columns may not sum to totals due to rounding.0.0 = no sample for the cell or a value of >0.0 but <0.05.
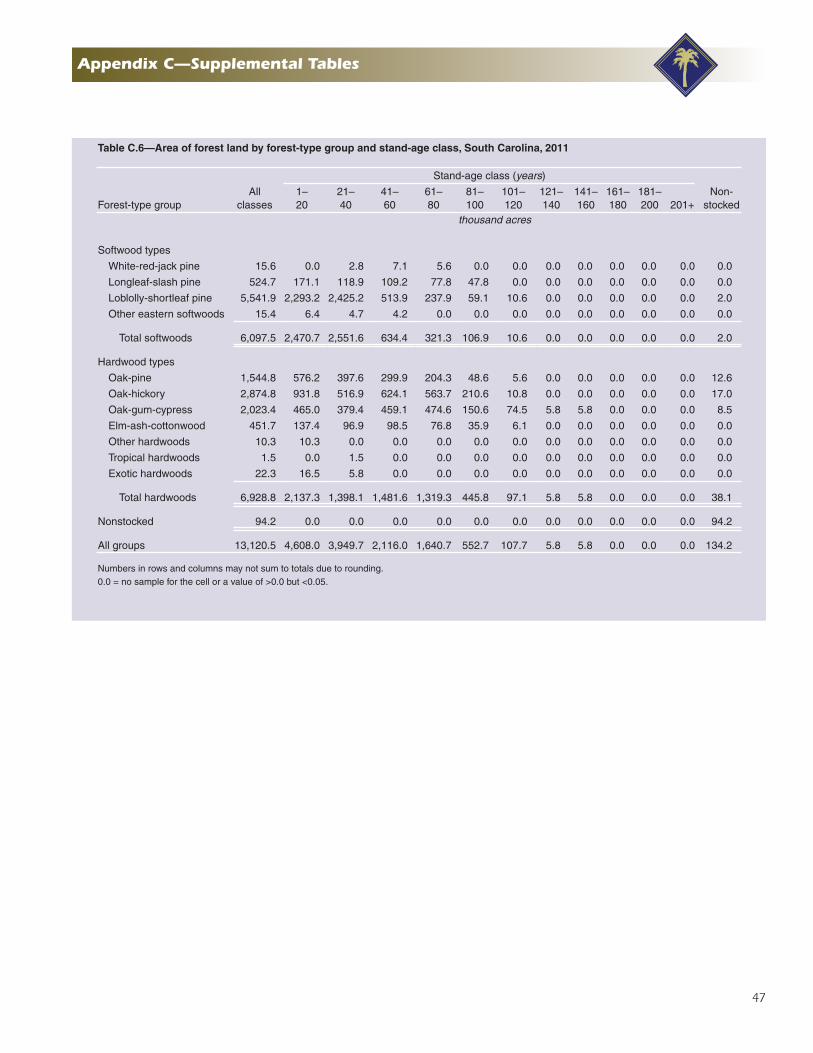
47
Appendix C—Supplemental Tables
Table C.6—Area of forest land by forest-type group and stand-age class, South Carolina, 2011
Forest-type groupAll
classes
Stand-age class (years)
Non-stocked
1–20
21–40
41–60
61–80
81–100
101–120
121–140
141–160
161–180
181–200 201+
thousand acres
Softwood types
White-red-jack pine 15.6 0.0 2.8 7.1 5.6 0.0 0.0 0.0 0.0 0.0 0.0 0.0 0.0
Longleaf-slash pine 524.7 171.1 118.9 109.2 77.8 47.8 0.0 0.0 0.0 0.0 0.0 0.0 0.0
Loblolly-shortleaf pine 5,541.9 2,293.2 2,425.2 513.9 237.9 59.1 10.6 0.0 0.0 0.0 0.0 0.0 2.0
Other eastern softwoods 15.4 6.4 4.7 4.2 0.0 0.0 0.0 0.0 0.0 0.0 0.0 0.0 0.0
Total softwoods 6,097.5 2,470.7 2,551.6 634.4 321.3 106.9 10.6 0.0 0.0 0.0 0.0 0.0 2.0
Hardwood types
Oak-pine 1,544.8 576.2 397.6 299.9 204.3 48.6 5.6 0.0 0.0 0.0 0.0 0.0 12.6
Oak-hickory 2,874.8 931.8 516.9 624.1 563.7 210.6 10.8 0.0 0.0 0.0 0.0 0.0 17.0
Oak-gum-cypress 2,023.4 465.0 379.4 459.1 474.6 150.6 74.5 5.8 5.8 0.0 0.0 0.0 8.5
Elm-ash-cottonwood 451.7 137.4 96.9 98.5 76.8 35.9 6.1 0.0 0.0 0.0 0.0 0.0 0.0
Other hardwoods 10.3 10.3 0.0 0.0 0.0 0.0 0.0 0.0 0.0 0.0 0.0 0.0 0.0
Tropical hardwoods 1.5 0.0 1.5 0.0 0.0 0.0 0.0 0.0 0.0 0.0 0.0 0.0 0.0
Exotic hardwoods 22.3 16.5 5.8 0.0 0.0 0.0 0.0 0.0 0.0 0.0 0.0 0.0 0.0
Total hardwoods 6,928.8 2,137.3 1,398.1 1,481.6 1,319.3 445.8 97.1 5.8 5.8 0.0 0.0 0.0 38.1
Nonstocked 94.2 0.0 0.0 0.0 0.0 0.0 0.0 0.0 0.0 0.0 0.0 0.0 94.2
All groups 13,120.5 4,608.0 3,949.7 2,116.0 1,640.7 552.7 107.7 5.8 5.8 0.0 0.0 0.0 134.2
Numbers in rows and columns may not sum to totals due to rounding.0.0 = no sample for the cell or a value of >0.0 but <0.05.
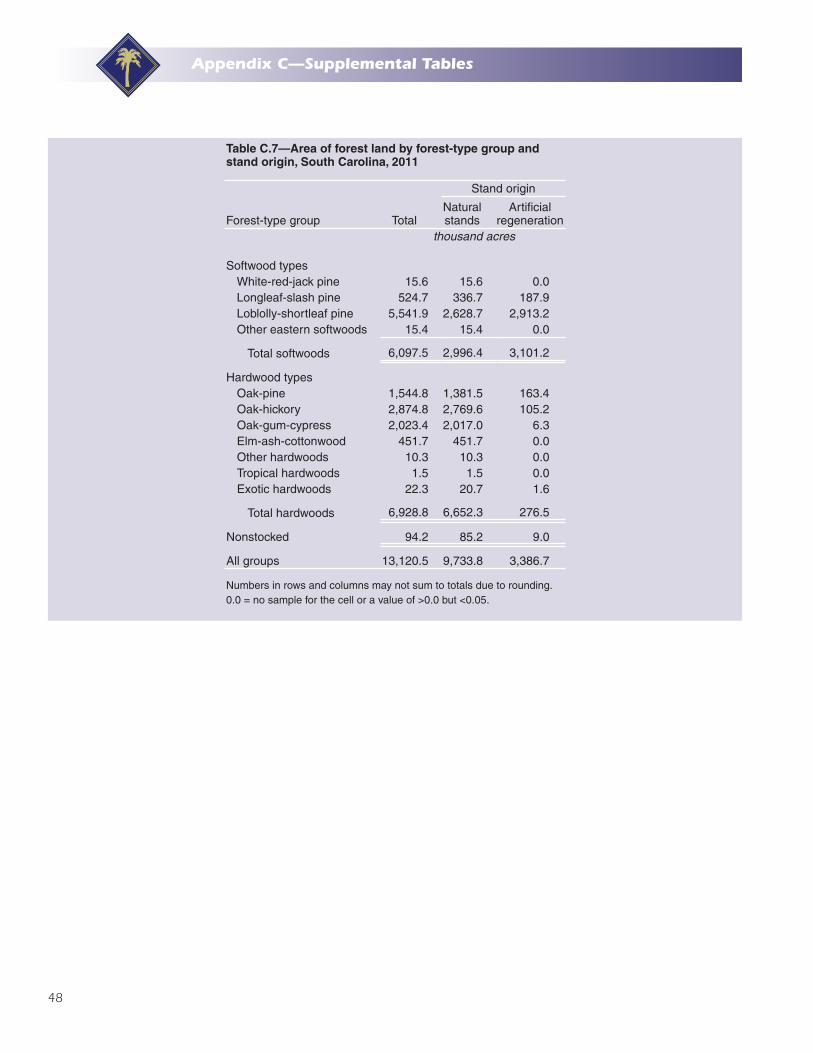
48
Appendix C—Supplemental Tables
Table C.7—Area of forest land by forest-type group and stand origin, South Carolina, 2011
Forest-type group Total
Stand origin
Natural stands
Artificial regeneration
thousand acres
Softwood typesWhite-red-jack pine 15.6 15.6 0.0Longleaf-slash pine 524.7 336.7 187.9Loblolly-shortleaf pine 5,541.9 2,628.7 2,913.2Other eastern softwoods 15.4 15.4 0.0
Total softwoods 6,097.5 2,996.4 3,101.2
Hardwood typesOak-pine 1,544.8 1,381.5 163.4Oak-hickory 2,874.8 2,769.6 105.2Oak-gum-cypress 2,023.4 2,017.0 6.3Elm-ash-cottonwood 451.7 451.7 0.0Other hardwoods 10.3 10.3 0.0Tropical hardwoods 1.5 1.5 0.0Exotic hardwoods 22.3 20.7 1.6
Total hardwoods 6,928.8 6,652.3 276.5
Nonstocked 94.2 85.2 9.0
All groups 13,120.5 9,733.8 3,386.7
Numbers in rows and columns may not sum to totals due to rounding.0.0 = no sample for the cell or a value of >0.0 but <0.05.
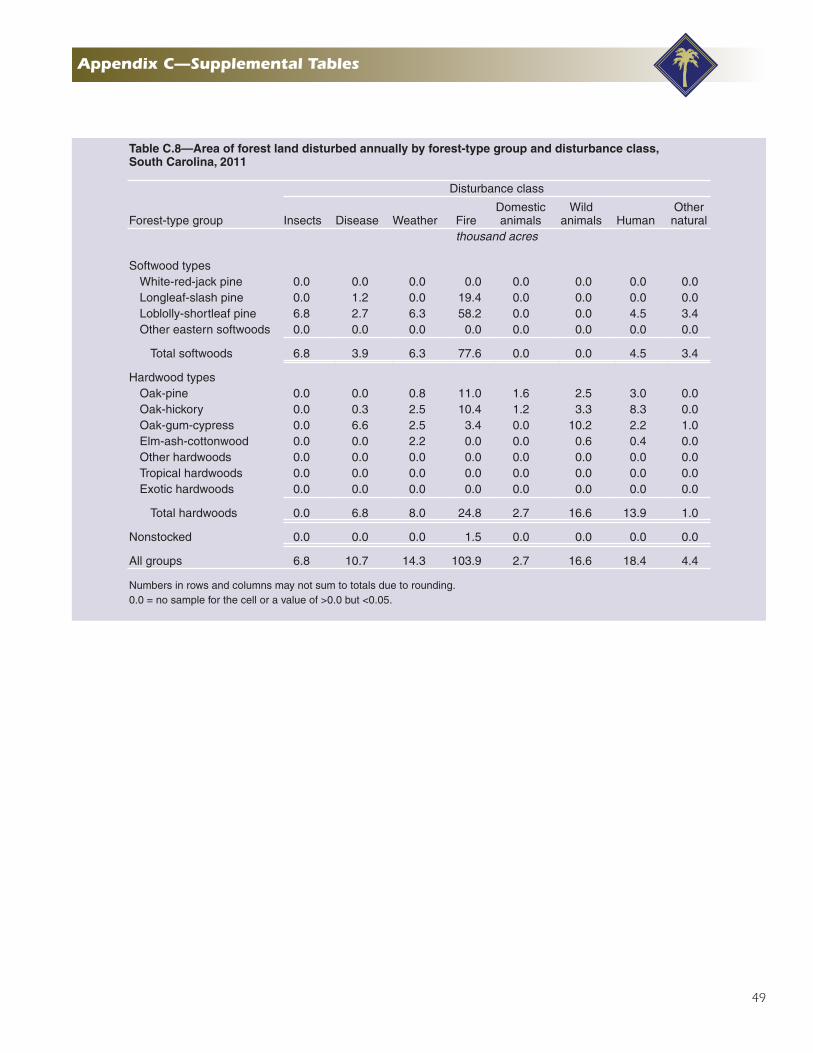
49
Appendix C—Supplemental Tables
Table C.8—Area of forest land disturbed annually by forest-type group and disturbance class, South Carolina, 2011
Forest-type group
Disturbance class
Insects Disease Weather FireDomestic animals
Wild animals Human
Other natural
thousand acres
Softwood typesWhite-red-jack pine 0.0 0.0 0.0 0.0 0.0 0.0 0.0 0.0Longleaf-slash pine 0.0 1.2 0.0 19.4 0.0 0.0 0.0 0.0Loblolly-shortleaf pine 6.8 2.7 6.3 58.2 0.0 0.0 4.5 3.4Other eastern softwoods 0.0 0.0 0.0 0.0 0.0 0.0 0.0 0.0
Total softwoods 6.8 3.9 6.3 77.6 0.0 0.0 4.5 3.4
Hardwood typesOak-pine 0.0 0.0 0.8 11.0 1.6 2.5 3.0 0.0Oak-hickory 0.0 0.3 2.5 10.4 1.2 3.3 8.3 0.0Oak-gum-cypress 0.0 6.6 2.5 3.4 0.0 10.2 2.2 1.0Elm-ash-cottonwood 0.0 0.0 2.2 0.0 0.0 0.6 0.4 0.0Other hardwoods 0.0 0.0 0.0 0.0 0.0 0.0 0.0 0.0Tropical hardwoods 0.0 0.0 0.0 0.0 0.0 0.0 0.0 0.0Exotic hardwoods 0.0 0.0 0.0 0.0 0.0 0.0 0.0 0.0
Total hardwoods 0.0 6.8 8.0 24.8 2.7 16.6 13.9 1.0
Nonstocked 0.0 0.0 0.0 1.5 0.0 0.0 0.0 0.0
All groups 6.8 10.7 14.3 103.9 2.7 16.6 18.4 4.4
Numbers in rows and columns may not sum to totals due to rounding.0.0 = no sample for the cell or a value of >0.0 but <0.05.
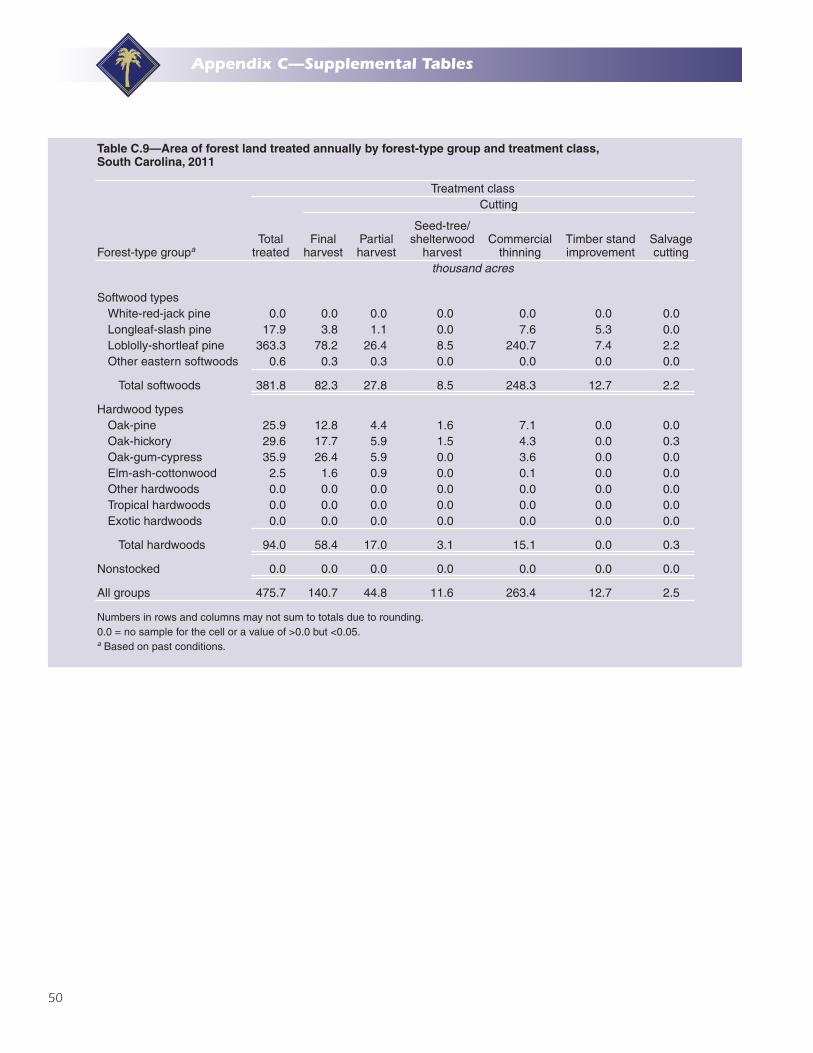
50
Appendix C—Supplemental Tables
Table C.9—Area of forest land treated annually by forest-type group and treatment class, South Carolina, 2011
Forest-type groupa
Treatment class
Total treated
Cutting
Final harvest
Partial harvest
Seed-tree/ shelterwood
harvestCommercial
thinningTimber stand improvement
Salvage cutting
thousand acres
Softwood typesWhite-red-jack pine 0.0 0.0 0.0 0.0 0.0 0.0 0.0Longleaf-slash pine 17.9 3.8 1.1 0.0 7.6 5.3 0.0Loblolly-shortleaf pine 363.3 78.2 26.4 8.5 240.7 7.4 2.2Other eastern softwoods 0.6 0.3 0.3 0.0 0.0 0.0 0.0
Total softwoods 381.8 82.3 27.8 8.5 248.3 12.7 2.2
Hardwood typesOak-pine 25.9 12.8 4.4 1.6 7.1 0.0 0.0Oak-hickory 29.6 17.7 5.9 1.5 4.3 0.0 0.3Oak-gum-cypress 35.9 26.4 5.9 0.0 3.6 0.0 0.0Elm-ash-cottonwood 2.5 1.6 0.9 0.0 0.1 0.0 0.0Other hardwoods 0.0 0.0 0.0 0.0 0.0 0.0 0.0Tropical hardwoods 0.0 0.0 0.0 0.0 0.0 0.0 0.0Exotic hardwoods 0.0 0.0 0.0 0.0 0.0 0.0 0.0
Total hardwoods 94.0 58.4 17.0 3.1 15.1 0.0 0.3
Nonstocked 0.0 0.0 0.0 0.0 0.0 0.0 0.0
All groups 475.7 140.7 44.8 11.6 263.4 12.7 2.5
Numbers in rows and columns may not sum to totals due to rounding.0.0 = no sample for the cell or a value of >0.0 but <0.05.a Based on past conditions.

51
Appendix C—Supplemental Tables
Table C.10—Area of forest land treated annually by forest-type group and treatment class, South Carolina, 2011
Forest-type groupa
Treatment classRegeneration
Sitepreparation
Artificial regeneration
Natural regeneration
Other silviculture
thousand acres
Softwood typesWhite-red-jack pine 0.0 0.0 0.0 0.0Longleaf-slash pine 1.0 0.9 0.5 4.2Loblolly-shortleaf pine 29.6 35.6 23.3 14.5Other eastern softwoods 0.0 0.0 0.0 0.0
Total softwoods 30.6 36.5 23.8 18.7
Hardwood typesOak-pine 14.7 11.2 15.7 2.2Oak-hickory 5.7 8.1 34.2 4.1Oak-gum-cypress 1.4 0.0 7.4 2.2Elm-ash-cottonwood 0.2 0.0 1.4 0.0Other hardwoods 0.0 0.0 0.0 0.0Tropical hardwoods 0.0 0.0 0.0 0.0Exotic hardwoods 0.0 0.0 0.0 0.0
Total hardwoods 22.0 19.3 58.7 8.5
Nonstocked 0.5 0.3 2.5 0.3
All groups 53.2 56.1 85.0 27.6
Numbers in rows and columns may not sum to totals due to rounding.0.0 = no sample for the cell or a value of >0.0 but <0.05.a Based on current conditions.
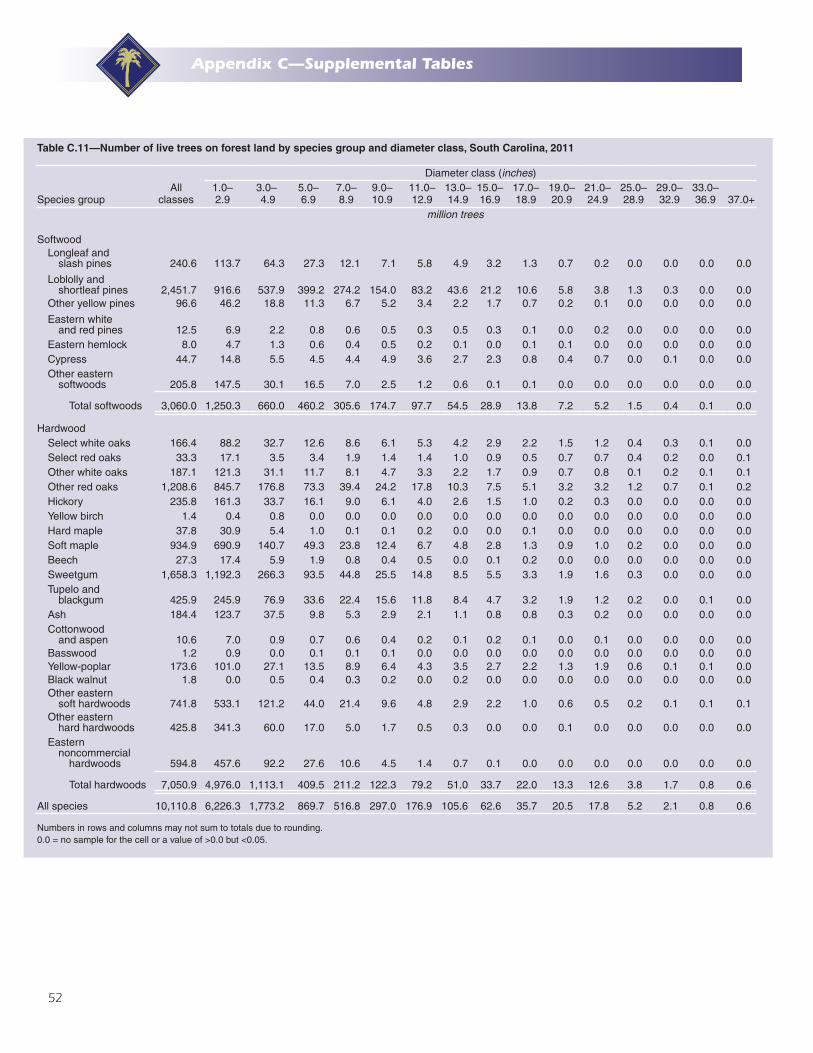
52
Appendix C—Supplemental Tables
Table C.11—Number of live trees on forest land by species group and diameter class, South Carolina, 2011
Species groupAll
classes
Diameter class (inches)1.0– 2.9
3.0– 4.9
5.0– 6.9
7.0– 8.9
9.0– 10.9
11.0– 12.9
13.0– 14.9
15.0– 16.9
17.0– 18.9
19.0– 20.9
21.0– 24.9
25.0– 28.9
29.0– 32.9
33.0– 36.9 37.0+
million trees
SoftwoodLongleaf and
slash pines 240.6 113.7 64.3 27.3 12.1 7.1 5.8 4.9 3.2 1.3 0.7 0.2 0.0 0.0 0.0 0.0
Loblolly andshortleaf pines 2,451.7 916.6 537.9 399.2 274.2 154.0 83.2 43.6 21.2 10.6 5.8 3.8 1.3 0.3 0.0 0.0
Other yellow pines 96.6 46.2 18.8 11.3 6.7 5.2 3.4 2.2 1.7 0.7 0.2 0.1 0.0 0.0 0.0 0.0
Eastern whiteand red pines 12.5 6.9 2.2 0.8 0.6 0.5 0.3 0.5 0.3 0.1 0.0 0.2 0.0 0.0 0.0 0.0
Eastern hemlock 8.0 4.7 1.3 0.6 0.4 0.5 0.2 0.1 0.0 0.1 0.1 0.0 0.0 0.0 0.0 0.0Cypress 44.7 14.8 5.5 4.5 4.4 4.9 3.6 2.7 2.3 0.8 0.4 0.7 0.0 0.1 0.0 0.0Other eastern
softwoods 205.8 147.5 30.1 16.5 7.0 2.5 1.2 0.6 0.1 0.1 0.0 0.0 0.0 0.0 0.0 0.0
Total softwoods 3,060.0 1,250.3 660.0 460.2 305.6 174.7 97.7 54.5 28.9 13.8 7.2 5.2 1.5 0.4 0.1 0.0
HardwoodSelect white oaks 166.4 88.2 32.7 12.6 8.6 6.1 5.3 4.2 2.9 2.2 1.5 1.2 0.4 0.3 0.1 0.0Select red oaks 33.3 17.1 3.5 3.4 1.9 1.4 1.4 1.0 0.9 0.5 0.7 0.7 0.4 0.2 0.0 0.1Other white oaks 187.1 121.3 31.1 11.7 8.1 4.7 3.3 2.2 1.7 0.9 0.7 0.8 0.1 0.2 0.1 0.1Other red oaks 1,208.6 845.7 176.8 73.3 39.4 24.2 17.8 10.3 7.5 5.1 3.2 3.2 1.2 0.7 0.1 0.2Hickory 235.8 161.3 33.7 16.1 9.0 6.1 4.0 2.6 1.5 1.0 0.2 0.3 0.0 0.0 0.0 0.0Yellow birch 1.4 0.4 0.8 0.0 0.0 0.0 0.0 0.0 0.0 0.0 0.0 0.0 0.0 0.0 0.0 0.0Hard maple 37.8 30.9 5.4 1.0 0.1 0.1 0.2 0.0 0.0 0.1 0.0 0.0 0.0 0.0 0.0 0.0Soft maple 934.9 690.9 140.7 49.3 23.8 12.4 6.7 4.8 2.8 1.3 0.9 1.0 0.2 0.0 0.0 0.0Beech 27.3 17.4 5.9 1.9 0.8 0.4 0.5 0.0 0.1 0.2 0.0 0.0 0.0 0.0 0.0 0.0Sweetgum 1,658.3 1,192.3 266.3 93.5 44.8 25.5 14.8 8.5 5.5 3.3 1.9 1.6 0.3 0.0 0.0 0.0Tupelo and
blackgum 425.9 245.9 76.9 33.6 22.4 15.6 11.8 8.4 4.7 3.2 1.9 1.2 0.2 0.0 0.1 0.0Ash 184.4 123.7 37.5 9.8 5.3 2.9 2.1 1.1 0.8 0.8 0.3 0.2 0.0 0.0 0.0 0.0Cottonwood
and aspen 10.6 7.0 0.9 0.7 0.6 0.4 0.2 0.1 0.2 0.1 0.0 0.1 0.0 0.0 0.0 0.0Basswood 1.2 0.9 0.0 0.1 0.1 0.1 0.0 0.0 0.0 0.0 0.0 0.0 0.0 0.0 0.0 0.0Yellow-poplar 173.6 101.0 27.1 13.5 8.9 6.4 4.3 3.5 2.7 2.2 1.3 1.9 0.6 0.1 0.1 0.0Black walnut 1.8 0.0 0.5 0.4 0.3 0.2 0.0 0.2 0.0 0.0 0.0 0.0 0.0 0.0 0.0 0.0Other eastern
soft hardwoods 741.8 533.1 121.2 44.0 21.4 9.6 4.8 2.9 2.2 1.0 0.6 0.5 0.2 0.1 0.1 0.1Other eastern
hard hardwoods 425.8 341.3 60.0 17.0 5.0 1.7 0.5 0.3 0.0 0.0 0.1 0.0 0.0 0.0 0.0 0.0Eastern
noncommercialhardwoods 594.8 457.6 92.2 27.6 10.6 4.5 1.4 0.7 0.1 0.0 0.0 0.0 0.0 0.0 0.0 0.0
Total hardwoods 7,050.9 4,976.0 1,113.1 409.5 211.2 122.3 79.2 51.0 33.7 22.0 13.3 12.6 3.8 1.7 0.8 0.6
All species 10,110.8 6,226.3 1,773.2 869.7 516.8 297.0 176.9 105.6 62.6 35.7 20.5 17.8 5.2 2.1 0.8 0.6
Numbers in rows and columns may not sum to totals due to rounding.0.0 = no sample for the cell or a value of >0.0 but <0.05.
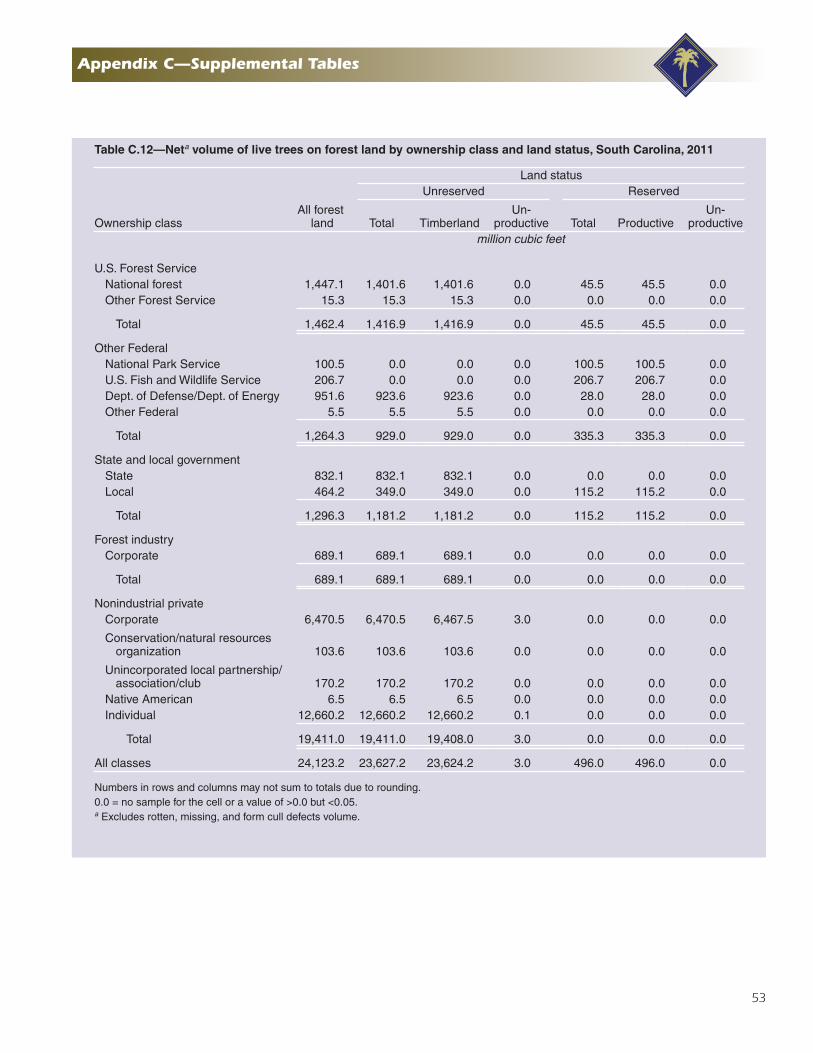
53
Appendix C—Supplemental Tables
Table C.12—Neta volume of live trees on forest land by ownership class and land status, South Carolina, 2011
Ownership classAll forest
land
Land statusUnreserved Reserved
Total TimberlandUn-
productive Total ProductiveUn-
productivemillion cubic feet
U.S. Forest ServiceNational forest 1,447.1 1,401.6 1,401.6 0.0 45.5 45.5 0.0Other Forest Service 15.3 15.3 15.3 0.0 0.0 0.0 0.0
Total 1,462.4 1,416.9 1,416.9 0.0 45.5 45.5 0.0
Other FederalNational Park Service 100.5 0.0 0.0 0.0 100.5 100.5 0.0U.S. Fish and Wildlife Service 206.7 0.0 0.0 0.0 206.7 206.7 0.0Dept. of Defense/Dept. of Energy 951.6 923.6 923.6 0.0 28.0 28.0 0.0Other Federal 5.5 5.5 5.5 0.0 0.0 0.0 0.0
Total 1,264.3 929.0 929.0 0.0 335.3 335.3 0.0
State and local governmentState 832.1 832.1 832.1 0.0 0.0 0.0 0.0Local 464.2 349.0 349.0 0.0 115.2 115.2 0.0
Total 1,296.3 1,181.2 1,181.2 0.0 115.2 115.2 0.0
Forest industryCorporate 689.1 689.1 689.1 0.0 0.0 0.0 0.0
Total 689.1 689.1 689.1 0.0 0.0 0.0 0.0
Nonindustrial privateCorporate 6,470.5 6,470.5 6,467.5 3.0 0.0 0.0 0.0
Conservation/natural resources organization 103.6 103.6 103.6 0.0 0.0 0.0 0.0
Unincorporated local partnership/association/club 170.2 170.2 170.2 0.0 0.0 0.0 0.0
Native American 6.5 6.5 6.5 0.0 0.0 0.0 0.0Individual 12,660.2 12,660.2 12,660.2 0.1 0.0 0.0 0.0
Total 19,411.0 19,411.0 19,408.0 3.0 0.0 0.0 0.0
All classes 24,123.2 23,627.2 23,624.2 3.0 496.0 496.0 0.0
Numbers in rows and columns may not sum to totals due to rounding.0.0 = no sample for the cell or a value of >0.0 but <0.05.a Excludes rotten, missing, and form cull defects volume.
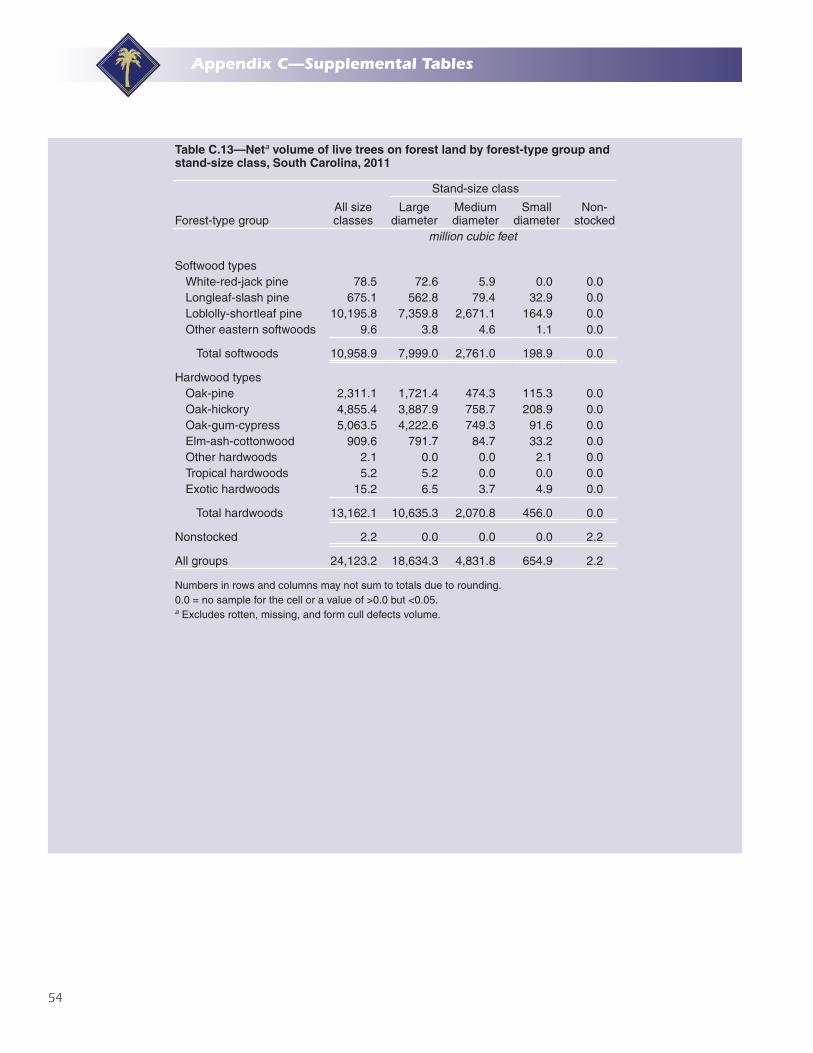
54
Appendix C—Supplemental Tables
Table C.13—Neta volume of live trees on forest land by forest-type group and stand-size class, South Carolina, 2011
Forest-type groupAll size classes
Stand-size class
Non-stocked
Large diameter
Medium diameter
Small diameter
million cubic feet
Softwood typesWhite-red-jack pine 78.5 72.6 5.9 0.0 0.0Longleaf-slash pine 675.1 562.8 79.4 32.9 0.0Loblolly-shortleaf pine 10,195.8 7,359.8 2,671.1 164.9 0.0Other eastern softwoods 9.6 3.8 4.6 1.1 0.0
Total softwoods 10,958.9 7,999.0 2,761.0 198.9 0.0
Hardwood typesOak-pine 2,311.1 1,721.4 474.3 115.3 0.0Oak-hickory 4,855.4 3,887.9 758.7 208.9 0.0Oak-gum-cypress 5,063.5 4,222.6 749.3 91.6 0.0Elm-ash-cottonwood 909.6 791.7 84.7 33.2 0.0Other hardwoods 2.1 0.0 0.0 2.1 0.0Tropical hardwoods 5.2 5.2 0.0 0.0 0.0Exotic hardwoods 15.2 6.5 3.7 4.9 0.0
Total hardwoods 13,162.1 10,635.3 2,070.8 456.0 0.0
Nonstocked 2.2 0.0 0.0 0.0 2.2
All groups 24,123.2 18,634.3 4,831.8 654.9 2.2
Numbers in rows and columns may not sum to totals due to rounding.0.0 = no sample for the cell or a value of >0.0 but <0.05.a Excludes rotten, missing, and form cull defects volume.
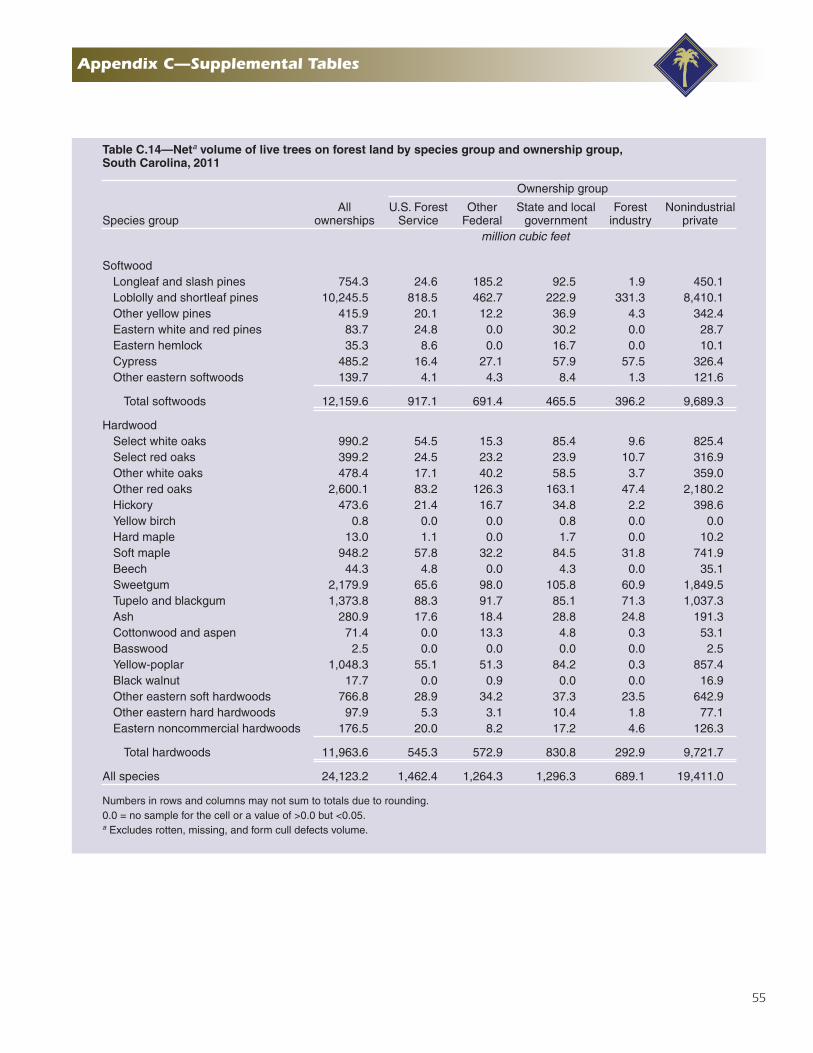
55
Appendix C—Supplemental Tables
Table C.14—Neta volume of live trees on forest land by species group and ownership group, South Carolina, 2011
Species groupAll
ownerships
Ownership group
U.S. Forest Service
Other Federal
State and local government
Forest industry
Nonindustrial private
million cubic feet
SoftwoodLongleaf and slash pines 754.3 24.6 185.2 92.5 1.9 450.1Loblolly and shortleaf pines 10,245.5 818.5 462.7 222.9 331.3 8,410.1Other yellow pines 415.9 20.1 12.2 36.9 4.3 342.4Eastern white and red pines 83.7 24.8 0.0 30.2 0.0 28.7Eastern hemlock 35.3 8.6 0.0 16.7 0.0 10.1Cypress 485.2 16.4 27.1 57.9 57.5 326.4Other eastern softwoods 139.7 4.1 4.3 8.4 1.3 121.6
Total softwoods 12,159.6 917.1 691.4 465.5 396.2 9,689.3
HardwoodSelect white oaks 990.2 54.5 15.3 85.4 9.6 825.4Select red oaks 399.2 24.5 23.2 23.9 10.7 316.9Other white oaks 478.4 17.1 40.2 58.5 3.7 359.0Other red oaks 2,600.1 83.2 126.3 163.1 47.4 2,180.2Hickory 473.6 21.4 16.7 34.8 2.2 398.6Yellow birch 0.8 0.0 0.0 0.8 0.0 0.0Hard maple 13.0 1.1 0.0 1.7 0.0 10.2Soft maple 948.2 57.8 32.2 84.5 31.8 741.9Beech 44.3 4.8 0.0 4.3 0.0 35.1Sweetgum 2,179.9 65.6 98.0 105.8 60.9 1,849.5Tupelo and blackgum 1,373.8 88.3 91.7 85.1 71.3 1,037.3Ash 280.9 17.6 18.4 28.8 24.8 191.3Cottonwood and aspen 71.4 0.0 13.3 4.8 0.3 53.1Basswood 2.5 0.0 0.0 0.0 0.0 2.5Yellow-poplar 1,048.3 55.1 51.3 84.2 0.3 857.4Black walnut 17.7 0.0 0.9 0.0 0.0 16.9Other eastern soft hardwoods 766.8 28.9 34.2 37.3 23.5 642.9Other eastern hard hardwoods 97.9 5.3 3.1 10.4 1.8 77.1Eastern noncommercial hardwoods 176.5 20.0 8.2 17.2 4.6 126.3
Total hardwoods 11,963.6 545.3 572.9 830.8 292.9 9,721.7
All species 24,123.2 1,462.4 1,264.3 1,296.3 689.1 19,411.0
Numbers in rows and columns may not sum to totals due to rounding.0.0 = no sample for the cell or a value of >0.0 but <0.05.a Excludes rotten, missing, and form cull defects volume.
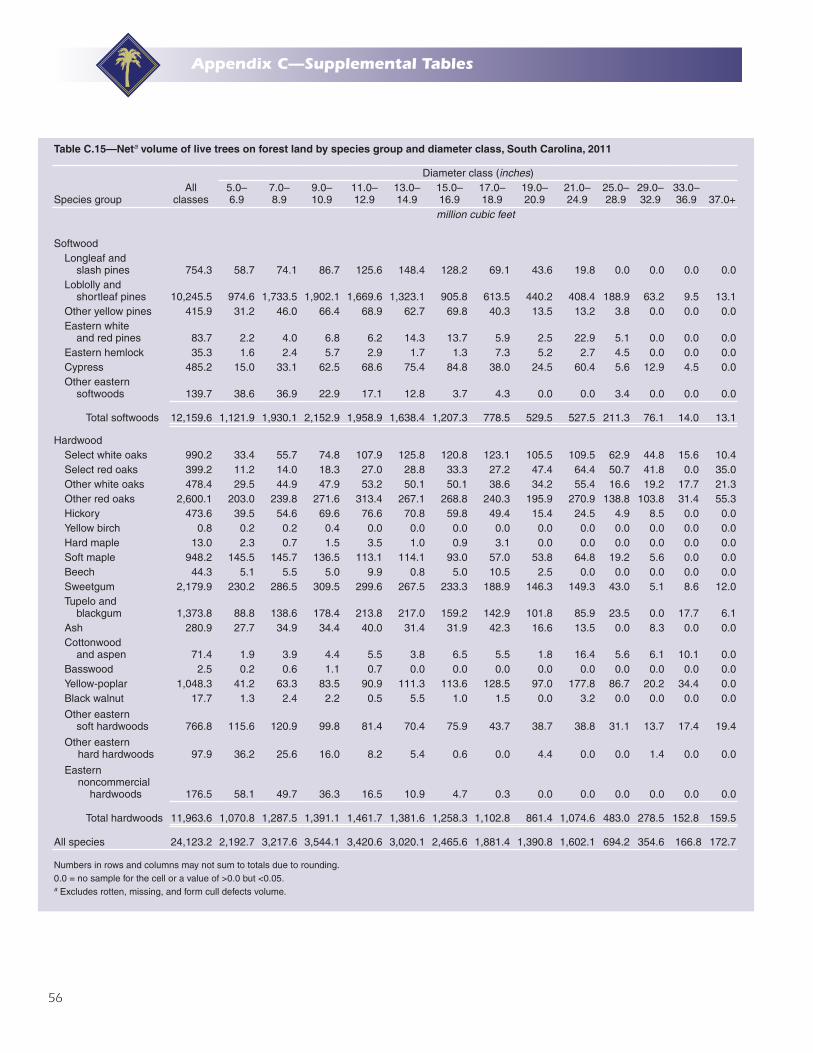
56
Appendix C—Supplemental Tables
Table C.15—Neta volume of live trees on forest land by species group and diameter class, South Carolina, 2011
Species groupAll
classes
Diameter class (inches)5.0– 6.9
7.0– 8.9
9.0– 10.9
11.0– 12.9
13.0– 14.9
15.0– 16.9
17.0– 18.9
19.0– 20.9
21.0– 24.9
25.0– 28.9
29.0– 32.9
33.0– 36.9 37.0+
million cubic feet
SoftwoodLongleaf and
slash pines 754.3 58.7 74.1 86.7 125.6 148.4 128.2 69.1 43.6 19.8 0.0 0.0 0.0 0.0Loblolly and
shortleaf pines 10,245.5 974.6 1,733.5 1,902.1 1,669.6 1,323.1 905.8 613.5 440.2 408.4 188.9 63.2 9.5 13.1Other yellow pines 415.9 31.2 46.0 66.4 68.9 62.7 69.8 40.3 13.5 13.2 3.8 0.0 0.0 0.0Eastern white
and red pines 83.7 2.2 4.0 6.8 6.2 14.3 13.7 5.9 2.5 22.9 5.1 0.0 0.0 0.0Eastern hemlock 35.3 1.6 2.4 5.7 2.9 1.7 1.3 7.3 5.2 2.7 4.5 0.0 0.0 0.0Cypress 485.2 15.0 33.1 62.5 68.6 75.4 84.8 38.0 24.5 60.4 5.6 12.9 4.5 0.0Other eastern
softwoods 139.7 38.6 36.9 22.9 17.1 12.8 3.7 4.3 0.0 0.0 3.4 0.0 0.0 0.0
Total softwoods 12,159.6 1,121.9 1,930.1 2,152.9 1,958.9 1,638.4 1,207.3 778.5 529.5 527.5 211.3 76.1 14.0 13.1
HardwoodSelect white oaks 990.2 33.4 55.7 74.8 107.9 125.8 120.8 123.1 105.5 109.5 62.9 44.8 15.6 10.4Select red oaks 399.2 11.2 14.0 18.3 27.0 28.8 33.3 27.2 47.4 64.4 50.7 41.8 0.0 35.0Other white oaks 478.4 29.5 44.9 47.9 53.2 50.1 50.1 38.6 34.2 55.4 16.6 19.2 17.7 21.3Other red oaks 2,600.1 203.0 239.8 271.6 313.4 267.1 268.8 240.3 195.9 270.9 138.8 103.8 31.4 55.3Hickory 473.6 39.5 54.6 69.6 76.6 70.8 59.8 49.4 15.4 24.5 4.9 8.5 0.0 0.0Yellow birch 0.8 0.2 0.2 0.4 0.0 0.0 0.0 0.0 0.0 0.0 0.0 0.0 0.0 0.0Hard maple 13.0 2.3 0.7 1.5 3.5 1.0 0.9 3.1 0.0 0.0 0.0 0.0 0.0 0.0Soft maple 948.2 145.5 145.7 136.5 113.1 114.1 93.0 57.0 53.8 64.8 19.2 5.6 0.0 0.0Beech 44.3 5.1 5.5 5.0 9.9 0.8 5.0 10.5 2.5 0.0 0.0 0.0 0.0 0.0Sweetgum 2,179.9 230.2 286.5 309.5 299.6 267.5 233.3 188.9 146.3 149.3 43.0 5.1 8.6 12.0Tupelo and
blackgum 1,373.8 88.8 138.6 178.4 213.8 217.0 159.2 142.9 101.8 85.9 23.5 0.0 17.7 6.1Ash 280.9 27.7 34.9 34.4 40.0 31.4 31.9 42.3 16.6 13.5 0.0 8.3 0.0 0.0Cottonwood
and aspen 71.4 1.9 3.9 4.4 5.5 3.8 6.5 5.5 1.8 16.4 5.6 6.1 10.1 0.0Basswood 2.5 0.2 0.6 1.1 0.7 0.0 0.0 0.0 0.0 0.0 0.0 0.0 0.0 0.0Yellow-poplar 1,048.3 41.2 63.3 83.5 90.9 111.3 113.6 128.5 97.0 177.8 86.7 20.2 34.4 0.0Black walnut 17.7 1.3 2.4 2.2 0.5 5.5 1.0 1.5 0.0 3.2 0.0 0.0 0.0 0.0
Other easternsoft hardwoods 766.8 115.6 120.9 99.8 81.4 70.4 75.9 43.7 38.7 38.8 31.1 13.7 17.4 19.4
Other easternhard hardwoods 97.9 36.2 25.6 16.0 8.2 5.4 0.6 0.0 4.4 0.0 0.0 1.4 0.0 0.0
Easternnoncommercial
hardwoods 176.5 58.1 49.7 36.3 16.5 10.9 4.7 0.3 0.0 0.0 0.0 0.0 0.0 0.0
Total hardwoods 11,963.6 1,070.8 1,287.5 1,391.1 1,461.7 1,381.6 1,258.3 1,102.8 861.4 1,074.6 483.0 278.5 152.8 159.5
All species 24,123.2 2,192.7 3,217.6 3,544.1 3,420.6 3,020.1 2,465.6 1,881.4 1,390.8 1,602.1 694.2 354.6 166.8 172.7
Numbers in rows and columns may not sum to totals due to rounding.0.0 = no sample for the cell or a value of >0.0 but <0.05.a Excludes rotten, missing, and form cull defects volume.
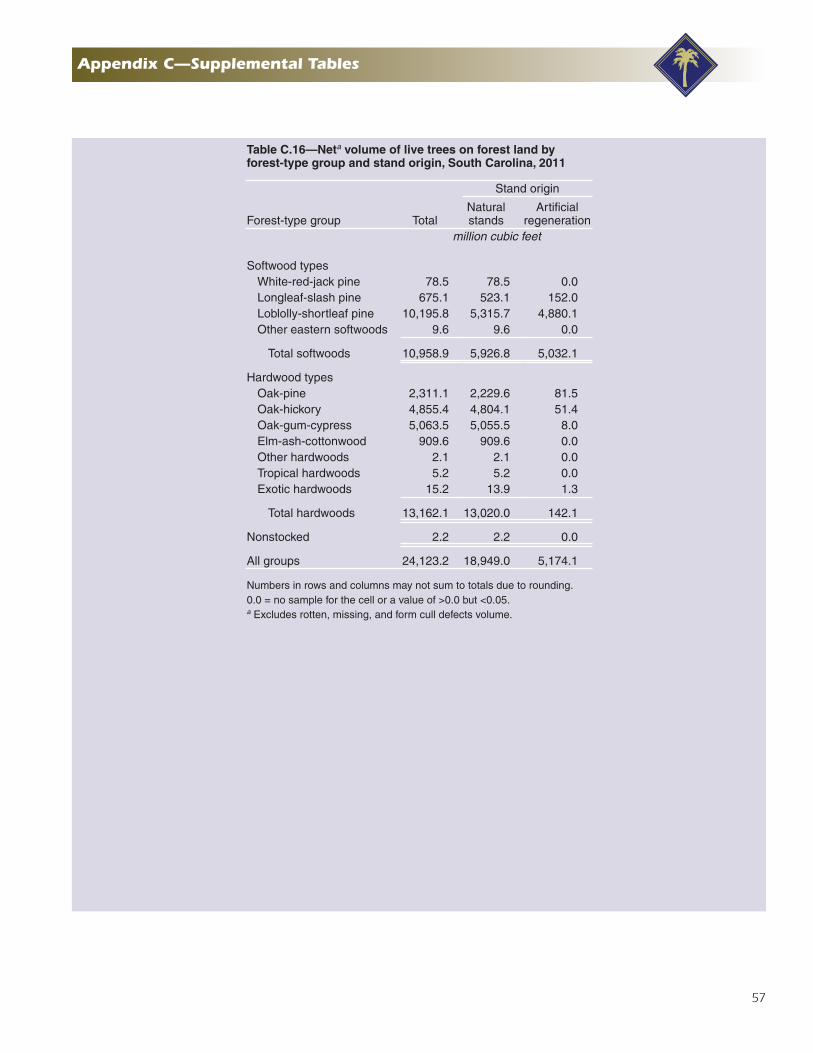
57
Appendix C—Supplemental Tables
Table C.16—Neta volume of live trees on forest land by forest-type group and stand origin, South Carolina, 2011
Forest-type group Total
Stand origin
Natural stands
Artificial regeneration
million cubic feet
Softwood typesWhite-red-jack pine 78.5 78.5 0.0Longleaf-slash pine 675.1 523.1 152.0Loblolly-shortleaf pine 10,195.8 5,315.7 4,880.1Other eastern softwoods 9.6 9.6 0.0
Total softwoods 10,958.9 5,926.8 5,032.1
Hardwood typesOak-pine 2,311.1 2,229.6 81.5Oak-hickory 4,855.4 4,804.1 51.4Oak-gum-cypress 5,063.5 5,055.5 8.0Elm-ash-cottonwood 909.6 909.6 0.0Other hardwoods 2.1 2.1 0.0Tropical hardwoods 5.2 5.2 0.0Exotic hardwoods 15.2 13.9 1.3
Total hardwoods 13,162.1 13,020.0 142.1
Nonstocked 2.2 2.2 0.0
All groups 24,123.2 18,949.0 5,174.1
Numbers in rows and columns may not sum to totals due to rounding.0.0 = no sample for the cell or a value of >0.0 but <0.05.a Excludes rotten, missing, and form cull defects volume.
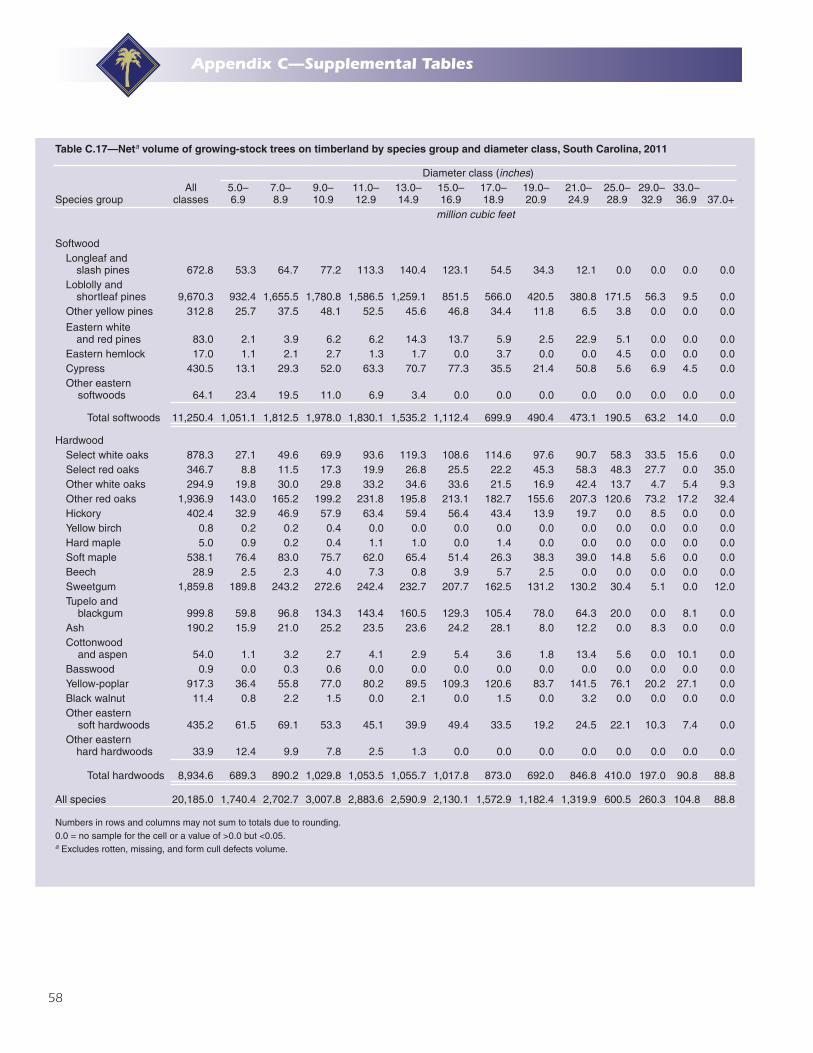
58
Appendix C—Supplemental Tables
Table C.17—Neta volume of growing-stock trees on timberland by species group and diameter class, South Carolina, 2011
Species groupAll
classes
Diameter class (inches)5.0– 6.9
7.0– 8.9
9.0– 10.9
11.0– 12.9
13.0– 14.9
15.0– 16.9
17.0– 18.9
19.0– 20.9
21.0– 24.9
25.0– 28.9
29.0– 32.9
33.0– 36.9 37.0+
million cubic feet
SoftwoodLongleaf and
slash pines 672.8 53.3 64.7 77.2 113.3 140.4 123.1 54.5 34.3 12.1 0.0 0.0 0.0 0.0Loblolly and
shortleaf pines 9,670.3 932.4 1,655.5 1,780.8 1,586.5 1,259.1 851.5 566.0 420.5 380.8 171.5 56.3 9.5 0.0Other yellow pines 312.8 25.7 37.5 48.1 52.5 45.6 46.8 34.4 11.8 6.5 3.8 0.0 0.0 0.0
Eastern whiteand red pines 83.0 2.1 3.9 6.2 6.2 14.3 13.7 5.9 2.5 22.9 5.1 0.0 0.0 0.0
Eastern hemlock 17.0 1.1 2.1 2.7 1.3 1.7 0.0 3.7 0.0 0.0 4.5 0.0 0.0 0.0Cypress 430.5 13.1 29.3 52.0 63.3 70.7 77.3 35.5 21.4 50.8 5.6 6.9 4.5 0.0Other eastern
softwoods 64.1 23.4 19.5 11.0 6.9 3.4 0.0 0.0 0.0 0.0 0.0 0.0 0.0 0.0
Total softwoods 11,250.4 1,051.1 1,812.5 1,978.0 1,830.1 1,535.2 1,112.4 699.9 490.4 473.1 190.5 63.2 14.0 0.0
HardwoodSelect white oaks 878.3 27.1 49.6 69.9 93.6 119.3 108.6 114.6 97.6 90.7 58.3 33.5 15.6 0.0Select red oaks 346.7 8.8 11.5 17.3 19.9 26.8 25.5 22.2 45.3 58.3 48.3 27.7 0.0 35.0Other white oaks 294.9 19.8 30.0 29.8 33.2 34.6 33.6 21.5 16.9 42.4 13.7 4.7 5.4 9.3Other red oaks 1,936.9 143.0 165.2 199.2 231.8 195.8 213.1 182.7 155.6 207.3 120.6 73.2 17.2 32.4Hickory 402.4 32.9 46.9 57.9 63.4 59.4 56.4 43.4 13.9 19.7 0.0 8.5 0.0 0.0Yellow birch 0.8 0.2 0.2 0.4 0.0 0.0 0.0 0.0 0.0 0.0 0.0 0.0 0.0 0.0Hard maple 5.0 0.9 0.2 0.4 1.1 1.0 0.0 1.4 0.0 0.0 0.0 0.0 0.0 0.0Soft maple 538.1 76.4 83.0 75.7 62.0 65.4 51.4 26.3 38.3 39.0 14.8 5.6 0.0 0.0Beech 28.9 2.5 2.3 4.0 7.3 0.8 3.9 5.7 2.5 0.0 0.0 0.0 0.0 0.0Sweetgum 1,859.8 189.8 243.2 272.6 242.4 232.7 207.7 162.5 131.2 130.2 30.4 5.1 0.0 12.0Tupelo and
blackgum 999.8 59.8 96.8 134.3 143.4 160.5 129.3 105.4 78.0 64.3 20.0 0.0 8.1 0.0Ash 190.2 15.9 21.0 25.2 23.5 23.6 24.2 28.1 8.0 12.2 0.0 8.3 0.0 0.0Cottonwood
and aspen 54.0 1.1 3.2 2.7 4.1 2.9 5.4 3.6 1.8 13.4 5.6 0.0 10.1 0.0Basswood 0.9 0.0 0.3 0.6 0.0 0.0 0.0 0.0 0.0 0.0 0.0 0.0 0.0 0.0Yellow-poplar 917.3 36.4 55.8 77.0 80.2 89.5 109.3 120.6 83.7 141.5 76.1 20.2 27.1 0.0Black walnut 11.4 0.8 2.2 1.5 0.0 2.1 0.0 1.5 0.0 3.2 0.0 0.0 0.0 0.0Other eastern
soft hardwoods 435.2 61.5 69.1 53.3 45.1 39.9 49.4 33.5 19.2 24.5 22.1 10.3 7.4 0.0Other eastern
hard hardwoods 33.9 12.4 9.9 7.8 2.5 1.3 0.0 0.0 0.0 0.0 0.0 0.0 0.0 0.0
Total hardwoods 8,934.6 689.3 890.2 1,029.8 1,053.5 1,055.7 1,017.8 873.0 692.0 846.8 410.0 197.0 90.8 88.8
All species 20,185.0 1,740.4 2,702.7 3,007.8 2,883.6 2,590.9 2,130.1 1,572.9 1,182.4 1,319.9 600.5 260.3 104.8 88.8
Numbers in rows and columns may not sum to totals due to rounding.0.0 = no sample for the cell or a value of >0.0 but <0.05.a Excludes rotten, missing, and form cull defects volume.
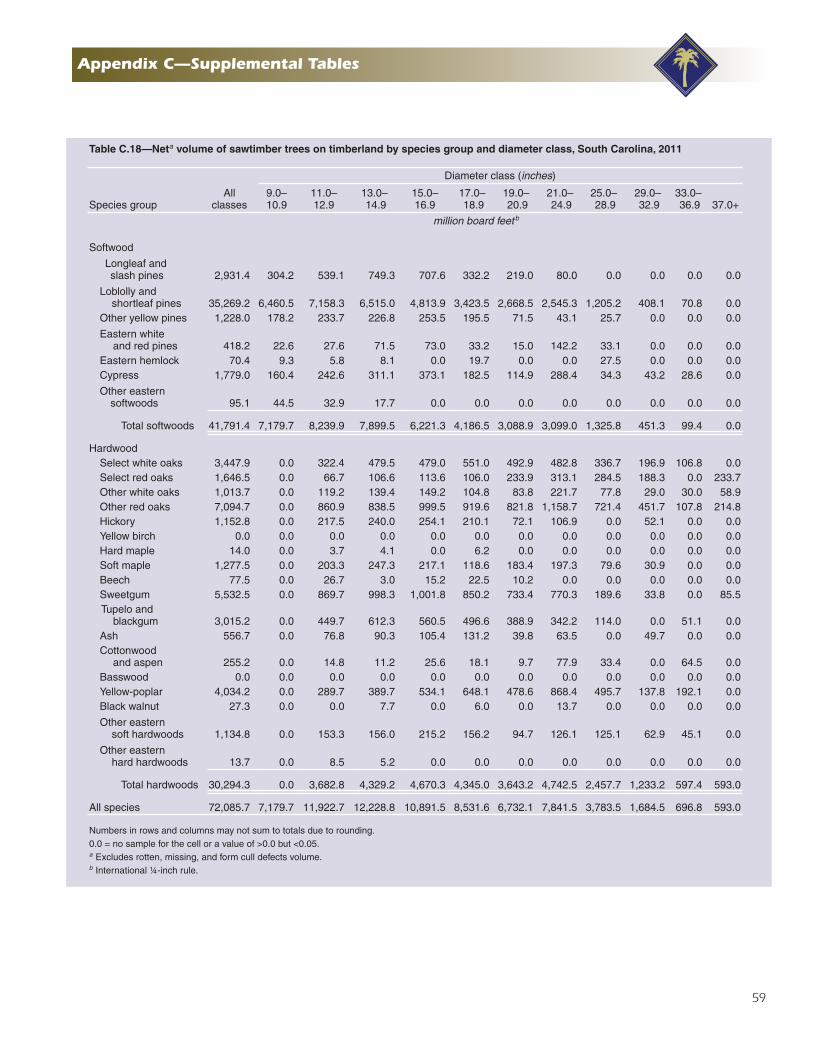
59
Appendix C—Supplemental Tables
Table C.18—Neta volume of sawtimber trees on timberland by species group and diameter class, South Carolina, 2011
Species groupAll
classes
Diameter class (inches)
9.0– 10.9
11.0– 12.9
13.0– 14.9
15.0– 16.9
17.0– 18.9
19.0– 20.9
21.0– 24.9
25.0– 28.9
29.0– 32.9
33.0– 36.9 37.0+
million board feet b
Softwood
Longleaf and slash pines 2,931.4 304.2 539.1 749.3 707.6 332.2 219.0 80.0 0.0 0.0 0.0 0.0
Loblolly and shortleaf pines 35,269.2 6,460.5 7,158.3 6,515.0 4,813.9 3,423.5 2,668.5 2,545.3 1,205.2 408.1 70.8 0.0
Other yellow pines 1,228.0 178.2 233.7 226.8 253.5 195.5 71.5 43.1 25.7 0.0 0.0 0.0
Eastern whiteand red pines 418.2 22.6 27.6 71.5 73.0 33.2 15.0 142.2 33.1 0.0 0.0 0.0
Eastern hemlock 70.4 9.3 5.8 8.1 0.0 19.7 0.0 0.0 27.5 0.0 0.0 0.0Cypress 1,779.0 160.4 242.6 311.1 373.1 182.5 114.9 288.4 34.3 43.2 28.6 0.0
Other eastern softwoods 95.1 44.5 32.9 17.7 0.0 0.0 0.0 0.0 0.0 0.0 0.0 0.0
Total softwoods 41,791.4 7,179.7 8,239.9 7,899.5 6,221.3 4,186.5 3,088.9 3,099.0 1,325.8 451.3 99.4 0.0
HardwoodSelect white oaks 3,447.9 0.0 322.4 479.5 479.0 551.0 492.9 482.8 336.7 196.9 106.8 0.0Select red oaks 1,646.5 0.0 66.7 106.6 113.6 106.0 233.9 313.1 284.5 188.3 0.0 233.7Other white oaks 1,013.7 0.0 119.2 139.4 149.2 104.8 83.8 221.7 77.8 29.0 30.0 58.9Other red oaks 7,094.7 0.0 860.9 838.5 999.5 919.6 821.8 1,158.7 721.4 451.7 107.8 214.8Hickory 1,152.8 0.0 217.5 240.0 254.1 210.1 72.1 106.9 0.0 52.1 0.0 0.0Yellow birch 0.0 0.0 0.0 0.0 0.0 0.0 0.0 0.0 0.0 0.0 0.0 0.0Hard maple 14.0 0.0 3.7 4.1 0.0 6.2 0.0 0.0 0.0 0.0 0.0 0.0Soft maple 1,277.5 0.0 203.3 247.3 217.1 118.6 183.4 197.3 79.6 30.9 0.0 0.0Beech 77.5 0.0 26.7 3.0 15.2 22.5 10.2 0.0 0.0 0.0 0.0 0.0Sweetgum 5,532.5 0.0 869.7 998.3 1,001.8 850.2 733.4 770.3 189.6 33.8 0.0 85.5Tupelo and
blackgum 3,015.2 0.0 449.7 612.3 560.5 496.6 388.9 342.2 114.0 0.0 51.1 0.0Ash 556.7 0.0 76.8 90.3 105.4 131.2 39.8 63.5 0.0 49.7 0.0 0.0Cottonwood
and aspen 255.2 0.0 14.8 11.2 25.6 18.1 9.7 77.9 33.4 0.0 64.5 0.0Basswood 0.0 0.0 0.0 0.0 0.0 0.0 0.0 0.0 0.0 0.0 0.0 0.0Yellow-poplar 4,034.2 0.0 289.7 389.7 534.1 648.1 478.6 868.4 495.7 137.8 192.1 0.0Black walnut 27.3 0.0 0.0 7.7 0.0 6.0 0.0 13.7 0.0 0.0 0.0 0.0
Other easternsoft hardwoods 1,134.8 0.0 153.3 156.0 215.2 156.2 94.7 126.1 125.1 62.9 45.1 0.0
Other easternhard hardwoods 13.7 0.0 8.5 5.2 0.0 0.0 0.0 0.0 0.0 0.0 0.0 0.0
Total hardwoods 30,294.3 0.0 3,682.8 4,329.2 4,670.3 4,345.0 3,643.2 4,742.5 2,457.7 1,233.2 597.4 593.0
All species 72,085.7 7,179.7 11,922.7 12,228.8 10,891.5 8,531.6 6,732.1 7,841.5 3,783.5 1,684.5 696.8 593.0
Numbers in rows and columns may not sum to totals due to rounding.0.0 = no sample for the cell or a value of >0.0 but <0.05.a Excludes rotten, missing, and form cull defects volume.b International ¼-inch rule.
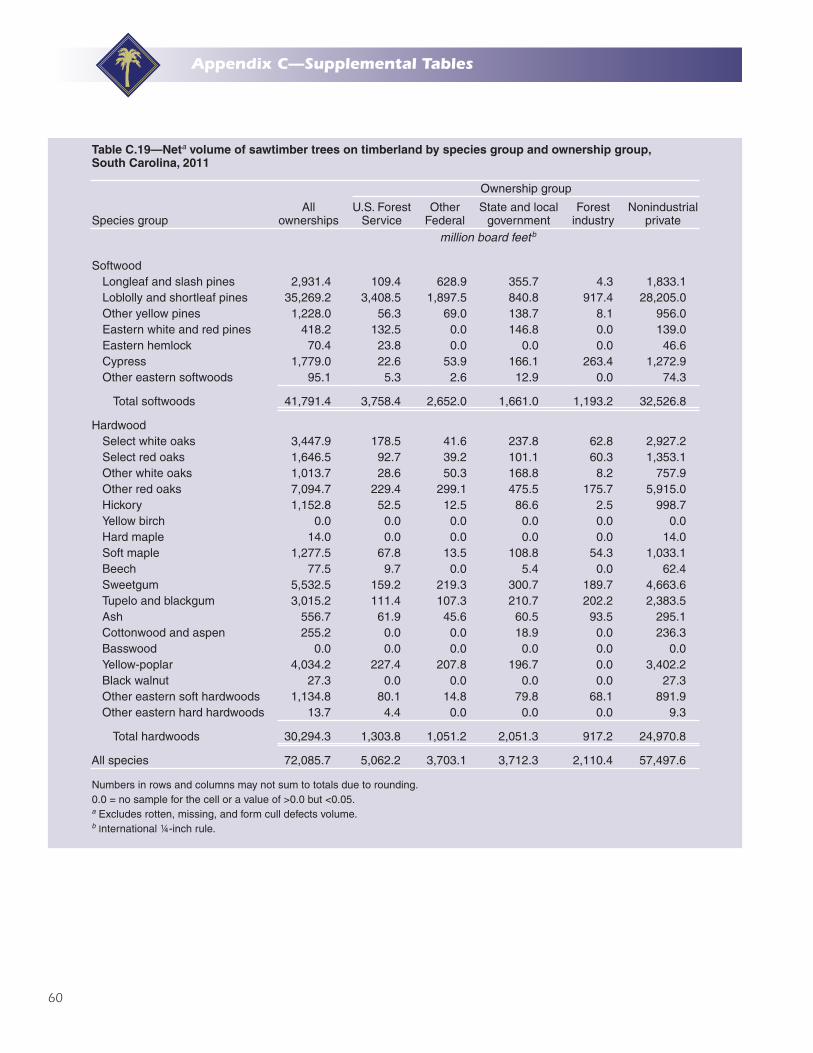
60
Appendix C—Supplemental Tables
Table C.19—Neta volume of sawtimber trees on timberland by species group and ownership group, South Carolina, 2011
Species groupAll
ownerships
Ownership group
U.S. Forest Service
Other Federal
State and local government
Forest industry
Nonindustrial private
million board feet b
SoftwoodLongleaf and slash pines 2,931.4 109.4 628.9 355.7 4.3 1,833.1Loblolly and shortleaf pines 35,269.2 3,408.5 1,897.5 840.8 917.4 28,205.0Other yellow pines 1,228.0 56.3 69.0 138.7 8.1 956.0Eastern white and red pines 418.2 132.5 0.0 146.8 0.0 139.0Eastern hemlock 70.4 23.8 0.0 0.0 0.0 46.6Cypress 1,779.0 22.6 53.9 166.1 263.4 1,272.9Other eastern softwoods 95.1 5.3 2.6 12.9 0.0 74.3
Total softwoods 41,791.4 3,758.4 2,652.0 1,661.0 1,193.2 32,526.8
HardwoodSelect white oaks 3,447.9 178.5 41.6 237.8 62.8 2,927.2Select red oaks 1,646.5 92.7 39.2 101.1 60.3 1,353.1Other white oaks 1,013.7 28.6 50.3 168.8 8.2 757.9Other red oaks 7,094.7 229.4 299.1 475.5 175.7 5,915.0Hickory 1,152.8 52.5 12.5 86.6 2.5 998.7Yellow birch 0.0 0.0 0.0 0.0 0.0 0.0Hard maple 14.0 0.0 0.0 0.0 0.0 14.0Soft maple 1,277.5 67.8 13.5 108.8 54.3 1,033.1Beech 77.5 9.7 0.0 5.4 0.0 62.4Sweetgum 5,532.5 159.2 219.3 300.7 189.7 4,663.6Tupelo and blackgum 3,015.2 111.4 107.3 210.7 202.2 2,383.5Ash 556.7 61.9 45.6 60.5 93.5 295.1Cottonwood and aspen 255.2 0.0 0.0 18.9 0.0 236.3Basswood 0.0 0.0 0.0 0.0 0.0 0.0Yellow-poplar 4,034.2 227.4 207.8 196.7 0.0 3,402.2Black walnut 27.3 0.0 0.0 0.0 0.0 27.3Other eastern soft hardwoods 1,134.8 80.1 14.8 79.8 68.1 891.9Other eastern hard hardwoods 13.7 4.4 0.0 0.0 0.0 9.3
Total hardwoods 30,294.3 1,303.8 1,051.2 2,051.3 917.2 24,970.8
All species 72,085.7 5,062.2 3,703.1 3,712.3 2,110.4 57,497.6
Numbers in rows and columns may not sum to totals due to rounding.0.0 = no sample for the cell or a value of >0.0 but <0.05.a Excludes rotten, missing, and form cull defects volume.b International ¼-inch rule.
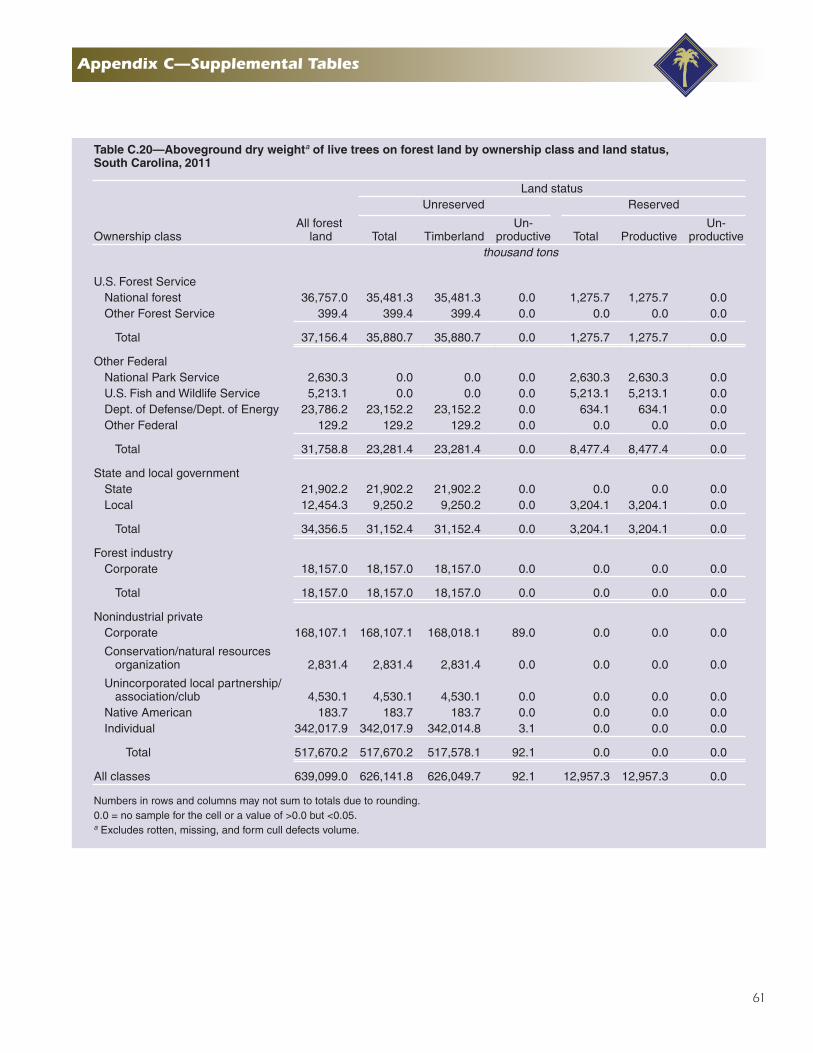
61
Appendix C—Supplemental Tables
Table C.20—Aboveground dry weighta of live trees on forest land by ownership class and land status, South Carolina, 2011
Ownership classAll forest
land
Land statusUnreserved Reserved
Total TimberlandUn-
productive Total ProductiveUn-
productivethousand tons
U.S. Forest ServiceNational forest 36,757.0 35,481.3 35,481.3 0.0 1,275.7 1,275.7 0.0Other Forest Service 399.4 399.4 399.4 0.0 0.0 0.0 0.0
Total 37,156.4 35,880.7 35,880.7 0.0 1,275.7 1,275.7 0.0
Other FederalNational Park Service 2,630.3 0.0 0.0 0.0 2,630.3 2,630.3 0.0U.S. Fish and Wildlife Service 5,213.1 0.0 0.0 0.0 5,213.1 5,213.1 0.0Dept. of Defense/Dept. of Energy 23,786.2 23,152.2 23,152.2 0.0 634.1 634.1 0.0Other Federal 129.2 129.2 129.2 0.0 0.0 0.0 0.0
Total 31,758.8 23,281.4 23,281.4 0.0 8,477.4 8,477.4 0.0
State and local governmentState 21,902.2 21,902.2 21,902.2 0.0 0.0 0.0 0.0Local 12,454.3 9,250.2 9,250.2 0.0 3,204.1 3,204.1 0.0
Total 34,356.5 31,152.4 31,152.4 0.0 3,204.1 3,204.1 0.0
Forest industryCorporate 18,157.0 18,157.0 18,157.0 0.0 0.0 0.0 0.0
Total 18,157.0 18,157.0 18,157.0 0.0 0.0 0.0 0.0
Nonindustrial privateCorporate 168,107.1 168,107.1 168,018.1 89.0 0.0 0.0 0.0
Conservation/natural resources organization 2,831.4 2,831.4 2,831.4 0.0 0.0 0.0 0.0
Unincorporated local partnership/association/club 4,530.1 4,530.1 4,530.1 0.0 0.0 0.0 0.0
Native American 183.7 183.7 183.7 0.0 0.0 0.0 0.0Individual 342,017.9 342,017.9 342,014.8 3.1 0.0 0.0 0.0
Total 517,670.2 517,670.2 517,578.1 92.1 0.0 0.0 0.0
All classes 639,099.0 626,141.8 626,049.7 92.1 12,957.3 12,957.3 0.0
Numbers in rows and columns may not sum to totals due to rounding.0.0 = no sample for the cell or a value of >0.0 but <0.05.a Excludes rotten, missing, and form cull defects volume.
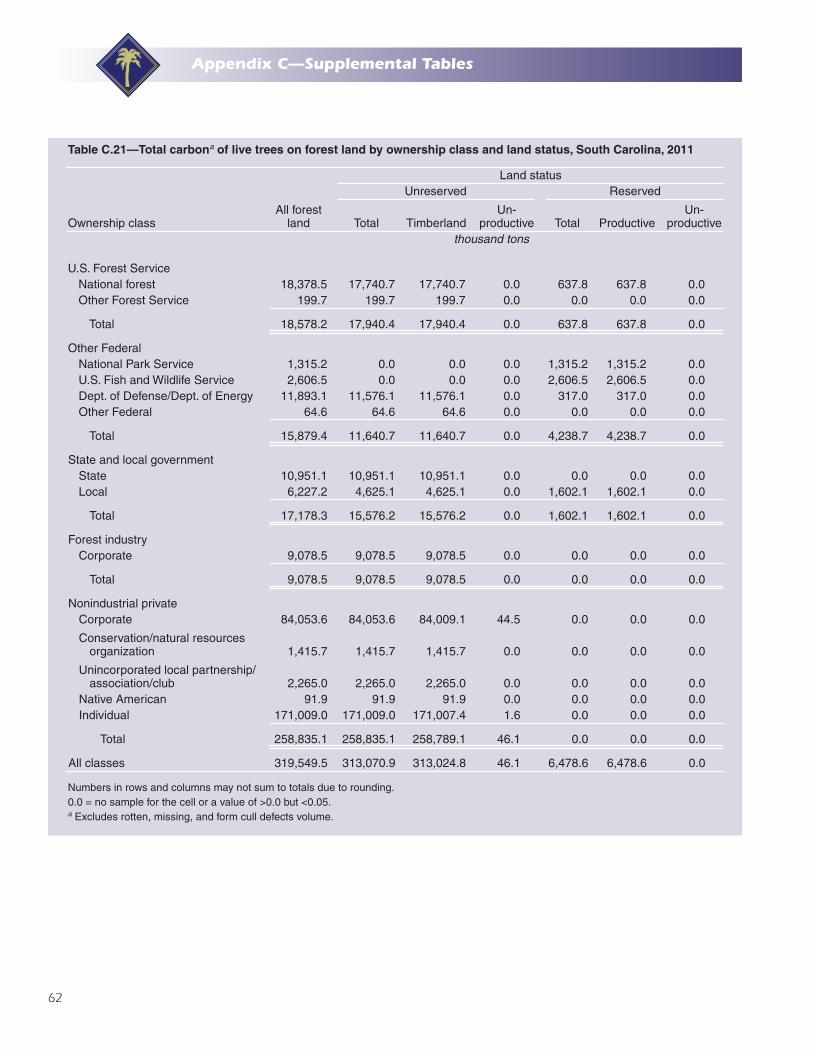
62
Appendix C—Supplemental Tables
Table C.21—Total carbona of live trees on forest land by ownership class and land status, South Carolina, 2011
Ownership classAll forest
land
Land statusUnreserved Reserved
Total TimberlandUn-
productive Total ProductiveUn-
productivethousand tons
U.S. Forest ServiceNational forest 18,378.5 17,740.7 17,740.7 0.0 637.8 637.8 0.0Other Forest Service 199.7 199.7 199.7 0.0 0.0 0.0 0.0
Total 18,578.2 17,940.4 17,940.4 0.0 637.8 637.8 0.0
Other FederalNational Park Service 1,315.2 0.0 0.0 0.0 1,315.2 1,315.2 0.0U.S. Fish and Wildlife Service 2,606.5 0.0 0.0 0.0 2,606.5 2,606.5 0.0Dept. of Defense/Dept. of Energy 11,893.1 11,576.1 11,576.1 0.0 317.0 317.0 0.0Other Federal 64.6 64.6 64.6 0.0 0.0 0.0 0.0
Total 15,879.4 11,640.7 11,640.7 0.0 4,238.7 4,238.7 0.0
State and local governmentState 10,951.1 10,951.1 10,951.1 0.0 0.0 0.0 0.0Local 6,227.2 4,625.1 4,625.1 0.0 1,602.1 1,602.1 0.0
Total 17,178.3 15,576.2 15,576.2 0.0 1,602.1 1,602.1 0.0
Forest industryCorporate 9,078.5 9,078.5 9,078.5 0.0 0.0 0.0 0.0
Total 9,078.5 9,078.5 9,078.5 0.0 0.0 0.0 0.0
Nonindustrial privateCorporate 84,053.6 84,053.6 84,009.1 44.5 0.0 0.0 0.0
Conservation/natural resources organization 1,415.7 1,415.7 1,415.7 0.0 0.0 0.0 0.0
Unincorporated local partnership/association/club 2,265.0 2,265.0 2,265.0 0.0 0.0 0.0 0.0
Native American 91.9 91.9 91.9 0.0 0.0 0.0 0.0Individual 171,009.0 171,009.0 171,007.4 1.6 0.0 0.0 0.0
Total 258,835.1 258,835.1 258,789.1 46.1 0.0 0.0 0.0
All classes 319,549.5 313,070.9 313,024.8 46.1 6,478.6 6,478.6 0.0
Numbers in rows and columns may not sum to totals due to rounding.0.0 = no sample for the cell or a value of >0.0 but <0.05.a Excludes rotten, missing, and form cull defects volume.
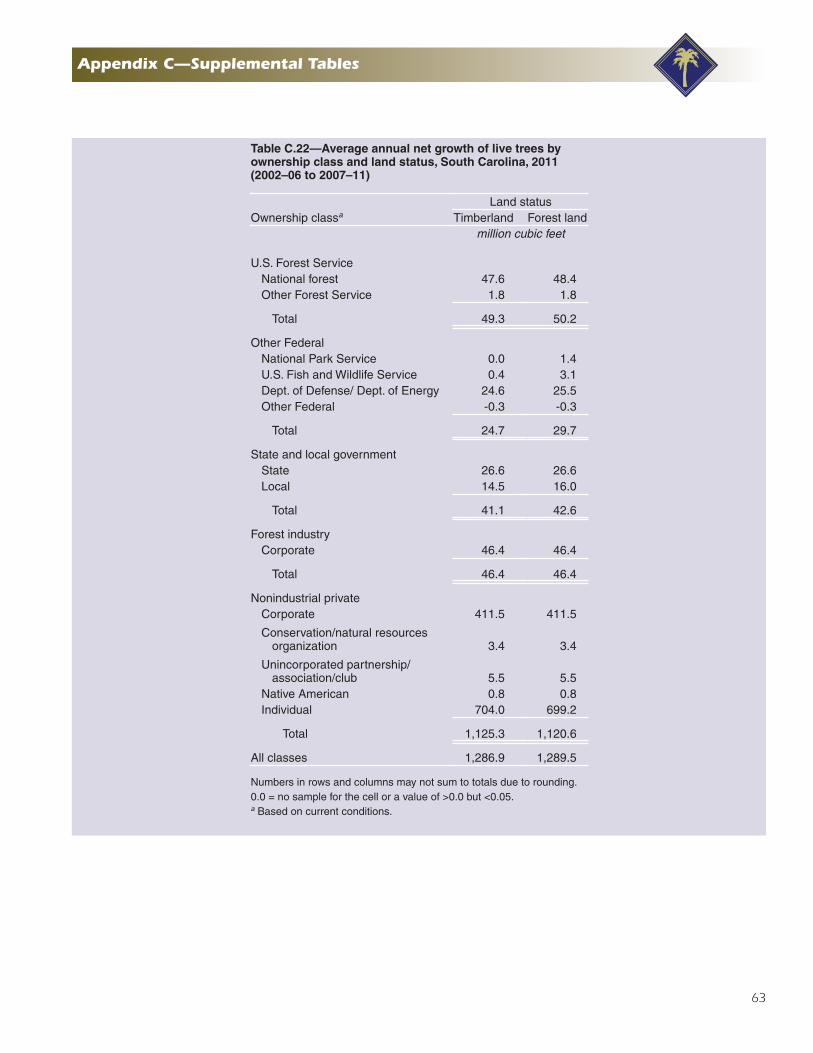
63
Appendix C—Supplemental Tables
Table C.22—Average annual net growth of live trees by ownership class and land status, South Carolina, 2011 (2002–06 to 2007–11)
Ownership classa
Land statusTimberland Forest land
million cubic feet
U.S. Forest ServiceNational forest 47.6 48.4Other Forest Service 1.8 1.8
Total 49.3 50.2
Other FederalNational Park Service 0.0 1.4U.S. Fish and Wildlife Service 0.4 3.1Dept. of Defense/ Dept. of Energy 24.6 25.5Other Federal -0.3 -0.3
Total 24.7 29.7
State and local governmentState 26.6 26.6Local 14.5 16.0
Total 41.1 42.6
Forest industryCorporate 46.4 46.4
Total 46.4 46.4
Nonindustrial privateCorporate 411.5 411.5
Conservation/natural resources organization 3.4 3.4
Unincorporated partnership/association/club 5.5 5.5
Native American 0.8 0.8Individual 704.0 699.2
Total 1,125.3 1,120.6
All classes 1,286.9 1,289.5
Numbers in rows and columns may not sum to totals due to rounding.0.0 = no sample for the cell or a value of >0.0 but <0.05.a Based on current conditions.
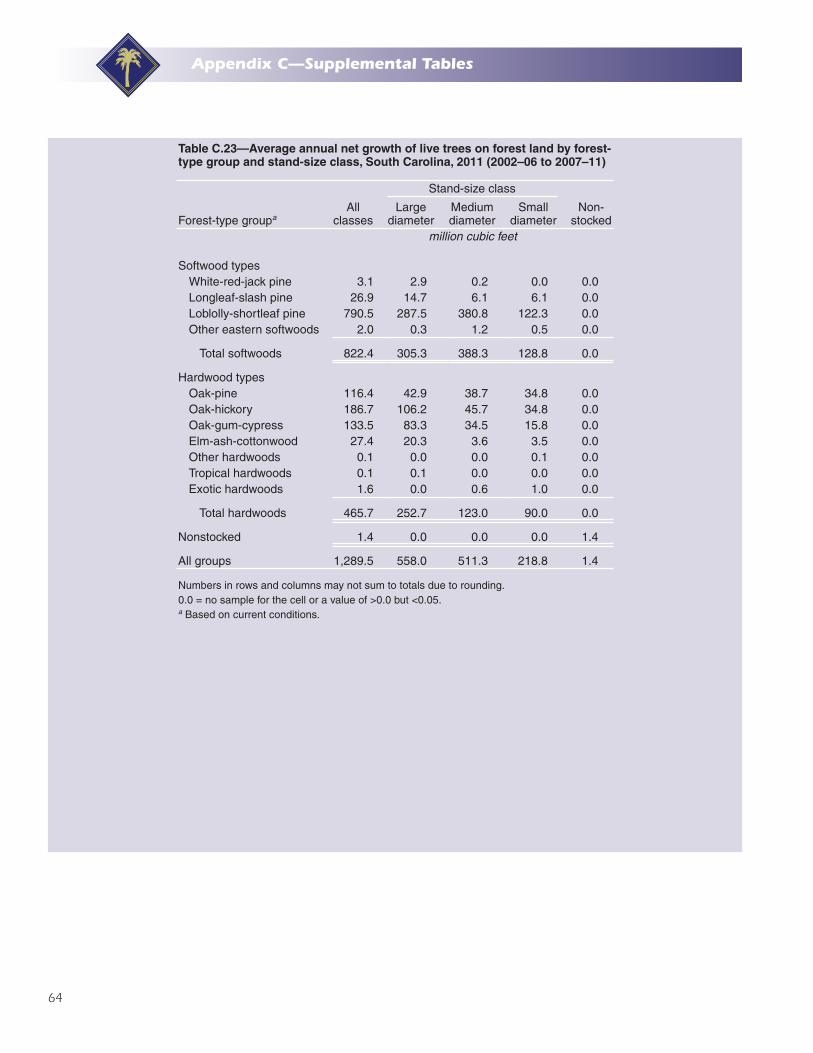
64
Appendix C—Supplemental Tables
Table C.23—Average annual net growth of live trees on forest land by forest-type group and stand-size class, South Carolina, 2011 (2002–06 to 2007–11)
Forest-type groupaAll
classes
Stand-size class
Non-stocked
Large diameter
Medium diameter
Small diameter
million cubic feet
Softwood typesWhite-red-jack pine 3.1 2.9 0.2 0.0 0.0Longleaf-slash pine 26.9 14.7 6.1 6.1 0.0Loblolly-shortleaf pine 790.5 287.5 380.8 122.3 0.0Other eastern softwoods 2.0 0.3 1.2 0.5 0.0
Total softwoods 822.4 305.3 388.3 128.8 0.0
Hardwood typesOak-pine 116.4 42.9 38.7 34.8 0.0Oak-hickory 186.7 106.2 45.7 34.8 0.0Oak-gum-cypress 133.5 83.3 34.5 15.8 0.0Elm-ash-cottonwood 27.4 20.3 3.6 3.5 0.0Other hardwoods 0.1 0.0 0.0 0.1 0.0Tropical hardwoods 0.1 0.1 0.0 0.0 0.0Exotic hardwoods 1.6 0.0 0.6 1.0 0.0
Total hardwoods 465.7 252.7 123.0 90.0 0.0
Nonstocked 1.4 0.0 0.0 0.0 1.4
All groups 1,289.5 558.0 511.3 218.8 1.4
Numbers in rows and columns may not sum to totals due to rounding.0.0 = no sample for the cell or a value of >0.0 but <0.05.a Based on current conditions.
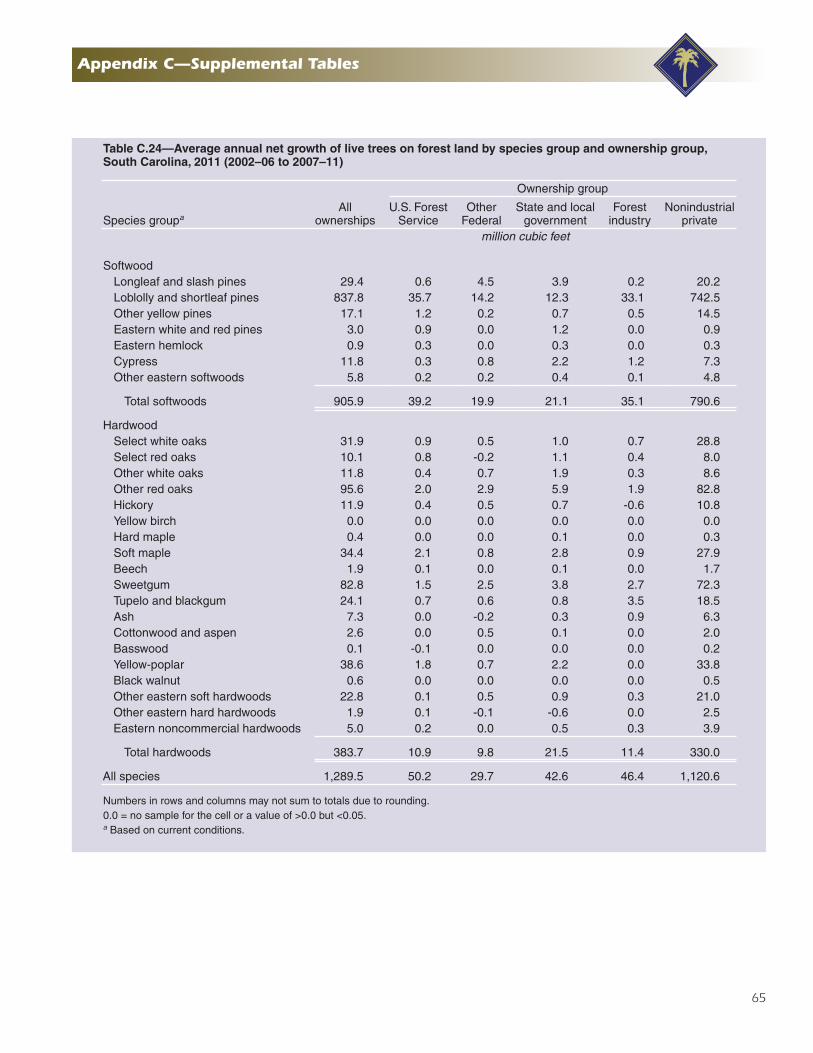
65
Appendix C—Supplemental Tables
Table C.24—Average annual net growth of live trees on forest land by species group and ownership group, South Carolina, 2011 (2002–06 to 2007–11)
Species groupaAll
ownerships
Ownership group
U.S. Forest Service
Other Federal
State and local government
Forest industry
Nonindustrial private
million cubic feet
SoftwoodLongleaf and slash pines 29.4 0.6 4.5 3.9 0.2 20.2Loblolly and shortleaf pines 837.8 35.7 14.2 12.3 33.1 742.5Other yellow pines 17.1 1.2 0.2 0.7 0.5 14.5Eastern white and red pines 3.0 0.9 0.0 1.2 0.0 0.9Eastern hemlock 0.9 0.3 0.0 0.3 0.0 0.3Cypress 11.8 0.3 0.8 2.2 1.2 7.3Other eastern softwoods 5.8 0.2 0.2 0.4 0.1 4.8
Total softwoods 905.9 39.2 19.9 21.1 35.1 790.6
HardwoodSelect white oaks 31.9 0.9 0.5 1.0 0.7 28.8Select red oaks 10.1 0.8 -0.2 1.1 0.4 8.0Other white oaks 11.8 0.4 0.7 1.9 0.3 8.6Other red oaks 95.6 2.0 2.9 5.9 1.9 82.8Hickory 11.9 0.4 0.5 0.7 -0.6 10.8Yellow birch 0.0 0.0 0.0 0.0 0.0 0.0Hard maple 0.4 0.0 0.0 0.1 0.0 0.3Soft maple 34.4 2.1 0.8 2.8 0.9 27.9Beech 1.9 0.1 0.0 0.1 0.0 1.7Sweetgum 82.8 1.5 2.5 3.8 2.7 72.3Tupelo and blackgum 24.1 0.7 0.6 0.8 3.5 18.5Ash 7.3 0.0 -0.2 0.3 0.9 6.3Cottonwood and aspen 2.6 0.0 0.5 0.1 0.0 2.0Basswood 0.1 -0.1 0.0 0.0 0.0 0.2Yellow-poplar 38.6 1.8 0.7 2.2 0.0 33.8Black walnut 0.6 0.0 0.0 0.0 0.0 0.5Other eastern soft hardwoods 22.8 0.1 0.5 0.9 0.3 21.0Other eastern hard hardwoods 1.9 0.1 -0.1 -0.6 0.0 2.5Eastern noncommercial hardwoods 5.0 0.2 0.0 0.5 0.3 3.9
Total hardwoods 383.7 10.9 9.8 21.5 11.4 330.0
All species 1,289.5 50.2 29.7 42.6 46.4 1,120.6
Numbers in rows and columns may not sum to totals due to rounding.0.0 = no sample for the cell or a value of >0.0 but <0.05.a Based on current conditions.
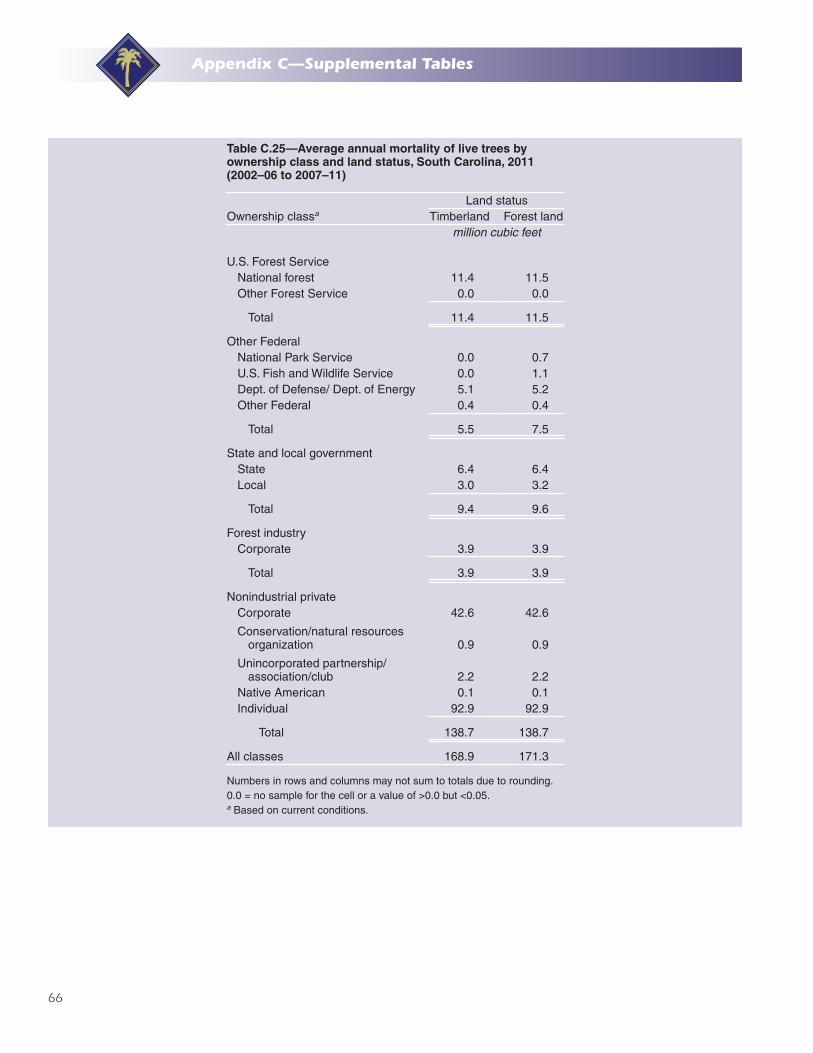
66
Table C.25—Average annual mortality of live trees by ownership class and land status, South Carolina, 2011 (2002–06 to 2007–11)
Ownership classa
Land statusTimberland Forest land
million cubic feet
U.S. Forest ServiceNational forest 11.4 11.5Other Forest Service 0.0 0.0
Total 11.4 11.5
Other FederalNational Park Service 0.0 0.7U.S. Fish and Wildlife Service 0.0 1.1Dept. of Defense/ Dept. of Energy 5.1 5.2Other Federal 0.4 0.4
Total 5.5 7.5
State and local governmentState 6.4 6.4Local 3.0 3.2
Total 9.4 9.6
Forest industryCorporate 3.9 3.9
Total 3.9 3.9
Nonindustrial privateCorporate 42.6 42.6
Conservation/natural resources organization 0.9 0.9
Unincorporated partnership/association/club 2.2 2.2
Native American 0.1 0.1Individual 92.9 92.9
Total 138.7 138.7
All classes 168.9 171.3
Numbers in rows and columns may not sum to totals due to rounding.0.0 = no sample for the cell or a value of >0.0 but <0.05.a Based on current conditions.
Appendix C—Supplemental Tables
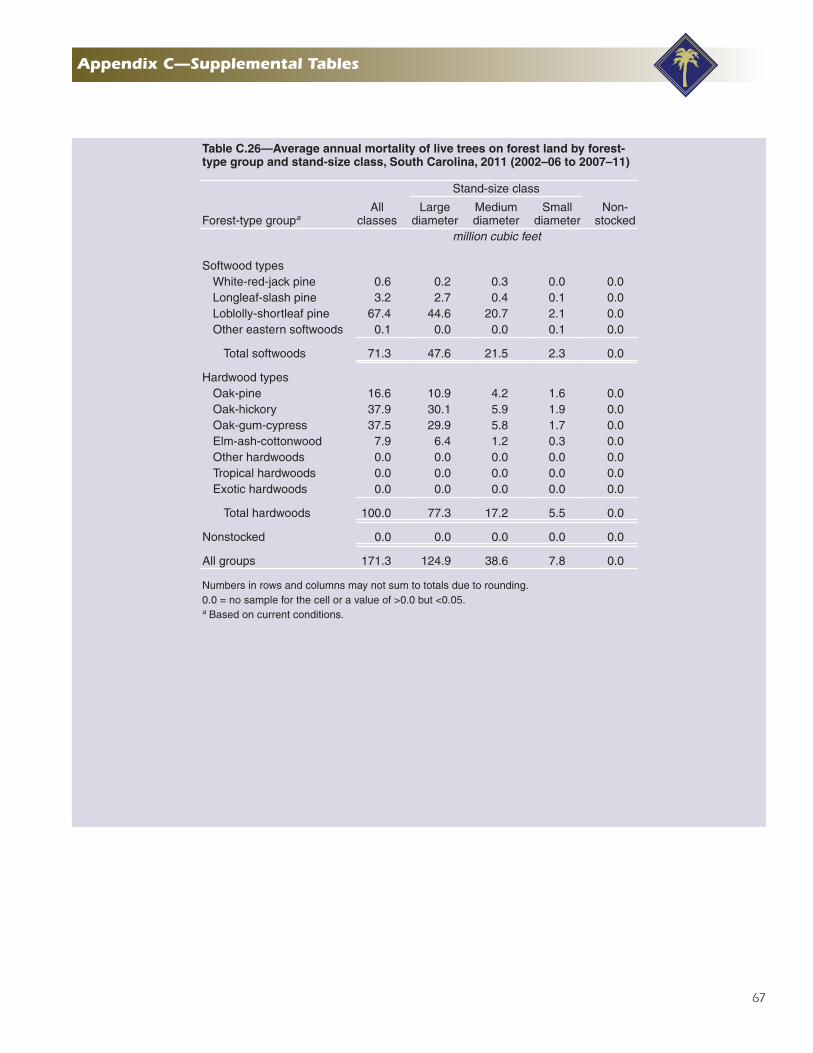
67
Table C.26—Average annual mortality of live trees on forest land by forest-type group and stand-size class, South Carolina, 2011 (2002–06 to 2007–11)
Forest-type groupaAll
classes
Stand-size class
Non-stocked
Large diameter
Medium diameter
Small diameter
million cubic feet
Softwood typesWhite-red-jack pine 0.6 0.2 0.3 0.0 0.0Longleaf-slash pine 3.2 2.7 0.4 0.1 0.0Loblolly-shortleaf pine 67.4 44.6 20.7 2.1 0.0Other eastern softwoods 0.1 0.0 0.0 0.1 0.0
Total softwoods 71.3 47.6 21.5 2.3 0.0
Hardwood typesOak-pine 16.6 10.9 4.2 1.6 0.0Oak-hickory 37.9 30.1 5.9 1.9 0.0Oak-gum-cypress 37.5 29.9 5.8 1.7 0.0Elm-ash-cottonwood 7.9 6.4 1.2 0.3 0.0Other hardwoods 0.0 0.0 0.0 0.0 0.0Tropical hardwoods 0.0 0.0 0.0 0.0 0.0Exotic hardwoods 0.0 0.0 0.0 0.0 0.0
Total hardwoods 100.0 77.3 17.2 5.5 0.0
Nonstocked 0.0 0.0 0.0 0.0 0.0
All groups 171.3 124.9 38.6 7.8 0.0
Numbers in rows and columns may not sum to totals due to rounding.0.0 = no sample for the cell or a value of >0.0 but <0.05.a Based on current conditions.
Appendix C—Supplemental Tables
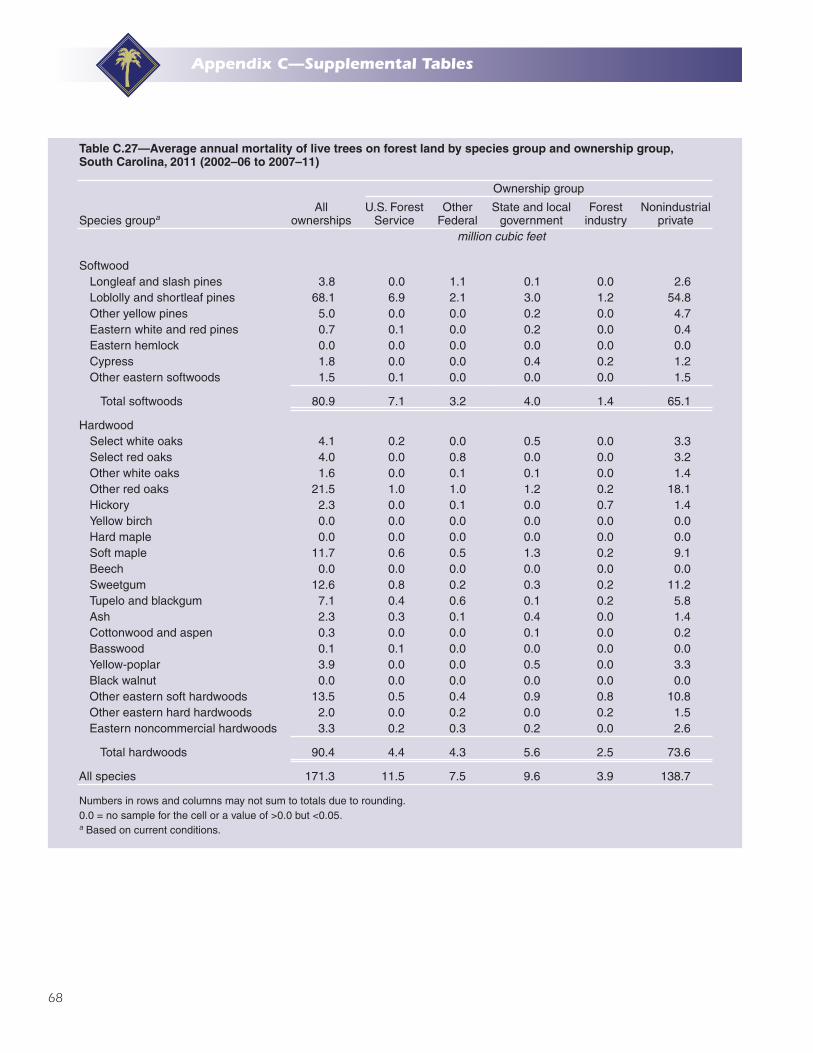
68
Table C.27—Average annual mortality of live trees on forest land by species group and ownership group, South Carolina, 2011 (2002–06 to 2007–11)
Species groupaAll
ownerships
Ownership group
U.S. Forest Service
Other Federal
State and local government
Forest industry
Nonindustrial private
million cubic feet
SoftwoodLongleaf and slash pines 3.8 0.0 1.1 0.1 0.0 2.6Loblolly and shortleaf pines 68.1 6.9 2.1 3.0 1.2 54.8Other yellow pines 5.0 0.0 0.0 0.2 0.0 4.7Eastern white and red pines 0.7 0.1 0.0 0.2 0.0 0.4Eastern hemlock 0.0 0.0 0.0 0.0 0.0 0.0Cypress 1.8 0.0 0.0 0.4 0.2 1.2Other eastern softwoods 1.5 0.1 0.0 0.0 0.0 1.5
Total softwoods 80.9 7.1 3.2 4.0 1.4 65.1
HardwoodSelect white oaks 4.1 0.2 0.0 0.5 0.0 3.3Select red oaks 4.0 0.0 0.8 0.0 0.0 3.2Other white oaks 1.6 0.0 0.1 0.1 0.0 1.4Other red oaks 21.5 1.0 1.0 1.2 0.2 18.1Hickory 2.3 0.0 0.1 0.0 0.7 1.4Yellow birch 0.0 0.0 0.0 0.0 0.0 0.0Hard maple 0.0 0.0 0.0 0.0 0.0 0.0Soft maple 11.7 0.6 0.5 1.3 0.2 9.1Beech 0.0 0.0 0.0 0.0 0.0 0.0Sweetgum 12.6 0.8 0.2 0.3 0.2 11.2Tupelo and blackgum 7.1 0.4 0.6 0.1 0.2 5.8Ash 2.3 0.3 0.1 0.4 0.0 1.4Cottonwood and aspen 0.3 0.0 0.0 0.1 0.0 0.2Basswood 0.1 0.1 0.0 0.0 0.0 0.0Yellow-poplar 3.9 0.0 0.0 0.5 0.0 3.3Black walnut 0.0 0.0 0.0 0.0 0.0 0.0Other eastern soft hardwoods 13.5 0.5 0.4 0.9 0.8 10.8Other eastern hard hardwoods 2.0 0.0 0.2 0.0 0.2 1.5Eastern noncommercial hardwoods 3.3 0.2 0.3 0.2 0.0 2.6
Total hardwoods 90.4 4.4 4.3 5.6 2.5 73.6
All species 171.3 11.5 7.5 9.6 3.9 138.7
Numbers in rows and columns may not sum to totals due to rounding.0.0 = no sample for the cell or a value of >0.0 but <0.05.a Based on current conditions.
Appendix C—Supplemental Tables
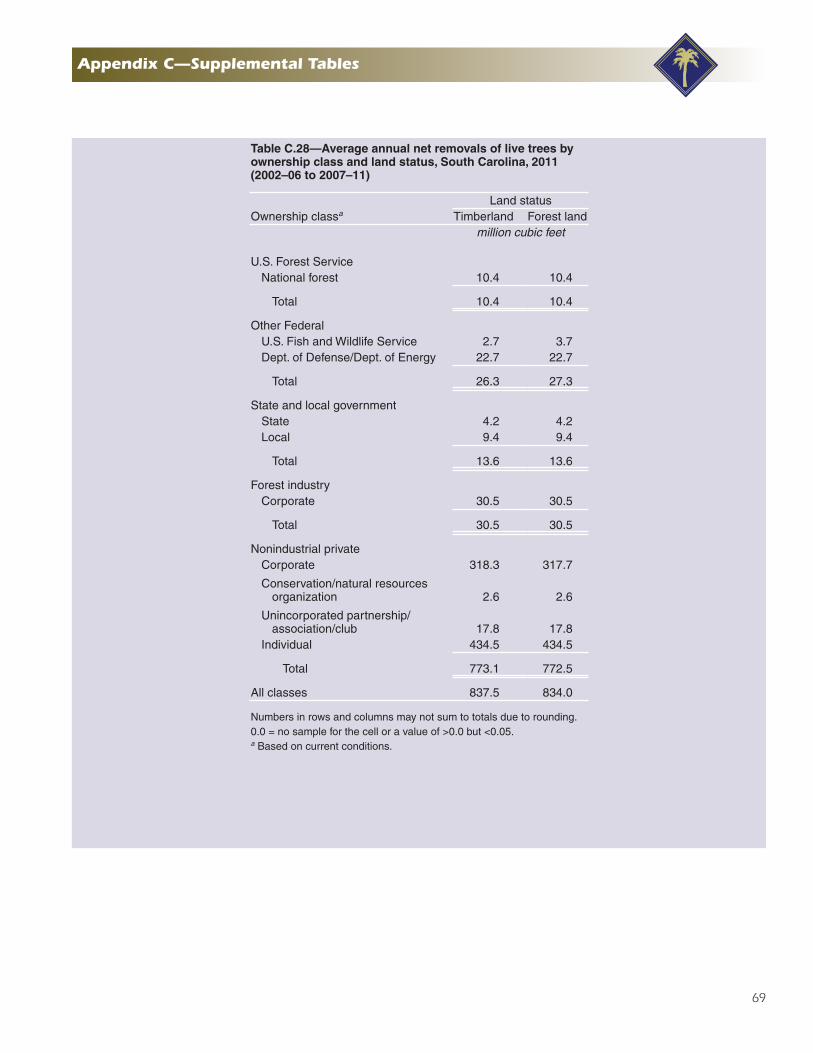
69
Table C.28—Average annual net removals of live trees by ownership class and land status, South Carolina, 2011 (2002–06 to 2007–11)
Ownership classa
Land statusTimberland Forest land
million cubic feet
U.S. Forest ServiceNational forest 10.4 10.4
Total 10.4 10.4
Other FederalU.S. Fish and Wildlife Service 2.7 3.7Dept. of Defense/Dept. of Energy 22.7 22.7
Total 26.3 27.3
State and local governmentState 4.2 4.2Local 9.4 9.4
Total 13.6 13.6
Forest industryCorporate 30.5 30.5
Total 30.5 30.5
Nonindustrial privateCorporate 318.3 317.7
Conservation/natural resources organization 2.6 2.6
Unincorporated partnership/association/club 17.8 17.8
Individual 434.5 434.5
Total 773.1 772.5
All classes 837.5 834.0
Numbers in rows and columns may not sum to totals due to rounding.0.0 = no sample for the cell or a value of >0.0 but <0.05.a Based on current conditions.
Appendix C—Supplemental Tables
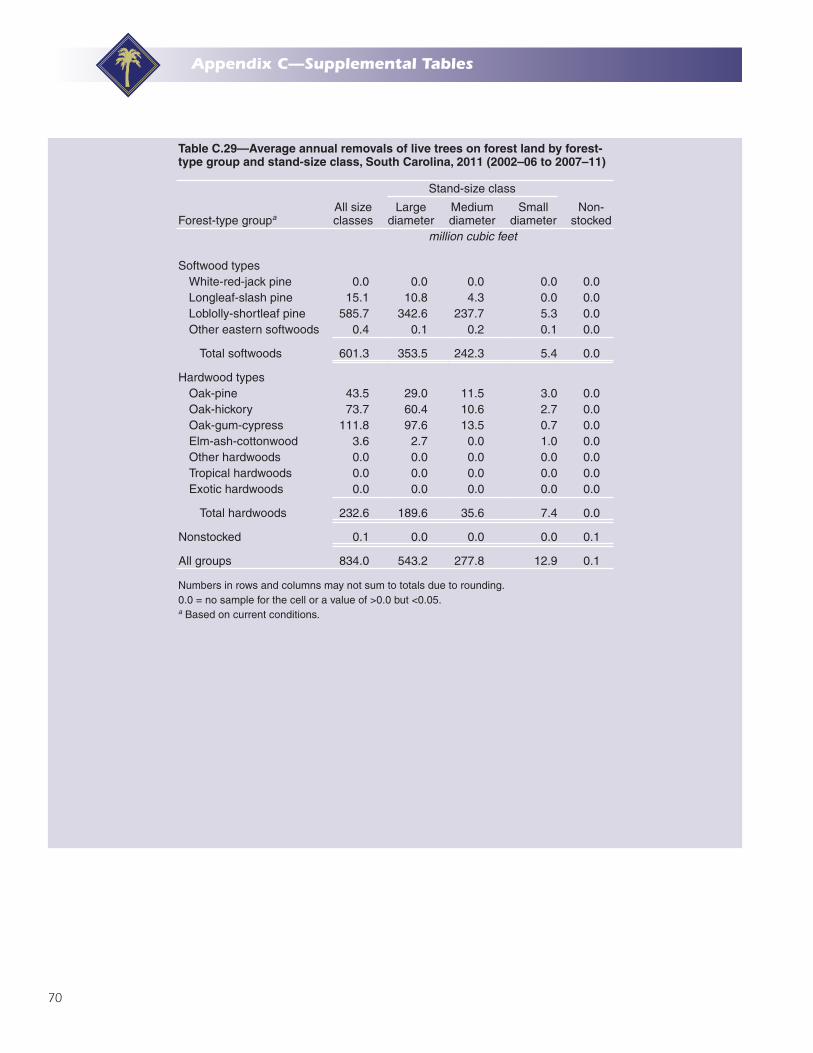
70
Table C.29—Average annual removals of live trees on forest land by forest-type group and stand-size class, South Carolina, 2011 (2002–06 to 2007–11)
Forest-type groupaAll size classes
Stand-size class
Non-stocked
Large diameter
Medium diameter
Small diameter
million cubic feet
Softwood typesWhite-red-jack pine 0.0 0.0 0.0 0.0 0.0Longleaf-slash pine 15.1 10.8 4.3 0.0 0.0Loblolly-shortleaf pine 585.7 342.6 237.7 5.3 0.0Other eastern softwoods 0.4 0.1 0.2 0.1 0.0
Total softwoods 601.3 353.5 242.3 5.4 0.0
Hardwood typesOak-pine 43.5 29.0 11.5 3.0 0.0Oak-hickory 73.7 60.4 10.6 2.7 0.0Oak-gum-cypress 111.8 97.6 13.5 0.7 0.0Elm-ash-cottonwood 3.6 2.7 0.0 1.0 0.0Other hardwoods 0.0 0.0 0.0 0.0 0.0Tropical hardwoods 0.0 0.0 0.0 0.0 0.0Exotic hardwoods 0.0 0.0 0.0 0.0 0.0
Total hardwoods 232.6 189.6 35.6 7.4 0.0
Nonstocked 0.1 0.0 0.0 0.0 0.1
All groups 834.0 543.2 277.8 12.9 0.1
Numbers in rows and columns may not sum to totals due to rounding.0.0 = no sample for the cell or a value of >0.0 but <0.05.a Based on current conditions.
Appendix C—Supplemental Tables
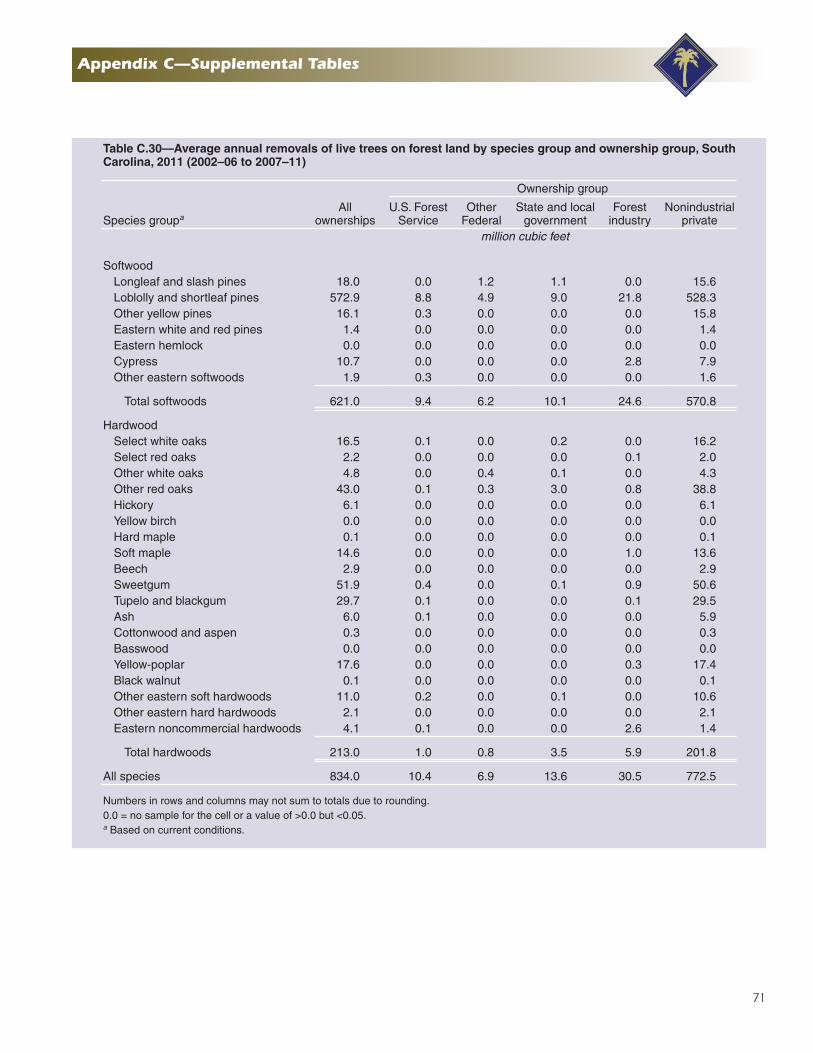
71
Table C.30—Average annual removals of live trees on forest land by species group and ownership group, South Carolina, 2011 (2002–06 to 2007–11)
Species groupaAll
ownerships
Ownership group
U.S. Forest Service
Other Federal
State and local government
Forest industry
Nonindustrial private
million cubic feet
SoftwoodLongleaf and slash pines 18.0 0.0 1.2 1.1 0.0 15.6Loblolly and shortleaf pines 572.9 8.8 4.9 9.0 21.8 528.3Other yellow pines 16.1 0.3 0.0 0.0 0.0 15.8Eastern white and red pines 1.4 0.0 0.0 0.0 0.0 1.4Eastern hemlock 0.0 0.0 0.0 0.0 0.0 0.0Cypress 10.7 0.0 0.0 0.0 2.8 7.9Other eastern softwoods 1.9 0.3 0.0 0.0 0.0 1.6
Total softwoods 621.0 9.4 6.2 10.1 24.6 570.8
HardwoodSelect white oaks 16.5 0.1 0.0 0.2 0.0 16.2Select red oaks 2.2 0.0 0.0 0.0 0.1 2.0Other white oaks 4.8 0.0 0.4 0.1 0.0 4.3Other red oaks 43.0 0.1 0.3 3.0 0.8 38.8Hickory 6.1 0.0 0.0 0.0 0.0 6.1Yellow birch 0.0 0.0 0.0 0.0 0.0 0.0Hard maple 0.1 0.0 0.0 0.0 0.0 0.1Soft maple 14.6 0.0 0.0 0.0 1.0 13.6Beech 2.9 0.0 0.0 0.0 0.0 2.9Sweetgum 51.9 0.4 0.0 0.1 0.9 50.6Tupelo and blackgum 29.7 0.1 0.0 0.0 0.1 29.5Ash 6.0 0.1 0.0 0.0 0.0 5.9Cottonwood and aspen 0.3 0.0 0.0 0.0 0.0 0.3Basswood 0.0 0.0 0.0 0.0 0.0 0.0Yellow-poplar 17.6 0.0 0.0 0.0 0.3 17.4Black walnut 0.1 0.0 0.0 0.0 0.0 0.1Other eastern soft hardwoods 11.0 0.2 0.0 0.1 0.0 10.6Other eastern hard hardwoods 2.1 0.0 0.0 0.0 0.0 2.1Eastern noncommercial hardwoods 4.1 0.1 0.0 0.0 2.6 1.4
Total hardwoods 213.0 1.0 0.8 3.5 5.9 201.8
All species 834.0 10.4 6.9 13.6 30.5 772.5
Numbers in rows and columns may not sum to totals due to rounding.0.0 = no sample for the cell or a value of >0.0 but <0.05.a Based on current conditions.
Appendix C—Supplemental Tables
In accordance with Federal civil rights law and U.S. Department of Agriculture (USDA) civil rights regulations and policies, the USDA, its Agencies, offices, and employees, and institutions participating in or administering USDA programs are prohibited from discriminating based on race, color, national origin, religion, sex, gender identity (including gender expression), sexual orientation, disability, age, marital status, family/parental status, income derived from a public
assistance program, political beliefs, or reprisal or retaliation for prior civil rights activity, in any program or activity conducted or funded by USDA (not all bases apply to all programs). Remedies and complaint filing deadlines vary by program or incident.
Persons with disabilities who require alternative means of communication for program information (e.g., Braille, large print, audiotape, American Sign Language, etc.) should contact the responsible Agency or USDA’s TARGET Center at (202) 720-2600 (voice and TTY) or contact USDA through the Federal Relay Service at (800) 877-8339.
To file a program discrimination complaint, complete the USDA Program Discrimination Complaint Form, AD-3027, found online at http://www.ascr.usda.gov/complaint_filing_cust.html and at any USDA office or write a letter addressed to USDA and provide in the letter all of the information requested in the form. To request a copy of the complaint form, call (866) 632-9992. Submit your completed form or letter to USDA by: (1) mail: U.S. Department of Agriculture, Office of the Assistant Secretary for Civil Rights, 1400 Independence Avenue, SW, Washington, D.C. 20250-9410; (2) fax: (202) 690-7442; or (3) email: [email protected].
USDA is an equal opportunity provider, employer, and lender.
January 2016
Southern Research Station200 W.T. Weaver Blvd.Asheville, NC 28804
DEP
A
R T MENT OF AGRICU LTURE
Rose, Anita K. 2016. South Carolina’s forests, 2011. Resour. Bull. SRS–208. Asheville, NC: U.S. Department of Agriculture Forest Service, Southern Research Station. 71 p.
Between 2007 and 2011, the U.S. Department of Agriculture Forest Service’s Forest Inventory and Analysis (FIA) program conducted the tenth inventory of the forests of South Carolina. The inventory estimated that 13.1 million acres, or 68 percent of the State, was forested. The majority of South Carolina’s forest land was in private ownership. Many private individuals rely on family-owned forests and value their biologic as well as their economic value. This survey revealed a growing forest with a volume of 24.1 billion cubic feet, the most ever reported. Forests in South Carolina are maturing; area of large-diameter stands in 2011 was the highest ever recorded by FIA. While loblolly pine continued to be the most dominant single species, hardwoods and softwoods contributed to the overall volume equally. Sweetgum was the leading hardwood species. Both growth and removals increased over the previous survey period. However, harvesting did not appear to be outpacing growth, indicating a thriving yet sustainable forest industry at the State level. Mortality declined statewide by 13.5 percent since the previous survey. Nonnative invasive plants were recorded on 58 percent of forested plots, with Japanese honeysuckle being the most often occurring species recorded. On a positive note, crews found almost no ozone-induced foliar injury. The Forest Service’s FIA is the only program that conducts forest assessments across all land in the United States. Increasing demands on the resource and anthropogenic-related impacts on forests have intensified the need to conduct ecosystem-based inventories such as these.
Keywords: FIA, forest health, forest inventory, forest survey, invasive species, ozone, South Carolina.

How do you rate this publication?Scan this code to submit your feedback or go to www.srs.fs.usda.gov/pubeval
You may request additional copies of this publication by email at [email protected] limit requests to two copies per individual.
The 500-foot boardwalk at Woods Bay State Natural Area in Sumter and Clarendon Counties, SC, offers visitors a look at the diversity of South Carolina’s bottomland forests.