Embed Size (px)
Citation preview
South East Business Snapshot Survey ReportWinter-Spring 2011
Ref: 3992Q
March 2011

2
1. Executive Summary
2. Background, Objectives & Methodology
3. Business Performance
4. Business Trends
5. Employment & Training
6. Business Investment
7. Costs & Finance
8. Suppliers & Customer Base
9. Business Profile
Contents
3
1. Executive Summary
4
Executive Summary (1)
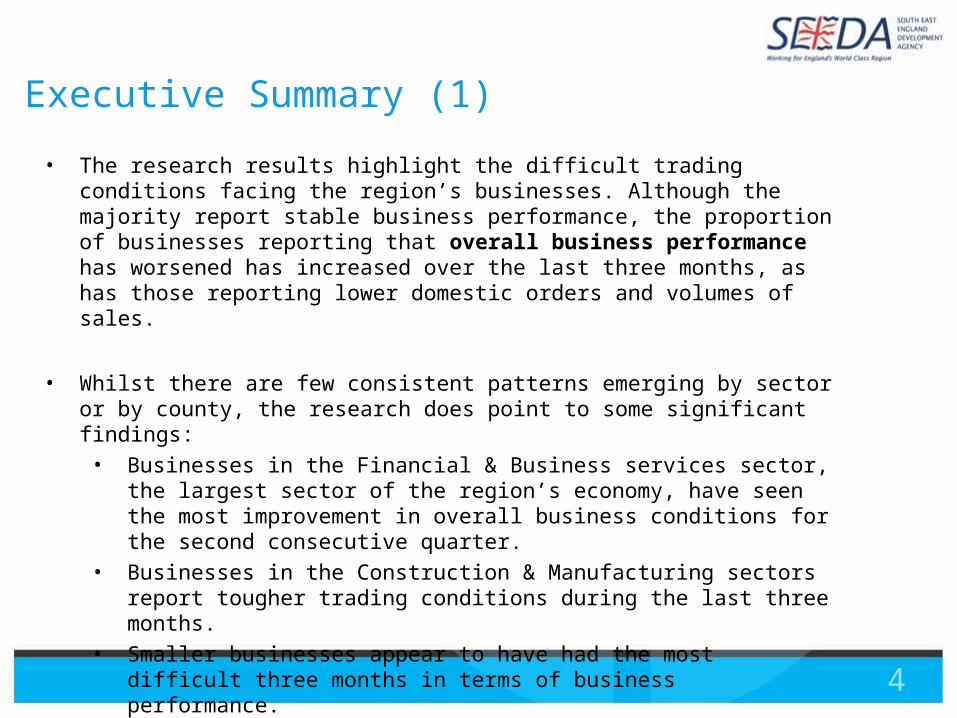
• The research results highlight the difficult trading conditions facing the region’s businesses. Although the majority report stable business performance, the proportion of businesses reporting that overall business performance has worsened has increased over the last three months, as has those reporting lower domestic orders and volumes of sales.
• Whilst there are few consistent patterns emerging by sector or by county, the research does point to some significant findings:
• Businesses in the Financial & Business services sector, the largest sector of the region’s economy, have seen the most improvement in overall business conditions for the second consecutive quarter.
• Businesses in the Construction & Manufacturing sectors report tougher trading conditions during the last three months.
• Smaller businesses appear to have had the most difficult three months in terms of business performance.
• Businesses in Berkshire and Oxfordshire were more likely to report improving conditions; those in Surrey are more likely to report worsening conditions.

5
Executive Summary (2)
• However, generally businesses in the area are slightly more optimistic about the business climate for the forthcoming three months, suggesting that perhaps (for some at least) the bottom of the market has been reached. In particular most sectors expect an upturn in domestic orders in the next 3 months.
• There is more optimism in the ‘Hotels & Restaurants’ sector (perhaps a seasonal effect) but, understandably perhaps, there is less optimism for those in the ‘Public Sector/ Other Services’ sector.
• One in ten businesses are heavily reliant on the public sector (accounts for 50% or more of their sales), and one in five expect to make changes as a result of the publics sector budget cuts.
• Two thirds of the region’s businesses’ purchases come from the South East and about three quarters of sales generated are also from the South East.
6
Executive Summary (3)
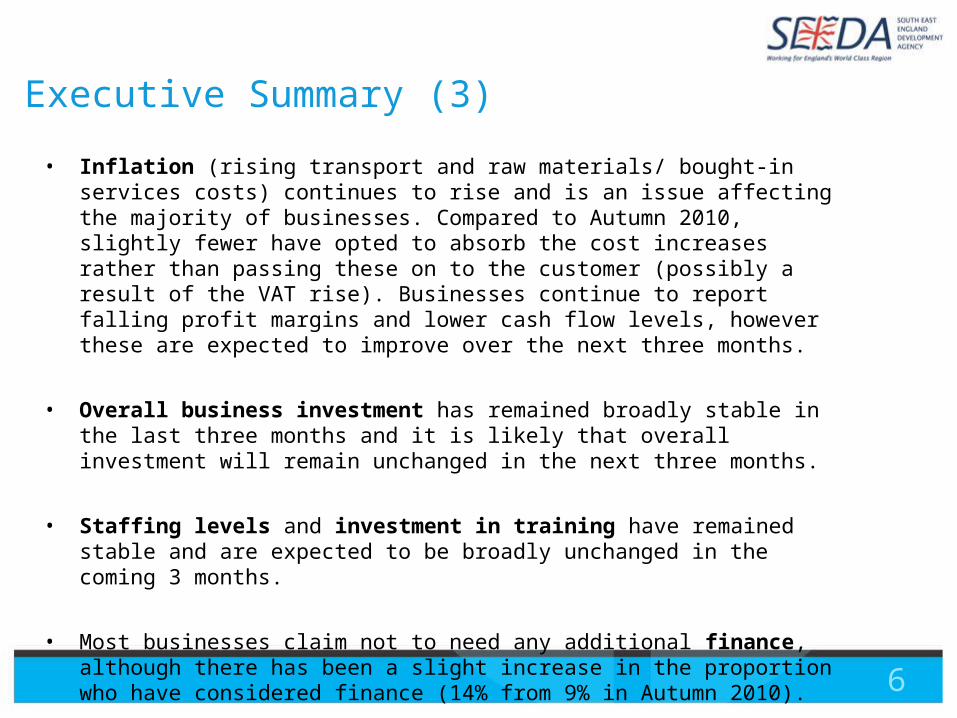
• Inflation (rising transport and raw materials/ bought-in services costs) continues to rise and is an issue affecting the majority of businesses. Compared to Autumn 2010, slightly fewer have opted to absorb the cost increases rather than passing these on to the customer (possibly a result of the VAT rise). Businesses continue to report falling profit margins and lower cash flow levels, however these are expected to improve over the next three months.
• Overall business investment has remained broadly stable in the last three months and it is likely that overall investment will remain unchanged in the next three months.
• Staffing levels and investment in training have remained stable and are expected to be broadly unchanged in the coming 3 months.
• Most businesses claim not to need any additional finance, although there has been a slight increase in the proportion who have considered finance (14% from 9% in Autumn 2010).
7
2. Background, Objectives, Methodology

8
Research Background, Method & Objectives
• This report presents the findings of the latest South East Business Snapshot Survey for Winter/ Spring 2011 conducted amongst businesses in the South East.
• The research measures business performance on a range of key economic indicators, as well as business confidence (previous/ next three months).
• Critical Research Ltd undertook the survey on behalf of SEEDA, the Regional Development Agency for the South East.
• The survey was conducted by telephone between 7th February and 23rd February 2011.
• In total 644 interviews were conducted. • All interviews were conducted with business respondents in a senior position. • In order to achieve a representative sample, quotas were set for county, industry
sector and employee sizeband.• The results were then weighted to IDBR population counts for the South East by
sector, county and employee sizeband.• Results are comparable to the Autumn 2010 and Winter/ Spring 2010 Business
Snapshot Surveys.• Where ‘Net Balance’ scores are shown, these are calculated by taking the proportion
of those who say ‘decreased’ away from the proportion who say ‘increased’.

9
Statistical Validity • When looking at comparisons by industry sector and county, we have focused
on results that are statistically significant (indicated by blue boxes). • If a result is statistically significant, it means that the 19 times out of 20 the
difference in the results would be ‘real’ and not due to chance or the research process. However if the base sizes of the results being compared are small, it increases the difference in the results required for them to be statistically significant.
• For example, comparing two results where the base size is 80, the following approximate differences are required for the result to be significant:
• A result of 50%, +/- 15% required to be significant • A result of 75%, +/- 12.5% required to be significant • A result of 90%, +/- 9% required to be significant
• A minimum of 80 interviews was conducted in each county. It is worth noting that with these relatively small sample sizes, some differences between counties are likely to be due to differences in business profile by sector and size.
• For the most recent two waves of the research, electricity, gas & water supply companies were included in the ‘Agriculture & Extraction’ sector instead of ‘Manufacturing’.

10
Sample ProfileThe table below shows the number of interviews achieved (unweighted).
Sizeband (No. Employees at Site) TOTAL
SIC 03 Sector
1 to 9 10 to 49 50+
Agriculture & Extraction A,B,C,E 41 33 5 79Manufacturing D 37 24 20 81Construction F 38 23 17 78Retail, Motor, Wholesale G 52 27 15 94Hotels & Restaurants H 25 29 23 77Transport, Storage & Communications
I41 25 13 79
Financial & Business Services
J,K41 22 19 82
Public Sector & Other Services
L,M,N,O28 23 23 74
TOTAL 303 206 135 644
11
3. Business Performance
12
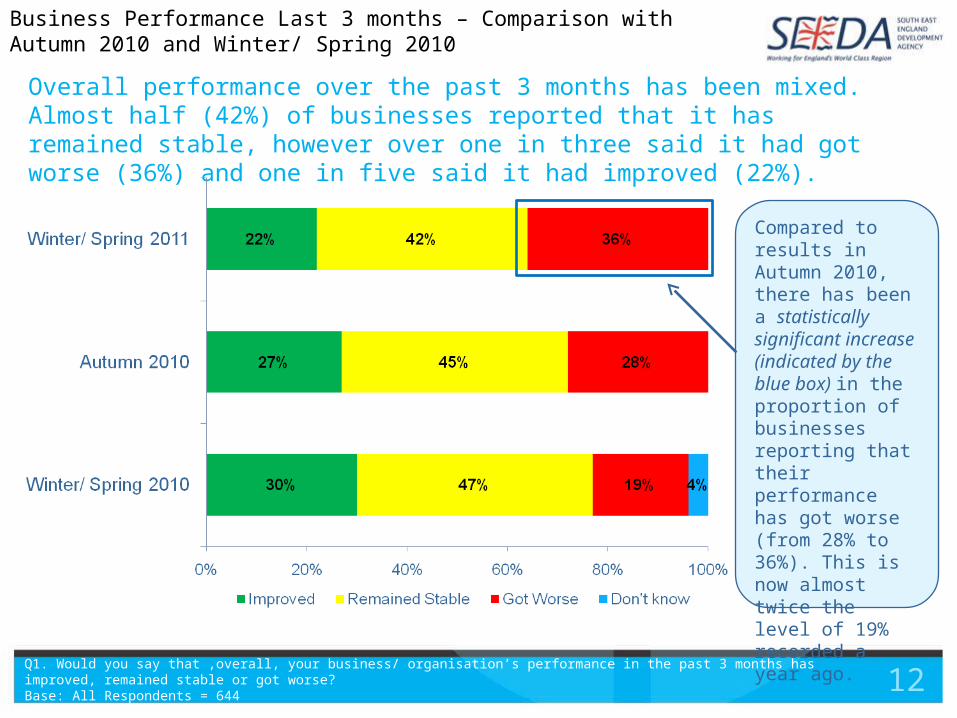
Overall performance over the past 3 months has been mixed. Almost half (42%) of businesses reported that it has remained stable, however over one in three said it had got worse (36%) and one in five said it had improved (22%).
Q1. Would you say that ,overall, your business/ organisation’s performance in the past 3 months has improved, remained stable or got worse?Base: All Respondents = 644
Compared to results in Autumn 2010, there has been a statistically significant increase (indicated by the blue box) in the proportion of businesses reporting that their performance has got worse (from 28% to 36%). This is now almost twice the level of 19% recorded a year ago.
Business Performance Last 3 months – Comparison with Autumn 2010 and Winter/ Spring 2010

13
Medium sized businesses (10-49 employees) have performed better than smaller businesses in the last 3 months - they are significantly more likely to report an improvement in performance than those with fewer employees.
Q1. Would you say that ,overall, your business/ organisation’s performance in the past 3 months has improved, remained stable or got worse?Base: All Respondents = 644
Net Balance
-14
-20
+16
+14
Business Performance Last 3 months – by Company Size
14
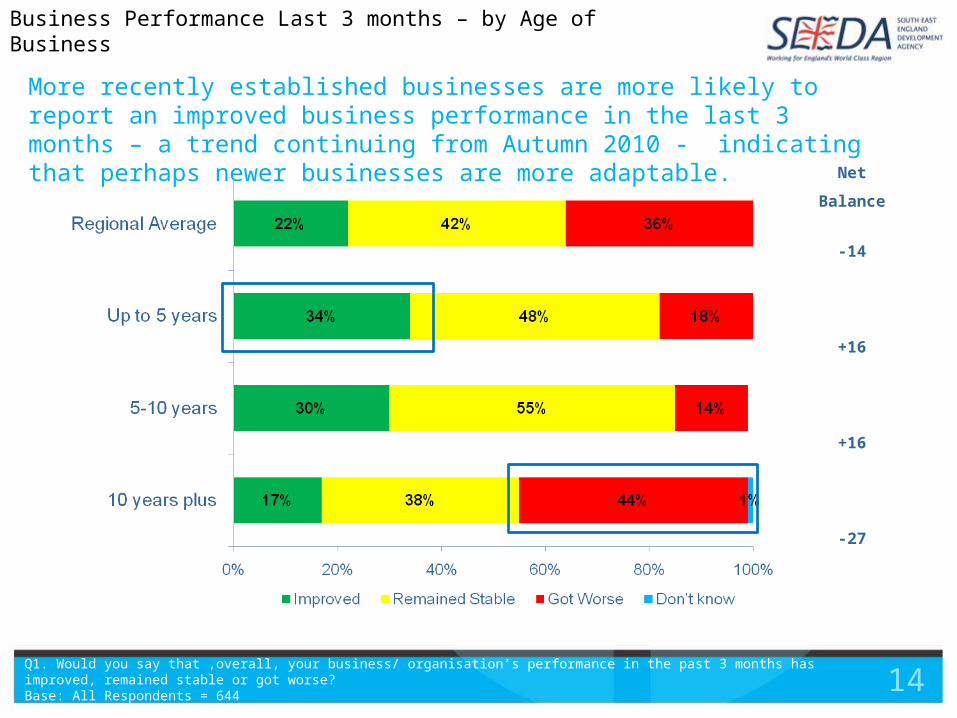
More recently established businesses are more likely to report an improved business performance in the last 3 months – a trend continuing from Autumn 2010 - indicating that perhaps newer businesses are more adaptable.
Q1. Would you say that ,overall, your business/ organisation’s performance in the past 3 months has improved, remained stable or got worse?Base: All Respondents = 644
Net Balance
-14
+16
+16
-27
Business Performance Last 3 months – by Age of Business
15
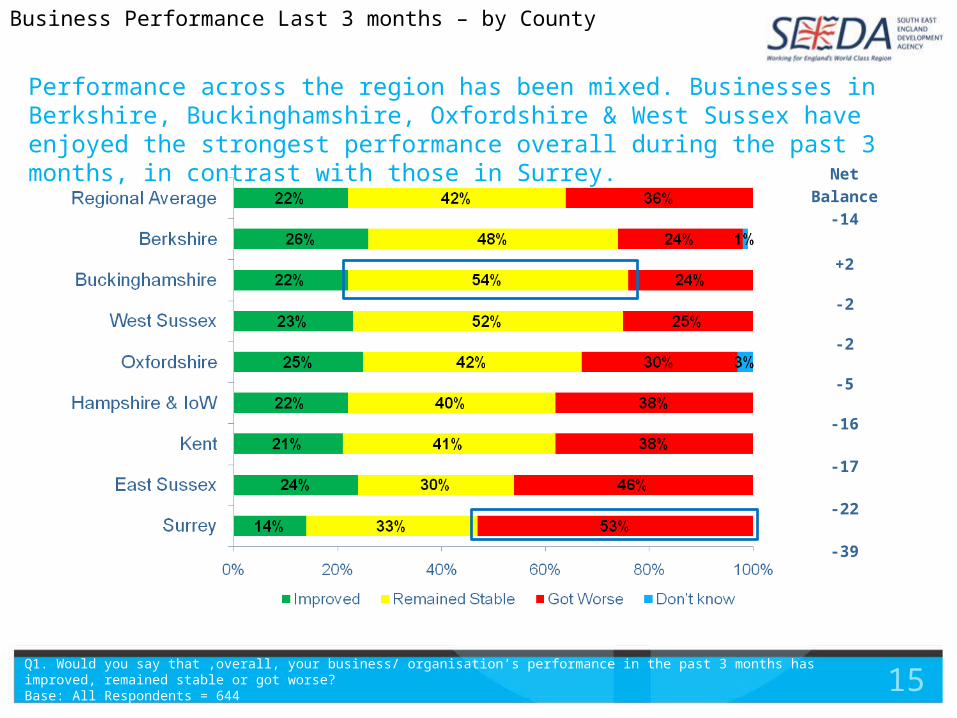
Performance across the region has been mixed. Businesses in Berkshire, Buckinghamshire, Oxfordshire & West Sussex have enjoyed the strongest performance overall during the past 3 months, in contrast with those in Surrey.
Q1. Would you say that ,overall, your business/ organisation’s performance in the past 3 months has improved, remained stable or got worse?Base: All Respondents = 644
Net Balance
-14
+2
-2
-2
-5
-16
-17
-22
-39
Business Performance Last 3 months – by County

16
Businesses in the largest sector, ‘Finance & Business Services’, have seen the most improvement, as was the case in Autumn 2010. In contrast, about half of businesses in both ‘Manufacturing’ and the ‘Construction’ sectors report that their business performance has got worse during the last 3 months.
Q1. Would you say that ,overall, your business/ organisation’s performance in the past 3 months has improved, remained stable or got worse?Base: All Respondents = 644
Net Balance
-14
-2
-6
-7
-11
-20
-28
-31
-31
Business Performance Last 3 months – by Sector

17
More sales and an increase in customers are the most commonly cited aspects of performance that have improved over the last 3 months. These feature more prominently as reasons for improvement than in the Autumn 2010 survey.
Q2A. Which aspects of your business/ organisation’s performance have particularly improved? (Spontaneous)Base: All who believe that performance has improved = 168
Business Performance Last 3 months – Reasons for Improvement
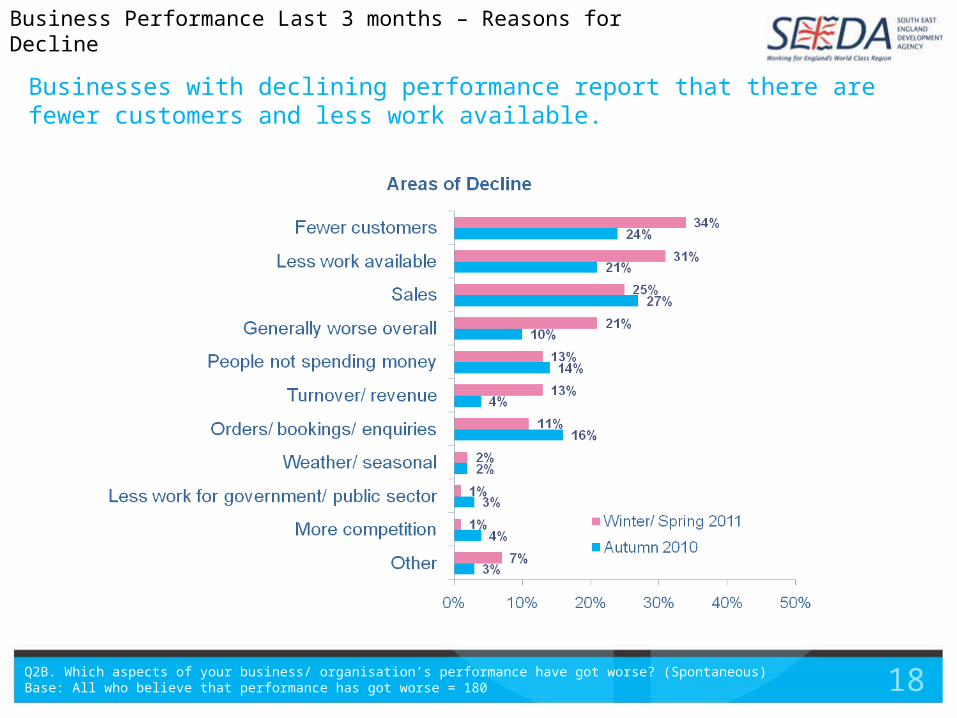
18
Businesses with declining performance report that there are fewer customers and less work available.
Q2B. Which aspects of your business/ organisation’s performance have got worse? (Spontaneous)Base: All who believe that performance has got worse = 180
Business Performance Last 3 months – Reasons for Decline
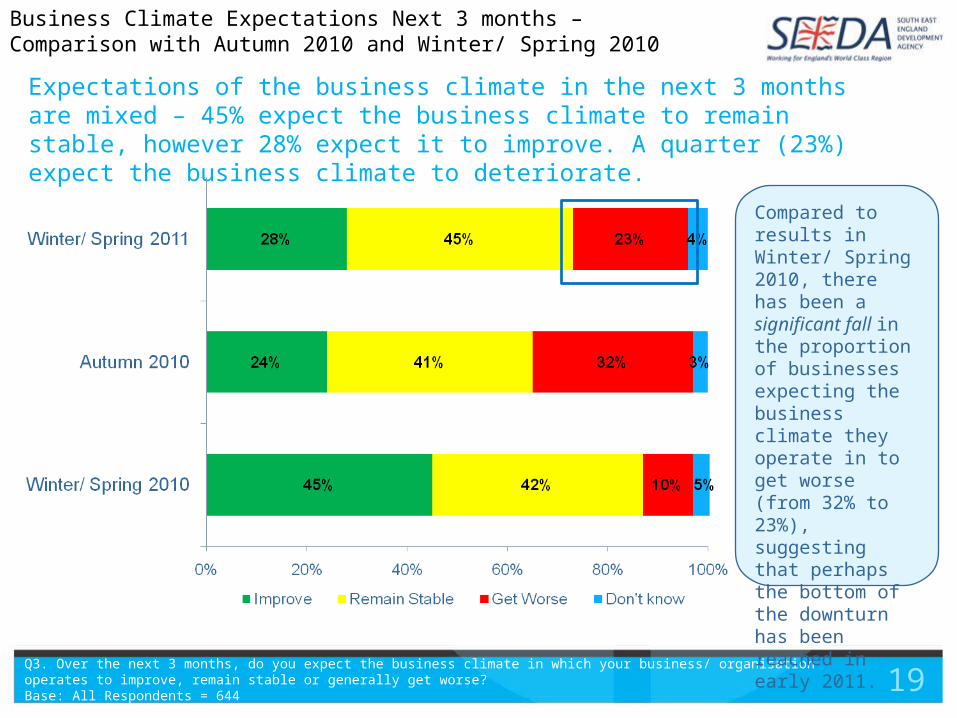
19
Expectations of the business climate in the next 3 months are mixed – 45% expect the business climate to remain stable, however 28% expect it to improve. A quarter (23%) expect the business climate to deteriorate.
Q3. Over the next 3 months, do you expect the business climate in which your business/ organisation operates to improve, remain stable or generally get worse?Base: All Respondents = 644
Compared to results in Winter/ Spring 2010, there has been a significant fall in the proportion of businesses expecting the business climate they operate in to get worse (from 32% to 23%), suggesting that perhaps the bottom of the downturn has been reached in early 2011.
Business Climate Expectations Next 3 months – Comparison with Autumn 2010 and Winter/ Spring 2010

20
Larger businesses (50+ employees) are more likely to believe there will be stability in the next 3 months. Smaller businesses (less than 50 employees) are slightly more optimistic, however this difference is not statistically significant.
Net Balance
+5
+5
+4
-2
Business Climate Expectations Next 3 Months – by Company Size
Q3. Over the next 3 months, do you expect the business climate in which your business/ organisation operates to improve, remain stable or generally get worse?Base: All Respondents = 644

21
Businesses in Kent are more optimistic than most – 41% expect the business climate to improve, significantly higher than the regional average of 28%. Hampshire & IoW and East Sussex are more likely to have experienced worsening performance, but are more likely to expect an improvement.
Net Balance
+5
+12
-11
-1
-6
+10
+20
+24
-16
Business Climate Expectations Next 3 Months – by County
Q3. Over the next 3 months, do you expect the business climate in which your business/ organisation operates to improve, remain stable or generally get worse?Base: All Respondents = 644
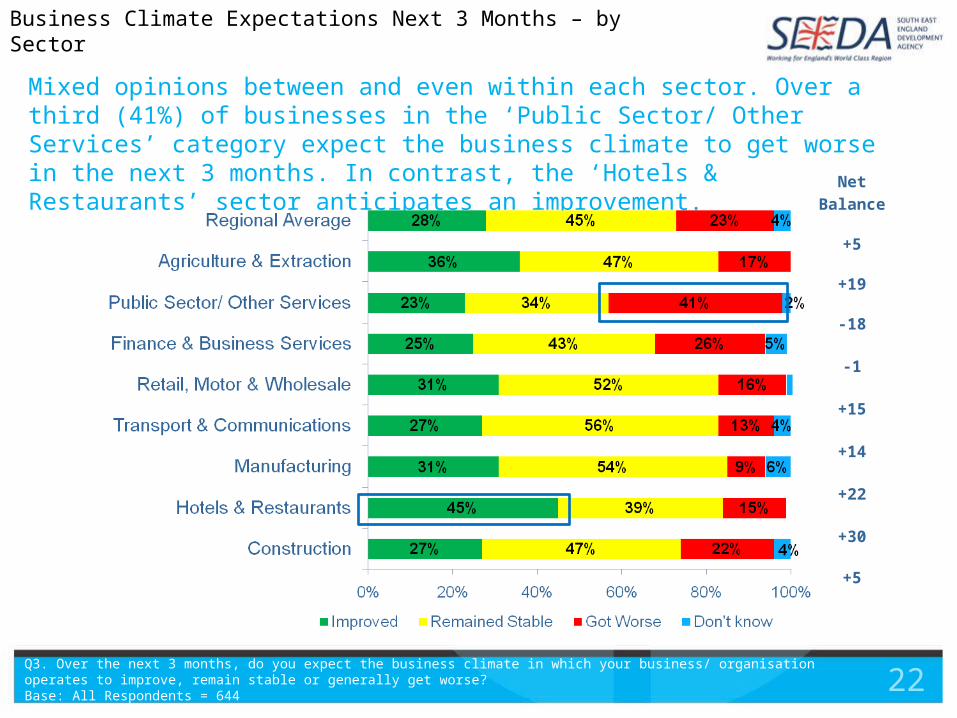
22
Mixed opinions between and even within each sector. Over a third (41%) of businesses in the ‘Public Sector/ Other Services’ category expect the business climate to get worse in the next 3 months. In contrast, the ‘Hotels & Restaurants’ sector anticipates an improvement. Net Balance
+5
+19
-18
-1
+15
+14
+22
+30
+5
Business Climate Expectations Next 3 Months – by Sector
Q3. Over the next 3 months, do you expect the business climate in which your business/ organisation operates to improve, remain stable or generally get worse?Base: All Respondents = 644
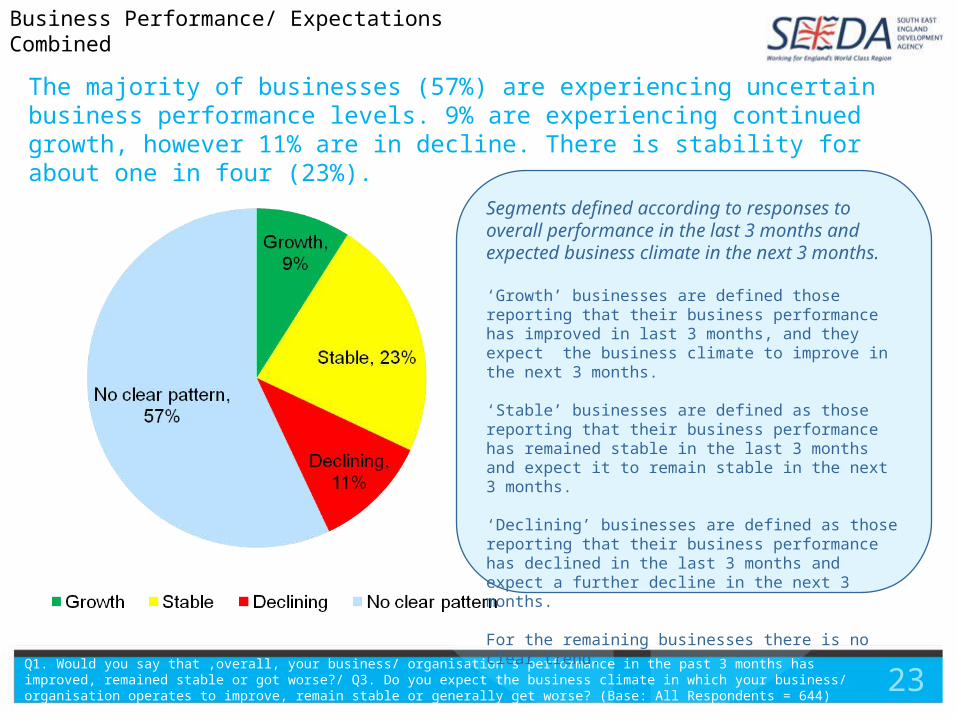
23
The majority of businesses (57%) are experiencing uncertain business performance levels. 9% are experiencing continued growth, however 11% are in decline. There is stability for about one in four (23%).
Q1. Would you say that ,overall, your business/ organisation’s performance in the past 3 months has improved, remained stable or got worse?/ Q3. Do you expect the business climate in which your business/ organisation operates to improve, remain stable or generally get worse? (Base: All Respondents = 644)
Business Performance/ Expectations Combined
Segments defined according to responses to overall performance in the last 3 months and expected business climate in the next 3 months.
‘Growth’ businesses are defined those reporting that their business performance has improved in last 3 months, and they expect the business climate to improve in the next 3 months.
‘Stable’ businesses are defined as those reporting that their business performance has remained stable in the last 3 months and expect it to remain stable in the next 3 months.
‘Declining’ businesses are defined as those reporting that their business performance has declined in the last 3 months and expect a further decline in the next 3 months.
For the remaining businesses there is no clear trend.
24
4. Business Trends

25
Whilst overall there is relative stability in terms of the numbers employed and staff costs, the trend towards falling profit margins and cash flow continues, despite a net increase in prices charged. Performance in the domestic market and the volume of output is more negative compared to Autumn 2010 results.
Net Balance
-21
-0
-5
-14
+4
+9
-30
-26
Business Trends Last 3 Months - Region
Q4A. Excluding seasonal variations, what has been the trend during the past 3 months for each of the following...? I'm going to read out a list, for each one please tell me whether the trend has been higher, the same, or lower.Base: All Respondents = 644
26
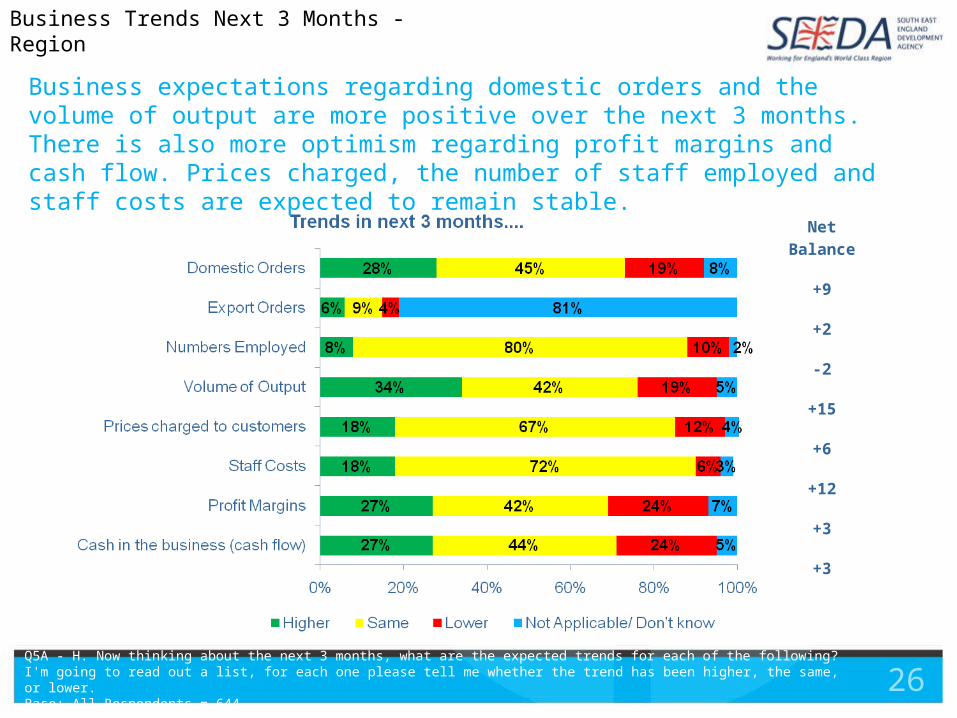
Business expectations regarding domestic orders and the volume of output are more positive over the next 3 months. There is also more optimism regarding profit margins and cash flow. Prices charged, the number of staff employed and staff costs are expected to remain stable.
Net Balance
+9
+2
-2
+15
+6
+12
+3
+3
Business Trends Next 3 Months - Region
Q5A - H. Now thinking about the next 3 months, what are the expected trends for each of the following? I'm going to read out a list, for each one please tell me whether the trend has been higher, the same, or lower.Base: All Respondents = 644

27
Generally businesses in all sectors are more likely to have reported falling sales than an increase in sales over the last 3 months. The ‘Hotels & Restaurants’ and ‘Construction’ sectors appear to be more stable.
Business Trends Last 3 Months – Domestic Orders by Sector
Q4A. Domestic Orders. What has been the trend during the past 3 months?Base: All Respondents = 644
Domestic orders have fallen more sharply in the Transport & Communications (43% report falling sales) and the Manufacturing and Retail sectors (42% of businesses in both sectors report falling sales).
28
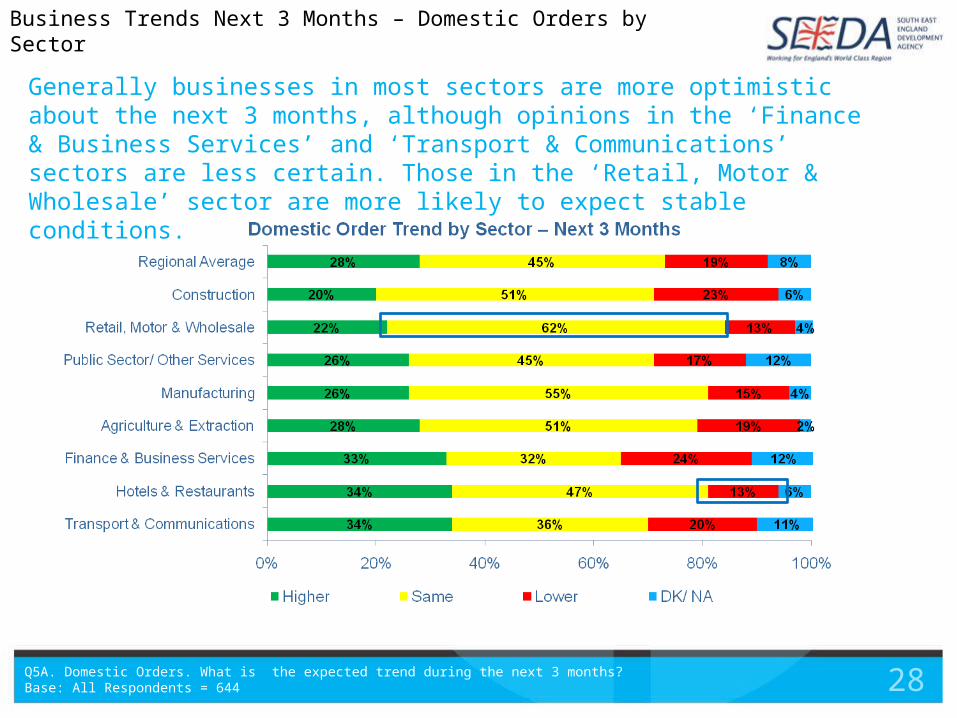
Generally businesses in most sectors are more optimistic about the next 3 months, although opinions in the ‘Finance & Business Services’ and ‘Transport & Communications’ sectors are less certain. Those in the ‘Retail, Motor & Wholesale’ sector are more likely to expect stable conditions.
Business Trends Next 3 Months – Domestic Orders by Sector
Q5A. Domestic Orders. What is the expected trend during the next 3 months?Base: All Respondents = 644
29
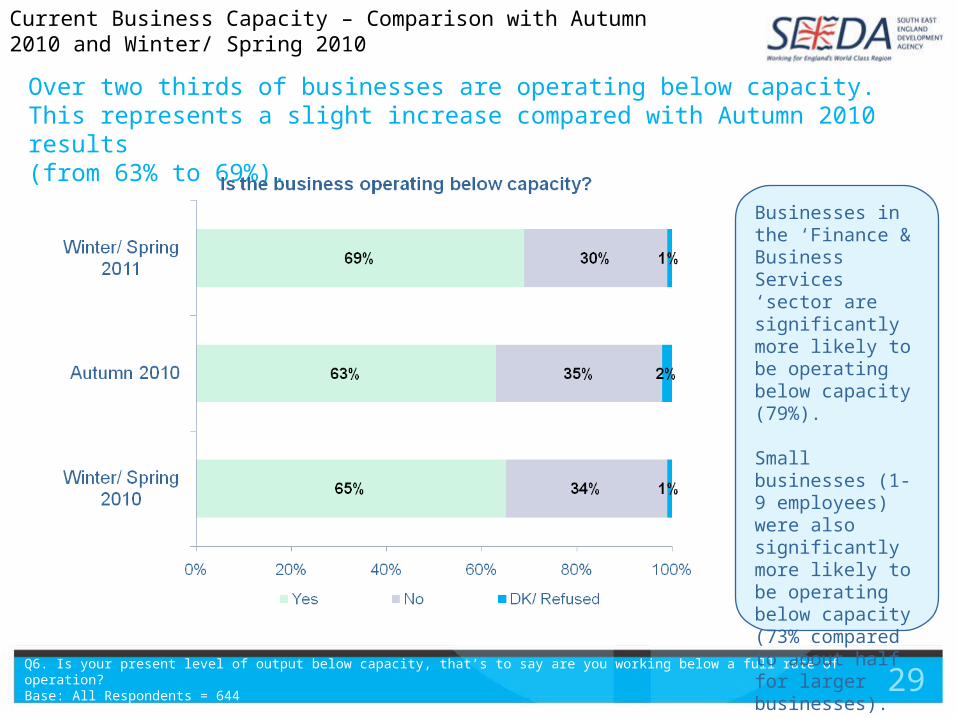
Over two thirds of businesses are operating below capacity.This represents a slight increase compared with Autumn 2010 results(from 63% to 69%).
Q6. Is your present level of output below capacity, that’s to say are you working below a full rate of operation?Base: All Respondents = 644
Businesses in the ‘Finance & Business Services ‘sector are significantly more likely to be operating below capacity (79%).
Small businesses (1-9 employees) were also significantly more likely to be operating below capacity (73% compared to about half for larger businesses).
Current Business Capacity – Comparison with Autumn 2010 and Winter/ Spring 2010
30
5. Employment & Training
31
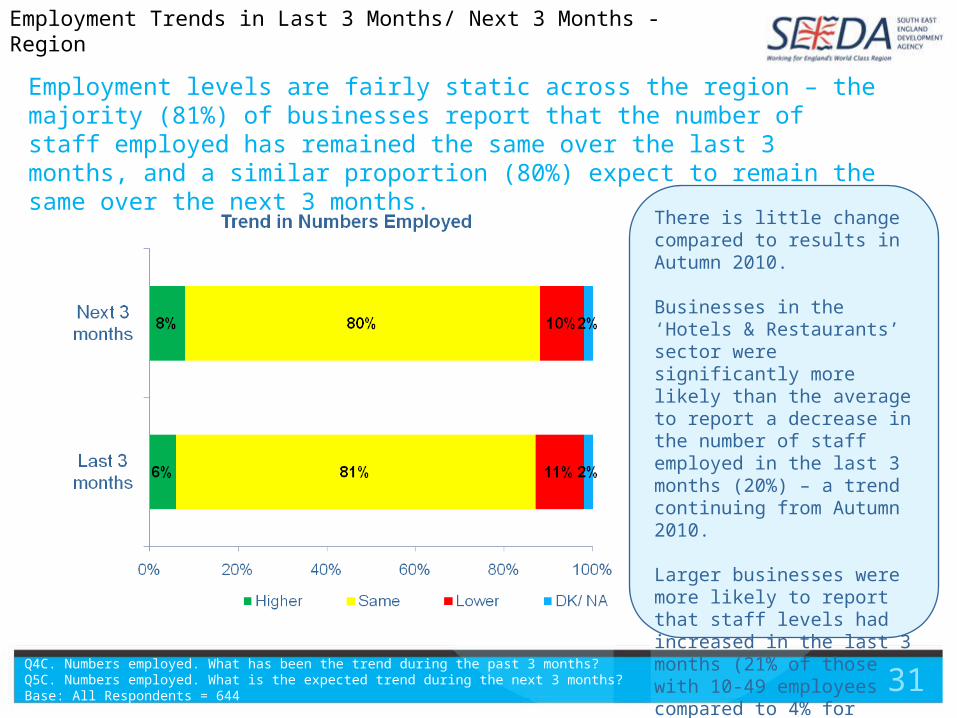
Employment levels are fairly static across the region – the majority (81%) of businesses report that the number of staff employed has remained the same over the last 3 months, and a similar proportion (80%) expect to remain the same over the next 3 months.
Q4C. Numbers employed. What has been the trend during the past 3 months?Q5C. Numbers employed. What is the expected trend during the next 3 months?Base: All Respondents = 644
There is little change compared to results in Autumn 2010.
Businesses in the ‘Hotels & Restaurants’ sector were significantly more likely than the average to report a decrease in the number of staff employed in the last 3 months (20%) – a trend continuing from Autumn 2010.
Larger businesses were more likely to report that staff levels had increased in the last 3 months (21% of those with 10-49 employees compared to 4% for those with 1-9 employees).
Employment Trends in Last 3 Months/ Next 3 Months - Region
32
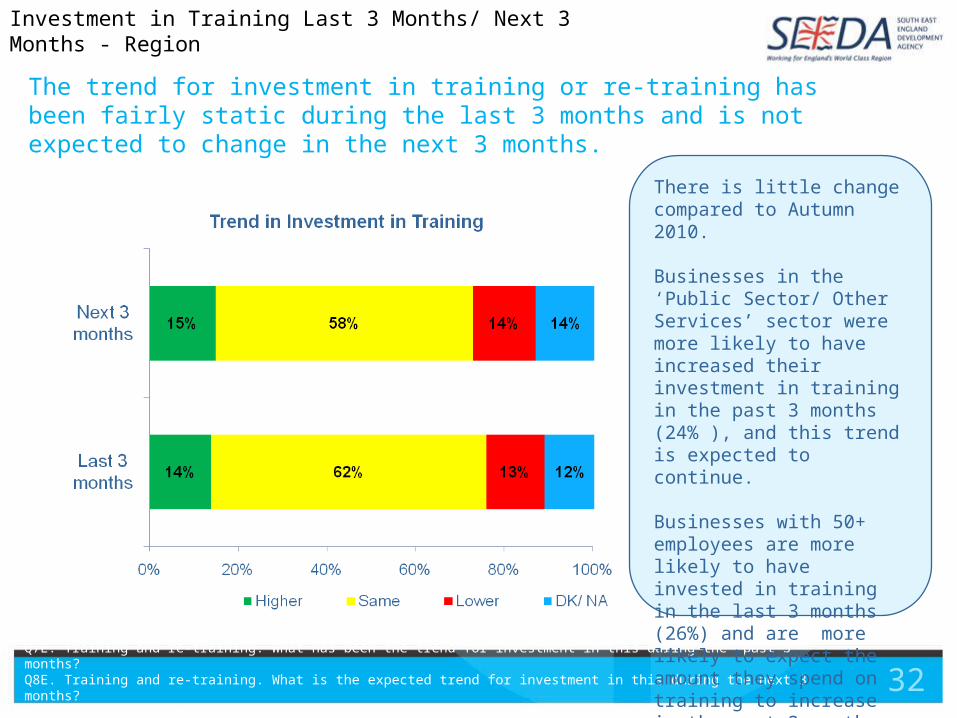
The trend for investment in training or re-training has been fairly static during the last 3 months and is not expected to change in the next 3 months.
Q7E. Training and re-training. What has been the trend for investment in this during the past 3 months?Q8E. Training and re-training. What is the expected trend for investment in this during the next 3 months?Base: All Respondents = 644
There is little change compared to Autumn 2010.
Businesses in the ‘Public Sector/ Other Services’ sector were more likely to have increased their investment in training in the past 3 months (24% ), and this trend is expected to continue.
Businesses with 50+ employees are more likely to have invested in training in the last 3 months (26%) and are more likely to expect the amount they spend on training to increase in the next 3 months (30%).
Investment in Training Last 3 Months/ Next 3 Months - Region

33
6. Business Investment

34
The picture for overall investment is mixed, although over half of businesses report that it has not changed during the last 3 months, about one in five report that it has increased, with a similar proportion reporting a fall.
Q7F. On balance, what has been the trend for overall investment in the business during the past 3 months? (Prompted)Base: All Respondents = 644
Business Investment Trends Last 3 months – Comparison with Autumn 2010 and Winter/ Spring 2010

35
Expected business investment levels in the next 3 months may increase slightly compared to the previous 3 months.
Q8F. On balance, what is the expected trend for overall investment in the business in the next 3 months? (Prompted)Base: All Respondents = 644
Business Investment Trends Next 3 Months – Comparison with Autumn 2010 and Winter/ Spring 2010
Expected investment levels still represent a fall from expected levels reported in the Winter/ Spring 2010 survey, however there is an improvement compared to Autumn 2010.
36
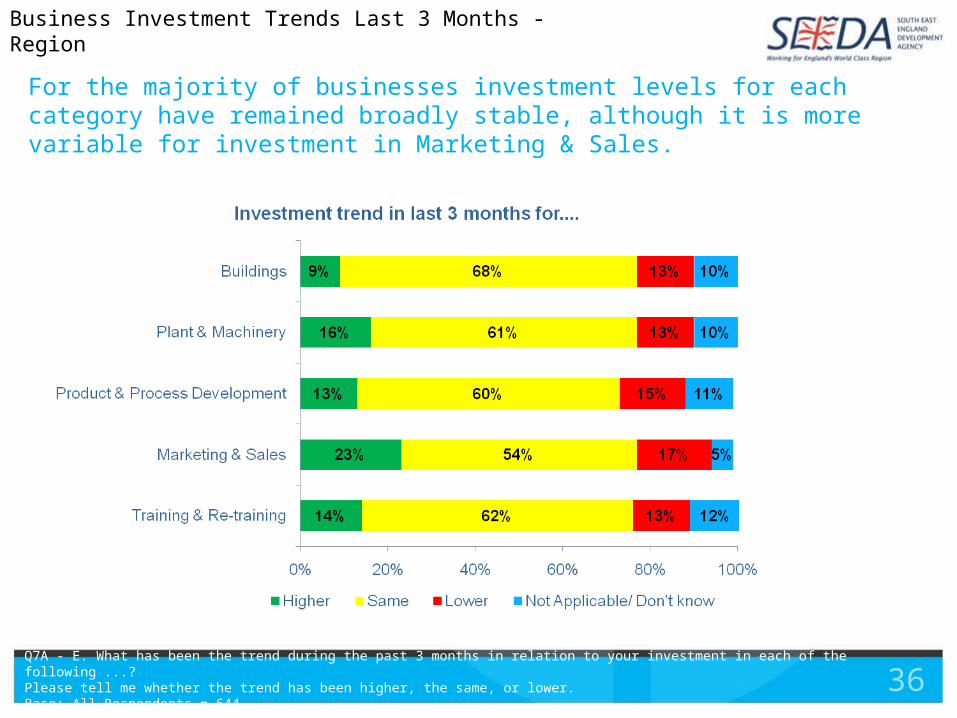
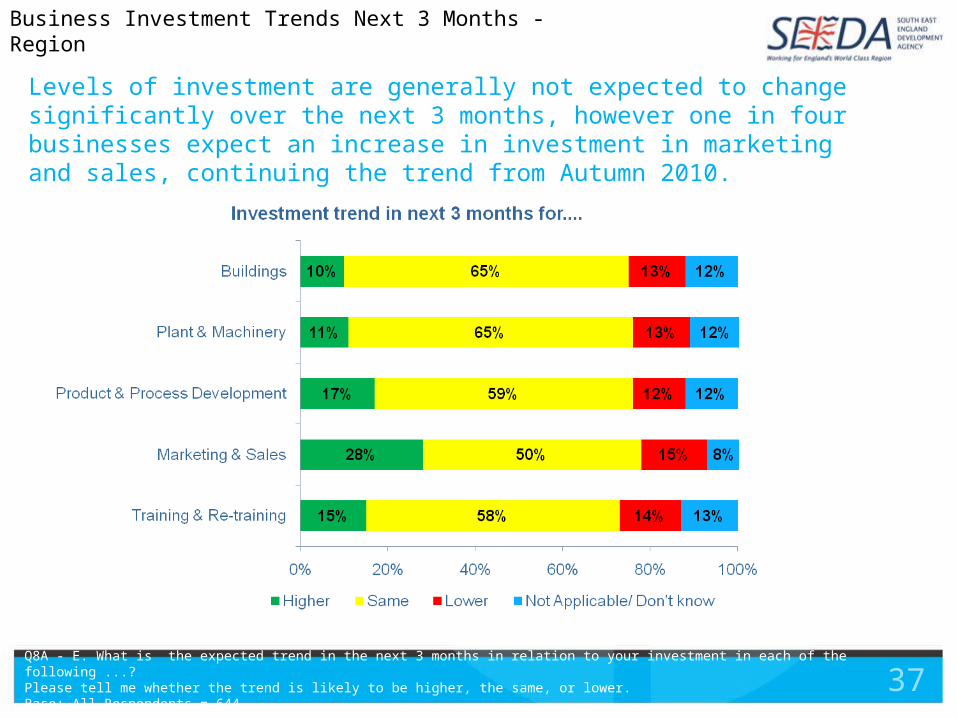
For the majority of businesses investment levels for each category have remained broadly stable, although it is more variable for investment in Marketing & Sales.
Q7A - E. What has been the trend during the past 3 months in relation to your investment in each of the following ...? Please tell me whether the trend has been higher, the same, or lower.Base: All Respondents = 644
Business Investment Trends Last 3 Months - Region
37
Levels of investment are generally not expected to change significantly over the next 3 months, however one in four businesses expect an increase in investment in marketing and sales, continuing the trend from Autumn 2010.
Q8A - E. What is the expected trend in the next 3 months in relation to your investment in each of the following ...? Please tell me whether the trend is likely to be higher, the same, or lower.Base: All Respondents = 644
Business Investment Trends Next 3 Months - Region
38
7. Costs & Finance
39
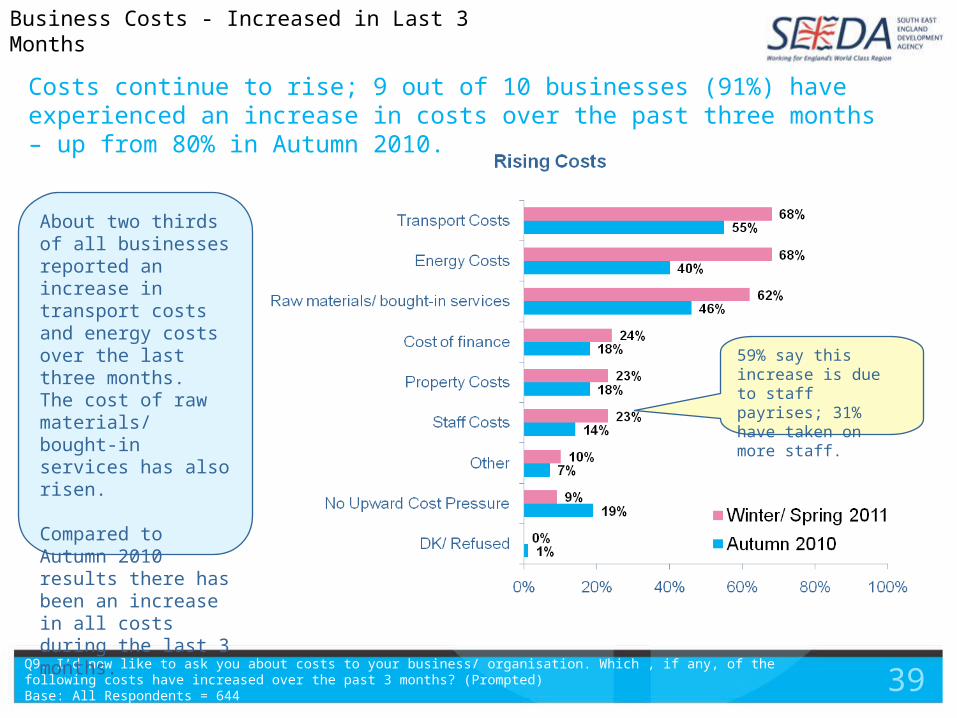
Costs continue to rise; 9 out of 10 businesses (91%) have experienced an increase in costs over the past three months – up from 80% in Autumn 2010.
Q9. I’d now like to ask you about costs to your business/ organisation. Which , if any, of the following costs have increased over the past 3 months? (Prompted)Base: All Respondents = 644
About two thirds of all businesses reported an increase in transport costs and energy costs over the last three months. The cost of raw materials/ bought-in services has also risen.
Compared to Autumn 2010 results there has been an increase in all costs during the last 3 months.
Business Costs - Increased in Last 3 Months
59% say this increase is due to staff payrises; 31% have taken on more staff.
40
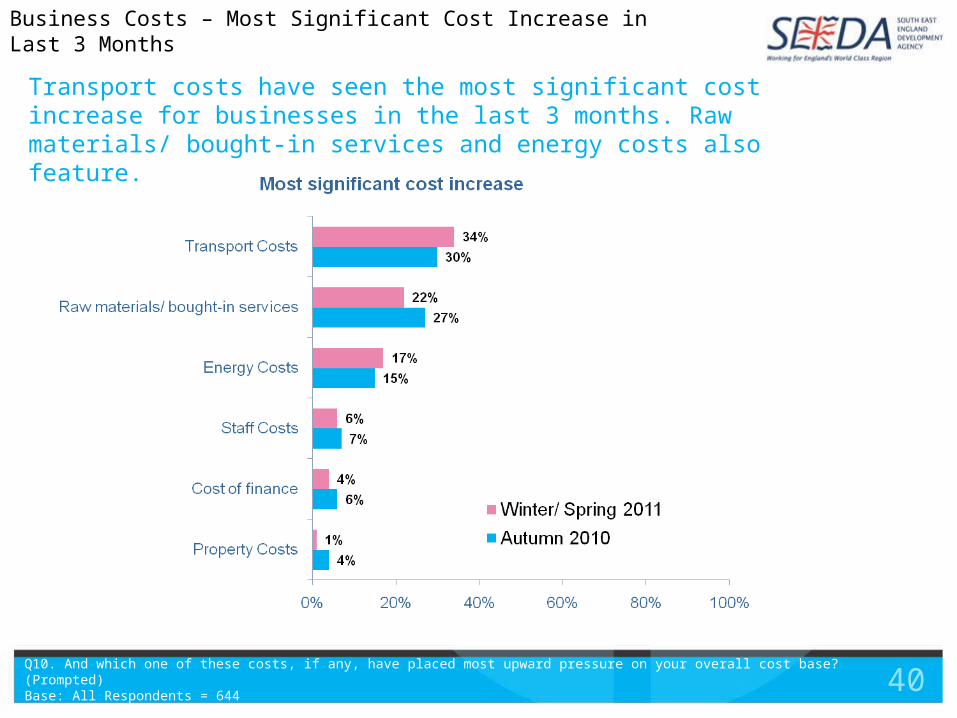
Transport costs have seen the most significant cost increase for businesses in the last 3 months. Raw materials/ bought-in services and energy costs also feature.
Q10. And which one of these costs, if any, have placed most upward pressure on your overall cost base? (Prompted)Base: All Respondents = 644
Business Costs – Most Significant Cost Increase in Last 3 Months
41
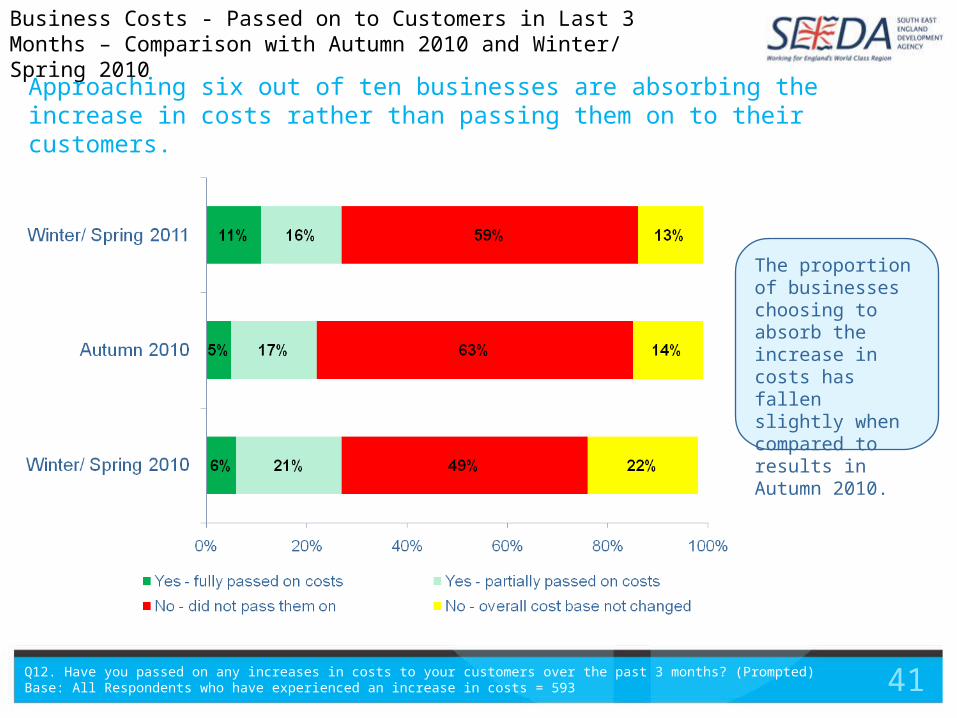
Approaching six out of ten businesses are absorbing the increase in costs rather than passing them on to their customers.
Q12. Have you passed on any increases in costs to your customers over the past 3 months? (Prompted)Base: All Respondents who have experienced an increase in costs = 593
The proportion of businesses choosing to absorb the increase in costs has fallen slightly when compared to results in Autumn 2010.
Business Costs - Passed on to Customers in Last 3 Months – Comparison with Autumn 2010 and Winter/ Spring 2010

42
Over the last 3 months 44% of businesses reported falling profit margins, and slightly fewer (37%) reported stable profit margins. However there is a significant upturn in expected profit margins for the next 3 months.
Q4G. Profit margins. What has been the trend during the past 3 months?Q5G. Profit margins. What is the expected trend during the next 3 months?Base: All Respondents = 644
Six out of ten businesses in the Construction sector (60%) reported falling profit margins during the last 3 months – significantly higher than average. About half (54%) expected profit margins to remain the same in the next 3 months.
Businesses in the ‘Finance & Business Services’ sector were more likely to report an upturn in profit margins during the previous 3 months (25% higher), and they are more likely to expect this trend to continue in the next 3 months (37% higher).
Profit Margins - Last 3 Months/ Next 3 Months - Region
43
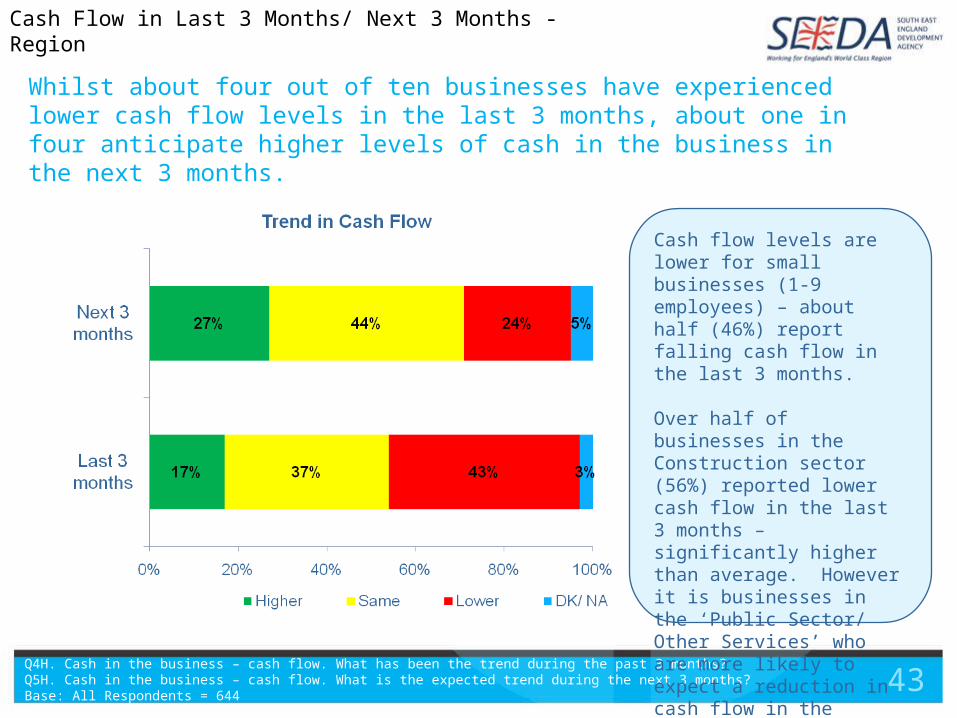
Whilst about four out of ten businesses have experienced lower cash flow levels in the last 3 months, about one in four anticipate higher levels of cash in the business in the next 3 months.
Q4H. Cash in the business – cash flow. What has been the trend during the past 3 months?Q5H. Cash in the business – cash flow. What is the expected trend during the next 3 months?Base: All Respondents = 644
Cash flow levels are lower for small businesses (1-9 employees) – about half (46%) report falling cash flow in the last 3 months.
Over half of businesses in the Construction sector (56%) reported lower cash flow in the last 3 months – significantly higher than average. However it is businesses in the ‘Public Sector/ Other Services’ who are more likely to expect a reduction in cash flow in the coming 3 months(38% lower).
Cash Flow in Last 3 Months/ Next 3 Months - Region
44
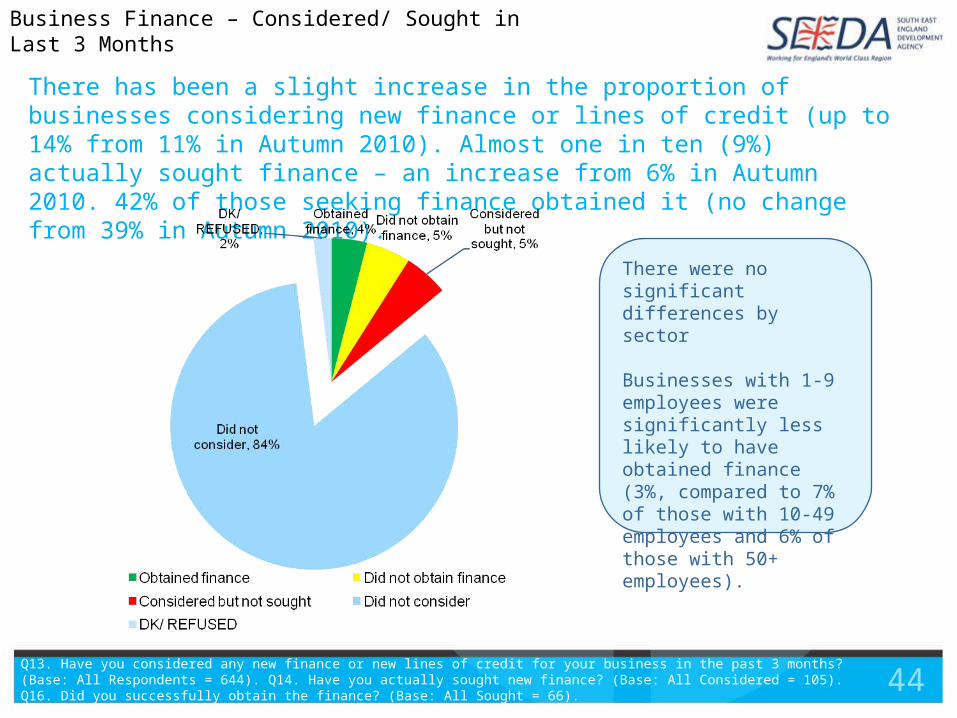
There has been a slight increase in the proportion of businesses considering new finance or lines of credit (up to 14% from 11% in Autumn 2010). Almost one in ten (9%) actually sought finance – an increase from 6% in Autumn 2010. 42% of those seeking finance obtained it (no change from 39% in Autumn 2010).
Q13. Have you considered any new finance or new lines of credit for your business in the past 3 months? (Base: All Respondents = 644). Q14. Have you actually sought new finance? (Base: All Considered = 105). Q16. Did you successfully obtain the finance? (Base: All Sought = 66).
Business Finance – Considered/ Sought in Last 3 Months
There were no significant differences by sector
Businesses with 1-9 employees were significantly less likely to have obtained finance (3%, compared to 7% of those with 10-49 employees and 6% of those with 50+ employees).
45
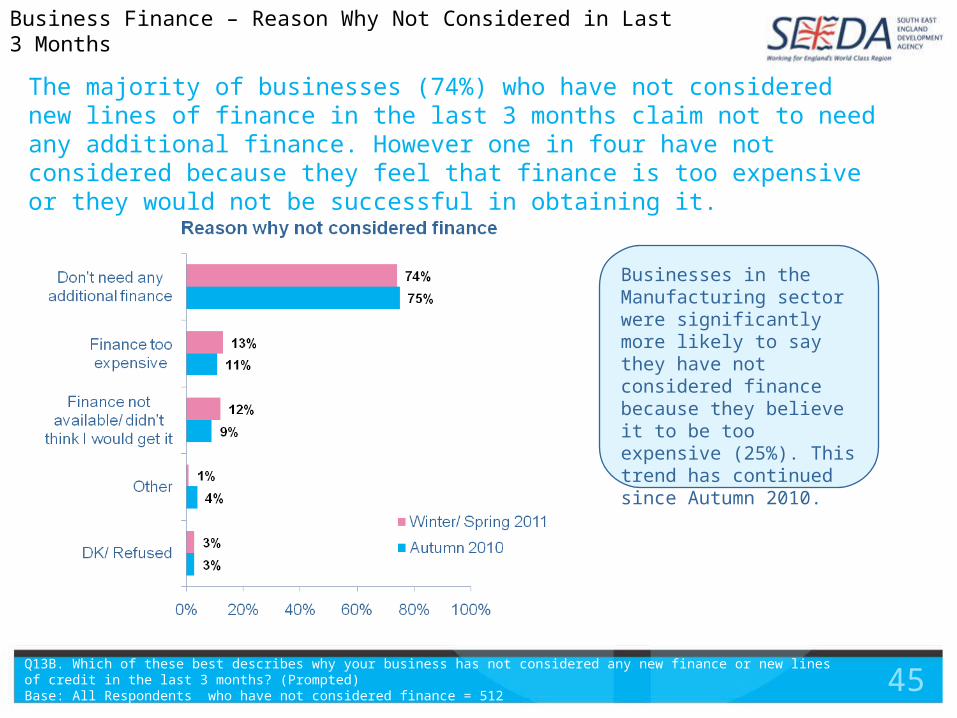
The majority of businesses (74%) who have not considered new lines of finance in the last 3 months claim not to need any additional finance. However one in four have not considered because they feel that finance is too expensive or they would not be successful in obtaining it.
Q13B. Which of these best describes why your business has not considered any new finance or new lines of credit in the last 3 months? (Prompted)Base: All Respondents who have not considered finance = 512
Business Finance – Reason Why Not Considered in Last 3 Months
Businesses in the Manufacturing sector were significantly more likely to say they have not considered finance because they believe it to be too expensive (25%). This trend has continued since Autumn 2010.
46
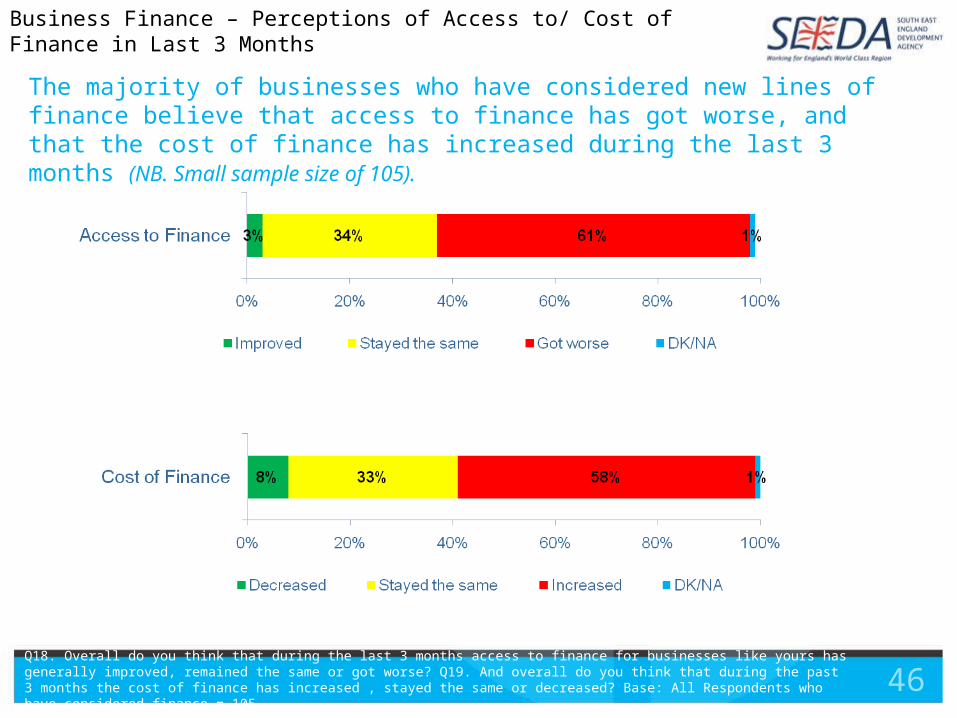
The majority of businesses who have considered new lines of finance believe that access to finance has got worse, and that the cost of finance has increased during the last 3 months (NB. Small sample size of 105).
Q18. Overall do you think that during the last 3 months access to finance for businesses like yours has generally improved, remained the same or got worse? Q19. And overall do you think that during the past 3 months the cost of finance has increased , stayed the same or decreased? Base: All Respondents who have considered finance = 105
Business Finance – Perceptions of Access to/ Cost of Finance in Last 3 Months
47
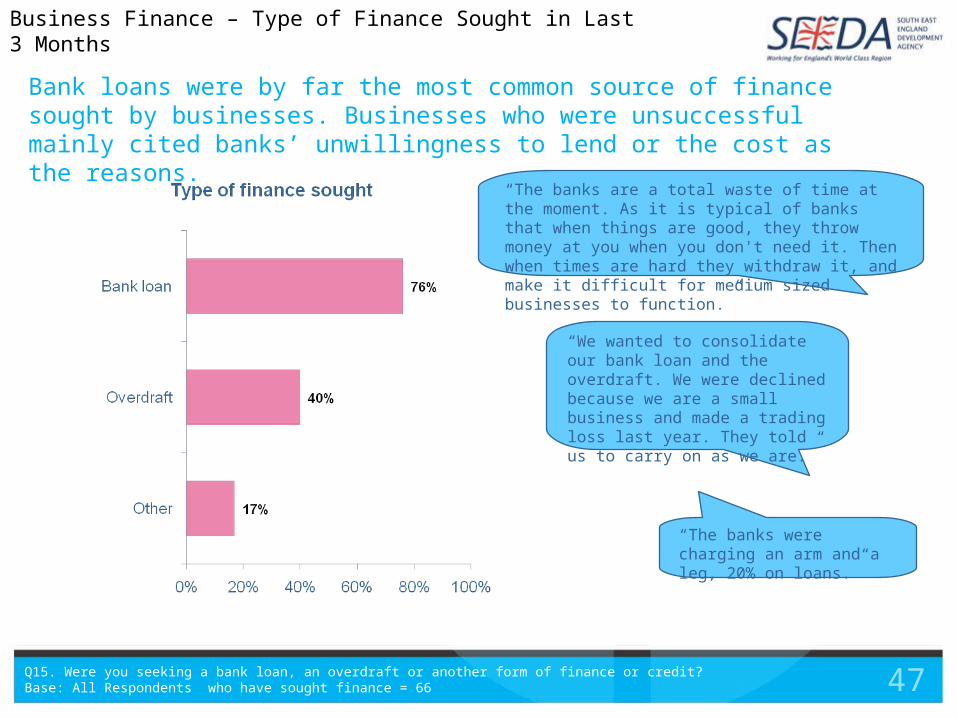
Bank loans were by far the most common source of finance sought by businesses. Businesses who were unsuccessful mainly cited banks’ unwillingness to lend or the cost as the reasons.
Q15. Were you seeking a bank loan, an overdraft or another form of finance or credit?Base: All Respondents who have sought finance = 66
Business Finance – Type of Finance Sought in Last 3 Months
“The banks are a total waste of time at the moment. As it is typical of banks that when things are good, they throw money at you when you don't need it. Then when times are hard they withdraw it, and make it difficult for medium sized businesses to function.”
“The banks were charging an arm and a leg, 20% on loans.”
“We wanted to consolidate our bank loan and the overdraft. We were declined because we are a small business and made a trading loss last year. They told us to carry on as we are.”

48
8. Suppliers & Customer Base
49
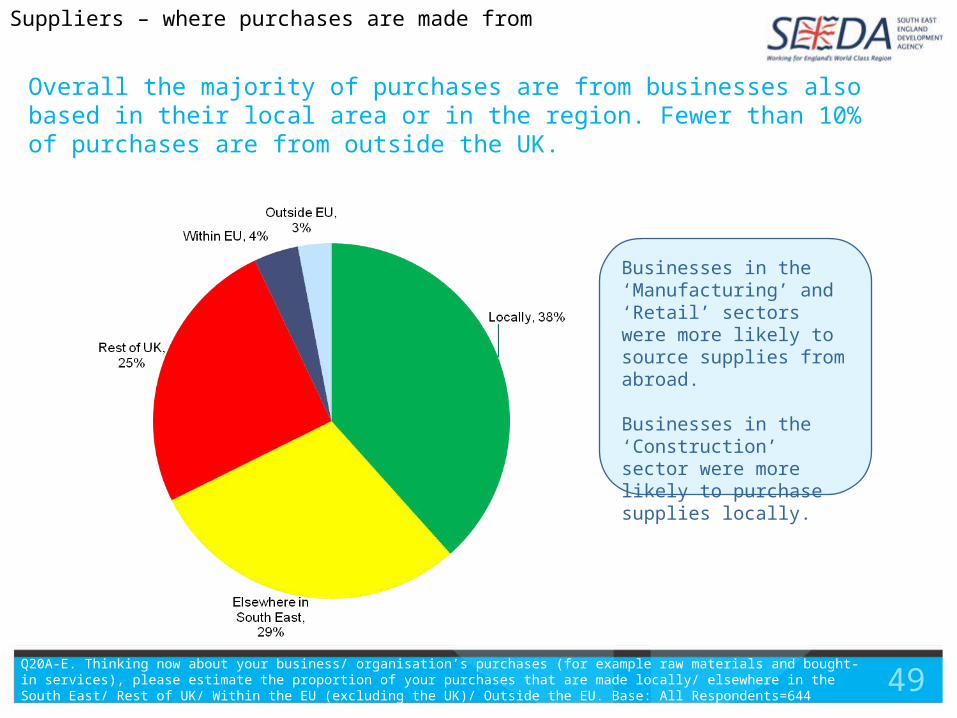
Overall the majority of purchases are from businesses also based in their local area or in the region. Fewer than 10% of purchases are from outside the UK.
Q20A-E. Thinking now about your business/ organisation’s purchases (for example raw materials and bought-in services), please estimate the proportion of your purchases that are made locally/ elsewhere in the South East/ Rest of UK/ Within the EU (excluding the UK)/ Outside the EU. Base: All Respondents=644
Suppliers – where purchases are made from
Businesses in the ‘Manufacturing’ and ‘Retail’ sectors were more likely to source supplies from abroad.
Businesses in the ‘Construction’ sector were more likely to purchase supplies locally.
50
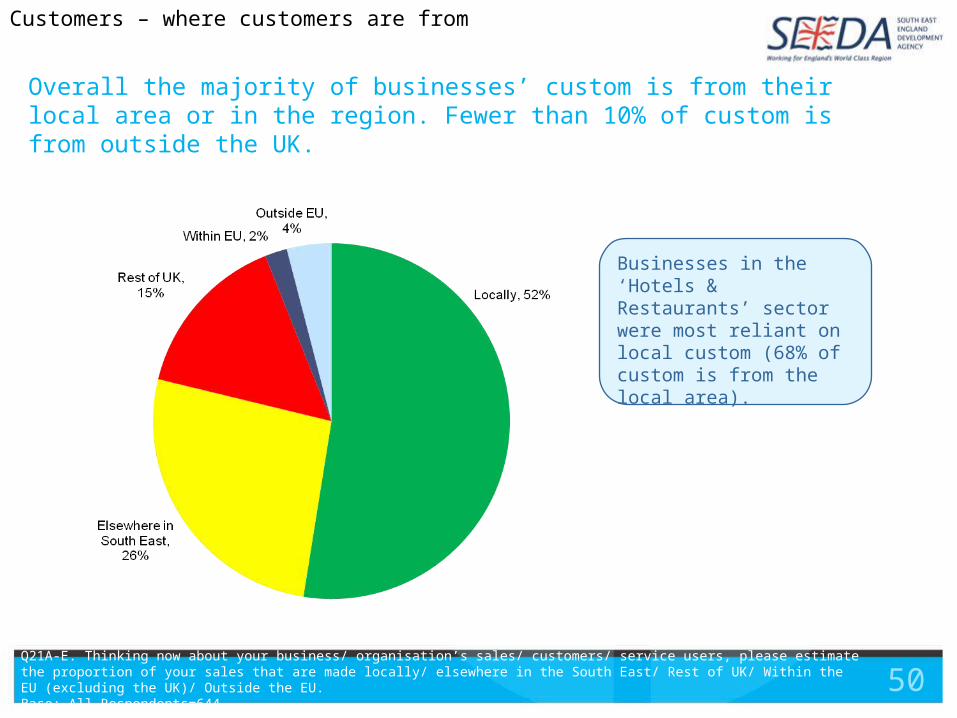
Overall the majority of businesses’ custom is from their local area or in the region. Fewer than 10% of custom is from outside the UK.
Q21A-E. Thinking now about your business/ organisation’s sales/ customers/ service users, please estimate the proportion of your sales that are made locally/ elsewhere in the South East/ Rest of UK/ Within the EU (excluding the UK)/ Outside the EU. Base: All Respondents=644
Customers – where customers are from
Businesses in the ‘Hotels & Restaurants’ sector were most reliant on local custom (68% of custom is from the local area).

51
About half of all businesses mainly sell to consumers. 7% are reliant on public sector organisations as their primary market.
Q22. Is your primary market for sales/ customers/ service users......PROMPTEDBase: All Respondents=644
Customers – primary market
Businesses whose primary market is consumers were significantly less likely to report that their business performance has improved in the last 3 months (17% improved compared with the average of 22%).
However these businesses are more optimistic about the coming 3 months (37% expect business performance to improve compared to 28% overall).
52
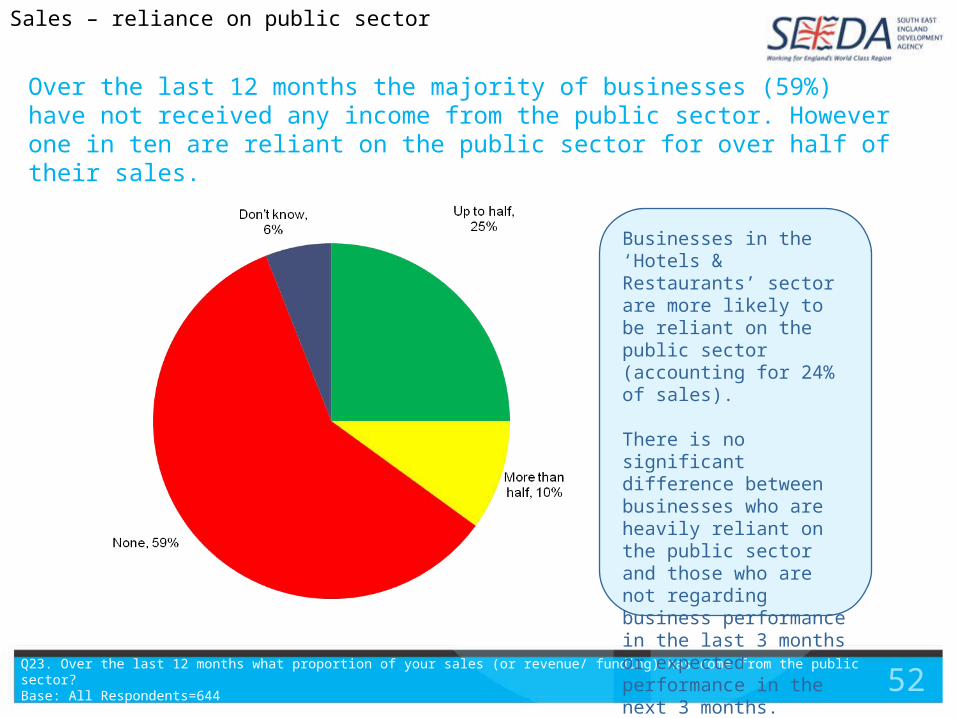
Over the last 12 months the majority of businesses (59%) have not received any income from the public sector. However one in ten are reliant on the public sector for over half of their sales.
Q23. Over the last 12 months what proportion of your sales (or revenue/ funding) has come from the public sector?Base: All Respondents=644
Sales – reliance on public sector
Businesses in the ‘Hotels & Restaurants’ sector are more likely to be reliant on the public sector (accounting for 24% of sales).
There is no significant difference between businesses who are heavily reliant on the public sector and those who are not regarding business performance in the last 3 months or expected performance in the next 3 months.
53
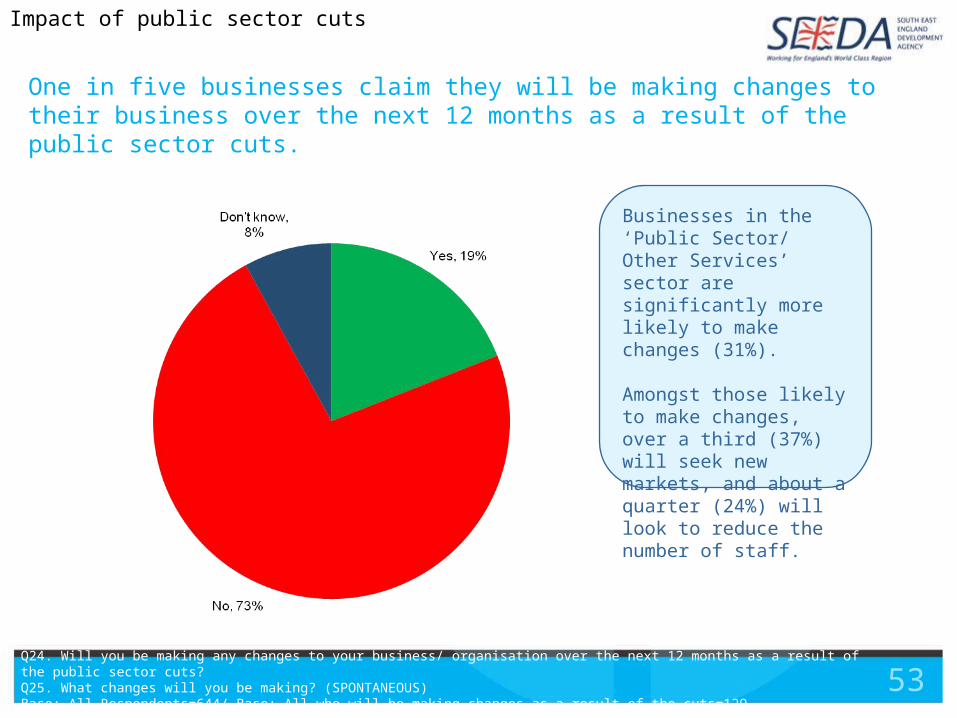
One in five businesses claim they will be making changes to their business over the next 12 months as a result of the public sector cuts.
Q24. Will you be making any changes to your business/ organisation over the next 12 months as a result of the public sector cuts?Q25. What changes will you be making? (SPONTANEOUS)Base: All Respondents=644/ Base: All who will be making changes as a result of the cuts=129
Impact of public sector cuts
Businesses in the ‘Public Sector/ Other Services’ sector are significantly more likely to make changes (31%).
Amongst those likely to make changes, over a third (37%) will seek new markets, and about a quarter (24%) will look to reduce the number of staff.

54
9. Business Profile
55
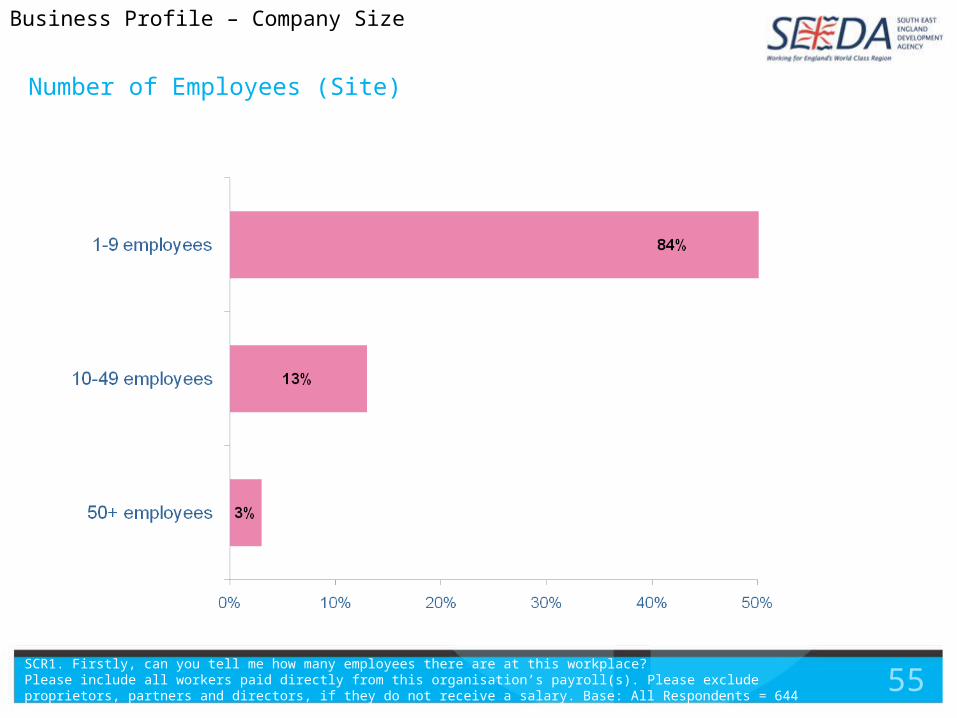
Number of Employees (Site)
SCR1. Firstly, can you tell me how many employees there are at this workplace? Please include all workers paid directly from this organisation’s payroll(s). Please exclude proprietors, partners and directors, if they do not receive a salary. Base: All Respondents = 644
Business Profile – Company Size
56
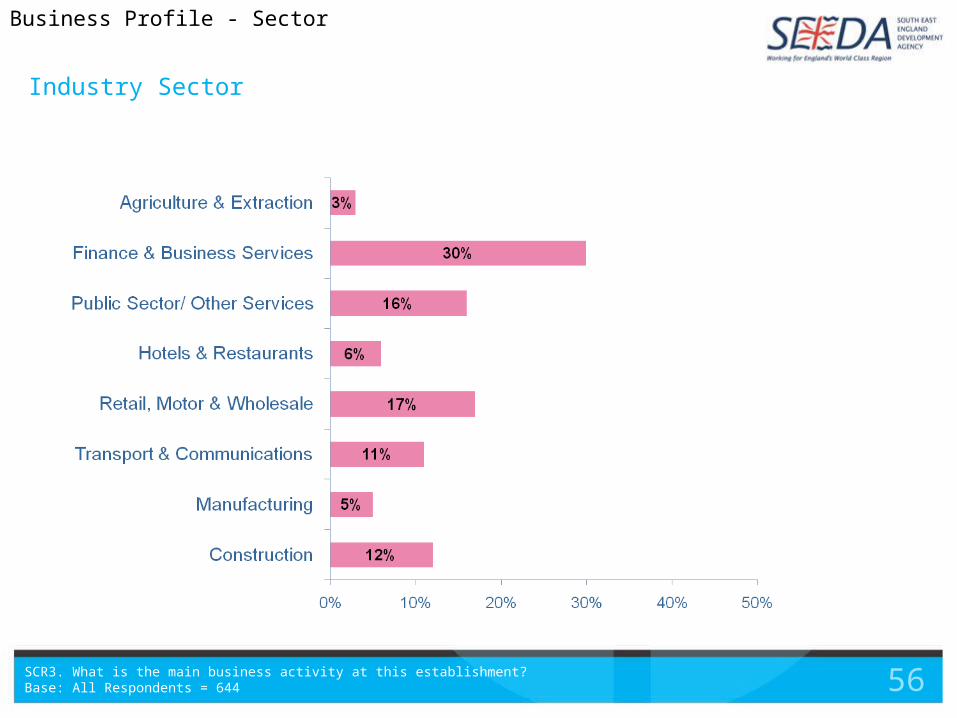
Industry Sector
SCR3. What is the main business activity at this establishment?Base: All Respondents = 644
Business Profile - Sector

57
Age of Business
Q26. Approximately how long has your business/ organisation been in operation for?Base: All Respondents = 644
Business Profile – Age of Business

58
Turnover of business/ organisation (Site)
Q27. What is your annual turnover at this site? Base: All Respondents = 644
Business Profile - Turnover
59
Contact
SEEDA Research & EconomicsSEEDA HeadquartersCross LanesGuildford GU1 1YA
email: [email protected]: 01482 500744
http://www.seeda.co.uk/what-we-do/economic-intelligence-and-research