Embed Size (px)
Citation preview

SOUTHVALLEYDATAATLAS
PreparedforLaReddelRioAbajoMa12,2016
NMEVALUATIONLABUniversityofNewMexico

SouthValleyDataAtlas
ii
INTRODUCTION
ThemainobjectiveofthisearlydevelopmentalevaluationforLaRedistoprovideasocialanddemographicsnapshotofAlbuquerque’sSouthValley.Thedatatellastoryofcommunitystrengthsandchallenges.WehopethatacompilationofthesestrengthsandchallengeswillhelpLaRedorganizationsdocumentthecontextinwhichtheywork.PerhapstheAtlaswillalsoincubateideasfornewwaystomobilizethecommunity.
ANOTEABOUTTHEDATA
MostoftheinformationwereportiscollectedbytheUnitedStatesCensusBureau.TheCensusBureaucollectsinformationfrommorethan3millionresidenceseveryyearthroughitsAmericanCommunitySurvey(ACS).TheACShasreplacedthe“longform”ofthedecennialCensus,providingthesamedata,butmorefrequently.
Sinceonlyasmallpercentageofhouseholdsaresurveyedinanygivenyear,thedataavailableforsmallgeographiesareforafive-yearperiod.Thislongertimeframeensuresthatinformationiscollectedfromenoughhouseholdssothatthecommunityisfaithfullyrepresented.WeusethemostrecentavailableACSdata,whichareforthe2010-2014period.
Byahappycoincidence,the87105zipcodedefinestheSouthValleyverywell,anddatabyzipcodecanbereadilyaccessedthroughtheCensusBureau’sAmericanFactFindertoolhttp://factfinder.census.gov.
AlthoughtheACSisagreatsourceofdata,thereareafewlimitationstoconsider.First,anyofficialsurveymostsurelyundercountsundocumentedimmigrants.AlthoughtheACSpromisesanonymity,anddoesnotaskquestionsaboutimmigrationstatus,thosewhoprefertostay“offtheradar”arelikelyreluctanttorespondtoadetailedsurvey.ThedatareportedbytheACSaccountfornon-respondingunitsbyincreasingthe“weight”ofrespondingunits.Thistechniquewillprovideagoodestimateofcommunitycharacteristicsonlyifnon-respondingunitsareverysimilartorespondingunits.
If,asislikely,non-respondingunitsaremateriallyandsociallydisadvantaged,thedatawilloverestimatecommunitywell-being.Itisthereforereasonabletointerpretthereporteddataasanupperboundofwell-being;realwell-beingisprobablysomewhatlower.
Inthe“SouthValleyNumbers”section,wealsoprovideanadjustedestimateofthesizeoftheimmigrantcommunity,basedonthemethodsusedbythePewResearchCenter,awell-respectedsourceofinformationontheHispanicpopulationintheUnitedStates.
Second,theACSdoesnotcollectdataonmanycharacteristicsthatmanypeoplewouldconsiderimportanttotheirwell-being.Therearenodirectmeasuresofhealth,jobopportunities,educationalquality,leisuretimeactivitiesorcommunityengagement.WeencourageLaRedtocompilealistofadditionalmeasuresofcommunitywell-being.Thisexercisecouldleadtodatacollectionfromothersources,ortothedevelopmentoforiginaldatacollectioninstruments.

NMEvaluationLab@UNM
iii
OurotherdatasourceistheNewMexicoIndicatorBasedInformationSystem(NM-IBIS)<https://ibis.health.state.nm.us>.NM-IBISisacollectionofhealthdataprovidedbytheNewMexicoDepartmentofHealth.Unfortunately,muchofthedetailedhealthinformationinNM-IBISisnotavailableatthesub-countylevel.Thispreventsusfromcapturingadultandyouthriskbehaviors,accesstoprenatalcare,maternaldepressionandotherpotentiallyusefulinformationforSouthValleyresidents.
ThedatawecanprovidefortheSouthValleyisreportedby“SmallAreas,”andincludesinformationdrawnfrombirthanddeathrecords.
Weusethemostrecentdataavailablefromthissource.AswiththeACSatthezipcodelevel,datareportedforSmallAreasaggregatesfiveyearperiodsinordertoimproveaccuracy.Adisadvantageofthisaggregationisthattheinformationreflectslessrecentconditions.

SouthValleyDataAtlas
iv
LISTOFFIGURES
PageA.PEOPLE
Race,HispanicOrigin,LanguageandImmigration Figurea1.HispanicorLatinoOrigin 1Figurea2.Otherraceidentities 1Figurea3.LanguageotherthanEnglishspokenathomeforthose5yearsofage
andolder 2Figurea4.ResidentswhospeakEnglishlessthan“verywell” 3Figurea5.Immigrationandcitizenship 3
Agedistribution Figurea6.Medianage 4Figurea7.Agedistribution 5Figurea8.Childdependencyratio(thenumberofchildren0-17yearsper100
working-ageadults18-64years) 6Educationandearnings
Figurea9.Enrollmentratesforpre-schoolersandolderteens 6Figurea10.Educationalattainmentforadults25yearsandolder 7Figurea11.Youngadults(18-24years)withahighschoolcredential,bygender 7Figurea12.Medianearningsbyeducationalattainment 8Figurea13.Povertyratesforadultswithoutahighschoolcredential 9
Workforce(employment,occupation,disability) Figurea14.Percentofcivilianpopulation16yearsandolderemployed,
unemployedandnotinlaborforce 10Figurea15.Householdsreceivingdisabilityincome 11Figurea16.Self-employedworkerswhosebusinessesarenotincorporated 11Figurea17.Occupationaldistribution 12Figurea18.Medianearningsforworkers25yearsandolder 12
Olderadults Figurea19.Adults65yearsandolderanddisabilities 13Figurea20.Poverty(darkersegment)andnearpoverty(lightersegment)for
adults65andolder 13Figurea21.Adults65yearsandolderwithFoodstamp/SNAPbenefits 14Figurea22.Homeownershipforadults65yearsandolder 14
B.HOUSEHOLDS,FAMILIESANDCHILDREN Figureb1.Householdsize 15Figureb2.Householdtype 16Figureb3.Medianhouseholdincome 17Figureb4.Povertyratesforfamilieswithchildrenundertheageof18 17Figureb5.Childrenbyhouseholdtype 18Figureb6.Childreninhouseholdsnotheadedbytheirparents 18Figureb7.Theroleofgrandparents 19Figureb8.Children,publicassistanceandpoverty 20
NMEvaluationLab@UNM
v
LISTOFFIGURES,continued
C.TRANSPORTATIONANDHOUSING
Transportation Figurec1.Householdswithnocaravailable 21Figurec2.Commutingtimes 21Figurec3.Gettingtowork 22
Housing Figurec4.Proportionofhousingbuiltineachdecadefrompre1940topresent 22Figurec5.Yearsinsamehome 23Figurec6.Homeownership 23Figurec7.Homevalues 24Figurec8.Medianhomevalues 24Figurec9.Owneroccupiedunitswithoutmortgages 25Figurec10.Medianmonthlyhousingcostsforhomeowners 25Figurec11.Housingcostscomprise30%ormoreofhomeowners’income 26Figurec12.Medianrent 26Figurec13.Housingcostscomprise30%ormoreofrenters’income 27
D.HEALTH
Figured1.Birthweightandteenbirths 28Figured2.Lifeexpectancyatbirth 29Figured3.DeathsbyCauseper100,000Population(Age-adjusted) 30Figured4.Deathsper100,000population,bycausesrelatedtobehavioral
health 30Figured5.Percentwithouthealthinsurance 31
APPENDIX
I.SouthValleyDataGeography 32II.CorrectionforUndercountofUndocumentedImmigrants 34


NMEvaluationLab@UNM
1
A.PEOPLE
Alldatainthissectionarefromthe2010-2014AmericanCommunitySurvey.
Race,HispanicorLatinoOrigin,LanguageandImmigration
Figurea1.HispanicorLatinoOrigin
80%ofSouthValleyresidentsareofHispanicorLatinoorigin...
Figurea2.Otherraceidentities
...andveryfewidentifyasblackorAfricanAmerican,especiallywhencomparedwiththerestoftheUnitedStatesandAlbuquerque.4.4%identifyasAmericanIndian,aboutthesameasinAlbuquerque,andmorethanfivetimestherepresentationintheUnitedStatesasawhole.TheSouthValleyishometorelativelyfewAsianpeople.
62.8%
16.9%
41.3%47.3%
13.9%
79.9%
White,non-Hispanic HispanicorLajno(anyrace)
UnitedStates Albuquerque SouthValley
12.6%
0.8%
5.0%3.3%
4.2%2.6%
1.7%
4.4%
0.4%
Black AmericanIndian Asian
UnitedStates Albuquerque SouthValley
STRENGTH:
A Hispanic and Latino community with a rich cultural heritage

SouthValleyDataAtlas
2
Intermsofnumbers,thereare57,878SouthValleyresidents.
46,245areHispanicorLatino,anyrace
8,045arewhite,non-Hispanic
2,547areAmericanIndian
984areBlack
232areAsian
(Totalismorethan57,878sincesomeAmericanIndians,BlacksandAsiansmayalsobeHispanic)
Figurea3.LanguageotherthanEnglishspokenathomeforthose5yearsofageandolder
MorethanhalfofSouthValleyresidentsspeakalanguageotherthanEnglish(presumablySpanish)athome.Thiscontrastswith30%ofAlbuquerqueresidentsand21%ofUnitedStatesresidents.OlderSouthValleyresidentsaremorelikelytospeakSpanishathomethantheiryoungerneighbors.ThispatternsuggestsapotentiallossoftheSpanishlanguageforresidentswhosefamilieshavebeeninNewMexicoforhundredsofyears.FortheUnitedStatesasawhole,youngerresidentsaremorelikelytospeakalanguageotherthanEnglishathome.
Intermsofnumbers,thereare29,818SpanishspeakersintheSouthValley,and5,265ofthemare65andolder.
20.9%14.5%
29.9% 30.8%
55.1%
68.1%
Populajon5yearsandolder Adults65yearsandolder
UnitedStates Albuquerque SouthValley
STRENGTH:
Bi-lingualism

NMEvaluationLab@UNM
3
Figurea4.ResidentswhospeakEnglishlessthan“verywell”
17%ofSouthValleyresidents(8,929people)and20%ofolderSouthValleyresidents(1,577people)arenotcompletelycomfortablespeakingEnglish.TheseratesaremuchhigherthantheratesforAlbuquerqueandtheUnitedStates,andsuggestaneedforbilingualeducationandforhealthandsocialservicesproviderswhospeakSpanish.
Figurea5.Immigrationandcitizenship
TheSouthValleyishometoagreatershareofimmigrantsthanisAlbuquerqueortheUnitedStatesasawhole.17%ofSouthValleyresidentsareimmigrants,comparedwith11%inAlbuquerqueand13%intheUnitedStates.12%ofSouthValleyresidentsarenotcitizens,comparedwith7%inAlbuquerqueandtheUnitedStates.Thesepercentagesriseonlyslightlywhenweaccountfortheestimatedundercountofundocumentedimmigrants.
8.6% 8.5%7.9%8.8%
16.5%
20.4%
Populajon5yearsandolder Adults65yearsandolder
UnitedStates Albuquerque SouthValley
13.1%
7.1%
10.7%
6.8%
16.6%
12.0%
Immigrant Notacijzen
UnitedStates Albuquerque SouthValley
CHALLENGE:
Bi-lingualism
CHALLENGE:
Legal status and access to services
STRENGTH:
Diversity

SouthValleyDataAtlas
4
Intermsofnumbers,theSouthValleyishometo9,965immigrantsofwhom7,292arenotcitizens.ThesenumbersreflectacorrectionusedbythePewResearchCenter.Pewestimatesthat15%ofundocumentedimmigrantsaremissedbytheCensus.Sinceabout28%ofimmigrantsareundocumented,theundercountforimmigrantsisabout4%(=28%X15%).Seetheappendixfordetails.
Age
Figurea6.Medianage
ThemedianageintheSouthValleyisaboutoneyearhigherthaninAlbuquerque,andalittlelessthanayearlowerthanintheUnitedStatesasawhole.
37.435.6 36.7
UnitedStates Albuquerque SouthValley

NMEvaluationLab@UNM
5
Figurea7.Agedistribution
Schoolagechildrenandteensareover-representedintheSouthValley,relativetoAlbuquerqueandtheUnitedStates,andyoungadults(inthe20-34agebracket)areunder-represented.Thedistributionofadults50yearsofageandolderisaboutthesameintheSouthValleyandtheUnitedStates,andslightlyhigherthaninAlbuquerque.
TheSouthValleyagedistributionandnumberofpeopleineachagecategoryareasfollows:
SouthValleyResidents Percent NumberUnder5years 6.5% 3,7625to14years 14.1% 8,16115to19years 8.0% 4,63020to34years 19.1% 11,05535to49years 19.3% 11,17050to65years 19.6% 11,34465yearsandover 13.4% 7,756
Allagegroups 100.0% 57,878
0%
8%
16%
24%
Under5years
5to14years
15to19years
20to34years
35to49years
50to65years
65yearsandover
UnitedStates Albuquerque SouthValley
STRENGTH:
Relative abundance of wise elders

SouthValleyDataAtlas
6
Figurea8.Childdependencyratio,whichisthenumberofchildren(0-17years)per100working-ageadults(18-64years)
Thechilddependencyratioreflectstheratioofdependentchildrentotheworkingagepopulation.TheSouthValleyhasahigherchilddependencyratiothanAlbuquerqueandtheUnitedStates.Therelativeshortageofyoungadultsalsocontributestothehigherratio.
Education
Figurea9.Enrollmentratesforpre-schoolersandolderteens
Pre-schoolenrollmentfor3and4year-oldsintheSouthValleyismorethan10percentagepointsbelowtheUnitedStatesaverage,anditis4percentagepointsbelowtheAlbuquerqueaverage.Attheotherendofchildhood,schoolenrollmentfor18and19year-oldsis10percentagepointsbelowtheUnitedStatesaverageand12percentagepointsbelowtheAlbuquerqueaverage.
37.4 37.1
41.6
UnitedStates Albuquerque SouthValley
47.4%
75.3%
40.8%
75.8%
36.6%
61.6%
3and4years 18and19years
UnitedStates Albuquerque SouthValley
CHALLENGE:
Fewer workers per dependent child
CHALLENGE:
Too few young children and older teens in school

NMEvaluationLab@UNM
7
Figurea10.Educationalattainmentforadults25yearsandolder
TheSouthValleytrailsAlbuquerqueandtheUnitedStatesby16and13percentagepointsinthepercentofpopulation25yearsandolderwithatleastahighschooldegree.Thediscrepancyisevenlargerforcollegedegreeattainment.13%ofSouthValleyadultsholdacollegedegreeorhigher,comparedwith33%ofAlbuquerqueadultsand29%ofadultsnationally.
Figurea11.Youngadults(18-24years)withahighschoolcredential,bygender
Atallgeographies,youngwomenaremorelikelythanyoungmentoholdahighschoolcredential.ButthedisparityismorepronouncedintheSouthValley,where68%ofyoungmenand76%ofyoungwomenhavecompletedhighschool.Thesesharesaremorethan10percentagepointslowerthaninAlbuquerqueandtheUnitedStates.
86.3%
29.3%
88.9%
33.2%
72.8%
12.7%
Highschoolgraduateorhigher Bachelor'sdegreeorhigher
UnitedStates Albuquerque SouthValley
82.7%87.4%
81.2%85.4%
68.2%75.6%
Men Women
UnitedStates Albuquerque SouthValley
CHALLENGE:
Incomplete education for many . . .
. . .
especially for young adults

SouthValleyDataAtlas
8
Figurea12.Medianearningsbyeducationalattainment
South Valley residents without a high school credential earn as much as those with the same education level in Albuquerque and the United States. Compared with the United States as a whole, Albuquerque residents with some college or associate’s degree and those with a Bachelor’s degree earn less. For the other comparisons, the estimates have such large margins of error that we cannot be sure that the apparent pattern of lower earnings for South Valley residents truly holds. That is, there is a reasonable probability that another sample of survey respondents would show a smaller earnings gap. At the same time, this uncertainty also means that there is a reasonable probability that another sample of survey respondents would show a larger gap.
$19,954
$27,868
$33,988
$50,515
$66,944
$19,405
$26,949$30,736
$44,217
$57,513
$19,323
$24,028
$28,810
$37,227
$51,552
Lessthanhighschoolgraduate
Highschoolgraduate(includes
equivalency)
Somecollegeorassociate'sdegree
Bachelor'sdegree Graduateorprofessionaldegree
UnitedStates Albuquerque SouthValley

NMEvaluationLab@UNM
9
Figurea13.Povertyratesforadultswithoutahighschoolcredential
Womenwithoutahighschoolcredentialfacehigherpovertyratesthanmeninallthreegeographies.AlbuquerqueandSouthValleyresidentswithlittleeducationfacesimilarpovertyrates,andbothgroupsaremorelikelyhaveincomesbelowthepovertylinethanthosewithsimilarschoolingintherestofthecountry.Theratesareveryhigh:35%ofSouthValleywomenwhodidnotgraduatefromhighschooland29%oftheirmalecounterpartsliveinpoverty.
23.8%
31.3%29.9%
36.4%
28.9%
34.8%
Men Women
UnitedStates Albuquerque SouthValley
CHALLENGE:
Poverty rates are very high for those without a high school credential

SouthValleyDataAtlas
10
WorkForce
Figurea14.Percentofcivilianpopulation16yearsandolderemployed,unemployedandnotinlaborforce
Thefirstseriesshowstheemployment-populationratio,thepercentoftheunderlyingpopulationthatisworkingforpay,eitherasanemployeeorasaself-employedworker.Peoplewhoarenotworking,butwhoareactivelylookingandavailableforworkareconsideredunemployed.Theunemploymentratedoesnotincludepeoplewhowouldliketowork,butwhohavebecomediscouragedandarenolongerjobhunting.These“discouragedworkers”areconsideredtobenotinthelaborforce,asisanyoneelsewhoisnotworkingorlookingforwork.Thosenotinthelaborforceincludestudents,retireesandhomemakers.
ComparedwithAlbuquerqueandtheUnitedStatesasawhole,SouthValleyresidentsarelesslikelytobeemployed,morelikelytobeunemployed,andmorelikelynottobeinthelaborforce.The51%employmentrateis16%lowerthaninAlbuquerque;the7.1%unemploymentis29%higherthaninAlbuquerque,andtheratenotinthelaborforce,at42%,is20%higherthaninAlbuquerque.Inshort,SouthValleyresidentsareemployedatsignificantlylowerratesthantheircounterpartsinAlbuquerque.
57.7%
5.8%
36.1%
59.5%
5.5%
34.7%
51.3%
7.1%
41.6%
Employed Unemployed Notinlaborforce
UnitesStates Albuquerque SouthValley
CHALLENGE:
JOBS!!!

NMEvaluationLab@UNM
11
Figurea15.Householdsreceivingdisabilityincome
Asacorollarytoloweremploymentrates,SouthValleyresidentsaremuchmorelikelythantheircounterpartsinAlbuquerqueandnationallytoreceiveSupplementalSecurityIncome(SSI),aprogramthatsupportsthoseunabletoworkduetodisability.
Figurea16.Self-employedworkerswhosebusinessesarenotincorporated
SouthValleyworkersaremorelikelytoruntheirownsmallbusinessthanAlbuquerqueworkers.Therate,at6.4%,issimilartothenationalaverage.
5.3% 5.4%
9.0%
UnitesStates Albuquerque SouthValley
6.1%
5.2%
6.4%
UnitesStates Albuquerque SouthValley
CHALLENGE:
High rates of disability
STRENGTH:
Entrepre-neurship

SouthValleyDataAtlas
12
Figurea17.Occupationaldistribution
Reflectingloweducationalattainment,SouthValleyworkersaremuchlesslikelythanthoseinAlbuquerqueandtheUnitedStatestohaveoccupationsinmanagement,business,scienceandthearts,andmuchmorelikelytohaveservice,constructionandtransportationjobs.
Figurea18.Medianearningsforworkers25yearsandolder
SouthValleyresidentsearnsubstantiallylessthanallresidentsofAlbuquerqueandtheUnitedStates.Medianearningsforfull-timeworkerswholiveintheSouthValleyare$26,153,comparedwith$34,396forthosewholiveinAlbuquerque,adifferenceofmorethan$8,000.
36.4%
18.2%
24.4%
9.0%12.1%
41.2%
19.6%
23.9%
7.8% 7.6%
23.9% 25.3%23.1%
14.9%12.8%
Management,business,science,andarts
Service Salesandoffice Naturalresources,construcjonandmaintenance
Producjonandtransportajon
UnitedStates Albuquerque SouthValley
$36,034$34,396
$26,153
UnitedStates Albuquerque SouthValley
CHALLENGE:
Low earning power

NMEvaluationLab@UNM
13
Olderadults
Figurea19.Adults65yearsandolderanddisabilities
Forty-fourpercentofadults65andolderintheSouthValleyreportadisability,comparedwithonly39percentinAlbuquerqueand36percentintheUnitedStates.
Figurea20.Poverty(darkersegment)andnearpoverty(lightersegment)foradults65andolder
Note:Nearpovertyisincomebetween100and150%ofthepovertyline.
Ratesofpovertyandnear-povertyforadults65yearsandolderaremuchhigherintheSouthValleythaninAlbuquerqueandtheUnitedStatesasawhole.
36.3%38.6%
43.9%
UnitedStates Albuquerque SouthValley
9.4% 9.8%15.4%
10.9% 10.3%
17.4%
UnitedStates Albuquerque SouthValley
CHALLENGE:
High rates of disability for elders
CHALLENGE:
Poverty and near-poverty for older adults

SouthValleyDataAtlas
14
Figurea21.Adults65yearsandolderwithFoodstamp/SNAPbenefits
Nearly16%ofolderadultsintheSouthValleyreceivefoodstamp(SNAP)benefits.ThisisdoubletherateoffoodstampreceiptforolderadultsinAlbuquerque,andclosetodoubletherateforolderadultsnationally.
Figurea22.Homeownershipforadults65yearsandolder
Despitehigherlevelsofpoverty,olderadultsintheSouthValleyaremorelikelytoowntheirhomethanolderadultsintheUnitedStatesasawholeandolderadultsinAlbuquerque.91%ofSouthValleyeldersowntheirhomes,comparedwith77%inAlbuquerqueand79%nationally.
8.5%7.5%
15.8%
UnitedStates Albuquerque SouthValley
78.5% 76.7%
90.8%
UnitedStates Albuquerque SouthValley
STRENGTH:
High rates of home ownership among older adults

NMEvaluationLab@UNM
15
B.HOUSEHOLDS,FAMILIESANDCHILDREN
Alldatainthissectionarefromthe2010-2014AmericanCommunitySurvey.
Figureb1.Householdsize
HouseholdsarelargerintheSouthValleythaninAlbuquerqueandtheUnitedStatesasawhole.49%ofSouthValleyresidentsliveinhouseholdsofthreeormorepeople,comparedwith35%inAlbuquerqueand39%intheUnitedStatesasawhole.
27.6%
33.6%38.9%
32.7% 32.5%34.9%
22.1%
29.1%
48.8%
One Two Threeormore
UnitedStates Albuquerque SouthValley

SouthValleyDataAtlas
16
Figureb2.Householdtype
TheCensusdistinguishesbetweenfamilyhouseholds,composedoftwoormorerelatedpeople,and“non-family”households,composedeitherofoneperson,oroftwoormoreunrelatedpeople.
TheSouthValleyhasrelativelymorefamilyhouseholdsthanAlbuquerqueandtheUnitedStates.Addingallfamilyhouseholdsregardlessofwhoheadsthem,73%ofhouseholdsintheSouthValleyarefamilies,comparedwith60%inAlbuquerqueand66%nationally.TheSouthValleyalsohasrelativelymorehouseholdscomposedoffamiliesheadedbyasinglemaleorfemale.18%ofSouthValleyhouseholdsarefamilieswithafemalehouseholder,comparedwith13%and14%ofUnitedStatesandAlbuquerquehouseholds,and9%ofSouthValleyhouseholdsarefamilieswithamalehouseholder,comparedwith5%and6%ofUnitedStatesandAlbuquerquehouseholds.Thismeansthat27%ofSouthValleyhouseholdsarelikelytobesingle-parentfamilies,amuchgreatersharethanthe20%ofAlbuquerquehouseholds,and18%ofhouseholdsnationally.
33.8% 40.1%27.7%
48.4% 39.6%
45.8%
13.0% 14.4%17.8%
4.8% 6.0% 8.7%
UnitedStates Albuquerque SouthValley
Singlemalefamilyhouseholder
Singlefemalefamilyhouseholder
Married-couplefamily
Nonfamilyhousehold
STRENGTH:
South Valley residents are surrounded by family

NMEvaluationLab@UNM
17
Figureb3.Medianhouseholdincome
MedianhouseholdincomeintheSouthValleyis$36,676.Thisfigureismorethan$10,000lowerthaninAlbuquerque,andnearly$17,000lowerthanintheUnitedStatesasawhole.
Figureb4.Povertyratesforfamilieswithchildrenundertheageof18
MorethanathirdofSouthValleyfamilieswithchildrenliveinpoverty,comparedwith25%ofAlbuquerquefamilies,andonly18%offamiliesnationally.
$53,482
$47,413
$36,676
UnitedStates Albuquerque SouthValley
18.1%
24.8%
34.4%
UnitedStates NewMexico SouthValley
CHALLENGE:
More than 1/3 of families with children face poverty

SouthValleyDataAtlas
18
Figureb5.Childrenbyhouseholdtype
ComparedwiththeUnitedStates,childrenInbothAlbuquerqueandtheSouthValleyarelesslikelytoliveinhouseholdsheadedbyamarriedcouple,andaremorelikelytoliveinhouseholdsheadedbyanunmarriedparent.29%ofSouthValleychildrenliveinahouseholdheadedbyasinglewoman;11%liveinahouseholdheadedbyasingleman.
Figureb6.Childreninhouseholdsnotheadedbytheirparents
ChildrenintheSouthValleyaremuchmorelikelythanchildreninAlbuquerqueandtheUnitedStatesasawholetoliveinhouseholdsthatarenotheadedbytheirparents.14%ofSouthValleychildrenliveinhouseholdsheadedagrandparentandanother5%liveinhouseholdsheadedbyanotherrelativeotherthanaparent.Thiscompareswith6%and3%ofAlbuquerquechildrenlivingwithgrandparentsandotherrelativesand7.5%and2%ofchildren
65.9%
25.9%
7.5%
57.5%
31.4%
10.5%
59.6%
29.2%
10.9%
Householdheadedbymarriedcouple
Singlefemalehouseholder Singlemalehouseholder
UnitedStates Albuquerque SouthValley
7.5%
2.4%
6.3%
2.7%
14.1%
5.3%
Grandparent Otherrelatajve
UnitedStates Albuquerque SouthValley
CHALLENGE:
Single parent households
STRENGTH:
Multi-generational families

NMEvaluationLab@UNM
19
livingwithgrandparentsandotherrelativesnationally.Thegreatershareofchildrenlivinginhouseholdsheadedbyrelativesotherthantheirparentsislikelyrelatedtothehighratesofbirthstoteenmoms(seefigured1).
Figureb7.Theroleofgrandparents
12%ofSouthValleyadults65andolderlivewiththeirgrandkids,whichistwicetherateforolderadultsinAlbuquerqueandintheUnitedStatesasawhole.5%ofSouthValleyeldersareresponsibleforraisingtheirgrandkids.ThisrateismorethanquadrupletheratefortheUnitedStates,andmorethan3timestherateforAlbuquerque.
Intermsofnumbers,907olderadultslivewiththeirgrandkids,and419areraisingtheirgrandkids.
5.0%
1.2%
4.8%
1.4%
11.7%
5.4%
Livingwithgrandchild Responsibleforgrandchild
UnitedStates Albuquerque SouthValley
CHALLENGE:
Grand-parents raising grandkids

SouthValleyDataAtlas
20
Figureb8.Children,publicassistanceandpoverty
39%ofSouthValleychildrenliveinpoverty,and45%liveinhouseholdsthatreceiveeitherdisabilityinsurancethroughtheSupplementalSecurityIncome(SSI)program,cashpublicassistanceincome,orFoodStamp/SNAPbenefits.Therateofpublicassistanceis50%higherthanthenationalaverageand40%higherthantheAlbuquerquerate.Ratesofpovertyaremorethan50%higherthanratesinAlbuquerqueandthecountryasawhole.
28.0%
21.9%
31.6%
25.6%
44.7%
39.0%
Inhouseholdwithpublicassistance Inhouseholdwithincomebelowthepovertyline
UnitedStates Albuquerque SouthValley
STRENGTH:
Children are connected to public assistance programs
CHALLENGE:
39% of children live in poverty

NMEvaluationLab@UNM
21
C.TRANSPORTATIONANDHOUSING
Alldatainthissectionarefromthe2010-2014AmericanCommunitySurvey.
Transportation
Figurec1.Householdswithnocaravailable
VeryfewhouseholdsintheSouthValleydonothaveaccesstoacar,only5%,comparedwith7%ofhouseholdsinAlbuquerqueand9%nationally.Althoughsmallasapercentage,989householdsintheSouthValleyhavenocar.
Figurec2.Commutingtimes
SouthValleyworkersarelesslikelythanotherworkersinAlbuquerquetohaveshortcommutestowork,reflectinggreatertraveldistances.
9.1%
6.9%
5.2%
UnitedStates Albuquerque SouthValley
42.9%
63.9%
48.4%
76.5%
40.3%
70.8%
Lessthan20minutes Lessthan30minutes
UnitesStates Albuquerque SouthValley
CHALLENGE:
Distance

SouthValleyDataAtlas
22
Figurec3.Gettingtowork
SouthValleyresidentsaremorelikelytocarpool,butlesslikelytotakepublictransportationortowalkorbiketowork,comparedwithworkersinAlbuquerqueandtheUnitedStatesasawhole.Useofpublictransportationandwalkingorbikingareparticularlylow.
Housing
Figurec4.Proportionofhousingbuiltineachdecadefrompre1940topresent
SouthValleyhousingstockisrelativelyold,withmanystructuresdatingtothe1960sorearlier.
9.6%
5.1%
3.4%
9.5%
2.1%
3.4%
11.8%
1.3%1.9%
Carpooled Publictransportajon WalkorbikeUnitedStates Albuquerque SouthValley
0%
5%
10%
15%
20%
2010orlater
2000-2009
1990-1999
1980to1989
1970to1979
1960to1969
1950to1959
1940to1949
1939orearlier
US Albuquerque SouthValley
CHALLENGE:
Older homes
STRENGTH:
Carpooling
CHALLENGE:
Public transport-ation
CHALLENGE:
Walking and biking safety

NMEvaluationLab@UNM
23
Figurec5.Yearsinsamehome
TheSouthValleyisverystable:nearlyhalfofallresidentshavelivedintheirhomesfor15yearsormore,andonly17%havelivedintheirhomesforlessthan5years.Bycontrast,only27%ofAlbuquerqueresidentshavelivedintheirhomesfor15yearsormore,and29%ofthemhavelivedintheirhomesforlessthan5years.
Figurec6.Homeownership
74%ofSouthValleyhousingunitsareowner-occupied,comparedwith59%ofAlbuquerqueunitsand64%ofunitsnationally.
25%
41%
33.9%29%
44%
26.5%
17%
35%
48.1%
Lessthan5years 5-14years 15yearsormore
UnitedStates Albuquerque SouthValley
64.4%59.3%
74.4%
UnitedStates Albuquerque SouthValley
STRENGTH:
Stability!!!
STRENGTH:
High rates of home ownership

SouthValleyDataAtlas
24
Figurec7.Homevalues
29%ofSouthValleyhomeswerevaluedatlessthan$100,000inthe2010-2014period.(Valuespriorto2014wereadjustedforinflation.)
Figurec8.Medianhomevalues
SouthValleymedianhomevaluesare30%lowerthanthemedianhomevalueinAlbuquerque.
9.3%
15.6% 16.0% 15.1%18.2%
15.5%
10.3%
5.8% 5.9%
20.0%
24.7%
28.1%
12.6%
2.9%
8.5%
20.9%
30.9%
20.0%
12.1%
5.8%
1.9%
Lessthan$50,000
$50,000to$99,999
$100,000to$149,999
$150,000to$199,999
$200,000to$299,999
$300,000to$499,999
$500,000ormore
UnitedStates Albuquerque SouthValley
$175,700$185,100
$128,200
UnitedStates Albuquerque SouthValley

NMEvaluationLab@UNM
25
Figurec9.Owneroccupiedunitswithoutmortgages
ReflectingthelongtenancyofmanyhomeownersintheSouthValley,40%ofowneroccupiedhousingunitsdonothavemortgages.Thiscompareswith29%inAlbuquerqueand34%nationally.
Figurec10.Medianmonthlyhousingcostsforhomeowners
HousingcostsarelowerintheSouthValley,although...
34.4%
29.2%
39.9%
UnitedStates Albuquerque SouthValley
$1,522
$457
$1,356
$397
$1,101
$312
Montlyownercostwmortgage MontlyownercostwomortgageUnitedStates Albuquerque SouthValley
STRENGTH:
Many home owners have no mortgage payments
STRENGTH:
Low cost housing

SouthValleyDataAtlas
26
Figurec11.Housingcostscomprise30%ormoreofhomeowners’income
...notnecessarilymoreaffordable,since42%ofhomeownerswithamortgagespend30%ormoreoftheirhouseholdincomeforhousingexpenses.InAlbuquerqueandnationallyonly34%ofhomeownersspendasmuchasapercentofincome.
ThesituationismuchbetterforSouthValleyhomeownerswithoutamortgage,whoarelesslikelytospend30%ormoreoftheirincomeonhousingexpensesthanthoseinAlbuquerqueandnationally.
Figurec12.Medianrent
SouthValleyrentsarelowerthaninAlbuquerque...
34.2%
15.0%
33.5%
12.2%
41.9%
11.3%
Withmortgage Withoutmortgage
UnitedStates Albuquerque SouthValley
$920
$798$711
UnitedStates Albuquerque SouthValley
CHALLENGE:
Housing affordability

NMEvaluationLab@UNM
27
Figurec13.Housingcostscomprise30%ormoreofrenters’income
...althoughmanyrenterspay30%ormoreoftheirincomeforhousing.IntheSouthValley,62%ofrentersareinthissituation,comparedwith52%inAlbuquerqueandnationally.
52.3% 52.3%
62.4%
UnitedStates Albuquerque SouthValley

SouthValleyDataAtlas
28
D.HEALTH
Unlessotherwisenoted,datainthissectionarefromtheNM-Indicator Based Information System (NM-IBIS).
Figured1.Birthweightandteenbirths
Note:Yearsofdataare2014fortheUnitedStates,2009-2014forBernalilloCountyand2009-2013fortheSouthValley.
InfantsborntoSouthValleyresidentsaresimilarintermsoflowbirthweighttoinfantsborninAlbuquerqueandtheUnitedStatesasawhole,eventhoughtheyaremorelikelytobeborntoteenmothers.TheSouthValleyteenbirthrateis2-½timesthenationalrateandjustbelow2timestheAlbuquerquerate.
28.8
9.1
15.3
9.4
10.9
8.7
Birthsper1,000GirlsAge15-17
LiveInfantsWithLowBirthweight(%)
UnitedStates BernalilloCounty SouthValley
CHALLENGE:
High birth rate for teens
NMEvaluationLab@UNM
29
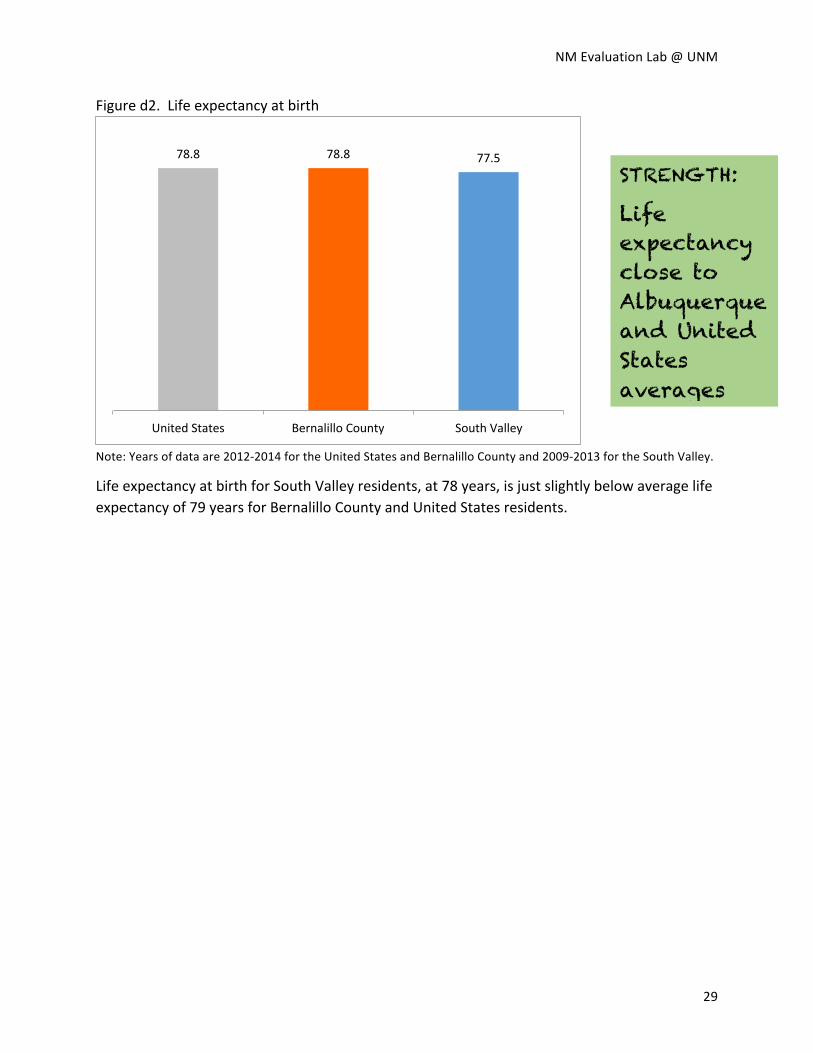
Figured2.Lifeexpectancyatbirth
Note:Yearsofdataare2012-2014fortheUnitedStatesandBernalilloCountyand2009-2013fortheSouthValley.
LifeexpectancyatbirthforSouthValleyresidents,at78years,isjustslightlybelowaveragelifeexpectancyof79yearsforBernalilloCountyandUnitedStatesresidents.
78.8 78.8 77.5
UnitedStates BernalilloCounty SouthValley
STRENGTH:
Life expectancy close to Albuquerque and United States averages

SouthValleyDataAtlas
30
Figured3.DeathsbyCauseper100,000Population(Age-adjusted)
Note:Yearsofdataare2008-2011fortheSouthValley,2012-2014forBernalilloCounty.FortheUnitedStates,yearsofdataare2013fordiabetesandunintentionalinjurymortalityratesand2014forstrokemortality.
AlthoughSouthValleylifeexpectancyisclosetolifeexpectancyforthenationasawhole,mortalityratesfordiabetes,strokeandunintentionalinjuryaremuchhigherintheSouthValleythaninBernalilloCountyandtheUnitedStates.Forexample,deathsduetodiabetesoccurredattherateof31per100,000residentsintheSouthValley,comparedwith21per100,000UnitedStatesresidents.Deathsduetostrokewere50per100,000intheSouthValley,comparedwiththeUnitedStatesrateof36per100,000.Andaccidentaldeathswere68per100,000intheSouthValley,comparedto39per100,000intheUnitedStates.
68.2
50.0
31.2
56.3
34.0
25.7
39.4
36.2
21.2
UnintenjonalInjury
Stroke
Diabetes
UnitedStates BernalilloCounty SouthValley
CHALLENGE:
Excess mortality, especially due to stroke and accidents
NMEvaluationLab@UNM
31
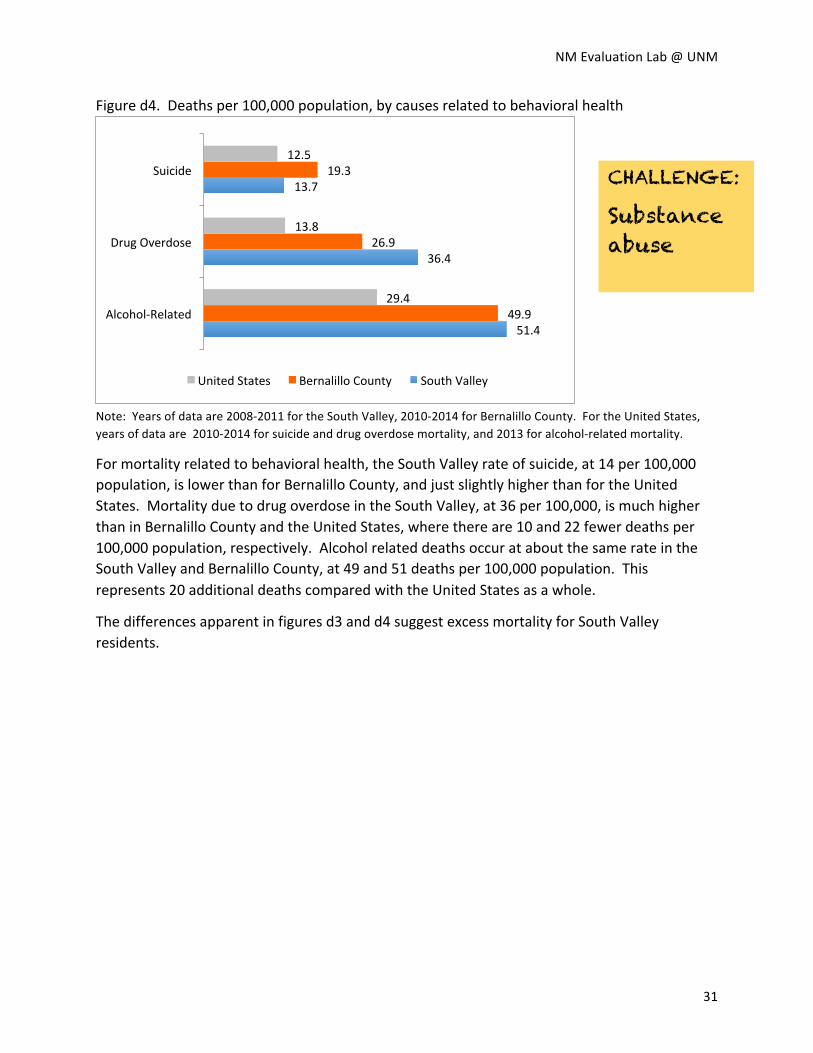
Figured4.Deathsper100,000population,bycausesrelatedtobehavioralhealth
Note:Yearsofdataare2008-2011fortheSouthValley,2010-2014forBernalilloCounty.FortheUnitedStates,yearsofdataare2010-2014forsuicideanddrugoverdosemortality,and2013foralcohol-relatedmortality.
Formortalityrelatedtobehavioralhealth,theSouthValleyrateofsuicide,at14per100,000population,islowerthanforBernalilloCounty,andjustslightlyhigherthanfortheUnitedStates.MortalityduetodrugoverdoseintheSouthValley,at36per100,000,ismuchhigherthaninBernalilloCountyandtheUnitedStates,wherethereare10and22fewerdeathsper100,000population,respectively.AlcoholrelateddeathsoccurataboutthesamerateintheSouthValleyandBernalilloCounty,at49and51deathsper100,000population.Thisrepresents20additionaldeathscomparedwiththeUnitedStatesasawhole.
Thedifferencesapparentinfiguresd3andd4suggestexcessmortalityforSouthValleyresidents.
51.4
36.4
13.7
49.9
26.9
19.3
29.4
13.8
12.5
Alcohol-Related
DrugOverdose
Suicide
UnitedStates BernalilloCounty SouthValley
CHALLENGE:
Substance abuse

SouthValleyDataAtlas
32
Figured5.Percentwithouthealthinsurance
Source:AmericanCommunitySurvey2010-2014.
24%ofallSouthValleyresidentswereuninsuredinthe2010-2014period,comparedwithratesof15%and14%forBernalilloCountyandtheUnitedStates,respectively.UninsuranceratesforSouthValleychildrenaremorethandoubletheratesinAlbuquerqueandtheUnitedStates.TheexpansionofinsurancethoughtheAffordableCareActbeganinJanuaryof2014,soitispossiblethatinsurancerateswillrise.
14.2%
7.1%
15.2%
6.5%
23.9%
15.8%
All Under18yearsofage
UnitedStates Albuquerque SouthValley
CHALLENGE:
Many have no health insurance
NMEvaluationLab@UNM
33
APPENDIX
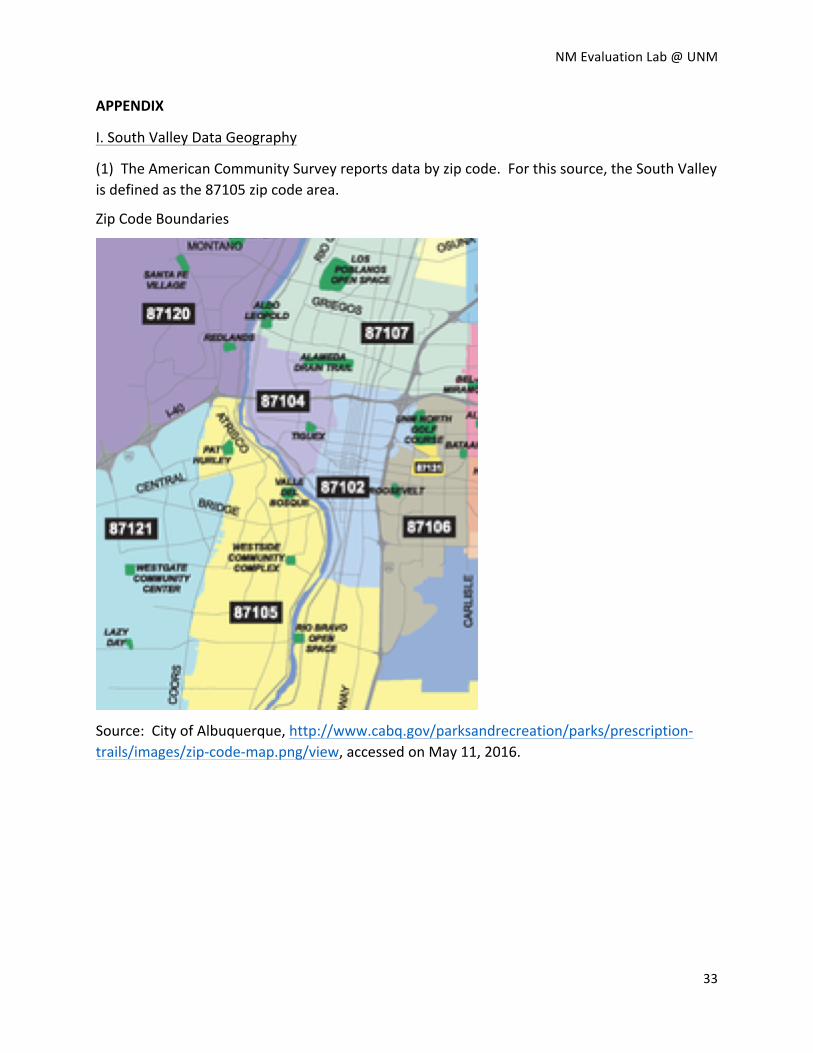
I.SouthValleyDataGeography
(1)TheAmericanCommunitySurveyreportsdatabyzipcode.Forthissource,theSouthValleyisdefinedasthe87105zipcodearea.
ZipCodeBoundaries
Source:CityofAlbuquerque,http://www.cabq.gov/parksandrecreation/parks/prescription-trails/images/zip-code-map.png/view,accessedonMay11,2016.

SouthValleyDataAtlas
34
(2)TheNM-Indicator Based Information System (NM-IBIS) reports some data for “Small Areas.” The figures in section D use the most recent data available and average measures for the two Small Areas (10 and 14) that comprise most of the populated areas of the 87105 zip code.
MapofSmallAreas.SouthValleyfiguresarecalculatedastheaveragemeasureforAreas10and14.
Source:NM-IBIShttps://ibis.health.state.nm.us/resource/SmallAreaMethods.html#part2,accessedMarch24,2016.
NMEvaluationLab@UNM
35
II.CorrectionforUndercountofUndocumentedImmigrants
Pewestimatesthat10-15%ofundocumentedimmigrantsdonotrespondtotheCensus.Thisfigurecomesfroma2001studyofundocumentedimmigrantsfromMexico.Pewestimatedthat27.7%oftheimmigrantpopulationwasundocumentedin2011.
TheACSestimatedthattherewere9,605immigrantsintheSouthValley.Wewanttoincreasethatnumberby15%oftheundocumentedimmigrants.TheACSdoesnotaskaboutimmigrationstatus,butfromthePewestimateweknowthatthepercentofundocumentedimmigrantsis27.7%ofallimmigrants.To“solve”forthenumberofundocumentedimmigrants,weset27.7%equalto1.15timestheunknownnumberofundocumentedimmigrantsdividedbyrespondingimmigrantsplustheadditional15%ofnon-respondingundocumentedimmigrants.Wecanthensolveforthenumberofundocumentedimmigrants,whichwefindtobe2,401.TheACSthusmissed15%ofthisnumber,or360.
Isthisaplausiblenumber?Itisifwebelievethat85%ofundocumentedworkersrespondtotheCensus.Thentheundercountis15%ofthe27.7%ofimmigrantswhoareundocumented,whichisaboutatotalofa4%undercountofallimmigrants.
Source:PewResearchCenter,“UnauthorizedImmigrants:HowPewResearchCountsThemandWhatWeKnowAboutThem,”April17,2013,http://www.pewresearch.org/2013/04/17/unauthorized-immigrants-how-pew-research-counts-them-and-what-we-know-about-them/,accessedMay11,2016


![ATLAS DE RIESGOS DE PIHUAMO JALISCO, MEXICO · [ATLAS DE RIESGOS DE PIHUAMO JALISCO, MEXICO] ... Las amenazas naturales han representado un alto riesgo, en la población de todo el](https://img.pdfslide.net/doc/110x75/5baa3d9809d3f2196d8c0383/atlas-de-riesgos-de-pihuamo-jalisco-mexico-atlas-de-riesgos-de-pihuamo-jalisco.jpg)