Embed Size (px)
Citation preview

1
Southampton University Annual Diversity Report 2009-2010
Contents:
1. Foreword: Professor Nick Foskett, Dean Law, Arts and Social Sciences, University Diversity Champion
2. New Vision and Values 3. Equalities Implementation Group and Diversity Champions 4. Single Equality Scheme 5. Gender Balance on Governance Structures 6. International Women’s Day 7. Athena SWAN Awards 8. Action Learning Group 9. Home Working Policy 10. Student Monitoring 11. Transitions Project 12. Staff Monitoring 13. Equal Pay Update 14. Dignity at Work and Study Policy 15. Equality Impact Assessments 16. Reasonable Adjustment Guide 17. Equal Pay Update
Appendices:
1. Monitoring data for students 2. Updated equality plans 3. Equal Pay Update 4. Equality Impact Assessment - Education 5. Monitoring data for staff

2
1. Foreword: Professor Nick Foskett, Dean of Law, Arts and Social Sciences, University Diversity Champion.
I am pleased to present to Council the 6th Annual Diversity Report for the University. This report continues to chart our position and progress on equality and diversity issues in the University, and provides the opportunity to assess both our achievements and our priorities for future action. Since becoming the University Diversity Champion I have worked with many colleagues (including members of the University Executive Group, the Equalities Implementation Group, the Diversity Champions Network, the University's Harassment Contacts, and the Diversity Team) to take forward our aspirations on equality and diversity, and to embed a culture that directly addresses these issues further within the University. I would like to thank everyone who has contributed to this. This year I will be standing down as the University’s Diversity Champion as I move to my new role at Keele University. This Annual Diversity Report shows the substantive efforts to move issues forward, yet many challenges still remain. I hope that as the University continues to move forward on this agenda with our new Vice Chancellor an affirmation of the importance of equality and diversity in the new vision and direction will maintain the momentum for change. This will provide a key signal to staff and students, and to our external partners and stakeholders, that these issues are an important and integral part of university life at Southampton. I believe strongly these challenges are at least as much about changing the culture of the university, how we do things, and the environment in which we work as they are about increasing the range of diversity in our student and staff profiles. In this context it is the lead provided by Council, UEG and the most senior colleagues within the University which is crucial in setting the tone and the momentum of change.

3
2. New Vision and Values With the appointment of the university’s new Vice Chancellor (VC), Don Nutbeam, and building on our previous successes, a new vision and shape for the University of Southampton is developing. Useful discussions, through the University Diversity Champion and the Equality Implementation Group, have taken place with the VC to ensure that Equality and Diversity are a core theme throughout the new strategy and any proposed changes. This has been reflected in the draft values of the new strategy, as below:
Mission Statement
To change the world for the better through our education and research,
our innovation and enterprise.
Values
The Core Values of the University of Southampton reflect our belief in:
the value of education to transform the lives of individuals, communities and society
the importance of advancing knowledge through independent research to tackle the major economic, social, environmental and technological challenges of humankind
valuing, respecting and promoting the rights, responsibilities and dignity of individuals within all our professional activities and relationships
equality of educational opportunity based on merit, irrespective of background, beliefs and socio-economic context
pursuing excellence in all that we do
the freedom to challenge existing knowledge and beliefs through independent critical research and scholarship
upholding the standards of probity and ethical behaviour required by our legal obligations and societal expectations
promoting environmental and economic sustainability in all that we do
the intellectual independence of universities
Discussions with the VC will continue to take place on this agenda as the strategy unfolds, including addressing the areas of governance and accountability; and this will need to include the appointment of a new University Champion.
It is vital that the principles and values of equity and diversity permeate the future strategy of the university. If this is not clearly embedded then there
4
remains the possibility that equality and diversity are seen as marginal to the ethos and work of the university.
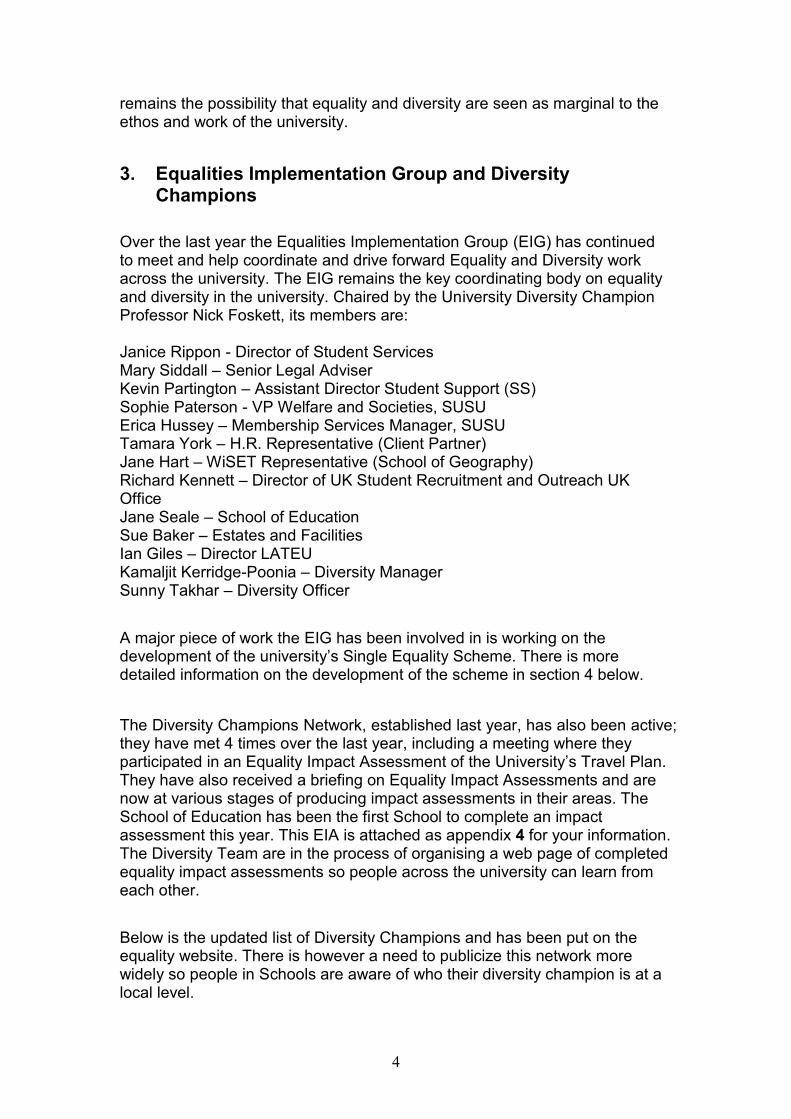
3. Equalities Implementation Group and Diversity Champions
Over the last year the Equalities Implementation Group (EIG) has continued to meet and help coordinate and drive forward Equality and Diversity work across the university. The EIG remains the key coordinating body on equality and diversity in the university. Chaired by the University Diversity Champion Professor Nick Foskett, its members are:
Janice Rippon - Director of Student Services Mary Siddall – Senior Legal Adviser Kevin Partington – Assistant Director Student Support (SS) Sophie Paterson - VP Welfare and Societies, SUSU Erica Hussey – Membership Services Manager, SUSU Tamara York – H.R. Representative (Client Partner) Jane Hart – WiSET Representative (School of Geography) Richard Kennett – Director of UK Student Recruitment and Outreach UK Office Jane Seale – School of Education Sue Baker – Estates and Facilities Ian Giles – Director LATEU Kamaljit Kerridge-Poonia – Diversity Manager Sunny Takhar – Diversity Officer
A major piece of work the EIG has been involved in is working on the development of the university’s Single Equality Scheme. There is more detailed information on the development of the scheme in section 4 below.
The Diversity Champions Network, established last year, has also been active; they have met 4 times over the last year, including a meeting where they participated in an Equality Impact Assessment of the University’s Travel Plan. They have also received a briefing on Equality Impact Assessments and are now at various stages of producing impact assessments in their areas. The School of Education has been the first School to complete an impact assessment this year. This EIA is attached as appendix 4 for your information. The Diversity Team are in the process of organising a web page of completed equality impact assessments so people across the university can learn from each other.
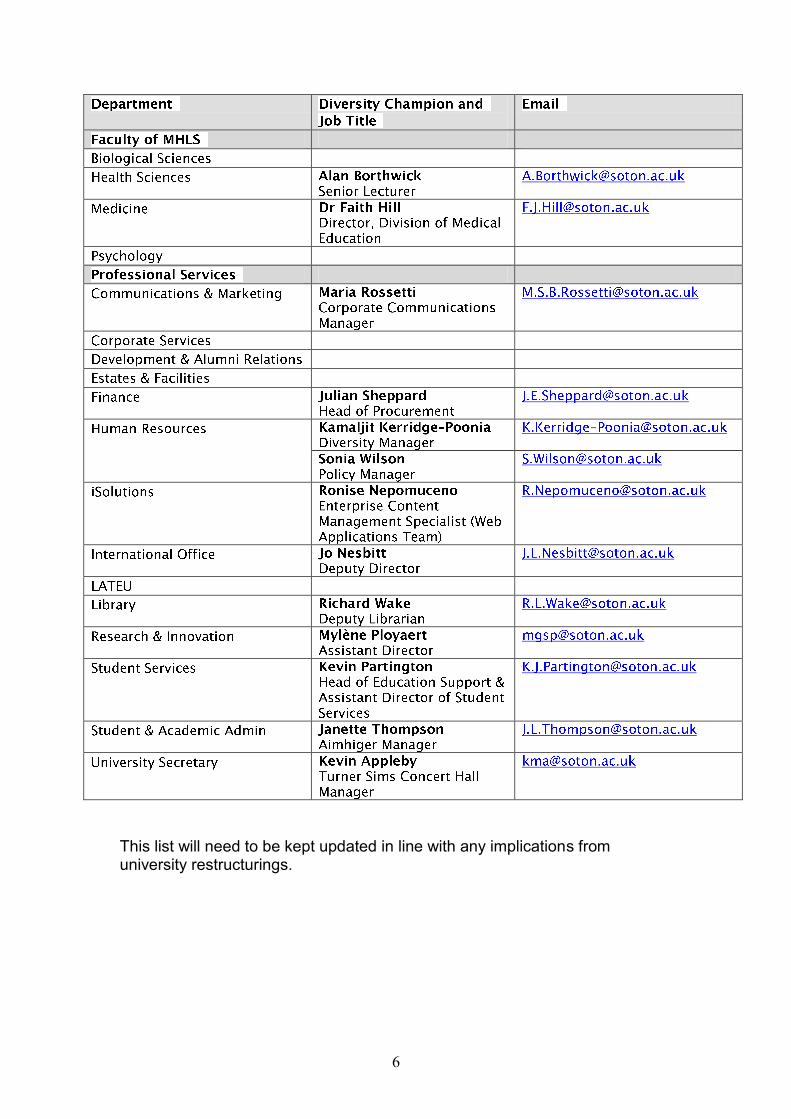
Below is the updated list of Diversity Champions and has been put on the equality website. There is however a need to publicize this network more widely so people in Schools are aware of who their diversity champion is at a local level.

5
6
This list will need to be kept updated in line with any implications from university restructurings.
7
4. Single Equality Scheme
Last years Annual Diversity Report updated Council on the new Equality Bill. The Bill has progressed through the House of Commons and is now with the House of Lords, having gone through its second reading and is awaiting a date for its third reading before it goes for Royal Assent. The Equality and Human Rights Commission is currently consulting authorities on the Guidance and Codes of Practice aligned to the Bill.
In summary the Bill will harmonise and in some cases extend existing discrimination law covering the 'protected characteristics' of age, disability, gender reassignment, marriage and civil partnership, pregnancy and maternity, race, religion or belief, sex, and sexual orientation. It will address the impact of recent case law which is generally seen as having weakened discrimination protection, and harmonise provisions defining indirect discrimination.
Key areas in the Bill are that it:
Provides powers to extend age discrimination protection outside the workplace
Clarifies protection against discrimination by association, for example in relation to a mother who cares for her disabled child
Extends protection from discrimination on the grounds of gender reassignment to school pupils
Extends discrimination protection in the terms of membership and benefits for private clubs and associations
Creates a unified public sector duty, intended to promote equality in public policy and decision-making, existing provisions being extended to the protected characteristics of sexual orientation, age and religion or belief, and proposes a new public sector duty related to socio-economic inequalities
Provides for legislation requiring that employers review gender pay differences within their organisations and publish the results
Provides for changes to the way that individual claims are enforced, and gives employment tribunals wider powers to make recommendations for the collective benefit of employees
Allows a Minister to amend UK equality legislation to comply with European law without the need for primary legislation
Extends the period for which all-women shortlists may be used for parliamentary and other elections until 2030 and allows parties to reserve places on shortlists of candidates for people on the grounds of race or disability.
In response to these changes the EIG decided that the University should develop a Single Equality Scheme, and cover the areas of sexual orientation, gender, including gender reassignment, disability, race and religion and belief, and age.

8
The EIG has taken a lead on establishing working groups in each area, chaired by EIG members and supported by the Diversity Manager.
Most of the working groups have met 3/4 times and have scoped out key issues in each area. The table below summarises the key issues each group has identified so far:
SINGLE EQUALITY SCHEME WORKING GROUPS SUMMARY
Group Summary Key Issues & Decisions
Age New chair to be appointed.
Generally issues differ depending on groups - Academic/MSA & technical and staff/students
Staff - Returning from retirement/project work/? Would this be best fit? Team dynamics - younger people managing older people, women managing men? Students – Initial view was that few issues exist but it may be that they are not reported/identified)- need more feedback from students on this. SUSU facilities geared towards undergraduate students, needs addressing for those mature/post grad students, see attached statistics on student population profile. There are a number of under grad timetabling issues i.e. little flexibility for part-time/working/mature students Managers who are involved in recruitment/redeployment should undergo specific training, as this will influence people’s views of different age groups of people applying to the university for work.
Disability Chair: Kevin Partington
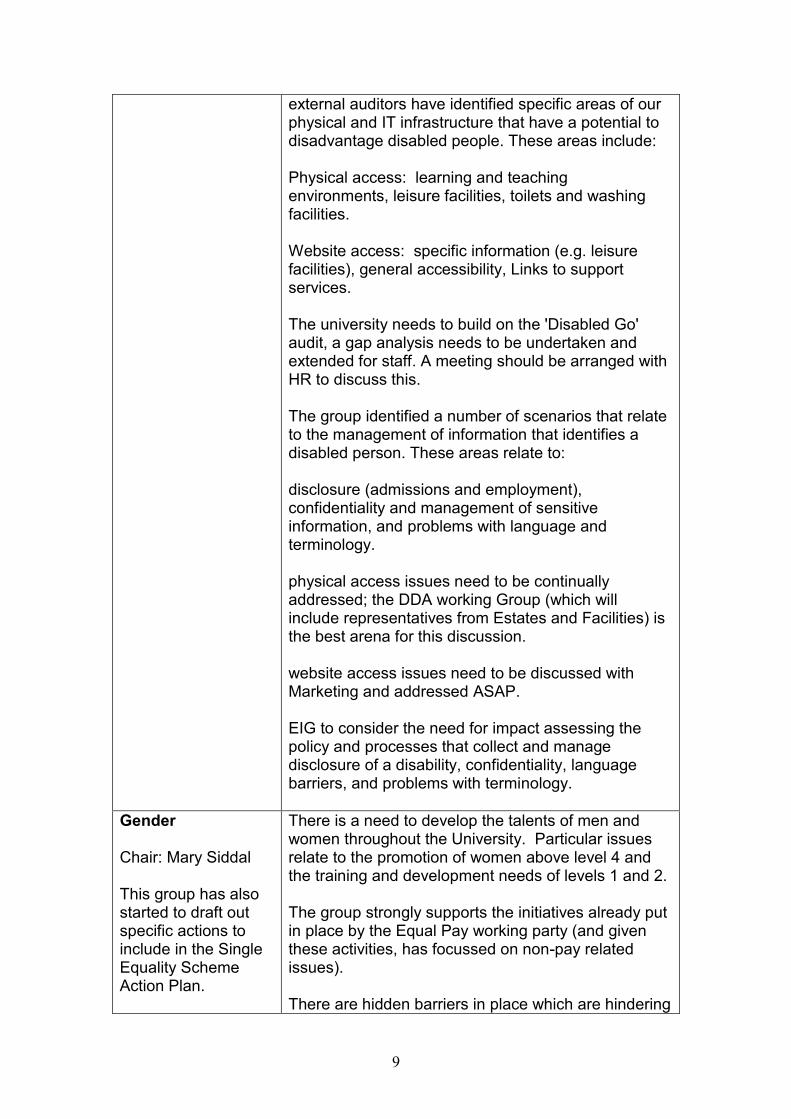
The work of this group underpinned the revisions to the Disability Equality Scheme, which needed to be done by December 2009, the full revised scheme and action plan have been sent separately. The following are some specific issues the group identified. Commissioned and non commissioned work by
9
external auditors have identified specific areas of our physical and IT infrastructure that have a potential to disadvantage disabled people. These areas include: Physical access: learning and teaching environments, leisure facilities, toilets and washing facilities. Website access: specific information (e.g. leisure facilities), general accessibility, Links to support services. The university needs to build on the 'Disabled Go' audit, a gap analysis needs to be undertaken and extended for staff. A meeting should be arranged with HR to discuss this. The group identified a number of scenarios that relate to the management of information that identifies a disabled person. These areas relate to: disclosure (admissions and employment), confidentiality and management of sensitive information, and problems with language and terminology. physical access issues need to be continually addressed; the DDA working Group (which will include representatives from Estates and Facilities) is the best arena for this discussion. website access issues need to be discussed with Marketing and addressed ASAP. EIG to consider the need for impact assessing the policy and processes that collect and manage disclosure of a disability, confidentiality, language barriers, and problems with terminology.
Gender Chair: Mary Siddal This group has also started to draft out specific actions to include in the Single Equality Scheme Action Plan.
There is a need to develop the talents of men and women throughout the University. Particular issues relate to the promotion of women above level 4 and the training and development needs of levels 1 and 2. The group strongly supports the initiatives already put in place by the Equal Pay working party (and given these activities, has focussed on non-pay related issues). There are hidden barriers in place which are hindering

10
the promotion of women at senior levels. Flexibility is key to the career development of all staff. As we consider the development of the University alongside initiatives such as ‘Creating our Future’, flexibility needs to be at the heart of any changes. In many cases, the current membership of key committees and governance bodies does not reflect the gender mix of the workforce they represent and steps are needed to address this.
1. Collaboration and inter-disciplinary working, which has been identified by the VC as crucial to the University as a whole, will also promote diversity and start to break down occupational and subject-related segregation.
2. We need to promote a culture that supports gender equality and send out the message that this is everyone’s responsibility and is not a ‘tick box’ exercise.
Race Chair: Richard Kennet
Recruitment – need to reach out to more diverse groups, doubt the university currently reflects the local community? Need to engage better with local communities. Issues with lack of aspirations/socio economic etc. Agreed the need to identify where we are under represented and target. Analysis of BME applicants/entrants data needed. Further discussions required. Need to access recruitment methods used/where advertisements are placed/networks used/employment events etc. Need to analyse what we do well and where support is needed – ‘Access to Southampton’. Need to raise cultural awareness, working with diverse staff and students, should be include induction/staff development – should raise at EIG Issues around promotion raised
Religion & Belief Ian Giles
To be completed in discussion with PVC Alistair Fitt
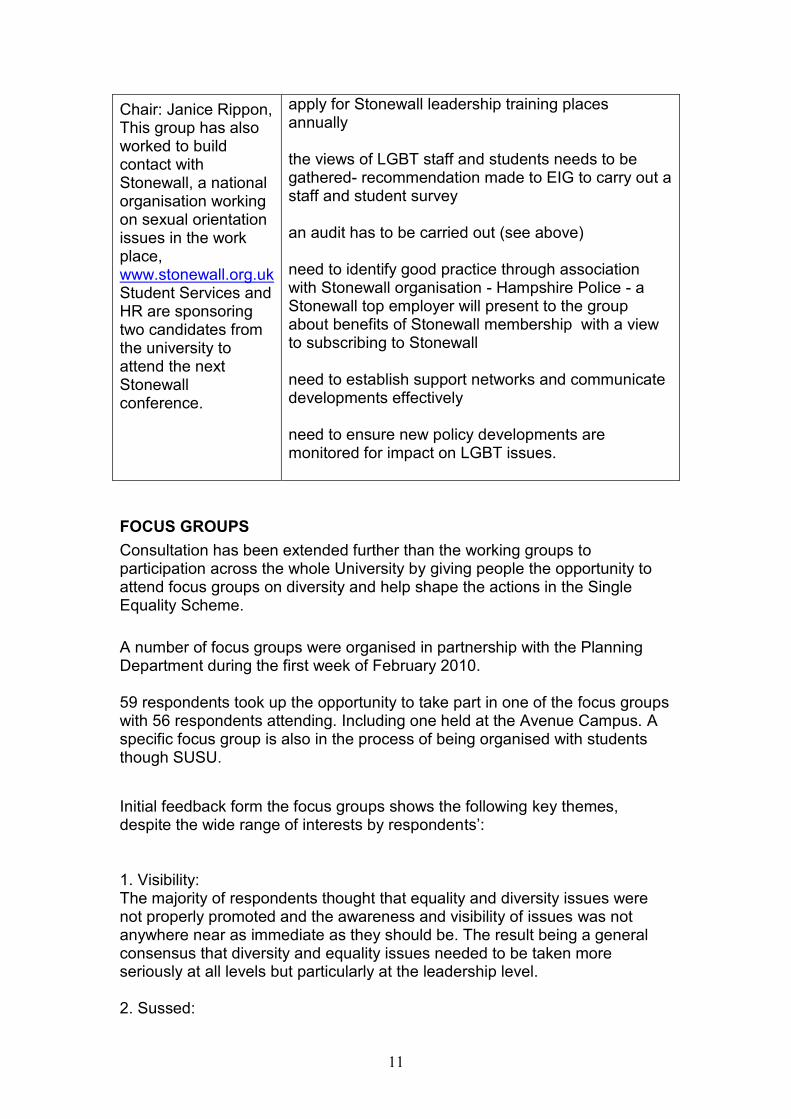
Sexual Orientation leadership of the university needs to be aware of LGBT specific equality issues - decided to fund and
11
Chair: Janice Rippon, This group has also worked to build contact with Stonewall, a national organisation working on sexual orientation issues in the work place, www.stonewall.org.uk Student Services and HR are sponsoring two candidates from the university to attend the next Stonewall conference.
apply for Stonewall leadership training places annually the views of LGBT staff and students needs to be gathered- recommendation made to EIG to carry out a staff and student survey an audit has to be carried out (see above) need to identify good practice through association with Stonewall organisation - Hampshire Police - a Stonewall top employer will present to the group about benefits of Stonewall membership with a view to subscribing to Stonewall need to establish support networks and communicate developments effectively need to ensure new policy developments are monitored for impact on LGBT issues.
FOCUS GROUPS
Consultation has been extended further than the working groups to participation across the whole University by giving people the opportunity to attend focus groups on diversity and help shape the actions in the Single Equality Scheme.
A number of focus groups were organised in partnership with the Planning Department during the first week of February 2010. 59 respondents took up the opportunity to take part in one of the focus groups with 56 respondents attending. Including one held at the Avenue Campus. A specific focus group is also in the process of being organised with students though SUSU.
Initial feedback form the focus groups shows the following key themes, despite the wide range of interests by respondents’: 1. Visibility: The majority of respondents thought that equality and diversity issues were not properly promoted and the awareness and visibility of issues was not anywhere near as immediate as they should be. The result being a general consensus that diversity and equality issues needed to be taken more seriously at all levels but particularly at the leadership level. 2. Sussed:

12
Sussed was almost universally mentioned as the main place where respondents either look for or begin their search for information. However it was almost universally regarded as at best cumbersome, especially the inability to search properly for items 3. University policy: The university policy fulfils the government legislation, but the spirit of equality and diversity is low down on the overall agenda of the university. There is a wide range of initiatives that individuals have heard of, but none of them appear to be particularly joined up and awareness (e.g. of the diversity champions) tend to be linked into the number of years of employment at the university and how well linked into the culture that employee is. 4. Leadership: Leaders such as Debra Humphris, give the equality and diversity agenda a higher amount of visibility and momentum. There is a perception from some that other leaders need to drive the agenda forward more actively and it is their responsibility to do so (and at the current time this is not happening). Due to equality and diversity issues not being embraced by senior management (in the eyes of the majority of respondents), these issues are not seen externally as being particularly important to the university. This is only the initial feedback a more detail analysis to due imminently and will help form the draft Single Equality Scheme for discussion by the EIG.
The EIG has also agreed that the next stage it to carry out a university wide equality to include both staff and students. The group are keen to ensure that the opportunity is presented to all staff to comment on equality and diversity; this will also help to provide a good benchmark for measuring progress in the future.
As can be seen a picture of the key equality issue, concerns and hopes are beginning to emerge. The final draft Single Equality Scheme will be presented to council in the summer for endorsement as a university plan.
5. Gender Balance on Governance Structures
The Annual Diversity Report presented to Council in 2009, highlighted the under representation of women in the governance structures of the university. Council agreed that this was an area which needed to be worked on and improvements made.
At the beginning of this academic year Simon Higman, Registrar and Chief Operating Officer, wrote to chairs of committees to be mindful of this when recruiting new members to their committees.
13
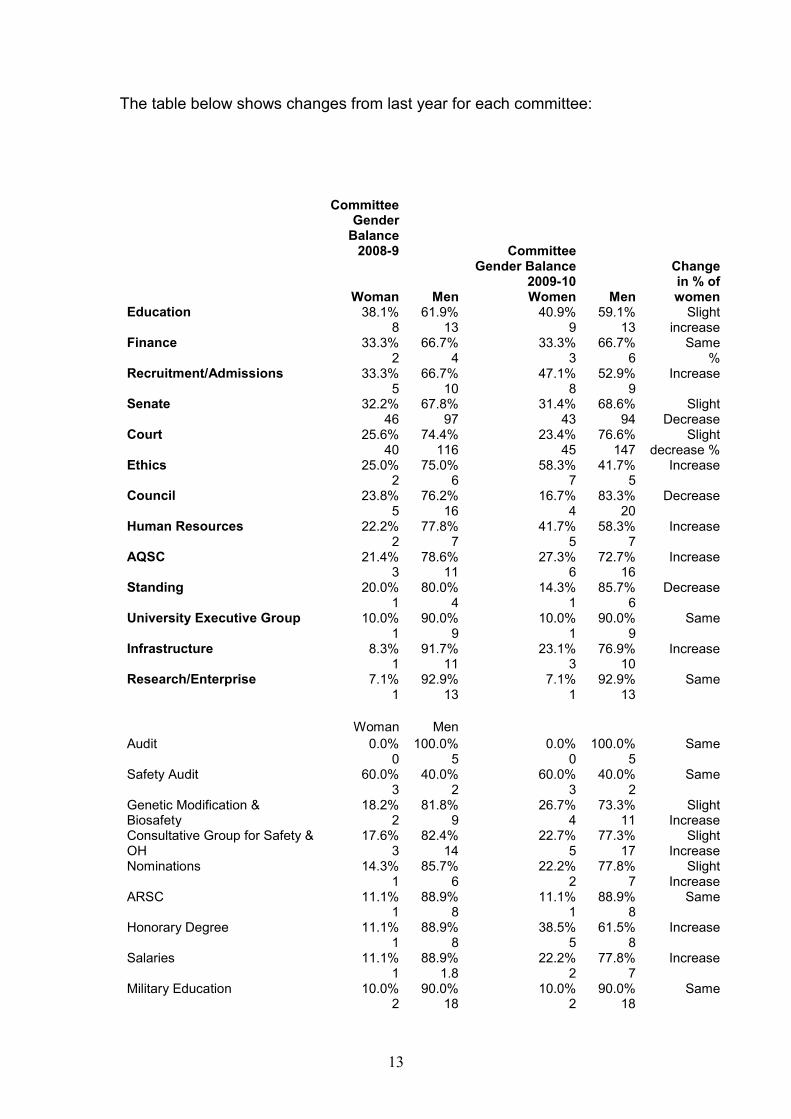
The table below shows changes from last year for each committee:
Committee Gender
Balance 2008-9
Woman Men
Committee Gender Balance
2009-10 Women Men
Change in % of women
Education 38.1% 8
61.9% 13
40.9% 9
59.1% 13
Slight increase
Finance 33.3% 2
66.7% 4
33.3% 3
66.7% 6
Same %
Recruitment/Admissions 33.3% 5
66.7% 10
47.1% 8
52.9% 9
Increase
Senate 32.2% 46
67.8% 97
31.4% 43
68.6% 94
Slight Decrease
Court 25.6% 40
74.4% 116
23.4% 45
76.6% 147
Slight decrease %
Ethics 25.0% 2
75.0% 6
58.3% 7
41.7% 5
Increase
Council 23.8% 5
76.2% 16
16.7% 4
83.3% 20
Decrease
Human Resources 22.2% 2
77.8% 7
41.7% 5
58.3% 7
Increase
AQSC 21.4% 3
78.6% 11
27.3% 6
72.7% 16
Increase
Standing 20.0% 1
80.0% 4
14.3% 1
85.7% 6
Decrease
University Executive Group 10.0% 1
90.0% 9
10.0% 1
90.0% 9
Same
Infrastructure 8.3% 1
91.7% 11
23.1% 3
76.9% 10
Increase
Research/Enterprise 7.1% 1
92.9% 13
7.1% 1
92.9% 13
Same
Woman Men
Audit 0.0% 0
100.0% 5
0.0% 0
100.0% 5
Same
Safety Audit 60.0% 3
40.0% 2
60.0% 3
40.0% 2
Same
Genetic Modification & Biosafety
18.2% 2
81.8% 9
26.7% 4
73.3% 11
Slight Increase
Consultative Group for Safety & OH
17.6% 3
82.4% 14
22.7% 5
77.3% 17
Slight Increase
Nominations 14.3% 1
85.7% 6
22.2% 2
77.8% 7
Slight Increase
ARSC 11.1% 1
88.9% 8
11.1% 1
88.9% 8
Same
Honorary Degree 11.1% 1
88.9% 8
38.5% 5
61.5% 8
Increase
Salaries 11.1% 1
88.9% 1.8
22.2% 2
77.8% 7
Increase
Military Education 10.0% 2
90.0% 18
10.0% 2
90.0% 18
Same
14
Safety & Occupational Health 8.3% 1
91.7% 11
23.1% 3
76.9% 10
Increase
Overall, although the situation remains similar, there have been some small positive changes. It is though not possible, without further analysis, to say what has been the cause of this change. In particular it is noted though that there has been a decrease in the number of women on Council this year. As the university changes structure this issue needs to remain high on the agenda so the university can capitalise on the changes and use it to encourage more women to participate. The emphasis so far has been on monitoring the gender balance of committees, but Council is asked to consider monitoring committees for black and minority ethnic and disability categories as well. If this is agreed it would entail a more formal monitoring system to be put in place.
6. International Women’s Day In June 2009 Debra Humphris, Pro Vice - Chancellor Education, sponsored a successful Women’s Day. The success of the day and the enthusiastic involvement of women in the programme of activities has prompted the PVC Education to continue with these activities and bring them together under the banner of International Women’s Day, which falls on 8th March every year. This year activities have been organised to cover the 8th and 9th March 2010. The PVC Education established a steering group of women from disciplines across the university to organise seminars and events covering key issues. Debra Humphris comments “The focus of Women’s Day this year is on networking, sharing common challenges, developing a mentoring programme and celebrating the successes and achievements of women in the university” In order to do achieve this, the following events have been organised:
1. “The Career Tightrope” a team building activity by WiSET (Women in Science, Engineering and Technology).
2. An event for levels 2-4 “Laughter, Lunch and Life Coaching”
3. HR work-life/flexible working seminar “The Balancing Act”
4. Student Involvement Workshop, organised by SUSU.
5. Mentoring Seminar.

15
6. Annual Women’s Dinner, “Inspire and be inspired”, with Sandy Toksvig
as keynote speaker. Bringing together events in this way helps not only to raise awareness but also consult people on their views and how the university should move forward on these issues. Many of the people who attend these events also become more proactive in getting involved with either their own development and or initiatives the university puts into place.
7. Women In Science, Engineering and Technology. The Athena SWAN Charter is a scheme which recognises excellence in Science, Engineering and Technology (SET) employment in higher education. The Charter was launched in June 2005. Any university or research institution which is committed to the advancement and promotion of the careers of women in SET in higher education and research can apply for membership. The beliefs underpinning the Charter are:
1. The advancement of science, engineering and technology (SET) is fundamental to quality of life across the globe.
2. It is vitally important that women are adequately represented in what has traditionally been, and is still, a male-dominated area.
3. Science cannot reach its full potential unless it can benefit from the talents of the whole population, and until women and men can benefit equally from the opportunities it affords.
The University of Southampton was one of the first to join the charter and submit for the bronze award. This bronze award was successfully maintained last year, as all awards have to be renewed on a three yearly basis. Further to this the University may submit for silver awards in 2011. Unlike the Bronze award, which is given on a university wide basis, silver awards are given on a school/departmental basis. To be successful at this level of award there has to be a significant step change demonstrated by real outcomes and activities by departments in their employment of women and intake of female students.
Tony Strike, University Secretary, is chairing a corporate steering group, with membership from WiSET, the Diversity Team, the Director of HR, Legal and once decided representatives from the relevant schools/departments, to address the position of women in the science, engineering and technology areas.
8. Action Learning Groups

16
Following discussion with the WiSET Group, and feedback from consultation with women on career progression issues, this year the Learning and Development Unit have re instated Action Learning Groups for women seeking to go for promotion in the near future. These activities have proved to be very successful in the past in encouraging women to apply successfully for promotion and to support each other. This year 18 women are involved in Action Learning Sets from the following schools:
2 x Primary Medical Care 3 x Geography 1 x Health Sciences 3 x Medicine 2 x Humanities 1 x Physics 1 x Economics 2 x Management 1 x Soc Stats 2 x Eng Sciences
Action Learning Sets will also be included in the staff development plan for 2011.
9. Home Working Policy In 2009 the HR committee approved a Home Working Policy to be piloted in different parts of the University before rolling it out. Such a policy will assist in supporting all individuals, male and female, to be able to work more flexibly and achieve an appropriate work life balance. The policy is currently being piloted in three divisions of the School of Medicine and the School of Social Sciences, as well as the HR department. The HR committee will receive an evaluation on the application of the policy in the summer before deciding the approach to be taken across the university.
10. Student Monitoring For the first time the University has a dedicated officer, based in Student Administration, who been able to pull together coherently diversity data for the student population. This will enable the university to benchmark the diversity of students in future years. This data is attached at appendix 1. The tables below summarise the current situation: The key points for the current year’s analysis are as follows:

17
The highest declaration of ethnicity is those of White background, followed by Chinese. The proportions of ethnicity in ESM and LASS faculties are relatively similar, but the MHLS faculty has a higher proportion of students from a White background. 8.13% of the undergraduate student population as at 1st December 2009 declared a disability. The % of students declaring a disability is highest in MHLS (10.06) and lowest in LASS (6.84%).
Overall there are more female undergraduate students than male (56.37% to 43.63%) with MHLS having the largest proportion of female students at 76.84%. However, in the ESM faculty this trend is significantly reversed with males comprising 70.41% of total students as at 1st December 2009.
Much like the trend in the undergraduate population, the highest declaration of ethnicity of postgraduate students is those of White background, followed by
18
Chinese. The proportions of ethnicity in ESM and LASS faculties are relatively similar, but the MHLS faculty has a much higher proportion of students from a White background. 6.29% of the postgraduate student population as at 1st December 2009 declared a disability. The % of postgraduate students declaring a disability does not vary significantly between faculties. Mirroring the trends in the undergraduate population, there are more female postgraduate students than male (54.76% to 45.24%) with MHLS having the largest proportion of female students at 76.99%. However, in the ESM faculty this trend is significantly reversed with males making up 68.08% of total students as at 1st December 2009.
11. Transitions Project Last years Annual Diversity Report identified the need for the university to take a more proactive approach to supporting the growing diversity of students in the university, and in particular international students. In order to take this forward a Transitions Project has been established.
Transition is defined as the period from when the student makes firm acceptance of a place on a programme of study to the end of the first semester (or six months after enrolment for PGR students). The University of Southampton Transitions Project was initiated in 2008 by the PVC Education to ensure that students are well supported through this period, with the Students’ Union also identifying transitional support for students as a priority theme in their five year plan in November 2009. The project is being funded until the end of the academic year 2013. Key themes for the project are:
• Supporting development of an integrated cohort of students regardless of country of origin. In year one the project will focus on enhancing the experience for international students and ensuring their particular needs are addressed, and in year two, broadening to a theme of integration of all students, maximising on the international university environment.
• Managing the delivery of information to students during the
transition period avoiding overload and confusion (especially during induction) but at the same time building their confidence so that they can rely on knowing what they need to know at any stage in order to manage their life and their learning.
• Supporting students as they start to live and learn independently
and extending that support to students who are making a further

19
transition to postgraduate study on a taught or research-based programme.
12. Staff Monitoring The Staff Monitoring Report is attached at Appendix 5. Overall the staff headcount figure for the University has decreased by 3% from 5321, as reported from last year, to 5154 this year. This monitoring report will be made available to all Schools and Professional Services to enable them to look at their individual profiles and see whether they need to address specific issues. The overall headlines on staff diversity are as follows:
Gender Overall the number of women in Level 1-3 roles is 1322 compared to 1303 last year, 1289 women are in Level 4-6 roles and at Level 7 the number is 74. Therefore there are 1363 women in Level 4-7 roles, which remains the same as last year. Women make up 52% of the overall workforce, which shows a very minor increase from last year when it was 51%. Overall the number of men in Levels 1-3 is 591, compared to 608 last year, 1573 men are in Level 4-6 roles and at Level 7 the number is 305 (last year the number of men in Level 4-7 roles was 1921 compared to 1878 this year). Men make up 48% of the overall workforce, which shows a very minor decrease from last year when it was 49%.
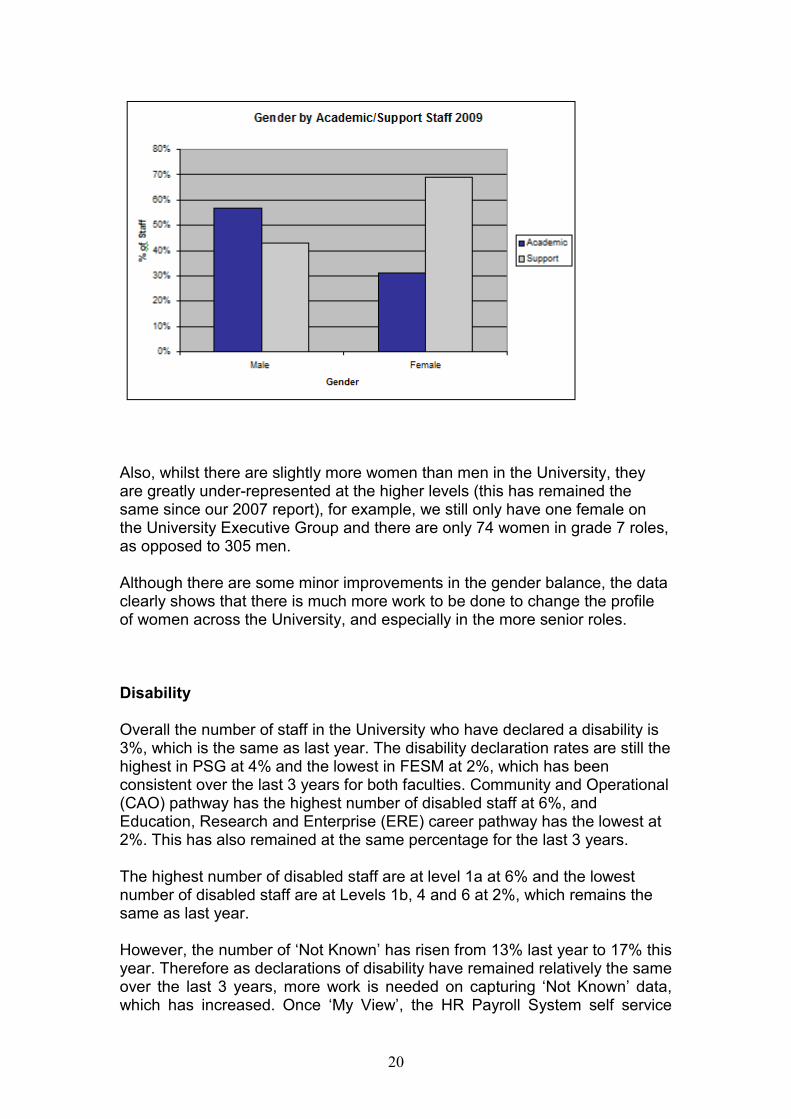
As the graph below shows, it can be seen that a higher proportion of women are still concentrated in support staff roles, and a higher proportion of men are in academic roles. This is evident in the gender split within career pathways, where Management, Specialist and Administrative (MSA) has the highest proportion of women at 73%, and Technical and Experimental (TAE) has the highest percentage of men at 64%.
20
Also, whilst there are slightly more women than men in the University, they are greatly under-represented at the higher levels (this has remained the same since our 2007 report), for example, we still only have one female on the University Executive Group and there are only 74 women in grade 7 roles, as opposed to 305 men. Although there are some minor improvements in the gender balance, the data clearly shows that there is much more work to be done to change the profile of women across the University, and especially in the more senior roles. Disability Overall the number of staff in the University who have declared a disability is 3%, which is the same as last year. The disability declaration rates are still the highest in PSG at 4% and the lowest in FESM at 2%, which has been consistent over the last 3 years for both faculties. Community and Operational (CAO) pathway has the highest number of disabled staff at 6%, and Education, Research and Enterprise (ERE) career pathway has the lowest at 2%. This has also remained at the same percentage for the last 3 years. The highest number of disabled staff are at level 1a at 6% and the lowest number of disabled staff are at Levels 1b, 4 and 6 at 2%, which remains the same as last year. However, the number of ‘Not Known’ has risen from 13% last year to 17% this year. Therefore as declarations of disability have remained relatively the same over the last 3 years, more work is needed on capturing ‘Not Known’ data, which has increased. Once ‘My View’, the HR Payroll System self service

21
facility, has been further developed to capture equal opportunity data, it will allow staff to inform us of any new disabilities or changes in health on an ongoing basis. This facility will be launched in April 2010.
Ethnicity The known number of black and minority ethnic (bme) staff this year is 9%, which has increased over the last 3 years, from 6% in 2007 and 7% in 2008. One of the reasons for this may be the increased level of declaration. The percentage of staff with an unknown ethnicity category has decreased from 23% in 2008 to 21% this year. The unknown category for staff ethnicity remains the highest in PSG for the third year, although it has decreased from 26% last year to 24% this year. The known numbers of bme staff only make up 12% of all academic staff, whereas 68% are from the declared white ethnic category. However, this is an increase from last year when declared bme staff was 9% and the declared white ethnic category was 65%. There has also been a slight increase since last year for support staff as declared bme staff was 5% but is now 6%, and the declared white ethnic category was 71% but is now 73%. CAO career pathway has the highest percentage of declared bme staff at 13%, closely followed by ERE pathway at 11%. This shows a slight increase from last year when both career pathways were 10%. TAE and MSA both remain the lowest career pathways with declared bme staff for the third year running.
Although we have a low number of bme staff at the University (9%), out of the total number of declared bme staff (449), the highest percentage work in Level 4 jobs and the lowest percentage work in Level 1b jobs. Therefore declared bme staff in the University are predominantly in the middle grade Levels. However we still need to look at why only 4% of staff at grade 7 are from the a declared bme category and how the University can attract a more ethnically diverse workforce. Age The age profile of University staff has remained relatively consistent over the past 3 years. 41% of our staff are aged between 30-44 and 48% of these people are based in FESM. The biggest change has been for staff aged 65+ as it remained at 6% in 2007 and 2008, but has now dropped to 4% this year. This may be related to the default retirement age remaining in place. PSG has the highest percentage of 16-29 year olds at 18% since 2007. There has been a slight percentage change in the Faculty with the most staff aged 65+, as LASS currently has 5%, but in 2007 and 2008 both FESM and MHLS had a slightly higher percentage than the other Faculties.
22
Just under half of the University’s academic staff (48%) is concentrated in the 30-44 age bracket, which is very similar to last year when it was 49%. 3% of staff aged 65+ are academics, which has increased over the last 2 years when it was 1%. The highest proportion of staff in ERE, MSA and TAE career pathways are aged between 30-44 which was has remained consistent for the last 3 years. The highest proportion of staff in the CAO career pathway are aged 45-59, which again has remained the same over the last 3 years. Age and grade level shows that the highest percentage of staff aged between 45-59 (62%) are working at grade 7. In terms of career development, it can be seen that there has been no-one aged 16-29 at a grade 6 and 7 over the last 3 years.
13. Equal Pay Update Work on Equal Pay continues to be taken forward by the HR Reward Team, who are currently leading 12 key projects looking at potential equal pay issues within the University. A full summary of the projects is provided at appendix 3.
Progress of these projects is monitored on a quarterly basis by the Joint TU/Management Equal Pay Monitoring Group. Progress in each of these project areas was presented to HRC in July and November 2009 and is summarised below:
Potential Glass Ceiling
Female staff, while having a slight majority (52%) over the whole
University, are greatly underrepresented at the higher levels.
Pay Protection
Pay protection policy to form part of Reward Strategy being developed
in 2010.
Payment of Additional Increments
Analysis currently underway.
Use of the HRZ
This is to address inconsistency in application of the criteria across
schools/services has developed since the pay review in 2004.
Career Pathways for Administrative Staff
Exploring recommendations for a central communication point for all
qualification, training and work experience pathways, a policy on study
leave and setting up mentor/coaching groups.

23
Level 7 Pay
Level 7 pay has for the first time been included within Equal Pay
analysis. 2009 equal pay report due for release in spring 2010.
Pay Gaps
The latest pay gap data will be released in the 2010 Equal Pay audit
update, based on the situation in 2009.
Starting Salaries
There is no central guidance currently available to managers on
agreeing starting salaries. (This is being developed)
Grading of Temp Bank Posts
To bring into line with overall university polices.
Terms and Conditions
There are still actions outstanding from 2004 pay agreement, regarding
harmonisation for level 1-3.
Transparency
Work is underway to improve transparency of processes.
Reward Strategy
Including pay structure issues and timetable for strategy.
14. Dignity at Work and Study Policy The new Dignity at Work and Study Policy was endorsed by Council in July 2009. Over the last year and a half there have been 3 cases of Harassment reported for the period October 2008 to September 2009, and 1 case for the period September 2009 to the present. A key aspect of the new policy was to initiate a more preventative approach to conflict resolution in the university, and for this to be achieved in a number of different ways. One by recruiting more Harassment Contacts who can advice people at different stages of conflict and refer people onto mediation if necessary. In 2009 the Diversity Team undertook a recruitment drive for Harassment Contacts. The response was very positive with over 30 people showing an interest in the area and 15 undertaking training to become contacts in the future. The university mediation scheme is also now being utilised by a growing number of people across the university, including students and staff. University mediators are now fully accredited. 10 mediations have been completed to end of 2009 with a success rate of around 80%. There is a however a continuing need to promote the availability of the scheme, and we

24
may need to train new mediators over the next couple of years to replace any turnover, as some staff leave the organisation. Professor Nick Foskett will be holding an evaluation meeting in early summer 2010, inviting all those who were involved consultations leading to the development of the new policy.
15. Equality Impact Assessments (EIAs) Steady progress is being made on developing a culture of undertaking Equality Impact Assessments across the university. In 2009 an awareness raising event was organised for the university’s Diversity Champions, some of whom have discussed at their school level and are in the process of doing EIAs Diversity Champions have had conversations in their respective areas in order to identify issues for assessment. The School of Education has already undertaken an impact assessment on ‘The impact of specific interventions to support the retention and recruitment of Black and Ethnic Minority students (BME) on the PGCE secondary course at the University of Southampton’ HR also continues to carry out EIAs on relevant areas, including the impact of structural changes to the diversity of staff. A meeting has been organised with Trade Unions to work together on how these EIAs can be improved in the future. A question on whether people are undertaking EIAs on new policies has been included in the pro forma for committee report. However it remains to be seen how effectively this will be used. The Diversity Manager continues to provide guidance and support to those undertaking EIAs across the university. Recently a briefing was provided to the Student Services management team. Student Services are one of the more proactive parts of the university in this area.
16. Reasonable Adjustment Guide A comprehensive Guide on Reasonable Adjustments was launched in November 2009. This corporate guide was developed following research which showed that very few people with management responsibilities either for students or staff understood the issue of reasonable adjustments. The guide is comprehensive covering issues from the legislative background and responsibilities to examples of good practice.

25
The Diversity Team arranged a seminar on this issue, with external and internal speakers. The seminar was very well attended, with 60 people participating on the day. Overall the guide has been very well received.
17. Conclusion As this years’ Annual Diversity Report shows much effort is going into achieving a more equitable, fairer, inclusive and diverse culture in the University. If this effort and commitment, from across the university is to produce sustainable and real change, the diversity and equality agenda has to be mainstreamed into the overall strategy and commitment of the university. As feedback from the focus groups, in the context, of the Single Equality Scheme shows a huge difference is made by proactive and clear leadership from the top to shape people’s perceptions of how much importance is attached to this work. Sustaining and improving this as the University enters a new phase of its history is crucial to future success.
Council are asked to consider the following recommendations for implementation over the next year:
1. Discuss and agree how diversity representation can be improved on
Council.
2. Endorse formal monitoring of gender, race/ethnicity and disability on all
committees.
3. Endorse the inclusion of a responsibility to implement equality and
diversity in the job descriptions for new Deans and associate Deans,
currently being recruited.
4. Endorse the inclusion of equality and diversity as part of the
performance and review of all UEG members.
5. Endorse the appointment of a new University Diversity Champion.
6. Approve the Annual Diversity Report 2009/10.


Please see the cover sheet for more information about the figures below, including details about the criteria and restrictions applied to the data.
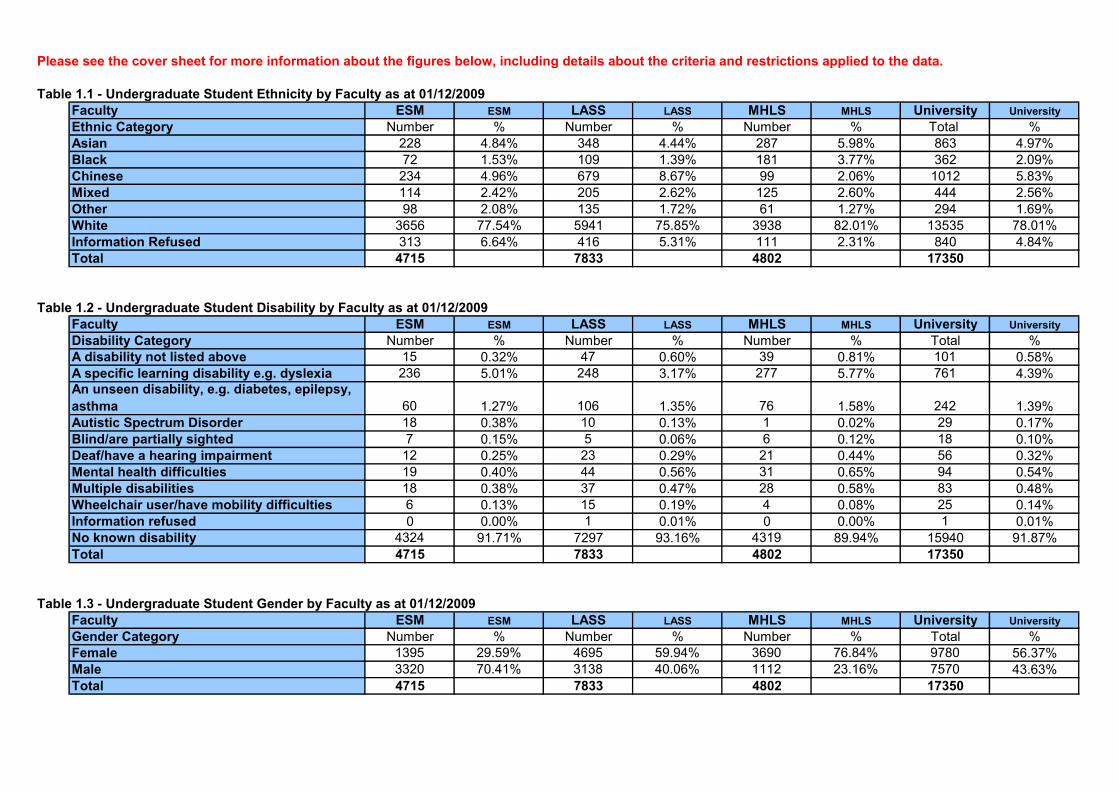
Table 1.1 - Undergraduate Student Ethnicity by Faculty as at 01/12/2009
Faculty ESM ESM LASS LASS MHLS MHLS University University
Ethnic Category Number % Number % Number % Total %
Asian 228 4.84% 348 4.44% 287 5.98% 863 4.97%
Black 72 1.53% 109 1.39% 181 3.77% 362 2.09%
Chinese 234 4.96% 679 8.67% 99 2.06% 1012 5.83%
Mixed 114 2.42% 205 2.62% 125 2.60% 444 2.56%
Other 98 2.08% 135 1.72% 61 1.27% 294 1.69%
White 3656 77.54% 5941 75.85% 3938 82.01% 13535 78.01%
Information Refused 313 6.64% 416 5.31% 111 2.31% 840 4.84%
Total 4715 7833 4802 17350
Table 1.2 - Undergraduate Student Disability by Faculty as at 01/12/2009
Faculty ESM ESM LASS LASS MHLS MHLS University University
Disability Category Number % Number % Number % Total %
A disability not listed above 15 0.32% 47 0.60% 39 0.81% 101 0.58%
A specific learning disability e.g. dyslexia 236 5.01% 248 3.17% 277 5.77% 761 4.39%
An unseen disability, e.g. diabetes, epilepsy,
asthma 60 1.27% 106 1.35% 76 1.58% 242 1.39%
Autistic Spectrum Disorder 18 0.38% 10 0.13% 1 0.02% 29 0.17%
Blind/are partially sighted 7 0.15% 5 0.06% 6 0.12% 18 0.10%
Deaf/have a hearing impairment 12 0.25% 23 0.29% 21 0.44% 56 0.32%
Mental health difficulties 19 0.40% 44 0.56% 31 0.65% 94 0.54%
Multiple disabilities 18 0.38% 37 0.47% 28 0.58% 83 0.48%
Wheelchair user/have mobility difficulties 6 0.13% 15 0.19% 4 0.08% 25 0.14%
Information refused 0 0.00% 1 0.01% 0 0.00% 1 0.01%
No known disability 4324 91.71% 7297 93.16% 4319 89.94% 15940 91.87%
Total 4715 7833 4802 17350
Table 1.3 - Undergraduate Student Gender by Faculty as at 01/12/2009
Faculty ESM ESM LASS LASS MHLS MHLS University University
Gender Category Number % Number % Number % Total %
Female 1395 29.59% 4695 59.94% 3690 76.84% 9780 56.37%
Male 3320 70.41% 3138 40.06% 1112 23.16% 7570 43.63%
Total 4715 7833 4802 17350
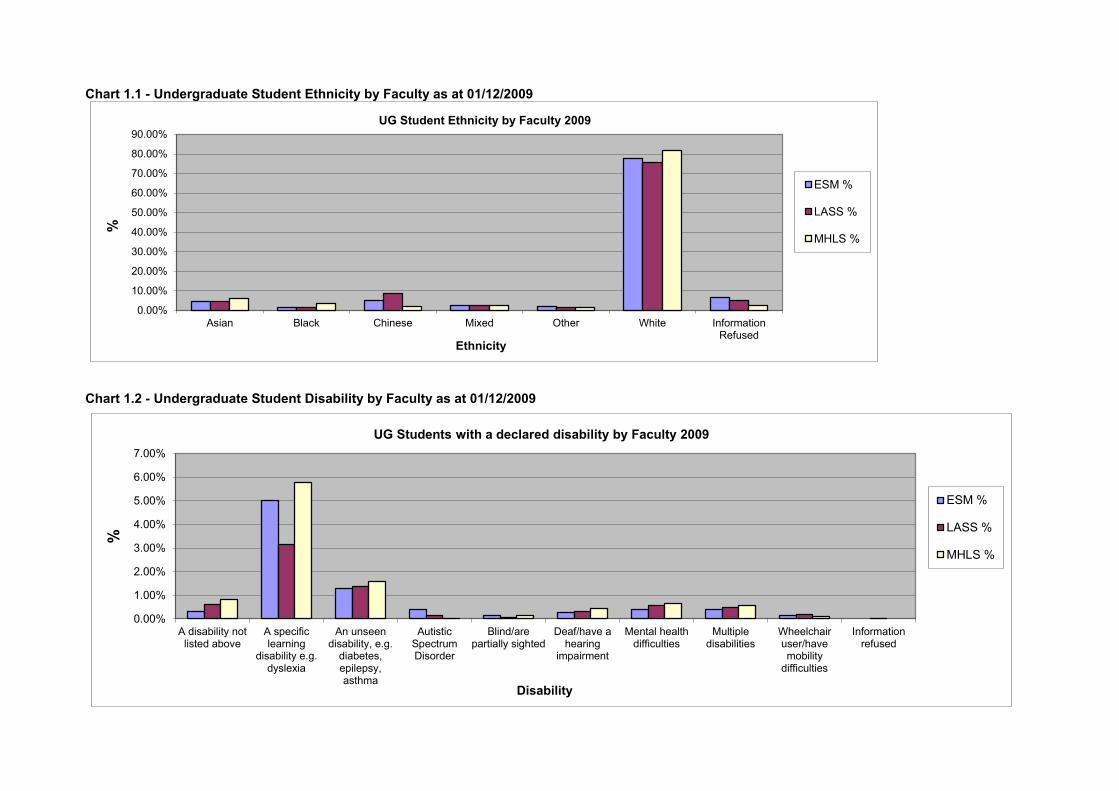
Chart 1.1 - Undergraduate Student Ethnicity by Faculty as at 01/12/2009
Chart 1.2 - Undergraduate Student Disability by Faculty as at 01/12/2009
0.00%
10.00%
20.00%
30.00%
40.00%
50.00%
60.00%
70.00%
80.00%
90.00%
Asian Black Chinese Mixed Other White InformationRefused
%
Ethnicity
UG Student Ethnicity by Faculty 2009
ESM %
LASS %
MHLS %
0.00%
1.00%
2.00%
3.00%
4.00%
5.00%
6.00%
7.00%
A disability notlisted above
A specificlearning
disability e.g.dyslexia
An unseendisability, e.g.
diabetes,epilepsy,asthma
AutisticSpectrumDisorder
Blind/arepartially sighted
Deaf/have ahearing
impairment
Mental healthdifficulties
Multipledisabilities
Wheelchairuser/havemobility
difficulties
Informationrefused
%
Disability
UG Students with a declared disability by Faculty 2009
ESM %
LASS %
MHLS %
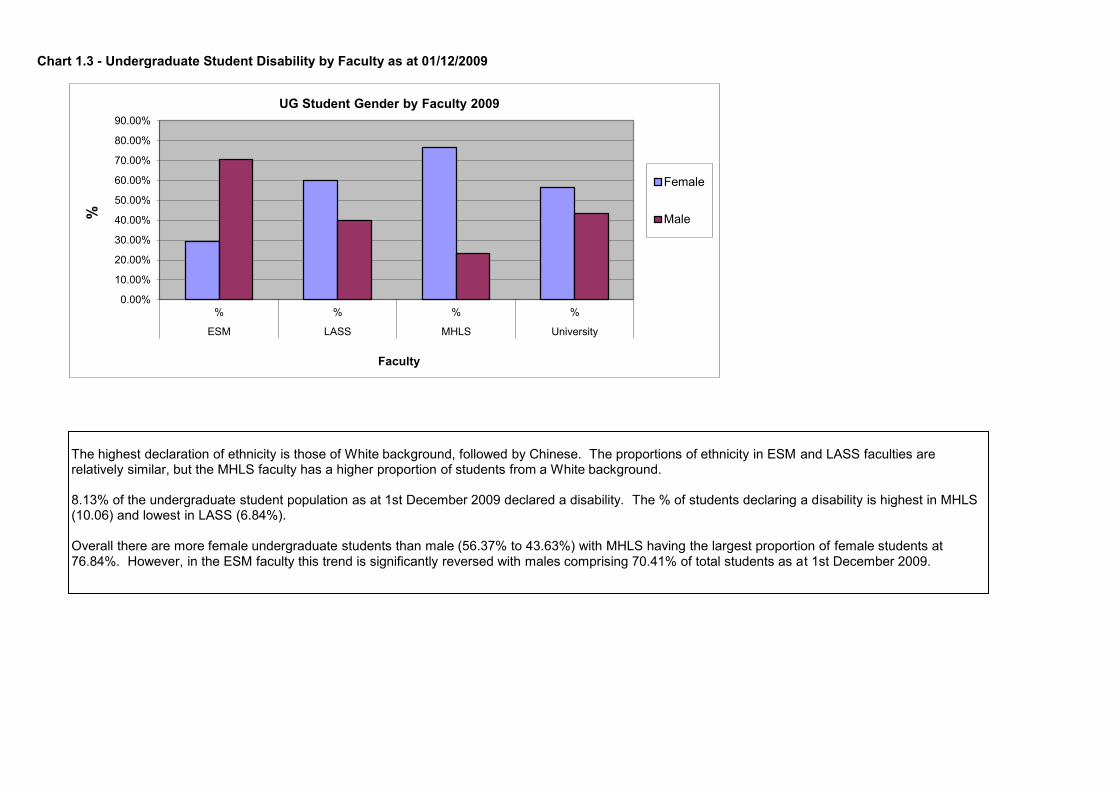
Chart 1.3 - Undergraduate Student Disability by Faculty as at 01/12/2009
The highest declaration of ethnicity is those of White background, followed by Chinese. The proportions of ethnicity in ESM and LASS faculties are relatively similar, but the MHLS faculty has a higher proportion of students from a White background. 8.13% of the undergraduate student population as at 1st December 2009 declared a disability. The % of students declaring a disability is highest in MHLS (10.06) and lowest in LASS (6.84%). Overall there are more female undergraduate students than male (56.37% to 43.63%) with MHLS having the largest proportion of female students at 76.84%. However, in the ESM faculty this trend is significantly reversed with males comprising 70.41% of total students as at 1st December 2009.
0.00%
10.00%
20.00%
30.00%
40.00%
50.00%
60.00%
70.00%
80.00%
90.00%
% % % %
ESM LASS MHLS University
%
Faculty
UG Student Gender by Faculty 2009
Female
Male
Please see the cover sheet for more information about the figures below, including details about the criteria and restrictions applied to the data.
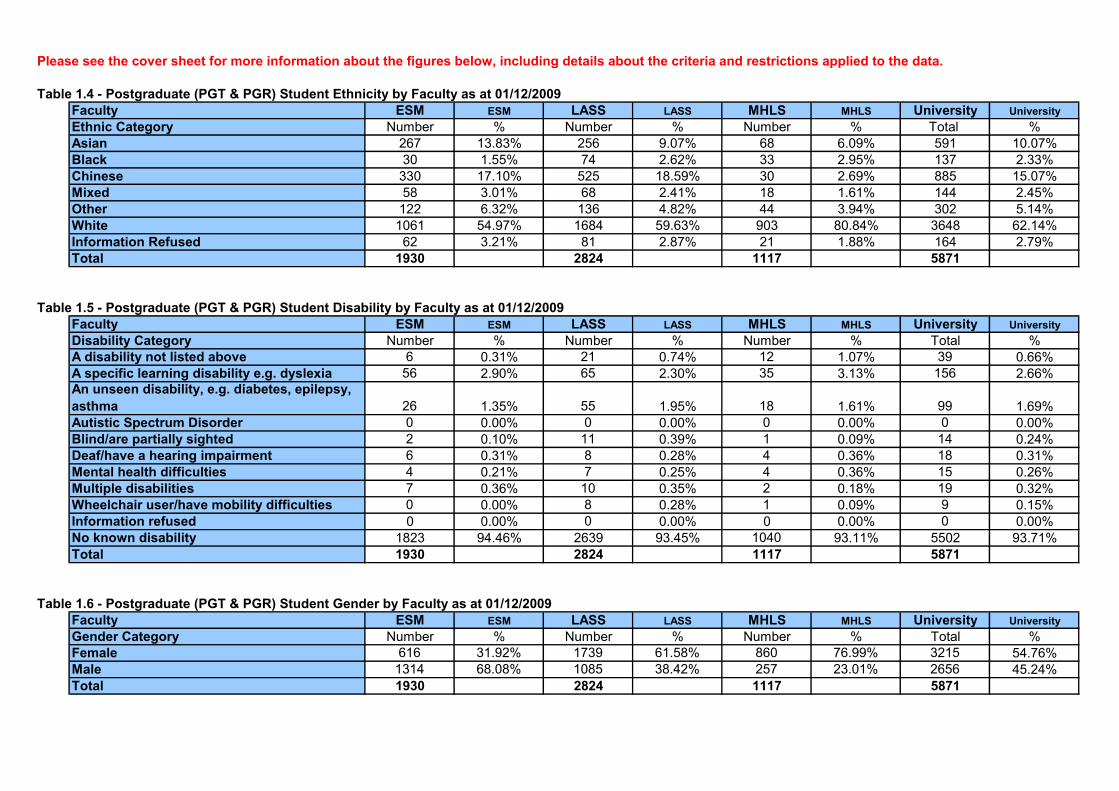
Table 1.4 - Postgraduate (PGT & PGR) Student Ethnicity by Faculty as at 01/12/2009
Faculty ESM ESM LASS LASS MHLS MHLS University University
Ethnic Category Number % Number % Number % Total %
Asian 267 13.83% 256 9.07% 68 6.09% 591 10.07%
Black 30 1.55% 74 2.62% 33 2.95% 137 2.33%
Chinese 330 17.10% 525 18.59% 30 2.69% 885 15.07%
Mixed 58 3.01% 68 2.41% 18 1.61% 144 2.45%
Other 122 6.32% 136 4.82% 44 3.94% 302 5.14%
White 1061 54.97% 1684 59.63% 903 80.84% 3648 62.14%
Information Refused 62 3.21% 81 2.87% 21 1.88% 164 2.79%
Total 1930 2824 1117 5871
Table 1.5 - Postgraduate (PGT & PGR) Student Disability by Faculty as at 01/12/2009
Faculty ESM ESM LASS LASS MHLS MHLS University University
Disability Category Number % Number % Number % Total %
A disability not listed above 6 0.31% 21 0.74% 12 1.07% 39 0.66%
A specific learning disability e.g. dyslexia 56 2.90% 65 2.30% 35 3.13% 156 2.66%
An unseen disability, e.g. diabetes, epilepsy,
asthma 26 1.35% 55 1.95% 18 1.61% 99 1.69%
Autistic Spectrum Disorder 0 0.00% 0 0.00% 0 0.00% 0 0.00%
Blind/are partially sighted 2 0.10% 11 0.39% 1 0.09% 14 0.24%
Deaf/have a hearing impairment 6 0.31% 8 0.28% 4 0.36% 18 0.31%
Mental health difficulties 4 0.21% 7 0.25% 4 0.36% 15 0.26%
Multiple disabilities 7 0.36% 10 0.35% 2 0.18% 19 0.32%
Wheelchair user/have mobility difficulties 0 0.00% 8 0.28% 1 0.09% 9 0.15%
Information refused 0 0.00% 0 0.00% 0 0.00% 0 0.00%
No known disability 1823 94.46% 2639 93.45% 1040 93.11% 5502 93.71%
Total 1930 2824 1117 5871
Table 1.6 - Postgraduate (PGT & PGR) Student Gender by Faculty as at 01/12/2009
Faculty ESM ESM LASS LASS MHLS MHLS University University
Gender Category Number % Number % Number % Total %
Female 616 31.92% 1739 61.58% 860 76.99% 3215 54.76%
Male 1314 68.08% 1085 38.42% 257 23.01% 2656 45.24%
Total 1930 2824 1117 5871
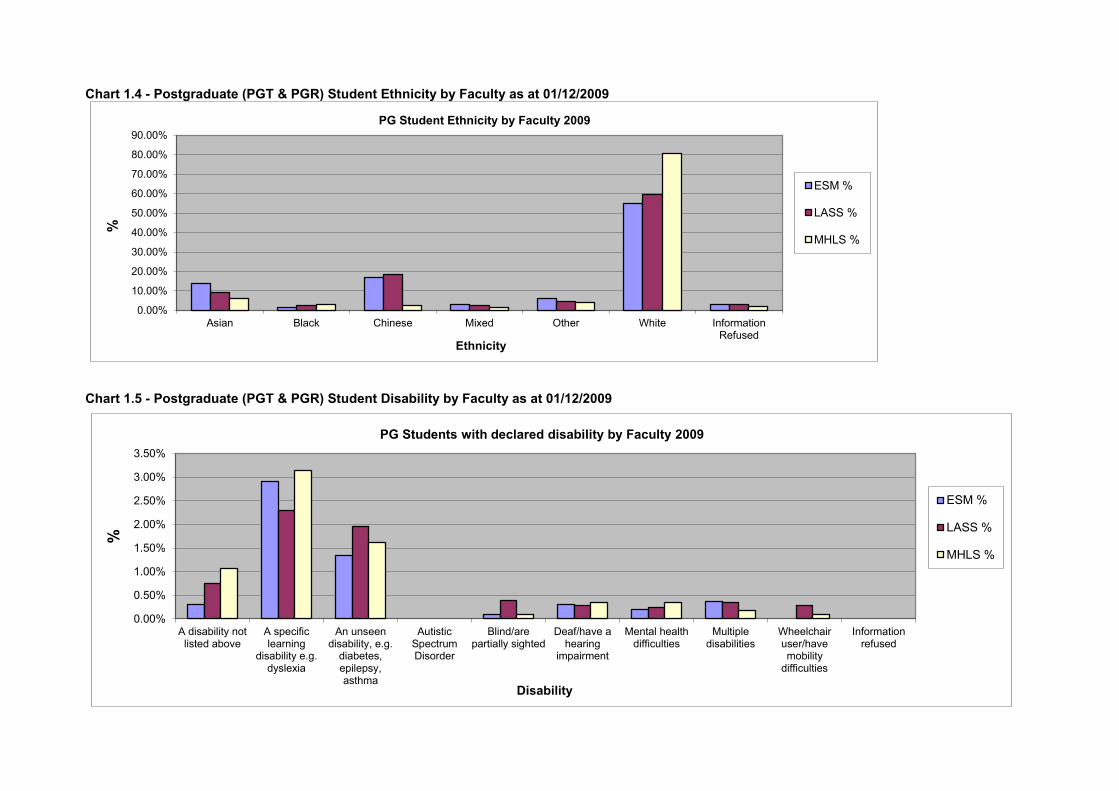
Chart 1.4 - Postgraduate (PGT & PGR) Student Ethnicity by Faculty as at 01/12/2009
Chart 1.5 - Postgraduate (PGT & PGR) Student Disability by Faculty as at 01/12/2009
0.00%
10.00%
20.00%
30.00%
40.00%
50.00%
60.00%
70.00%
80.00%
90.00%
Asian Black Chinese Mixed Other White InformationRefused
%
Ethnicity
PG Student Ethnicity by Faculty 2009
ESM %
LASS %
MHLS %
0.00%
0.50%
1.00%
1.50%
2.00%
2.50%
3.00%
3.50%
A disability notlisted above
A specificlearning
disability e.g.dyslexia
An unseendisability, e.g.
diabetes,epilepsy,asthma
AutisticSpectrumDisorder
Blind/arepartially sighted
Deaf/have ahearing
impairment
Mental healthdifficulties
Multipledisabilities
Wheelchairuser/havemobility
difficulties
Informationrefused
%
Disability
PG Students with declared disability by Faculty 2009
ESM %
LASS %
MHLS %

Chart 1.6 - Postgraduate (PGT & PGR) Student Disability by Faculty as at 01/12/2009
The highest declaration of ethnicity is those of White background, followed by Chinese. The proportions of ethnicity in ESM and LASS faculties are relatively similar, but the MHLS faculty has a higher proportion of students from a White background.
8.13% of the undergraduate student population as at 1st December 2009 declared a disability. The % of students declaring a disability is highest in MHLS (10.06) and lowest in LASS (6.84%).
Overall there are more female undergraduate students than male (56.37% to 43.63%) with MHLS having the largest proportion of female students at 76.84%. However, in the ESM faculty this trend is significantly reversed with males comprising 70.41% of total students as at 1st December 2009.
Much like the trend in the undergraduate population, the highest declaration of ethnicity of postgraduate students is those of White background, followed by Chinese. The proportions of ethnicity in ESM and LASS faculties are relatively similar, but the MHLS faculty has a much higher proportion of students from a White background. 6.29% of the postgraduate student population as at 1st December 2009 declared a disability. The % of postgraduate students declaring a disability does not vary significantly between faculties. Mirroring the trends in the undergraduate population, there are more female postgraduate students than male (54.76% to 45.24%) with MHLS having the largest proportion of female students at 76.99%. However, in the ESM faculty this trend is significantly reversed with males making up 68.08% of total students as at 1st December 2009.

The highest declaration of ethnicity is those of White background, followed by Chinese. The proportions of ethnicity in ESM and LASS faculties are relatively similar, but the MHLS faculty has a higher proportion of students from a White background.
8.13% of the undergraduate student population as at 1st December 2009 declared a disability. The % of students declaring a disability is highest in MHLS (10.06) and lowest in LASS (6.84%).
Overall there are more female undergraduate students than male (56.37% to 43.63%) with MHLS having the largest proportion of female students at 76.84%. However, in the ESM faculty this trend is significantly reversed with males comprising 70.41% of total students as at 1st December 2009.
0.00%
10.00%
20.00%
30.00%
40.00%
50.00%
60.00%
70.00%
80.00%
90.00%
% % % %
ESM LASS MHLS University
%
Faculty
Student Gender by Faculty 2009
Female
Male

Please see the cover sheet for more information about the figures below, including details about the criteria and restrictions applied to the data.
Table 2.1 - Undergraduate Student Ethnicity by Academic School as at 01/12/2009
Faculty SchoolName Asian % Black % Chinese % Mixed % Other % White %Information
Refused% Total
ESM Faculty of Engineering, Science and Mathematics 5 0.6% 6 1.7% 3 0.3% 5 1.1% 5 1.7% 82 0.6% 61 7.3% 167
ESM Institute of Sound and Vibration Research 6 0.7% 1 0.3% 2 0.2% 4 0.9% 2 0.7% 135 1.0% 6 0.7% 156
ESM School of Chemistry 13 1.5% 1 0.3% 17 1.7% 8 1.8% 1 0.3% 260 1.9% 9 1.1% 309
ESM School of Civil Engineering and the Environment 18 2.1% 7 1.9% 19 1.9% 8 1.8% 13 4.4% 393 2.9% 25 3.0% 483
ESM School of Electronics and Computer Science 47 5.4% 28 7.7% 58 5.7% 19 4.3% 26 8.8% 529 3.9% 76 9.0% 783
ESM School of Engineering Sciences 60 7.0% 9 2.5% 28 2.8% 24 5.4% 28 9.5% 541 4.0% 58 6.9% 748
ESM School of Geography 1 0.1% 5 1.4% 5 0.5% 6 1.4% 1 0.3% 493 3.6% 5 0.6% 516
ESM School of Mathematics 65 7.5% 14 3.9% 99 9.8% 15 3.4% 18 6.1% 354 2.6% 43 5.1% 608
ESM School of Ocean and Earth Science 3 0.3% 1 0.3% 2 0.2% 10 2.3% 3 1.0% 538 4.0% 17 2.0% 574
ESM School of Physics and Astronomy 10 1.2% 0 0.0% 1 0.1% 15 3.4% 1 0.3% 331 2.4% 13 1.5% 371
LASS Faculty of Law, Arts and Social Sciences 1 0.1% 0 0.0% 9 0.9% 1 0.2% 4 1.4% 9 0.1% 8 1.0% 32
LASS School of Art 28 3.2% 9 2.5% 63 6.2% 30 6.8% 6 2.0% 718 5.3% 51 6.1% 905
LASS School of Education 8 0.9% 4 1.1% 3 0.3% 10 2.3% 6 2.0% 666 4.9% 15 1.8% 712
LASS School of Humanities 146 16.9% 29 8.0% 359 35.5% 98 22.1% 71 24.1% 2813 20.8% 189 22.5% 3705
LASS School of Law 34 3.9% 19 5.2% 39 3.9% 17 3.8% 19 6.5% 376 2.8% 34 4.0% 538
LASS School of Management 32 3.7% 11 3.0% 71 7.0% 7 1.6% 12 4.1% 321 2.4% 50 6.0% 504
LASS School of Social Sciences 99 11.5% 37 10.2% 135 13.3% 42 9.5% 17 5.8% 1038 7.7% 69 8.2% 1437
MHLS Health Care Innovation Unit 4 0.5% 11 3.0% 2 0.2% 2 0.5% 2 0.7% 103 0.8% 1 0.1% 125
MHLS School of Biological Sciences 47 5.4% 26 7.2% 16 1.6% 22 5.0% 8 2.7% 521 3.8% 24 2.9% 664
MHLS School of Health Professions and Rehabilitation Sciences 12 1.4% 7 1.9% 12 1.2% 10 2.3% 1 0.3% 377 2.8% 7 0.8% 426
MHLS School of Medicine 189 21.9% 61 16.9% 49 4.8% 45 10.1% 43 14.6% 816 6.0% 50 6.0% 1253
MHLS School of Nursing and Midwifery 28 3.2% 70 19.3% 9 0.9% 26 5.9% 7 2.4% 1726 12.8% 21 2.5% 1887
MHLS School of Psychology 7 0.8% 6 1.7% 11 1.1% 20 4.5% 0 0.0% 395 2.9% 8 1.0% 447
Total 863 362 1012 444 294 13535 840 17350
Table 2.2 - Postgraduate (PGT & PGR) Student Ethnicity by Academic School as at 01/12/2009
Faculty SchoolName Asian % Black % Chinese % Mixed % Other % White %Information
Refused% Total
ESM Institute of Sound and Vibration Research 20 3.4% 1 0.7% 15 1.7% 5 3.5% 10 3.3% 99 2.7% 4 2.4% 154
ESM Optoelectronics Research Centre 9 1.5% 1 0.7% 13 1.5% 1 0.7% 4 1.3% 30 0.8% 3 1.8% 61
ESM School of Chemistry 6 1.0% 3 2.2% 4 0.5% 3 2.1% 6 2.0% 117 3.2% 3 1.8% 142
ESM School of Civil Engineering and the Environment 30 5.1% 3 2.2% 27 3.1% 7 4.9% 16 5.3% 179 4.9% 7 4.3% 269
ESM School of Electronics and Computer Science 129 21.8% 8 5.8% 181 20.5% 9 6.3% 45 14.9% 147 4.0% 22 13.4% 541
ESM School of Engineering Sciences 44 7.4% 4 2.9% 52 5.9% 10 6.9% 18 6.0% 159 4.4% 7 4.3% 294
ESM School of Geography 8 1.4% 5 3.6% 5 0.6% 3 2.1% 7 2.3% 59 1.6% 2 1.2% 89
ESM School of Mathematics 9 1.5% 3 2.2% 25 2.8% 9 6.3% 9 3.0% 60 1.6% 5 3.0% 120
ESM School of Ocean and Earth Science 12 2.0% 2 1.5% 8 0.9% 7 4.9% 6 2.0% 155 4.2% 4 2.4% 194
ESM School of Physics and Astronomy 0 0.0% 0 0.0% 0 0.0% 4 2.8% 1 0.3% 56 1.5% 5 3.0% 66
LASS School of Art 47 8.0% 4 2.9% 121 13.7% 0 0.0% 17 5.6% 44 1.2% 5 3.0% 238
LASS School of Education 25 4.2% 16 11.7% 17 1.9% 19 13.2% 11 3.6% 729 20.0% 25 15.2% 842
LASS School of Humanities 20 3.4% 3 2.2% 26 2.9% 19 13.2% 40 13.2% 367 10.1% 15 9.1% 490
LASS School of Law 14 2.4% 4 2.9% 25 2.8% 1 0.7% 10 3.3% 58 1.6% 3 1.8% 115
LASS School of Management 116 19.6% 25 18.2% 279 31.5% 17 11.8% 41 13.6% 202 5.5% 22 13.4% 702
LASS School of Social Sciences 34 5.8% 22 16.1% 57 6.4% 12 8.3% 17 5.6% 284 7.8% 11 6.7% 437
MHLS School of Biological Sciences 4 0.7% 2 1.5% 4 0.5% 3 2.1% 3 1.0% 41 1.1% 2 1.2% 59
MHLS School of Health Professions and Rehabilitation Sciences 5 0.8% 2 1.5% 10 1.1% 2 1.4% 6 2.0% 122 3.3% 4 2.4% 151
MHLS School of Medicine 27 4.6% 10 7.3% 6 0.7% 3 2.1% 18 6.0% 148 4.1% 6 3.7% 218
MHLS School of Nursing and Midwifery 24 4.1% 18 13.1% 6 0.7% 6 4.2% 13 4.3% 379 10.4% 7 4.3% 453
MHLS School of Psychology 8 1.4% 1 0.7% 4 0.5% 4 2.8% 4 1.3% 213 5.8% 2 1.2% 236
Total 591 137 885 144 302 3648 164 5871
Please see the cover sheet for more information about the figures below, including details about the criteria and restrictions applied to the data.
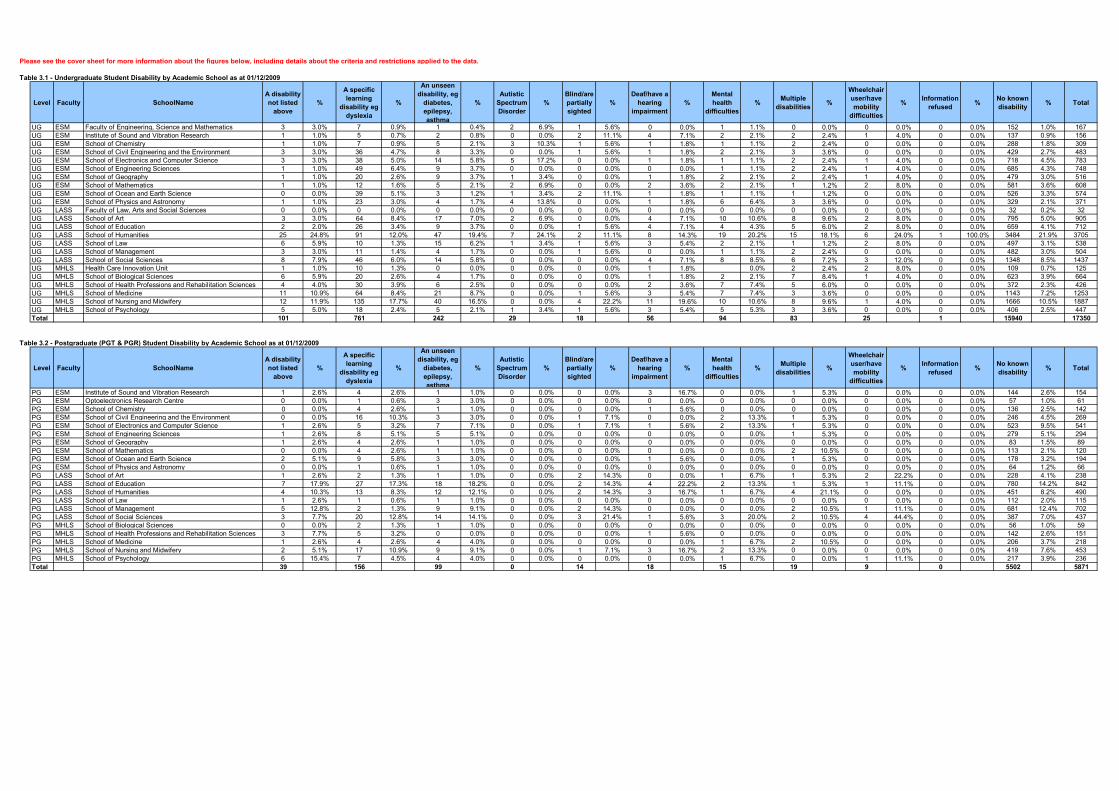
Table 3.1 - Undergraduate Student Disability by Academic School as at 01/12/2009
Level Faculty SchoolName
A disability
not listed
above
%
A specific
learning
disability eg
dyslexia
%
An unseen
disability, eg
diabetes,
epilepsy,
asthma
%
Autistic
Spectrum
Disorder
%
Blind/are
partially
sighted
%
Deaf/have a
hearing
impairment
%
Mental
health
difficulties
%Multiple
disabilities%
Wheelchair
user/have
mobility
difficulties
%Information
refused%
No known
disability% Total
UG ESM Faculty of Engineering, Science and Mathematics 3 3.0% 7 0.9% 1 0.4% 2 6.9% 1 5.6% 0 0.0% 1 1.1% 0 0.0% 0 0.0% 0 0.0% 152 1.0% 167
UG ESM Institute of Sound and Vibration Research 1 1.0% 5 0.7% 2 0.8% 0 0.0% 2 11.1% 4 7.1% 2 2.1% 2 2.4% 1 4.0% 0 0.0% 137 0.9% 156
UG ESM School of Chemistry 1 1.0% 7 0.9% 5 2.1% 3 10.3% 1 5.6% 1 1.8% 1 1.1% 2 2.4% 0 0.0% 0 0.0% 288 1.8% 309
UG ESM School of Civil Engineering and the Environment 3 3.0% 36 4.7% 8 3.3% 0 0.0% 1 5.6% 1 1.8% 2 2.1% 3 3.6% 0 0.0% 0 0.0% 429 2.7% 483
UG ESM School of Electronics and Computer Science 3 3.0% 38 5.0% 14 5.8% 5 17.2% 0 0.0% 1 1.8% 1 1.1% 2 2.4% 1 4.0% 0 0.0% 718 4.5% 783
UG ESM School of Engineering Sciences 1 1.0% 49 6.4% 9 3.7% 0 0.0% 0 0.0% 0 0.0% 1 1.1% 2 2.4% 1 4.0% 0 0.0% 685 4.3% 748
UG ESM School of Geography 1 1.0% 20 2.6% 9 3.7% 1 3.4% 0 0.0% 1 1.8% 2 2.1% 2 2.4% 1 4.0% 0 0.0% 479 3.0% 516
UG ESM School of Mathematics 1 1.0% 12 1.6% 5 2.1% 2 6.9% 0 0.0% 2 3.6% 2 2.1% 1 1.2% 2 8.0% 0 0.0% 581 3.6% 608
UG ESM School of Ocean and Earth Science 0 0.0% 39 5.1% 3 1.2% 1 3.4% 2 11.1% 1 1.8% 1 1.1% 1 1.2% 0 0.0% 0 0.0% 526 3.3% 574
UG ESM School of Physics and Astronomy 1 1.0% 23 3.0% 4 1.7% 4 13.8% 0 0.0% 1 1.8% 6 6.4% 3 3.6% 0 0.0% 0 0.0% 329 2.1% 371
UG LASS Faculty of Law, Arts and Social Sciences 0 0.0% 0 0.0% 0 0.0% 0 0.0% 0 0.0% 0 0.0% 0 0.0% 0 0.0% 0 0.0% 0 0.0% 32 0.2% 32
UG LASS School of Art 3 3.0% 64 8.4% 17 7.0% 2 6.9% 0 0.0% 4 7.1% 10 10.6% 8 9.6% 2 8.0% 0 0.0% 795 5.0% 905
UG LASS School of Education 2 2.0% 26 3.4% 9 3.7% 0 0.0% 1 5.6% 4 7.1% 4 4.3% 5 6.0% 2 8.0% 0 0.0% 659 4.1% 712
UG LASS School of Humanities 25 24.8% 91 12.0% 47 19.4% 7 24.1% 2 11.1% 8 14.3% 19 20.2% 15 18.1% 6 24.0% 1 100.0% 3484 21.9% 3705
UG LASS School of Law 6 5.9% 10 1.3% 15 6.2% 1 3.4% 1 5.6% 3 5.4% 2 2.1% 1 1.2% 2 8.0% 0 0.0% 497 3.1% 538
UG LASS School of Management 3 3.0% 11 1.4% 4 1.7% 0 0.0% 1 5.6% 0 0.0% 1 1.1% 2 2.4% 0 0.0% 0 0.0% 482 3.0% 504
UG LASS School of Social Sciences 8 7.9% 46 6.0% 14 5.8% 0 0.0% 0 0.0% 4 7.1% 8 8.5% 6 7.2% 3 12.0% 0 0.0% 1348 8.5% 1437
UG MHLS Health Care Innovation Unit 1 1.0% 10 1.3% 0 0.0% 0 0.0% 0 0.0% 1 1.8% 0.0% 2 2.4% 2 8.0% 0 0.0% 109 0.7% 125
UG MHLS School of Biological Sciences 6 5.9% 20 2.6% 4 1.7% 0 0.0% 0 0.0% 1 1.8% 2 2.1% 7 8.4% 1 4.0% 0 0.0% 623 3.9% 664
UG MHLS School of Health Professions and Rehabilitation Sciences 4 4.0% 30 3.9% 6 2.5% 0 0.0% 0 0.0% 2 3.6% 7 7.4% 5 6.0% 0 0.0% 0 0.0% 372 2.3% 426
UG MHLS School of Medicine 11 10.9% 64 8.4% 21 8.7% 0 0.0% 1 5.6% 3 5.4% 7 7.4% 3 3.6% 0 0.0% 0 0.0% 1143 7.2% 1253
UG MHLS School of Nursing and Midwifery 12 11.9% 135 17.7% 40 16.5% 0 0.0% 4 22.2% 11 19.6% 10 10.6% 8 9.6% 1 4.0% 0 0.0% 1666 10.5% 1887
UG MHLS School of Psychology 5 5.0% 18 2.4% 5 2.1% 1 3.4% 1 5.6% 3 5.4% 5 5.3% 3 3.6% 0 0.0% 0 0.0% 406 2.5% 447
Total 101 761 242 29 18 56 94 83 25 1 15940 17350
Table 3.2 - Postgraduate (PGT & PGR) Student Disability by Academic School as at 01/12/2009
Level Faculty SchoolName
A disability
not listed
above
%
A specific
learning
disability eg
dyslexia
%
An unseen
disability, eg
diabetes,
epilepsy,
asthma
%
Autistic
Spectrum
Disorder
%
Blind/are
partially
sighted
%
Deaf/have a
hearing
impairment
%
Mental
health
difficulties
%Multiple
disabilities%
Wheelchair
user/have
mobility
difficulties
%Information
refused%
No known
disability% Total
PG ESM Institute of Sound and Vibration Research 1 2.6% 4 2.6% 1 1.0% 0 0.0% 0 0.0% 3 16.7% 0 0.0% 1 5.3% 0 0.0% 0 0.0% 144 2.6% 154
PG ESM Optoelectronics Research Centre 0 0.0% 1 0.6% 3 3.0% 0 0.0% 0 0.0% 0 0.0% 0 0.0% 0 0.0% 0 0.0% 0 0.0% 57 1.0% 61
PG ESM School of Chemistry 0 0.0% 4 2.6% 1 1.0% 0 0.0% 0 0.0% 1 5.6% 0 0.0% 0 0.0% 0 0.0% 0 0.0% 136 2.5% 142
PG ESM School of Civil Engineering and the Environment 0 0.0% 16 10.3% 3 3.0% 0 0.0% 1 7.1% 0 0.0% 2 13.3% 1 5.3% 0 0.0% 0 0.0% 246 4.5% 269
PG ESM School of Electronics and Computer Science 1 2.6% 5 3.2% 7 7.1% 0 0.0% 1 7.1% 1 5.6% 2 13.3% 1 5.3% 0 0.0% 0 0.0% 523 9.5% 541
PG ESM School of Engineering Sciences 1 2.6% 8 5.1% 5 5.1% 0 0.0% 0 0.0% 0 0.0% 0 0.0% 1 5.3% 0 0.0% 0 0.0% 279 5.1% 294
PG ESM School of Geography 1 2.6% 4 2.6% 1 1.0% 0 0.0% 0 0.0% 0 0.0% 0 0.0% 0 0.0% 0 0.0% 0 0.0% 83 1.5% 89
PG ESM School of Mathematics 0 0.0% 4 2.6% 1 1.0% 0 0.0% 0 0.0% 0 0.0% 0 0.0% 2 10.5% 0 0.0% 0 0.0% 113 2.1% 120
PG ESM School of Ocean and Earth Science 2 5.1% 9 5.8% 3 3.0% 0 0.0% 0 0.0% 1 5.6% 0 0.0% 1 5.3% 0 0.0% 0 0.0% 178 3.2% 194
PG ESM School of Physics and Astronomy 0 0.0% 1 0.6% 1 1.0% 0 0.0% 0 0.0% 0 0.0% 0 0.0% 0 0.0% 0 0.0% 0 0.0% 64 1.2% 66
PG LASS School of Art 1 2.6% 2 1.3% 1 1.0% 0 0.0% 2 14.3% 0 0.0% 1 6.7% 1 5.3% 2 22.2% 0 0.0% 228 4.1% 238
PG LASS School of Education 7 17.9% 27 17.3% 18 18.2% 0 0.0% 2 14.3% 4 22.2% 2 13.3% 1 5.3% 1 11.1% 0 0.0% 780 14.2% 842
PG LASS School of Humanities 4 10.3% 13 8.3% 12 12.1% 0 0.0% 2 14.3% 3 16.7% 1 6.7% 4 21.1% 0 0.0% 0 0.0% 451 8.2% 490
PG LASS School of Law 1 2.6% 1 0.6% 1 1.0% 0 0.0% 0 0.0% 0 0.0% 0 0.0% 0 0.0% 0 0.0% 0 0.0% 112 2.0% 115
PG LASS School of Management 5 12.8% 2 1.3% 9 9.1% 0 0.0% 2 14.3% 0 0.0% 0 0.0% 2 10.5% 1 11.1% 0 0.0% 681 12.4% 702
PG LASS School of Social Sciences 3 7.7% 20 12.8% 14 14.1% 0 0.0% 3 21.4% 1 5.6% 3 20.0% 2 10.5% 4 44.4% 0 0.0% 387 7.0% 437
PG MHLS School of Biological Sciences 0 0.0% 2 1.3% 1 1.0% 0 0.0% 0 0.0% 0 0.0% 0 0.0% 0 0.0% 0 0.0% 0 0.0% 56 1.0% 59
PG MHLS School of Health Professions and Rehabilitation Sciences 3 7.7% 5 3.2% 0 0.0% 0 0.0% 0 0.0% 1 5.6% 0 0.0% 0 0.0% 0 0.0% 0 0.0% 142 2.6% 151
PG MHLS School of Medicine 1 2.6% 4 2.6% 4 4.0% 0 0.0% 0 0.0% 0 0.0% 1 6.7% 2 10.5% 0 0.0% 0 0.0% 206 3.7% 218
PG MHLS School of Nursing and Midwifery 2 5.1% 17 10.9% 9 9.1% 0 0.0% 1 7.1% 3 16.7% 2 13.3% 0 0.0% 0 0.0% 0 0.0% 419 7.6% 453
PG MHLS School of Psychology 6 15.4% 7 4.5% 4 4.0% 0 0.0% 0 0.0% 0 0.0% 1 6.7% 0 0.0% 1 11.1% 0 0.0% 217 3.9% 236
Total 39 156 99 0 14 18 15 19 9 0 5502 5871

Please see the cover sheet for more information about the figures below, including details about the criteria and restrictions applied to the data.
Table 4.1 - Undergraduate Student Gender by Academic School as at 01/12/2009
Level Faculty SchoolName F % M % Total
UG ESM Faculty of Engineering, Science and Mathematics 27 0.3% 140 1.8% 167
UG ESM Institute of Sound and Vibration Research 71 0.7% 85 1.1% 156
UG ESM School of Chemistry 115 1.2% 194 2.6% 309
UG ESM School of Civil Engineering and the Environment 178 1.8% 305 4.0% 483
UG ESM School of Electronics and Computer Science 96 1.0% 687 9.1% 783
UG ESM School of Engineering Sciences 85 0.9% 663 8.8% 748
UG ESM School of Geography 282 2.9% 234 3.1% 516
UG ESM School of Mathematics 253 2.6% 355 4.7% 608
UG ESM School of Ocean and Earth Science 227 2.3% 347 4.6% 574
UG ESM School of Physics and Astronomy 61 0.6% 310 4.1% 371
UG LASS Faculty of Law, Arts and Social Sciences 21 0.2% 11 0.1% 32
UG LASS School of Art 704 7.2% 201 2.7% 905
UG LASS School of Education 443 4.5% 269 3.6% 712
UG LASS School of Humanities 2191 22.4% 1514 20.0% 3705
UG LASS School of Law 319 3.3% 219 2.9% 538
UG LASS School of Management 231 2.4% 273 3.6% 504
UG LASS School of Social Sciences 786 8.0% 651 8.6% 1437
UG MHLS Health Care Innovation Unit 111 1.1% 14 0.2% 125
UG MHLS School of Biological Sciences 414 4.2% 250 3.3% 664
UG MHLS School of Health Professions and Rehabilitation Sciences 371 3.8% 55 0.7% 426
UG MHLS School of Medicine 715 7.3% 538 7.1% 1253
UG MHLS School of Nursing and Midwifery 1704 17.4% 183 2.4% 1887
UG MHLS School of Psychology 375 3.8% 72 1.0% 447
Total 9780 7570 17350
Table 4.2 - Postgraduate (PGT & PGR) Student Gender by Academic School as at 01/12/2009
Level Faculty SchoolName F % M % Total
PG ESM Institute of Sound and Vibration Research 58 1.8% 96 3.6% 154
PG ESM Optoelectronics Research Centre 12 0.4% 49 1.8% 61
PG ESM School of Chemistry 56 1.7% 86 3.2% 142
PG ESM School of Civil Engineering and the Environment 98 3.0% 171 6.4% 269
PG ESM School of Electronics and Computer Science 112 3.5% 429 16.2% 541
PG ESM School of Engineering Sciences 55 1.7% 239 9.0% 294
PG ESM School of Geography 34 1.1% 55 2.1% 89
PG ESM School of Mathematics 56 1.7% 64 2.4% 120
PG ESM School of Ocean and Earth Science 116 3.6% 78 2.9% 194
PG ESM School of Physics and Astronomy 19 0.6% 47 1.8% 66
PG LASS School of Art 195 6.1% 43 1.6% 238
PG LASS School of Education 539 16.8% 303 11.4% 842
PG LASS School of Humanities 300 9.3% 190 7.2% 490
PG LASS School of Law 68 2.1% 47 1.8% 115
PG LASS School of Management 371 11.5% 331 12.5% 702
PG LASS School of Social Sciences 266 8.3% 171 6.4% 437
PG MHLS School of Biological Sciences 31 1.0% 28 1.1% 59
PG MHLS School of Health Professions and Rehabilitation Sciences 103 3.2% 48 1.8% 151
PG MHLS School of Medicine 137 4.3% 81 3.0% 218
PG MHLS School of Nursing and Midwifery 389 12.1% 64 2.4% 453
PG MHLS School of Psychology 200 6.2% 36 1.4% 236
Total 3215 2656 5871
Please see the cover sheet for more information about the figures below, including details about the criteria and restrictions applied to the data.
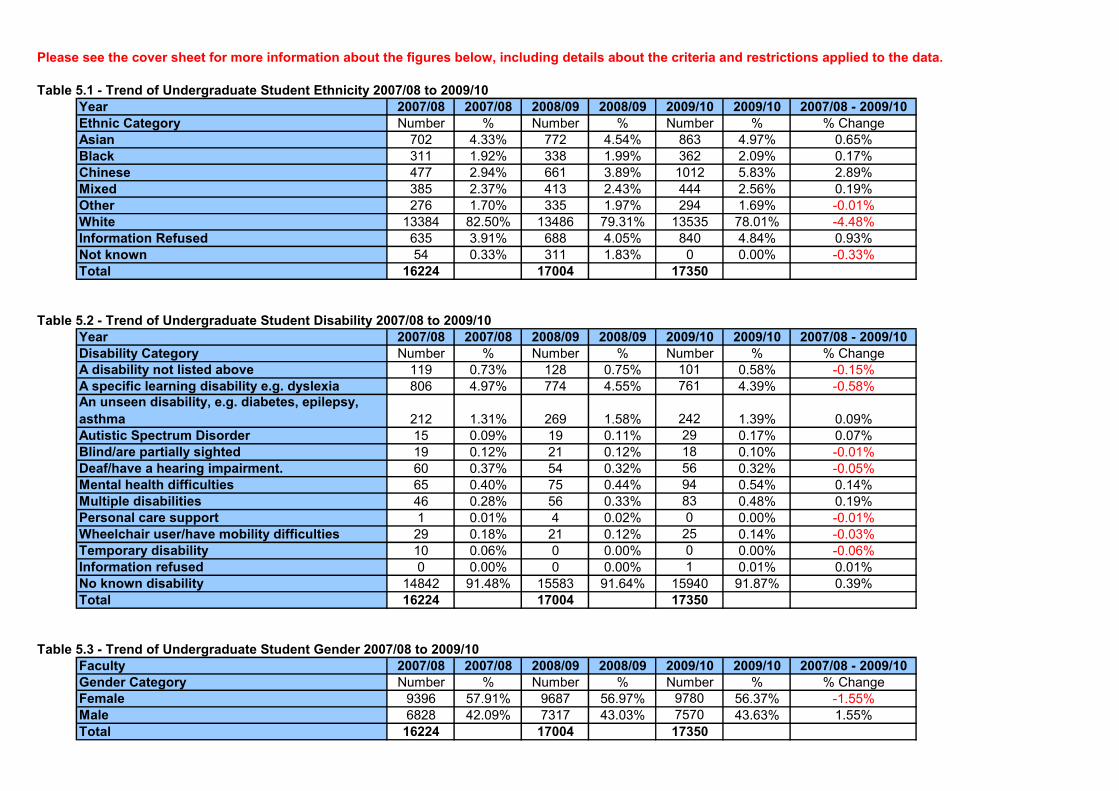
Table 5.1 - Trend of Undergraduate Student Ethnicity 2007/08 to 2009/10
Year 2007/08 2007/08 2008/09 2008/09 2009/10 2009/10 2007/08 - 2009/10
Ethnic Category Number % Number % Number % % Change
Asian 702 4.33% 772 4.54% 863 4.97% 0.65%
Black 311 1.92% 338 1.99% 362 2.09% 0.17%
Chinese 477 2.94% 661 3.89% 1012 5.83% 2.89%
Mixed 385 2.37% 413 2.43% 444 2.56% 0.19%
Other 276 1.70% 335 1.97% 294 1.69% -0.01%
White 13384 82.50% 13486 79.31% 13535 78.01% -4.48%
Information Refused 635 3.91% 688 4.05% 840 4.84% 0.93%
Not known 54 0.33% 311 1.83% 0 0.00% -0.33%
Total 16224 17004 17350
Table 5.2 - Trend of Undergraduate Student Disability 2007/08 to 2009/10
Year 2007/08 2007/08 2008/09 2008/09 2009/10 2009/10 2007/08 - 2009/10
Disability Category Number % Number % Number % % Change
A disability not listed above 119 0.73% 128 0.75% 101 0.58% -0.15%
A specific learning disability e.g. dyslexia 806 4.97% 774 4.55% 761 4.39% -0.58%
An unseen disability, e.g. diabetes, epilepsy,
asthma 212 1.31% 269 1.58% 242 1.39% 0.09%
Autistic Spectrum Disorder 15 0.09% 19 0.11% 29 0.17% 0.07%
Blind/are partially sighted 19 0.12% 21 0.12% 18 0.10% -0.01%
Deaf/have a hearing impairment. 60 0.37% 54 0.32% 56 0.32% -0.05%
Mental health difficulties 65 0.40% 75 0.44% 94 0.54% 0.14%
Multiple disabilities 46 0.28% 56 0.33% 83 0.48% 0.19%
Personal care support 1 0.01% 4 0.02% 0 0.00% -0.01%
Wheelchair user/have mobility difficulties 29 0.18% 21 0.12% 25 0.14% -0.03%
Temporary disability 10 0.06% 0 0.00% 0 0.00% -0.06%
Information refused 0 0.00% 0 0.00% 1 0.01% 0.01%
No known disability 14842 91.48% 15583 91.64% 15940 91.87% 0.39%
Total 16224 17004 17350
Table 5.3 - Trend of Undergraduate Student Gender 2007/08 to 2009/10
Faculty 2007/08 2007/08 2008/09 2008/09 2009/10 2009/10 2007/08 - 2009/10
Gender Category Number % Number % Number % % Change
Female 9396 57.91% 9687 56.97% 9780 56.37% -1.55%
Male 6828 42.09% 7317 43.03% 7570 43.63% 1.55%
Total 16224 17004 17350
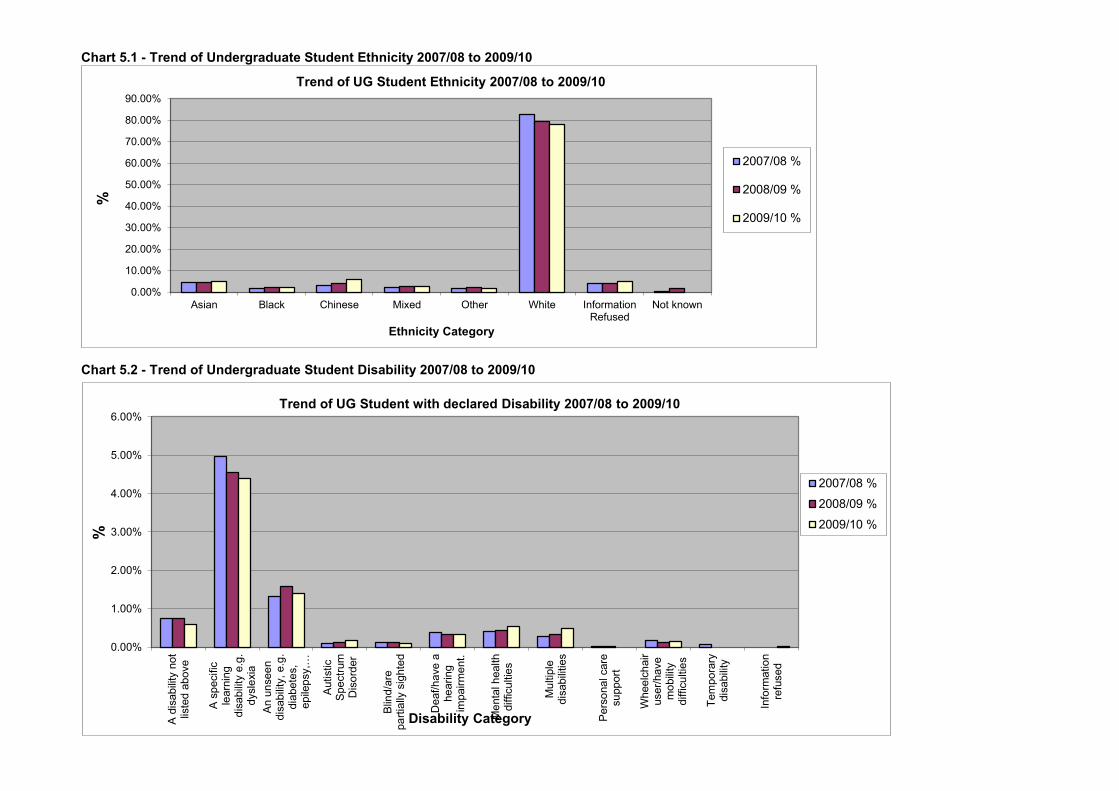
Chart 5.1 - Trend of Undergraduate Student Ethnicity 2007/08 to 2009/10
Chart 5.2 - Trend of Undergraduate Student Disability 2007/08 to 2009/10
0.00%
10.00%
20.00%
30.00%
40.00%
50.00%
60.00%
70.00%
80.00%
90.00%
Asian Black Chinese Mixed Other White InformationRefused
Not known
%
Ethnicity Category
Trend of UG Student Ethnicity 2007/08 to 2009/10
2007/08 %
2008/09 %
2009/10 %
0.00%
1.00%
2.00%
3.00%
4.00%
5.00%
6.00%
A d
isabili
ty n
ot
liste
d a
bove
A s
pecific
learn
ing
dis
abili
ty e
.g.
dysle
xia
An u
nsee
ndis
abili
ty, e.g
.dia
bete
s,
epilepsy,…
Autistic
Spectr
um
Dis
ord
er
Blin
d/a
repa
rtia
lly s
ighte
d
Deaf/h
ave a
he
aring
impairm
ent.
Me
nta
l h
ealth
difficu
ltie
s
Mu
ltip
ledis
abili
ties
Pers
onal care
su
pport
Whee
lch
air
user/
have
mo
bili
tydifficu
ltie
s
Tem
pora
rydis
abili
ty
Info
rmatio
nre
fused
%
Disability Category
Trend of UG Student with declared Disability 2007/08 to 2009/10
2007/08 %
2008/09 %
2009/10 %

Chart 5.3 - Trend of Undergraduate Student Gender 2007/08 to 2009/10
30.00%
40.00%
50.00%
60.00%
% % %
2007/08 2008/09 2009/10
%
Year
Trend of UG Student Gender 2007/08 to 2009/10
Female
Male

Please see the cover sheet for more information about the figures below, including details about the criteria and restrictions applied to the data.
Table 5.4 - Trend of Postgraduate (PGT & PGR) Student Ethnicity 2007/08 to 2009/10
Year 2007/08 2007/08 2008/09 2008/09 2009/10 2009/10 2007/08 - 2009/10
Ethnic Category Number % Number % Number % % Change
Asian 448 9.18% 523 9.82% 591 10.07% 0.89%
Black 128 2.62% 134 2.52% 137 2.33% -0.29%
Chinese 548 11.23% 780 14.65% 885 15.07% 3.85%
Mixed 121 2.48% 126 2.37% 144 2.45% -0.03%
Other 186 3.81% 254 4.77% 302 5.14% 1.33%
White 3321 68.04% 3360 63.11% 3648 62.14% -5.90%
Information Refused 121 2.48% 145 2.72% 0 0.00% -2.48%
Not known 8 0.16% 2 0.04% 164 2.79% 2.63%
Total 4881 5324 5871
Table 5.5 - Trend of Postgraduate (PGT & PGR) Student Disability 2007/08 to 2009/10
Year 2007/08 2007/08 2008/09 2008/09 2009/10 2009/10 2007/08 - 2009/10
Disability Category Number % Number % Number % % Change
A disability not listed above 25 0.51% 34 0.64% 39 0.66% 0.15%
A specific learning disability e.g. dyslexia 133 2.72% 144 2.70% 156 2.66% -0.07%
An unseen disability, e.g. diabetes, epilepsy,
asthma 90 1.84% 99 1.86% 99 1.69% -0.16%
Autistic Spectrum Disorder 0 0.00% 0 0.00% 0 0.00% 0.00%
Blind/are partially sighted 5 0.10% 12 0.23% 14 0.24% 0.14%
Deaf/have a hearing impairment. 17 0.35% 22 0.41% 18 0.31% -0.04%
Mental health difficulties 17 0.35% 20 0.38% 15 0.26% -0.09%
Multiple disabilities 18 0.37% 13 0.24% 19 0.32% -0.05%
Personal care support 0 0.00% 0 0.00% 0 0.00% 0.00%
Wheelchair user/have mobility difficulties 12 0.25% 15 0.28% 9 0.15% -0.09%
Temporary disability 3 0.06% 0 0.00% 0 0.00% -0.06%
Information refused 0 0.00% 0 0.00% 0 0.00% 0.00%
No known disability 4561 93.44% 4965 93.26% 5502 93.71% 0.27%
Total 4881 5324 5871
Table 5.6 - Trend of Postgraduate (PGT & PGR) Student Gender 2007/08 to 2009/10
Faculty 2007/08 2007/08 2008/09 2008/09 2009/10 2009/10 2007/08 - 2009/10
Gender Category Number % Number % Number % % Change
Female 2723 55.79% 2891 54.30% 3215 54.76% -1.03%
Male 2158 44.21% 2433 45.70% 2656 45.24% 1.03%
Total 4881 5324 5871

Chart 5.4 - Trend of Postgraduate (PGT & PGR) Student Ethnicity 2007/08 to 2009/10
Chart 5.5 - Trend of Postgraduate (PGT & PGR) Student Disability 2007/08 to 2009/10
0.00%
10.00%
20.00%
30.00%
40.00%
50.00%
60.00%
70.00%
80.00%
Asian Black Chinese Mixed Other White InformationRefused
Not known
%
Ethnicity Category
Trend of PG Student Ethnicity 2007/08 to 2009/10
2007/08 %
2008/09 %
2009/10 %
0.00%
0.50%
1.00%
1.50%
2.00%
2.50%
3.00%
A d
isabili
ty n
ot
liste
d a
bove
A s
pecific
learn
ing
dis
abili
ty e
.g.
dysle
xia
An u
nsee
ndis
abili
ty, e.g
.dia
bete
s,
epilepsy,…
Autistic
Spectr
um
Dis
ord
er
Blin
d/a
repa
rtia
lly s
ighte
d
Deaf/h
ave a
he
aring
impairm
ent.
Me
nta
l h
ealth
difficu
ltie
s
Mu
ltip
ledis
abili
ties
Pers
onal care
su
pport
Whee
lch
air
user/
have
mo
bili
tydifficu
ltie
s
Tem
pora
rydis
abili
ty
Info
rmatio
nre
fused
%
Disability Category
Trend of PG Student with declared Disability 2007/08 to 2009/10
2007/08 %
2008/09 %
2009/10 %
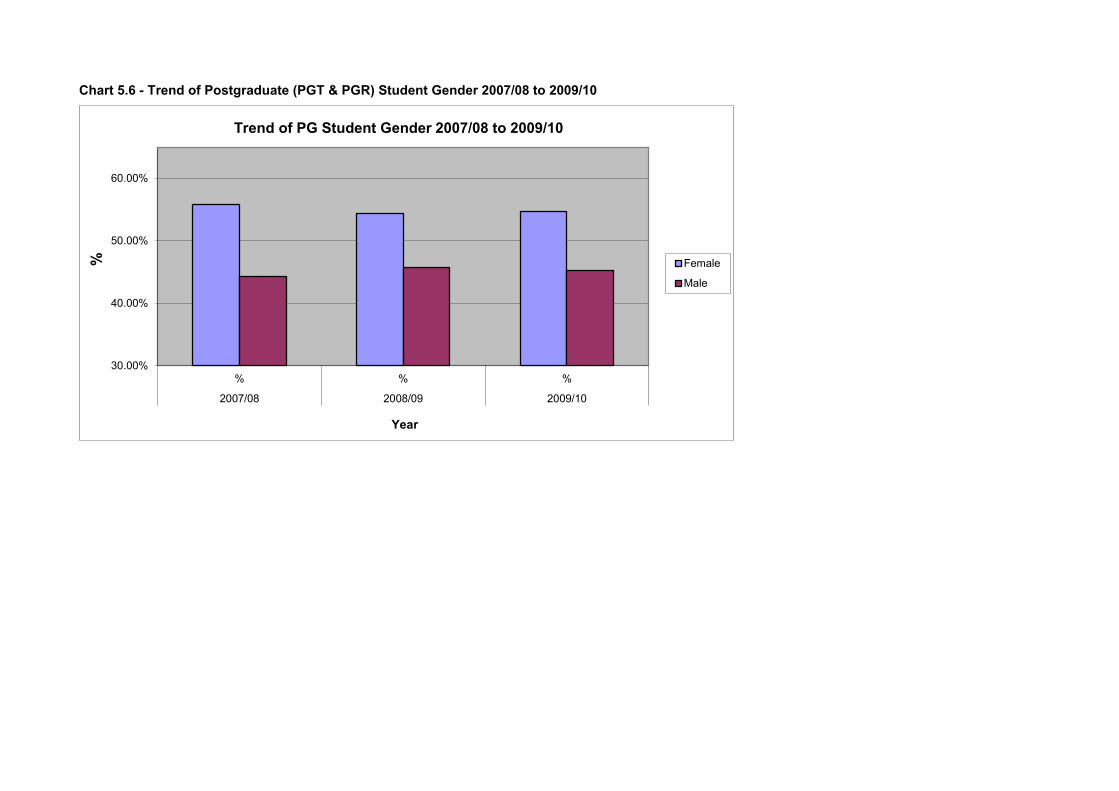
Chart 5.6 - Trend of Postgraduate (PGT & PGR) Student Gender 2007/08 to 2009/10
30.00%
40.00%
50.00%
60.00%
% % %
2007/08 2008/09 2009/10
%
Year
Trend of PG Student Gender 2007/08 to 2009/10
Female
Male
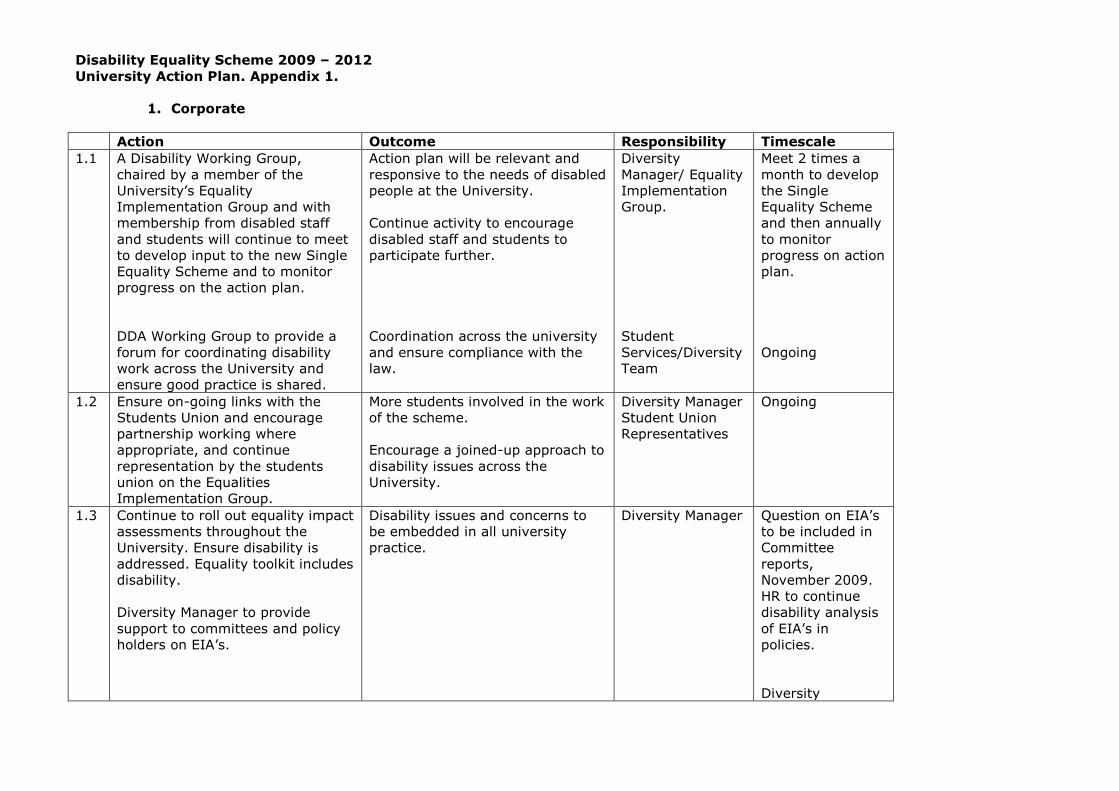
Disability Equality Scheme 2009 – 2012
University Action Plan. Appendix 1.
1. Corporate
Action Outcome Responsibility Timescale
1.1 A Disability Working Group,
chaired by a member of the
University’s Equality
Implementation Group and with
membership from disabled staff
and students will continue to meet
to develop input to the new Single
Equality Scheme and to monitor
progress on the action plan.
DDA Working Group to provide a
forum for coordinating disability
work across the University and
ensure good practice is shared.
Action plan will be relevant and
responsive to the needs of disabled
people at the University.
Continue activity to encourage
disabled staff and students to
participate further.
Coordination across the university
and ensure compliance with the
law.
Diversity
Manager/ Equality
Implementation
Group.
Student
Services/Diversity
Team
Meet 2 times a
month to develop
the Single
Equality Scheme
and then annually
to monitor
progress on action
plan.
Ongoing
1.2 Ensure on-going links with the
Students Union and encourage
partnership working where
appropriate, and continue
representation by the students
union on the Equalities
Implementation Group.
More students involved in the work
of the scheme.
Encourage a joined-up approach to
disability issues across the
University.
Diversity Manager
Student Union
Representatives
Ongoing
1.3 Continue to roll out equality impact
assessments throughout the
University. Ensure disability is
addressed. Equality toolkit includes
disability.
Diversity Manager to provide
support to committees and policy
holders on EIA’s.
Disability issues and concerns to
be embedded in all university
practice.
Diversity Manager Question on EIA’s
to be included in
Committee
reports,
November 2009.
HR to continue
disability analysis
of EIA’s in
policies.
Diversity

Champions to
identify and carry
out EIA’s at a
local level in their
schools and
departments in
2010.
1.4 The Disability Equality Scheme will
be published on the University of
Southampton’s external facing
website. It will be made available
in a variety of formats on request.
Comments about the Scheme and
the associated action plan will be
welcomed at any time and
considered with regard to the
continuous improvement of both
the Scheme and action plan.
Disabled people will have full
access to the University’s plans for
improving disability equality and
will have an ongoing opportunity to
be involved in its development.
Diversity Manager Ongoing
1.5 1. Develop corporate good
practice web access
guidelines
2. Train new Information
Analyst on Web Accessibility
3. Audit websites compliance
to the W3C/WA1 guidelines
4. Include accessibility on CMS
training
5. ISolutions to participate on
DDA working Group to
ensure corporate
implementation.
6. ISOlutions to form Web
Accessibility and Usability
Group
7. Auditing all relevant
applications eg CMS,
SharePoint, Banner.
Improve the University’s web
access for Disabled people.
To develop culture change to create a climate for web accessibility.
Ronise
Nepomuceno
Enterprise
Content
Management
Specialist,
ISolutions/ Sunny
Takhar
Distribute by end
January 2010.
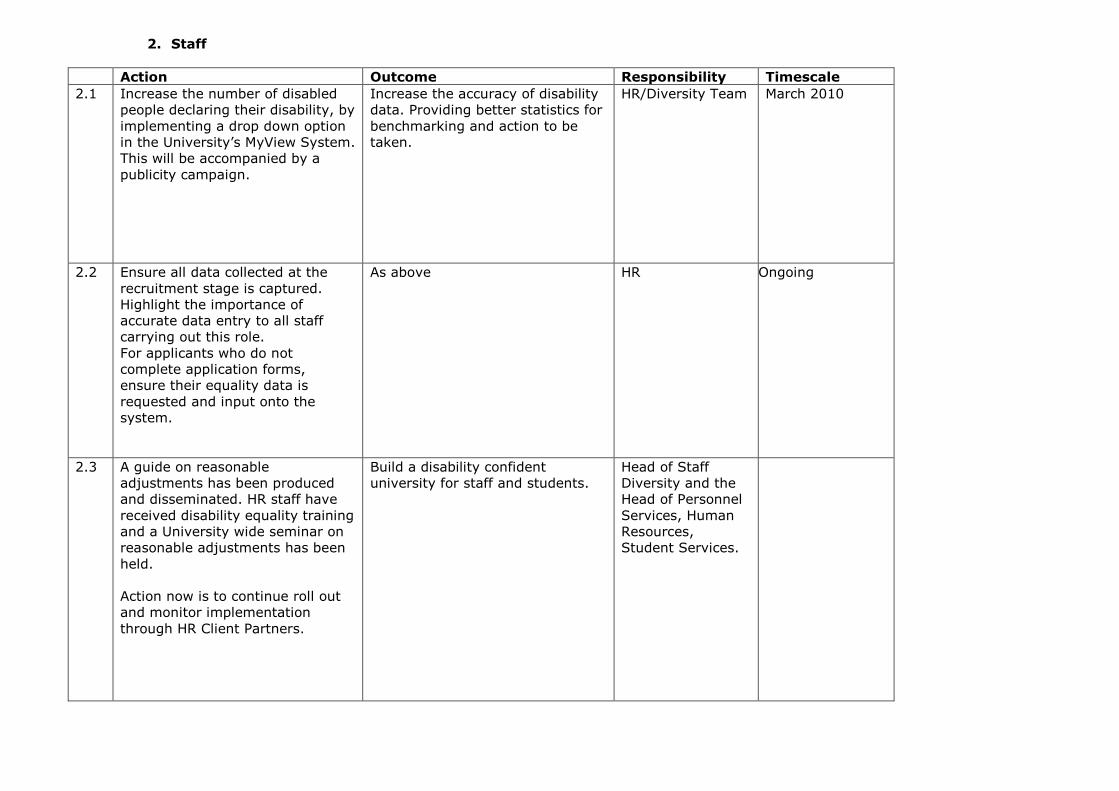
2. Staff
Action Outcome Responsibility Timescale
2.1 Increase the number of disabled
people declaring their disability, by
implementing a drop down option
in the University’s MyView System.
This will be accompanied by a
publicity campaign.
Increase the accuracy of disability
data. Providing better statistics for
benchmarking and action to be
taken.
HR/Diversity Team March 2010
2.2 Ensure all data collected at the
recruitment stage is captured.
Highlight the importance of
accurate data entry to all staff
carrying out this role.
For applicants who do not
complete application forms,
ensure their equality data is
requested and input onto the
system.
As above HR Ongoing
2.3 A guide on reasonable
adjustments has been produced
and disseminated. HR staff have
received disability equality training
and a University wide seminar on
reasonable adjustments has been
held.
Action now is to continue roll out
and monitor implementation
through HR Client Partners.
Build a disability confident
university for staff and students.
Head of Staff
Diversity and the
Head of Personnel
Services, Human
Resources,
Student Services.

2.4 Ensure that there is a system
within Human Resources where
information on disability is
updated when a member of staff
develops a disability during the
course of their employment.
Ensure the facility on MyView to
update personal data is
highlighted to staff on a periodic
basis.
Accurate reporting of disabled
staff.
HR/Diversity
Manager
Annual reminder
to staff.
2.5 Disability equality training
delivered by disabled people is
included in the Staff Development
Programme for the year 2010
Staff will learn about the Social
Model of Disability which will help
with culture change. In addition
interacting with disabled people
who live independently will help to
break down cultural barriers.
Head of Staff
Development
2010
2.6 The Diversity Learning Programme
will form part of the offering in the
Staff Development Booklet. This
includes topics related to
disability.
The staff development Programme
will offer:
Updates on Equality Legislation,
Managing Diversity and a new
cultural diversity programme will
be piloted in 2010.
Staff will develop a good
grounding in equality and diversity
issues.
Staff Development
Office/Diversity
Manager
Ongoing
2.7 The working group on disability to
consider wider involvement of
disabled people and publicise the
group on an ongoing basis.
Increase the involvement of
disabled people.
Diversity
Manager/Chair of
working group
Ongoing
2.8 Take steps to ensure that current
and prospective staff are aware
that the University has signed up
to the Two Ticks Scheme. Ensure
that current and prospective staff
understand the rights and
External awareness of the scheme
will help to attract disabled
applicants and internal awareness
of the University’s duties under the
scheme will help to retain staff
that develop a disability during the
Diversity
Manager/HR
Annual review

responsibilities this places upon
them.
course of their employment.
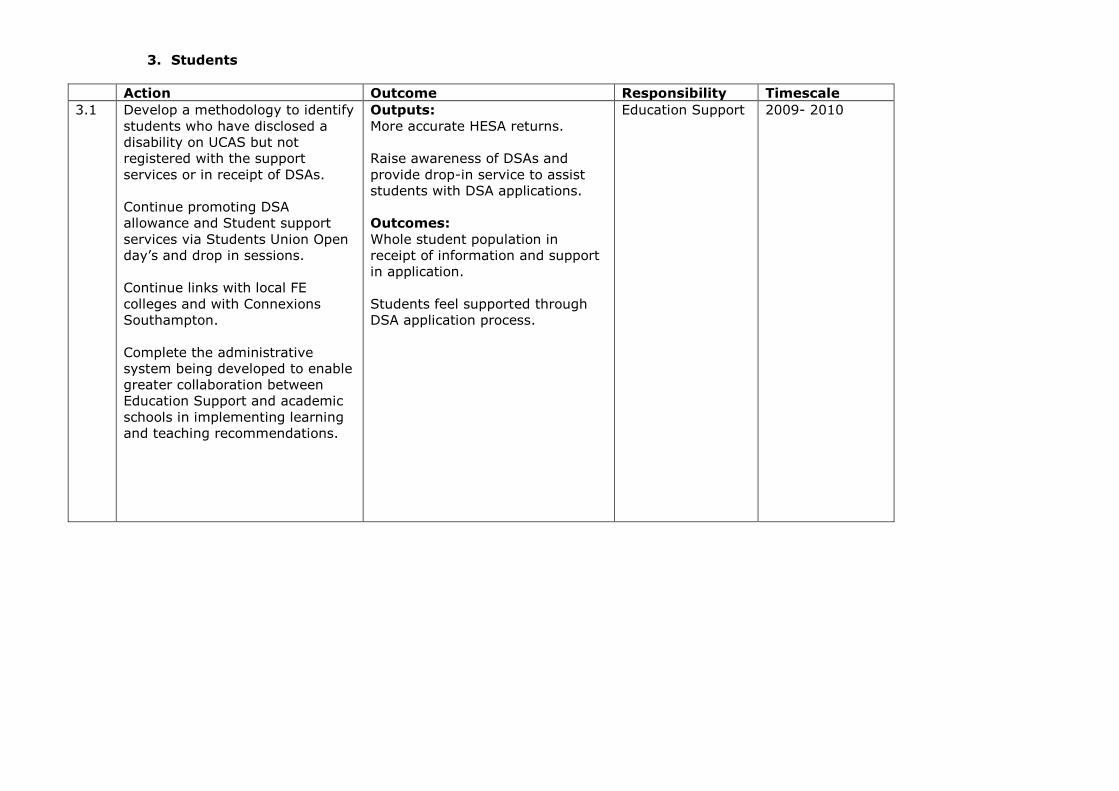
3. Students
Action Outcome Responsibility Timescale
3.1 Develop a methodology to identify
students who have disclosed a
disability on UCAS but not
registered with the support
services or in receipt of DSAs.
Continue promoting DSA
allowance and Student support
services via Students Union Open
day’s and drop in sessions.
Continue links with local FE
colleges and with Connexions
Southampton.
Complete the administrative
system being developed to enable
greater collaboration between
Education Support and academic
schools in implementing learning
and teaching recommendations.
Outputs:
More accurate HESA returns.
Raise awareness of DSAs and
provide drop-in service to assist
students with DSA applications.
Outcomes:
Whole student population in
receipt of information and support
in application.
Students feel supported through
DSA application process.
Education Support 2009- 2010
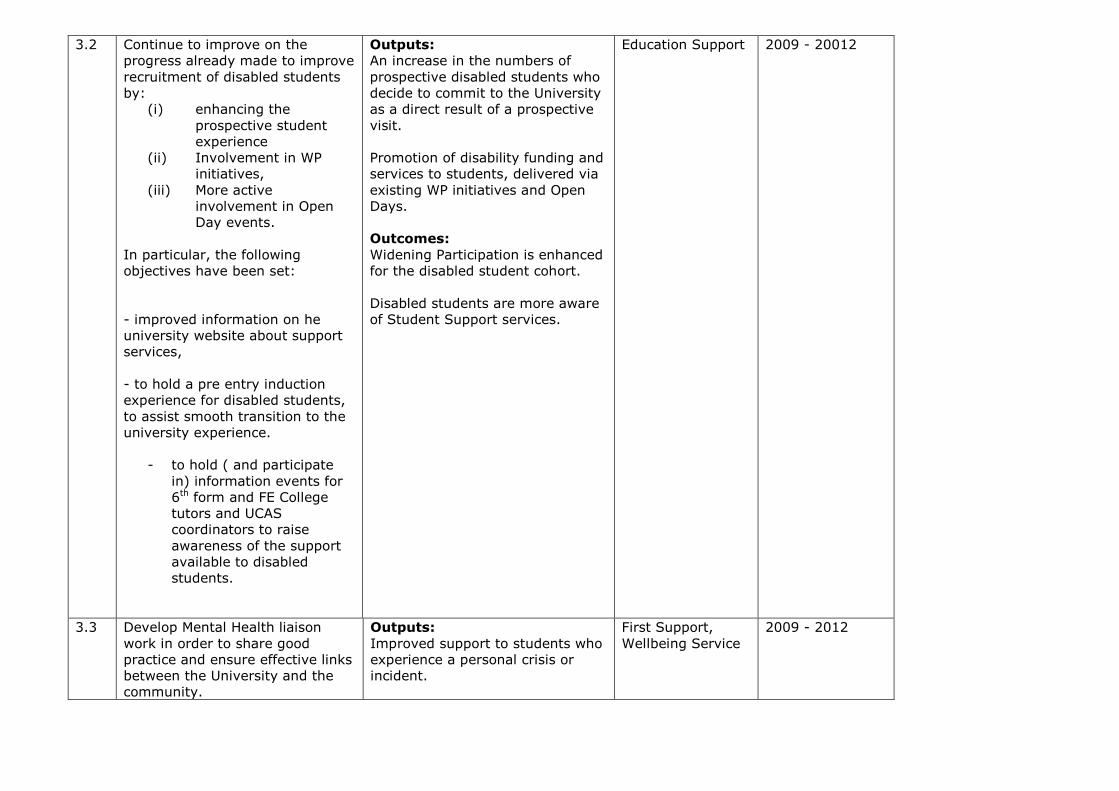
3.2 Continue to improve on the
progress already made to improve
recruitment of disabled students
by:
(i) enhancing the
prospective student
experience
(ii) Involvement in WP
initiatives,
(iii) More active
involvement in Open
Day events.
In particular, the following
objectives have been set:
- improved information on he
university website about support
services,
- to hold a pre entry induction
experience for disabled students,
to assist smooth transition to the
university experience.
- to hold ( and participate
in) information events for
6th form and FE College
tutors and UCAS
coordinators to raise
awareness of the support
available to disabled
students.
Outputs:
An increase in the numbers of
prospective disabled students who
decide to commit to the University
as a direct result of a prospective
visit.
Promotion of disability funding and
services to students, delivered via
existing WP initiatives and Open
Days.
Outcomes:
Widening Participation is enhanced
for the disabled student cohort.
Disabled students are more aware
of Student Support services.
Education Support
2009 - 20012
3.3 Develop Mental Health liaison
work in order to share good
practice and ensure effective links
between the University and the
community.
Outputs:
Improved support to students who
experience a personal crisis or
incident.
First Support,
Wellbeing Service
2009 - 2012
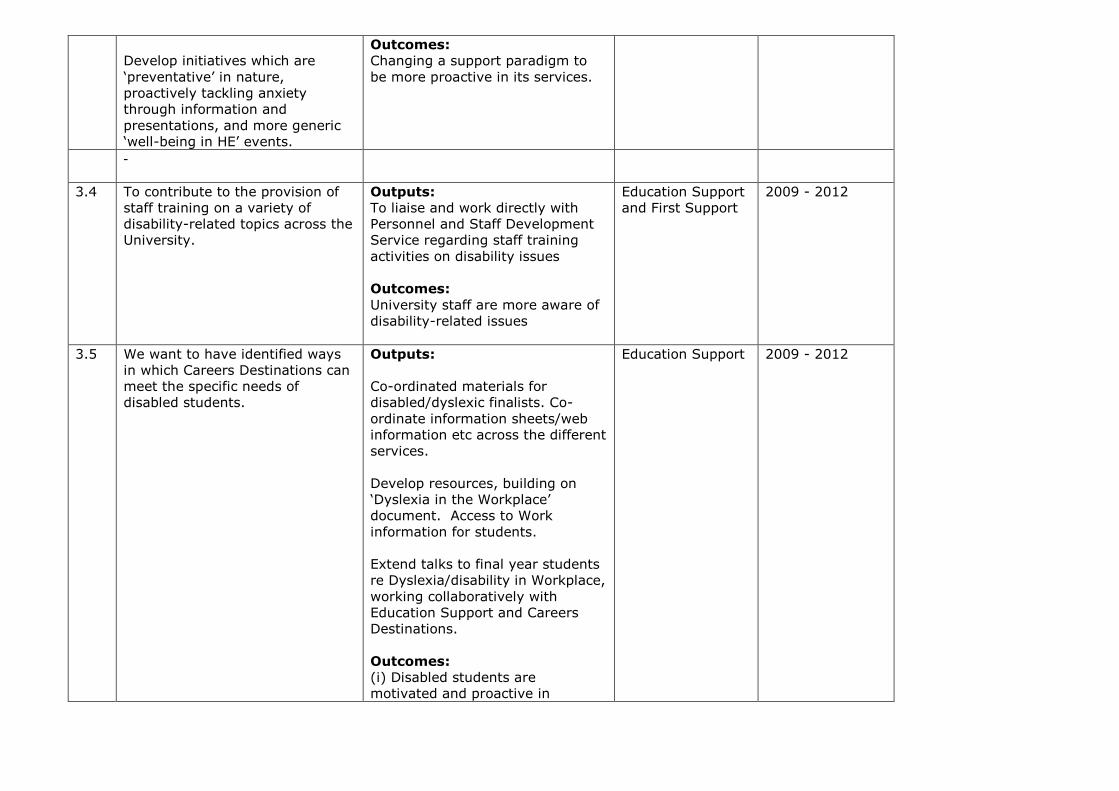
Develop initiatives which are
‘preventative’ in nature,
proactively tackling anxiety
through information and
presentations, and more generic
‘well-being in HE’ events.
Outcomes:
Changing a support paradigm to
be more proactive in its services.
-
3.4 To contribute to the provision of
staff training on a variety of
disability-related topics across the
University.
Outputs:
To liaise and work directly with
Personnel and Staff Development
Service regarding staff training
activities on disability issues
Outcomes:
University staff are more aware of
disability-related issues
Education Support
and First Support
2009 - 2012
3.5 We want to have identified ways
in which Careers Destinations can
meet the specific needs of
disabled students.
Outputs:
Co-ordinated materials for
disabled/dyslexic finalists. Co-
ordinate information sheets/web
information etc across the different
services.
Develop resources, building on
‘Dyslexia in the Workplace’
document. Access to Work
information for students.
Extend talks to final year students
re Dyslexia/disability in Workplace,
working collaboratively with
Education Support and Careers
Destinations.
Outcomes:
(i) Disabled students are
motivated and proactive in
Education Support 2009 - 2012

improving their employability (ii)
The University supports the
student so that they feel
More confident that they have
valuable skills and
experience to offer potential
employers.
The National Student Forum
(2009) has identified this area as a
specific recommendation.
Establish an on-line buddy
scheme where students with
disabilities can contact each other
informally via email about any
questions or worries they may
have.
Additional support network for
disabled students.
Student Disability
Representative
(Frankie Fry)
2010
In collaboration with the Equal
Opportunities Officer to organise a
disabilities sports day, with the
involvement of local
organisations.
Positively promote disability. Student Disability
Representative
(Frankie Fry)
2010
Ensure regular contact with
students with disabilities either in
person or via email so I can be a
source of contact and be known
as someone to talk to.
Additional Support network for
disabled students.
Student Disability
Representative
(Frankie Fry)
2010
4. Education and Curriculum
Action Outcome Responsibility Timescale
4.1 The Inclusion taskforce (ITF) as an
advisory group to be disbanded.
Instead 2 members of the
Inclusion Task Force to continue
acting as members of the Equality
Implementation Group and take
work forward through that
avenue.
All those below Jane Seale as Chair
of ITF with support
of LATEU
Ian Giles
Mainstreaming
decisions to be
made in 2010.

4.2 Design and develop strategic level
CPD sessions for Deputy Heads of
School.
Student’s needs, policy drivers
and the principles of inclusion will
be cascaded down through
Schools.
SDU in association
with LATEU
February 2010
4.3 Review the Design and develop
introductory level CPD sessions for
academic and learning support
staff and implement targeted
learning programmes on equality
and diversity issues.
Academic and support staff will
understand the principles of
inclusion and generic strategies
for applying them.
LATEU April 2010
4.4 Periodically publicise the inclusion
DVD launched in 2008.
Academic and support staff will
understand the principles of
inclusion.
LATEU Annually
4.5 Periodically publicise the inclusion
and diversity page on the LATEU
website.
All staff involved in learning and
teaching will have access to the
resources they require to deliver
inclusive programmes.
LATEU Annually
4.6 Identify individuals within schools
to work with staff to implement
the principles of inclusion at
school/divisional level.
Schools develop their own
strategies for inclusive learning
and teaching with support from
the ITF.
Schools with
support from
Faculties and
LATEU
2010
4.7 Offer schools support for tailor-
made CPD for staff using case
studies or featuring particular
issues.
Individuals within Schools will
develop their own inclusive
practices with support from
Schools and ITF.
LATEU Ongoing
4.9 Initiate the closer involvement of
students in the design of
inclusion-related CPD by involving
them in the planning and design
of CPD activities.
Students will be involved in the
inclusion process
LATEU 2010
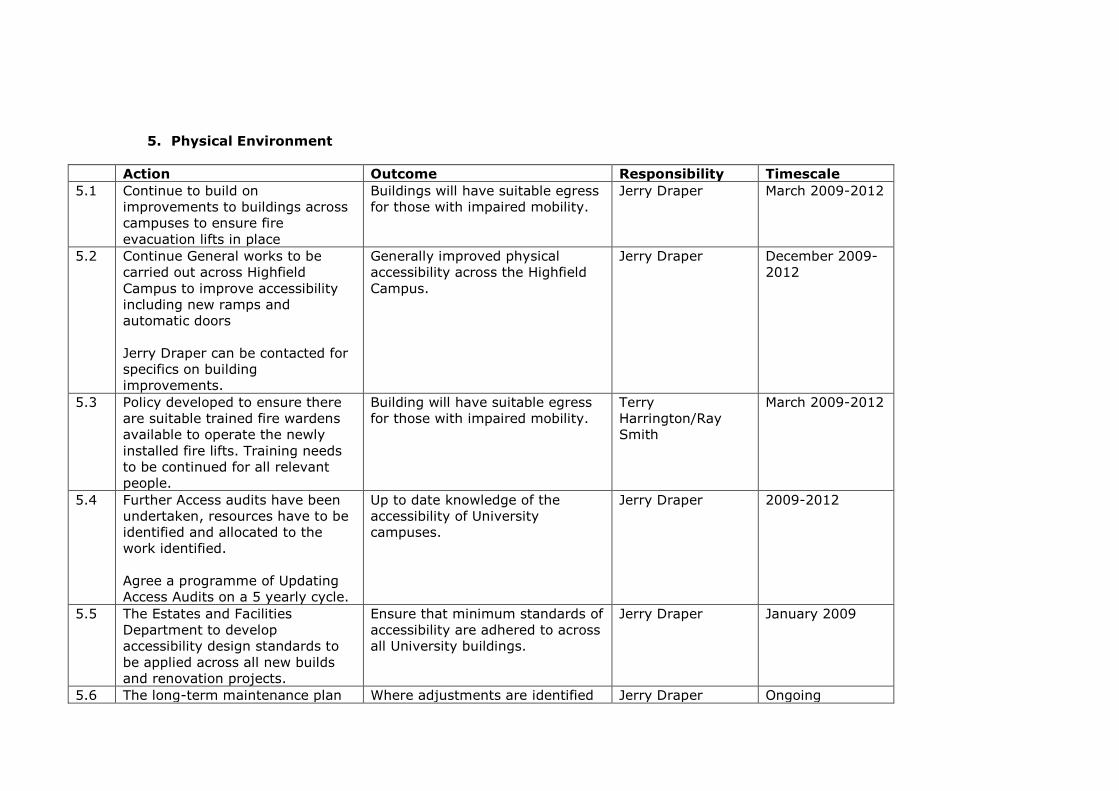
5. Physical Environment
Action Outcome Responsibility Timescale
5.1 Continue to build on
improvements to buildings across
campuses to ensure fire
evacuation lifts in place
Buildings will have suitable egress
for those with impaired mobility.
Jerry Draper March 2009-2012
5.2 Continue General works to be
carried out across Highfield
Campus to improve accessibility
including new ramps and
automatic doors
Jerry Draper can be contacted for
specifics on building
improvements.
Generally improved physical
accessibility across the Highfield
Campus.
Jerry Draper December 2009-
2012
5.3 Policy developed to ensure there
are suitable trained fire wardens
available to operate the newly
installed fire lifts. Training needs
to be continued for all relevant
people.
Building will have suitable egress
for those with impaired mobility.
Terry
Harrington/Ray
Smith
March 2009-2012
5.4 Further Access audits have been
undertaken, resources have to be
identified and allocated to the
work identified.
Agree a programme of Updating
Access Audits on a 5 yearly cycle.
Up to date knowledge of the
accessibility of University
campuses.
Jerry Draper 2009-2012
5.5 The Estates and Facilities
Department to develop
accessibility design standards to
be applied across all new builds
and renovation projects.
Ensure that minimum standards of
accessibility are adhered to across
all University buildings.
Jerry Draper January 2009
5.6 The long-term maintenance plan Where adjustments are identified Jerry Draper Ongoing

will be based on risk assessments
that rank issues and include
adjustments in line with the
outcome of the accessibility
audits.
they are prioritised.
5.7 Ensure the University has a
Personal Emergency Evacuation
Plan (PEEP) process.
Every disabled person in the
University that requires one, will
have a personalised evacuation
plan to ensure safe egress.
Terry
Harrington,Universi
ty Health and
Safety Adviser
Ongoing
6. Marketing
Action Outcome Responsibility Timescale
6.1 Develop a communication strategy
on diversity and inclusion for the
University.
Including publicising key issues
and events.
Images and use of images.
Internal and External
communication.
Increased awareness of the
progress towards an inclusive
University, including disability
equality.
Communications/
Diversity office
2010
6.2 Ensure ongoing publicity and
communication on diversity
issues.
Increased awareness of the
progress towards an inclusive
University, including disability
equality.
Communications/
Diversity
Office/EIG/
Diversity
Champions
Ongoing
7. Purchasing
Action Outcome Responsibility Timescale
7.1 Investigate and implement a
Disability criteria, amongst other
equality and diversity
considerations within the formal
tendering process for over 20k.
All tenders over £20K in value will
have considered the impact for
equality and diversity.
Julian Sheppard,
Head of
Procurement
January –
October 2010
7.2 Equality and diversity obligations
will be monitored in supplier
Implement a checklist and
incorporate an equality and
Julian Sheppard,
Head of
January –
October 2010
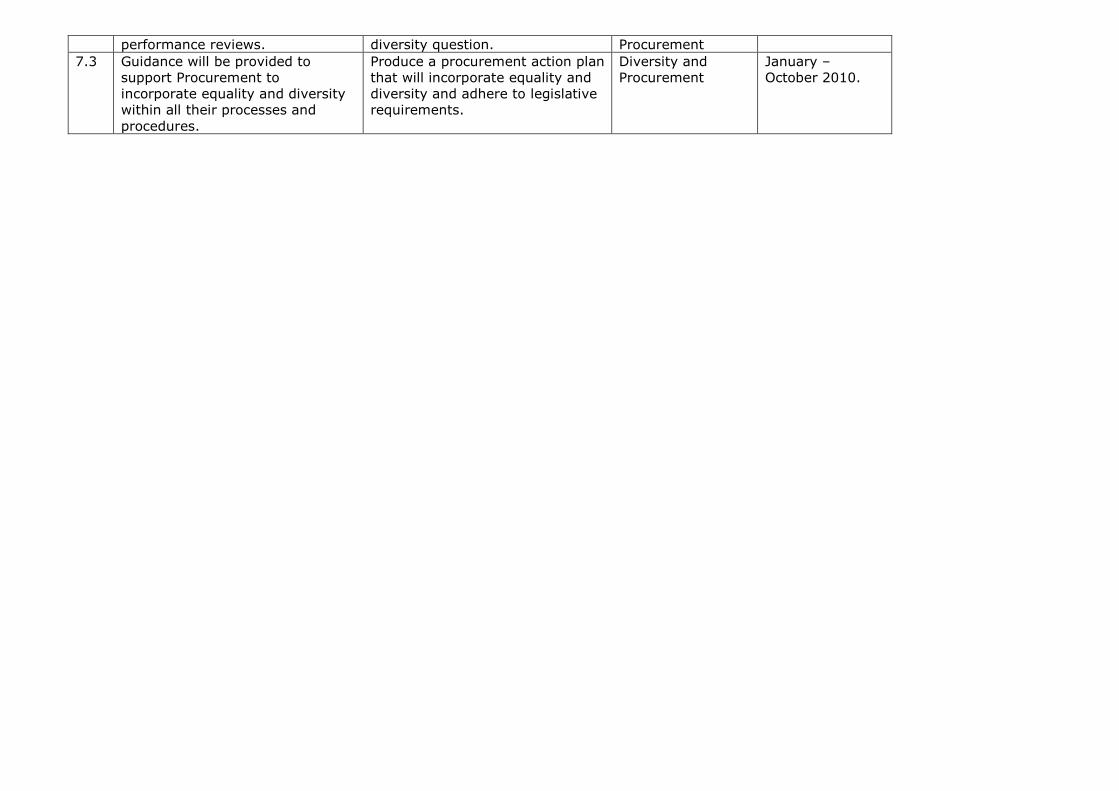
performance reviews. diversity question. Procurement
7.3 Guidance will be provided to
support Procurement to
incorporate equality and diversity
within all their processes and
procedures.
Produce a procurement action plan
that will incorporate equality and
diversity and adhere to legislative
requirements.
Diversity and
Procurement
January –
October 2010.

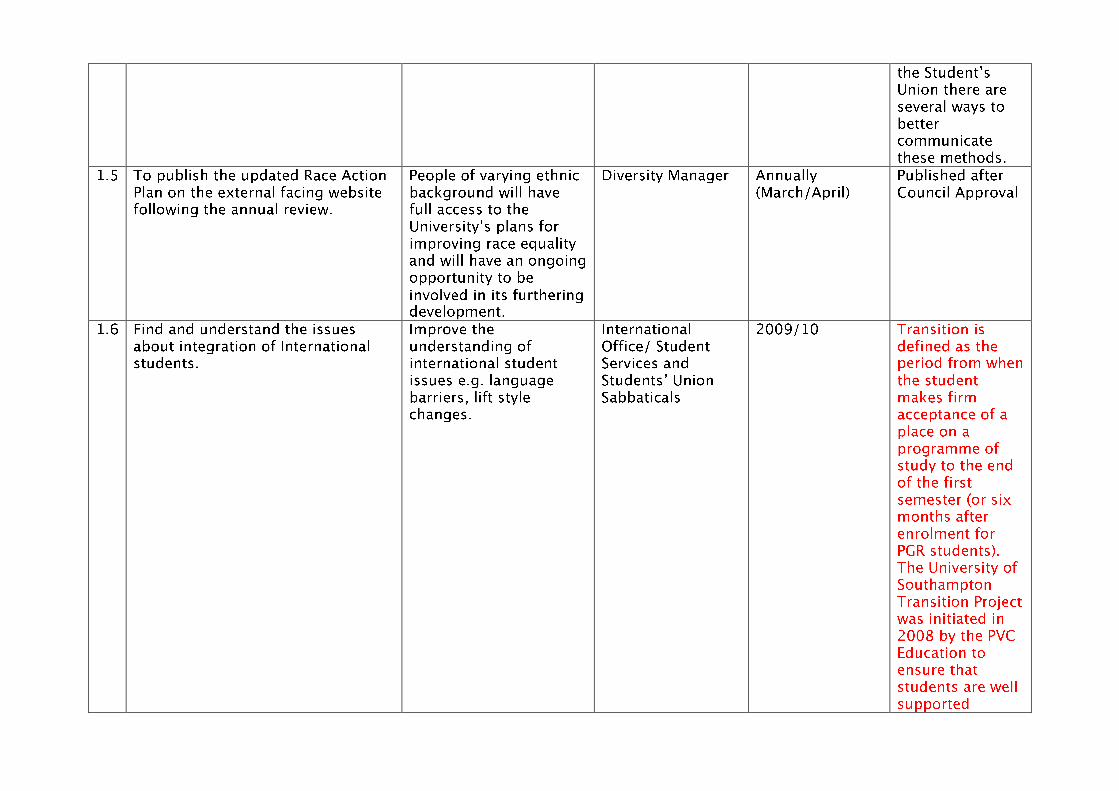


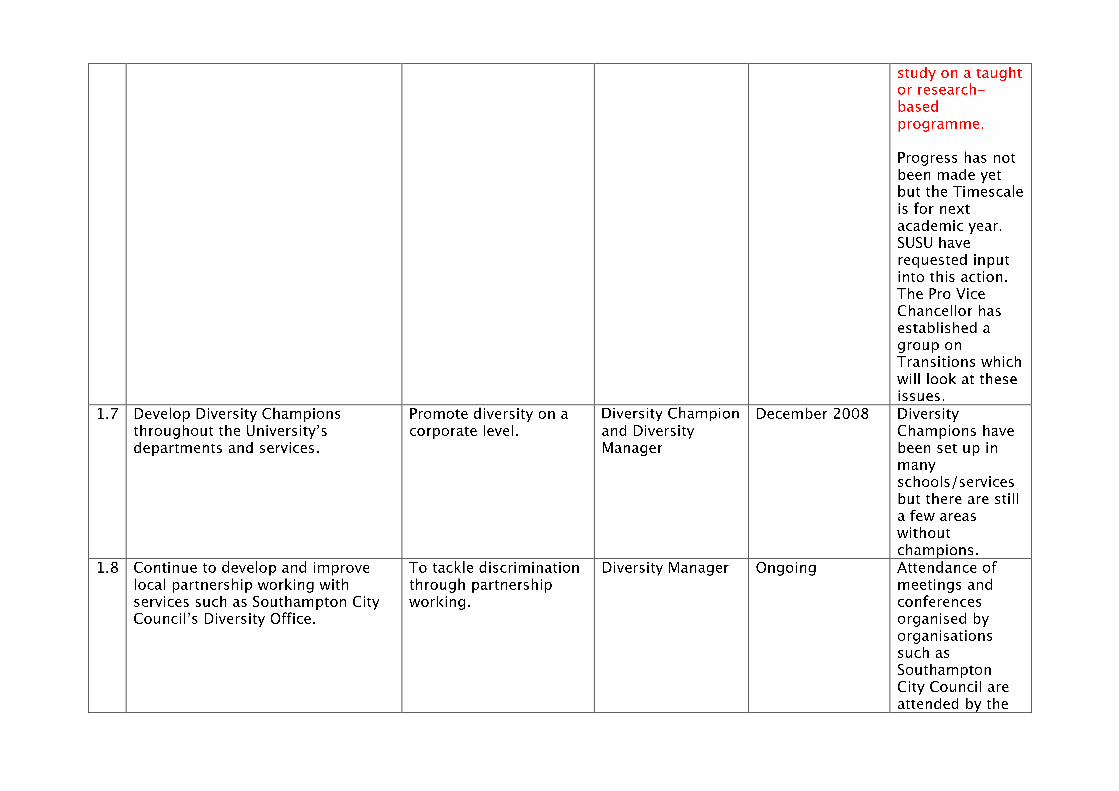
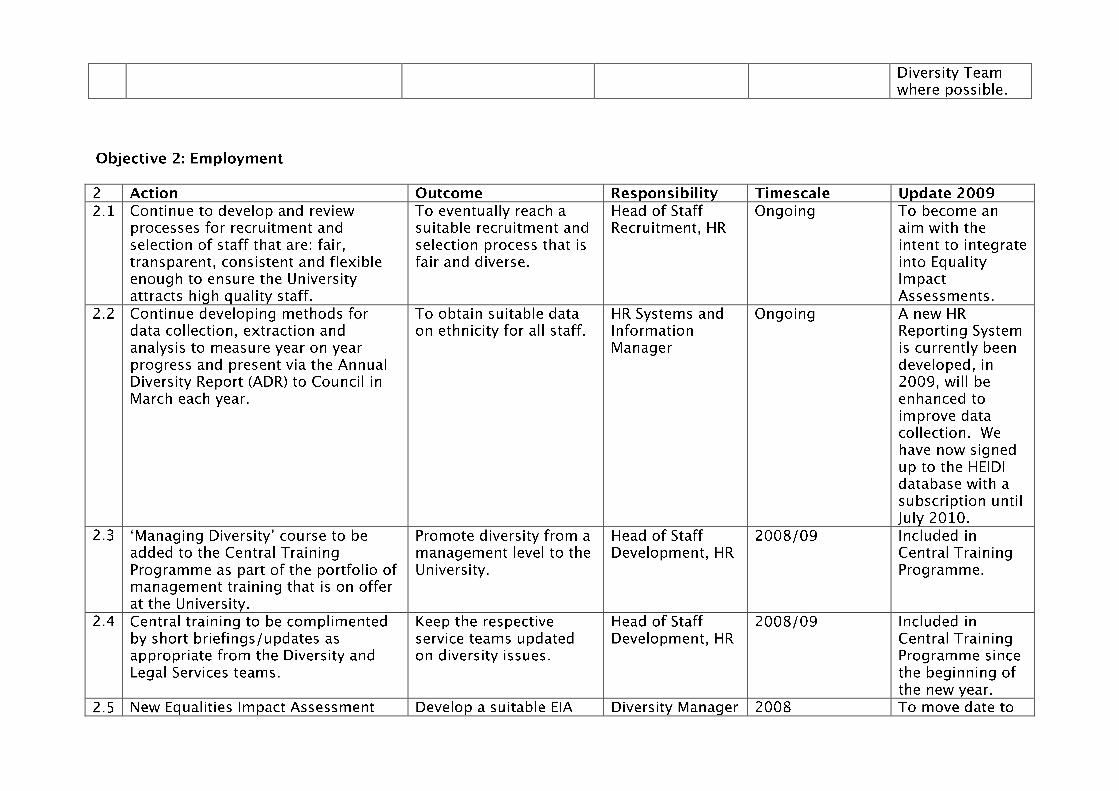
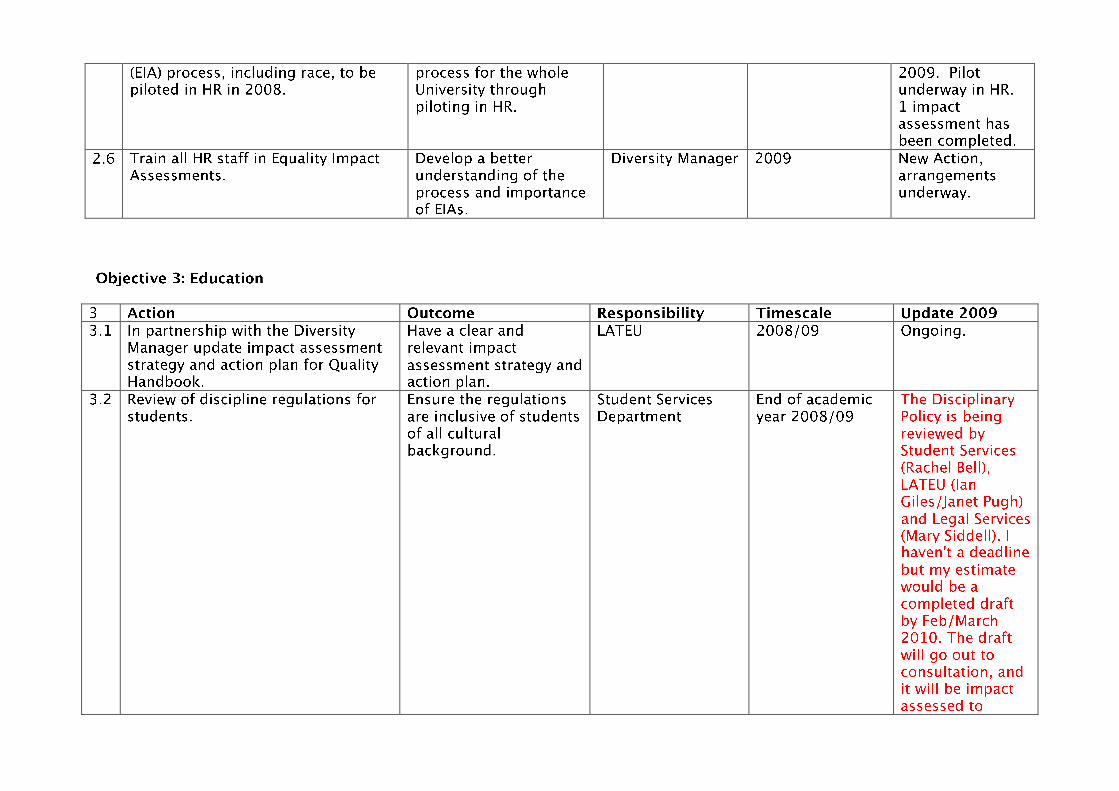
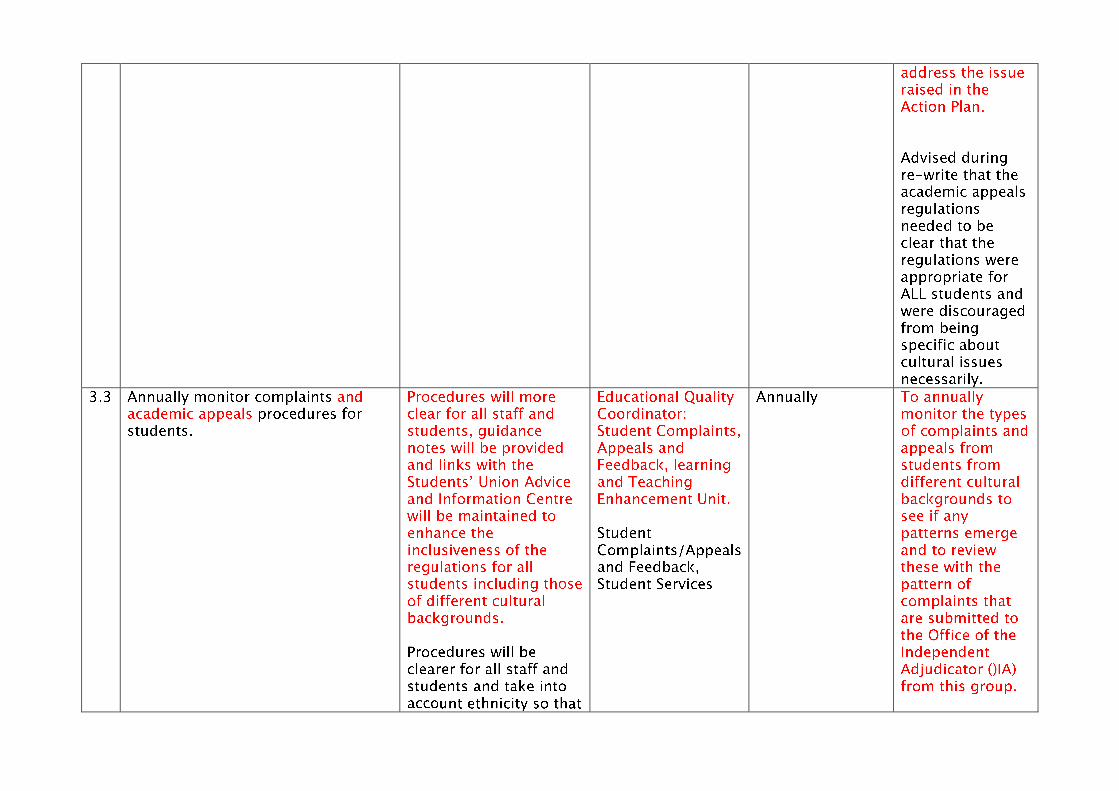
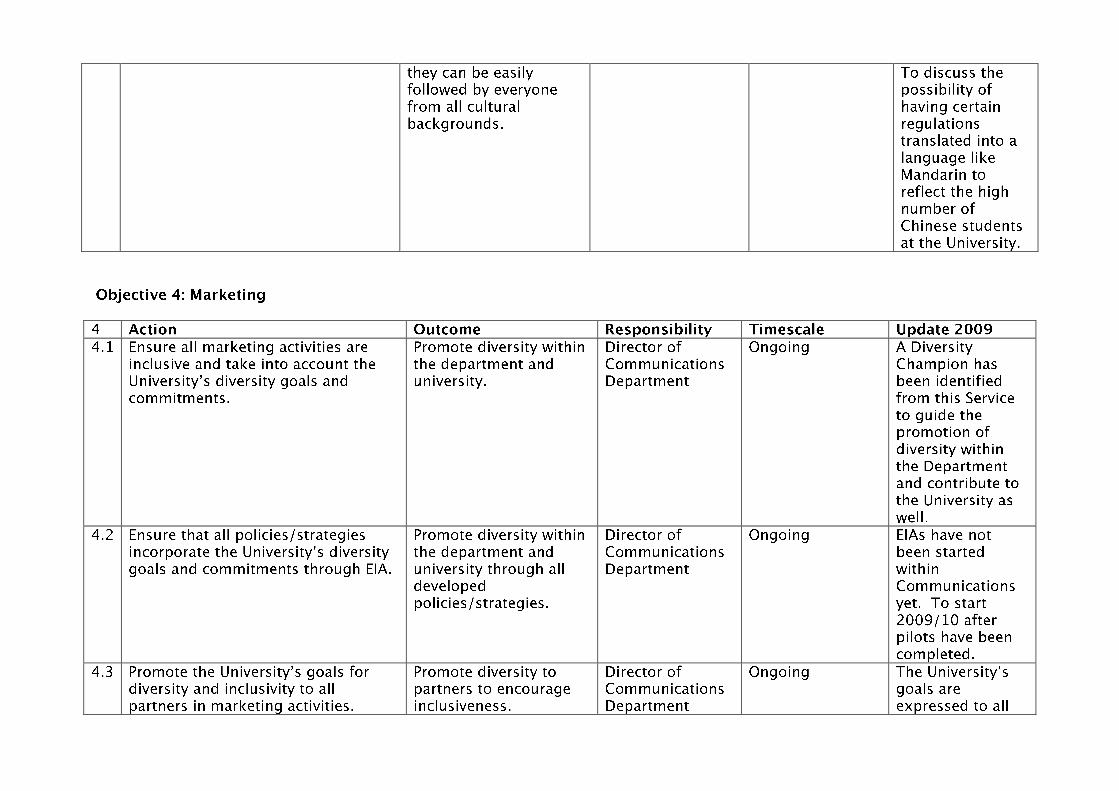


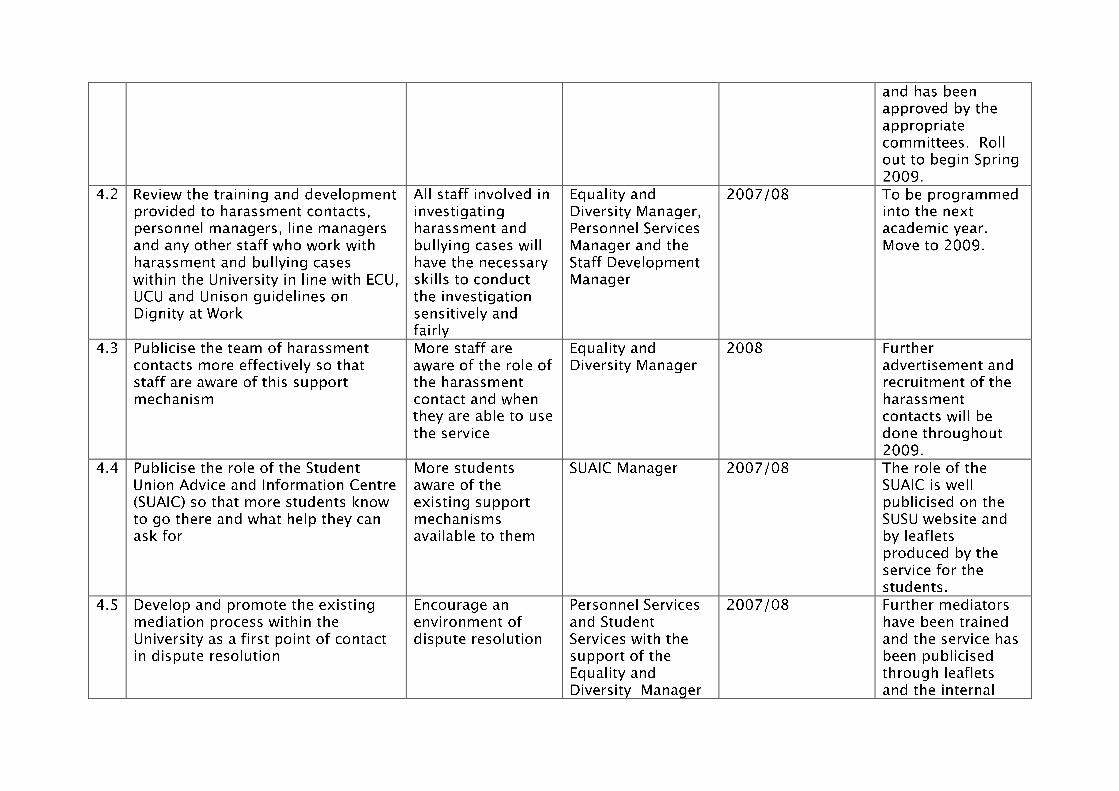

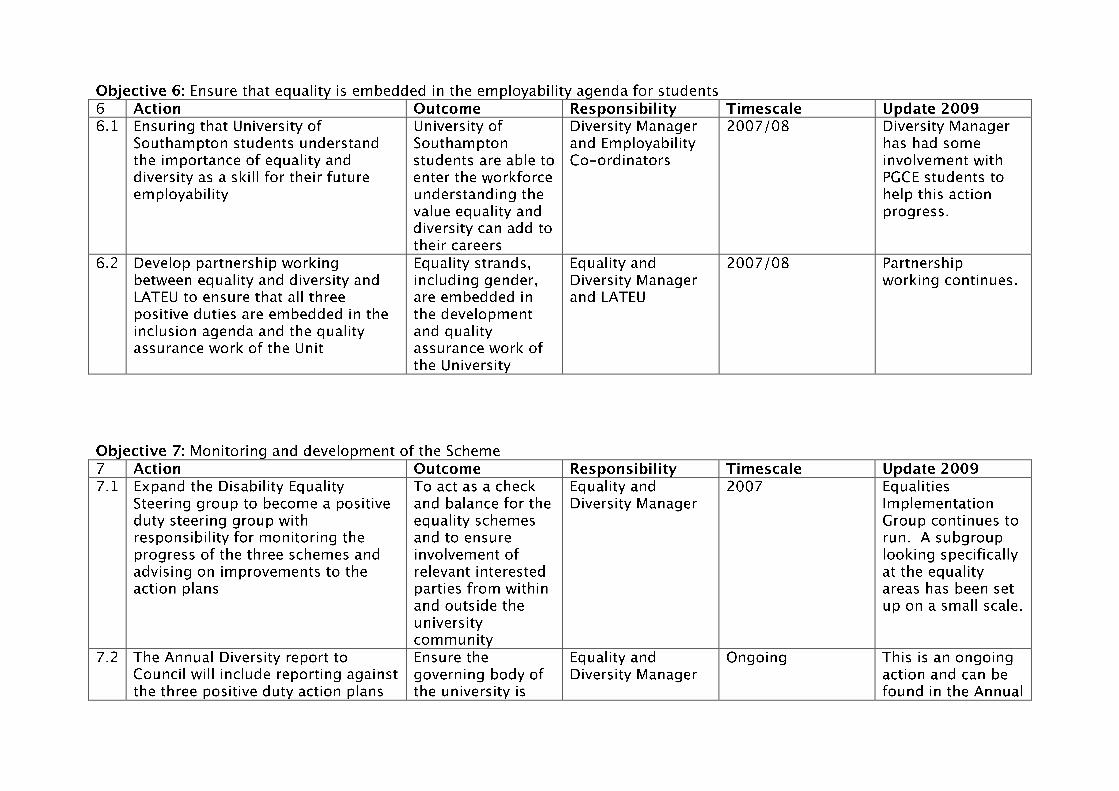


Area of Concern Nature of concern Actions/Achievements since July 2009
(n.b. Further work continues in all areas)
Potential Glass ceiling
Whilst there are slightly more women than
men in the university, they are greatly under-
represented at the higher levels.
Statistical analysis of promotion applications
and success rates confirms that although
women continue to do well once they have
applied for promotion, application rates for
eligible women are significantly lower than
their male counterparts.
3% female academics that were eligible to do
so applied for promotion, compared to 10% of
male academics who were eligible.
Feedback from the Academic Promotions
Survey identified the following common
themes regarding female perceptions of the
process:
‘the application process put me off’ and ‘the
interview process put me off’.
‘I did not feel able to apply for promotion due
to personal circumstances’.
Achievements/findings to date:
o Action learning Groups re-instated.
o All level 4-7 academics surveyed regarding ease of use / perception of
current re-grading process. Initial analysis of feedback suggests:
i. The ‘long hours culture’ at senior management level is perceived to be a barrier to the promotion of those with caring responsibilities.
ii. Flexibility is key to the career development of all staff. As we consider the development of the University alongside initiatives such as ‘Creating our Future’, extension of the teaching day and widening participation, flexibility needs to be at the heart of any changes.
iii. The current membership of key committees and governance bodies does not reflect a proper gender balance and steps are needed to address this. This issue is now being addressed by the Registrar and Chief Operating Officer.
o Female representation on promotions panels recommended as standard.
o Clearer guidance issued to panels on the need focus on ability and
performance, so as not to see career breaks as a deficit.
o Gender Equality Group add promotion of women above level 4 as one of
their key focus areas for recommended change – looking at ‘long hours
culture’, ‘flexibility at work’ and membership of key committees and
governance bodies.
o Minor amendments to Promotions procedure 2009 made in light of
promotions survey findings.
Further Action:
o Further amendments to promotions process to be recommended to HRC in
2010 in light of Promotion Survey Findings.
o Drill down analysis halted pending availability of Cognos reporting tool.
Equal Pay Action Plan

When available school/service specific issues will be identified and
discussion with local managers planned for late winter 2009/Spring 2010
to identify rationale for lower application rates and determine action to
resolve.
o Project work underway exploring the potential impact of current internal
and external recruitment practices on female applicants.
Pay Protection At present a number of staff have their pay
protected at a level above their current grade
as a result of the 2004 Pay Assimilation
exercise. This pay protection has been made
indefinite. This results in an Equal Pay anomaly
where a comparator, undertaking the same
work can potentially be identified as being
paid at a higher grade.
Case law confirms that indefinite protection
arrangements can in themselves be
discriminatory, however ending such
contractual arrangements would potentially be
a breach of contract.
Research:
o Legal Services confirm that pay protection will be enshrined as a legitimate
measure to 'reduce pay inequality over time' in the Equality Bill. However this
suggests that pay protection will still need to reduce over time rather than
be indefinite. Case law in this area is still emerging and therefore close
partnership working with Legal Services is taking place.
Further action:
o A pay protection policy to be developed by HR and Legal Services and will be
presented to HRC in 2010. Future pay protection arrangements to be for a
specified period only.
Payment of Additional increments
Status: Project Area Halted
Historical summary data regarding the
payment of additional increments is currently
unavailable.
ACTION: Project Area halted pending Cognos reporting Tool (due November
2009)
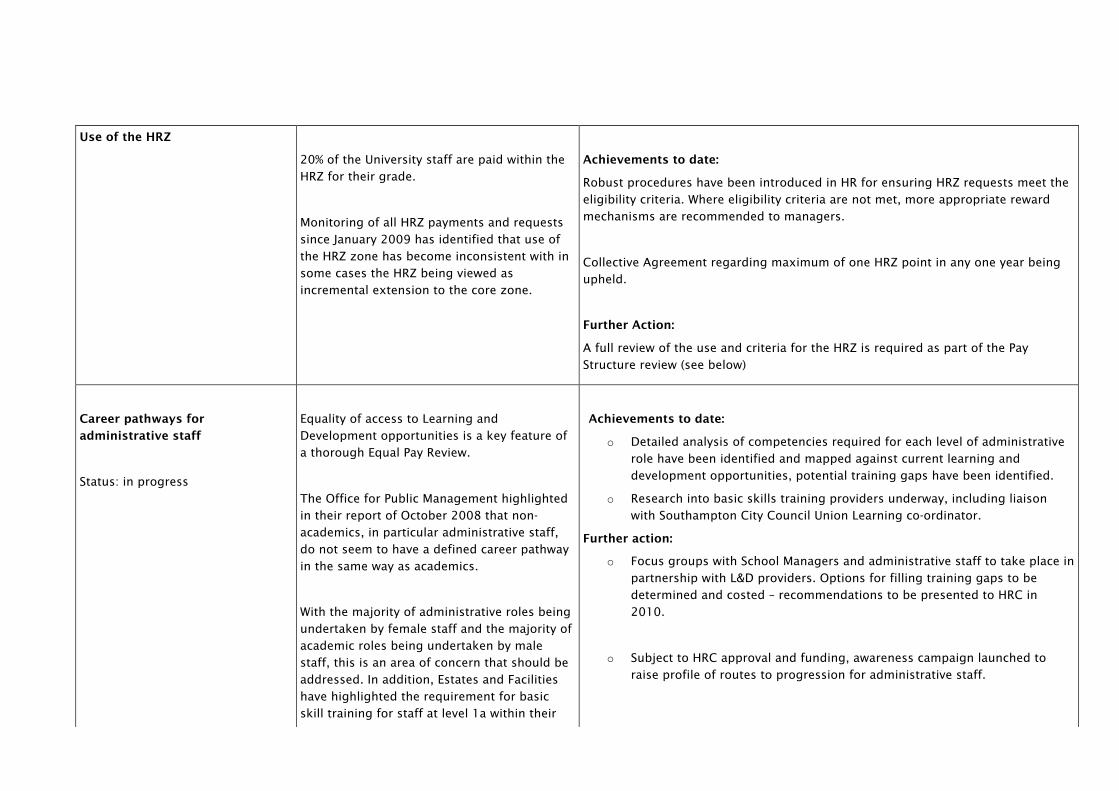
Use of the HRZ
20% of the University staff are paid within the
HRZ for their grade.
Monitoring of all HRZ payments and requests
since January 2009 has identified that use of
the HRZ zone has become inconsistent with in
some cases the HRZ being viewed as
incremental extension to the core zone.
Achievements to date:
Robust procedures have been introduced in HR for ensuring HRZ requests meet the
eligibility criteria. Where eligibility criteria are not met, more appropriate reward
mechanisms are recommended to managers.
Collective Agreement regarding maximum of one HRZ point in any one year being
upheld.
Further Action:
A full review of the use and criteria for the HRZ is required as part of the Pay
Structure review (see below)
Career pathways for
administrative staff
Status: in progress
Equality of access to Learning and
Development opportunities is a key feature of
a thorough Equal Pay Review.
The Office for Public Management highlighted
in their report of October 2008 that non-
academics, in particular administrative staff,
do not seem to have a defined career pathway
in the same way as academics.
With the majority of administrative roles being
undertaken by female staff and the majority of
academic roles being undertaken by male
staff, this is an area of concern that should be
addressed. In addition, Estates and Facilities
have highlighted the requirement for basic
skill training for staff at level 1a within their
Achievements to date:
o Detailed analysis of competencies required for each level of administrative
role have been identified and mapped against current learning and
development opportunities, potential training gaps have been identified.
o Research into basic skills training providers underway, including liaison
with Southampton City Council Union Learning co-ordinator.
Further action:
o Focus groups with School Managers and administrative staff to take place in
partnership with L&D providers. Options for filling training gaps to be
determined and costed – recommendations to be presented to HRC in
2010.
o Subject to HRC approval and funding, awareness campaign launched to
raise profile of routes to progression for administrative staff.

service. (mainly female staff)
Level 7 Pay:
Professorial Pay – staff
progression, rezoning.
Status - in progress
To date, Level 7 staff have been excluded from
the University’s Equal Pay Reviews.
Prior to 2009, a robust audit trail of level 7 pay
decisions has not always been immediately
availability and historical pay data limited.
Anecdotal evidence suggests professorial pay
review is perceived as lacking transparency
and that inconsistency of approach across
faculties.
A review of recent ‘applications’ for
progression reveals that a significant
percentage of High performers are choosing
not to apply for salary progression. The 2009
process is therefore flawed not achieving its
aim to ‘reward excellence’.
Professorial and Senior Salaries Committee
identify that the current level 7 pay structure is
not aligned to current re-zoning policy,
resulting in a large financial cost to the
University.
Achievements to date:
o Level 7 pay to be included in all future Equal Pay Reviews.
o Professorial Pay Cognos reporting facility in place with effect from
September 2009, providing accurate and up to date pay data.
o Equal Pay established as standing item on Professorial and Senior Salaries
Committee agenda. Regular monitoring reports presented and discussed.
o Existing pay anomalies identified and resolved as appropriate.
o Off Scale salaries aligned to University spine points wherever possible.
o Major review of Pay Review process agreed for 2010. Professorial
‘application’ for salary progression replaced by Management
recommendation, based on assessment of performance against objectives.
o Two moderation stages built into 2010 process to ensure consistency of
approach across Faculty and University.
o Senior Deputy Vice-Chancellor and Deans to provide support to Schools on
the setting of SMART academic objectives. PPDR Skills training set as
minimum training requirement for all Level 7 Appraisers. Learning and
Development courses in place to meet demand.
o Managers provided with clear guidance on appropriate progression
recommendations in relation to performance in role. Maximum limits for
standard progression set.
o Clear guidelines issued to all Heads of School and professorial staff -
linking professorial salary progression to performance rating identified
through PPDR process. Further training still required for managers in this
area.
Further action:
o Review of professorial zones to place in 2010.

Pay Gaps
Under the single equality duty it will be
expected that the University publish the
percentage difference in the average pay of
men and women.
Although the University’s overall gender based
Equal Pay Gap has reduced, significant (i.e.
>4%) pay gaps have been identified in Levels
1b and Level 7.
Significant ethnicity based pay gaps exist at
level 2a and 2b, with a significant disability
based pay gap at level 2a.
Actions/Achievements to date:
o Level 7 Pay is now monitored annually and reported to the University’s
Professorial and Senior Salaries Committee (PSSC).
Further action:
o Drill down analysis due to take place to identify school/service specific pay
gaps at level 1b, 2a and 2b, objective justification to be confirmed or
appropriate action to resolve identified and recommended to HRC. ( Halted
due to unavailability of Cognos Reporting Tool)
Starting Salaries
Analysis of new appointments, in the year
ending October 2008 has highlighted a
significant gender pay gap relating to starting
salaries. Unfortunately due to the Cognos
reporting delay, details of specific
services/schools where this issue is
pronounced is unavailable.
Across the University, starting salaries are
negotiated between the Chair of the
recruitment panel and the successful
candidate. No central guidance on agreeing
starting salaries is provided to managers.
There is no central recruitment training
provided by the University. Managers are
therefore making recruitment decisions with
Achievements to Date:
o Cessation of recruitment good practice training for managers identified as
contributing factor.
o Recruitment training to be reinstated, to include core element on diversity
and Equal pay. Equal Pay Project recommendations to HRC will include the
introduction of mandatory recruitment training for all managers involved in
recruiting staff.
o Research complete regarding management of Starting Salaries across the
University sector. Starting Salary policy in draft.
Further Action:
o Identification of specific services/schools where the starting salary pay gap
is pronounced to commence in November 2009. Justification or remedial
action to follow. (Action halted awaiting Cognos reporting tool)
o Starting Salaries Policy to be presented to HRC in spring 2010.

little or no knowledge of best practice or
related anti discrimination legislation.
Grading of Temp Bank Posts
Concern regarding equity in levels of pay paid
to staff undertaking temp bank placement
Action/Achievements to date:
o HR temp bank staff now fully trained in HAY evaluation methodology. All
evaluation decisions being recorded and monitored for grading purposes.
o The appropriate level of pay for all temp bank placements is now
determined by Job Evaluation by a trained evaluator, rather than by
management untrained judgement.
o Bank of most common temp bank posts are being evaluated, with
associated job descriptions being made available on the web to managers.
o Quality Assurance processes are now in place for all job Evaluation
decisions across the University.
Further Action:
o Further development of generic temp bank posts
o Communications exercise planned to raise management awareness of
generic temp bank post and related Equal Pay Legislation.
Fees payroll
The concept of Equal Pay for work of equal
value which is central to Equal Pay legislation
applies both to contracted staff and
‘casual/fees’ paid staff. To date an Equal Pay
Audit of fees paid staff has not taken place,
however there is a wealth of anecdotal
evidence that raises concerns that rates of pay
for staff paid in this way are inconsistent and
may not be defendable if challenged.
This issue is being highlighted nationally by
Achievements/Action to date:
o A joint HR / Payroll project team established to look in detail at fees payroll
and investigate the exact nature of the issues present.
Further Action:
o Project commenced September 2009 regarding the grading of staff paid on
fees payroll. A similar approach will be adopted to that used for the Temp
bank and discussions with School Managers will commence shortly to
identify the most common roles.

UCEA.
Terms and conditions –
consistency in application and
outstanding items for
implementation from the 2004
pay agreement.
Possible inconsistencies in the application of
existing terms and conditions are apparent.
Agreed actions outstanding from 2004 pay
agreement.
Achievements / Action to date:
o Protection of annual leave entitlement for level 3 staff ended 1st October
2008 (where applicable).
o Notice given regarding the ending of the period of protection of 35.5
hours working week. Protection to cease 1st October 2009.
o Outstanding review of annual leave for staff at 1a completed. Annual leave
entitlements for staff on level 1a brought in line with annual leave
entitlements for staff on levels 1b-3 from 1st October 2009.
Further Action:
o Further discussions regarding harmonisation of terms and conditions
across levels 1b-3 to be included with full review of pay structure and
reward strategy see below.
Current pay structure / Reward
Strategy
The University’s current pay structure was
introduced in 2004 and is now 5 years old.
Since implementation, new employment
legislation (e.g. age regulations) and
emerging Equal Pay case law, has highlighted
the need for a review of the current pay
structure and associated processes and
procedures. In addition organisational
strategy for 2010+ is likely to strengthen the
focus on performance management and thus
Performance Related Pay. The development of
the new Reward Strategy and associated
policies and practices will commence in 2010
following release of the business strategy.
Achievements to date:
Equal Pay Policy developed outlining the key principles on which all future pay
policy and procedure will be based.
Council confirm that future Reward Strategy and supporting policies and procedures
will:
I. Support the University’s objective of improving performance and rewarding excellent performance.
II. minimise inequalities and equal pay risks III. meet the requirements of Employment Law Legislation IV. more effectively control staff costs
Further Action Planned:
Development of overarching Reward Strategy required, aligned to corporate
strategy and in line with current employment and anti-discrimination legislation.
Due to commence spring 2010.

1
Consider at this point the composition of the panel
and the requirement for any other input, such as from
stakeholders including equality target groups.
To increase provision and support for successful
completion of the course and successful conversion to
employment for BME candidates in line with
government targets and in response to equality issues
that exist more widely across the university.
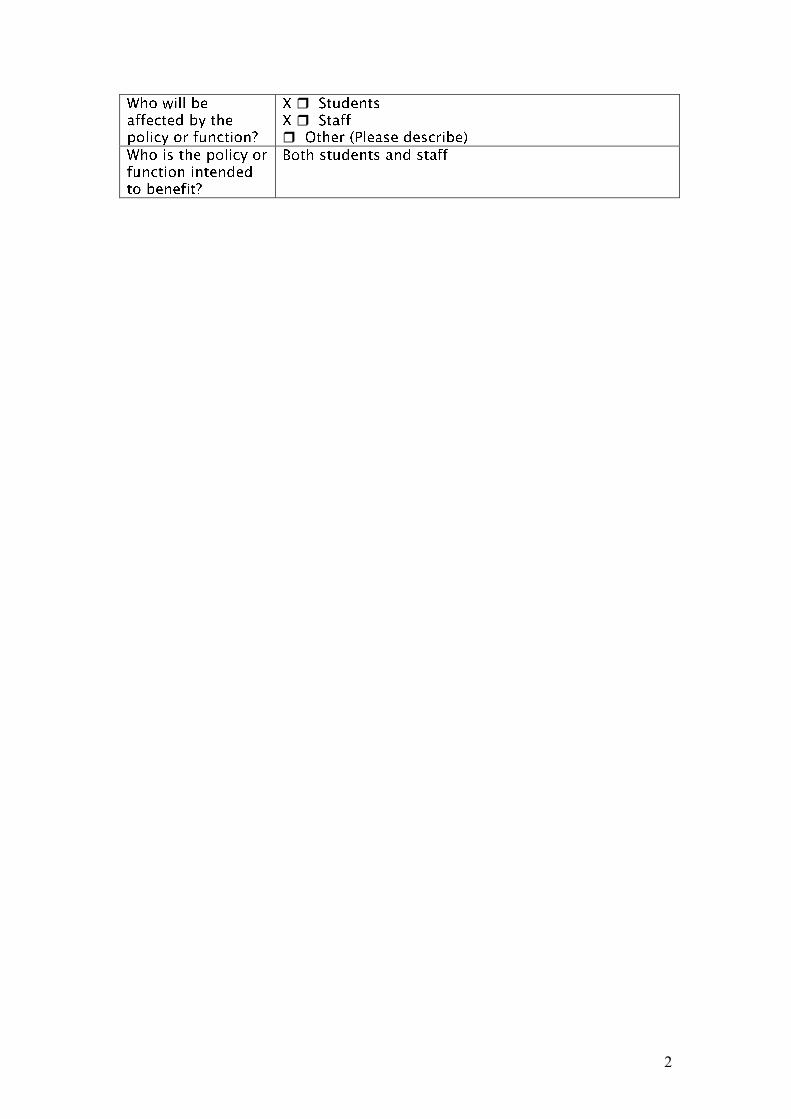
2
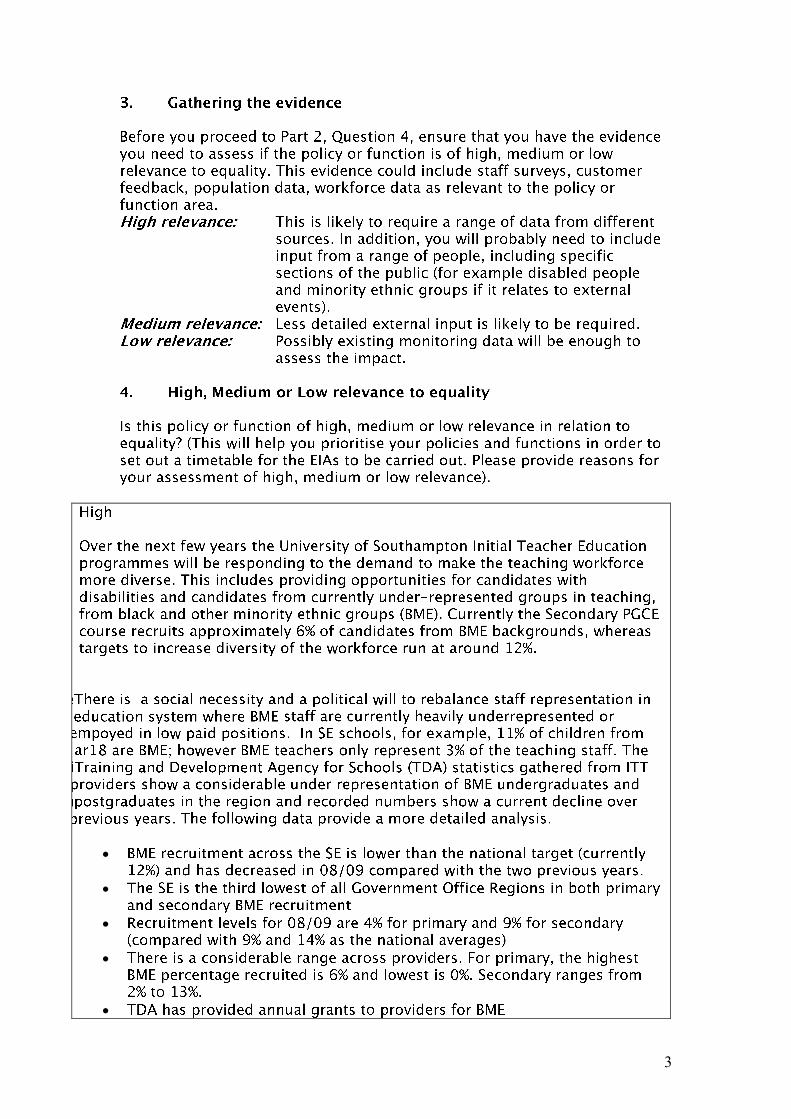
3

4
once recruited their success rate varies. In 2008-09 the
statistics of completion for BME showed 14 BME trainees recruited (5%); all
candidates from Asian groups achieved success on the course, although
conversion to employment varied. Despite success, 2 of the Asian candidates have
still not reported employment, even though they have reported looking
continuously. For black British or Black African candidates (5 on the course in
2008-09), only one of these candidates succeeded to gain employment although it
is important to note that the lack of supported funding for overseas trainees in
teacher education programmes does mean retaining overseas trainees on these
courses can be difficult. Withdrawals due to fee problems and/or other reasons
were recorded reasons for the difficulties of achievement in this group. European
nationals do well on the course, including Polish and Finnish teachers.
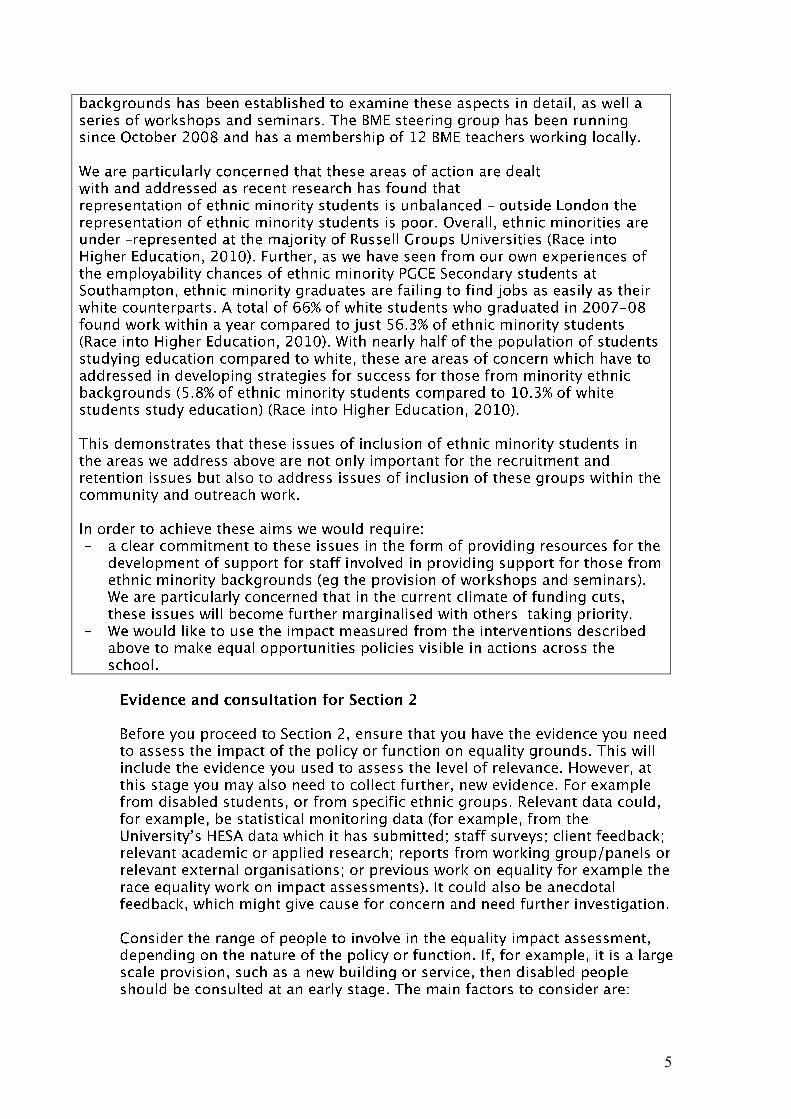
5

6
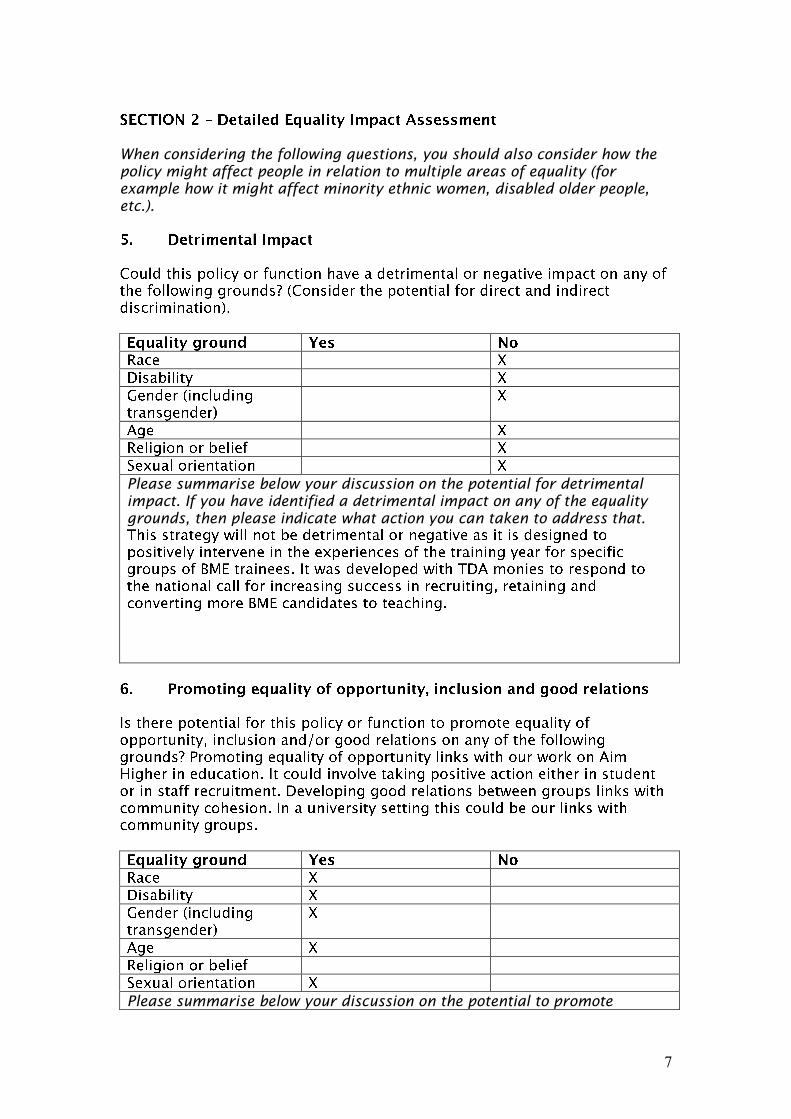
7
When considering the following questions, you should also consider how the
policy might affect people in relation to multiple areas of equality (for
example how it might affect minority ethnic women, disabled older people,
etc.).
Please summarise below your discussion on the potential for detrimental
impact. If you have identified a detrimental impact on any of the equality
grounds, then please indicate what action you can taken to address that.
Please summarise below your discussion on the potential to promote

8
equality of opportunity or good relations. If you have identified any
potential, then please describe, plus indicate any action you plan to take to
make this happen.
but there was no mechanism within the school to report how the
case was managed.
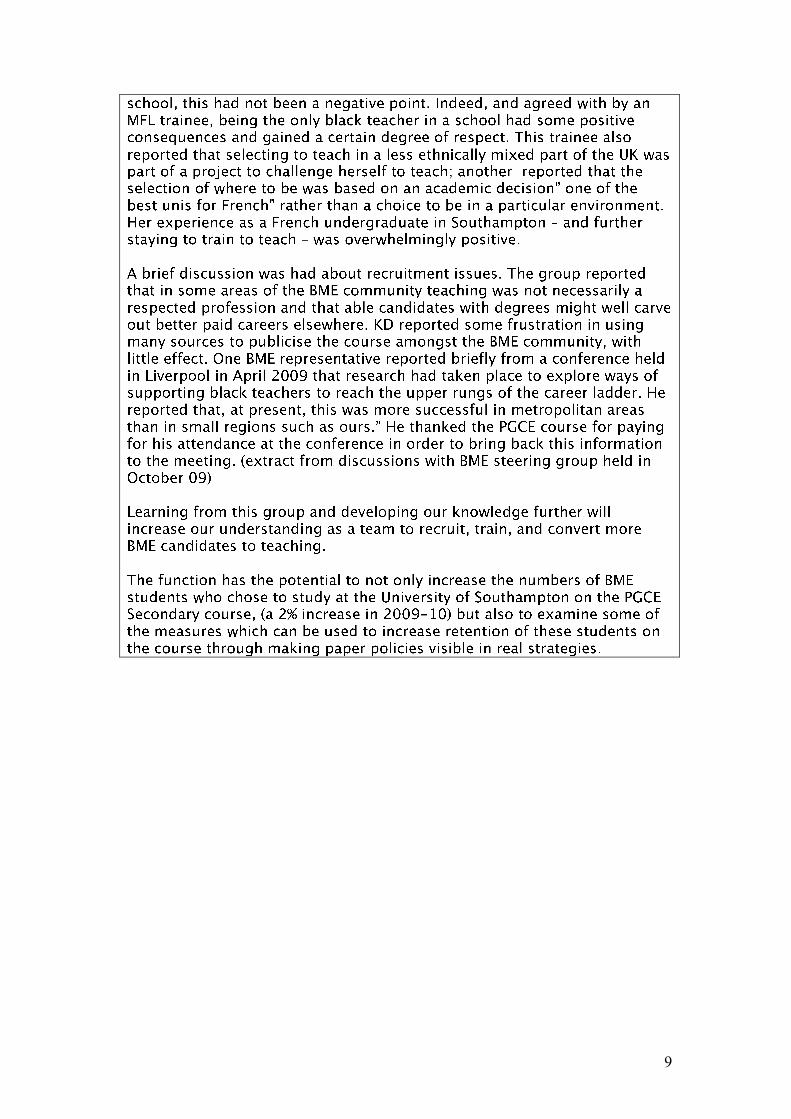
9
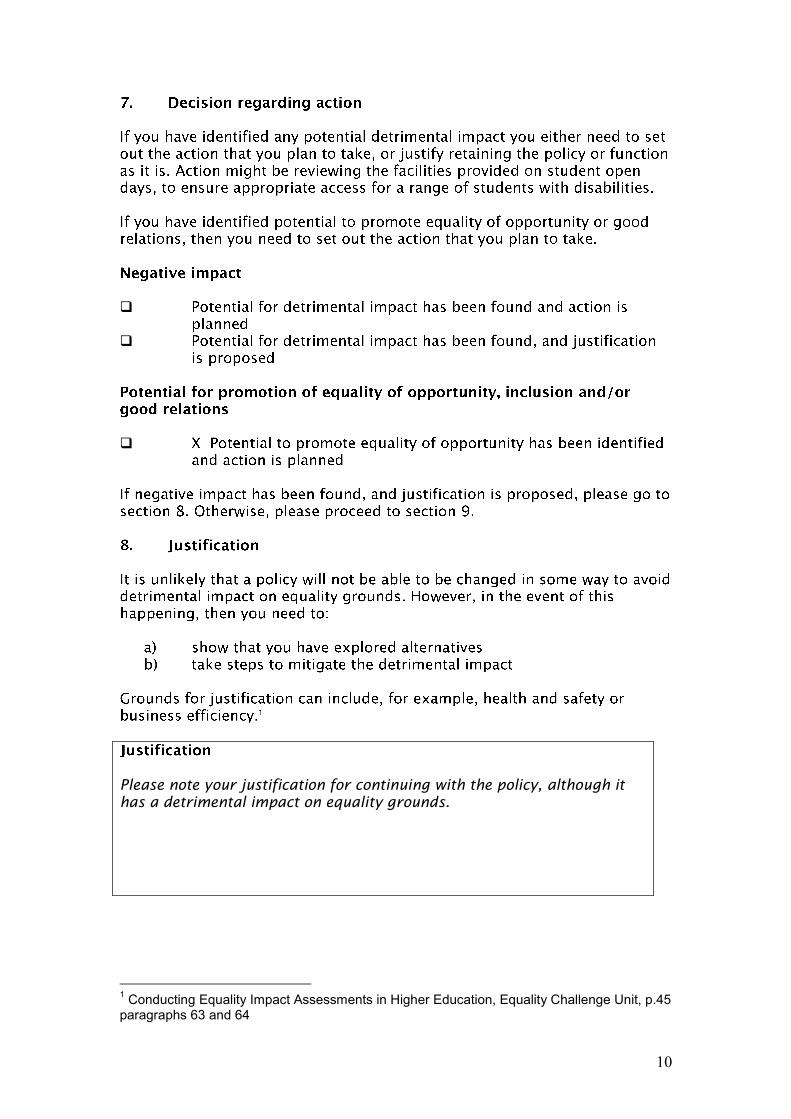
10
Please note your justification for continuing with the policy, although it
has a detrimental impact on equality grounds.
1 Conducting Equality Impact Assessments in Higher Education, Equality Challenge Unit, p.45
paragraphs 63 and 64

11
From the PGCE Improvement Plan 2009-10

12
13

Workbook contents:
Section 1 - Faculty
Section 2 - School
Section 3 - Academic/Support
Section 4 - Career Pathway
Section 5 - Job Grade
Section 6 - Contract Type
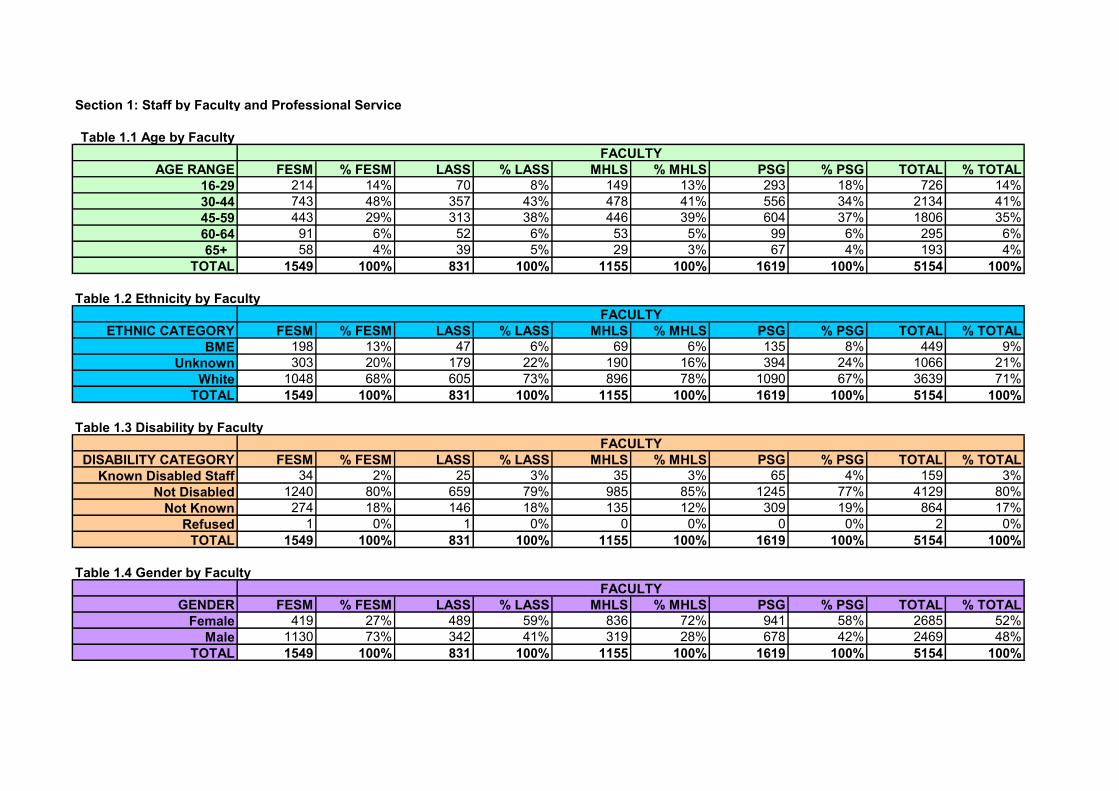
Section 1: Staff by Faculty and Professional Service
Table 1.1 Age by Faculty
AGE RANGE FESM % FESM LASS % LASS MHLS % MHLS PSG % PSG TOTAL % TOTAL
16-29 214 14% 70 8% 149 13% 293 18% 726 14%
30-44 743 48% 357 43% 478 41% 556 34% 2134 41%
45-59 443 29% 313 38% 446 39% 604 37% 1806 35%
60-64 91 6% 52 6% 53 5% 99 6% 295 6%
65+ 58 4% 39 5% 29 3% 67 4% 193 4%
TOTAL 1549 100% 831 100% 1155 100% 1619 100% 5154 100%
Table 1.2 Ethnicity by Faculty
ETHNIC CATEGORY FESM % FESM LASS % LASS MHLS % MHLS PSG % PSG TOTAL % TOTAL
BME 198 13% 47 6% 69 6% 135 8% 449 9%
Unknown 303 20% 179 22% 190 16% 394 24% 1066 21%
White 1048 68% 605 73% 896 78% 1090 67% 3639 71%
TOTAL 1549 100% 831 100% 1155 100% 1619 100% 5154 100%
Table 1.3 Disability by Faculty
DISABILITY CATEGORY FESM % FESM LASS % LASS MHLS % MHLS PSG % PSG TOTAL % TOTAL
Known Disabled Staff 34 2% 25 3% 35 3% 65 4% 159 3%
Not Disabled 1240 80% 659 79% 985 85% 1245 77% 4129 80%
Not Known 274 18% 146 18% 135 12% 309 19% 864 17%
Refused 1 0% 1 0% 0 0% 0 0% 2 0%
TOTAL 1549 100% 831 100% 1155 100% 1619 100% 5154 100%
Table 1.4 Gender by Faculty
GENDER FESM % FESM LASS % LASS MHLS % MHLS PSG % PSG TOTAL % TOTAL
Female 419 27% 489 59% 836 72% 941 58% 2685 52%
Male 1130 73% 342 41% 319 28% 678 42% 2469 48%
TOTAL 1549 100% 831 100% 1155 100% 1619 100% 5154 100%
FACULTY
FACULTY
FACULTY
FACULTY
Section 1: Staff by Faculty and Professional Service: Analysis
The age range for Schools is highest for those between 30-44 (41%), 48% in FESM and this has been relatively consistant for the past 3 years.
In both 2007 and 2008 it was 42%. The same principle applies to 45-49 when it was second highest in both 2007 and 2008 at 36%, and
now at 35%. 65+ remained at 6% in 2007 and 2008, but has now dropped to 4% which may be closly related to retirement legislation.
LASS has the lowest number of people aged 16-29 (8%) which again duplicates the trend in 2007 and 2008 when it was also 8% then.
FESM has the highest number of 30-44 year olds at 48%, which has also remained the same amount from 2007 and 2008.
PSG has the highest percentage of 16-29 year olds at 18% since 2007. 65+ currently has 5% but in 2007 and 2008 both FESM and MHLS
had a slightly higher percentage than other Faculities.
The declaration of White as an ethnicity remains the highest at 71%, which has increased from 2007 and 2008 when it was 68% in both
years. The percentage of staff with an unknown ethnicity category has decreased from 23% in 2008 to 21% this year. The unknown category for staff
ethnicity remains the highest in PSG for the third year, although it has decreased from 26% in 2008 to 24% this year. BME staff consists of 9% of the total
workforce, which has increased over the last 3 years, from 6% in 2007 and 7% in 2008.
Declarations of disability remain the same at 3% now and in 2008. It was 4% in 2007 so only a slight decrease. 'Not Known' has increased
from 13% 2008 to 17% now. PSG has had the highest percentage of disabled people for the past 3 years, 5% in 2007, 4% in 2008 and
2009. FESM has the lowest at 2% which has also remained consistent over the past 3 years.
Overall, there are slightly more females than males employed at the University. This has been the case for the last 3 years. In both 2007
and 2008 we had 51% females and 49% males. This year there is a slightly wider gap of 4% as opposed to 3% in the last 2 years.
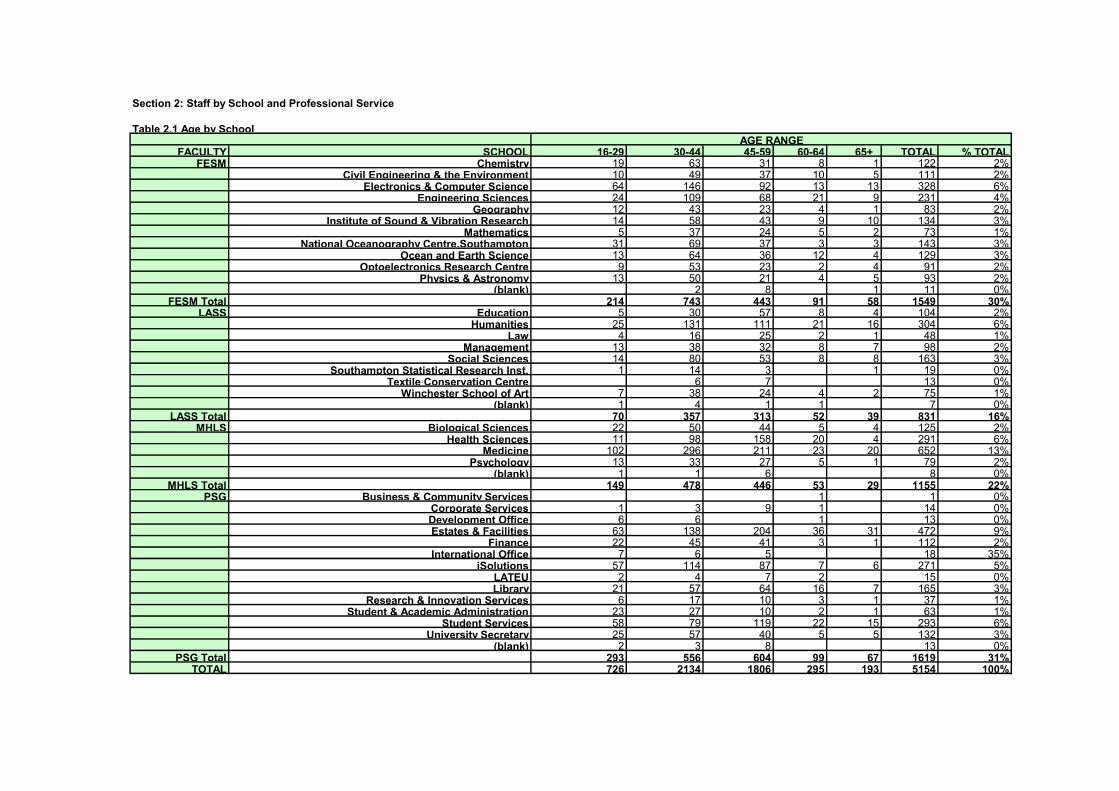
Section 2: Staff by School and Professional Service
Table 2.1 Age by School
FACULTY SCHOOL 16-29 30-44 45-59 60-64 65+ TOTAL % TOTALFESM Chemistry 19 63 31 8 1 122 2%
Civil Engineering & the Environment 10 49 37 10 5 111 2%Electronics & Computer Science 64 146 92 13 13 328 6%
Engineering Sciences 24 109 68 21 9 231 4%Geography 12 43 23 4 1 83 2%
Institute of Sound & Vibration Research 14 58 43 9 10 134 3%Mathematics 5 37 24 5 2 73 1%
National Oceanography Centre,Southampton 31 69 37 3 3 143 3%Ocean and Earth Science 13 64 36 12 4 129 3%
Optoelectronics Research Centre 9 53 23 2 4 91 2%Physics & Astronomy 13 50 21 4 5 93 2%
(blank) 2 8 1 11 0%FESM Total 214 743 443 91 58 1549 30%
LASS Education 5 30 57 8 4 104 2%Humanities 25 131 111 21 16 304 6%
Law 4 16 25 2 1 48 1%Management 13 38 32 8 7 98 2%
Social Sciences 14 80 53 8 8 163 3%Southampton Statistical Research Inst. 1 14 3 1 19 0%
Textile Conservation Centre 6 7 13 0%Winchester School of Art 7 38 24 4 2 75 1%
(blank) 1 4 1 1 7 0%LASS Total 70 357 313 52 39 831 16%
MHLS Biological Sciences 22 50 44 5 4 125 2%Health Sciences 11 98 158 20 4 291 6%
Medicine 102 296 211 23 20 652 13%Psychology 13 33 27 5 1 79 2%
(blank) 1 1 6 8 0%MHLS Total 149 478 446 53 29 1155 22%
PSG Business & Community Services 1 1 0%Corporate Services 1 3 9 1 14 0%Development Office 6 6 1 13 0%Estates & Facilities 63 138 204 36 31 472 9%
Finance 22 45 41 3 1 112 2%International Office 7 6 5 18 35%
iSolutions 57 114 87 7 6 271 5%LATEU 2 4 7 2 15 0%Library 21 57 64 16 7 165 3%
Research & Innovation Services 6 17 10 3 1 37 1%Student & Academic Administration 23 27 10 2 1 63 1%
Student Services 58 79 119 22 15 293 6%University Secretary 25 57 40 5 5 132 3%
(blank) 2 3 8 13 0%PSG Total 293 556 604 99 67 1619 31%
TOTAL 726 2134 1806 295 193 5154 100%
AGE RANGE

Table 2.2 Ethnicity by School
FACULTY SCHOOL BME Unknown White TOTAL % TOTALFESM Chemistry 13 29 80 122 2%
Civil Engineering & the Environment 17 20 74 111 2%Electronics & Computer Science 56 78 194 328 6%
Engineering Sciences 37 41 153 231 4%Geography 7 23 53 83 2%
Institute of Sound & Vibration Research 15 19 100 134 3%Mathematics 16 13 44 73 1%
National Oceanography Centre,Southampton 6 18 119 143 3%Ocean and Earth Science 7 22 100 129 3%
Optoelectronics Research Centre 18 16 57 91 2%Physics & Astronomy 6 24 63 93 2%
(blank) 11 11 0%FESM Total 198 303 1048 1549 30%
LASS Education 6 17 81 104 2%Humanities 8 82 214 304 6%
Law 1 12 35 48 1%Management 9 15 74 98 2%
Social Sciences 15 34 114 163 3%Southampton Statistical Research Inst. 1 2 16 19 0%
Textile Conservation Centre 2 1 10 13 0%Winchester School of Art 5 16 54 75 1%
(blank) 7 7 0%LASS Total 47 179 605 831 16%
MHLS Biological Sciences 5 31 89 125 2%Health Sciences 16 32 243 291 6%
Medicine 43 119 490 652 13%Psychology 5 8 66 79 2%
(blank) 8 8 0%MHLS Total 69 190 896 1155 22%
PSG Business & Community Services 1 1 0%Corporate Services 4 10 14 0%Development Office 2 11 13 0%Estates & Facilities 51 167 254 472 9%
Finance 7 13 92 112 2%International Office 1 4 13 18 0%
iSolutions 20 60 191 271 5%LATEU 3 12 15 0%Library 16 24 125 165 3%
Research & Innovation Services 1 5 31 37 1%Student & Academic Administration 4 12 47 63 1%
Student Services 29 75 189 293 6%University Secretary 6 19 107 132 3%
(blank) 6 7 13 0%PSG Total 135 394 1090 1619 31%
TOTAL 449 1066 3639 5154 100%
ETHNIC CATEGORY
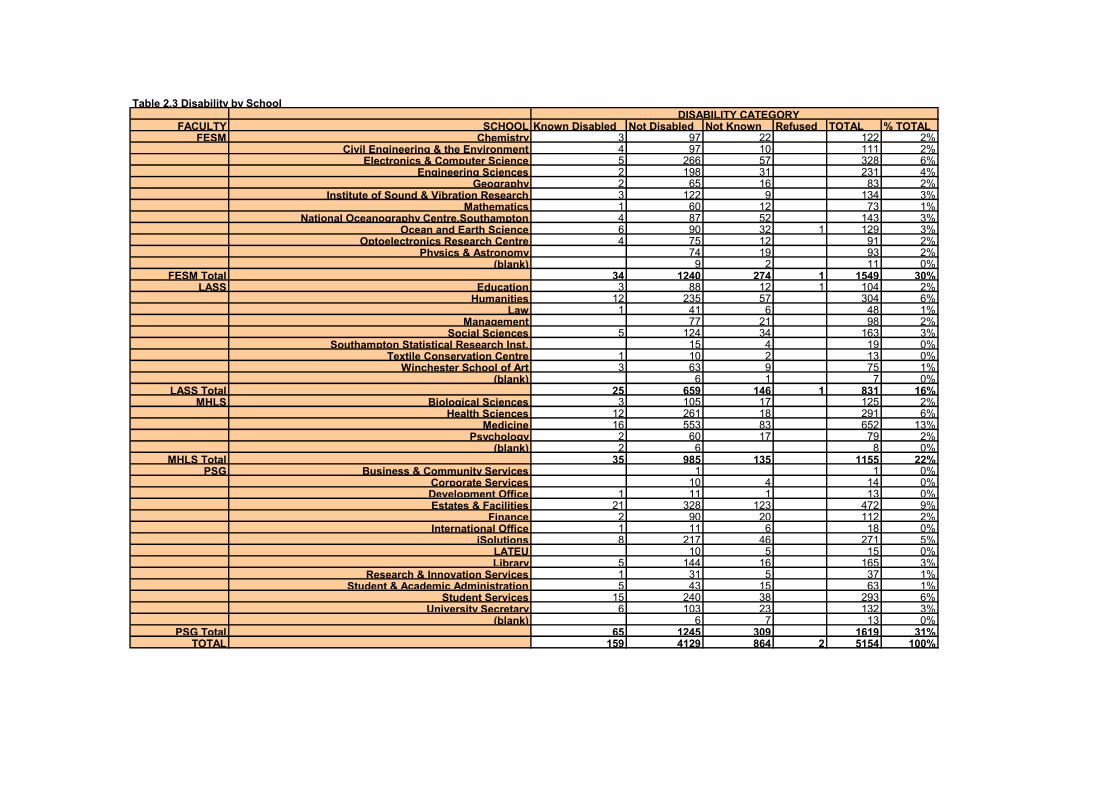
Table 2.3 Disability by SchoolDISABILITY CATEGORY
FACULTY SCHOOL Known Disabled Not Disabled Not Known Refused TOTAL % TOTALFESM Chemistry 3 97 22 122 2%
Civil Engineering & the Environment 4 97 10 111 2%Electronics & Computer Science 5 266 57 328 6%
Engineering Sciences 2 198 31 231 4%Geography 2 65 16 83 2%
Institute of Sound & Vibration Research 3 122 9 134 3%Mathematics 1 60 12 73 1%
National Oceanography Centre,Southampton 4 87 52 143 3%Ocean and Earth Science 6 90 32 1 129 3%
Optoelectronics Research Centre 4 75 12 91 2%Physics & Astronomy 74 19 93 2%
(blank) 9 2 11 0%FESM Total 34 1240 274 1 1549 30%
LASS Education 3 88 12 1 104 2%Humanities 12 235 57 304 6%
Law 1 41 6 48 1%Management 77 21 98 2%
Social Sciences 5 124 34 163 3%Southampton Statistical Research Inst. 15 4 19 0%
Textile Conservation Centre 1 10 2 13 0%Winchester School of Art 3 63 9 75 1%
(blank) 6 1 7 0%LASS Total 25 659 146 1 831 16%
MHLS Biological Sciences 3 105 17 125 2%Health Sciences 12 261 18 291 6%
Medicine 16 553 83 652 13%Psychology 2 60 17 79 2%
(blank) 2 6 8 0%MHLS Total 35 985 135 1155 22%
PSG Business & Community Services 1 1 0%Corporate Services 10 4 14 0%Development Office 1 11 1 13 0%Estates & Facilities 21 328 123 472 9%
Finance 2 90 20 112 2%International Office 1 11 6 18 0%
iSolutions 8 217 46 271 5%LATEU 10 5 15 0%Library 5 144 16 165 3%
Research & Innovation Services 1 31 5 37 1%Student & Academic Administration 5 43 15 63 1%
Student Services 15 240 38 293 6%University Secretary 6 103 23 132 3%
(blank) 6 7 13 0%PSG Total 65 1245 309 1619 31%
TOTAL 159 4129 864 2 5154 100%
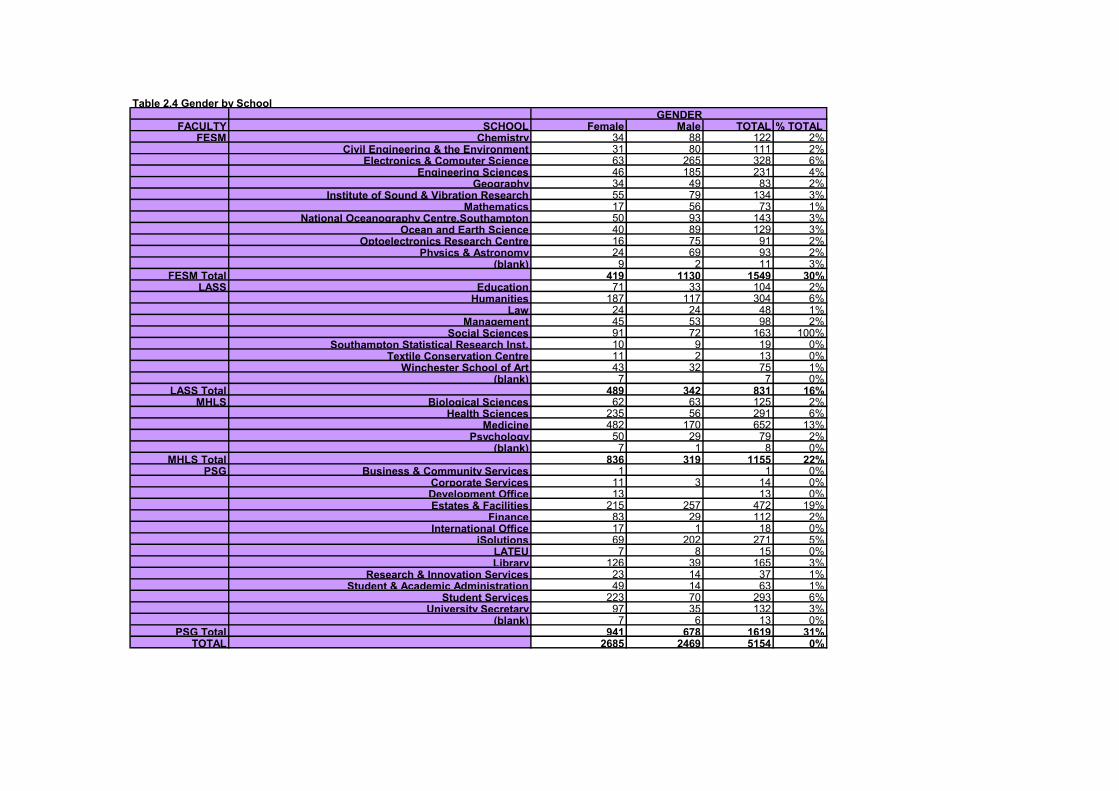
Table 2.4 Gender by School
FACULTY SCHOOL Female Male TOTAL % TOTALFESM Chemistry 34 88 122 2%
Civil Engineering & the Environment 31 80 111 2%Electronics & Computer Science 63 265 328 6%
Engineering Sciences 46 185 231 4%Geography 34 49 83 2%
Institute of Sound & Vibration Research 55 79 134 3%Mathematics 17 56 73 1%
National Oceanography Centre,Southampton 50 93 143 3%Ocean and Earth Science 40 89 129 3%
Optoelectronics Research Centre 16 75 91 2%Physics & Astronomy 24 69 93 2%
(blank) 9 2 11 3%FESM Total 419 1130 1549 30%
LASS Education 71 33 104 2%Humanities 187 117 304 6%
Law 24 24 48 1%Management 45 53 98 2%
Social Sciences 91 72 163 100%Southampton Statistical Research Inst. 10 9 19 0%
Textile Conservation Centre 11 2 13 0%Winchester School of Art 43 32 75 1%
(blank) 7 7 0%LASS Total 489 342 831 16%
MHLS Biological Sciences 62 63 125 2%Health Sciences 235 56 291 6%
Medicine 482 170 652 13%Psychology 50 29 79 2%
(blank) 7 1 8 0%MHLS Total 836 319 1155 22%
PSG Business & Community Services 1 1 0%Corporate Services 11 3 14 0%Development Office 13 13 0%Estates & Facilities 215 257 472 19%
Finance 83 29 112 2%International Office 17 1 18 0%
iSolutions 69 202 271 5%LATEU 7 8 15 0%Library 126 39 165 3%
Research & Innovation Services 23 14 37 1%Student & Academic Administration 49 14 63 1%
Student Services 223 70 293 6%University Secretary 97 35 132 3%
(blank) 7 6 13 0%PSG Total 941 678 1619 31%
TOTAL 2685 2469 5154 0%
GENDER
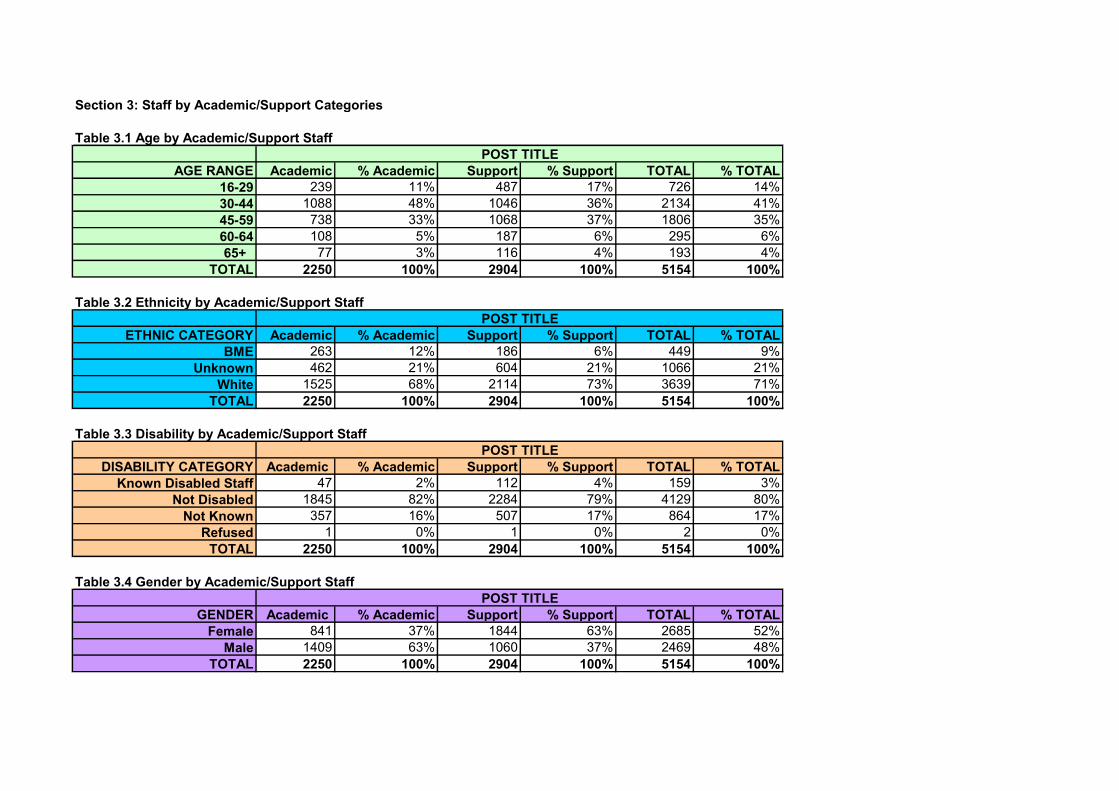
Section 3: Staff by Academic/Support Categories
Table 3.1 Age by Academic/Support Staff
AGE RANGE Academic % Academic Support % Support TOTAL % TOTAL
16-29 239 11% 487 17% 726 14%
30-44 1088 48% 1046 36% 2134 41%
45-59 738 33% 1068 37% 1806 35%
60-64 108 5% 187 6% 295 6%
65+ 77 3% 116 4% 193 4%
TOTAL 2250 100% 2904 100% 5154 100%
Table 3.2 Ethnicity by Academic/Support Staff
ETHNIC CATEGORY Academic % Academic Support % Support TOTAL % TOTAL
BME 263 12% 186 6% 449 9%
Unknown 462 21% 604 21% 1066 21%
White 1525 68% 2114 73% 3639 71%
TOTAL 2250 100% 2904 100% 5154 100%
Table 3.3 Disability by Academic/Support Staff
DISABILITY CATEGORY Academic % Academic Support % Support TOTAL % TOTAL
Known Disabled Staff 47 2% 112 4% 159 3%
Not Disabled 1845 82% 2284 79% 4129 80%
Not Known 357 16% 507 17% 864 17%
Refused 1 0% 1 0% 2 0%
TOTAL 2250 100% 2904 100% 5154 100%
Table 3.4 Gender by Academic/Support Staff
GENDER Academic % Academic Support % Support TOTAL % TOTAL
Female 841 37% 1844 63% 2685 52%
Male 1409 63% 1060 37% 2469 48%
TOTAL 2250 100% 2904 100% 5154 100%
POST TITLE
POST TITLE
POST TITLE
POST TITLE

Section 3: Staff by Academic/Support Categories: Analysis
The highest headcount for academic staff is in the age range of 30-44 at 48% (nearly half of the workforce). This is similar to 2007 where 50%
of academic staff were 30-44 and in 2008 it was 49%. It has only fractional decreased over the past 3 years.The lowest percentage of academic
staff are aged 65+ at 3% and this was lower in 2008 and 2007 at 1%.
The highest percentage of support staff were aged 45-59 at 39% in 2007, and 39% in 2008. It has dropped by 2% to 37% this year. The lowest
percentage is 4% for 65+ support staff and this was lower in 2007 at 0.5% and 0% in 2008.
BME Academic Staff consist of only 12% whereas 68% are of the declared white ethnic category. However, this is an increase from last year
when declared bme staff was 9% and the declared white ethnic category was 65%. There has also been a slight increase since last year for
support staff as declared bme staff was 5% but is now 6%, and the declared white ethnic category was 71% but is now 73%.
Known disabled staff within Academic staff is 1% and slightly higher for Support staff at 2%. This varies slightly from 2007 and 2008 when Academic
known disabled staff was only 2% and for support staff it was only 4% in both years.
Female Academic staff remains low at 31% and 69% of female staff are in Support roles. Male Academic staff consist of 57% of all male staff
and remains lower at 43% for support roles. Overall female support staff consist of the highest percentage at 36% of all staff,
and the lowest is female academics at 16%, leaving a gap of 20%. The gap between male academics and male supoort staff is much closer at only
6% (male academics 27% and support 21%).
There was only a slightly lesser gap in 2008 when female academics was 37% and support staff was 63%, and a larger gap between the male
academics at 63% and support was 37%.
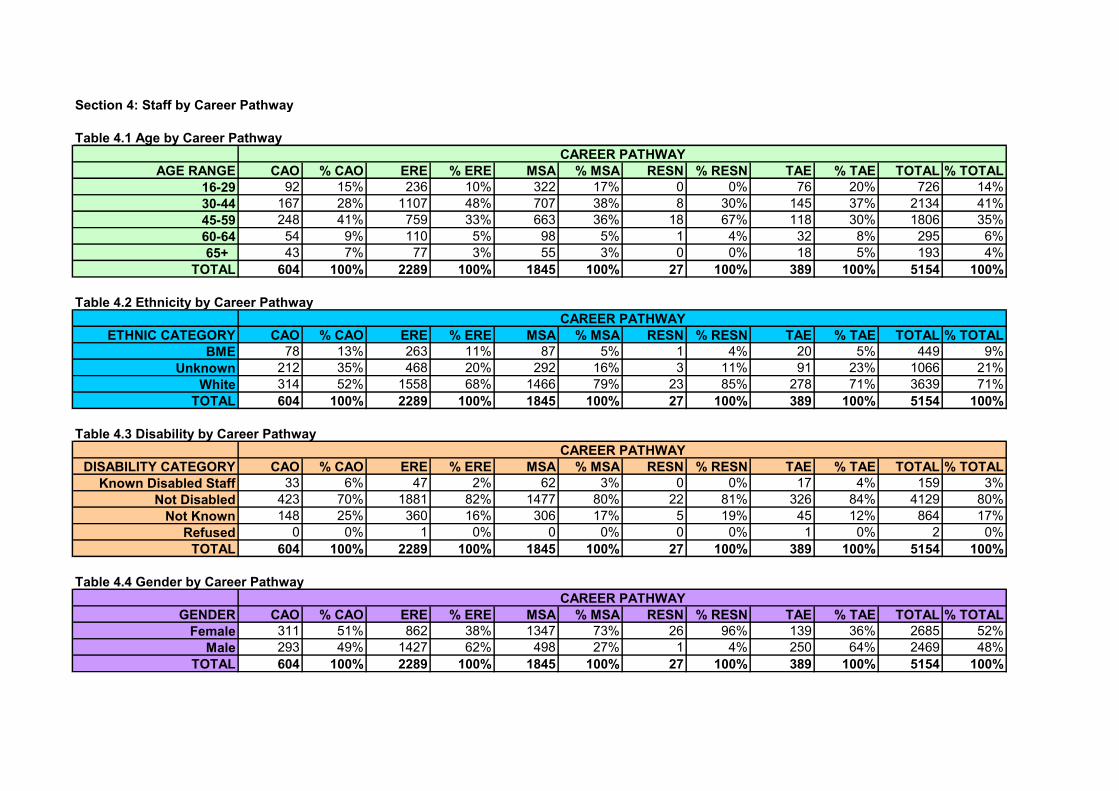
Section 4: Staff by Career Pathway
Table 4.1 Age by Career Pathway
AGE RANGE CAO % CAO ERE % ERE MSA % MSA RESN % RESN TAE % TAE TOTAL % TOTAL
16-29 92 15% 236 10% 322 17% 0 0% 76 20% 726 14%
30-44 167 28% 1107 48% 707 38% 8 30% 145 37% 2134 41%
45-59 248 41% 759 33% 663 36% 18 67% 118 30% 1806 35%
60-64 54 9% 110 5% 98 5% 1 4% 32 8% 295 6%
65+ 43 7% 77 3% 55 3% 0 0% 18 5% 193 4%
TOTAL 604 100% 2289 100% 1845 100% 27 100% 389 100% 5154 100%
Table 4.2 Ethnicity by Career Pathway
ETHNIC CATEGORY CAO % CAO ERE % ERE MSA % MSA RESN % RESN TAE % TAE TOTAL % TOTAL
BME 78 13% 263 11% 87 5% 1 4% 20 5% 449 9%
Unknown 212 35% 468 20% 292 16% 3 11% 91 23% 1066 21%
White 314 52% 1558 68% 1466 79% 23 85% 278 71% 3639 71%
TOTAL 604 100% 2289 100% 1845 100% 27 100% 389 100% 5154 100%
Table 4.3 Disability by Career Pathway
DISABILITY CATEGORY CAO % CAO ERE % ERE MSA % MSA RESN % RESN TAE % TAE TOTAL % TOTAL
Known Disabled Staff 33 6% 47 2% 62 3% 0 0% 17 4% 159 3%
Not Disabled 423 70% 1881 82% 1477 80% 22 81% 326 84% 4129 80%
Not Known 148 25% 360 16% 306 17% 5 19% 45 12% 864 17%
Refused 0 0% 1 0% 0 0% 0 0% 1 0% 2 0%
TOTAL 604 100% 2289 100% 1845 100% 27 100% 389 100% 5154 100%
Table 4.4 Gender by Career Pathway
GENDER CAO % CAO ERE % ERE MSA % MSA RESN % RESN TAE % TAE TOTAL % TOTAL
Female 311 51% 862 38% 1347 73% 26 96% 139 36% 2685 52%
Male 293 49% 1427 62% 498 27% 1 4% 250 64% 2469 48%
TOTAL 604 100% 2289 100% 1845 100% 27 100% 389 100% 5154 100%
CAREER PATHWAY
CAREER PATHWAY
CAREER PATHWAY
CAREER PATHWAY

Section 4: Staff by Career Pathway: Analysis
The highest proportion of ERE, MSA and TAE staff are in the 30-44 age group. In 2007 and 2008 this was also true of ERE and TAE staff.
CAO (41%) and RESN had the highest percentage of staff aged 45-59, which was also the case for CAO in 2007 and 2008 (45%).
CAO has the highest percentage of declared bme staff at 13%, closely followed by ERE pathway at 11%. It shows a slight increase from last year
when both career pathways were 10%. TAE and MSA both remain the lowest career pathways with declared bme staff for the third year running.
CAO has the highest percentage of disabled people (6%) and ERE has the lowest (2%). This has remained at the same percentage for the last 3 years.
CAO also had the highest percentage of disabled staff in 2007 (6%) and in 2008 (6%) and ERE had the lowest in both years (2%).
CAO has an even spread of sexes but the biggest difference is in RESN where 4% of staff (1) is male and 96% (26) is female.
MSA also has a 46% difference as 27% are male and 73 % are female.
TAE has the highest percentage of men at 64%. RESN followed by MSA have the highest percentages of women.
As RESN only consists of 27 members of staff, I have focused on the other pathways for comparative analysis.

Section 5: Staff by Job Grade
Table 5.1 Age by Job Grade
AGE RANGE Level 1a Level 1b Level 2a Level 2b Level 3 Level 4 Level 5 Level 6 Level 7 TOTAL16-29 36 52 50 115 137 318 18 0 0 726
30-44 87 41 75 184 244 760 523 166 54 2134
45-59 130 68 74 188 217 277 372 244 236 1806
60-64 31 21 13 35 34 43 34 24 60 295
65+ 26 13 12 12 18 25 29 29 29 193
TOTAL 310 195 224 534 650 1423 976 463 379 5154
Table 5.2 % Age by Job Grade
AGE RANGE % Level 1a % Level 1b % Level 2a % Level 2b % Level 3 % Level 4 % Level 5 % Level 6 % Level 7 % TOTAL16-29 12% 27% 22% 22% 21% 22% 2% 0% 0% 14%
30-44 28% 21% 33% 34% 38% 53% 54% 36% 14% 41%
45-59 42% 35% 33% 35% 33% 19% 38% 53% 62% 35%
60-64 10% 11% 6% 7% 5% 3% 3% 5% 16% 6%
65+ 8% 7% 5% 2% 3% 2% 3% 6% 8% 4%
TOTAL 100% 100% 100% 100% 100% 100% 100% 100% 100% 100%
Table 5.3 Ethnicity by Job Grade
ETHNIC CATEGORY Level 1a Level 1b Level 2a Level 2b Level 3 Level 4 Level 5 Level 6 Level 7 TOTALBME 70 11 16 15 31 176 83 33 14 449
Unknown 132 55 47 107 96 283 170 84 92 1066
White 108 129 161 412 523 964 723 346 273 3639
TOTAL 310 195 224 534 650 1423 976 463 379 5154
Table 5.4 % Ethnicity by Job Grade
ETHNIC CATEGORY % Level 1a % Level 1b % Level 2a % Level 2b % Level 3 % Level 4 % Level 5 % Level 6 % Level 7 % TOTALBME 23% 6% 7% 3% 5% 12% 9% 7% 4% 9%
Unknown 43% 28% 21% 20% 15% 20% 17% 18% 24% 21%
White 35% 66% 72% 77% 80% 68% 74% 75% 72% 71%
TOTAL 100% 100% 100% 100% 100% 100% 100% 100% 100% 100%
GRADE
GRADE
GRADE
GRADE

Table 5.5 BME by Job Grade
ETHNIC CATEGORY Level 1a Level 1b Level 2a Level 2b Level 3 Level 4 Level 5 Level 6 Level 7 TOTALBME 70 11 16 15 31 176 83 33 14 449
% BME 16% 2% 4% 3% 7% 39% 19% 7% 3% 100%
Table 5.6 Disability by Job Grade
DISABILITY CATEGORY Level 1a Level 1b Level 2a Level 2b Level 3 Level 4 Level 5 Level 6 Level 7 TOTALKnown Disabled Staff 18 3 9 25 25 31 27 11 10 159
Not Disabled 216 137 172 390 531 1065 845 426 347 4129
Not Known 76 55 43 119 93 327 103 26 22 864
Refused 0 0 0 0 1 0 1 0 0 2
TOTAL 310 195 224 534 650 1423 976 463 379 5154
DISABILITY CATEGORY % Level 1a % Level 1b % Level 2a % Level 2b % Level 3 % Level 4 % Level 5 % Level 6 % Level 7 % TOTALKnown Disabled Staff 6% 2% 4% 5% 4% 2% 3% 2% 3% 3%
Not Disabled 70% 70% 77% 73% 82% 75% 87% 92% 92% 80%
Not Known 25% 28% 19% 22% 14% 23% 11% 6% 6% 17%
Refused 0% 0% 0% 0% 0% 0% 0% 0% 0% 0%
TOTAL 100% 100% 100% 100% 100% 100% 100% 100% 100% 100%
Table 5.8 Gender by Job Grade
Gender Level 1a Level 1b Level 2a Level 2b Level 3 Level 4 Level 5 Level 6 Level 7 TOTALFemale 207 115 166 399 435 680 455 154 74 2685
Male 103 80 58 135 215 743 521 309 305 2469
TOTAL 310 195 224 534 650 1423 976 463 379 5154
Table 5.9 % Gender by Job Grade
Gender % Level 1a % Level 1b % Level 2a % Level 2b % Level 3 % Level 4 % Level 5 % Level 6 % Level 7 % TOTALFemale 66% 59% 74% 75% 67% 48% 47% 33% 20% 52%
Male 33% 41% 26% 25% 33% 52% 53% 67% 80% 48%
TOTAL 100% 100% 100% 100% 100% 100% 100% 100% 100% 100%
GRADE
GRADE
GRADE
GRADE
Table 5.7 % Disability by Job Grade
GRADE

Section 5: Staff by Job Grade: Analysis
The highest percentage of staff are aged 45-59 and grade 7 (62%). This was also true in 2007 where 62% of people aged 45-59 were grade 7, and in 2008 when 65% grade 7s were aged 45-59. There have been no members of staff aged 16-29 over the 3 years at a grade 6 and 7.
The highest percentage of white ethnic category is 81% at grade 3 and this was also true in 2007 (79%) and 2008 (80%).The highest for BME is at grade 1a (23%) and the lowest is 2b (2%). 4% of staff at grade 7 are from the BME category.
Out of 449 BME staff, the highest % work at grade 4 and the lowest % work at Level 1b. BME staff are mostly in the middle grade Levels.
The highest percentage of disabled staff are at level 1a at 6% and the lowest are at levels 1b, 4 and 6 at 2%. This is the same as 2008.However this has changed from 2007 where 6% (the highest) of disabled staff were level 2b and the lowest was level 4 at 3%.
There is a higher proportion of women at the lower job levels of 1-3 and this was true in 2007 and 2008. There is a higher proportion of men at the higher job levels of 4-7, with the highest gap being at level 7, where 20% are womenand 80% are men.This has been the case in 2007 and 2008.Women make up 52% of the workforce (51% in 2008) and men make up 48% (49% last year).

Section 6: Staff by Contract Type: Analysis
Table 6.1 Age by Fixed Term / Permanent Staff
AGE RANGE Fixed Term % Fixed Term Permanent % Permanent TOTAL % TOTAL16-29 346 29% 380 10% 726 14%
30-44 598 50% 1536 39% 2134 41%
45-59 190 16% 1616 41% 1806 35%
60-64 26 2% 269 7% 295 6%
65+ 30 3% 163 4% 193 4%
TOTAL 1190 100% 3964 100% 5154 100%
Table 6.2 Age by Full Time / Part Time Staff
AGE RANGE Full Time % Full Time Part Time % Part Time TOTAL % TOTAL16-29 640 16% 86 7% 726 14%
30-44 1691 43% 443 37% 2134 41%
45-59 1330 34% 476 40% 1806 35%
60-64 198 5% 97 8% 295 6%
65+ 110 3% 83 7% 193 4%
TOTAL 3969 100% 1185 100% 5154 100%
Table 6.3 Ethnicity by Fixed Term / Permanent Staff
ETHNIC CATEGORY Fixed Term % Fixed Term Permanent % Permanent TOTAL % TOTALBME 161 14% 288 7% 449 9%
Unknown 248 21% 818 21% 1066 21%
White 781 66% 2858 72% 3639 71%
TOTAL 1190 100% 3964 100% 5154 100%
Table 6.4 Ethnicity by Full Time / Part Time Staff
ETHNIC CATEGORY Full Time % Full Time Part Time % Part Time TOTAL % TOTALBME 342 9% 107 9% 449 9%
Unknown 767 19% 299 25% 1066 21%
White 2860 72% 779 66% 3639 71%
TOTAL 3969 100% 1185 100% 5154 100%
CONTRACT TYPE
CONTRACT TYPE
CONTRACT TYPE
CONTRACT TYPE

Table 6.5 Disability by Fixed Term / Permanent Staff
DISABILITY CATEGORY Fixed Term % Fixed Term Permanent % Permanent TOTAL % TOTALKnown Disabled Staff 19 2% 140 4% 159 3%
Not Disabled 829 70% 3300 83% 4129 80%
Not Known 341 29% 523 13% 864 17%
Refused 1 0% 1 0% 2 0%
TOTAL 1190 100% 3964 100% 5154 100%
Table 6.6 Disability by Full Time / Part Time Staff
DISABILITY CATEGORY Full Time % Full Time Part Time % Part Time TOTAL % TOTALKnown Disabled Staff 118 3% 41 3% 159 3%
Not Disabled 3146 79% 983 83% 4129 80%
Not Known 704 18% 160 14% 864 17%
Refused 1 0% 1 0% 2 0%
TOTAL 3969 100% 1185 100% 5154 100%
Table 6.7 Gender by Fixed Term / Permanent Staff
GENDER Fixed Term % Fixed Term Permanent % Permanent TOTAL % TOTALFemale 626 53% 2059 52% 2685 52%
Male 564 47% 1905 48% 2469 48%
TOTAL 1190 100% 3964 100% 5154 100%
Table 6.8 Gender by Full Time / Part Time Staff
GENDER Full Time % Full Time Part Time % Part Time TOTAL % TOTALFemale 1724 43% 961 81% 2685 52%
Male 2245 57% 224 19% 2469 48%
TOTAL 3969 100% 1185 100% 5154 100%
CONTRACT TYPE
CONTRACT TYPE
CONTRACT TYPE
CONTRACT TYPE
Section 6: Staff by Contract Type: Analysis
50% of staff on fixed term contracts are aged between 30-44 years of age. This was relatively similar in 2007 when it was 52% in 2007 and no change in 2008 when it was still 50%.
The higest proportion of full-time staff are within the 30-44 age category, and the highest proportion of part-time staff are in the 45-59 category. This has remained the same since 2007.
There are only 7% BME staff on permanent contracts as opposed to 72% of White staff.There is a 7% increase of BME staff on fixed term contracts from permanent, and a decrease of 6% from permanent to fixed term for White staff. Permanent White staff has remained consistent since 2007 at 72%.
There has been little change of the percentage of White part-time staff (2007 - 64% and 2008 65%).However there has been a slight increase by 4% of White full-time staff since 2007 and a 3% increase since 2008
Known disabled staff on permanent / fixed term and full-time / part time contracts remains unchanged since2007. Known disabled staff on permanent / fixed term contracts is very similar, and the number of staff on bothfull-time and part-time contracts is the same at 3%.
A slightly higher percentage of women are on fixed term (only 6% more women than men) and permanent (only 4%) contracts. In 2007 this picture was reversed when 7% more men were on fixed term contracts thanwomen. In 2008 there was only 2% more women on fixed term contracts than men.
The percentage for full-time and part-time staff for both men and women has remained consistent since 2007.