Embed Size (px)
Citation preview


Southeast Alaska Power Agency Swan Lake Hydroelectric Project
Feasibility Study – Final Report Page i June 13, 2012
TABLE OF CONTENTS
Section 1 Introduction .................................................................................................................... 1 1.0 Purpose .................................................................................................................................... 1 1.1 Scope ....................................................................................................................................... 1 1.2 Authorization ........................................................................................................................... 2 1.3 Background ............................................................................................................................. 2 Section 2 Pertinent data and design criteria.................................................................................... 3 2.0 Introduction ............................................................................................................................. 3 2.1 Pertinent Data ..................................................................................................................... 3 2.2 Existing Facility Description ................................................................................................... 3 2.2.1 General ............................................................................................................................... 3 2.2.2 Dam .................................................................................................................................... 3 2.2.3 Reservoir ............................................................................................................................ 4 2.2.4 Spillway .............................................................................................................................. 4 2.2.5 Power Intake ....................................................................................................................... 4 2.2.6 Power Tunnel ..................................................................................................................... 4 2.2.7 Power Plant ........................................................................................................................ 4 2.2.8 Switchyard .......................................................................................................................... 5 2.2.9 Support Facilities ................................................................................................................ 5 2.3 Design Criteria ........................................................................................................................ 5 2.3.1 Hydrological Data .............................................................................................................. 5 2.3.2 Hydraulics .......................................................................................................................... 6 2.3.3 Structural ............................................................................................................................ 6 2.3.3.1 Dam Geometry ................................................................................................................... 6 2.3.3.2 Material Properties ............................................................................................................. 7 2.3.3.3 Loads Used for Analysis ..................................................................................................... 7 2.3.3.4 Load Combinations for Dam Analysis ................................................................................ 8 2.3.3.5 Factor of Safety ................................................................................................................. 8 2.3.3.6 Allowable Concrete Stresses .............................................................................................. 8 2.3.4 Mechanical ......................................................................................................................... 9 2.3.5 Geology and Seismicity ...................................................................................................... 9 Section 3 Existing Dam Assessment for 10, 15, and 20 Feet Lake Raise ..................................... 10 3.1 Introduction ........................................................................................................................... 10 3.2 General Approach ................................................................................................................. 10 3.3 Dam Structural Analyses ....................................................................................................... 10 3.3.1 Arch Dam .............................................................................................................................. 10 3.3.1.1 Comparison of Stresses from SAP2000 Model with Stresses in the Construction
Documents ........................................................................................................................ 11 3.3.1.2 Percentage Stress Levels in Dam for Varying Lake Levels ............................................. 11 3.3.1.3 Dam Analysis Conclusions .............................................................................................. 12 3.3.1.4 Intake Structure ................................................................................................................ 13 3.3.2 Power Intake Structure Equipment and Isolation Gate .................................................... 13 3.3.2.1 Evaluation of Impacts of 10, 15, and 20 Foot Reservoir Raise on Intake Structure and
Isolation Gate ................................................................................................................... 13 3.3.2.2 Conclusions ...................................................................................................................... 16 3.3.3 Evaluation of Impacts of 10, 15, and 20 Foot Reservoir Raise on the Power Tunnel and
Penstock ........................................................................................................................... 17 3.3.4 Evaluation of Impacts of 10, 15, and 20 Foot Reservoir Raise on Powerhouse, Turbine,
Butterfly Valves, and Other Equipment ........................................................................... 18

Southeast Alaska Power Agency Swan Lake Hydroelectric Project
Feasibility Study – Final Report Page ii June 13, 2012
3.4 Spillway ................................................................................................................................. 21 3.5 Conclusions ........................................................................................................................... 22 Section 4 Dam Raise Alternatives ................................................................................................. 23 4.1 Introduction ........................................................................................................................... 23 4.2 General Approach ................................................................................................................. 23 4.3 Spillway Configurations and Approach ................................................................................ 23 4.3.1 Spillway Alternatives ....................................................................................................... 24 4.3.2 Alternative B1 Obermeyer Gate ....................................................................................... 24 4.3.3 Alternative B2 Rubber Dam ............................................................................................. 25 4.3.4 Alternative B3 Roller Gate ............................................................................................... 25 4.3.5 Alternative B4 Raised Fixed Crest ................................................................................... 25 4.3.6 Alternative S1 Fuse Plug .................................................................................................. 25 4.3.7 Alternative S2 Low Level Outlet Valve ........................................................................... 26 4.3.8 Alternative S3 Siphon Spillway ....................................................................................... 26 4.3.9 Spillway Alternative Evaluation....................................................................................... 26 4.4 10 Feet Lake Raise ................................................................................................................ 28 4.4.1 Spillway Configuration .................................................................................................... 28 4.4.2 Dam .................................................................................................................................. 28 4.4.3 Intake Structure ................................................................................................................ 29 4.5 15 Feet Lake Raise ................................................................................................................ 29 4.5.1 Spillway Configuration .................................................................................................... 29 4.5.2 Dam .................................................................................................................................. 29 4.5.3 Intake Structure ................................................................................................................ 29 4.6 20 Feet Lake Raise ................................................................................................................ 29 4.6.1 Spillway Configuration .................................................................................................... 29 4.6.2 Dam .................................................................................................................................. 29 4.6.3 Intake Structure ................................................................................................................ 30 4.7 PFM Evaluation..................................................................................................................... 30 4.7.1 Impact on Category II Load Cases ................................................................................... 30 4.7.1.1 PFM No. 3 - Erosion of Plunge Pool Undermining the Toe of Dam ............................... 30 4.7.1.2 PFM No. 4 - Blocked Spillway Causing Overtopping of Dam ........................................ 31 4.7.1.3 PFM No. 6 - Abutment Block Failures ............................................................................ 32 4.7.1.4 PFM No. 13 - Earthquake Causing Right Abutment Block Failures ............................... 32 4.7.2 Impact on Category IV Load Cases.................................................................................. 32 4.7.2.1 PFM No. 8 – Load Rejection Surge Pressure Increase ..................................................... 32 4.7.2.2 PFM No. 9 – Seepage through Foundation Causing Deterioration of Rock .................... 33 4.7.2.3 PFM No. 11 – Earthquake Causing Landslide into Reservoir ......................................... 33 4.7.2.4 PFM No. 13 – Earthquake Causing Rock Slabs to Fall onto Dam Left Side ................... 33 4.7.2.5 PFM NO. 1 – Overtopping of Dam and Erosion Damage to Abutments ......................... 33 4.7.2.6 PFM No. 14 – Earthquake Loading on Dam Causing Differential Block Movement ..... 34 4.8 Conclusions ........................................................................................................................... 34 Section 5 Cost Estimates And Construction .................................................................................. 36 5.0 Introduction ........................................................................................................................... 36 5.1 Basis of Cost Estimate ........................................................................................................... 36 5.2 Precision of Cost Estimates ................................................................................................... 36 5.3 Construction Schedule ........................................................................................................... 36 5.4 Project Cost Summary ........................................................................................................... 37 5.5 Assumptions .......................................................................................................................... 37 5.5.1 General ............................................................................................................................. 37 5.5.2 Mobilization ..................................................................................................................... 38 5.5.3 Preparatory Work ............................................................................................................. 38

Southeast Alaska Power Agency Swan Lake Hydroelectric Project
Feasibility Study – Final Report Page iii June 13, 2012
5.5.4 Construction ..................................................................................................................... 38 5.5.5 Start-Up and Testing ........................................................................................................ 39 Section 6 Conclusions And Recommendations ............................................................................. 40 6.0 Conclusions ........................................................................................................................... 40 6.1 Recommendations ................................................................................................................. 41 References ..................................................................................................................................... 42
TABLES
Table 2-1. Key Reservoir and Hydrological Data .......................................................................... 4 Table 2-2. Summary of Hydrological Design Criteria ................................................................... 5 Table 2-3. Existing Dam Geometry ................................................................................................. 6 Table 2-4. Concrete Properties ........................................................................................................ 7 Table 2-5. Anticipated Load Conditions ......................................................................................... 7 Table 2-6. Load Combinations ........................................................................................................ 8 Table 2-7. Load Combinations Required Factor of Safety .............................................................. 8 Table 2-8. Allowable Concrete Stresses .......................................................................................... 9 Table 3-1. Average Dam Arch and Cantilever Stresses (LC-1 Load Case) .................................. 11 Table 3-2. Average Arch Stresses at Dam Elevation 240/Station 10+00 ...................................... 12 Table 3-3. Average Arch Stresses at Dam Elevation 300/Station 11+28 ...................................... 12 Table 3-4. Average Arch Stresses at Dam Elevation 210/Station 10+00 ...................................... 12 Table 3-5. Average Arch Stresses at Dam Elevation 300/Station 11+59 ...................................... 12 Table 3-6. Power Intake Pertinent Data ........................................................................................ 13 Table 3-7. Gate and Wheel Loads ................................................................................................. 14 Table 3-8. Tunnel and Penstock Properties ................................................................................... 17 Table 3-9. Tunnel and Penstock Pressures .................................................................................... 17 Table 3-10. Powerhouse Equipment Data ..................................................................................... 18 Table 3-11. Expected Versus Current Powerhouse and Tunnel Pressures .................................... 19 Table 3-12. Summary of Fixed Crest Spillway and Corresponding Lake Elevations ................... 21 Table 4-1. Alternative Advantages and Disadvantages ................................................................. 27 Table 4-2. Summary of Potential Failure Modes (PFMs) – Categories I through IV .................. 30 Table 5-1. Cost Summary .............................................................................................................. 37
DRAWINGS
Drawing 1. Cover Sheet Drawing 2. Location Map, Vicinity Map and Drawing Index Drawing 3. Standard Abbreviations Drawing 4. Standard Symbols and Legends Drawing 5. Existing Site Plan Drawing 6. Existing Dam Layout Drawing 7. Existing Dam Elevation and Sections Drawing 8. Existing Power Intake Plan and Sections Drawing 9. Spillway Alternative B1 - Obermeyer Gate Spillway Plan and Section Drawing 10. Spillway Alternative B2 - Rubber Dam Spillway Plan and Section Drawing 11. Spillway Alternative B3 - Roller Gate Spillway Plan and Section Drawing 12. Spillway Alternative B4 - Fixed Dam Crest Spillway Plan and Section Drawing 13. 10 ft Lake Raise - Dam Layout Drawing 14. 10 ft Lake Raise - Elevation and Sections Drawing 15. 10 ft Lake Raise - Intake Plan and Sections Drawing 16. 15 ft Lake Raise - Dam Layout

Southeast Alaska Power Agency Swan Lake Hydroelectric Project
Feasibility Study – Final Report Page iv June 13, 2012
Drawing 17. 15 ft Lake Raise - Elevation and Sections Drawing 18. 15 ft Lake Raise - Intake Plan and Sections Drawing 19. 20 ft Lake Raise - Dam Layout Drawing 20. 20 ft Lake Raise - Elevation and Sections Drawing 21. 20 ft Lake Raise - Intake Plan and Sections
APPENDICES
Appendix A Hydraulic Analysis Appendix B Structural Analysis Appendix C Vendor Data Appendix D Cost Estimates

Southeast Alaska Power Agency Swan Lake Hydroelectric Project
Feasibility Study – Final Report Page 1 June 13, 2012
SECTION 1 INTRODUCTION
1.0 Purpose The purpose of this study is to provide exploratory research and engineering analysis to determine the feasibility of increasing the active storage at the existing Swan Lake Hydroelectric Project located near Ketchikan, Alaska. 1.1 Scope The scope of work to be completed as part of this study includes the following:
1) Complete an exploratory and engineering analysis to determine the feasibility of increasing active storage at Swan Lake Dam. The current full pool elevation is 330.0 feet (ft). Engineering calculations, construction methodology, and construction cost estimates are to be identified for the following two cases:
a) 10 ft increase b) 15 to 20 ft increase
2) As part of the lake raise analysis, McMillen, LLC (McMillen) shall complete the following engineering review analyzes:
a) Determine the impacts to four (4) existing Class II PFM (Probable Failure Mode) categories
of the 2009 Part 12 follow up report which are:
(1) PMF No. 3 – Erosion of plunge pool and subsequent undermining of the toe of the dam. (2) PMF No. 4 – Blocked spillway during high water event and subsequent overtopping of
the dam. (3) PMF No. 6 – Failure of abutment blocks under static loading conditions. (4) PMF No. 13 – Failure of right abutment during an earthquake.
3) Using the existing Probable Maximum Flood (PMF), propose a design for a new spillway configuration and investigate the most probable cost effective method to conduct spill;
4) Discuss the increase in static and/or dynamic loads as a result of the additional head on the load
cases of the identified Category IV PFMs (Nos. 1, 2, 7, 8, 9, 10, 11, 12, and 14);
5) Determine any adverse effects to the intake structure;
6) Discuss any construction modifications or design engineering that improves the likelihood of Federal Energy Regulatory Commission (FERC) approval.
7) Estimate construction costs for the proposed spillway modification, and estimate construction
costs required to mitigate the effects of the increased loading.

Southeast Alaska Power Agency Swan Lake Hydroelectric Project
Feasibility Study – Final Report Page 2 June 13, 2012
1.2 Authorization This work effort is authorized under the Consulting Services Agreement No. SEAPA-12-05 issued by the Southeast Alaska Power Agency (SEAPA) to McMillen, LLC on December 28, 2011. 1.3 Background Swan Lake Dam, as currently operated, has an active storage capacity of 86,000 acre-ft which is contained between the minimum pool elevation of 271.5 ft and full pool elevation of 330. 0 ft. From 2006 through 2011, Ketchikan Public Utilities (KPU) has seen an increasing level of diesel generation required to offset inadequate hydropower resources. During this same period, Swan Lake Dam has experienced spill conditions which if captured, could offset at least a portion of the diesel generation requirements. The focus of this study is to determine methods for accomplishing a 10, 15, or 20 ft lake raise.

Southeast Alaska Power Agency Swan Lake Hydroelectric Project
Feasibility Study – Final Report Page 3 June 13, 2012
SECTION 2 PERTINENT DATA AND DESIGN CRITERIA
2.0 Introduction Section 2 presents the pertinent data and design criteria used as the basis for completing the lake raise analysis. The criteria presented within this section were selected from the original design documents, FERC Part 12 inspection reports, and applicable codes and standards. 2.1 Pertinent Data The study utilized a wide range of pertinent data and resources related to the Swan Lake Hydroelectric Project and arch dam design in general. The following specific reference documents provided by SEAPA formed the basis for conducting the study.
1) FERC Part 12 Report, Addendum to Part 12 Report 2) 5-Year Part 12 Follow-Up Report 3) As-Constructed Dam Drawings 4) Project As-Built Final Report 5) Repair of Culvert Leak Report 6) FERC EAP Presentation 7) FERC Engineering Guidelines, Chapter 14 8) Swan Lake Reservoir Operation Guide Curves
The additional technical guides and resources used in conducting the study are presented under the References section located at the end of the report. 2.2 Existing Facility Description The existing facilities descriptions were obtained from the FERC Part 12 reports as presented under Section 2.1, Pertinent Data. 2.2.1 General The Swan Lake Project (Project) is located approximately 22 miles northwest of Ketchikan in southeast Alaska as illustrated on Drawing G-1. The Project was constructed in 1984 to provide power to the southeast Alaska area. The Project consists of a 174-ft-high concrete arch dam creating an 86,000 acre-ft active storage reservoir. Water passes through a concrete power tower located on the right abutment and upstream of the dam passing through a 2,300 ft long power tunnel to the powerhouse. The tunnel feeds an indoor type powerhouse fitted with two 12,500 kVA generating units. Power is transmitted from the powerhouse to Ketchikan, Wrangell, and Petersburg, Alaska. 2.2.2 Dam The Swan Lake Dam is a double curvature elliptical arch dam with a crest elevation of 344.0 ft which is 174 ft above the lowest foundation line. The dam has a developed crest length of 480 ft and arch thickness varying from 6 ft at the crest to 17 ft at the base of the crown cantilever. The plan and sectional views of the dam are presented on Drawings G-5 and G-6.

Southeast Alaska Power Agency Swan Lake Hydroelectric Project
Feasibility Study – Final Report Page 4 June 13, 2012
2.2.3 Reservoir Swan Lake Dam raised the level of Swan Lake from elevation 236.0 ft to 330.0 ft. The minimum reservoir elevation is now at elevation 271.5 ft which provides an active storage of 86,000 acre-ft. The reservoir is approximately 2 miles in length and has a surface area of 1,500 acres when at the full pool level of 330.0 ft. Table 2-1 presents the key hydrological and reservoir data.
Table 2-1. Key Reservoir and Hydrological Data
Item Description Reservoir Data Surface Area (acres) 1500 Normal Pool El. (msl) 330.0 Minimum Operating Pool El. 277.0 Active Storage (acre-ft) 86,000 Hydrological Data PMF inflow (cfs) 33,500 IDF inflow (cfs) 33,500 Max. Historical Flow at Dam Site (cfs) 5,500 Date of Maximum Flow 11/1/1917
Source: Four Dam Pool Agency, Swan Lake Hydroelectric Project, Supporting Technical Information (STI) Document, February 2005.
2.2.4 Spillway The dam was constructed with a 100-ft-wide un-gated ogee spillway located in the center of the dam. Flow passes over the ogee crest at elevation 330.0 ft and passes over a concrete chute spillway which flips the flow downstream from the dam toe into an excavated plunge pool. 2.2.5 Power Intake The intake consists of a concrete monolith structure located on the right (north) abutment upstream of and separate from the dam. The trashrack sill elevation of the intake entrance is at elevation 232.0 ft. A semi-circular trashrack is bolted in place at the intake entrance. A 9-ft 5-inch by 17-ft 9-inch fixed wheel gate with a hydraulic cylinder-type hoist is located immediately downstream from the trashrack providing for emergency and service closure of the power tunnel. 2.2.6 Power Tunnel A tunnel extends from the intake 2,311 ft down to the powerhouse. The upstream portion (1,950 ft in length) is concrete lined with a finished diameter of 11 ft. The downstream portion is 278-ft-long and is steel lined with a finished diameter of 9 ft 6 inches. The final section consists of the bifurcation and the 66-inch-diameter branches which extend to the spiral cases of the generating units in the powerhouse. The power tunnel has a uniform grade of 11-1/4 percent from the intake entrance to a point 130 ft upstream from the powerhouse where the centerline has a constant elevation of 4 ft above sea level. 2.2.7 Power Plant The powerhouse is a surface, indoor type, reinforced concrete structure located immediately north of the mouth of Falls Creek on Carroll Inlet. The powerhouse is 64-ft-wide by 104-ft-long with an overall height of 100 ft measured from the bottom of the sump to the top of the roof. The interior layout of the powerhouse includes a 39-ft-wide by 100-ft-long generator and erection bay, flanked by a 25-ft-wide switch gear gallery. A 75-ton overhead traveling crane with a 15 ton auxiliary hoist is provided in the

Southeast Alaska Power Agency Swan Lake Hydroelectric Project
Feasibility Study – Final Report Page 5 June 13, 2012
erection bay. Each of the two umbrella-type, vertical shaft generators is rated at 12,500 kVA, 0.9 power factor, 13,800 volts, 450 rpm, and 60 Hertz. Each generator is driven by a 17,400-hp hydraulic Francis type turbine operating at 450 rpm under a maximum rated head of 304 ft. Each turbine is equipped with a 66 inch butterfly type inlet valve. 2.2.8 Switchyard The switchyard is located adjacent to the powerhouse. The switchyard provides for step-up from the generator voltage of 13,800 volts to the transmission line voltage of 115,000 volts. 2.2.9 Support Facilities Access to the Project is by air or water only. Port facilities including a bulkhead, barge ramp, floats for small boats and float planes, and a staging area, are located north of the powerhouse on the shore of Carroll Inlet. The site development includes three permanent family residences, crew quarters, a maintenance shop, warehouse, and public use facilities (restrooms, sheltered picnic table, and reservoir boat dock). Access from the powerhouse site to the dam and the power intake site is via an access road approximately 0.5 miles long. 2.3 Design Criteria The following design criteria were developed to support the technical analysis for the lake raise study. Much of the indicated criteria was obtained from the FERC Part 12 reports for Swan Lake Dam. 2.3.1 Hydrological Data The information presented in Table 2-2 was abstracted from the 1989 Part 12 Report (1). That report re-evaluated the PMF and determined peak inflow and reservoir elevations with results almost identical to the original PMF determination.
Table 2-2. Summary of Hydrological Design Criteria
Item Criteria Storm Probable Maximum Flood occurring in October Precipitation Source Hydrometeorological Report No. 54 Precipitation 32.86 inches/72 hours; 19.10 inches/24 hours; 13.60 inches/12 hours; 9.50
inches/6 hours Snowmelt None in October according to HMR54 procedures
Loss Rates 0.02 inches per hour during the PMP, total = 1.44 inches
Drainage Area 36.50 square miles for total basin including the 2.30 square mile reservoir Unit Hydrograph Clark unit hydrograph, Tc = 3.5 hrs, R = 3.5, R/(Tc+R) = 0.5 Runoff Model HEC-1 PMF Peak Inflow 33,500 cfs PMF Peak Outflow and Reservoir Elevation
The peak outflow was 19,400 cfs with a maximum reservoir at elevation 343.3. See Figure 6.1in Appendix A PMF Volume: 56,936 acre-feet for the 72-hour storm.
IDF Peak Inflow N/A same as PMF IDF Peak Outflow and Reservoir Elevation
N/A same as PMF

Southeast Alaska Power Agency Swan Lake Hydroelectric Project
Feasibility Study – Final Report Page 6 June 13, 2012
Item Criteria IDF Volume N/A same as PMF Spillway Capacity: 20,600 cfs at El 344, the top of the arch dam Spillway Rating Curve See Figure 6.2 Total Freeboard: 14 feet from normal maximum operating pool at elevation 330 to the top of
the arch dam crest at elevation 344 and 17.5 feet from normal maximum operating pool to top of the parapet wall at elevation 347.5
Residual Freeboard 0.7 feet to the top of the dam crest and 4.2 feet to the top of the parapet wall at elevation 347.5
2.3.2 Hydraulics The Probably Maximum Precipitation (PMP) was calculated using the Hydrometeorological Report No. 54 (HMR54) which revised the procedures for computing PMP in the project area. The revised analysis completed in February 2005 and summarized in the STI document predicted a maximum PMF inflow of 33,500 cfs under the all-season PMP, which is applicable for the October time frame. The 100-ft-wide un-gated, ogee spillway was designed to pass the PMF over the dam reaching a maximum stage of elevation 343.3 ft and a maximum outflow of 19,400 cfs. The 2005 analysis indicated the resulting freeboard was acceptable at 0.7 ft to the top of the dam and 4.2 ft to the top of the parapet wall. For the purpose of this study, the existing dam PMF will be used as the basis of the hydraulic analysis of the modified spillway curves. Spillway gate alternatives would be developed to maintain as close to the ogee crest hydraulic capacity as possible. The PMF hydrograph, lake stage-storage curve, and spillway rating curve as presented in Appendix A. 2.3.3 Structural The following data was used to analyze the dam and intake structure to evaluate increased reservoir levels. 2.3.3.1 Dam Geometry The existing dam geometry was obtained from the as-constructed drawings of Swan Lake Dam and is summarized below.
Table 2-3. Existing Dam Geometry
Item Criteria Dam Crest Length 480 ft Height above foundation 174 ft Dam Crest Elevation 344 ft Dam Foundation Elevation 170 ft Crest Thickness 6 ft Base Thickness 17 ft Center Section Axis Radius 240 ft Outer Face Axis Radius 700 ft Spillway Crest Elevation 330 ft Spillway Crest Length 100 ft

Southeast Alaska Power Agency Swan Lake Hydroelectric Project
Feasibility Study – Final Report Page 7 June 13, 2012
2.3.3.2 Material Properties The following material properties are based on the previous FERC Part 12 reports for Swan Lake Dam. The original construction requirements specified a minimum concrete compressive strength of 4,000 pounds per square inch (psi), and concrete strengths were verified with cylinder testing during construction. Based on US Bureau of Reclamation (USBR) guidelines, "experience factors" can be applied to concrete to include the concrete strength gain over time. Using the original concrete strength, the age of the dam, and the USBR strength factors, the actual concrete compressive capacity is estimated to be at least 5,300 psi. The following concrete properties were assumed for the structural analysis.
Table 2-4. Concrete Properties
Item Criteria Unit weight of concrete 150 pcf Compressive strength (1 year) Static: 5,300 psi minimum Tensile Strength Static: 318 psi (6% of compressive strength) Modulus of Elasticity Static: 3 x 10⁶ psi
Dynamic: 4 x 10⁶ psi Poisson Ratio 0.2 Internal Friction Angle 45° Coefficient of Thermal Expansion
5 x 10⁶ /°F
2.3.3.3 Loads Used for Analysis
A range of loads were developed for the dam analysis as presented in Table 2-5. These load conditions were evaluated separately and in combinations as part of the dam analysis, as outlined in paragraph 2.3.3.4.
Table 2-5. Anticipated Load Conditions
Item Criteria
Dead Load Self-weight Silt Load Lateral: 85 psf (up to EL 185)
Vertical : 120 psf (over foundation) Ice load 10 kip / ft at EL 340 Seismic Operating Basis Earthquake (OBE): 0.15g
Maximum Credible Earthquake (MCE): 0.3g Hydrostatic Pressure Upstream: Elevation of water varies based on load case
Tailwater: EL 190.0 Hydrodynamic Pressure Calculated as per Westergaard's added-mass concept
= Hydrodynamic pressure at height Z from foundation
= Seismic acceleration
= 62.4 PCF
= Height of the Dam

Southeast Alaska Power Agency Swan Lake Hydroelectric Project
Feasibility Study – Final Report Page 8 June 13, 2012
Item Criteria Temperature load Calculated as per load combinations
2.3.3.4 Load Combinations for Dam Analysis Table 2-6 summarizes the load combinations under which the existing dam was analyzed. The impact to the structural integrity of the dam considering a lake raise will be evaluated using these load combinations.
Table 2-6. Load Combinations
Load Combination Description Usual Load Combination (LC)
LC-1 Effects of minimum usual concrete temperatures and the maximum reservoir elevation occurring at that time (Maximum Reservoir elevation) with dead load, tail water, ice, and silt.
LC-2 Effects of maximum usual concrete temperatures and the most probable reservoir elevation occurring at that time with dead load, tail water, and silt.
LC-3 Minimum design reservoir elevation (Inactive Capacity, El. 271.5) and the effects of concrete temperatures occurring at that time with dead load, tailwater, and silt.
Unusual Load Combination (ULC) ULC-1 Maximum design reservoir elevation and the effects of mean concrete temperatures
occurring at that time with dead load, silt, and tail water. ULC-2 Design Basis Earthquake with LC-1.
Extreme Load Combination (ELC) ELC-1 Maximum Credible Earthquake with LC-1.
2.3.3.5 Factor of Safety The current (2008) FERC factors of safety for existing arch dams for the loading combinations are presented in Table 2-7.
Table 2-7. Load Combinations Required Factor of Safety
Load Combination Compressive
Stress Tensile Stress
Usual (LC) 2.0 1.0 Unusual (ULC) 1.5 1.0 Extreme (ELC) 1.1 1.0
2.3.3.6 Allowable Concrete Stresses The allowable compressive and tensile stresses associated with each load combination are presented in Table 2-8 below.

Southeast Alaska Power Agency Swan Lake Hydroelectric Project
Feasibility Study – Final Report Page 9 June 13, 2012
Table 2-8. Allowable Concrete Stresses
2.3.4 Mechanical The mechanical components of the proposed spillway gate alternatives and required power intake modification would be designed in accordance with industry mechanical codes and standards. For the purpose of this study, the existing equipment assessment due to the proposed lake raises will be evaluated based on professional judgment and review of the original dam and power intake as-constructed drawings and construction report. 2.3.5 Geology and Seismicity The geology and seismicity aspects of the Swan Lake Dam were based on the information presented in the STI document, Section 5. Within this reference document, the design phase geotechnical investigations of the Swan Lake Hydroelectric Project were initially undertaken in 1979 by Converse, Ward, Davis, and Dixon (Converse). The field and office investigations completed by Converse are summarized in this document including the laboratory testing and seismicity studies required for determination of the maximum Design Earthquake and a Maximum Credible Earthquake. To assist with the seismicity studies, Converse retained the services of the University of Alaska, Geophysical Institute. The documents as presented and discussed in the STI document serve as the design basis for the lake raise study and are herein incorporated by reference.
Load Combination Compressive Stresses (psi)
Tensile Stresses (psi)
LC-1 LC-2 LC-3
2650 2650 2650
318 318 318
ULC-1 ULC-2 (Seismic)
3533 4818
318 795
ELC-1 (Seismic) 4818 795

Southeast Alaska Power Agency Swan Lake Hydroelectric Project
Feasibility Study – Final Report Page 10 June 13, 2012
SECTION 3 EXISTING DAM ASSESSMENT FOR 10, 15, AND 20 FEET LAKE RAISE
3.1 Introduction Section 3 presents an assessment of the existing Swan Lake Dam considering a 10, 15 and 20 ft lake raise. 3.2 General Approach Two basic analyzes were required to support development and evaluation of alternatives for raising the existing storage reservoir level at Swan Lake Dam. The first is a structural analysis to determine the maximum reservoir level which the existing dam can structurally support. This analysis was conducted using a finite element analysis to determine the increase in stresses within the dam structure and along the rock foundation. The second analysis is a hydraulic analysis to determine the maximum reservoir level which would occur when routing the PMF through the reservoir and proposed spillway configuration. 3.3 Dam Structural Analyses The Swan Lake Arch Dam was analyzed using software programs. Loads and load combinations along with allowable stresses are discussed in Section 2. The dynamic analyses were performed using the seismic coefficients discussed in the August 2008 FERC report which are discussed in Section 2. 3.3.1 Arch Dam The Swan Lake Dam is a double curvature elliptical arch dam. SAP2000, a finite element analysis software, was used to model the existing dam. For this feasibility study, several simplifying assumptions were made:
1) The dam was modeled using solid element to predict the behavior of the concrete arch. 2) The dam was modeled assuming a 240 ft single radius horizontal curve, not the actual double
elliptical curvature. This assumption produces good results for a feasibility level study, but the more complex geometry should be modeled for final design. The vertical curvature was modeled to closely reflect the as-built geometry.
3) The edge supports were assumed to be "pinned" supports, meaning that they provide translation support in all three primary directions. The pins were placed at the center of the solid elements, so the elements are free to rotate (don't develop any base moments) about the plane of the arch at that specific location. This assumption provided the best correlation with the previous model results.
4) While we were able to develop a good correlation between the average shell stresses between the SAP2000 model and the stresses listed in the construction documents, we were unable to draw a direct correlation between the face shell stresses. For this study we have assumed that the face shell stresses are proportional to the average stress. For example, if the average stress in an element increased by 10 percent, we have assumed that the maximum compressive and tensile stresses at the same location have also increased by 10 percent.
Once the finite element model was developed, the analysis was divided into two parts:

Southeast Alaska Power Agency Swan Lake Hydroelectric Project
Feasibility Study – Final Report Page 11 June 13, 2012
1) The SAP2000 model was compared to the previous model. The structural analysis results from the SAP2000 model for a static case of the current condition (WSEL 330) were compared with stresses listed in the construction documents and the Part 12 reports.
2) Once the model assumptions were verified, the model was used to determine a baseline (set of stresses based on the current loading criteria), and then to evaluate the increase in stresses as compared to the baseline. The analysis results from SAP2000 are compared for different water levels and a percentage stress level (interaction ratio) is calculated to understand the behavior of the dam due to additional loads.
3.3.1.1 Comparison of Stresses from SAP2000 Model with Stresses in the Construction Documents The SAP2000 model used for the feasibility study is based on the model assumptions listed in Section 3.3.1. Because of these assumptions and differences in the modeling techniques used in this study and previous studies, the results do not precisely match those shown in the as-built drawings (Figure 3.11 from August 2008 FERC report). There are several possible reasons for this, including variations in the model geometry, differences in modern finite element analysis methods compared to the original design, and differences in assumptions regarding the boundary conditions. In order to calibrate the SAP2000 model, the average solid element stresses were compared to the calculated stresses provided in the original document. While the stresses did not match precisely, the results were within a reasonable margin of error for this feasibility study and provided a model stress distribution throughout the dam similar to the original design. Table 3-1 below provides a correlation between the SAP2000 model and the dam stresses listed in the construction documents. It includes the average arch and cantilever stresses at certain critical points in the dam for LC-1. The percentage stress in the table is based on the maximum stress (from construction documents) on the face of the dam in that location.
Table 3-1. Average Dam Arch and Cantilever Stresses (LC-1 Load Case)
Type of Stresses
Location of Stresses Average Stresses
from Construction Documents (psi)
Average Stresses from SAP2000 model (psi)
Dam Stress Level
Arch Stresses
EL240 & STA 10+00 273 500 20% (Comp) EL300 & STA 11+28 261 260 12% (Comp)
Cantilever Stresses
EL210 & STA 10+00 113 165 6% (Comp) EL300 & STA 11+59 39 -14 12% (Tensile)
3.3.1.2 Percentage Stress Levels in Dam for Varying Lake Levels Based on the model baseline established in section 3.3.1.1 above (LC-1 static loading, wsel 330 ft), the dam was analyzed for varying lake level conditions and the increase in stress levels were compared to this baseline to determine the relative increase in stresses in the dam. This ratio of stresses was then applied to the Dam Stress Level provided in Table 3-1 for that location. See the following example:
1) Location - EL 240 and STA 10+00 (Table 3-2) 2) Model baseline stress from Table 3-1 = 500 psi (notice that this matches the first row, first
column of Table 3-2) 3) Model baseline Dam Stress Level from Table 3-1 = 20% 4) For a 10 foot increase, max static stress from LC-2 = 580 psi 5) Stress ratio compared to the baseline = 580/500 = 1.16
Southeast Alaska Power Agency Swan Lake Hydroelectric Project
Feasibility Study – Final Report Page 12 June 13, 2012
6) Resulting dam stress level = 20% x 1.16 = 23%. This represents the ratio of the loading from a 10-ft dam raise at this location compared to the concrete capacity listed in Section 2.
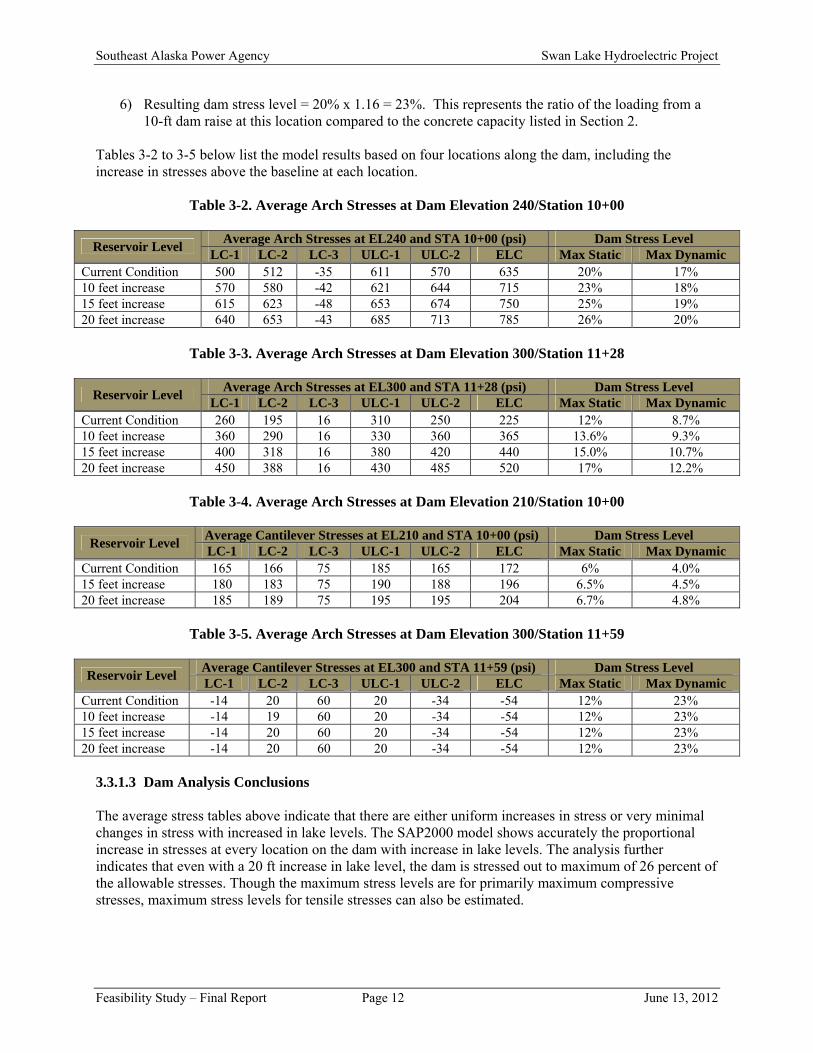
Tables 3-2 to 3-5 below list the model results based on four locations along the dam, including the increase in stresses above the baseline at each location.
Table 3-2. Average Arch Stresses at Dam Elevation 240/Station 10+00
Reservoir Level Average Arch Stresses at EL240 and STA 10+00 (psi) Dam Stress Level
LC-1 LC-2 LC-3 ULC-1 ULC-2 ELC Max Static Max Dynamic Current Condition 500 512 -35 611 570 635 20% 17% 10 feet increase 570 580 -42 621 644 715 23% 18% 15 feet increase 615 623 -48 653 674 750 25% 19% 20 feet increase 640 653 -43 685 713 785 26% 20%
Table 3-3. Average Arch Stresses at Dam Elevation 300/Station 11+28
Reservoir Level Average Arch Stresses at EL300 and STA 11+28 (psi) Dam Stress Level
LC-1 LC-2 LC-3 ULC-1 ULC-2 ELC Max Static Max Dynamic Current Condition 260 195 16 310 250 225 12% 8.7% 10 feet increase 360 290 16 330 360 365 13.6% 9.3% 15 feet increase 400 318 16 380 420 440 15.0% 10.7% 20 feet increase 450 388 16 430 485 520 17% 12.2%
Table 3-4. Average Arch Stresses at Dam Elevation 210/Station 10+00
Reservoir Level Average Cantilever Stresses at EL210 and STA 10+00 (psi) Dam Stress Level LC-1 LC-2 LC-3 ULC-1 ULC-2 ELC Max Static Max Dynamic
Current Condition 165 166 75 185 165 172 6% 4.0% 15 feet increase 180 183 75 190 188 196 6.5% 4.5% 20 feet increase 185 189 75 195 195 204 6.7% 4.8%
Table 3-5. Average Arch Stresses at Dam Elevation 300/Station 11+59
Reservoir Level Average Cantilever Stresses at EL300 and STA 11+59 (psi) Dam Stress Level LC-1 LC-2 LC-3 ULC-1 ULC-2 ELC Max Static Max Dynamic
Current Condition -14 20 60 20 -34 -54 12% 23% 10 feet increase -14 19 60 20 -34 -54 12% 23% 15 feet increase -14 20 60 20 -34 -54 12% 23% 20 feet increase -14 20 60 20 -34 -54 12% 23%
3.3.1.3 Dam Analysis Conclusions The average stress tables above indicate that there are either uniform increases in stress or very minimal changes in stress with increased in lake levels. The SAP2000 model shows accurately the proportional increase in stresses at every location on the dam with increase in lake levels. The analysis further indicates that even with a 20 ft increase in lake level, the dam is stressed out to maximum of 26 percent of the allowable stresses. Though the maximum stress levels are for primarily maximum compressive stresses, maximum stress levels for tensile stresses can also be estimated.

Southeast Alaska Power Agency Swan Lake Hydroelectric Project
Feasibility Study – Final Report Page 13 June 13, 2012
The August 2008 FERC report, section 8.1.8 shows a summary for maximum stresses. The maximum tensile stress from that table is -166 psi for a static case and -301 psi for a dynamic case. These stresses are approximately 50 percent of the allowable values. Depending upon the location of the maximum stresses, it can be estimated that these maximum stresses might increase by 0 to 50 percent for a 20 ft lake level increase. It can be concluded from the preliminary analysis that by limiting the reservoir increase to 25 ft maximum, the maximum stresses can be kept within allowable limits. 3.3.1.4 Intake Structure As currently designed, the intake structure design minimizes the head differential across the intake structure walls to the head loss across the intake trashrack. This load condition occurs since the gate intake slot extends from the bottom of the intake structure up to the gate hoist room. The water surfaces on the upstream side of the intake structure as well as within the gate hoist room are under atmospheric conditions. The lake raise will require modification to the gate hoist room to extend the mechanical equipment above the new lake levels. The structural modifications required to accomplish this modification will be related to the overall lake raise and modifications to the dam itself to accomplish the higher lake levels. 3.3.2 Power Intake Structure Equipment and Isolation Gate In addition to the impact to the structural integrity of the dam, the lake raise also has potential impacts to the intake, isolation gate, tunnel, and powerhouse equipment. An assessment of these impacts is presented within this paragraph considering a reservoir raise of 10, 15, and 20 ft. 3.3.2.1 Evaluation of Impacts of 10, 15, and 20 Foot Reservoir Raise on Intake Structure and
Isolation Gate To begin this evaluation, data specific to the intake and intake isolation gate was gathered from existing drawings. This data is as follows:
Table 3-6. Power Intake Pertinent Data
Item Value Spillway crest elevation 330.0 ft Normal max pool elevation 330.0 ft Minimum pool elevation 271.5 ft Top of Dam 344.0 ft Top of Dam Parapet Wall 347.5 ft Height of Intake Tower above lake bottom to roof Approx. 125 ft Bottom Floor of intake inlet 232.0 ft Invert power tunnel at intake 240.0 ft Top of gate slot and holding beam elevation 331.0 ft Intake room floor (equipment base level) 344.0 ft Intake ceiling top deck level (base of hoist cylinder) 356.0 ft Floor is suspended slab- rock underneath elevation 327.5 ft Intake thin vertical wall section bottom elevation 331.04 ft Top of intake slot air vent 356.0 ft Fixed-wheel gate size w/ hydraulic cylinder hoist 9 ft-5 inches w x
17ft-9 inches h Max reservoir elevation in flood 344.0 ft Dock on reservoir elevation 331.0 ft Number of wheels on fixed wheel gate 12

Southeast Alaska Power Agency Swan Lake Hydroelectric Project
Feasibility Study – Final Report Page 14 June 13, 2012
Item Value Wheel axle diameter 2 ¼ inch Gate Hoist shaft diameter 3 ¾ inch Gate hoist hydraulic operating pressure 2,000 psi
Issues at the intake associated with raising the reservoir elevation, and options for addressing them are as follows:
A. What are the impacts on the isolation fixed wheel gate associated with the raise? B. What are the impacts on the lifting hoist associated with the raise? C. What is the impact on the Intake Equipment Room and hoist area associated with the raise? D. Are there other impacts at the intake area from the raise?
These issues are discussed in the following paragraphs. A. What are the impacts on the isolation fixed wheel gate associated with the raise? When the reservoir level is raised, the water pressure down at the upstream face of the intake isolation gate will increase when it is closed. This pressure will add load to the gate skin plates, and to the wheels and their axles inside the fixed wheel gate. It will also increase the pressure on the gate seals. The gate loads and wheel loads were calculated under current conditions and for the various reservoir raise options. The results are presented in Table 3-7.
Table 3-7. Gate and Wheel Loads
Swan Lake Intake Reservoir and Isolation Gate Data
Item Existing 10 ft Raise 15 ft Raise 20 ft Raise Normal Reservoir Level 330 340 345 350 Design Reservoir Flood Level 344 354 359 364 Normal Average Head on Gate (centroid) (feet) 87.8 97.8 102.8 107.8 Normal Average Pressure on Gate (psi) 38.0 42.3 44.5 46.7 Flood Average Head on Gate (feet) 101.8 111.8 116.8 121.8 Flood Average Pressure on Gate (psi) 44.1 48.4 50.6 52.7 Maximum Gate Horizontal Load (kips) (flood) 1,061 1,165 1,218 1,268 Maximum wheel axle shear load (psi) 22,280 24,453 25,564 26,625
As can be seen, the axle loads on the wheels increase but appear to be safe for typical forged steel axles (60,000 psi steel or higher). During final design, the actual axle material properties will have to be checked, and if it is determined that the existing axle material is approaching its design limit, twelve new axles could be fabricated from a higher strength steel to address any concerns. This would not involve a large expenditure. The gate skin plates and internal support beams will see an increase in load of about 9.8 percent from a ten foot reservoir raise. The gate skin and its support beams can likely easily handle this small increase in load, but the amount of gate deflection in the downstream direction from the new pressures should be checked during final design to confirm this. B. What are the impacts on the lifting hoist associated with the raise? Since this is a fixed wheel gate, the actual lifting load on the gate hoist will increase from a reservoir raise, but only a small amount due to increased force required to initially move a closed gate due to increased seal pressure and wheel loads. Once the gate is open even a small amount, pressure equalizes

Southeast Alaska Power Agency Swan Lake Hydroelectric Project
Feasibility Study – Final Report Page 15 June 13, 2012
on both sides and lifting requirements stay the same as they are now. The existing hoist is hydraulic cylinder operated with hydraulic oil at 2,000 psi provided from a hydraulic pressure unit (HPU). It is very likely the existing hoist and hydraulic system will be able to handle the small increase in vertical loads and operate the isolation gate under all reservoir raise options. In final design, the cylinder diameter, lifting capacity and current hydraulic pressure necessary to move the gate should be verified. A small increase in hydraulic oil pressure at the HPU could be made if additional lifting capacity is found to be necessary. Another impact will be the possible need to lengthen the gate lifting stem. This will only be necessary if the existing gate lift hydraulic cylinder has to be raised from its current elevation of 356.0 ft. As will be discussed further below, the hoist will have to be raised for all reservoir raise options, and thus the gate lifting stem will also have to be lengthened as well. Finally, a gate maintenance support beam consisting of two 14 by 48 steel beams 6 ft long is located at elevation 331.0 in the intake structure. This support beam is used to hold the lifting stem during efforts to raise the gate up into the gate house for maintenance. This beam has to be accessible to maintenance personnel in order to raise the gate for maintenance. Under existing conditions, the reservoir water (at full pool) will only be 1 foot below the elevation of this beam. Under any reservoir raise option, this beam will be submerged. Therefore the beam will have to be raised. Due to the gate stem geometry, raising this beam will also require the gate stem to be lengthened and require the lifting hoist to also be raised. This is discussed further in a subsequent paragraph. C. What is the impact on the Intake Equipment Room and hoist area associated with the raise? The equipment room at the intake contains electrical equipment and controls as well as a hydraulic oil pressure set with pumps and an oil reservoir that is used to operate the isolation gate. Reservoir level instruments and ice control equipment are also located in the equipment room. The equipment room floor is at elevation 344.0 (same elevation as maximum reservoir during flood) and the top of the roof of this equipment room is at elevation 356.0. Adjacent to the equipment room is the gate slot and gate hoist room. This room is located directly over the isolation gate slot. The various main components of the lifting system are located in this area. From bottom to top, main components include the gate maintenance support beam (at elevation 331.0) include; the gate stem disassembly and coupling storage man-cage (at elevation 345.4), and the gate hoist hydraulic cylinder, mounted on the intake roof at elevation 356.0. Finally, a 30-inch-diameter air vent pipe connects the gate slot area with the outside so that in all circumstances air is able to get into or out of the gate slot area, in particular during pressure surges as a result of turbine load rejections. This vent has to be kept open at all times and its top elevation is 356.0. From Table 3-6 above, it can be seen that with a 10 ft reservoir raise, the maximum pool elevation during flood is 354.0. It may be possible to reduce this somewhat with increases in spillway capacity, but in this evaluation we will consider 354.0 as the worst case for the ten foot raise scenario. With a water elevation of 354.0, the gate operating cylinder and the air vent are not submerged. However, the equipment room, the gate maintenance beam, and the gate stem disassembly and storage cage would all be submerged. To address these issues, two approaches could be used; 1) raise the whole equipment room and hoist by 10 ft (for the 10 ft raise scenario, more for other scenarios); or 2) attempt to modify the gate house design to allow it to be submerged without allowing water to get into the gate house. This option could not be used for the 15 or 20 ft reservoir raise scenarios as the hoist and vent would be already be submerged along with all the other associated problems. To allow the gate house to be submerged would require the following issues to be addressed:

Southeast Alaska Power Agency Swan Lake Hydroelectric Project
Feasibility Study – Final Report Page 16 June 13, 2012
1) The equipment room and gate slot room walls appear to be only 1ft to 0-inch-thick above elevation 331.0 To withstand exterior water pressure these walls would have to be thickened;
2) All construction joints above elevation 330.0 could leak when submerged. They will likely need to be sealed with an epoxy sealing system or equivalent;
3) The intake room extends out over the water beyond the edges of the gate slot tower. If this room is submerged, hydraulic uplift will result on the room. The room will have to be checked for structural integrity under uplift conditions;
4) The access man-doors to the intake will have to be sealed off and access hatches with ladders will have to be installed through the equipment room roof;
5) The top of the gate slot would have to be sealed with a waterproof cover that could remain water tight under 23 ft of head. Where the gate shaft passes through the top of the slot, a packing box would have to be installed around the gate stem to prevent it from leaking. Even with these additions, it would become impossible to raise the isolation gate more than about 14 ft (distance between stem couplings) or to remove the isolation gate for maintenance unless the reservoir pool was lowered to 330.0 or lower.
Due to the construction challenges and operating constraints this approach would impose, we believe it is not feasible to waterproof the intake gate house for submergence. Therefore, under all reservoir raise scenarios, we believe the intake gate house, hoist and equipment room will have to be raised by an amount equal to the reservoir raise. D. Are there other impacts at the intake area from the raise? If the reservoir is raised, access roads will need to be re-graded in the area. These roads would all be submerged during flood conditions without re-grading. One other small issue is the reservoir boat dock. This dock is currently at elevation 331.0. It would be submerged by any reservoir raise and would need to be rebuilt to accommodate new reservoir levels. 3.3.2.2 Conclusions We conclude that under all reservoir raise scenarios, the intake gate house, its roof and its equipment room will need to be raised an equivalent amount. The equipment could all be re-used after it is relocated to its new elevation. The gate maintenance beams would also have to be raised as well as the gate stem disassembly cage and stem storage rack. The gate hoist would have to be raised an equivalent amount and a new section of gate stem would have to be fabricated to allow lengthening of the gate stem. During final design, several items should be revisited and checked to be sure if some additional changes are necessary. These items include:
1) The trash racks over the tunnel opening would experience some increased loading if they become completely plugged after the reservoir is raised. The rack support beams should be checked to confirm they can handle the approximately ten percent increased loads if the racks become 100 percent plugged.
2) Check the gate hoist hydraulic cylinder diameter and measure the current pressure required to move the gate, and adjust HPU pressure upward if necessary for increased hoist capacity.
3) Check the fixed wheel gate wheel axle material and properties. If axle loads are approaching the safe limit for the axles, new axles of stronger steel material can be fabricated and installed.
Southeast Alaska Power Agency Swan Lake Hydroelectric Project
Feasibility Study – Final Report Page 17 June 13, 2012
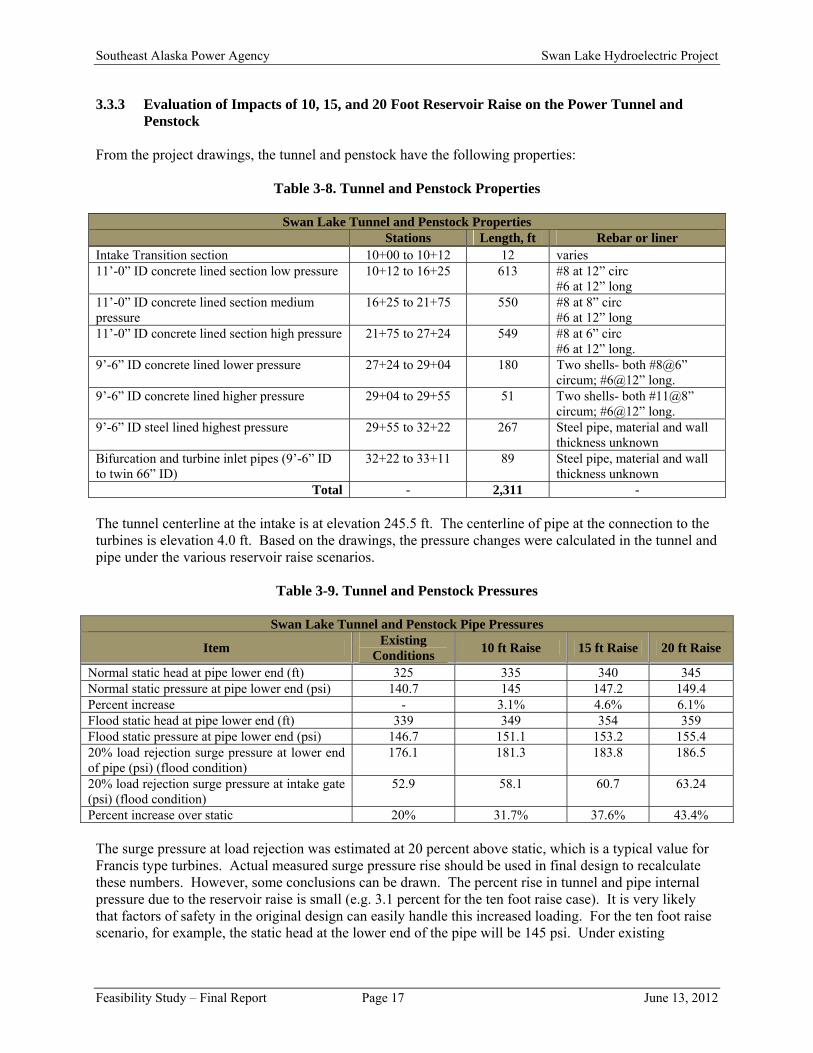
3.3.3 Evaluation of Impacts of 10, 15, and 20 Foot Reservoir Raise on the Power Tunnel and Penstock
From the project drawings, the tunnel and penstock have the following properties:
Table 3-8. Tunnel and Penstock Properties
Swan Lake Tunnel and Penstock Properties Stations Length, ft Rebar or liner Intake Transition section 10+00 to 10+12 12 varies 11’-0” ID concrete lined section low pressure 10+12 to 16+25 613 #8 at 12” circ
#6 at 12” long 11’-0” ID concrete lined section medium pressure
16+25 to 21+75 550 #8 at 8” circ #6 at 12” long
11’-0” ID concrete lined section high pressure 21+75 to 27+24 549 #8 at 6” circ #6 at 12” long.
9’-6” ID concrete lined lower pressure 27+24 to 29+04 180 Two shells- both #8@6” circum; #6@12” long.
9’-6” ID concrete lined higher pressure 29+04 to 29+55 51 Two shells- both #11@8” circum; #6@12” long.
9’-6” ID steel lined highest pressure 29+55 to 32+22 267 Steel pipe, material and wall thickness unknown
Bifurcation and turbine inlet pipes (9’-6” ID to twin 66” ID)
32+22 to 33+11 89 Steel pipe, material and wall thickness unknown
Total - 2,311 - The tunnel centerline at the intake is at elevation 245.5 ft. The centerline of pipe at the connection to the turbines is elevation 4.0 ft. Based on the drawings, the pressure changes were calculated in the tunnel and pipe under the various reservoir raise scenarios.
Table 3-9. Tunnel and Penstock Pressures
Swan Lake Tunnel and Penstock Pipe Pressures
Item Existing
Conditions 10 ft Raise 15 ft Raise 20 ft Raise
Normal static head at pipe lower end (ft) 325 335 340 345 Normal static pressure at pipe lower end (psi) 140.7 145 147.2 149.4 Percent increase - 3.1% 4.6% 6.1% Flood static head at pipe lower end (ft) 339 349 354 359 Flood static pressure at pipe lower end (psi) 146.7 151.1 153.2 155.4 20% load rejection surge pressure at lower end of pipe (psi) (flood condition)
176.1 181.3 183.8 186.5
20% load rejection surge pressure at intake gate (psi) (flood condition)
52.9 58.1 60.7 63.24
Percent increase over static 20% 31.7% 37.6% 43.4% The surge pressure at load rejection was estimated at 20 percent above static, which is a typical value for Francis type turbines. Actual measured surge pressure rise should be used in final design to recalculate these numbers. However, some conclusions can be drawn. The percent rise in tunnel and pipe internal pressure due to the reservoir raise is small (e.g. 3.1 percent for the ten foot raise case). It is very likely that factors of safety in the original design can easily handle this increased loading. For the ten foot raise scenario, for example, the static head at the lower end of the pipe will be 145 psi. Under existing

Southeast Alaska Power Agency Swan Lake Hydroelectric Project
Feasibility Study – Final Report Page 18 June 13, 2012
conditions, during load rejection, the lower end of the pipe and tunnel is already withstanding 176.1 psi surge pressure with no adverse effects. Data on the material and wall thickness of the tunnel liner, the penstock pipe and bifurcation were not available at the time of this report. During final design this data should be obtained and pipe stress under the new operating scenario should be checked. This could be used to lower surge pressures in the event that any section of the tunnel or penstock appears to be approaching a stress limit under any new reservoir raise scenario. 3.3.4 Evaluation of Impacts of 10, 15, and 20 Foot Reservoir Raise on Powerhouse, Turbine,
Butterfly Valves, and Other Equipment To begin this evaluation, key data was obtained from the project drawings as follows:
Table 3-10. Powerhouse Equipment Data
Item Value Turbine max gross head 325.0 ft Minimum Tailwater elevation 5.5 ft Maximum Tailwater elevation TW 21.5 ft Water Strainer floor elevation -5.0 ft Butterfly valve diameter (two valves) 66 inches Inlet pipe diameter (2 pipes) 66 inches Powerhouse footprint 64-ft-wide by 104-ft-long Assumed pipe pressure rise on load rejection 20% assumed Flange ratings- cooling piping and couplings 150# ANSI flanges assumed
A variety of issues were evaluated in connection with the powerhouse and powerhouse equipment. The issues and findings include the following:
A. What are the normal, flood and load rejection surge pressures that will be observed at the turbine? B. What is impact of the increased head on the turbine? C. What is the impact of increased pressures on the turbine inlet pipe, butterfly valve, butterfly valve
actuator, water strainer, and dresser coupling? D. What are the impacts on powerhouse foundations due to increased pipeline pressure (horizontal
dead end thrust)? A. What are the normal, flood and load rejection surge pressures that will be observed at the
turbine? The expected pressures compared to the current conditions are shown in the following table:

Southeast Alaska Power Agency Swan Lake Hydroelectric Project
Feasibility Study – Final Report Page 19 June 13, 2012
Table 3-11. Expected Versus Current Powerhouse and Tunnel Pressures
Swan Lake Powerhouse and Tunnel Pressures
Item Existing
conditions 10 ft Raise 15 ft Raise 20 ft Raise
Normal full turbine static head (ft) 325 335 340 345 Normal full turbine static press (psi) 140.7 145 147.2 149.4 Percent increase - 3.1% 4.6% 6.1% Flood turbine static head (ft) 339 349 354 359 Flood turbine static pressure (psi) 146.7 151.1 153.2 155.4 20% load rejection surge pressure @ turbine (psi) (flood condition)
176.1 181.3 183.8 186.5
Percent increase over static 20% 31.7% 37.6% 43.4% Dead end thrust at powerhouse, butterfly valves closed, kips
1,004 1,034 1,048 1,063
Foundation shear load over footprint due to thrust (psi)
1.05 1.078 1.094 1.10
B. What is impact of the increased head on the turbine?
Turbine Case- The turbine case will have to withstand up to 6.1 percent more static pressure and similarly increased surge pressures that result after load rejection. Since the casing is a pressure vessel and should comply with ASME pressure vessel code (to be confirmed) it was likely factory tested to at least 50 percent above design static pressure. The small increase in pressure is very unlikely to create any problems with the case. This, along with several other issues described below, will have to be confirmed with the original equipment manufacturer before the change is finalized.
Turbine Runner Loads and Efficiency- The small increase in static head should be able to be handled easily by the existing runner. This should be verified in final design with the equipment manufacturer. The efficiency of the runner at the increased head will change slightly from the current full head efficiency. Francis turbine runners operate according to a set of “hill curves” that consist of a family of curves that show efficiency versus flow at various heads. The increased head will push the turbine operation onto a new hill curve whenever the reservoir rises above elevation 330.0 At this point it is not possible to be sure if the new efficiency will be higher or lower than current efficiency. The manufacturer will have to be contacted to obtain this information.
Turbine Runaway Speed- Turbine runaway speed is the maximum speed a turbine will attain under free flow with no load conditions. For Francis turbines this speed is typically 40 to 100 percent higher than the normal operating speed (450 rpm for these turbines). When the unit is operating at load and then trips off line, its speed will quickly increase up to full runaway speed in 5 to 10 seconds. As the wicket gates close after a trip, flow is slowly reduced and the turbine will slow down and stop. With higher head, it is expected that the full runaway speed of the turbine will increase. The time for the unit to reach runaway speed may also be less with higher head. These exact values can be obtained from the original turbine manufacturer and they depend on runner design, hydraulic losses through the machine and also mechanical losses inside the machine. Higher runaway speeds have a variety of impacts, such as creating increased bearing loads, increased heating of lubricating oil during runaway, and higher centrifugal forces on the generator rotor and poles. During design, these aspects of the machine typically have considerable factors of safety added to them. In this case, with the small increase in head, we expect the increases in speed and loads will be small, but this will have to be confirmed with the manufacturer.

Southeast Alaska Power Agency Swan Lake Hydroelectric Project
Feasibility Study – Final Report Page 20 June 13, 2012
Turbine Shaft- The turbine shaft will experience higher loads under the increased static head and in particular during load rejection as described above. The change in unit maximum output is expected to be 3.1 percent increase for a 10 foot reservoir raise (12.5 MW to 12.89 MW). McMillen is currently working on another project here in Washington State that is upgrading unit output by 25 percent and we have found that the existing shafts can be re-used without problems. We conclude that the Swan Lake turbine shafts will likely be adequate as they exist, but again this will have to be confirmed with the equipment manufacturer during final design.
Surge on Load Rejection- Due to higher static pressures on the turbine, as discussed above, and possible increase in runaway speed, the maximum surge pressure upon full load rejection may increase from current values. This will have to be confirmed with the manufacturer. Some unit adjustments may be possible to minimize or even eliminate increased surge pressures, such as changing the wicket gate closure times. Because the percentage change in static head is small, the expected changes in surge pressure will also be small.
Turbine Cavitation- Cavitation at a turbine runner is a function of runner design, total head, and setting of the runner elevation with respect to tailwater elevation. Cavitation potential can be calculated by finding the value of Thoma’s constant, σ (sigma). Based on the setting of the Swan Lake turbines, σ is calculated to be 0.1123. According to Davis “Hydraulic Handbook”, the range of cavitation free operation for this plant would have a σ between about 0.083 < σ < 0.134, with the optimum σ being about 0.1225. The existing plant falls well within this range. This is all calculated at the lowest expected tailwater at the plant of 5.0 ft above sea level. Higher tailwaters would increase σ and reduce cavitation potential. With a reservoir raise of 10 ft, σ falls to 0.1089 For a reservoir raise of 20 ft σ falls to 0.1058 All these values are within the safe range of operation, but it should be noted that cavitation potential does rise associated with the raise in reservoir level. The existing record of plant operation should be checked for any instances of cavitation impacts. If the plant has had any past cavitation problems, they can be expected to increase somewhat if the reservoir is raised. Again, operating at tailwater elevations above elevation 5.0 ft would be helpful in reducing cavitation potential.
C. What is the impact of increased pressures on the turbine inlet pipe, butterfly valve, butterfly
valve actuator, water strainer, and dresser coupling?
Inlet Pipe- Static head increases between 3.1 and 6.1 percent depending on how much the reservoir is raised. This is a very small increase and is not expected to require pipe replacement. During final design the inlet pipe material and wall thickness should be checked to insure it is adequate for the small increase in pressure. Note that upon load rejection, pipe pressures can increase 20 percent over static or more as a transient condition.
Main Shutoff Valves- With the valve fully closed and the pipe empty downstream of the valve, increased head imposes an increased load on the valve. However, this is only a small percentage increase in load (3.1 percent for a ten foot reservoir raise) and is not expected to be a problem. The valve disc shaft seals should be able to handle the small increase in pressure as well. We would like to obtain the valve nameplate data to verify valve material and pressure rating.
Main Shutoff Valve Actuator- Since the valves are fitted with motor operated bypass valves that are used to equalize pressure on both sides of the valve before it is opened, the existing actuators should not be affected by any changes in static head.
Water Strainer- This strainer takes water off the penstock and cleans it before sending it through the plant service water system. It is floor mounted at elevation -5.0 ft, about 10 ft below minimum tailwater. It will experience the higher static heads (3.1 to 6.1 percent increase). From the drawings it appears to be a standard unit with 150# ANSI flanged connections, and if so should be adequate up to 425 psi for cold water service. The units rating should be field verified from its nameplate.

Southeast Alaska Power Agency Swan Lake Hydroelectric Project
Feasibility Study – Final Report Page 21 June 13, 2012
66-inch Dresser Coupling- There are 66-inch dresser-type couplings installed upstream of the main shutoff valves. These appear on the drawings to be standardized couplings and we assume they are rated with a standard ANSI rating of 150 psi. This should be confirmed in the field. If so rated, the small increase in head from the reservoir raise will have no impacts on these couplings.
D. What are the impacts on powerhouse foundations due to increased pipeline pressure (horizontal
dead end thrust)? When both 66-inch-butterfly valves are closed, there is a large thrust force in the horizontal direction from water pressure on one side of the valves. This dead end thrust is often one of the key design criteria for a powerhouse structure. This thrust is typically restrained using a variety of methods including; a) concrete thrust blocks that embed the pipe upstream of the valves; b) the weight of the powerhouse structure on its foundation that restrains the thrust by friction against its foundation material (in this case rock) that prevents sliding of the structure; c) structural keys that can be cut into the foundations or by keying the sides of the building foundation into rock that also prevent sliding. Data on the drawings indicate that most structures were made of 3,000 psi concrete or better. To do a quick check of the existing loads and the effects of increased head, the shear being applied to the building foundation by the dead end thrust can be reviewed, and ignoring all the other structural restraints to thrust. The building footprint (64- ft-wide by 104 - ft-long) is 6,656 sq. ft. The dead end thrust under existing static head is about 962 kips. This is equal to a shear on the foundation of about 144 lbs per square foot of footprint or 1.0 psi. This is a very low load, but in this analysis we are looking primarily at the changes caused by the dam raise, not the absolute values. For a 10 ft reservoir raise, the dead end thrust becomes 992 kips (a 3.1 percent increase) and the shear loading becomes 149 lb/sq. ft. or 1.035 psi. These very small changes are not expected to require any modifications to the powerhouse structures. 3.4 Spillway Swan Lake Dam was constructed with a 100-ft-wide standard ogee, un-gated spillway located in the center of the dam. The ogee crest transitions into a chute which flips the spillway flows downstream away from the dam toe. During the PMF, the maximum reservoir inflow is 33,500 cfs which when routed through the reservoir is reduced to 19,800 cfs at the spillway correlating to a maximum reservoir elevation of 343.3 ft. When considering a lake raise at Swan Lake Dam, providing sufficient capacity to pass the PMF will be the controlling factor in determining potential spillway modification alternatives and required top of dam elevations. Simply raising the existing fixed spillway crest to accommodate a lake raise will result in a corresponding increase in the reservoir level which occurs under the PMF. Assuming a simple fixed ogee crest and using the original dam design PMF inflow hydrograph and routing, Table 3-12 presents the anticipated maximum reservoir level and required top of dam to contain the PMF flood event.
Table 3-12. Summary of Fixed Crest Spillway and Corresponding Lake Elevations
Assumed Lake Raise
(ft)
Spillway Crest Elevation
(ft)
Max. Reservoir Elevation
(ft)
Head on Spillway Crest (ft)
Existing Top of Dam/Top of Parapet Wall
(ft) None - Existing 330.0 343.3 13.3 344.0/347.5
10 340.0 353.3 13.3 344.0/347.5 15 345.0 358.3 13.3 344.0/347.5 20 350.0 363.3 13.3 344.0/347.5

Southeast Alaska Power Agency Swan Lake Hydroelectric Project
Feasibility Study – Final Report Page 22 June 13, 2012
As shown, simply moving the fixed crest level up to accommodate the increased reservoir level creates a corresponding increase in the top of dam elevation. Increasing the length of the spillway crest would have a limited effect in reducing the reservoir level since the flow over the spillway crest is directly proportional to the head over the crest, or H1.5. Increasing the length will result in a lower unit discharge. Spreading out the flow will also reduce the effectiveness of the excavated plunge pool located at the base of the dam and could increase erosion along the channel banks downstream from the dam. Overall, any lake raise will require modification to the existing spillway to accommodate the lake raise, incorporation of a gated intake structure, and potentially raising the overall dam crest to accommodate. 3.5 Conclusions As outlined in the previous section, the impact to the existing dam, power intake, tunnel, and powerhouse vary with the proposed lake raise. The general observations from the existing facilities assessment are as follows:
1) The stresses in the dam will be within allowable limits up to a 25 ft increase in lake level. This corresponds to a maximum lake level of approximately 355.0 ft.
2) With a 25 ft lake level rise, the dam is estimated to be stressed at a maximum of 50 percent in compression and 90 percent in tension of allowable loads.
3) The power intake structure will have to be modified under all lake raise options to raise the gate hoist equipment out of the new active storage pool elevation and anticipated PMF maximum reservoir levels.
4) The existing gate, tunnel, and powerhouse equipment appear to be capable of withstanding the additional loads from the proposed lake level rise. Additional analysis will be required during the final design to confirm this observation.
5) The existing spillway will have to be modified to provide the higher lake level as well as pass the PMF.
For the analysis of the dam several simplifying assumptions were made. While these assumptions are reasonable for this feasibility analysis, more work will be required during the final design of the selected alternative. Additional refinements which should be made to the structural analysis include,
1) The model geometry should be further refined to reflect the elliptical double curvature of the arch. This horizontal curvature will then need to be coordinated with the vertical curvature.
2) Any required modifications to the spillways, top of the dam, or other appurtenances should be included in the model.
3) The foundation elements should be modeled with the dam to verify the interaction between the concrete dam and the bedrock foundation.
4) Foundation uplift pressures due to pore water pressure need to be added to the foundation model. 5) The model needs to be run using a time history analysis, similar to August 2008 FERC report. For
this analysis the model was analyzed using a response spectrum analysis based on the OBE and MCE.
6) The model should be analyzed using staged construction techniques to reflect the construction sequence as the dam was constructed over a long period of time. Currently, the dead load is applied instantaneously which tends to overestimate vertical tensile stresses near the abutments at the top of the dam.

Southeast Alaska Power Agency Swan Lake Hydroelectric Project
Feasibility Study – Final Report Page 23 June 13, 2012
SECTION 4 DAM RAISE ALTERNATIVES
4.1 Introduction Section 4 outlines the general approach and alternatives identified for accomplishing a 10, 15 or 20 ft lake raise. 4.2 General Approach Within Section 3, the existing Swan Lake Dam was assessed to determine the potential impact from increasing the active reservoir operating level by 10, 15 or 20 ft. The preliminary assessment resulted in the following observations:
1) The arch dam could withstand an increase in operating active storage lake level from elevation 330.0 ft to as high as elevation 355.0 ft while maintaining acceptable levels of compressive and tensile stresses with the dam faces.
2) Any level of lake raise from 10 ft and above would require modifications to the existing power intake structure to raise the gate hoist equipment above the new active storage operating lake levels. These modifications would include increasing the height of the concrete power intake structure, strengthening the intake walls in the gate hoist structure, and relocating the existing mechanical equipment to a higher elevation.
3) Routing the PMF inflow of 33,500 cfs through the reservoir and spillway will determine the maximum reservoir water level under each lake raise condition. Modification to the spillway structure will be required to support the lake raise while also passing the PMF. Simply raising the fixed ogee spillway crest to the new operating lake level may not be sufficient to pass the PMF while also not exceeding the maximum lake raise of 25 ft which was determined to be acceptable through the preliminary structural analysis.
4) Increasing the operating lake level above the top of the dam elevation 344.0 ft will require modification to the right abutment of the dam to tie the dam into the rock abutment, modify the access road, and raise the area between the dam and power intake.
5) The existing intake gate, power tunnel, and powerhouse equipment appears to be capable of handling the increased operating levels. A more detailed analysis of these features will be required during the final design work phase to confirm these observations.
These preliminary observations and assessments were developed based on a basic condition of increasing the lake level by 10, 15, and 20 ft. The analysis within Section 3 confirmed that the lake level could be raised within the design parameters and factors of safety of the original design parameters. Section 4 is intended to outline the approach to accomplishing a lake raise with a focus on the required spillway and dam modifications required to accommodate the lake raise. One of the primary controlling factors is maintaining the ability to pass the PMF through the dam spillway. The general dam raise alternatives and specifically spillway modification alternatives are presented in the following paragraphs. 4.3 Spillway Configurations and Approach In general, the spillway configuration will control the required dam modifications to support the increased operating lake level and capacity to pass the PMF. Within the spillway analysis, it is important to consider that containing the PMF is the controlling factor in determining the maximum dam height. This is accomplished through a combination of storage within the reservoir and spillway capacity. Routing the PMF through the reservoir results in an increase in the lake level, in effect storing flood water, and
Southeast Alaska Power Agency Swan Lake Hydroelectric Project
Feasibility Study – Final Report Page 24 June 13, 2012
discharging over the spillway. With the existing un-gated ogee crest spillway configuration, the PMF inflow of 33,500 cfs is attenuated within the reservoir reducing the peak outflow over the spillway to 19,800 cfs. This combination of reservoir storage and spillway capacity results in a maximum reservoir elevation of 343.3 ft which occurs during the PMF event. Considering the top of dam elevation of 344.0 ft and the top of parapet wall elevation of 347.5 ft freeboard of 0.7 ft and 4.2 ft are provided, respectively, during the PMF event. Flow over the existing spillway starts at the overflow crest elevation of 330.0 ft and builds to a maximum of 343.3 ft or 13.3 ft at the maximum spillway discharge of 19,800 cfs. The PMF hydrograph and spillway rating curve used to determine these values are presented in Appendix A. As seen from the spillway rating curve, the spillway flow increases from 0.0 cfs at the spillway crest to 19,800 cfs at elevation 343.3 ft. The simplest approach to increasing the operating lake level would be to simply raise the dam and spillway maintaining the existing un-gated spillway operation. The maximum lake level which occurs during the PMF event could then be estimated simply by adding 13.3 ft to the new operating lake level. This would result in the dam characteristics as outlined in Table 3-12, or a maximum operating water surface of 353.3, 358.3, or 363.3 ft for a 10, 15, and 20 ft lake raise would exceed the preliminary estimated structurally acceptable lake raise of 25 ft or lake level 355.0 ft. Taking advantage of a gated spillway which would allow release of water early during the PMF event would allow the spillway discharge to be increased resulting in a lower attenuated maximum operating level in the lake during the PMF event. As a result, the spillway modifications outlined in the following paragraphs were developed to maximize the gated spillway capacity as much as possible. 4.3.1 Spillway Alternatives A range of spillway alternatives were identified and considered for application at Swan Lake Dam. The alternatives were grouped in two classifications: (1) base spillway alternatives used to increase the reservoir level, (2) supplemental alternatives which would provide additional spillway capacity to pass the PMF. The base alternatives are designated with a “B” and supplemental with an “S”. The basic approach is to combine the base alternative with a supplemental alternative, as required, to provide the required reservoir raise plus meet the required PMF spillway capacity. Brief discussions of these alternatives are presented in the following paragraphs. 4.3.2 Alternative B1 Obermeyer Gate Obermeyer Spillway Gates consist of a row of steel gate panels supported on their downstream side with inflatable air bladders. By controlling the pressure in the bladders, the pool elevation maintained by the gates can be infinitely adjusted within the system control range (full inflation to full deflation). The spillway gates are supplied with control systems which include a source of compressed air and a means for controlled venting of air from the air bladders. All automatic systems also include provisions for a manual control system. Each system includes an air compressor, a receiver tank, and required control valves as well as air driers. For the Swan Lake application, the existing ogee crest is curved to match the dam arch. A new straight dam axis would have to be constructed on the upstream side of the existing crest. This would allow the gate system to be installed in straight line providing effective seals between adjacent gate panels. Using a standard width of 17 ft, a total of 6 gate panels would be required for the existing 100 ft wide spillway crest. Wider gate sections could also be fabricated and installed to limit the number of gate panels and associated air bladders. No internal piers are required for installation of an Obermeyer Gate which is an added benefit in passing debris over the spillway during spill events. Drawing B1 illustrates the conceptual layout of the Alternative B1. Appendix C includes the vendor data.

Southeast Alaska Power Agency Swan Lake Hydroelectric Project
Feasibility Study – Final Report Page 25 June 13, 2012
4.3.3 Alternative B2 Rubber Dam This alternative consists of installing a rubber dam as manufactured by Bridgestone on the spillway crest. Rubber dams are constructed from a flexible, fabric coated rubber tube that is mounted to the spillway crest with a series steel anchor bolts and clamps. Rubber dams are typically used where the spillway crest is much longer than the height such as low head diversion structures. Historically, there have been two primary manufacturers of rubber dams: (1) Bridgestone Rubber Products, and (2) Sumigate. Rubber dams do not require intermediate piers for installation. The dam abutments do require a 45 degree angle for installation. An air inflation system consisting of a blower or air compressor maintaining an air bladder pressure of 6 psi is used to maintain the rubber dam shape. Automatic deflation systems are available which allow the rubber dam to be lowered when flood conditions occur based on a maximum reservoir elevation. For the Swan Lake application, a new flat and straight concrete crest would have to be constructed on the upstream side of the existing Ogee crest to support installation of the rubber dam. A 10-ft-high rubber dam would require approximately a 20-ft-wide concrete crest to allow the rubber dam to lay flat when deflated. Drawing B2 illustrates the conceptual layout for the rubber dam. 4.3.4 Alternative B3 Roller Gate Roller or fixed wheel gates are commonly used for spillway or intake isolation gates at dams and hydroelectric facilities. These gate types are commonly used for spillway gates such as Bonneville Dam spillway. The gate width and height can vary to accommodate the required configuration though maximum widths approaching 30 to 50 ft are typically used. A hoist system consisting of cable hoists, a gantry crane, or a hydraulic cylinder are required to lift the gates. At the Swan Lake Dam, a series of four, 25-ft-wide gates could be mounted on the existing ogee dam crest. The gates would be oriented on the spillway arch chords to maintain a clear opening of approximately 25 ft. Intermediate piers would be required between each roller gate along with the gate frame hoist and access platform. Electrical power would be required for the gate hoists along with an emergency backup system. Drawing B3 illustrates the conceptual layout for the roller gate. 4.3.5 Alternative B4 Raised Fixed Crest This alternative consists essentially of raising the fixed ogee crest to achieve the required reservoir level. The existing ogee gate crest is set at elevation 330.0 ft. With this approach, the existing spillway would be demolished and raised to elevation 340.0, 345.0, or 350.0 ft to accomplish a 10, 15, or 20 ft reservoir raise, respectively. The existing ogee crest has the capacity to pass the PMF outflow of 19,800 cfs with the maximum reservoir elevation reaching 343.3 ft which corresponds to 13.3 ft of head on the spillway crest. Using the same 100 ft spillway crest length, the top of dam would have to be raised under all proposed reservoir increases by 13.3 ft to maintain adequate spillway capacity to pass the PMF considering only the spillway capacity. Lengthening the spillway crest is not an acceptable approach for increasing the capacity since the overall dam length is only 450 ft. Drawing B4 illustrates the conceptual layout for the fixed spillway crest. 4.3.6 Alternative S1 Fuse Plug Fuse plugs are commonly used to provide spillway capacity to protect the dam during emergency spill operations, or provide the spill capacity for passing large flood events such as the PMF. Fuse plugs take a wide variety of forms including an erodible embankment section, concrete plug, or gates fitted with a fuse pin designed to fail when a pre-determined head condition is exceeded. For Swan Lake Dam, a fuse plug would be a viable option to provide the required spillway capacity to supplement the base spillway alternative capacity. The fuse plug would be located on the left (south) abutment and would consist of either a concrete plug block or fuse gate.

Southeast Alaska Power Agency Swan Lake Hydroelectric Project
Feasibility Study – Final Report Page 26 June 13, 2012
4.3.7 Alternative S2 Low Level Outlet Valve Low level outlets are often used on dams to release flows past the dam. Often, the low level outlets are provided in place of a powerhouse, or as supplemental hydraulic capacity to minimize operation of a conventional overflow spillway. Outlet gates are normally fitted with some type of energy dissipation valve such as a Howell-Bunger valve, or discharge into a stilling basin to dissipate energy and prevent erosion damage in the outlet channel. Generally, low level outlets are used to discharge relatively low flow volumes and are not practical for passing large flood events. For example, at Swan Lake, the low level outlet would be located at approximately a 50 ft depth which is just above the main curvature of the dam. At this location, a 6-ft-diameter valve structure would have a capacity of approximately 1,000 cfs. Considering that PMF has an inflow of 33,500 cfs and a routed peak outflow over the existing spillway of 19,800 cfs, low level outlets would have limited ability to pass the PMF. For this reason, low level outlets were removed from further consideration as supplemental spillway alternatives at Swan Lake Dam. 4.3.8 Alternative S3 Siphon Spillway A siphon spillway consists essentially of a submerged intake within the reservoir connected to a pipe which passes through or over the dam. As the reservoir level increases, the siphon will “prime” allowing flow to pass from the reservoir into the tailrace. The spillway will have to discharge into a spillway chute or outlet channel to contain the flow and minimize erosion of the tailrace channel. Incorporation of a siphon spillway at Swan Lake would be challenging due to the arch dam design and potential impacts to the structural integrity of the dam due to the spillway penetration. Routing the spillway siphon to the project tailrace would also be difficult and costly. Based on these observations, a siphon spillway was determined to not be a viable alternative for Swan Lake Dam and removed from further consideration. 4.3.9 Spillway Alternative Evaluation When reviewing the spillway alternatives outlined in the previous paragraphs, it is important to consider the existing Swan Lake Dam design and remote location. The arch dam has a top width of 6 ft and an overall length along the crest of 480 ft. The limited width and curved nature challenge incorporation of a gated spillway into the existing structure. The load transfer associated with the arch dam also requires the spillway loads to be located on the upstream face of the dam to effectively transfer the loads onto the dam and subsequently into the rock abutments. As a result, the spillway alternatives will require extending a concrete structure to the upstream face to support the gated structures. Only the fixed spillway configuration could be constructed on the same alignment. Table 4-1 presents a list of advantages and disadvantages. In general the following observations can be made:
1) The Obermeyer gate is the simplest system to install, operate, and maintain for the Swan Lake Dam. This system can be installed along the upstream side of the existing spillway crest allowing the existing spillway ogee crest and chute to be maintained, which also confines the spillway discharge to the existing plunge pool. The control system required for the Obermeyer gates is simple to install and operate and can be set up to allow an automatic deflation based on reservoir level or inflow. Since the Obermeyer gate system does not have any intermediate piers, debris including trees and rootwads can be passed over the dam unimpeded, essentially identical to the existing un-gated ogee spillway. From a construction perspective, the Obermeyer gate sections are relatively easy to handle compared to the larger gate systems such as roller gates, easing the installation on the existing dam. Overall, this system represents the simplest approach for increasing the lake level at Swan Lake Dam while also maintaining the spillway capacity to pass the project PMF.

Southeast Alaska Power Agency Swan Lake Hydroelectric Project
Feasibility Study – Final Report Page 27 June 13, 2012
2) The rubber dam was determined to not be feasible for this application due to the physical footprint required for installation and potential damage to the rubber dam when passing debris. For these reasons, it was removed from further consideration.
3) Roller gates are a standard gate option used at dams throughout the country. At Swan Lake Dam, the biggest challenge is installing the required intermediate piers and hoist assembly to lift the gates during spill events. The hoist assembly would require access walkways, power, and a trolley system to support bulkheading and removal of the gates for inspection and maintenance. One of the biggest concerns is the restriction of debris passage over the dam during the PMF event. The intermediate piers required for the roller gate bays reduce the effective width of the spillway. From a construction perspective, the added complexity of the roller gates, hoists, and associated equipment along with the larger gate structures increases the complexity and cost of construction. A similar increase in operation and maintenance effort would also be expected.
4) The fixed crest alternative, though simple, is only feasible for a 10 ft lake raise. The resulting maximum reservoir level during the PMF event would exceed the structural capacity of the existing dam. This alternative would also require the top of dam to be raised even at the 10 ft lake raise level since the hydraulic capacity of the spillway is limited by the spillway crest elevation required to maintain the lake raise.
Based on this preliminary analysis, the Obermeyer gate alternative is the recommended alternative for consideration under the 10, 15 and 20 ft lake raise scenarios. The maximum Obermeyer gate height was assumed to be 15 ft based on the preliminary data from the manufacturer. For the 20 ft lake raise, the spillway crest would be raised by 5 ft to maintain a maximum Obermeyer gate height of 15 ft. The supplemental spillway capacity Alternative S3, Fuse Plug, can be coupled with the Obermeyer gate, if required. The goal would be to use the Obermeyer gate as a standalone option to achieve the lake raise while maintaining the hydraulic capacity to pass the PMF.
Table 4-1. Alternative Advantages and Disadvantages
Alternative Advantages Disadvantages
B1 - Obermeyer Gate Simple design and operation Adaptable to the spillway crest Allows automatic deflation during high
flow events Allows free passage of debris over the
spillway
Limited gate height (approximately 15 ft)
B2 - Rubber Dam Simple design and construction
Requires a large footprint to install Prone to damage during high flow
events Requires tapered wall end
connections
B3 - Roller Gate Standard gate design Can be installed on ogee gate crest Durable gate system
Requires hoist and frame to lift gates
More prone to debris blockage due to intermediate piers
More difficult to construct B4 - Raised Fixed Crest Simple design
Straight forward construction Results in a higher dam to contain
PMF (above 10 ft lake raise) S1 - Fuse Plug Provides effective method to pass high
PMF flows
Requires careful design development to ensure failure at appropriate time

Southeast Alaska Power Agency Swan Lake Hydroelectric Project
Feasibility Study – Final Report Page 28 June 13, 2012
Alternative Advantages Disadvantages
S2 - Low Level Outlet Valve
Standard design
Requires energy dissipation Difficult to install on existing arch
dam without dewatering Limited hydraulic capacity Requires more complex controls
S3 - Siphon Spillway Provides discharge at high reservoir elevations
No controls required to pass flow
Difficult to implement on an arch dam
May impact the existing plunge pool
4.4 10 Feet Lake Raise 4.4.1 Spillway Configuration To accomplish a 10 ft lake raise, the existing spillway crest will be extended upstream, straightened, and widened to allow installation of an Obermeyer Spillway Gate. The gate will be oriented in a straight line between the existing abutments providing a competent seal between adjacent gate leafs. A total of 6 to 10 gate leafs would be provided allowing the spillway crest to be segmented into equal width sections. A small equipment building would be constructed on the right abutment of the dam to house the Obermeyer controls and equipment which would include an air compressor, dryer, backup generator, and electrical equipment. The air line would be routed along the top of the dam mounted on the parapet wall to feed the gate air bladders. A HEC-RAS model was developed to route the PMF event through the reservoir. The analysis utilized the existing PMF hydrograph and reservoir stage-storage curve. The PMF event was initiated with a starting reservoir elevation of 340.0 ft. The Obermeyer gates were assumed to drop when the reservoir inflow reached 6,000 cfs resulting in an instantaneous increase in spillway capacity. The spillway rating curve for the existing ogee spillway was input into the model to set the flow over the spillway. As part of the final design effort, the shape and form of the spillway would be developed to maintain as close of a discharge coefficient to the existing ogee crest as possible. Using this analysis and spillway configuration, it was possible to pass the PMF event while maintaining the existing maximum reservoir level of 343.3 ft. As a result, the freeboard of 0.7 ft to top of dam and 4.2 ft to top of the parapet wall would be maintained. The arch dam would not have to be raised for the 10 ft lake raise. It is important to consider that the ability to open the gates based on inflow or reservoir elevation takes advantage of the increased flow over the spillway on the climbing leg of the hydrograph. This has the effect of discharging more water early during the PMF event allowing the maximum reservoir elevation of 343.3 ft to be maintained even though the operating level of the lake was raised from elevation 330.3 to 340.0 ft. During the final design effort, the reservoir routing model, spillway rating curve, and control system would be developed in detail to refine the intended operation during the PMF event. The analysis and background data are presented in Appendix A, Hydraulic Analysis. 4.4.2 Dam Under the proposed 10 ft lake raise and Obermeyer spillway gate arrangement, the main arch dam structure would not have to be modified. The existing top of dam elevation of 344.0 ft and top of parapet wall of 347.5 ft would be maintained. The concrete spillway section would have to be modified to support installation of the Obermeyer gate as discussed in the previous paragraph, and illustrated on Drawings B1 and LR-101 to LR-103.

Southeast Alaska Power Agency Swan Lake Hydroelectric Project
Feasibility Study – Final Report Page 29 June 13, 2012
4.4.3 Intake Structure The intake structure would have to be modified to support the increased lake raise to 340.0 ft as outlined in paragraph 3.3.1.4 and illustrated on Drawing B1 and LR-103. These modifications are related to raising the power intake structure to accommodate the lake raise. This would require raising the concrete structure and relocating the existing mechanical and electrical equipment to a higher elevation. 4.5 15 Feet Lake Raise 4.5.1 Spillway Configuration With a 15 ft lake raise, the new reservoir level of 445.0 ft would exceed the top of dam elevation of 344.0 ft by 1 ft. Based on discussions with Obermeyer gate, it is possible to fabricate and install a 15 ft high Obermeyer gate system. The existing spillway gate structure would have to be extended upstream an additional 5 to 7 ft to accommodate the increased gate length. Assuming the spillway crest is maintained at elevation 330.0 ft, the top of the gate would be set at elevation 345.0 ft. Using a similar approach as with the 10 ft lake raise, the PMF would be routed through reservoir with a maximum reservoir elevation of 347.0 ft occurring during the PMF flow event (inflow of 33,500 cfs). 4.5.2 Dam Assuming a minimum of 3 ft of freeboard, the top of dam would be raised to approximately elevation 350.0 ft. Since the intake structure is located upstream from the arch dam, the area between the intake structure and dam would have to be raised or a concrete wall constructed along the top of the reservoir to contain the reservoir elevation of 347.0 ft which occurs during the PMF flow as well as the normal maximum operating pool elevation of 345.0 ft. 4.5.3 Intake Structure Similar to the dam, the intake structure would have to be raised to contain the maximum operating pool of 347.0 ft. This would require raising the concrete intake structure, relocating the gate hoist equipment, and increasing the gate lift shaft. 4.6 20 Feet Lake Raise 4.6.1 Spillway Configuration To accommodate the 20 ft lake raise, the spillway crest will be raised to elevation 340.0 ft allowing incorporation of a more standard 10 to 15 ft high Obermeyer gate. Routing the PMF event through the reservoir starting at the maximum operating pool elevation of 350.0 ft and assuming the Obermeyer gates would open when the inflow reached 6,000 cfs, the resulting maximum reservoir elevation would be approximately 355.0 ft. this lake level was the maximum identified during the preliminary structural analysis to maintain acceptable dam stresses. 4.6.2 Dam Within in the 20 ft lake raise, the dam crest would be raised from elevation 344.0 to 358.0 ft providing a minimum of 3 ft of freeboard over the maximum PMF reservoir level of 355.0 ft. The dam would extend into the rock abutment on the north and south sides. The area between the dam and then intake structure would also be raised with a retaining wall constructed along the reservoir edge. The access road would also have to be re-graded and a retaining wall constructed to pass over the raised dam section. A new

Southeast Alaska Power Agency Swan Lake Hydroelectric Project
Feasibility Study – Final Report Page 30 June 13, 2012
handrail or parapet wall could be constructed on top of the dam to a minimum of 3 ft tall to provide safety. 4.6.3 Intake Structure Similar modifications to the intake structure would be required as outline for the 10 and 15 ft lake raises. 4.7 PFM Evaluation In order to fully evaluate the potential impacts of a lake raise, a review of the Probable Failure Modes Analysis (PFMA) is required to consider the impact of the lake raise on specific Probable Failure Modes (PFMs). The PFMA workshop session was conducted on June 10, 2004 in the offices of Ketchikan Public Utilities. Through the course of this workshop, the Core Team identified a total of 14 potential failures modes which were sorted by Category I through IV. These failure modes are presented in Table 4-2.
Table 4-2. Summary of Potential Failure Modes (PFMs) – Categories I through IV
PFM Structure Potential Failure Mode Category I
None - - Category II
3 Plunge Pool Erosion of Plunge Pool Undermining Toe of Dam 4 Spillway Blocked Spillway Causing Overtopping of Dam 6 Dam Foundation Abutment Block Failures
13 Dam Foundation Earthquake Causing Right Abutment Block Failure Category III
None - - Category IV
2 Dam Flood Loading on Dam 7 Dam Reservoir Loading on Dam 8 Power Conduit Load Rejection Surge Pressure Increase 9 Dam Seepage Through Foundation Causing Deterioration of Rock
10 Reservoir Ice Loading on Dam 11 Dam Earthquake Causing Landslide into Reservoir 12 Dam Earthquake Causing Rock Slabs to Fall Onto Dam Left Side 1 Dam Overtopping of Dam Causing Erosion Damage to Abutments
14 Dam Earthquake Loadings on Dam Causing Differential Block Movement Of these, the Category II PFM’s present the greatest risk to the dam due to a lake raise. A brief evaluation of these four Category II PFM’s is presented in the following paragraphs. The impact of the increase in static and/or dynamic loads is a result of additional head on the load cases of the identified Category IV PFM’s is also discussed. 4.7.1 Impact on Category II Load Cases 4.7.1.1 PFM No. 3 - Erosion of Plunge Pool Undermining the Toe of Dam The primary scenario is that a major flood discharge, frequent periodic lower flood discharge, or continuous spillway discharges might erode the foundation bedrock in the plunge pool or between the plunge pool and dam to the extent that it destabilizes the foundation under the dam resulting in a failure of the arch dam. The consequence of a dam failure is hazardous flows at the powerhouse, maintenance

Southeast Alaska Power Agency Swan Lake Hydroelectric Project
Feasibility Study – Final Report Page 31 June 13, 2012
facilities, and resident housing complex. Further consequences would be the loss of investment in the dam, damage to the powerhouse, maintenance facilities, resident housing complex, and the loss of a significant power resource to serve the cities of Ketchikan, Wrangell, and Petersburg. A spillway plunge pool was excavated in the river channel a short distance downstream from the dam. The plunge pool was designed to handle a significant spillway discharge up to the PMF. The central portion of the dam base upstream of the plunge pool was placed upon a plinth block used to shape the bottom contact of the dam with the foundation to avoid unusual stress conditions. On the downstream side, the concrete plinth block provides an additional 5 foot width of concrete on which the arch dam is founded. Since the dam was constructed, no significant plunge pool erosion has occurred. The rock conditions in the plunge pool are strong and substantial with tight pervasive joint systems which would be highly resistant to erosion and plucking caused by spillway discharges. As currently operated, the upstream limit of the excavated plunge pool and designed flow trajectory is about 60 ft downstream from the dam plinth. The following impact to PFM 3 is anticipated under the proposed lake raises:
1) A 10 ft lake raise utilizing an Obermeyer Spillway Gate would maintain the existing maximum spillway discharge of 19,800 cfs and reservoir level of elevation 343.3 ft. Consequently, no impact to the plunge pool as compared to the existing conditions is anticipated.
2) A 15 ft lake raise would result in a maximum spillway flow of 19,800 cfs and reservoir elevation
under the PMF of 347 ft. The maximum vertical drop from the end of the spillway chute to the plunge pool would not be expected to increase the potential for erosion within the plunge pool.
3) A 20 ft lake raise would result in a maximum spillway flow of 21,200 cfs and reservoir elevation under the PMF of 355 ft. The maximum vertical drop from the end of the spillway chute to the plunge pool would not be expected to increase the erosion potential within the plunge pool.
4.7.1.2 PFM No. 4 - Blocked Spillway Causing Overtopping of Dam The primary scenario is that if the spillway were to become partially blocked by floating tree debris and tree root balls, the capacity to pass flood flows would be reduced and might result in overtopping the dam and parapet wall. The overtopping would result in overtopping flows impinging directly on both abutment groin areas. The overtopping flows could also flow through the roadway turnaround area and flow over the right abutment groin and or washout the access road to the dam. Should sufficient erosion of the rock abutments occur, the erosion could undermine and destabilize the abutment foundation which might result in failure of the dam. Of the two selected base spillway modification alternatives, Alternative B1 Obermeyer Gate would be considered to have little or no impact on PFM No. 4. This is due primarily to the ability of the Obermeyer gate sections to lay flat on the spillway crest allowing free passage of debris over the spillway. With this alternative, the flow characteristics and ability to pass debris would be no different than the existing ogee, un-gated spillway. For the second base alternative, Alternative B3 Roller Gate, the spillway crest would be divided into a series of gate bays with piers placed between the gates to support the gate hoist equipment. The roller gates will release water under the gates precluding debris passage until the gate is lifted entirely out of the spillway flow. Sufficient clearance between the bottom of the gate and the spillway flow would be required to pass large trees and root wads over the spillway. Due to these limitations, Alternative B3 would be considered to increase the risk under PFM No. 4 due to the reduced spillway width with the intermediate piers between the roller gates. The actual lake raise whether

Southeast Alaska Power Agency Swan Lake Hydroelectric Project
Feasibility Study – Final Report Page 32 June 13, 2012
10, 15, or 20 ft would not be expected to significantly increase the risk of PFM No. 4 as long as the reservoir is cleared of timber prior to affecting the actual lake raise. 4.7.1.3 PFM No. 6 - Abutment Block Failures The primary scenario associated with this PFM is that the foundation blocks defined by joint sets in the dam foundation could become unstable and no longer provide adequate support to the arch dam. Loss of adequate foundation support for the arch dam could potentially cause a structural failure. The dam site rock formation is a meta-sedimentary rock unit consisting predominately of schist with subordinate intercollated graphitic pyllite. Foliation strikes approximately N10W and dips 60 to 85 degrees. The primary A-joint set strikes N55-75E and dips steeply to 0 to 35 degrees either side of vertical. The secondary B joint set strikes N80E and dips 0 to 35 degrees to the southeast. Joint planes were generally noted to be non-persistent, tight without clay infillings, planer, straight to slightly curved, and close to widely spaced. A third joint set was noted in the left abutment as foliation sheet jointing parallel to the ground surface. The original design stability analysis of the primary and secondary joint set blocks determined that some blocks did not form critical foundation potential instability conditions. Analyses of foundation blocks critical to the arch dam foundation stability were determined to exceed specified criteria for both static and dynamic loading conditions. As outlined in the PFMA analysis, re-analyses in 1994 of the foundation block formed by joint sets A and B confirmed that the intersection line of the joints dips upstream at 3 degrees. The A-B intersection block does not daylight downstream within 600 ft of the dam. Therefore, in order for the A-B block to fail it must be displaced upslope in a downstream direction in addition to overcoming the very large resisting shear forces developed on the joint surfaces. The static and dynamic safety factors that were re-determined exceed specific criteria. FERC requested a re-analysis with an earthquake loading of 0.3g be applied to block A-B in a cross canyon direction towards the river channel. The re-analysis yielded a safety factor of 1.8. The 20 ft dam raise is estimated to decrease the safety factor of 1.6 assuming a linear relationship between the dam height, resulting loads, and factor of safety. 4.7.1.4 PFM No. 13 - Earthquake Causing Right Abutment Block Failures Similar to PFM No. 6, as outlined in the PFMA analysis, re-analyses in 1994 of the foundation block formed by joint sets A and B confirmed that the intersection line of the joints dips upstream at 3 degrees. The A-B intersection block does not daylight downstream within 600 ft of the dam. Therefore, in order for the A-B block to fail it must be displaced upslope in a downstream direction in addition to overcoming the very large resisting shear forces developed on the joint surfaces. The static and dynamic safety factors that were re-determined exceed specific criteria. FERC requested a re-analysis with an earthquake loading of 0.3g be applied to block A-B in a cross canyon direction towards the river channel. The re-analysis yielded a safety factor of 1.8. The 20 ft dam raise is estimated to decrease the safety factor of 1.6 assuming a linear relationship between the dam height, resulting loads, and factor of safety. 4.7.2 Impact on Category IV Load Cases 4.7.2.1 PFM No. 8 – Load Rejection Surge Pressure Increase The PFMA Team postulated that the surge pressure increases resulting from a load rejection might cause overstressing in the concrete lined portion of the power conduit tunnel, the steel and concrete lined penstock portion, and the steel penstock section. Overstressing might cause a bursting failure within the power conduit system resulting in an uncontrolled release of reservoir water until such time that the power intake gate is closed. As outlined in paragraph 3.3.3, the estimated percent rise in the tunnel and pipe internal pressure due to the reservoir raise is small (e.g. 3.1 percent for the 10 ft raise). As a result, it

Southeast Alaska Power Agency Swan Lake Hydroelectric Project
Feasibility Study – Final Report Page 33 June 13, 2012
is likely that the factors of safety with the original design can easily handle these increased loading conditions. Under existing conditions, during load rejection, the lower end of the pipe and tunnel is already withstanding 176.1 psi surge pressure with no adverse effects. No adverse effects from the surge pressure are anticipated. It should be noted that small changes in turbine wicket gate closure timing, or adding a small delay upon the start of wicket gate closure upon load rejection can reduce hydraulic surge pressures significantly in the tunnel and pipeline. This approach could be used to lower surge pressures in the event that any section of the tunnel or penstock appears to be approaching a stress limit under any new reservoir raise scenario. 4.7.2.2 PFM No. 9 – Seepage through Foundation Causing Deterioration of Rock The PFMA Team postulated that seepage under the dam might result in mechanical or solution deterioration of the foundation rock. Long term occurrence of this condition could result in a foundation failure leading to a potential dam failure. As outlined in the PFM analysis, the dam was founded on fresh intact rock. The schist rock in the foundation is not a highly erodible type. Erosion, if it occurred, would be found along the joints and visual inspection would quickly identify developing leakage conditions in time to permit treatment of the foundation. Foundation leakage in the groins of the dam measured just upstream from the plunge pool indicates minimal leakage from the foundation and foundation drains on the downstream side of the dam. The increased stresses on the foundation due to the lake raises are not expected to increase the seepage through the foundation due to the tight rock formations, extensive curtain and consolidation grouting of the foundation joints, and estimated leakage through the existing dam of less than 2 gpm. 4.7.2.3 PFM No. 11 – Earthquake Causing Landslide into Reservoir The PFMA Team postulated that a significant magnitude earthquake might cause landslides into the reservoir which could cause landslide waves overtopping the dam resulting in overstressing and failure of the dam. The slopes around the reservoir are steep and have well vegetated shallow soils overlying bedrock. Small isolated slides have occurred historically around the reservoir. There have not been any observed active large deep-seated slides or slide conditions. Increasing the reservoir level would not be expected to increase the frequency or size of isolated landslides of the size required to create a wave capable of overtopping the dam. 4.7.2.4 PFM No. 13 – Earthquake Causing Rock Slabs to Fall onto Dam Left Side As outlined by the PFMA Team, the left or south side of the narrow river channel in which the dam is sited has exfoliation jointing in the bedrock that parallels the ground surface. The exfoliation joints result in small slab rockfalls above the left abutment of the dam and the abutment area above the plunge pool. It was postulated that an earthquake could result in larger rock slab rockfalls occurring above the left end of the dam or above the plunge pool area of such magnitude that the dam might fail due to direct structural damage or loss of left abutment foundation support immediately downstream from the dam. The PFMA Team indicated that the expected exfoliation slabs would be expected to be small, would not be significant enough to cause structural failure of the dam, and it is not reasonable to postulate a dam failure. Increasing the lake level would not change this postulation. As a result, the increased lake level would not impact this PFM. 4.7.2.5 PFM NO. 1 – Overtopping of Dam and Erosion Damage to Abutments A postulated flood that exceeded the spillway discharge capacity might result in overtopping the dam, the right abutment roadway turnaround area, and the right abutment road. The overtopping would result in overtopping flows impending directly on the abutment groin areas. The overtopping flow could also flow

Southeast Alaska Power Agency Swan Lake Hydroelectric Project
Feasibility Study – Final Report Page 34 June 13, 2012
through the roadway turnaround area and flow over the right abutment groin and/or washout the access road to the dam. Should sufficient erosion of the rock abutments occur, the erosion could undermine and destabilize the abutment foundation which could result in failure of the dam. The PFMA Team indicated that without any adverse conditions occurring at the same time, the postulated PFM is clearly so remote as to be a non-credible or not reasonable to postulate to its occurrence. Under the 10 ft lake raise, the PMF maximum reservoir level of 343.3 ft is maintained, maintaining existing operating conditions and essentially not changing this PFM. With the 15 and 20 ft lake raises, the Obermeyer spillway gates will be added, providing significantly more spillway capacity and the ability to release more water early on the ascending leg of the inflow hydrograph. The top of dam will also be raised providing adequate freeboard to contain the PMF event. Based on these modifications, this PFM is not expected to be impacted. 4.7.2.6 PFM No. 14 – Earthquake Loading on Dam Causing Differential Block Movement PFM 14 was postulated during the PFMA session based on the issue of the lack of keyed vertical contraction joints between the arch dam monoliths. During earthquake loadings, it was expressed that differential movement between monoliths might result in severe structural damage to the dam or potentially cause a dam structural failure. The PFMA Team review of the ADSAS results for the dynamic analyses recommended that the postulated PFM 14 be set as a Category IV because of the physical possibility for the monoliths to differentially deflect sufficiently to lead to a failure does not exist and it is not reasonable to postulate its occurrence. FERC subsequently agreed with this recommendation. When considering the lake raise, the basic premise associated with this PFM analyses and classification would not be expected to change. 4.8 Conclusions As outlined in the previous paragraphs, increasing the operating lake level by 10, 15, or 20 ft is feasible at the existing Swan Lake Dam. An Obermeyer spillway gate system is recommended for installation on the existing spillway crest to accomplish the lake raise. This gate system can be readily implemented on the existing dam and provides unimpeded flow over the spillway maintaining effective debris passage as well. The 10 ft lake raise can be accomplished without raising the existing dam height by operating the new gated spillway to begin releasing flow early on the PMF hydrograph. The increased head on the spillway crest provides a much higher unit discharge as compared to the existing un-gated overflow spillway. Through this approach, the existing maximum reservoir elevation of 343.3 ft can be maintained during the PMF event. For the 15 and 20 ft lake raises, the dam crest will have to be raised to accommodate both the increased active storage operating water level as well as the maximum PMF lake level. The gated spillway structure allows more effective control of the PMF hydrograph allowing more flow to be released on the ascending leg of the hydrograph. As a result, the maximum reservoir level can be controlled to a lower level than that of a conventional fixed spillway crest. The dam raise will require additional abutment treatment on both the north and south banks of the dam, raising the area between the dam and the intake structure, and re-grading the main access road to pass over the raised dam section. For all lake raise levels, the existing power intake structure will have to be modified. These modifications consist of raising the concrete structure and relocating the mechanical equipment required to raise and lower the gate to a higher elevation. Much of the existing equipment could be reused with the intake structure modifications. Based on the preliminary analyses, the existing arch dam, power tunnel, and powerhouse equipment were determined to be capable of withstanding the increased lake levels while maintaining acceptable factors of safety. Additional analysis will be required as part of the final design effort to confirm these preliminary

Southeast Alaska Power Agency Swan Lake Hydroelectric Project
Feasibility Study – Final Report Page 35 June 13, 2012
assumptions. The lake raise is also not expected to impact the PFM issues and category rankings. Selection of the recommended level of lake raise is dependent on balancing the estimated capital cost with the increased level of storage and power generation. This analysis is not presented within this preliminary feasibility study report.

Southeast Alaska Power Agency Swan Lake Hydroelectric Project
Feasibility Study – Final Report Page 36 June 13, 2012
SECTION 5 COST ESTIMATES AND CONSTRUCTION
5.0 Introduction Section 5 presents the cost estimates and construction methodology for implementing a reservoir raise at the existing Swan Lake Dam. 5.1 Basis of Cost Estimate In considering cost estimate preparation, it is important to realize that changes during final design as well as changes in the cost of materials, labor, and equipment will cause comparable changes in the cost estimates presented within this report. A good indicator of changes in construction cost is the Engineering News-Record (ENR) Construction Cost Index. Construction cost data presented within this report are not intended to be the lowest cost for completing the work. Instead, the costs represent the median costs that would result from responsible bids received from qualified contractors. The unit costs presented within this report were derived from a number of sources. Unit prices for materials were obtained from sources located in Ketchikan, Alaska. Transportation costs for materials and equipment were assumed to be by barge from Ketchikan to the project site. 5.2 Precision of Cost Estimates A planning level cost estimate as defined by the American Association of Cost Engineers, is appropriate for a conceptual level design study. A planning level cost estimate is prepared based on the level of detail presented within a conceptual design study and drawings and generally includes preliminary estimates of quantities and equipment requirements. A planning level estimate has an expected accuracy of +50 percent/-30 percent. All estimates presented within this report are planning level estimates. 5.3 Construction Schedule McMillen has prepared a summary level project schedule to reflect the construction efforts required to accomplish the work described in a 15ft lake raise. McMillen chose to provide this schedule alternative as it is the middle ground proposed alternative related to both schedule and cost. The construction activities are presented in broad enough description that they may apply to the other proposed lake raise alternatives. This schedule is not based upon an anticipated duration or required completion date; therefore it does not take acceleration efforts into account, through either multiple working shifts or increased crew sizes. The project start date for the Notice to Proceed (NTP) has been set to January 1, 2013 for illustrative purposes only.

Southeast Alaska Power Agency Swan Lake Hydroelectric Project
Feasibility Study – Final Report Page 37 June 13, 2012
5.4 Project Cost Summary The following table presents a side by side comparison for the three lake raise alternatives presented in this report. Additional detail on the cost for each alternative can be found in Appendix D. As detailed in this table, the alternatives are broken down into two totals: The “Total Construction Cost” is the value that the owner can expect to pay to hire a construction contractor to perform the work, while the value of “Total Capital Cost” is the bottom line cost that the owner can expect to pay for construction services as well as complete project design and design support during the construction process.
Table 5-1. Cost Summary
Item Lake Raise Options
10 ft Lake Raise
15 ft Lake Raise
20 ft Lake Raise
Construction Cost $ 4,124,105 $ 7,260,369 $ 11,343,223 Design Contingency (10%) $ 412,410 $ 726,037 $ 1,134,322 Construction Cost Subtotal $ 4,536,515 $ 7,986,406 $ 12,477,545
Field Change Order Contingency (5%) $ 206,205 $ 363,018 $ 567,161 Total Construction Cost $ 4,742,720 $ 8,349,424 $ 13,044,706
Planning, Engineering and Design (15%) $ 680,477 $ 1,197,961 $ 1,871,632 Engineering Services During Construction (5%) $ 226,826 $ 399,320 $ 623,877 Construction Supervision and Administration (8%) $ 379,418 $ 667,954 $ 1,043,577 Total Capital Cost $ 6,029,441 $ 10,614,659 $ 16,583,792
5.5 Assumptions Below is a list of assumptions by category that are assumed for the basis of this cost estimate. 5.5.1 General The following general assumptions were made:
Used the Davis-Bacon prevailing wage rates for the Ketchikan, Alaska area (General Decision Number: AK20100001).
Assumed no additional per diem or hardship stipend to be paid to employees beyond the stated wage rates and appropriate fringe benefit rates. Employee’s meals and living arrangements have been included in the cost of an onsite man-camp.
Assumed a flat 10 percent rate of the direct construction costs to account for the contractor’s general conditions.
Assumed no labor acceleration (double shifts or increased crew sizes) to complete the project by a target date or duration.
Assumed no cost for liquidated damages in the included pricing.

Southeast Alaska Power Agency Swan Lake Hydroelectric Project
Feasibility Study – Final Report Page 38 June 13, 2012
5.5.2 Mobilization The following mobilization assumptions were made:
Assumed the majority of construction equipment and materials to be delivered by barge from either the Seattle, Washington or Anchorage, Alaska area to Ketchikan, Alaska via commercial barge transporting routes.
Assumed all necessary construction equipment and materials to be barged from Ketchikan, Alaska to a staging and work camp area on the Carroll Inlet near the base of Swan Lake dam via a chartered barge transport.
Assumed that mobilization to the project will be accomplished through an early mobilization of a small preparatory crew to establish a man-camp, construct the onsite batch plant, and perform other necessary small site improvements prior to the full mobilization of full project labor force.
5.5.3 Preparatory Work The following preparatory work assumptions were made:
Assumed the installation of a temporary batch plant onsite for the batching of all cast-in-place concrete materials.
Assumed the ability to erect a floating work barge assembly on the upstream side of the dam using modular “Flexi-Float” type barges.
Assumed the ability to “walk” a Rough Terrain crane onto the floating work barge assembly within close proximity to the intake tower structure with little or no site improvements required.
Assumed no significant site improvements are required to the transport road connecting the assumed staging area and the dam crest/intake tower area.
Assumed the ability to erect and maintain a working man camp area onsite for the duration of the project. This will include lodging, mess hall, and shower/restroom facilities.
5.5.4 Construction The following construction assumptions were made:
Assumed an allowance of $20,000.00 for material testing and quality assurance of batched concrete products on this project.
Assumed an allowance for $100,000 for temporary heating materials, equipment, and labor during the concrete placement and curing operations.
Assumed an allowance for $400,000 for mechanical system upgrades on this project. Assumed the ability to install a work scaffold system anchored to the dam face on the upstream
side of the dam face. This will serve as a work platform as well as the routing for a concrete placing slickline.
Assumed the ability to operate a floating work barge along the upstream face of the dam to assist in the installation of the work platform, erection and movement of formwork, and placement of concrete.
Assumed the ability to install a work scaffold system anchored to the face of the concrete walls of the Intake Tower to complete the necessary improvements to the tower for a dam crest raise.
Assumed the reinforcing steel will be required at a rate of 150 lbs of rebar per 1 CY of concrete placed.
Assumed the necessary power services required to operate the proposed Obermeyer gates is available onsite.

Southeast Alaska Power Agency Swan Lake Hydroelectric Project
Feasibility Study – Final Report Page 39 June 13, 2012
5.5.5 Start-Up and Testing
Assumed no return trips to the project site by the contractor following the project demobilization. All project punch-list corrections, equipment start-up, testing, and owner training is to be conducted prior to project demobilization.
Assumed an allowance of $30,000 for an Obermeyer gate manufacturer’s representative to provide technical assistance onsite during the start-up and testing phase.

Southeast Alaska Power Agency Swan Lake Hydroelectric Project
Feasibility Study – Final Report Page 40 June 13, 2012
SECTION 6 CONCLUSIONS AND RECOMMENDATIONS
6.0 Conclusions A study was conducted to determine if a 10, 15, or 20 ft lake raise is feasible at the existing Swan Lake Dam. As a starting point in the study, an assessment of the arch dam, power intake, power tunnel, and powerhouse equipment was completed to determine if, in relative terms, this level of lake raise would have a detrimental effect on the existing hydropower facility components. For the structural assessment, a finite element model was developed using the SAP2000 finite element analysis software for the existing arch dam. The model results for the existing reservoir operating level of 330.0 ft were compared to the original design analysis results presented within the Part 12 Inspection Reports. This comparison indicated similar trends in loads, though the exact loads varied between the original design and SAP2000 model. The model was then used to determine the increased stresses within the arch dam considering a 10, 15, and 20 ft lake raise. The analysis concluded that the lake level could be raised up to 25 ft while maintaining acceptable factors of safety for compressive and tensile stresses within the dam. A preliminary assessment on the power intake structure, power tunnel, and powerhouse equipment indicated that it is likely that the existing equipment can withstand the increased operating water level loadings. The original design for these elements was determined to be conservative enough to withstand the increased reservoir levels. A more refined analysis will be required as part of the final design development for the selected lake raise scenario. With the structural analysis confirming that the existing dam could withstand the proposed lake raise ranging from 10 to 20 ft, a range of spillway modification alternatives was considered including Obermeyer gates, rubber dams, roller gates, and a simple fixed gate crest. These alternatives were identified as potential alternatives to accomplish the lake raise while also passing the PMF. In addition to the base alternatives, supplemental spillway alternatives such as a fuse plug, low level outlet valves, and siphon spillways were considered. Only the fuse plug was determined to have merit for application at Swan Lake Dam. Of these alternatives, the Obermeyer gate was selected as the best approach for implementation at the Swan Lake Dam due to the relatively simple design and operation, ability to maintain close to the existing spillway discharge coefficients, ability to adapt to the existing spillway crest, and the flexibility to incorporate a control mechanism which would allow automatically dropping the gates during large flow events. The Obermeyer gate was subsequently assumed for all of the lake raise scenarios. Using a HEC-RAS model, the PMF inflow hydrograph was modeled in combination with the existing reservoir stage-storage curve and the spillway rating curve. Incorporating a gated spillway allows release of flood flows on the ascending leg of the inflow hydrograph controlling the maximum reservoir level. For the 10 ft gate raise, the existing maximum reservoir level during the PMF of 343.3 ft can be maintained. As a result, the dam would not have to be raised to accommodate the 10 ft lake raise. A similar approach was used with the spillway gates to control the maximum PMF reservoir level resulting in a maximum lake level of approximately 347.0 ft for the 15 ft lake raise, and 355.0 ft for the 20 ft lake raise. Under these lake raise scenarios the arch dam would have to be raised along with the area located between the dam and the power intake structure. The existing access road would also have to re-graded to pass over the raised dam section. Under all alternatives, the power intake structure would have to be modified to relocate the gate hoist equipment out of the active operating lake level. The extent of the required modifications increases with

Southeast Alaska Power Agency Swan Lake Hydroelectric Project
Feasibility Study – Final Report Page 41 June 13, 2012
the lake raise level. Overall, the proposed lake raise is not expected to impact either the Category II or Category IV PFM elements. In summary, the analysis completed within this report determined that the existing Swan Lake Dam and associated equipment is capable of withstanding a lake raise of up to 25 ft from the existing operating level of 330.0 to 355.0 ft. This maximum reservoir level would occur during the PMF flow event. Selection of the recommended level of lake raise is dependent on the estimated level of increased storage balanced with the increased generation value. This type of analysis is outside the scope of this report. It should be noted however, that 30 to 40 percent of the cost associated with implementing a lake raise is associated with the mobilization and site setup required to execute the work effort. If a lake raise of over 10 ft is selected, the existing dam crest will have to be raised. The incremental cost to increase the lake level beyond this minimum level would be expected to decline due to the high upfront costs associated with bringing equipment and crews to the site, as well as providing access to the dam to construct the improvements. 6.1 Recommendations As the lake raise level is selected, the following work elements are recommended:
1) Refine the SAP2000 finite element model to reflect the selected lake raise level and dam geometry.
2) Complete a more detailed analysis of the required modifications to the power intake including the required structural concrete modifications, mechanical equipment relocation and updates, and physical raising of the area between the dam and the power intake.
3) Conduct a more detailed analysis of the final loads on the power intake, power tunnel, and powerhouse equipment to verify the anticipated loads are within the acceptable factors of safety.
4) Refine the HEC-RAS flood routing through the reservoir and spillway to optimize the spillway gate crest elevation and operation.
5) Work with the Obermeyer gate manufacturer to optimize the gate height and width configuration to fit the Swan Lake Dam orientation. The intent of this analysis is to select a standard gate configuration that would not require special fabrication, assembly, or operation.
6) Anticipate new PFMA questions such as failure of the control system, requirement for back up air supply, and a fail proof mechanical open system to lower the Obermeyer gates when the reservoir reaches elevation 349.8 ft.
Southeast Alaska Power Agency Swan Lake Hydroelectric Project
Feasibility Study – Final Report Page 42 June 13, 2012
REFERENCES Brater, E.F., and King H.W., Handbook of Hydraulics, Sixth Edition, 1976. Chaudhry, M.H., Applied Hydraulic Transients, Second Edition, 1987. Chow, V.T., Open Channel Hydraulics, 1959. Bowes, D.E., Swan Lake Hydroelectric Project, FERC Project No. 2911, Independent Consultant
Inspection Report, February 2005. Bowes, D.E., Swan Lake Hydroelectric Project, FERC Project No. 2911, Potential Failure Mode Analysis
Report, Amendment No. 1, August 2008. HDR Alaska, Swan Lake Hydroelectric Project, FERC Project No. 2911, Supporting Technical
Information (STI) Document, August 2008. FEMA, Federal Guidelines for Dam Safety, Earthquake Analyses and Design of Dams, May 2005. FERC, Engineering Guidelines for the Evaluation of Hydropower Projects, Chapter 11 - Arch Dams,
October 1999. FERC, Chapter 14 Dam Safety Performance Monitoring Program, Rev. 1, July 2005. Golze, Alfred R., Handbook of Dam Engineering, Van Nostrand Reinhold Company, 1977. Hatch Acres, Swan Lake Hydro Project, FERC Project No. 2911, FERC Part 12 Safety Inspection Report,
December 2009. Hatch Acres, Swan Lake Hydro Project, FERC Project No. 2911, 2009 Potential Failure Modes Analysis
Supplement, December 2009. Swan Lake Project Final Reports, Part 12-Independent Consultant Inspection Report, Supporting
Technical Information Document, and Potential Failure Mode Analysis Report, prepared for the Four Dam Pool Power Agency, February 2005.
USBR, Design Criteria for Concrete Arch and Gravity Dams, A Water Resources Technical Publication
Engineering Monograph No. 14, 1977. USBR, A guide for Preliminary Design of Arch Dams, A Water Resources Technical Publication, Engineering Monograph No. 36, 1977.

Southeast Alaska Power Agency Swan Lake Hydroelectric Project
Feasibility Study – Final Report June 13, 2012
APPENDIX A
HYDRAULIC ANALYSIS

TECHNICAL MEMORANDUM
McMillen, LLC Page 1 Swan Lake Dam Lake Raise Unpublished Work Technical Memorandum February 21, 2012
To: Mort McMillen Project: Swan Lake Dam
From: E. George Robison, PE McMillen, LLC
Cc: File
Date: February 21, 2012 Job No:
Subject: Options for Swan Lake Dam Raise - Hydraulic Considerations
1.0 INTRODUCTION An alternatives analysis was conducted for Swan Lake Dam using different combinations of dam raise heights or introduction of different gate heights. This analysis was conducted to evaluate the stage water height on the dam under different scenarios to in turn evaluate what structural modifications to the dam would need to be accomplished. Data for this analysis came from the design drawings for the dam and a FERC Part 12 Safety Inspection Report conducted in 2009. The storage area rating curve values used in the HEC-RAS model (Table 1) were digitized from the Effective Power Curves (Figure 1). A significant point is the elevation - storage area capacity curve is nearly linear beyond 280 Feet. This will result in nearly the same outflow hydrograph shape when comparing the existing vs. raised spillway results. Differences will mostly consist of offset values with the whole curve shifting uniformly as crest level or gate levels are raised.
Table 1. Storage Area Rating Curve - Digitized from Figure 1
Reservoir Elevation, Feet Elevation Capacity
230 0
237 5 260 30 284 60 306 90 327 120
347.5 150 367.5 180 387.5 210 394.5 220 400 227

McMillen, LLC Page 2 Swan Lake Dam Lake Raise Unpublished Work Technical Memorandum February 21, 2012
Figure 1. Storage Area Rating Curve The inflow hydrograph was also taken from basic data from an analysis that resulted in a PMF of 33,500 cfs (Figure 2).
Figure 2. Inflow and outflow Hydrograph (Note: Dots are digitizing points and purple x's are calibration points using a developed HEC-RAS model for this
alternatives analysis.)

McMillen, LLC Page 3 Swan Lake Dam Lake Raise Unpublished Work Technical Memorandum February 21, 2012
2.0 SCENARIOS EVALUATED FOR EFFECTS ON RESERVOIR STAGE HEIGHT Several combinations of dam height vs. gate height vs. crest invert level were analyzed using a simple HEC-RAS model (Table 2). The HEC-RAS used a storage area with a stage storage relationship given in Table 1. Input hydrograph for the scenarios was digitized from Figure 2 and input to the model as a unsteady boundary condition. Gate values used in HEC-RAS are given in Table 2. In Table 2 each row represents a different scenario. For all gated scenarios gate operations were set as follows:
If (Storage Area Net Inflow < 6000 cfs) then Gate Opening = 0 Else If ( Storage Area Net Inflow > 6000 cfs) then Gate Opening = 10 (or 15 for last
scenario)
This allows for the Obermeyer gates to be opened when flow reaches 6,000 cfs within the model. This flow was selected as the starting value based on being slightly higher than the largest flow on record, which was 5,500 cfs. The flow set pint could be adjusted to optimize the gate opening point to balance the spillway discharge with the reservoir storage and associated maximum reservoir level which would occur during the PMF event. Table 2. Scenarios Under Which Swan Lake Dam was Evaluated for Effects of Gates and
Dam Raises on PMF Water Surface Levels on Reservoir
Width
Spillway Length
Spillway Height
Top of Dam Gate** Height
Initial SA WSE
Existing Dam 20 100 330 347.5 0 330 Crest 340 Constant
20 100 330 347.5 10 340
Crest 340 w Gate
Operations 20 100 330 347.5 0 - 10 340
*Crest 340 Constant
20 100 330 361 0 340
*Crest 350 Constant
20 100 340 361 0 350
*Crest 350 w Gate
Operations 20 100 340 361 0 - 10 350
Crest 345 w Gate
Operations 20 100 330 350 0 - 15 345
*This scenario raises the top of the dam to 361 ft so that the dam is not overtopped during these simulations so the gate hydrograph can be evaluated. This allows for comparison of the 340 ft gate scenario to the raised dam scenario. ** Obermeyer gates are not available in HEC-RAS. Instead the gates are defined as open air overflow gates with an Ogee crest.

McMillen, LLC Page 4 Swan Lake Dam Lake Raise Unpublished Work Technical Memorandum February 21, 2012
3.0 RESULTS There are a total of 7 conditions (scenarios) run. Each row in Table 2 represents a different scenario. Figure 3 compares three conditions. The first is the current reservoir operation (blue line). The stage peaks at a little over 344 feet. For the dam at a constant 340 foot crest height the stage peaks at over 352 feet. By using a 10 foot Obermeyer gate and creating a rule that it opens at 6,000 cfs stage height which begins at 340 feet peaks at 345 feet instead of 352 feet reducing the need to raise the crest to increase freeboard as compared to the constant 340 foot crest elevation.
Figure 3. Stage Heights of Existing Dam and Gated Dam With and Without Gate Operations

McMillen, LLC Page 5 Swan Lake Dam Lake Raise Unpublished Work Technical Memorandum February 21, 2012
Figure 4 presents three conditions with base crest elevation at 340 feet (black line with squares). The crest peaks at 354 feet. If the crest is simply raised to 350 feet the peak rises to over 363 feet and this is also overtopping the dam set at 361 feet (blue line). By using a gate and opening it at 6,000 cfs the stage on the dam peaks at less than 355 feet elevation.
Figure 4. Stage Heights of Existing Dam with Constant Gate Height and Raised Dam With and Without Gate Operations

McMillen, LLC Page 6 Swan Lake Dam Lake Raise Unpublished Work Technical Memorandum February 21, 2012
For Figure 5 simple comparisons are dispensed with and a 15 foot Obermeyer gate is modeled with a beginning elevation of 345 feet. When opened the crest elevation drops back to 330 feet. Stage results for the PMF show there is an initial rise to 347 feet elevation a drop as the gate is opened and then a rise as the PMF is accommodated up to approximately 345 feet. Since the maximum peak occurs during the initial run up to 6,000 cfs, some freeboard elevation can be shaved by changing the rule to 5,000 cfs for when the gates can be opened. Since the stage storage relationships are linear this graph can be adjusted for different gate heights. For instance a 12 foot Obermeyer gate will jump up to 344 feet (etc.) on the initial run up and the later part of the hydrographs going through a dip and then peaking again with the PMF peak.
Figure 5. Stage Heights of Swan Lake Dam with a Crest Elevation of 330 Feet and a 15 Foot Obermeyer Gate Opened at 6,000 cfs

McMillen, LLC Page 7 Swan Lake Dam Lake Raise Unpublished Work Technical Memorandum February 21, 2012
4.0 CONCLUSION Using the HECRAS model, varying combinations of spillway sizes, crest elevations, and gate widths can be modeled in combination with the reservoir stage-storage curve to determine predicted maximum reservoir levels which would occur during the PMF event. From the preliminary analysis presented within the memorandum, the 10 ft lake raise could be contained to the existing maximum reservoir level of 343.3 ft. Adjusting the inflow set point at which the Obermeyer gates are lowered allowing unrestricted spillway discharge. This would allow the lake raise to be accomplished without raising the main arch dam crest. For the 15 to 20 ft lake raise, the active storage operating level would exceed the existing top of dam. As a result, the arch dam crest would have to be raised. A similar evaluation could be completed to optimize the spillway configuration to minimize the rise in reservoir level which occurs during the PMF event. This type of optimization analysis would be incorporated into the preliminary design analysis.


Southeast Alaska Power Agency Swan Lake Hydroelectric Project
Feasibility Study – Final Report June 13, 2012
APPENDIX B
STRUCTURAL ANALYSIS

Southeast Alaska Power Agency
Swan Lake Hydroelectric Project
Lake Raise Feasibility Study
Structural Design
Prepared For: Southeast Alaska Power Agency
Prepared By: McMillen, LLC
June 13, 2012

DAM INPUT

SAP2000
SAP2000 v15.1.0 - File:Double Curvature Pinned Dam - Swan Lake - 3-D View - lb, ft, F Units
2/21/12 13:30:22


TABLE: Load Case Definitions
Case Type Notes
Text Text Text
DEAD LinStatic Self Weight of structure
MODAL LinModal For Response spectrum
Temp_Max LinStatic Max Temperature
Temp_Min LinStatic Min Temperature
Ice Load_EL330 LinStatic Ice Load @ EL 330
Silt LinStatic Silt Load
Tail Water LinStatic Tail Water Load
RS LinRespSpec Response spectrum
Hydrostatic_EL330 LinStatic Hydrostatic load as per elevation
Hydrostatic_EL344 LinStatic Hydrostatic load as per elevation
Hydrostatic_EL340 LinStatic Hydrostatic load as per elevation
Hydrostatic_EL350 LinStatic Hydrostatic load as per elevation
Hydrostatic_EL345 LinStatic Hydrostatic load as per elevation
Hydrostatic_EL266 LinStatic Hydrostatic load as per elevation
Hydrostatic_EL354 LinStatic Hydrostatic load as per elevation
Hydrostatic_EL359 LinStatic Hydrostatic load as per elevation
Hydrostatic_EL364 LinStatic Hydrostatic load as per elevation
Hydrodynamic_EL330 LinStatic Hydrodynamic load as per elevation
Hydrodynamic_EL340 LinStatic Hydrodynamic load as per elevation
Hydrodynamic_EL345 LinStatic Hydrodynamic load as per elevation
Hydrodynamic_EL350 LinStatic Hydrodynamic load as per elevation
LC‐1 (EL330) LinStatic
LC‐2 (EL330) LinStatic
LC‐3 (EL330) LinStatic
ULC‐1 (EL330) LinStatic
ULC‐2 (EL330) LinRespSpec
ELC (EL330) LinRespSpec
LC‐1 (EL340) LinStatic
LC‐2 (EL340) LinStatic
LC‐3 (EL340) LinStatic
ULC‐1 (EL340) LinStatic
ULC‐2 (EL340) LinRespSpec
ELC (EL340) LinRespSpec
LC‐1 (EL345) LinStatic
LC‐2 (EL345) LinStatic
LC‐3 (EL345) LinStatic
ULC‐1 (EL345) LinStatic
ULC‐2 (EL345) LinRespSpec
ELC (EL345) LinRespSpec
LC‐1 (EL350) LinStatic
LC‐2 (EL350) LinStatic
LC‐3 (EL350) LinStatic
ULC‐1 (EL350) LinStatic
ULC‐2 (EL350) LinRespSpec
ELC (EL350) LinRespSpec
Ey(OBE) LinStatic Seismic
Ey (MCE) LinStatic Seismic
Load Combos for Current Reservoir condition
Load Combos for 10 ft Rise condition
Load Combos for 15 ft Rise condition
Load Combos for 20 ft Rise condition

SAP2000
SAP2000 v15.1.0 - File:Double Curvature Pinned Dam - Swan Lake - Solid Surface Pressure - Face 3 (Hydrostatic_EL330) - lb, ft, F Units
2/20/12 17:44:16

SAP2000
SAP2000 v15.1.0 - File:Double Curvature Pinned Dam - Swan Lake - Solid Surface Pressure - Face 3 (Hydrostatic_EL340) - lb, ft, F Units
2/20/12 17:53:18

SAP2000
SAP2000 v15.1.0 - File:Double Curvature Pinned Dam - Swan Lake - Solid Surface Pressure - Face 3 (Hydrostatic_EL345) - lb, ft, F Units
2/20/12 17:55:53

SAP2000
SAP2000 v15.1.0 - File:Double Curvature Pinned Dam - Swan Lake - Solid Surface Pressure - Face 3 (Hydrostatic_EL350) - lb, ft, F Units
2/20/12 17:59:33

SAP2000
SAP2000 v15.1.0 - File:Double Curvature Pinned Dam - Swan Lake - Solid Surface Pressure - Face 3 (Hydrodynamic_EL330) - lb, ft, F Units
2/20/12 18:01:37

SAP2000
SAP2000 v15.1.0 - File:Double Curvature Pinned Dam - Swan Lake - Solid Surface Pressure - Face 3 (Hydrodynamic_EL340) - lb, ft, F Units
2/20/12 18:03:03

SAP2000
SAP2000 v15.1.0 - File:Double Curvature Pinned Dam - Swan Lake - Solid Surface Pressure - Face 3 (Hydrodynamic_EL345) - lb, ft, F Units
2/20/12 18:03:46
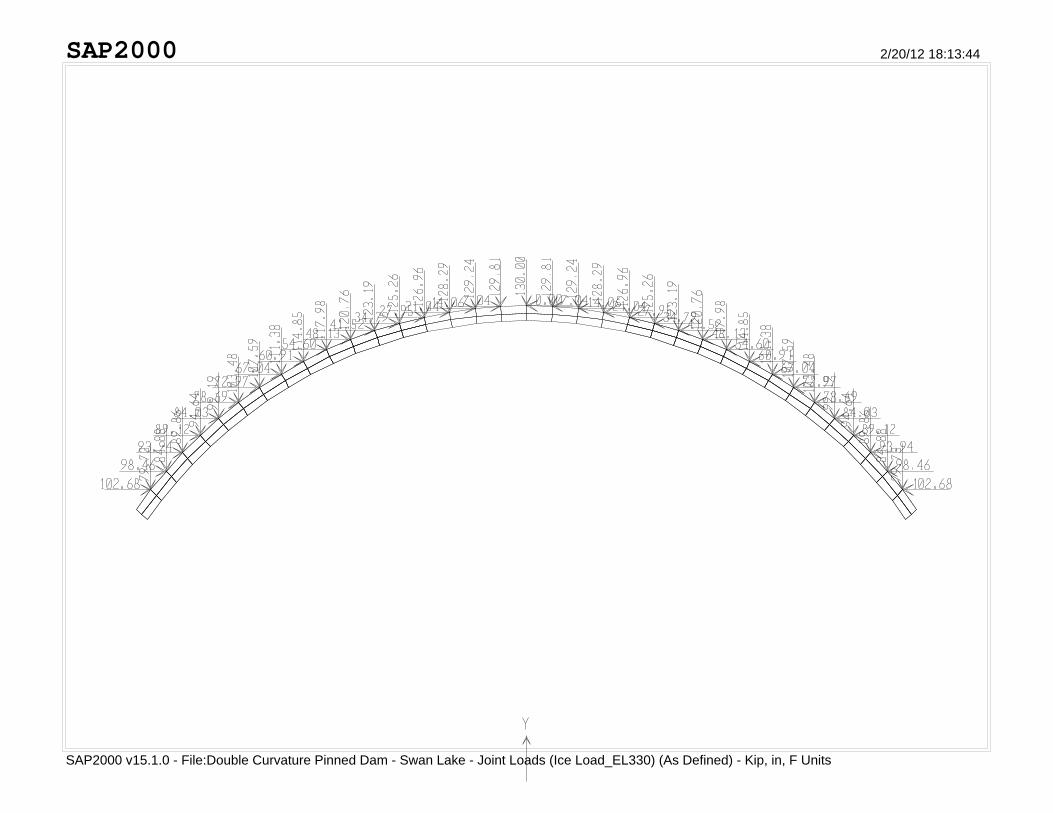
SAP2000
SAP2000 v15.1.0 - File:Double Curvature Pinned Dam - Swan Lake - Joint Loads (Ice Load_EL330) (As Defined) - Kip, in, F Units
2/20/12 18:13:44

SAP2000
SAP2000 v15.1.0 - File:Double Curvature Pinned Dam - Swan Lake - Solid Surface Pressure - Face 3 (Silt) - lb, ft, F Units
2/20/12 18:09:14

SAP2000
SAP2000 v15.1.0 - File:Double Curvature Pinned Dam - Swan Lake - Solid Surface Pressure - Face 1 (Tail Water) - lb, ft, F Units
2/20/12 18:09:56

SAP2000
SAP2000 v15.1.0 - File:Double Curvature Pinned Dam - Swan Lake - Solid Temperatures (Temp_Max) - lb, ft, F Units
2/20/12 18:11:18
8.0 9.2 10.3 11.5 12.6 13.8 14.9 16.1 17.2 18.4 19.5 20.7 21.8 23.0

SAP2000
SAP2000 v15.1.0 - File:Double Curvature Pinned Dam - Swan Lake - Solid Temperatures (Temp_Min) - lb, ft, F Units
2/20/12 18:11:39
-10.0 -9.5 -8.9 -8.4 -7.8 -7.3 -6.8 -6.2 -5.7 -5.2 -4.6 -4.1 -3.5 -3.0

TABLE: Case ‐ Static 1 ‐ Load Assignments
Case LoadType LoadName LoadSF
Text Text Text Unitless
Load pattern DEAD 1
Load pattern Hydrostatic_EL330 1
Load pattern Ice Load_EL330 1
Load pattern Silt 1
Load pattern Tail Water 1
Load pattern Temp_Min 1
Load pattern DEAD 1
Load pattern Hydrostatic_EL330 1
Load pattern Silt 1
Load pattern Tail Water 1
Load pattern Temp_Max 1
Load pattern DEAD 1
Load pattern Hydrostatic_EL266 1
Load pattern Silt 1
Load pattern Tail Water 1
Load pattern Temp_Max 1
Load pattern DEAD 1
Load pattern Hydrostatic_EL344 1
Load pattern Silt 1
Load pattern Tail Water 1
Load pattern Temp_Max 1
Load pattern DEAD 1
Load pattern Hydrostatic_EL340 1
Load pattern Ice Load_EL330 1
Load pattern Silt 1
Load pattern Tail Water 1
Load pattern Temp_Min 1
Load pattern DEAD 1
Load pattern Hydrostatic_EL340 1
Load pattern Silt 1
Load pattern Tail Water 1
Load pattern Temp_Max 1
Load pattern DEAD 1
Load pattern Hydrostatic_EL266 1
Load pattern Silt 1
Load pattern Tail Water 1
Load pattern Temp_Max 1
Load pattern DEAD 1
Load pattern Hydrostatic_EL345 1
Load pattern Silt 1
Load pattern Tail Water 1
Load pattern Temp_Max 1
LC‐3 (EL340)
ULC‐1 (EL340)
LC‐1 (EL330)
LC‐2 (EL330)
LC‐3 (EL330)
ULC‐1 (EL330)
LC‐1 (EL340)
LC‐2 (EL340)

TABLE: Case ‐ Static 1 ‐ Load Assignments
Case LoadType LoadName LoadSF
Text Text Text Unitless
Load pattern DEAD 1
Load pattern Hydrostatic_EL345 1
Load pattern Ice Load_EL330 1
Load pattern Silt 1
Load pattern Tail Water 1
Load pattern Temp_Min 1
Load pattern DEAD 1
Load pattern Hydrostatic_EL345 1
Load pattern Silt 1
Load pattern Tail Water 1
Load pattern Temp_Max 1
Load pattern DEAD 1
Load pattern Hydrostatic_EL266 1
Load pattern Silt 1
Load pattern Tail Water 1
Load pattern Temp_Max 1
Load pattern DEAD 1
Load pattern Hydrostatic_EL350 1
Load pattern Silt 1
Load pattern Tail Water 1
Load pattern Temp_Max 1
Load pattern DEAD 1
Load pattern Hydrostatic_EL350 1
Load pattern Ice Load_EL330 1
Load pattern Silt 1
Load pattern Tail Water 1
Load pattern Temp_Min 1
Load pattern DEAD 1
Load pattern Hydrostatic_EL350 1
Load pattern Silt 1
Load pattern Tail Water 1
Load pattern Temp_Max 1
Load pattern DEAD 1
Load pattern Hydrostatic_EL266 1
Load pattern Silt 1
Load pattern Tail Water 1
Load pattern Temp_Max 1
Load pattern DEAD 1
Load pattern Hydrostatic_EL355 1
Load pattern Silt 1
Load pattern Tail Water 1
Load pattern Temp_Max 1
LC‐1 (EL350)
LC‐2 (EL350)
LC‐3 (EL350)
ULC‐1 (EL350)
LC‐1 (EL345)
LC‐2 (EL345)
LC‐3 (EL345)
ULC‐1 (EL345)

AVERAGE ARCH STRESS COMPARISON

ARCH STRESSES (LC‐1 EL330) FROM SAP2000 MODEL AVERAGE ARCH STRESSES (LC‐1 EL330) FROM SAP2000 MODEL
ELEV STA 1188 1160 1128 1087 1018 1000 962 913 871 840 811 1188 1160 1128 1087 1018 1000 962 913 871 840 811
EL330 U ‐150 ‐190 ‐260 ‐260 ‐340 ‐333 ‐340 ‐260 ‐260 ‐190 ‐150D ‐120 ‐270 ‐300 ‐204 ‐114 ‐87 ‐114 ‐204 ‐300 ‐270 ‐120
EL300 U ‐140 ‐200 ‐300 ‐440 ‐550 ‐565 ‐550 ‐440 ‐300 ‐200 ‐140D ‐120 ‐240 ‐300 ‐330 ‐290 ‐290 ‐290 ‐330 ‐300 ‐240 ‐120
EL270 U ‐130 ‐290 ‐550 ‐690 ‐700 ‐690 ‐550 ‐290 ‐130D ‐220 ‐280 ‐340 ‐370 ‐360 ‐370 ‐340 ‐280 ‐220
EL240 U ‐200 ‐520 ‐740 ‐750 ‐740 ‐520 ‐200D ‐250 ‐250 ‐260 ‐250 ‐260 ‐250 ‐250
EL210 U ‐120 ‐610 ‐700 ‐610 ‐120D ‐90 10 33 10 ‐90
EL180 U ‐360 ‐490 ‐360D 370 402 370
EL170 U ‐410D 402
ARCH STRESSES (LC‐1 EL330) FROM CONSTRUCTION DOCS AVERAGE ARCH STRESSES (LC‐1 EL330) FROM CONSTRUCTION DOCSELEV STA 1188 1160 1128 1087 1018 1000 962 913 871 840 811 1188 1160 1128 1087 1018 1000 962 913 871 840 811
EL330 U ‐125 ‐235 ‐366 ‐309 ‐324 ‐377 ‐324 ‐309 ‐366 ‐235 ‐125D ‐202 ‐161 ‐141 ‐203 ‐132 ‐111 ‐132 ‐203 ‐141 ‐161 ‐202
EL300 U ‐32 ‐190 ‐325 ‐359 ‐437 ‐497 ‐437 ‐359 ‐325 ‐190 ‐32D ‐278 ‐228 ‐197 ‐259 ‐208 ‐136 ‐208 ‐259 ‐197 ‐228 ‐278
EL270 U ‐64 ‐152 ‐259 ‐431 ‐532 ‐431 ‐259 ‐152 ‐64D ‐253 ‐159 ‐184 ‐163 ‐70 ‐163 ‐184 ‐159 ‐253
EL240 U ‐100 ‐124 ‐360 ‐520 ‐360 ‐124 ‐100D ‐190 ‐211 ‐108 ‐25 ‐108 ‐211 ‐190
EL210 U 73 ‐235 ‐393 ‐235 73D ‐214 ‐48 30 ‐48 ‐214
‐234 ‐168 ‐145
‐142 ‐70.5
‐297 ‐222 ‐156 ‐159
‐164
‐323 ‐309 ‐261 ‐209 ‐155
5
‐228 ‐256 ‐254 ‐198
‐500 ‐385 ‐225
‐300 ‐105
‐530 ‐445 ‐285 ‐175
‐420 ‐385 ‐300 ‐220 ‐130
‐227 ‐232 ‐280 ‐230 ‐135
‐428
‐135 ‐230 ‐280 ‐232 ‐227 ‐210
‐130 ‐220 ‐300 ‐385 ‐420
‐4
‐175 ‐285 ‐445 ‐530 ‐530
‐225 ‐385 ‐500 ‐500
‐105 ‐300 ‐334
5 ‐44
‐317
‐164 ‐198 ‐254 ‐256 ‐228 ‐244
‐155 ‐209 ‐261 ‐309 ‐323
‐159 ‐156 ‐222 ‐297 ‐301
‐145 ‐168 ‐234 ‐273
‐70.5 ‐142 ‐182
AVERAGE CANTILEVER STRESS COMPARISON

CANTILEVER STRESSES (LC‐1 EL330) FROM SAP2000 MODEL AVERAGE CANTILEVER STRESSES (LC‐1 EL330) FROM SAP2000 MODEL
ELEV STA 1188 1160 1128 1087 1018 1000 962 913 871 840 811 1188 1160 1128 1087 1018 1000 962 913 871 840 811
EL330 U ‐60 ‐80 ‐65 ‐58 ‐11 ‐9 ‐11 ‐58 ‐65 ‐80 ‐60D 60 70 56 37 ‐22 ‐22 ‐22 37 56 70 60
EL300 U ‐140 ‐170 ‐180 ‐150 ‐120 ‐108 ‐120 ‐150 ‐180 ‐170 ‐140D 110 205 190 100 4 0 4 100 190 205 110
EL270 U ‐160 ‐260 ‐320 ‐310 ‐296 ‐310 ‐320 ‐260 ‐160D 260 290 230 125 113 125 230 290 260
EL240 U ‐160 ‐430 ‐500 ‐500 ‐500 ‐430 ‐160D 315 330 240 225 240 330 315
EL210 U ‐140 ‐505 ‐520 ‐505 ‐140D 315 200 180 200 315
EL180 U ‐207 ‐240 ‐207D 110 90 110
EL170 U ‐140D 104
CANTILEVER STRESSES (LC‐1 EL330) FROM CONSTRUCTION DOCS AVERAGE CANTILEVER STRESSES (LC‐1 EL330) FROM CONSTRUCTION DOCSELEV STA 1188 1160 1128 1087 1018 1000 962 913 871 840 811 1188 1160 1128 1087 1018 1000 962 913 871 840 811
EL330 U ‐3 0 2 7 11 12 11 7 2 0 ‐3D ‐23 ‐26 ‐29 ‐34 ‐38 ‐39 ‐38 ‐34 ‐29 ‐26 ‐23
EL300 U 12 41 17 ‐11 ‐6 2 ‐6 ‐11 17 41 12D ‐89 ‐119 ‐96 ‐71 ‐78 ‐87 ‐78 ‐71 ‐96 ‐119 ‐89
EL270 U 4 ‐3 ‐83 ‐89 ‐84 ‐89 ‐83 ‐3 4D ‐128 ‐120 ‐43 ‐48 ‐57 ‐48 ‐43 ‐120 ‐128
EL240 U ‐33 ‐78 ‐137 ‐143 ‐137 ‐78 ‐33D ‐148 ‐82 ‐37 ‐46 ‐37 ‐82 ‐148
EL210 U ‐8 ‐154 ‐180 ‐154 ‐8D ‐206 ‐52 ‐45 ‐52 ‐206
EL180 U ‐9 0 ‐9D ‐267 0 ‐267
EL170 U ‐58D ‐28
‐138
‐87 ‐80 ‐90.5
‐103 ‐107
‐68.5 ‐63 ‐61.5 ‐62
‐13
‐42 ‐41 ‐39.5 ‐39 ‐38.5
‐48.5
‐13.5 ‐13.5 ‐13.5 ‐13
‐130 ‐50 77.5
‐153 87.5
‐92.5 ‐45 15 50
‐58 ‐25 5 17.5 ‐15
‐16.5 ‐10.5 ‐4.5 ‐5 0
‐54
0 ‐5 ‐4.5 ‐10.5 ‐16.5 ‐15.5
‐15 17.5 5 ‐25 ‐58
‐18
50 15 ‐45 ‐92.5 ‐91.5
77.5 ‐50 ‐130 ‐138
87.5 ‐153 ‐170
‐48.5 ‐75
‐42.5
‐13 ‐13 ‐13.5 ‐13.5 ‐13.5 ‐13.5
‐38.5 ‐39 ‐39.5 ‐41 ‐42
‐43
‐62 ‐61.5 ‐63 ‐68.5 ‐70.5
‐90.5 ‐80 ‐87 ‐94.5
‐107 ‐103 ‐113
‐138 0

AVERAGE ARCH STRESS CONTOUR

SAP2000
SAP2000 v15.1.0 - File:Double Curvature Pinned Dam - Swan Lake - S11 Contours (LC-1 (EL330)) - lb, in, F Units
2/16/12 10:13:30
-800. -700. -600. -500. -400. -300. -200. -100. 0. 100. 200. 300. 400. 500.

SAP2000
SAP2000 v15.1.0 - File:Double Curvature Pinned Dam - Swan Lake - S11 Contours (LC-1 (EL340)) - lb, in, F Units
2/16/12 10:18:37
-880. -770. -660. -550. -440. -330. -220. -110. 0. 110. 220. 330. 440. 550.

SAP2000
SAP2000 v15.1.0 - File:Double Curvature Pinned Dam - Swan Lake - S11 Contours (LC-1 (EL345)) - lb, in, F Units
2/16/12 10:20:13
-960. -840. -720. -600. -480. -360. -240. -120. 0. 120. 240. 360. 480. 600.

SAP2000
SAP2000 v15.1.0 - File:Double Curvature Pinned Dam - Swan Lake - S11 Contours (LC-1 (EL350)) - lb, in, F Units
2/16/12 10:21:01
-1.04 -0.91 -0.78 -0.65 -0.52 -0.39 -0.26 -0.13 0.00 0.13 0.26 0.39 0.52 0.65 E+3

AVERAGE CANTILEVER STRESS CONTOUR
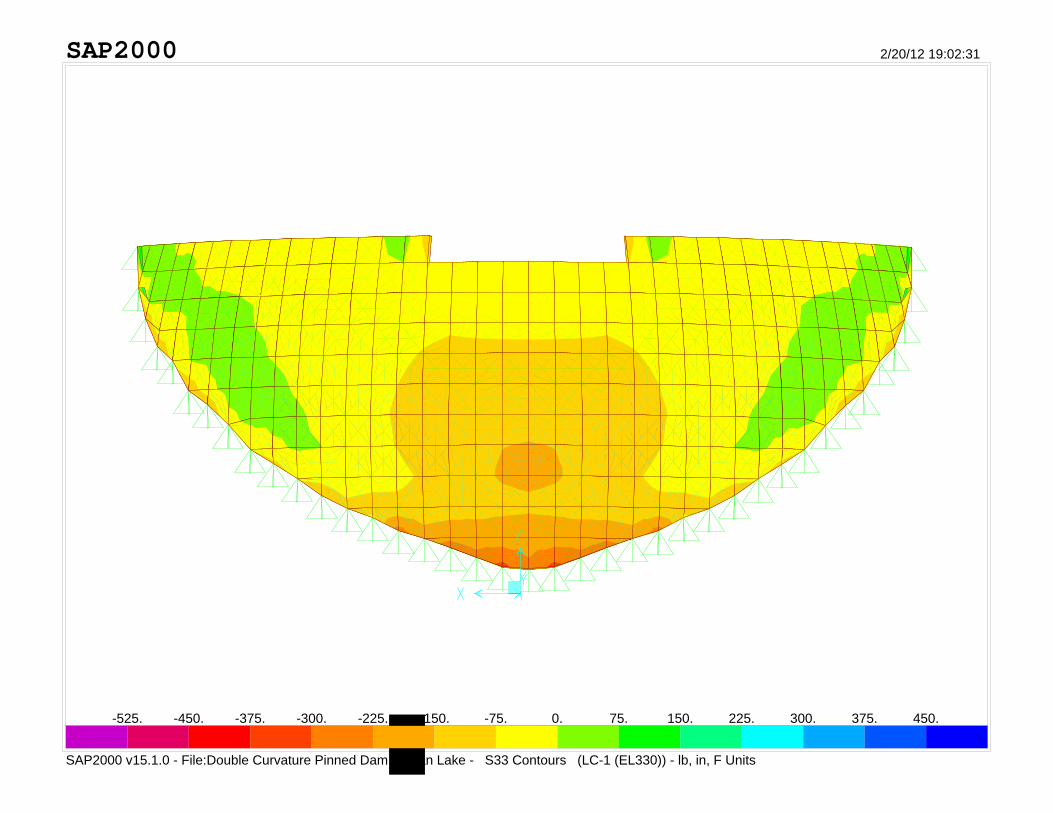
SAP2000
SAP2000 v15.1.0 - File:Double Curvature Pinned Dam - Swan Lake - S33 Contours (LC-1 (EL330)) - lb, in, F Units
2/20/12 19:02:31
-525. -450. -375. -300. -225. -150. -75. 0. 75. 150. 225. 300. 375. 450.

SAP2000
SAP2000 v15.1.0 - File:Double Curvature Pinned Dam - Swan Lake - S33 Contours (LC-1 (EL340)) - lb, in, F Units
2/20/12 19:03:15
-525. -450. -375. -300. -225. -150. -75. 0. 75. 150. 225. 300. 375. 450.

SAP2000
SAP2000 v15.1.0 - File:Double Curvature Pinned Dam - Swan Lake - S33 Contours (LC-1 (EL345)) - lb, in, F Units
2/20/12 19:03:56
-560. -480. -400. -320. -240. -160. -80. 0. 80. 160. 240. 320. 400. 480.

SAP2000
SAP2000 v15.1.0 - File:Double Curvature Pinned Dam - Swan Lake - S33 Contours (LC-1 (EL350)) - lb, in, F Units
2/20/12 19:04:29
-560. -480. -400. -320. -240. -160. -80. 0. 80. 160. 240. 320. 400. 480.

Southeast Alaska Power Agency Swan Lake Hydroelectric Project
Feasibility Study – Final Report June 13, 2012
APPENDIX C
VENDOR DATA

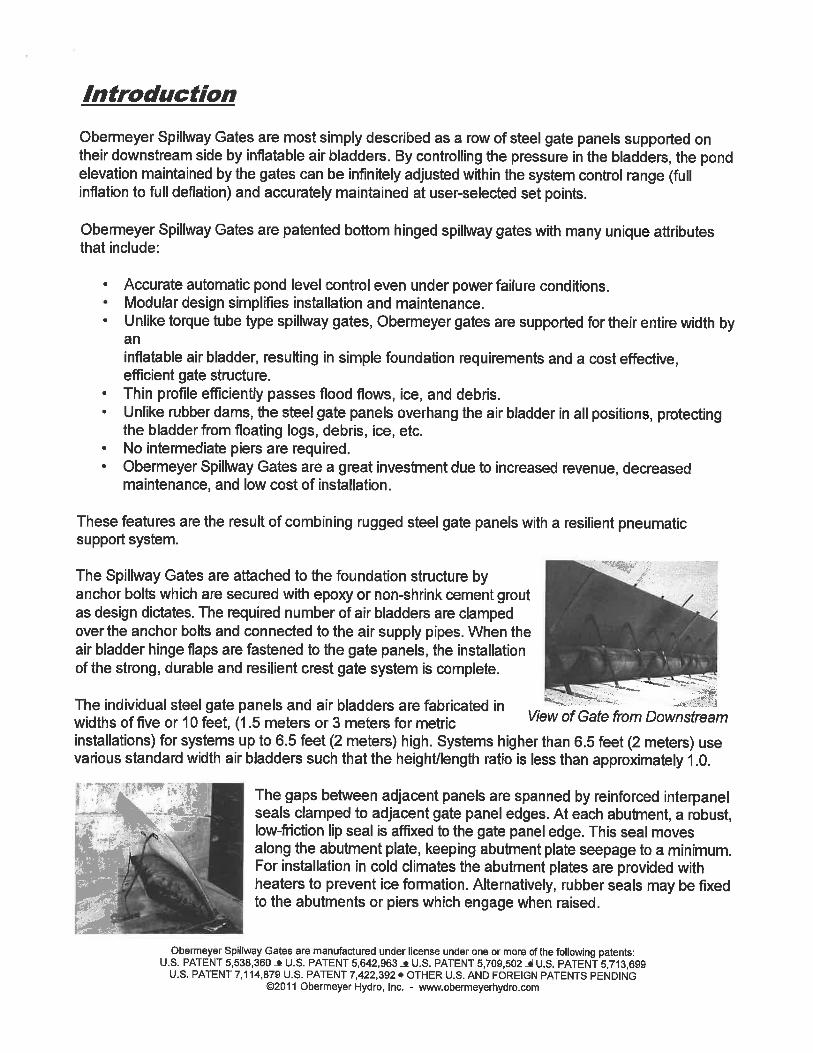


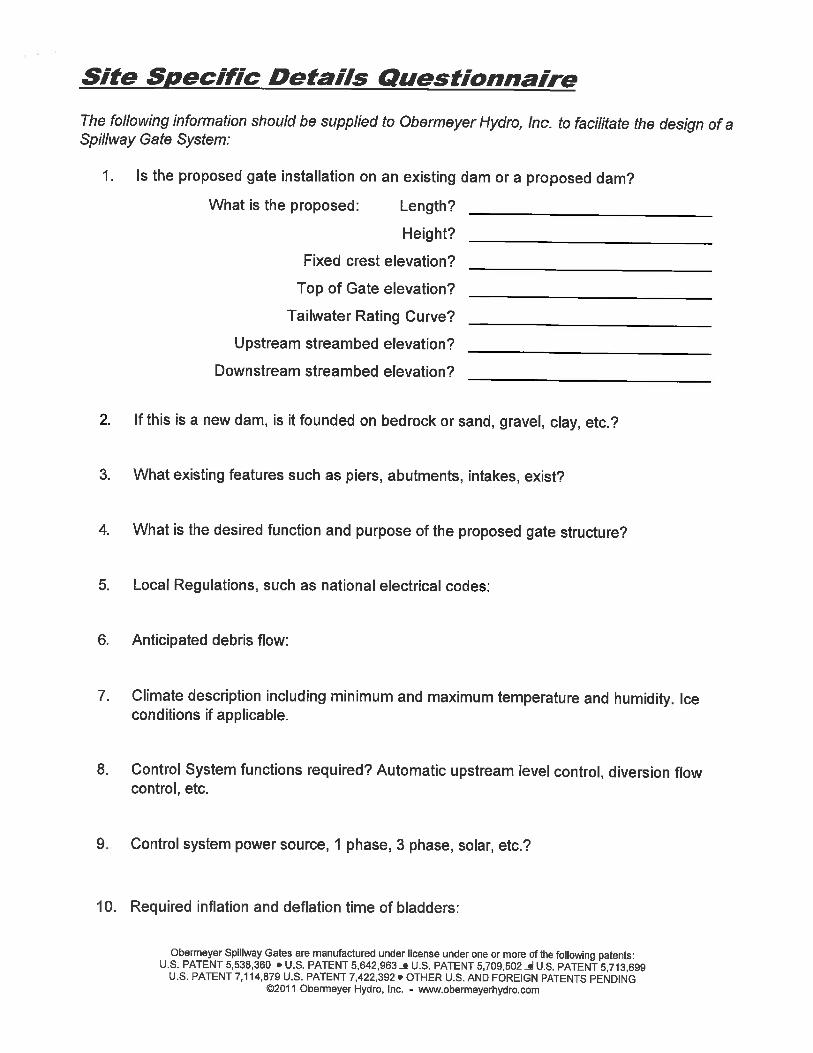


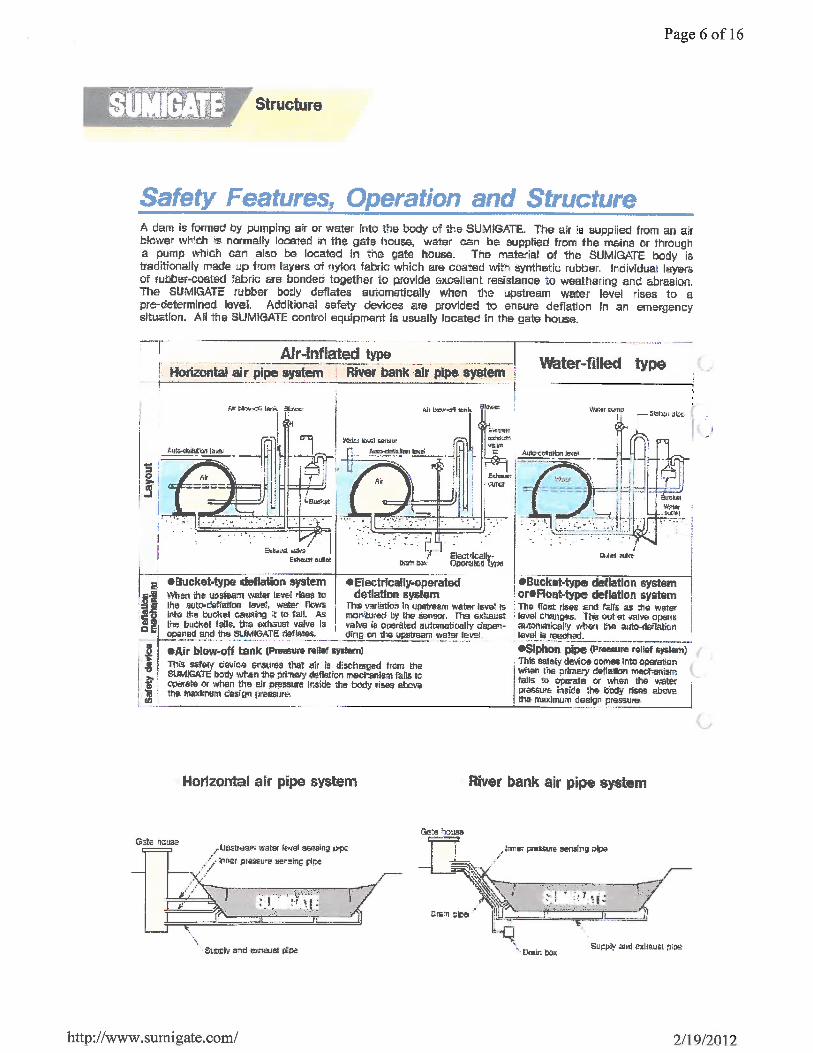
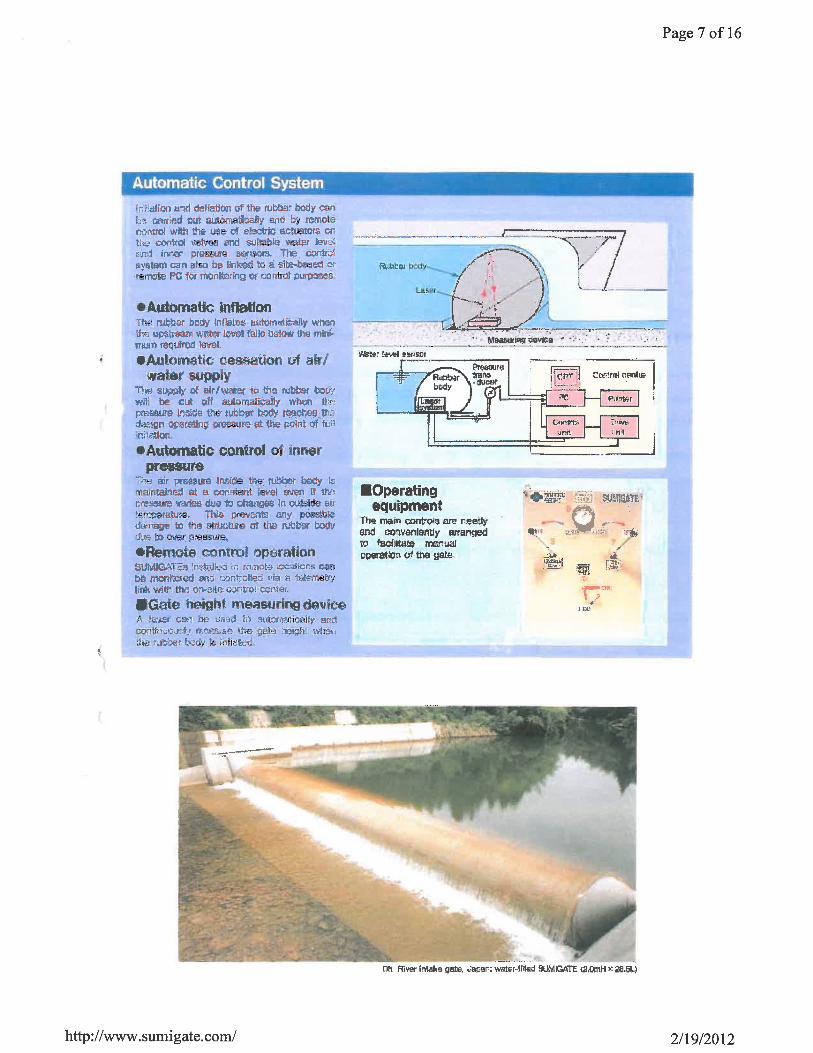
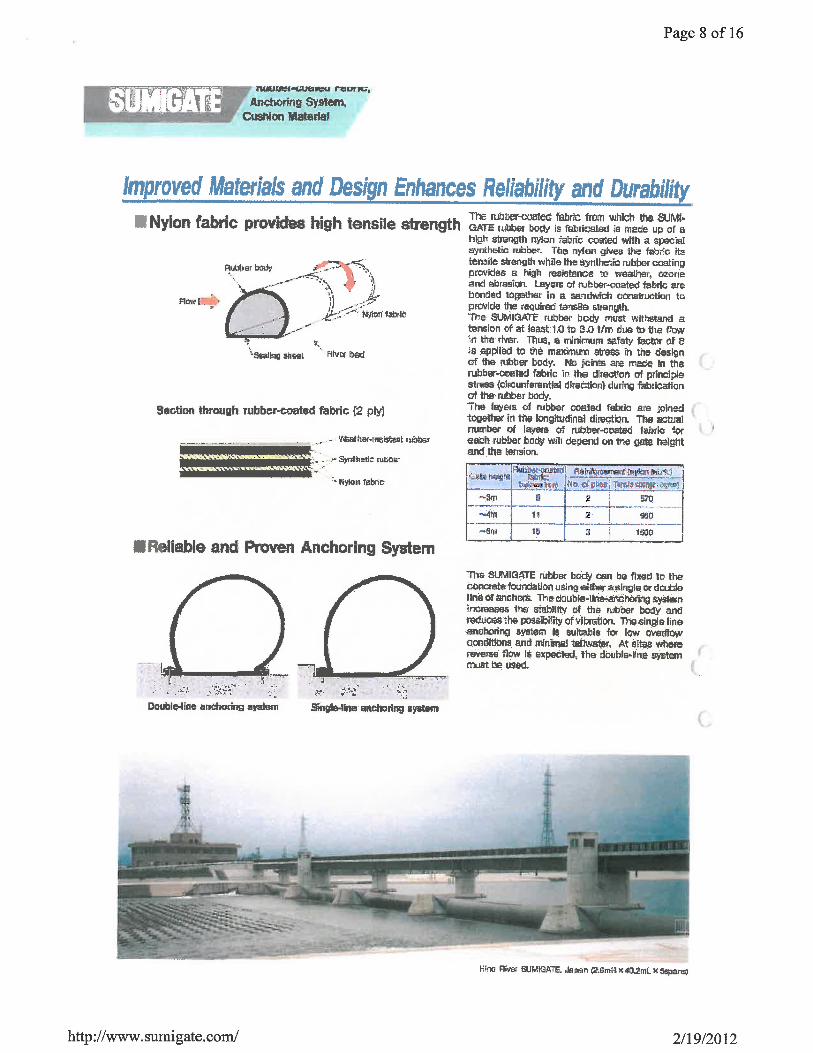
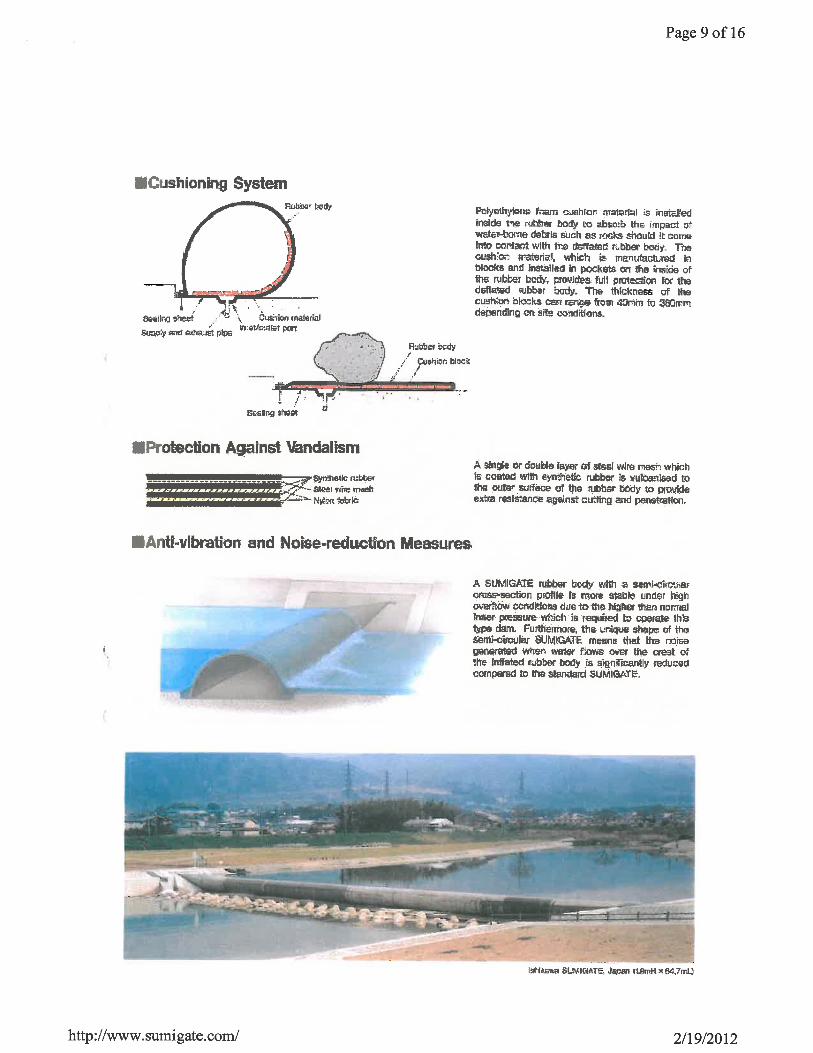


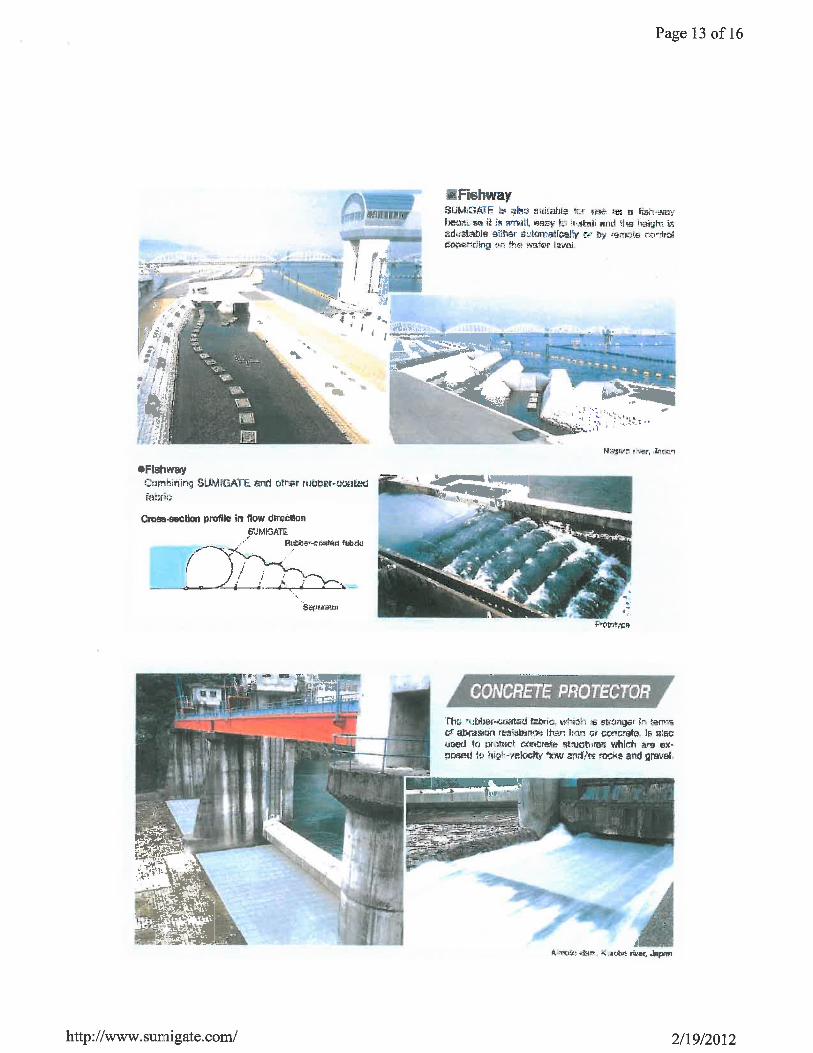


Southeast Alaska Power Agency Swan Lake Hydroelectric Project
Feasibility Study – Final Report June 13, 2012
APPENDIX D
COST ESTIMATES

Southeast Alaska Power Agency
Swan Lake Hydroelectric Project
Lake Raise Feasibility Study
Cost Estimate
Prepared For: Southeast Alaska Power Agency
Prepared By: McMillen, LLC
June 13, 2012

COMPARISON TABLE

10' Lake Raise 15' Lake Raise 20' Lake Raise
Construction Cost 4,124,105$ 7,260,369$ 11,343,223$
Design Contingency (10%) 412,410$ 726,037$ 1,134,322$
Construction Cost Subtotal 4,536,515$ 7,986,406$ 12,477,545$
Field Change Order Contingency (5%) 206,205$ 363,018$ 567,161$
Escalation (3.5%) 7,217$ 12,706$ 19,851$
Total Construction Cost 4,749,938$ 8,362,130$ 13,064,557$
Planning, Engineering, and Design (10%) 453,652$ 798,641$ 1,247,755$
Engineering Services During Construction (5%) 226,826$ 399,320$ 623,877$
Construction S&A (8%) 379,995$ 668,970$ 1,045,165$
Total Capital Cost 5,810,410$ 10,229,061$ 15,981,353$
Lake Raise Options

MARK UP TABLE

Estimate Low (-30%) High (+30%)Construction Cost 4,124,105$ 2,886,873$ 5,361,336$
Design Contingency (10%) 412,410$ 288,687$ 536,134$
Construction Cost Subtotal 4,536,515$ 3,175,561$ 5,897,470$
Field Change Order Contingency (5%) 206,205$ 144,344$ 268,067$
Escalation (3.5%) 7,217$ 5,052$ 9,382$
Total Construction Cost 4,749,938$ 3,324,956$ 6,174,919$
Planning, Engineering, and Design (10%) 453,652$ 317,556$ 589,747$
Engineering Services During Construction (5%) 226,826$ 158,778$ 294,873$
Construction S&A (8%) 379,995$ 265,997$ 493,994$
Total Capital Cost 5,810,410$ 4,067,287$ 7,553,533$
10' Lake Raise
Accuracy Range
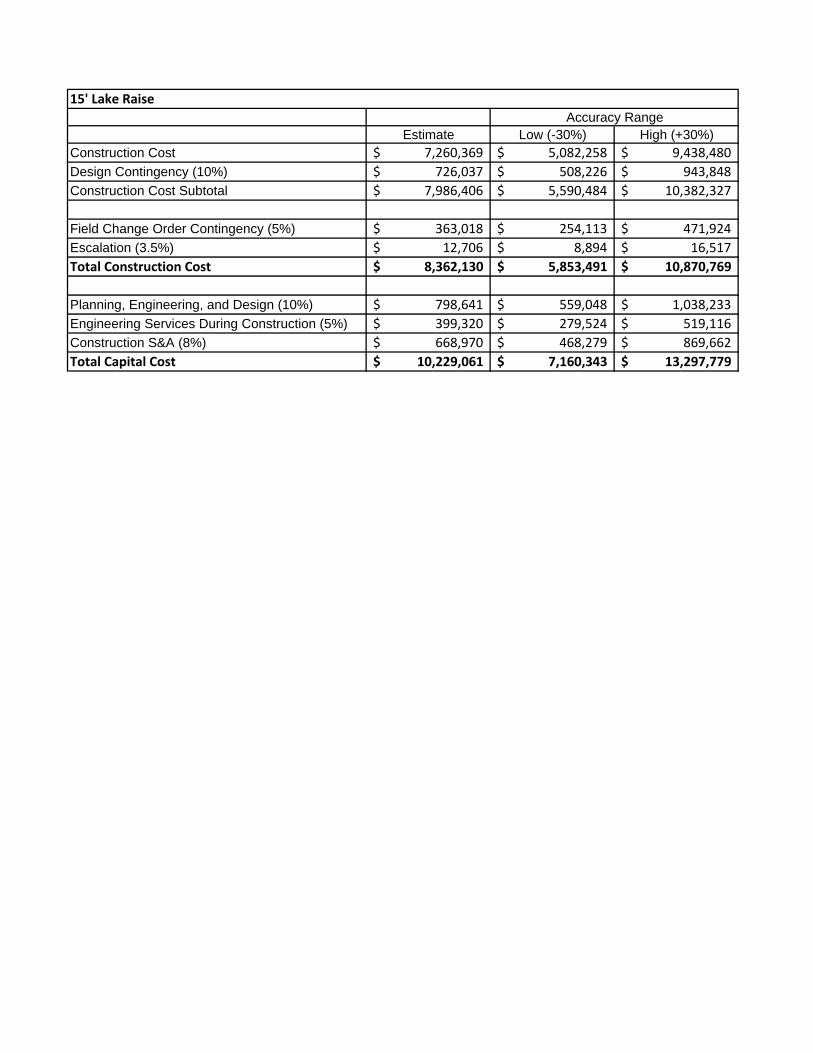
Estimate Low (-30%) High (+30%)Construction Cost 7,260,369$ 5,082,258$ 9,438,480$
Design Contingency (10%) 726,037$ 508,226$ 943,848$
Construction Cost Subtotal 7,986,406$ 5,590,484$ 10,382,327$
Field Change Order Contingency (5%) 363,018$ 254,113$ 471,924$
Escalation (3.5%) 12,706$ 8,894$ 16,517$
Total Construction Cost 8,362,130$ 5,853,491$ 10,870,769$
Planning, Engineering, and Design (10%) 798,641$ 559,048$ 1,038,233$
Engineering Services During Construction (5%) 399,320$ 279,524$ 519,116$
Construction S&A (8%) 668,970$ 468,279$ 869,662$
Total Capital Cost 10,229,061$ 7,160,343$ 13,297,779$
15' Lake Raise
Accuracy Range

Estimate Low (-30%) High (+30%)Construction Cost 11,343,223$ 7,940,256$ 14,746,190$
Design Contingency (10%) 1,134,322$ 794,026$ 1,474,619$
Construction Cost Subtotal 12,477,545$ 8,734,282$ 16,220,809$
Field Change Order Contingency (5%) 567,161$ 397,013$ 737,309$
Escalation (3.5%) 19,851$ 13,895$ 25,806$
Total Construction Cost 13,064,557$ 9,145,190$ 16,983,924$
Planning, Engineering, and Design (10%) 1,247,755$ 873,428$ 1,622,081$
Engineering Services During Construction (5%) 623,877$ 436,714$ 811,040$
Construction S&A (8%) 1,045,165$ 731,615$ 1,358,714$
Total Capital Cost 15,981,353$ 11,186,947$ 20,775,759$
20' Lake Raise
Accuracy Range

COST BREAKDOWN TABLES
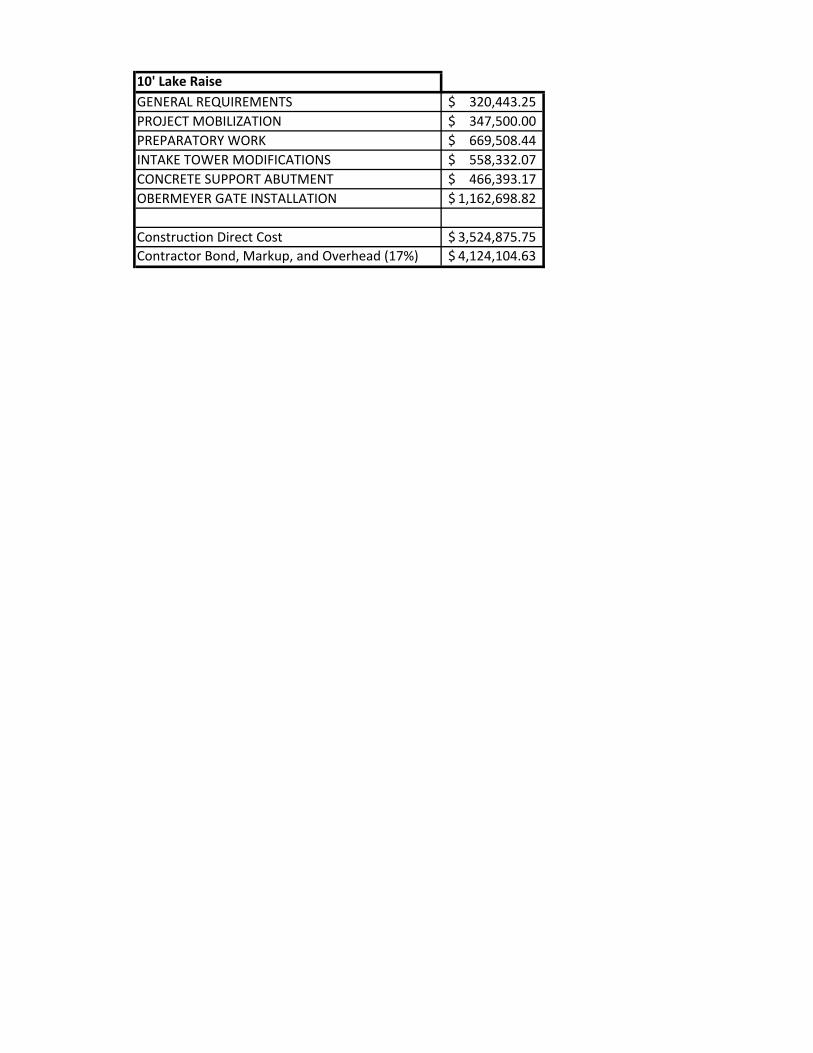
10' Lake Raise
GENERAL REQUIREMENTS 320,443.25$
PROJECT MOBILIZATION 347,500.00$
PREPARATORY WORK 669,508.44$
INTAKE TOWER MODIFICATIONS 558,332.07$
CONCRETE SUPPORT ABUTMENT 466,393.17$
OBERMEYER GATE INSTALLATION 1,162,698.82$
Construction Direct Cost 3,524,875.75$
Contractor Bond, Markup, and Overhead (17%) 4,124,104.63$

15' Lake Raise
GENERAL REQUIREMENTS 564,131.23$
PROJECT MOBILIZATION 537,500.00$
PREPARATORY WORK 1,036,890.12$
INTAKE TOWER MODIFICATIONS 716,663.46$
CONCRETE SUPPORT ABUTMENT 466,393.17$
CONCRETE CREST RAISE 535,666.14$
TIE TO RIGHT ABUTMENT 479,286.55$
REGRADE ROADWAY 397,224.00$
OBERMEYER GATE INSTALLATION 1,471,688.82$
Construction Direct Cost 6,205,443.49$
Contractor Bond, Markup, and Overhead (17%) 7,260,368.88$

20' Lake Raise
GENERAL REQUIREMENTS 881,369.31$
PROJECT MOBILIZATION 537,500.00$
PREPARATORY WORK 1,516,894.39$
INTAKER TOWER MODIFICATION 883,493.11$
EXISTING SPILLWAY DEMOLITION 184,941.20$
CONCRETE SPILLWAY RAISE 588,466.28$
CONCRETE SUPPORT ABUTMENT 466,393.17$
CONCRETE CREST RAISE 1,167,967.37$
TIE TO RIGHT ABUTMENT 1,118,334.71$
REGRADE ROADWAY 878,014.01$
OBERMEYER GATE INSTALLATION ‐ ALT 1 1,471,688.82$
Construction Direct Cost 9,695,062.37$
Contractor Bond, Markup, and Overhead (17%) 11,343,222.97$

COST SUMMARY REPORT

McMillen, LLC Page 12012-12 Swan Lake Project - Dam and Power Plant 02/21/2012 9:37Curtis Neibaur Cost Report Activity Desc Quantity Unit Perm Constr Equip Sub-
Resource Pcs Unit Cost Labor Material Matl/Exp Ment Contract Total BID ITEM = 100 Description = GENERAL REQUIREMENTS Unit = LS Takeoff Quan: 1.000 Engr Quan: 1.000
000000 General Conditions Quan: 1.00 LS Hrs/Shft: 8.00 Cal: 508 WC: NONE
4GENERAL General Requirements 1.00 LS 0.000 PARENT ITEM = 1000 Description = PROJECT MOBILIZATION Unit = LS Takeoff Quan: 1.000 Engr Quan: 1.000
Listing of Sub-Biditems of Parent Item 1000: BID ITEM = 1100 Description = PROJECT MOBILIZATION - 10' LAKE RAISE Unit = LS Takeoff Quan: 1.000 Engr Quan: 0.000
011330 Batch Plant Mobilization Quan: 1.00 EA Hrs/Shft: 8.00 Cal: 508 WC: NONE
5BARGETRANS Barge Transport to Swan La 1.00 EA 20,000.000 20,000 20,000 011340 Line Pump Mobilization Quan: 2.00 EA Hrs/Shft: 8.00 Cal: 508 WC: NONE
5BARGETRANS Barge Transport to Swan La 2.00 EA 7,500.000 15,000 15,000 011350 Concrete Truck Mobilization Quan: 4.00 EA Hrs/Shft: 8.00 Cal: 508 WC: NONE
5BARGETRANS Barge Transport to Swan La 4.00 EA 7,500.000 30,000 30,000 011360 Wheel Loader Mobilization Quan: 2.00 EA Hrs/Shft: 8.00 Cal: 508 WC: NONE
5BARGETRANS Barge Transport to Swan La 2.00 EA 7,500.000 15,000 15,000 011370 Crew Mobilization Quan: 1.00 LS Hrs/Shft: 8.00 Cal: 508 WC: NONE
5CREWMOBE Crew Mobilization 15.00 EA 2,000.000 30,000 30,000 011380 Man Camp Mobilization Quan: 1.00 LS Hrs/Shft: 8.00 Cal: 508 WC: NONE
5BARGETRANS Barge Transport to Swan La 1.00 LS 30,000.000 30,000 30,000 011385 Rebar Mobilization Quan: 1.00 LS Hrs/Shft: 8.00 Cal: 508 WC: NONE
5BARGETRANS Barge Transport to Swan La 1.00 LS 40,000.000 40,000 40,000 011395 Aggregate/Fly Ash/Cement Mobilization Quan: 1.00 LS Hrs/Shft: 8.00 Cal: 508 WC: NONE
5BARGETRANS Barge Transport to Swan La 1.00 LS 40,000.000 40,000 40,000 011405 Flexi-Float Barge Mobilization Quan: 6.00 EA Hrs/Shft: 8.00 Cal: 508 WC: NONE
5BARGETRANS Barge Transport to Swan La 6.00 EA 7,500.000 45,000 45,000 011415 Work Boat Mobilization Quan: 1.00 EA Hrs/Shft: 8.00 Cal: 508 WC: NONE
5BARGETRANS Barge Transport to Swan La 1.00 EA 7,500.000 7,500 7,500 011425 65-Ton RT Crane Mobilization Quan: 1.00 EA Hrs/Shft: 8.00 Cal: 508 WC: NONE
5BARGETRANS Barge Transport to Swan La 1.00 LS 25,000.000 25,000 25,000

McMillen, LLC Page 22012-12 Swan Lake Project - Dam and Power Plant 02/21/2012 9:37Curtis Neibaur Cost Report Activity Desc Quantity Unit Perm Constr Equip Sub-
Resource Pcs Unit Cost Labor Material Matl/Exp Ment Contract Total BID ITEM = 1100 Description = PROJECT MOBILIZATION - 10' LAKE RAISE Unit = LS Takeoff Quan: 1.000 Engr Quan: 0.000
011435 Gradall Forklift Mobilization Quan: 1.00 EA Hrs/Shft: 8.00 Cal: 508 WC: NONE
5BARGETRANS Barge Transport to Swan La 1.00 EA 10,000.000 10,000 10,000 011445 Flatbed Truck and Trailer Mobilization Quan: 1.00 EA Hrs/Shft: 8.00 Cal: 508 WC: NONE
5BARGETRANS Barge Transport to Swan La 1.00 EA 15,000.000 15,000 15,000 011455 Obermeyer Gate Mobilization Quan: 1.00 LS Hrs/Shft: 8.00 Cal: 508 WC: NONE
5BARGETRANS Barge Transport to Swan La 1.00 LS 25,000.000 25,000 25,000 =====> Item Totals: 1100 - PROJECT MOBILIZATION - 10' LAKE RAISE$347,500.00 [ ] 347,500 347,500347,500.000 1 LS 347,500.00 347,500.00 BID ITEM = 1200 Description = PROJECT MOBILIZATION - 15' LAKE RAISE Unit = LS Takeoff Quan: 1.000 Engr Quan: 0.000
011330 Batch Plant Mobilization Quan: 1.00 EA Hrs/Shft: 8.00 Cal: 508 WC: NONE
5BARGETRANS Barge Transport to Swan La 1.00 EA 40,000.000 40,000 40,000 011340 Line Pump Mobilization Quan: 2.00 EA Hrs/Shft: 8.00 Cal: 508 WC: NONE
5BARGETRANS Barge Transport to Swan La 2.00 EA 15,000.000 30,000 30,000 011350 Concrete Truck Mobilization Quan: 4.00 EA Hrs/Shft: 8.00 Cal: 508 WC: NONE
5BARGETRANS Barge Transport to Swan La 4.00 EA 10,000.000 40,000 40,000 011360 Wheel Loader Mobilization Quan: 2.00 EA Hrs/Shft: 8.00 Cal: 508 WC: NONE
5BARGETRANS Barge Transport to Swan La 2.00 EA 10,000.000 20,000 20,000 011370 Crew Mobilization Quan: 1.00 LS Hrs/Shft: 8.00 Cal: 508 WC: NONE
5CREWMOBE Crew Mobilization 20.00 EA 4,000.000 80,000 80,000 011380 Man Camp Mobilization Quan: 1.00 LS Hrs/Shft: 8.00 Cal: 508 WC: NONE
5BARGETRANS Barge Transport to Swan La 1.00 LS 25,000.000 25,000 25,000 011385 Rebar Mobilization Quan: 1.00 LS Hrs/Shft: 8.00 Cal: 508 WC: NONE
5BARGETRANS Barge Transport to Swan La 1.00 LS 50,000.000 50,000 50,000 011395 Aggregate/Fly Ash/Cement Mobilization Quan: 1.00 LS Hrs/Shft: 8.00 Cal: 508 WC: NONE
5BARGETRANS Barge Transport to Swan La 1.00 LS 100,000.000 100,000 100,000 011405 Flexi-Float Barge Mobilization Quan: 6.00 EA Hrs/Shft: 8.00 Cal: 508 WC: NONE
5BARGETRANS Barge Transport to Swan La 6.00 EA 10,000.000 60,000 60,000
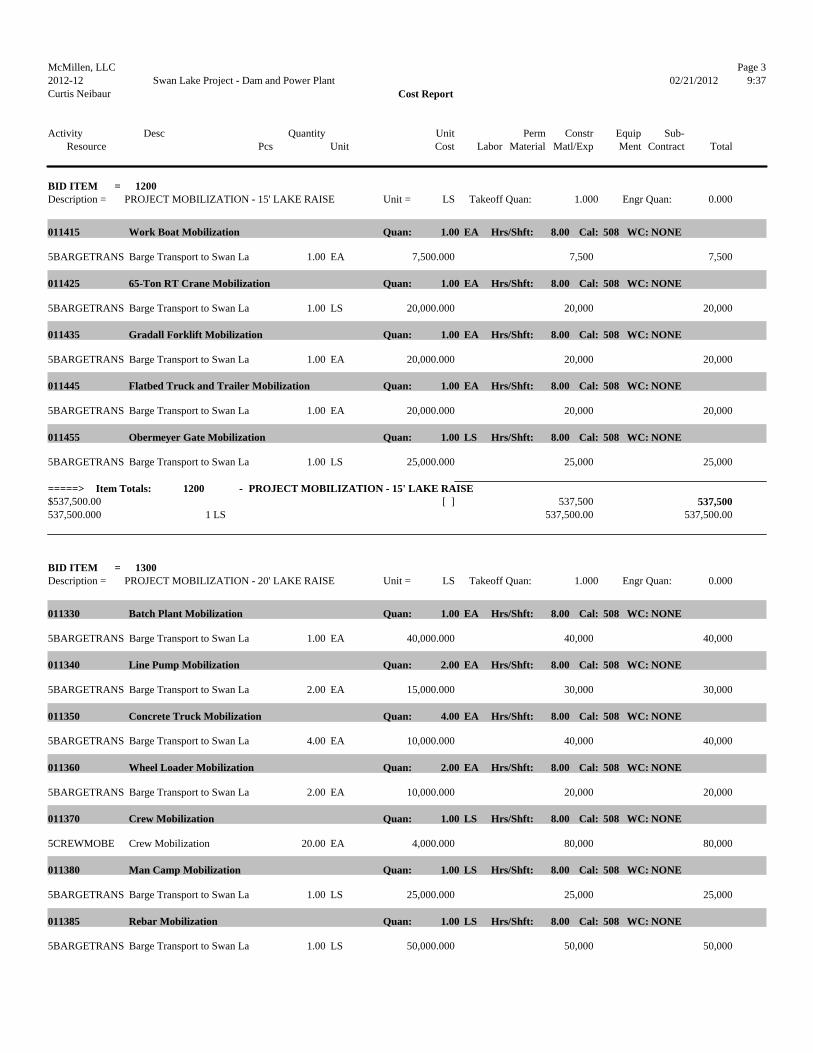
McMillen, LLC Page 32012-12 Swan Lake Project - Dam and Power Plant 02/21/2012 9:37Curtis Neibaur Cost Report Activity Desc Quantity Unit Perm Constr Equip Sub-
Resource Pcs Unit Cost Labor Material Matl/Exp Ment Contract Total BID ITEM = 1200 Description = PROJECT MOBILIZATION - 15' LAKE RAISE Unit = LS Takeoff Quan: 1.000 Engr Quan: 0.000
011415 Work Boat Mobilization Quan: 1.00 EA Hrs/Shft: 8.00 Cal: 508 WC: NONE
5BARGETRANS Barge Transport to Swan La 1.00 EA 7,500.000 7,500 7,500 011425 65-Ton RT Crane Mobilization Quan: 1.00 EA Hrs/Shft: 8.00 Cal: 508 WC: NONE
5BARGETRANS Barge Transport to Swan La 1.00 LS 20,000.000 20,000 20,000 011435 Gradall Forklift Mobilization Quan: 1.00 EA Hrs/Shft: 8.00 Cal: 508 WC: NONE
5BARGETRANS Barge Transport to Swan La 1.00 EA 20,000.000 20,000 20,000 011445 Flatbed Truck and Trailer Mobilization Quan: 1.00 EA Hrs/Shft: 8.00 Cal: 508 WC: NONE
5BARGETRANS Barge Transport to Swan La 1.00 EA 20,000.000 20,000 20,000 011455 Obermeyer Gate Mobilization Quan: 1.00 LS Hrs/Shft: 8.00 Cal: 508 WC: NONE
5BARGETRANS Barge Transport to Swan La 1.00 LS 25,000.000 25,000 25,000 =====> Item Totals: 1200 - PROJECT MOBILIZATION - 15' LAKE RAISE$537,500.00 [ ] 537,500 537,500537,500.000 1 LS 537,500.00 537,500.00 BID ITEM = 1300 Description = PROJECT MOBILIZATION - 20' LAKE RAISE Unit = LS Takeoff Quan: 1.000 Engr Quan: 0.000
011330 Batch Plant Mobilization Quan: 1.00 EA Hrs/Shft: 8.00 Cal: 508 WC: NONE
5BARGETRANS Barge Transport to Swan La 1.00 EA 40,000.000 40,000 40,000 011340 Line Pump Mobilization Quan: 2.00 EA Hrs/Shft: 8.00 Cal: 508 WC: NONE
5BARGETRANS Barge Transport to Swan La 2.00 EA 15,000.000 30,000 30,000 011350 Concrete Truck Mobilization Quan: 4.00 EA Hrs/Shft: 8.00 Cal: 508 WC: NONE
5BARGETRANS Barge Transport to Swan La 4.00 EA 10,000.000 40,000 40,000 011360 Wheel Loader Mobilization Quan: 2.00 EA Hrs/Shft: 8.00 Cal: 508 WC: NONE
5BARGETRANS Barge Transport to Swan La 2.00 EA 10,000.000 20,000 20,000 011370 Crew Mobilization Quan: 1.00 LS Hrs/Shft: 8.00 Cal: 508 WC: NONE
5CREWMOBE Crew Mobilization 20.00 EA 4,000.000 80,000 80,000 011380 Man Camp Mobilization Quan: 1.00 LS Hrs/Shft: 8.00 Cal: 508 WC: NONE
5BARGETRANS Barge Transport to Swan La 1.00 LS 25,000.000 25,000 25,000 011385 Rebar Mobilization Quan: 1.00 LS Hrs/Shft: 8.00 Cal: 508 WC: NONE
5BARGETRANS Barge Transport to Swan La 1.00 LS 50,000.000 50,000 50,000

McMillen, LLC Page 42012-12 Swan Lake Project - Dam and Power Plant 02/21/2012 9:37Curtis Neibaur Cost Report Activity Desc Quantity Unit Perm Constr Equip Sub-
Resource Pcs Unit Cost Labor Material Matl/Exp Ment Contract Total BID ITEM = 1300 Description = PROJECT MOBILIZATION - 20' LAKE RAISE Unit = LS Takeoff Quan: 1.000 Engr Quan: 0.000
011395 Aggregate/Fly Ash/Cement Mobilization Quan: 1.00 LS Hrs/Shft: 8.00 Cal: 508 WC: NONE
5BARGETRANS Barge Transport to Swan La 1.00 LS 100,000.000 100,000 100,000 011405 Flexi-Float Barge Mobilization Quan: 6.00 EA Hrs/Shft: 8.00 Cal: 508 WC: NONE
5BARGETRANS Barge Transport to Swan La 6.00 EA 10,000.000 60,000 60,000 011415 Work Boat Mobilization Quan: 1.00 EA Hrs/Shft: 8.00 Cal: 508 WC: NONE
5BARGETRANS Barge Transport to Swan La 1.00 EA 7,500.000 7,500 7,500 011425 65-Ton RT Crane Mobilization Quan: 1.00 EA Hrs/Shft: 8.00 Cal: 508 WC: NONE
5BARGETRANS Barge Transport to Swan La 1.00 LS 20,000.000 20,000 20,000 011435 Gradall Forklift Mobilization Quan: 1.00 EA Hrs/Shft: 8.00 Cal: 508 WC: NONE
5BARGETRANS Barge Transport to Swan La 1.00 EA 20,000.000 20,000 20,000 011445 Flatbed Truck and Trailer Mobilization Quan: 1.00 EA Hrs/Shft: 8.00 Cal: 508 WC: NONE
5BARGETRANS Barge Transport to Swan La 1.00 EA 20,000.000 20,000 20,000 011455 Obermeyer Gate Mobilization Quan: 1.00 LS Hrs/Shft: 8.00 Cal: 508 WC: NONE
5BARGETRANS Barge Transport to Swan La 1.00 LS 25,000.000 25,000 25,000 =====> Item Totals: 1300 - PROJECT MOBILIZATION - 20' LAKE RAISE$537,500.00 [ ] 537,500 537,500537,500.000 1 LS 537,500.00 537,500.00
Total of Above Sub-Biditems =====> Item Totals: 1000 - PROJECT MOBILIZATION$1,422,500.00 [ ] 1,422,500 1,422,5001,422,500.000 1 LS 1,422,500.00 1,422,500.00 PARENT ITEM = 2000 Description = PREPARATORY WORK Unit = LS Takeoff Quan: 1.000 Engr Quan: 1.000
Listing of Sub-Biditems of Parent Item 2000: BID ITEM = 2100 Description = PREPARATORY WORK - 10' LAKE RAISE Unit = LS Takeoff Quan: 1.000 Engr Quan: 0.000
010020 Setup Mancamp Quan: 1.00 LS Hrs/Shft: 8.00 Cal: 508 WC: NONE
LABG GENERAL LABOR CREW 40.00 CH Prod: 0.0000 Lab Pcs: 5.00 Eqp Pcs: 2.008FL12000 Forklift-12000 lb 1.00 40.00 HR 49.100 1,964 1,9648LO624 MCM JD624 - 4 YD Bucke 1.00 40.00 HR 69.860 2,794 2,794

McMillen, LLC Page 52012-12 Swan Lake Project - Dam and Power Plant 02/21/2012 9:37Curtis Neibaur Cost Report Activity Desc Quantity Unit Perm Constr Equip Sub-
Resource Pcs Unit Cost Labor Material Matl/Exp Ment Contract Total BID ITEM = 2100 Description = PREPARATORY WORK - 10' LAKE RAISE Unit = LS Takeoff Quan: 1.000 Engr Quan: 0.000
LABRA Laborer General 5.00 200.00 MH 68.014 13,603 13,603$18,361.34 200.0000 MH/LS 200.00 MH [ 10004 ] 13,603 4,758 18,361 030010 Operate Batchplant Quan: 1.00 LS Hrs/Shft: 8.00 Cal: 508 WC: NONE
BATCH Operate Batchplant 150.00 CH Prod: 0.0000 Lab Pcs: 3.00 Eqp Pcs: 1.002BATCHPLANT Batch Plant - Pur@106% 1.00 LS 159,000.000 159,000 159,0008LO624 MCM JD624 - 4 YD Bucke 1.00 150.00 HR 69.860 10,479 10,479CEBAT Batchplant Operator 1.00 150.00 MH 68.729 10,309 10,309LABRA Laborer General 1.00 150.00 MH 68.014 10,202 10,202OPLO Operator Loader 1.00 150.00 MH 68.449 10,267 10,267$200,257.99 450.0000 MH/LS 450.00 MH [ 24316.5 ] 30,779 159,000 10,479 200,258 010100 Setup Batchplant Quan: 1.00 LS Hrs/Shft: 8.00 Cal: 508 WC: NONE
LABG GENERAL LABOR CREW 40.00 CH Prod: 0.0000 Lab Pcs: 10.00 Eqp Pcs: 2.008FL12000 Forklift-12000 lb 1.00 40.00 HR 49.100 1,964 1,9648LO624 MCM JD624 - 4 YD Bucke 1.00 40.00 HR 69.860 2,794 2,794LABRA Laborer General 10.00 400.00 MH 68.014 27,206 27,206$31,964.28 400.0000 MH/LS 400.00 MH [ 20008 ] 27,206 4,758 31,964 010110 Site/Road Improvements Quan: 1.00 LS Hrs/Shft: 8.00 Cal: 508 WC: NONE
EX350 JD 350D EXCAVATOR CREW 16.00 CH Prod: 0.0000 Lab Pcs: 2.00 Eqp Pcs: 1.008LO624 MCM JD624 - 4 YD Bucke 1.00 16.00 HR 69.860 1,118 1,118LABRG Laborer Gradechecker 1.00 16.00 MH 68.015 1,088 1,088OPLO Operator Loader 1.00 16.00 MH 68.449 1,095 1,095$3,301.19 32.0000 MH/LS 32.00 MH [ 1703.2 ] 2,183 1,118 3,301 010150 Setup Floating Plant Quan: 1.00 LS Hrs/Shft: 8.00 Cal: 508 WC: NONE
LABG GENERAL LABOR CREW 24.00 CH Prod: 0.0000 Lab Pcs: 4.00 Eqp Pcs: 1.008CRLBRT65 Link Belt Rough Terrai 1.00 24.00 HR 73.000 1,752 1,752IWPILE Piledriver/Pilebuck 3.00 72.00 MH 65.703 4,731 4,731OPCRANE Operator Crane 1.00 24.00 MH 76.834 1,844 1,844$8,326.70 96.0000 MH/LS 96.00 MH [ 5300.4 ] 6,575 1,752 8,327 010140 Setup Upstream Dam Work Platform Quan: 1.00 LS Hrs/Shft: 8.00 Cal: 508 WC: NONE
FLEX Flexifloat Barge Crew 55.00 CH Prod: 0.0000 Lab Pcs: 5.00 Eqp Pcs: 7.003PLATFORM Working Platform@106% 440.00 LF 103.350 45,474 45,4748MIBOAT MCM 16' Boat W/Trailer 1.00 55.00 HR 56.000 3,080 3,0808MIFLEX Flexi-Float Barge 40'x 6.00 330.00 HR 10.000 3,300 3,300CARPE Carpenter 2.00 110.00 MH 75.098 8,261 8,261IWPILE Piledriver/Pilebuck 3.00 165.00 MH 65.703 10,841 10,841$70,955.98 275.0000 MH/LS 275.00 MH [ 15092 ] 19,102 45,474 6,380 70,956 010141 Setup Downstream Safety Railing Quan: 1.00 LS Hrs/Shft: 8.00 Cal: 508 WC: NONE
FLEX Flexifloat Barge Crew 31.25 CH Prod: 0.0000 Lab Pcs: 5.00 Eqp Pcs: 0.003RAILS Railing Material@106% 500.00 LF 68.900 34,450 34,450CARPE Carpenter 2.00 62.50 MH 75.098 4,694 4,694IWPILE Piledriver/Pilebuck 3.00 93.75 MH 65.703 6,160 6,160$45,303.41 156.2500 MH/LS 156.25 MH [ 8575.01 ] 10,853 34,450 45,303 010180 Onsite Flatbed Trucking (mancamp to dam) Quan: 1.00 LS Hrs/Shft: 8.00 Cal: 508 WC: NONE
FLAT Flatbed Trucking 200.00 CH Prod: 0.0000 Lab Pcs: 1.00 Eqp Pcs: 2.008TKT800 MCM KW Transport Semi 1.00 200.00 HR 67.000 13,400 13,400

McMillen, LLC Page 62012-12 Swan Lake Project - Dam and Power Plant 02/21/2012 9:37Curtis Neibaur Cost Report Activity Desc Quantity Unit Perm Constr Equip Sub-
Resource Pcs Unit Cost Labor Material Matl/Exp Ment Contract Total BID ITEM = 2100 Description = PREPARATORY WORK - 10' LAKE RAISE Unit = LS Takeoff Quan: 1.000 Engr Quan: 0.000
8TRLOW MCM LowBoy 1.00 200.00 HR 30.000 6,000 6,000TDTR Truck Driver (Transport) 1.00 200.00 MH 60.687 12,138 12,138$31,537.55 200.0000 MH/LS 200.00 MH [ 10840 ] 12,138 19,400 31,538 010185 Operate Mancamp Quan: 1.00 LS Hrs/Shft: 8.00 Cal: 508 WC: NONE
2MANCAMP Mancamp Purchase@106% 1.00 LS 79,500.000 79,500 79,5004MANCAMP Mancamp Operations 6.00 MO 30,000.000 180,000 180,000$259,500.00 [ ] 79,500 180,000 259,500 =====> Item Totals: 2100 - PREPARATORY WORK - 10' LAKE RAISE$669,508.44 1,809.2500 MH/LS 1,809.25 MH [ 95839.11 ] 122,439 238,500 79,924 48,646 180,000 669,508669,508.440 1 LS 122,438.88
238,500.00
79,924.00 48,645.56
180,000.00
669,508.44
BID ITEM = 2200 Description = PREPARATORY WORK - 15' LAKE RAISE Unit = LS Takeoff Quan: 1.000 Engr Quan: 0.000
010020 Setup Mancamp Quan: 1.00 LS Hrs/Shft: 8.00 Cal: 508 WC: NONE
LABG GENERAL LABOR CREW 60.00 CH Prod: 0.0000 Lab Pcs: 10.00 Eqp Pcs: 2.008FL12000 Forklift-12000 lb 1.00 60.00 HR 49.100 2,946 2,9468LO624 MCM JD624 - 4 YD Bucke 1.00 60.00 HR 69.860 4,192 4,192LABRA Laborer General 10.00 600.00 MH 68.014 40,809 40,809$47,946.42 600.0000 MH/LS 600.00 MH [ 30012 ] 40,809 7,138 47,946 030010 Operate Batchplant Quan: 1.00 LS Hrs/Shft: 8.00 Cal: 508 WC: NONE
BATCH Operate Batchplant 320.00 CH Prod: 0.0000 Lab Pcs: 3.00 Eqp Pcs: 1.002BATCHPLANT Batch Plant - Pur@106% 1.00 LS 159,000.000 159,000 159,0008LO624 MCM JD624 - 4 YD Bucke 1.00 320.00 HR 69.860 22,355 22,355CEBAT Batchplant Operator 1.00 320.00 MH 68.729 21,993 21,993LABRA Laborer General 1.00 320.00 MH 68.014 21,765 21,765OPLO Operator Loader 1.00 320.00 MH 68.449 21,904 21,904$247,017.04 960.0000 MH/LS 960.00 MH [ 51875.2 ] 65,662 159,000 22,355 247,017 010100 Setup Batchplant Quan: 1.00 LS Hrs/Shft: 8.00 Cal: 508 WC: NONE
LABG GENERAL LABOR CREW 40.00 CH Prod: 0.0000 Lab Pcs: 10.00 Eqp Pcs: 2.008FL12000 Forklift-12000 lb 1.00 40.00 HR 49.100 1,964 1,9648LO624 MCM JD624 - 4 YD Bucke 1.00 40.00 HR 69.860 2,794 2,794LABRA Laborer General 10.00 400.00 MH 68.014 27,206 27,206$31,964.28 400.0000 MH/LS 400.00 MH [ 20008 ] 27,206 4,758 31,964 010110 Site/Road Improvements Quan: 1.00 LS Hrs/Shft: 8.00 Cal: 508 WC: NONE
EX350 JD 350D EXCAVATOR CREW 16.00 CH Prod: 0.0000 Lab Pcs: 2.00 Eqp Pcs: 1.008LO624 MCM JD624 - 4 YD Bucke 1.00 16.00 HR 69.860 1,118 1,118LABRG Laborer Gradechecker 1.00 16.00 MH 68.015 1,088 1,088OPLO Operator Loader 1.00 16.00 MH 68.449 1,095 1,095$3,301.19 32.0000 MH/LS 32.00 MH [ 1703.2 ] 2,183 1,118 3,301 010150 Setup Floating Plant Quan: 1.00 LS Hrs/Shft: 8.00 Cal: 508 WC: NONE
LABG GENERAL LABOR CREW 24.00 CH Prod: 0.0000 Lab Pcs: 4.00 Eqp Pcs: 1.008CRLBRT65 Link Belt Rough Terrai 1.00 24.00 HR 73.000 1,752 1,752IWPILE Piledriver/Pilebuck 3.00 72.00 MH 65.703 4,731 4,731

McMillen, LLC Page 72012-12 Swan Lake Project - Dam and Power Plant 02/21/2012 9:37Curtis Neibaur Cost Report Activity Desc Quantity Unit Perm Constr Equip Sub-
Resource Pcs Unit Cost Labor Material Matl/Exp Ment Contract Total BID ITEM = 2200 Description = PREPARATORY WORK - 15' LAKE RAISE Unit = LS Takeoff Quan: 1.000 Engr Quan: 0.000
OPCRANE Operator Crane 1.00 24.00 MH 76.834 1,844 1,844$8,326.70 96.0000 MH/LS 96.00 MH [ 5300.4 ] 6,575 1,752 8,327 010140 Setup Upstream Dam Work Platform Quan: 1.00 LS Hrs/Shft: 8.00 Cal: 508 WC: NONE
FLEX Flexifloat Barge Crew 55.00 CH Prod: 0.0000 Lab Pcs: 5.00 Eqp Pcs: 7.003PLATFORM Working Platform@106% 440.00 LF 103.350 45,474 45,4748MIBOAT MCM 16' Boat W/Trailer 1.00 55.00 HR 56.000 3,080 3,0808MIFLEX Flexi-Float Barge 40'x 6.00 330.00 HR 10.000 3,300 3,300CARPE Carpenter 2.00 110.00 MH 75.098 8,261 8,261IWPILE Piledriver/Pilebuck 3.00 165.00 MH 65.703 10,841 10,841$70,955.98 275.0000 MH/LS 275.00 MH [ 15092 ] 19,102 45,474 6,380 70,956 010141 Setup Downstream Safety Railing Quan: 1.00 LS Hrs/Shft: 8.00 Cal: 508 WC: NONE
FLEX Flexifloat Barge Crew 31.25 CH Prod: 0.0000 Lab Pcs: 5.00 Eqp Pcs: 0.003RAILS Railing Material@106% 500.00 LF 68.900 34,450 34,450CARPE Carpenter 2.00 62.50 MH 75.098 4,694 4,694IWPILE Piledriver/Pilebuck 3.00 93.75 MH 65.703 6,160 6,160$45,303.41 156.2500 MH/LS 156.25 MH [ 8575.01 ] 10,853 34,450 45,303 010180 Onsite Flatbed Trucking (mancamp to dam) Quan: 1.00 LS Hrs/Shft: 8.00 Cal: 508 WC: NONE
FLAT Flatbed Trucking 400.00 CH Prod: 0.0000 Lab Pcs: 1.00 Eqp Pcs: 2.008TKT800 MCM KW Transport Semi 1.00 400.00 HR 67.000 26,800 26,8008TRLOW MCM LowBoy 1.00 400.00 HR 30.000 12,000 12,000TDTR Truck Driver (Transport) 1.00 400.00 MH 60.687 24,275 24,275$63,075.10 400.0000 MH/LS 400.00 MH [ 21680 ] 24,275 38,800 63,075 010185 Operate Mancamp Quan: 1.00 LS Hrs/Shft: 8.00 Cal: 508 WC: NONE
2MANCAMP Mancamp Purchase@106% 1.00 LS 159,000.000 159,000 159,0004MANCAMP Mancamp Operations 8.00 MO 45,000.000 360,000 360,000$519,000.00 [ ] 159,000 360,000 519,000 =====> Item Totals: 2200 - PREPARATORY WORK - 15' LAKE RAISE$1,036,890.12 2,919.2500 MH/LS 2,919.25 MH [ 154245.81 ] 196,665 318,000 79,924 82,301 360,000 1,036,8901,036,890.120 1 LS 196,665.16
318,000.00
79,924.00 82,300.96
360,000.00
1,036,890.12
BID ITEM = 2300 Description = PREPARATORY WORK - 20' LAKE RAISE Unit = LS Takeoff Quan: 1.000 Engr Quan: 0.000
010020 Setup Mancamp Quan: 1.00 LS Hrs/Shft: 8.00 Cal: 508 WC: NONE
LABG GENERAL LABOR CREW 60.00 CH Prod: 0.0000 Lab Pcs: 10.00 Eqp Pcs: 2.008FL12000 Forklift-12000 lb 1.00 60.00 HR 49.100 2,946 2,9468LO624 MCM JD624 - 4 YD Bucke 1.00 60.00 HR 69.860 4,192 4,192LABRA Laborer General 10.00 600.00 MH 68.014 40,809 40,809$47,946.42 600.0000 MH/LS 600.00 MH [ 30012 ] 40,809 7,138 47,946 030010 Operate Batchplant Quan: 1.00 LS Hrs/Shft: 8.00 Cal: 508 WC: NONE
BATCH Operate Batchplant 400.00 CH Prod: 0.0000 Lab Pcs: 3.00 Eqp Pcs: 1.002BATCHPLANT Batch Plant - Pur@106% 1.00 LS 424,000.000 424,000 424,0008LO624 MCM JD624 - 4 YD Bucke 1.00 400.00 HR 69.860 27,944 27,944CEBAT Batchplant Operator 1.00 400.00 MH 68.729 27,492 27,492

McMillen, LLC Page 82012-12 Swan Lake Project - Dam and Power Plant 02/21/2012 9:37Curtis Neibaur Cost Report Activity Desc Quantity Unit Perm Constr Equip Sub-
Resource Pcs Unit Cost Labor Material Matl/Exp Ment Contract Total BID ITEM = 2300 Description = PREPARATORY WORK - 20' LAKE RAISE Unit = LS Takeoff Quan: 1.000 Engr Quan: 0.000
LABRA Laborer General 1.00 400.00 MH 68.014 27,206 27,206OPLO Operator Loader 1.00 400.00 MH 68.449 27,380 27,380$534,021.31 1,200.0000 MH/LS 1,200.00 MH [ 64844 ] 82,077 424,000 27,944 534,021 010100 Setup Batchplant Quan: 1.00 LS Hrs/Shft: 8.00 Cal: 508 WC: NONE
LABG GENERAL LABOR CREW 40.00 CH Prod: 0.0000 Lab Pcs: 10.00 Eqp Pcs: 2.008FL12000 Forklift-12000 lb 1.00 40.00 HR 49.100 1,964 1,9648LO624 MCM JD624 - 4 YD Bucke 1.00 40.00 HR 69.860 2,794 2,794LABRA Laborer General 10.00 400.00 MH 68.014 27,206 27,206$31,964.28 400.0000 MH/LS 400.00 MH [ 20008 ] 27,206 4,758 31,964 010110 Site/Road Improvements Quan: 1.00 LS Hrs/Shft: 8.00 Cal: 508 WC: NONE
EX350 JD 350D EXCAVATOR CREW 16.00 CH Prod: 0.0000 Lab Pcs: 2.00 Eqp Pcs: 1.008LO624 MCM JD624 - 4 YD Bucke 1.00 16.00 HR 69.860 1,118 1,118LABRG Laborer Gradechecker 1.00 16.00 MH 68.015 1,088 1,088OPLO Operator Loader 1.00 16.00 MH 68.449 1,095 1,095$3,301.19 32.0000 MH/LS 32.00 MH [ 1703.2 ] 2,183 1,118 3,301 010150 Setup Floating Plant Quan: 1.00 LS Hrs/Shft: 8.00 Cal: 508 WC: NONE
LABG GENERAL LABOR CREW 24.00 CH Prod: 0.0000 Lab Pcs: 4.00 Eqp Pcs: 1.008CRLBRT65 Link Belt Rough Terrai 1.00 24.00 HR 73.000 1,752 1,752IWPILE Piledriver/Pilebuck 3.00 72.00 MH 65.703 4,731 4,731OPCRANE Operator Crane 1.00 24.00 MH 76.834 1,844 1,844$8,326.70 96.0000 MH/LS 96.00 MH [ 5300.4 ] 6,575 1,752 8,327 010140 Setup Upstream Dam Work Platform Quan: 1.00 LS Hrs/Shft: 8.00 Cal: 508 WC: NONE
FLEX Flexifloat Barge Crew 55.00 CH Prod: 0.0000 Lab Pcs: 5.00 Eqp Pcs: 7.003PLATFORM Working Platform@106% 440.00 LF 103.350 45,474 45,4748MIBOAT MCM 16' Boat W/Trailer 1.00 55.00 HR 56.000 3,080 3,0808MIFLEX Flexi-Float Barge 40'x 6.00 330.00 HR 10.000 3,300 3,300CARPE Carpenter 2.00 110.00 MH 75.098 8,261 8,261IWPILE Piledriver/Pilebuck 3.00 165.00 MH 65.703 10,841 10,841$70,955.98 275.0000 MH/LS 275.00 MH [ 15092 ] 19,102 45,474 6,380 70,956 010141 Setup Downstream Safety Railing Quan: 1.00 LS Hrs/Shft: 8.00 Cal: 508 WC: NONE
FLEX Flexifloat Barge Crew 31.25 CH Prod: 0.0000 Lab Pcs: 5.00 Eqp Pcs: 0.003RAILS Railing Material@106% 500.00 LF 68.900 34,450 34,450CARPE Carpenter 2.00 62.50 MH 75.098 4,694 4,694IWPILE Piledriver/Pilebuck 3.00 93.75 MH 65.703 6,160 6,160$45,303.41 156.2500 MH/LS 156.25 MH [ 8575.01 ] 10,853 34,450 45,303 010180 Onsite Flatbed Trucking (mancamp to dam) Quan: 1.00 LS Hrs/Shft: 8.00 Cal: 508 WC: NONE
FLAT Flatbed Trucking 400.00 CH Prod: 0.0000 Lab Pcs: 1.00 Eqp Pcs: 2.008TKT800 MCM KW Transport Semi 1.00 400.00 HR 67.000 26,800 26,8008TRLOW MCM LowBoy 1.00 400.00 HR 30.000 12,000 12,000TDTR Truck Driver (Transport) 1.00 400.00 MH 60.687 24,275 24,275$63,075.10 400.0000 MH/LS 400.00 MH [ 21680 ] 24,275 38,800 63,075 010185 Operate Mancamp Quan: 1.00 LS Hrs/Shft: 8.00 Cal: 508 WC: NONE
2MANCAMP Mancamp Purchase@106% 1.00 LS 212,000.000 212,000 212,0004MANCAMP Mancamp Operations 10.00 MO 50,000.000 500,000 500,000$712,000.00 [ ] 212,000 500,000 712,000

McMillen, LLC Page 92012-12 Swan Lake Project - Dam and Power Plant 02/21/2012 9:37Curtis Neibaur Cost Report Activity Desc Quantity Unit Perm Constr Equip Sub-
Resource Pcs Unit Cost Labor Material Matl/Exp Ment Contract Total BID ITEM = 2300 Description = PREPARATORY WORK - 20' LAKE RAISE Unit = LS Takeoff Quan: 1.000 Engr Quan: 0.000
=====> Item Totals: 2300 - PREPARATORY WORK - 20' LAKE RAISE$1,516,894.39 3,159.2500 MH/LS 3,159.25 MH [ 167214.61 ] 213,081 636,000 79,924 87,890 500,000 1,516,8941,516,894.390 1 LS 213,080.63
636,000.00
79,924.00 87,889.76
500,000.00
1,516,894.39
Total of Above Sub-Biditems =====> Item Totals: 2000 - PREPARATORY WORK$3,223,292.95 7,887.7500 MH/LS 7,887.75 MH [ 417299.53 ] 532,185
1,192,500
239,772 218,836
1,040,000
3,223,2933,223,292.950 1 LS 532,184.67
1,192,500.00
239,772.00
218,836.28
1,040,000.00
3,223,292.95
PARENT ITEM = 3000 Description = INTAKE TOWER CONCRETE Unit = LS Takeoff Quan: 1.000 Engr Quan: 1.000
Listing of Sub-Biditems of Parent Item 3000: BID ITEM = 3050 Description = INTAKE TOWER MODIFICATIONS - 10' LAKE RA Unit = LS Takeoff Quan: 1.000 Engr Quan: 0.000
030260 Intake Tower Form & Strip Quan: 8,960.00 SFC Hrs/Shft: 8.00 Cal: 508 WC: NONE
C3 CONCRETE WALL FORMING CREW
140.00
CH Prod: 10.6667 UM Lab Pcs: 6.00 Eqp Pcs: 0.003FORMWORK Dam Crest Formwor@106 8,960.00 SFCA 2.650 23,744 23,744CARPE Carpenter 3.00 420.00 MH 75.098 31,541 31,541CEF Concrete Foreman 1.00 140.00 MH 73.855 10,340 10,340LABRA Laborer General 2.00 280.00 MH 68.014 19,044 19,044$84,669.26 0.0937 MH/SFCA 840.00 MH [ 5.038 ] 60,925 23,744 84,669 230000 Mechanical System Quan: 1.00 LS Hrs/Shft: 8.00 Cal: 508 WC: NONE
4MECHUPGRAD Mechanical System Upgrad 1.00 LS 400,000.000 400,000 400,000 030265 Intake Tower Reinforcing Steel Quan: 11,040.00 LBS Hrs/Shft: 8.00 Cal: 508 WC: NONE
C5 REBAR CREW 48.00 CH Prod: 0.0000 Lab Pcs: 4.00 Eqp Pcs: 0.002REBAR Reinforcing Steel@106% 11,040.00 LBS 0.530 5,851 5,851IWREINF Ironworker Reinforcing Stee 2.00 96.00 MH 74.789 7,180 7,180LABRG Laborer Gradechecker 2.00 96.00 MH 68.014 6,529 6,529$19,560.39 0.0173 MH/LBS 192.00 MH [ 0.927 ] 13,709 5,851 19,560 030267 Intake Tower Concrete Transport Quan: 100.00 CY Hrs/Shft: 8.00 Cal: 508 WC: NONE
COTRUK Concrete Truck - Transport 13.33 CH Prod: 0.0000 Lab Pcs: 3.00 Eqp Pcs: 3.008TKCONC 10 CY Concrete Mixer T 3.00 40.00 HR 90.000 3,600 3,600TDTR Truck Driver (Transport) 3.00 40.00 MH 60.687 2,428 2,428$6,027.51 0.4000 MH/CY 40.00 MH [ 21.68 ] 2,428 3,600 6,028 030270 Intake Tower Place & Finish Quan: 100.00 CY Hrs/Shft: 8.00 Cal: 508 WC: NONE
C2 CONCRETE PLACING CREW 20.00 CH Prod: 5.0000 UH Lab Pcs: 6.00 Eqp Pcs: 1.002CONCRETE Batched Concrete@106% 100.00 CY 212.000 21,200 21,2008MIPUMP Concrete Line Pump 1.00 20.00 HR 100.000 2,000 2,000CEF Concrete Foreman 1.00 20.00 MH 73.855 1,477 1,477

McMillen, LLC Page 102012-12 Swan Lake Project - Dam and Power Plant 02/21/2012 9:37Curtis Neibaur Cost Report Activity Desc Quantity Unit Perm Constr Equip Sub-
Resource Pcs Unit Cost Labor Material Matl/Exp Ment Contract Total BID ITEM = 3050 Description = INTAKE TOWER MODIFICATIONS - 10' LAKE RA Unit = LS Takeoff Quan: 1.000 Engr Quan: 0.000
CEFIN Concrete Finisher 3.00 60.00 MH 71.385 4,283 4,283LABRA Laborer General 2.00 40.00 MH 68.014 2,721 2,721$31,680.84 1.2000 MH/CY 120.00 MH [ 62.608 ] 8,481 21,200 2,000 31,681 030280 Intake Tower Protect & Cure Quan: 100.00 CY Hrs/Shft: 8.00 Cal: 508 WC: NONE
LABG GENERAL LABOR CREW 16.00 CH Prod: 0.0000 Lab Pcs: 3.00 Eqp Pcs: 0.003BLANKET Concrete Blankets@106% 5.00 EA 79.500 398 3983CURE Concrete Cure@106% 100.00 CY 5.300 530 530LABRA Laborer General 3.00 48.00 MH 68.014 3,265 3,265$4,192.21 0.4800 MH/CY 48.00 MH [ 24.01 ] 3,265 928 4,192 030290 Intake Tower Point & Patch Quan: 8,960.00 SF Hrs/Shft: 8.00 Cal: 508 WC: NONE
LABG GENERAL LABOR CREW 37.33 CH Prod: 120.0001 UM Lab Pcs: 2.00 Eqp Pcs: 0.002PATCH Concrete Patch@106% 8,960.00 SF 0.795 7,123 7,123LABRA Laborer General 2.00 74.67 MH 68.014 5,079 5,079$12,201.86 0.0083 MH/SF 74.67 MH [ 0.417 ] 5,079 7,123 12,202 =====> Item Totals: 3050 - INTAKE TOWER MODIFICATIONS - 10' LAKE RA$558,332.07 1,314.6700 MH/LS 1,314.67 MH [ 69932.43 ] 93,886 34,174 24,672 5,600 400,000 558,332558,332.070 1 LS 93,886.17
34,174.40
24,671.50 5,600.00
400,000.00
558,332.07
BID ITEM = 3100 Description = INTAKE TOWER MODIFICATIONS - 15' LAKE RA Unit = LS Takeoff Quan: 1.000 Engr Quan: 0.000
030260 Intake Tower Form & Strip Quan: 17,920.00 SFC Hrs/Shft: 8.00 Cal: 508 WC: NONE
C3 CONCRETE WALL FORMING CREW
280.00
CH Prod: 10.6667 UM Lab Pcs: 6.00 Eqp Pcs: 0.003FORMWORK Dam Crest Formwor@106 17,920.00 SFCA 2.650 47,488 47,488CARPE Carpenter 3.00 840.00 MH 75.098 63,083 63,083CEF Concrete Foreman 1.00 280.00 MH 73.855 20,679 20,679LABRA Laborer General 2.00 560.00 MH 68.014 38,088 38,088$169,338.53 0.0937 MH/SFCA 1,680.00 MH [ 5.038 ] 121,851 47,488 169,339 230000 Mechanical System Quan: 1.00 LS Hrs/Shft: 8.00 Cal: 508 WC: NONE
4MECHUPGRAD Mechanical System Upgrad 1.00 LS 400,000.000 400,000 400,000 030265 Intake Tower Reinforcing Steel Quan: 22,080.00 LBS Hrs/Shft: 8.00 Cal: 508 WC: NONE
C5 REBAR CREW 96.00 CH Prod: 0.0000 Lab Pcs: 4.00 Eqp Pcs: 0.002REBAR Reinforcing Steel@106% 22,080.00 LBS 0.530 11,702 11,702IWREINF Ironworker Reinforcing Stee 2.00 192.00 MH 74.789 14,360 14,360LABRG Laborer Gradechecker 2.00 192.00 MH 68.014 13,059 13,059$39,120.79 0.0173 MH/LBS 384.00 MH [ 0.927 ] 27,418 11,702 39,121 030267 Intake Tower Concrete Transport Quan: 200.00 CY Hrs/Shft: 8.00 Cal: 508 WC: NONE
COTRUK Concrete Truck - Transport 26.66 CH Prod: 0.0000 Lab Pcs: 3.00 Eqp Pcs: 3.008TKCONC 10 CY Concrete Mixer T 3.00 80.00 HR 90.000 7,200 7,200TDTR Truck Driver (Transport) 3.00 80.00 MH 60.687 4,855 4,855$12,055.02 0.4000 MH/CY 80.00 MH [ 21.68 ] 4,855 7,200 12,055 030270 Intake Tower Place & Finish Quan: 200.00 CY Hrs/Shft: 8.00 Cal: 508 WC: NONE

McMillen, LLC Page 112012-12 Swan Lake Project - Dam and Power Plant 02/21/2012 9:37Curtis Neibaur Cost Report Activity Desc Quantity Unit Perm Constr Equip Sub-
Resource Pcs Unit Cost Labor Material Matl/Exp Ment Contract Total BID ITEM = 3100 Description = INTAKE TOWER MODIFICATIONS - 15' LAKE RA Unit = LS Takeoff Quan: 1.000 Engr Quan: 0.000
C2 CONCRETE PLACING CREW 40.00 CH Prod: 5.0000 UH Lab Pcs: 6.00 Eqp Pcs: 1.002CONCRETE Batched Concrete@106% 200.00 CY 212.000 42,400 42,4008MIPUMP Concrete Line Pump 1.00 40.00 HR 100.000 4,000 4,000CEF Concrete Foreman 1.00 40.00 MH 73.855 2,954 2,954CEFIN Concrete Finisher 3.00 120.00 MH 71.385 8,566 8,566LABRA Laborer General 2.00 80.00 MH 68.014 5,441 5,441$63,361.67 1.2000 MH/CY 240.00 MH [ 62.608 ] 16,962 42,400 4,000 63,362 030280 Intake Tower Protect & Cure Quan: 200.00 CY Hrs/Shft: 8.00 Cal: 508 WC: NONE
LABG GENERAL LABOR CREW 32.00 CH Prod: 0.0000 Lab Pcs: 3.00 Eqp Pcs: 0.003BLANKET Concrete Blankets@106% 10.00 EA 79.500 795 7953CURE Concrete Cure@106% 200.00 CY 5.300 1,060 1,060LABRA Laborer General 3.00 96.00 MH 68.014 6,529 6,529$8,384.41 0.4800 MH/CY 96.00 MH [ 24.01 ] 6,529 1,855 8,384 030290 Intake Tower Point & Patch Quan: 17,920.00 SF Hrs/Shft: 8.00 Cal: 508 WC: NONE
LABG GENERAL LABOR CREW 74.66 CH Prod: 120.0001 UM Lab Pcs: 2.00 Eqp Pcs: 0.002PATCH Concrete Patch@106% 17,920.00 SF 0.795 14,246 14,246LABRA Laborer General 2.00 149.33 MH 68.014 10,157 10,157$24,403.04 0.0083 MH/SF 149.33 MH [ 0.417 ] 10,157 14,246 24,403 =====> Item Totals: 3100 - INTAKE TOWER MODIFICATIONS - 15' LAKE RA$716,663.46 2,629.3300 MH/LS 2,629.33 MH [ 139864.37 ] 187,772 68,349 49,343 11,200 400,000 716,663716,663.460 1 LS 187,771.66
68,348.80
49,343.00 11,200.00
400,000.00
716,663.46
BID ITEM = 3200 Description = INTAKE TOWER MODIFICATIONS - 20' LAKE RA Unit = LS Takeoff Quan: 1.000 Engr Quan: 0.000
030260 Intake Tower Form & Strip Quan: 26,880.00 SFC Hrs/Shft: 8.00 Cal: 508 WC: NONE
C3 CONCRETE WALL FORMING CREW
420.00
CH Prod: 10.6667 UM Lab Pcs: 6.00 Eqp Pcs: 0.003FORMWORK Dam Crest Formwor@106 26,880.00 SFCA 2.650 71,232 71,232CARPE Carpenter 3.00 1,260.00 MH 75.098 94,624 94,624CEF Concrete Foreman 1.00 420.00 MH 73.855 31,019 31,019LABRA Laborer General 2.00 840.00 MH 68.014 57,132 57,132$254,007.81 0.0937 MH/SFCA 2,520.00 MH [ 5.038 ] 182,776 71,232 254,008 230000 Mechanical System Quan: 1.00 LS Hrs/Shft: 8.00 Cal: 508 WC: NONE
4MECHUPGRAD Mechanical System Upgrad 1.00 LS 400,000.000 400,000 400,000 030265 Intake Tower Reinforcing Steel Quan: 33,120.00 LBS Hrs/Shft: 8.00 Cal: 508 WC: NONE
C5 REBAR CREW 144.00 CH Prod: 0.0000 Lab Pcs: 4.00 Eqp Pcs: 0.002REBAR Reinforcing Steel@106% 33,120.00 LBS 0.530 17,554 17,554IWREINF Ironworker Reinforcing Stee 2.00 288.00 MH 74.789 21,539 21,539LABRG Laborer Gradechecker 2.00 288.00 MH 68.014 19,588 19,588$58,681.18 0.0173 MH/LBS 576.00 MH [ 0.927 ] 41,128 17,554 58,681 030267 Intake Tower Concrete Transport Quan: 300.00 CY Hrs/Shft: 8.00 Cal: 508 WC: NONE
COTRUK Concrete Truck - Transport 39.99 CH Prod: 0.0000 Lab Pcs: 3.00 Eqp Pcs: 3.008TKCONC 10 CY Concrete Mixer T 3.00 120.00 HR 90.000 10,800 10,800TDTR Truck Driver (Transport) 3.00 120.00 MH 60.687 7,283 7,283

McMillen, LLC Page 122012-12 Swan Lake Project - Dam and Power Plant 02/21/2012 9:37Curtis Neibaur Cost Report Activity Desc Quantity Unit Perm Constr Equip Sub-
Resource Pcs Unit Cost Labor Material Matl/Exp Ment Contract Total BID ITEM = 3200 Description = INTAKE TOWER MODIFICATIONS - 20' LAKE RA Unit = LS Takeoff Quan: 1.000 Engr Quan: 0.000
$18,082.53 0.4000 MH/CY 120.00 MH [ 21.68 ] 7,283 10,800 18,083 030270 Intake Tower Place & Finish Quan: 300.00 CY Hrs/Shft: 8.00 Cal: 508 WC: NONE
C2 CONCRETE PLACING CREW 60.00 CH Prod: 5.0000 UH Lab Pcs: 6.00 Eqp Pcs: 1.002CONCRETE Batched Concrete@106% 300.00 CY 212.000 63,600 63,6008MIPUMP Concrete Line Pump 1.00 60.00 HR 100.000 6,000 6,000CEF Concrete Foreman 1.00 60.00 MH 73.855 4,431 4,431CEFIN Concrete Finisher 3.00 180.00 MH 71.385 12,849 12,849LABRA Laborer General 2.00 120.00 MH 68.014 8,162 8,162$95,042.51 1.2000 MH/CY 360.00 MH [ 62.608 ] 25,443 63,600 6,000 95,043 030280 Intake Tower Protect & Cure Quan: 300.00 CY Hrs/Shft: 8.00 Cal: 508 WC: NONE
LABG GENERAL LABOR CREW 48.00 CH Prod: 0.0000 Lab Pcs: 3.00 Eqp Pcs: 0.003BLANKET Concrete Blankets@106% 15.00 EA 79.500 1,193 1,1933CURE Concrete Cure@106% 300.00 CY 5.300 1,590 1,590LABRA Laborer General 3.00 144.00 MH 68.014 9,794 9,794$12,576.62 0.4800 MH/CY 144.00 MH [ 24.01 ] 9,794 2,783 12,577 030290 Intake Tower Point & Patch Quan: 33,120.00 SF Hrs/Shft: 8.00 Cal: 508 WC: NONE
LABG GENERAL LABOR CREW 137.99 CH Prod: 120.0001 UM Lab Pcs: 2.00 Eqp Pcs: 0.002PATCH Concrete Patch@106% 33,120.00 SF 0.795 26,330 26,330LABRA Laborer General 2.00 276.00 MH 68.014 18,772 18,772$45,102.46 0.0083 MH/SF 276.00 MH [ 0.417 ] 18,772 26,330 45,102 =====> Item Totals: 3200 - INTAKE TOWER MODIFICATIONS - 20' LAKE RA$883,493.11 3,996.0000 MH/LS 3,996.00 MH [ 212397.84 ] 285,195 107,484 74,015 16,800 400,000 883,493883,493.110 1 LS 285,194.61
107,484.00
74,014.50 16,800.00
400,000.00
883,493.11
Total of Above Sub-Biditems =====> Item Totals: 3000 - INTAKE TOWER CONCRETE$2,158,488.64 7,940.0000 MH/LS 7,940.00 MH [ 422194.64 ] 566,852 210,007 148,029 33,600
1,200,000
2,158,4892,158,488.640 1 LS 566,852.44
210,007.20
148,029.00
33,600.00
1,200,000.00
2,158,488.64
PARENT ITEM = 3400 Description = 10' LAKE RAISE Unit = LS Takeoff Quan: 1.000 Engr Quan: 1.000
Listing of Sub-Biditems of Parent Item 3400: BID ITEM = 3405 Description = CONCRETE SUPPORT ABUTMENT - ELEV. 340 Unit = LS Takeoff Quan: 1.000 Engr Quan: 0.000
030200 New Support Abutment Form & Strip Quan: 2,703.00 SFC Hrs/Shft: 8.00 Cal: 508 WC: NONE
C3 CONCRETE WALL FORMING CREW 76.35 CH Prod: 0.0000 Lab Pcs: 8.00 Eqp Pcs: 1.003FORMWORK Dam Crest Formwor@106 2,703.00 SFCA 4.770 12,893 12,8938CRTOWER Tower Crane 1.00 76.36 HR 300.000 22,908 22,908CARPE Carpenter 4.00 305.42 MH 75.098 22,937 22,937CEF Concrete Foreman 1.00 76.36 MH 73.855 5,640 5,640

McMillen, LLC Page 132012-12 Swan Lake Project - Dam and Power Plant 02/21/2012 9:37Curtis Neibaur Cost Report Activity Desc Quantity Unit Perm Constr Equip Sub-
Resource Pcs Unit Cost Labor Material Matl/Exp Ment Contract Total BID ITEM = 3405 Description = CONCRETE SUPPORT ABUTMENT - ELEV. 340 Unit = LS Takeoff Quan: 1.000 Engr Quan: 0.000
LABRA Laborer General 2.00 152.71 MH 68.014 10,387 10,387OPCRANE Operator Crane 1.00 76.36 MH 76.834 5,867 5,867$80,631.12 0.2259 MH/SFCA 610.85 MH [ 12.329 ] 44,830 12,893 22,908 80,631 030205 New Support Abutment Reinforcing Steel Quan: 73,350.00 LBS Hrs/Shft: 8.00 Cal: 508 WC: NONE
C5 REBAR CREW 312.03 CH Prod: 58.7667 UM Lab Pcs: 4.00 Eqp Pcs: 0.002REBAR Reinforcing Steel@106% 73,350.00 LBS 0.530 38,876 38,876IWREINF Ironworker Reinforcing Stee 2.00 624.08 MH 74.789 46,675 46,675LABRG Laborer Gradechecker 2.00 624.08 MH 68.014 42,447 42,447$127,996.68 0.0170 MH/LBS 1,248.16 MH [ 0.907 ] 89,121 38,876 127,997 030207 New Support Abutment Transport Concrete Quan: 489.00 CY Hrs/Shft: 8.00 Cal: 508 WC: NONE
COTRUK Concrete Truck - Transport 97.80 CH Prod: 0.0000 Lab Pcs: 3.00 Eqp Pcs: 3.008TKCONC 10 CY Concrete Mixer T 3.00 293.40 HR 90.000 26,406 26,406TDTR Truck Driver (Transport) 3.00 293.40 MH 60.687 17,806 17,806$44,211.78 0.6000 MH/CY 293.40 MH [ 32.52 ] 17,806 26,406 44,212 030210 New Support Abutment Place & Finish Quan: 489.00 CY Hrs/Shft: 8.00 Cal: 508 WC: NONE
C2 CONCRETE PLACING CREW 97.80 CH Prod: 5.0000 UH Lab Pcs: 8.00 Eqp Pcs: 9.002CONCRETE Batched Concrete@106% 489.00 CY 212.000 103,668 103,6688MIBOAT MCM 16' Boat W/Trailer 1.00 97.80 HR 56.000 5,477 5,4778MIFLEX Flexi-Float Barge 40'x 6.00 586.80 HR 10.000 5,868 5,8688MIPUMP Concrete Line Pump 2.00 195.60 HR 100.000 19,560 19,560CEF Concrete Foreman 1.00 97.80 MH 73.855 7,223 7,223CEFIN Concrete Finisher 4.00 391.20 MH 71.385 27,926 27,926LABRA Laborer General 3.00 293.40 MH 68.014 19,956 19,956$189,677.45 1.6000 MH/CY 782.40 MH [ 83.162 ] 55,105 103,668 30,905 189,677 030220 New Support Abutment Protect & Cure Quan: 489.00 CY Hrs/Shft: 8.00 Cal: 508 WC: NONE
LABG GENERAL LABOR CREW 55.47 CH Prod: 0.0000 Lab Pcs: 4.00 Eqp Pcs: 0.003BLANKET Concrete Blankets@106% 27.74 EA 79.500 2,205 2,2053CURE Concrete Cure@106% 489.00 CY 5.300 2,592 2,592LABRA Laborer General 4.00 221.89 MH 68.014 15,092 15,092$19,888.81 0.4537 MH/CY 221.89 MH [ 22.697 ] 15,092 4,797 19,889 030230 New Support Abutment Point & Patch Quan: 2,703.00 SFC Hrs/Shft: 8.00 Cal: 508 WC: NONE
LABG GENERAL LABOR CREW 6.75 CH Prod: 100.0000 UM Lab Pcs: 4.00 Eqp Pcs: 0.002PATCH Concrete Patch@106% 2,703.00 SFCA 0.795 2,149 2,149LABRA Laborer General 4.00 27.03 MH 68.014 1,838 1,838$3,987.33 0.0100 MH/SFCA 27.03 MH [ 0.5 ] 1,838 2,149 3,987 =====> Item Totals: 3405 - CONCRETE SUPPORT ABUTMENT - ELEV. 340$466,393.17 3,183.7300 MH/LS 3,183.73 MH [ 168860.39 ] 223,792 144,692 17,690 80,219 466,393466,393.170 1 LS 223,791.64
144,692.39
17,690.34 80,218.80 466,393.17
Total of Above Sub-Biditems =====> Item Totals: 3400 - 10' LAKE RAISE$466,393.17 3,183.7300 MH/LS 3,183.73 MH [ 168860.39 ] 223,792 144,692 17,690 80,219 466,393466,393.170 1 LS 223,791.64
144,692.39
17,690.34 80,218.80 466,393.17

McMillen, LLC Page 142012-12 Swan Lake Project - Dam and Power Plant 02/21/2012 9:37Curtis Neibaur Cost Report Activity Desc Quantity Unit Perm Constr Equip Sub-
Resource Pcs Unit Cost Labor Material Matl/Exp Ment Contract Total
PARENT ITEM = 3450 Description = 15' LAKE RAISE Unit = LS Takeoff Quan: 1.000 Engr Quan: 1.000
Listing of Sub-Biditems of Parent Item 3450: BID ITEM = 3455 Description = CONCRETE SUPPORT ABUTMENT - ELEV. 345 Unit = LS Takeoff Quan: 1.000 Engr Quan: 0.000
030200 New Support Abutment Form & Strip Quan: 2,703.00 SFC Hrs/Shft: 8.00 Cal: 508 WC: NONE
C3 CONCRETE WALL FORMING CREW 76.35 CH Prod: 0.0000 Lab Pcs: 8.00 Eqp Pcs: 1.003FORMWORK Dam Crest Formwor@106 2,703.00 SFCA 4.770 12,893 12,8938CRTOWER Tower Crane 1.00 76.36 HR 300.000 22,908 22,908CARPE Carpenter 4.00 305.42 MH 75.098 22,937 22,937CEF Concrete Foreman 1.00 76.36 MH 73.855 5,640 5,640LABRA Laborer General 2.00 152.71 MH 68.014 10,387 10,387OPCRANE Operator Crane 1.00 76.36 MH 76.834 5,867 5,867$80,631.12 0.2259 MH/SFCA 610.85 MH [ 12.329 ] 44,830 12,893 22,908 80,631 030205 New Support Abutment Reinforcing Steel Quan: 73,350.00 LBS Hrs/Shft: 8.00 Cal: 508 WC: NONE
C5 REBAR CREW 312.03 CH Prod: 58.7667 UM Lab Pcs: 4.00 Eqp Pcs: 0.002REBAR Reinforcing Steel@106% 73,350.00 LBS 0.530 38,876 38,876IWREINF Ironworker Reinforcing Stee 2.00 624.08 MH 74.789 46,675 46,675LABRG Laborer Gradechecker 2.00 624.08 MH 68.014 42,447 42,447$127,996.68 0.0170 MH/LBS 1,248.16 MH [ 0.907 ] 89,121 38,876 127,997 030207 New Support Abutment Transport Concrete Quan: 489.00 CY Hrs/Shft: 8.00 Cal: 508 WC: NONE
COTRUK Concrete Truck - Transport 97.80 CH Prod: 0.0000 Lab Pcs: 3.00 Eqp Pcs: 3.008TKCONC 10 CY Concrete Mixer T 3.00 293.40 HR 90.000 26,406 26,406TDTR Truck Driver (Transport) 3.00 293.40 MH 60.687 17,806 17,806$44,211.78 0.6000 MH/CY 293.40 MH [ 32.52 ] 17,806 26,406 44,212 030210 New Support Abutment Place & Finish Quan: 489.00 CY Hrs/Shft: 8.00 Cal: 508 WC: NONE
C2 CONCRETE PLACING CREW 97.80 CH Prod: 5.0000 UH Lab Pcs: 8.00 Eqp Pcs: 9.002CONCRETE Batched Concrete@106% 489.00 CY 212.000 103,668 103,6688MIBOAT MCM 16' Boat W/Trailer 1.00 97.80 HR 56.000 5,477 5,4778MIFLEX Flexi-Float Barge 40'x 6.00 586.80 HR 10.000 5,868 5,8688MIPUMP Concrete Line Pump 2.00 195.60 HR 100.000 19,560 19,560CEF Concrete Foreman 1.00 97.80 MH 73.855 7,223 7,223CEFIN Concrete Finisher 4.00 391.20 MH 71.385 27,926 27,926LABRA Laborer General 3.00 293.40 MH 68.014 19,956 19,956$189,677.45 1.6000 MH/CY 782.40 MH [ 83.162 ] 55,105 103,668 30,905 189,677 030220 New Support Abutment Protect & Cure Quan: 489.00 CY Hrs/Shft: 8.00 Cal: 508 WC: NONE
LABG GENERAL LABOR CREW 55.47 CH Prod: 0.0000 Lab Pcs: 4.00 Eqp Pcs: 0.003BLANKET Concrete Blankets@106% 27.74 EA 79.500 2,205 2,2053CURE Concrete Cure@106% 489.00 CY 5.300 2,592 2,592LABRA Laborer General 4.00 221.89 MH 68.014 15,092 15,092$19,888.81 0.4537 MH/CY 221.89 MH [ 22.697 ] 15,092 4,797 19,889 030230 New Support Abutment Point & Patch Quan: 2,703.00 SFC Hrs/Shft: 8.00 Cal: 508 WC: NONE
LABG GENERAL LABOR CREW 6.75 CH Prod: 100.0000 UM Lab Pcs: 4.00 Eqp Pcs: 0.002PATCH Concrete Patch@106% 2,703.00 SFCA 0.795 2,149 2,149LABRA Laborer General 4.00 27.03 MH 68.014 1,838 1,838$3,987.33 0.0100 MH/SFCA 27.03 MH [ 0.5 ] 1,838 2,149 3,987
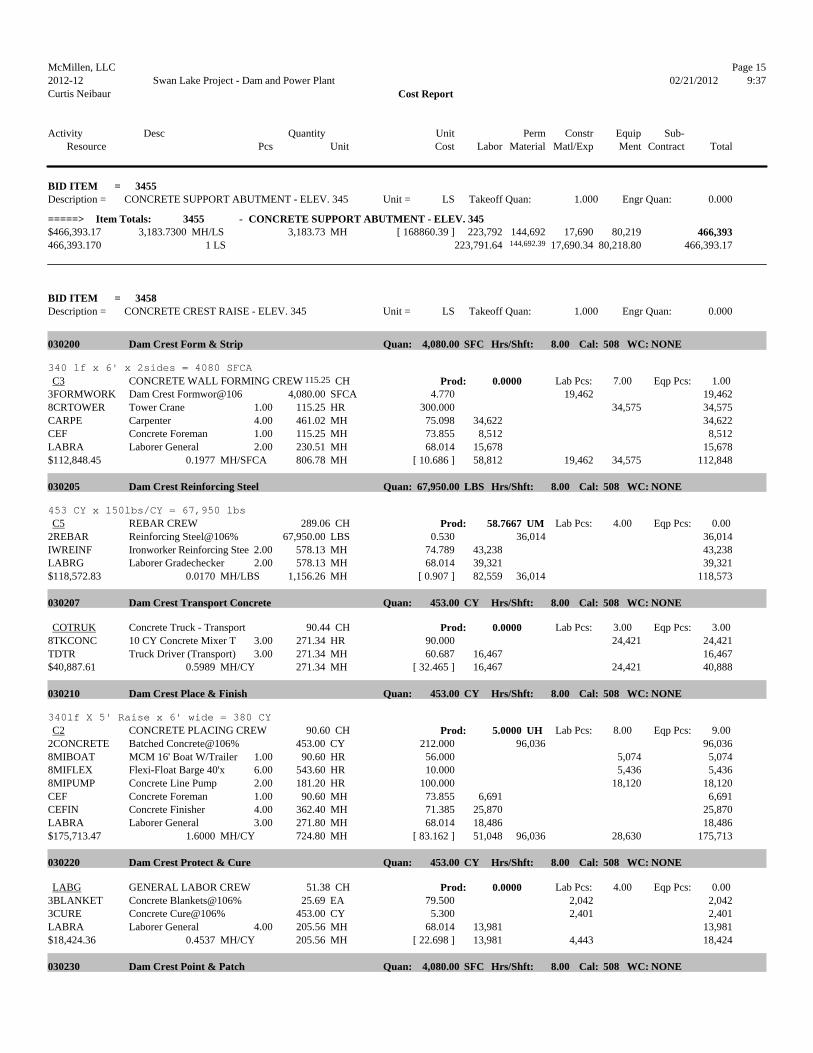
McMillen, LLC Page 152012-12 Swan Lake Project - Dam and Power Plant 02/21/2012 9:37Curtis Neibaur Cost Report Activity Desc Quantity Unit Perm Constr Equip Sub-
Resource Pcs Unit Cost Labor Material Matl/Exp Ment Contract Total BID ITEM = 3455 Description = CONCRETE SUPPORT ABUTMENT - ELEV. 345 Unit = LS Takeoff Quan: 1.000 Engr Quan: 0.000
=====> Item Totals: 3455 - CONCRETE SUPPORT ABUTMENT - ELEV. 345$466,393.17 3,183.7300 MH/LS 3,183.73 MH [ 168860.39 ] 223,792 144,692 17,690 80,219 466,393466,393.170 1 LS 223,791.64
144,692.39
17,690.34 80,218.80 466,393.17 BID ITEM = 3458 Description = CONCRETE CREST RAISE - ELEV. 345 Unit = LS Takeoff Quan: 1.000 Engr Quan: 0.000
030200 Dam Crest Form & Strip Quan: 4,080.00 SFC Hrs/Shft: 8.00 Cal: 508 WC: NONE
340 lf x 6' x 2sides = 4080 SFCA
C3 CONCRETE WALL FORMING CREW
115.25
CH Prod: 0.0000 Lab Pcs: 7.00 Eqp Pcs: 1.003FORMWORK Dam Crest Formwor@106 4,080.00 SFCA 4.770 19,462 19,4628CRTOWER Tower Crane 1.00 115.25 HR 300.000 34,575 34,575CARPE Carpenter 4.00 461.02 MH 75.098 34,622 34,622CEF Concrete Foreman 1.00 115.25 MH 73.855 8,512 8,512LABRA Laborer General 2.00 230.51 MH 68.014 15,678 15,678$112,848.45 0.1977 MH/SFCA 806.78 MH [ 10.686 ] 58,812 19,462 34,575 112,848 030205 Dam Crest Reinforcing Steel Quan: 67,950.00 LBS Hrs/Shft: 8.00 Cal: 508 WC: NONE
453 CY x 150lbs/CY = 67,950 lbs
C5 REBAR CREW 289.06 CH Prod: 58.7667 UM Lab Pcs: 4.00 Eqp Pcs: 0.002REBAR Reinforcing Steel@106% 67,950.00 LBS 0.530 36,014 36,014IWREINF Ironworker Reinforcing Stee 2.00 578.13 MH 74.789 43,238 43,238LABRG Laborer Gradechecker 2.00 578.13 MH 68.014 39,321 39,321$118,572.83 0.0170 MH/LBS 1,156.26 MH [ 0.907 ] 82,559 36,014 118,573 030207 Dam Crest Transport Concrete Quan: 453.00 CY Hrs/Shft: 8.00 Cal: 508 WC: NONE
COTRUK Concrete Truck - Transport 90.44 CH Prod: 0.0000 Lab Pcs: 3.00 Eqp Pcs: 3.008TKCONC 10 CY Concrete Mixer T 3.00 271.34 HR 90.000 24,421 24,421TDTR Truck Driver (Transport) 3.00 271.34 MH 60.687 16,467 16,467$40,887.61 0.5989 MH/CY 271.34 MH [ 32.465 ] 16,467 24,421 40,888 030210 Dam Crest Place & Finish Quan: 453.00 CY Hrs/Shft: 8.00 Cal: 508 WC: NONE
340lf X 5' Raise x 6' wide = 380 CY
C2 CONCRETE PLACING CREW 90.60 CH Prod: 5.0000 UH Lab Pcs: 8.00 Eqp Pcs: 9.002CONCRETE Batched Concrete@106% 453.00 CY 212.000 96,036 96,0368MIBOAT MCM 16' Boat W/Trailer 1.00 90.60 HR 56.000 5,074 5,0748MIFLEX Flexi-Float Barge 40'x 6.00 543.60 HR 10.000 5,436 5,4368MIPUMP Concrete Line Pump 2.00 181.20 HR 100.000 18,120 18,120CEF Concrete Foreman 1.00 90.60 MH 73.855 6,691 6,691CEFIN Concrete Finisher 4.00 362.40 MH 71.385 25,870 25,870LABRA Laborer General 3.00 271.80 MH 68.014 18,486 18,486$175,713.47 1.6000 MH/CY 724.80 MH [ 83.162 ] 51,048 96,036 28,630 175,713 030220 Dam Crest Protect & Cure Quan: 453.00 CY Hrs/Shft: 8.00 Cal: 508 WC: NONE
LABG GENERAL LABOR CREW 51.38 CH Prod: 0.0000 Lab Pcs: 4.00 Eqp Pcs: 0.003BLANKET Concrete Blankets@106% 25.69 EA 79.500 2,042 2,0423CURE Concrete Cure@106% 453.00 CY 5.300 2,401 2,401LABRA Laborer General 4.00 205.56 MH 68.014 13,981 13,981$18,424.36 0.4537 MH/CY 205.56 MH [ 22.698 ] 13,981 4,443 18,424 030230 Dam Crest Point & Patch Quan: 4,080.00 SFC Hrs/Shft: 8.00 Cal: 508 WC: NONE

McMillen, LLC Page 162012-12 Swan Lake Project - Dam and Power Plant 02/21/2012 9:37Curtis Neibaur Cost Report Activity Desc Quantity Unit Perm Constr Equip Sub-
Resource Pcs Unit Cost Labor Material Matl/Exp Ment Contract Total BID ITEM = 3458 Description = CONCRETE CREST RAISE - ELEV. 345 Unit = LS Takeoff Quan: 1.000 Engr Quan: 0.000
LABG GENERAL LABOR CREW 10.20 CH Prod: 100.0000 UM Lab Pcs: 4.00 Eqp Pcs: 0.002PATCH Concrete Patch@106% 4,080.00 SFCA 0.795 3,244 3,244LABRA Laborer General 4.00 40.80 MH 68.014 2,775 2,775$6,018.60 0.0100 MH/SFCA 40.80 MH [ 0.5 ] 2,775 3,244 6,019 050150 Handrails & Railings Quan: 680.00 LF Hrs/Shft: 8.00 Cal: 508 WC: NONE
IRON Ironworker Crew 85.00 CH Prod: 0.0000 Lab Pcs: 2.00 Eqp Pcs: 1.002HANDRAIL Metal Handrail@106% 680.00 LF 68.900 46,852 46,8528FL12000 Forklift-12000 lb 1.00 85.00 HR 49.100 4,174 4,174IWSTR Ironworker Structural Steel 1.00 85.00 MH 74.789 6,357 6,357OPFL Operator Forklift 1.00 85.00 MH 68.449 5,818 5,818$63,200.82 0.2500 MH/LF 170.00 MH [ 14.124 ] 12,175 46,852 4,174 63,201 =====> Item Totals: 3458 - CONCRETE CREST RAISE - ELEV. 345$535,666.14 3,375.5400 MH/LS 3,375.54 MH [ 179520.43 ] 237,817 182,145 23,905 91,799 535,666535,666.140 1 LS 237,817.48
182,145.10
23,904.86 91,798.70 535,666.14 BID ITEM = 3460 Description = TIE TO RIGHT ABUTMENT Unit = LS Takeoff Quan: 1.000 Engr Quan: 0.000
030910 Abutment Tie-In and Infill Form & Strip Quan: 3,000.00 SFC Hrs/Shft: 8.00 Cal: 508 WC: NONE
C3 CONCRETE WALL FORMING CREW 93.75 CH Prod: 8.0000 UM Lab Pcs: 4.00 Eqp Pcs: 0.003FORMWORK Dam Crest Formwor@106 3,000.00 SFCA 2.915 8,745 8,745CARPE Carpenter 2.00 187.50 MH 75.098 14,081 14,081CEF Concrete Foreman 1.00 93.75 MH 73.855 6,924 6,924LABRA Laborer General 1.00 93.75 MH 68.014 6,376 6,376$36,126.32 0.1250 MH/SFCA 375.00 MH [ 6.766 ] 27,381 8,745 36,126 030915 Abutment Tie-In and Infill Rebar Quan:
125,550.00
LBS Hrs/Shft: 8.00 Cal: 508 WC: NONE
837 CY x 150 lbs/CY = 125,550 lbs.
C5 REBAR CREW 500.00 CH Prod: 0.0000 Lab Pcs: 4.00 Eqp Pcs: 0.002REBAR Reinforcing Steel@106% 125,550.00 LBS 0.530 66,542 66,542IWREINF Ironworker Reinforcing Stee 2.00 1,000.00 MH 74.789 74,789 74,789LABRG Laborer Gradechecker 2.00 1,000.00 MH 68.014 68,015 68,015$209,345.61 0.0159 MH/LBS 2,000.00 MH [ 0.849 ] 142,804 66,542 209,346 030917 Abutment Tie-In and Infill Conc Transp Quan: 837.00 CY Hrs/Shft: 8.00 Cal: 508 WC: NONE
COTRUK Concrete Truck - Transport 55.80 CH Prod: 0.0000 Lab Pcs: 3.00 Eqp Pcs: 3.008TKCONC 10 CY Concrete Mixer T 3.00 167.40 HR 90.000 15,066 15,066TDTR Truck Driver (Transport) 3.00 167.40 MH 60.687 10,159 10,159$25,225.13 0.2000 MH/CY 167.40 MH [ 10.84 ] 10,159 15,066 25,225 030920 Abutment Tie-In and Infil Place & Finish Quan: 837.00 CY Hrs/Shft: 8.00 Cal: 508 WC: NONE
3766 SF x 6' raise = 837CY
C2 CONCRETE PLACING CREW 55.80 CH Prod: 15.0000 UH Lab Pcs: 5.00 Eqp Pcs: 0.002CONCRETE Batched Concrete@106% 837.00 CY 212.000 177,444 177,444CEF Concrete Foreman 1.00 55.80 MH 73.855 4,121 4,121CEFIN Concrete Finisher 2.00 111.60 MH 71.385 7,967 7,967LABRA Laborer General 2.00 111.60 MH 68.014 7,590 7,590$197,122.21 0.3333 MH/CY 279.00 MH [ 17.353 ] 19,678 177,444 197,122

McMillen, LLC Page 172012-12 Swan Lake Project - Dam and Power Plant 02/21/2012 9:37Curtis Neibaur Cost Report Activity Desc Quantity Unit Perm Constr Equip Sub-
Resource Pcs Unit Cost Labor Material Matl/Exp Ment Contract Total BID ITEM = 3460 Description = TIE TO RIGHT ABUTMENT Unit = LS Takeoff Quan: 1.000 Engr Quan: 0.000
030930 Abutment Tie-In and Infil Protect & Cure Quan: 837.00 CY Hrs/Shft: 8.00 Cal: 508 WC: NONE
LABG GENERAL LABOR CREW 40.00 CH Prod: 0.0000 Lab Pcs: 2.00 Eqp Pcs: 0.003BLANKET Concrete Blankets@106% 20.00 CY 79.500 1,590 1,5903CURE Concrete Cure@106% 837.00 CY 5.300 4,436 4,436LABRA Laborer General 2.00 80.00 MH 68.014 5,441 5,441$11,467.28 0.0955 MH/CY 80.00 MH [ 4.781 ] 5,441 6,026 11,467 =====> Item Totals: 3460 - TIE TO RIGHT ABUTMENT$479,286.55 2,901.4000 MH/LS 2,901.40 MH [ 154476.68 ] 205,464 243,986 14,771 15,066 479,287479,286.550 1 LS 205,463.95
243,985.50
14,771.10 15,066.00 479,286.55 BID ITEM = 3465 Description = REGRADE ROADWAY Unit = LS Takeoff Quan: 1.000 Engr Quan: 0.000
310050 Selective Demolition Quan: 1.00 LS Hrs/Shft: 8.00 Cal: 508 WC: NONE
4DEMOLITION Demolition 245.00 CY 150.000 36,750 36,750 320380 Pit Run - Asphalt On Site Quan: 1,100.00 CY Hrs/Shft: 8.00 Cal: 508 WC: NONE
6' raise. begin slope 300' to catch slope.
300' x 6'(.5) x 22' = 733 CY of pit run
EX350 JD 350D EXCAVATOR CREW 55.00 CH Prod: 20.0000 UH Lab Pcs: 3.00 Eqp Pcs: 1.002PITRUN Pitrun Material -@106% 1,100.00 CY 79.500 87,450 87,4508LO624 MCM JD624 - 4 YD Bucke 1.00 55.00 HR 69.860 3,842 3,842LABRG Laborer Gradechecker 2.00 110.00 MH 68.014 7,482 7,482OPLO Operator Loader 1.00 55.00 MH 68.449 3,765 3,765$102,538.65 0.1500 MH/CY 165.00 MH [ 7.824 ] 11,246 87,450 3,842 102,539 320240 3/4" Road Mix - Asphalt On Site Quan: 185.00 CY Hrs/Shft: 8.00 Cal: 508 WC: NONE
EX350 JD 350D EXCAVATOR CREW 18.50 CH Prod: 10.0000 UH Lab Pcs: 3.00 Eqp Pcs: 1.002ROADMIX 3/4" Roadmix@106% 185.00 CY 100.700 18,630 18,6308LO624 MCM JD624 - 4 YD Bucke 1.00 18.50 HR 69.860 1,292 1,292LABRG Laborer Gradechecker 2.00 37.00 MH 68.014 2,517 2,517OPLO Operator Loader 1.00 18.50 MH 68.449 1,266 1,266$23,704.77 0.3000 MH/CY 55.50 MH [ 15.647 ] 3,783 18,630 1,292 23,705 030740 Slab on Grade Form & Strip Quan: 1,500.00 SFC Hrs/Shft: 8.00 Cal: 508 WC: NONE
300' x 1' x 22' = 245 CY topslab.
C3 CONCRETE WALL FORMING CREW 36.00 CH Prod: 0.0000 Lab Pcs: 6.00 Eqp Pcs: 0.003FORMWORK Dam Crest Formwor@106 1,500.00 SFCA 3.180 4,770 4,770CARPE Carpenter 4.00 144.00 MH 75.098 10,814 10,814CEF Concrete Foreman 1.00 36.00 MH 73.855 2,659 2,659LABRA Laborer General 1.00 36.00 MH 68.014 2,449 2,449$20,691.52 0.1440 MH/SFCA 216.00 MH [ 7.878 ] 15,922 4,770 20,692 030742 Reinforcing Steel for Topslab Quan: 55,125.00 LBS Hrs/Shft: 8.00 Cal: 508 WC: NONE
245 CY x 150 lbs/CY = 36750 lbs.
C5 REBAR CREW 225.00 CH Prod: 0.0000 Lab Pcs: 4.00 Eqp Pcs: 0.002REBAR Reinforcing Steel@106% 55,125.00 LBS 0.530 29,216 29,216IWREINF Ironworker Reinforcing Stee 2.00 450.00 MH 74.789 33,655 33,655
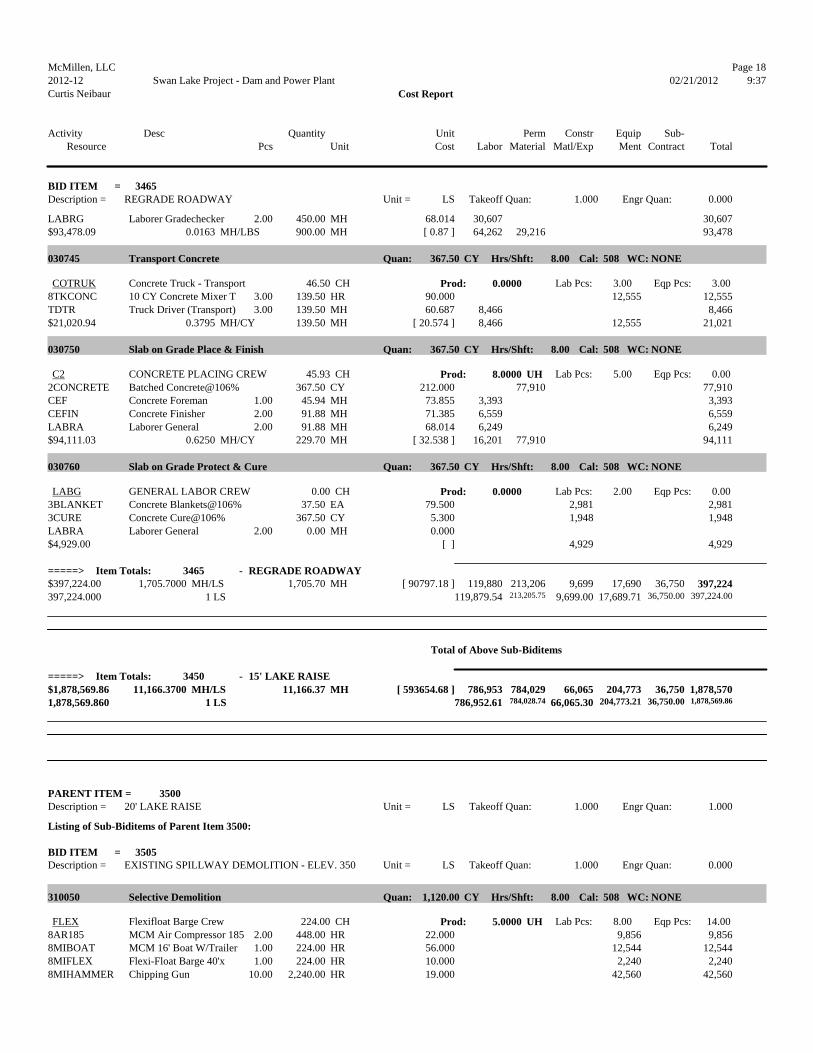
McMillen, LLC Page 182012-12 Swan Lake Project - Dam and Power Plant 02/21/2012 9:37Curtis Neibaur Cost Report Activity Desc Quantity Unit Perm Constr Equip Sub-
Resource Pcs Unit Cost Labor Material Matl/Exp Ment Contract Total BID ITEM = 3465 Description = REGRADE ROADWAY Unit = LS Takeoff Quan: 1.000 Engr Quan: 0.000
LABRG Laborer Gradechecker 2.00 450.00 MH 68.014 30,607 30,607$93,478.09 0.0163 MH/LBS 900.00 MH [ 0.87 ] 64,262 29,216 93,478 030745 Transport Concrete Quan: 367.50 CY Hrs/Shft: 8.00 Cal: 508 WC: NONE
COTRUK Concrete Truck - Transport 46.50 CH Prod: 0.0000 Lab Pcs: 3.00 Eqp Pcs: 3.008TKCONC 10 CY Concrete Mixer T 3.00 139.50 HR 90.000 12,555 12,555TDTR Truck Driver (Transport) 3.00 139.50 MH 60.687 8,466 8,466$21,020.94 0.3795 MH/CY 139.50 MH [ 20.574 ] 8,466 12,555 21,021 030750 Slab on Grade Place & Finish Quan: 367.50 CY Hrs/Shft: 8.00 Cal: 508 WC: NONE
C2 CONCRETE PLACING CREW 45.93 CH Prod: 8.0000 UH Lab Pcs: 5.00 Eqp Pcs: 0.002CONCRETE Batched Concrete@106% 367.50 CY 212.000 77,910 77,910CEF Concrete Foreman 1.00 45.94 MH 73.855 3,393 3,393CEFIN Concrete Finisher 2.00 91.88 MH 71.385 6,559 6,559LABRA Laborer General 2.00 91.88 MH 68.014 6,249 6,249$94,111.03 0.6250 MH/CY 229.70 MH [ 32.538 ] 16,201 77,910 94,111 030760 Slab on Grade Protect & Cure Quan: 367.50 CY Hrs/Shft: 8.00 Cal: 508 WC: NONE
LABG GENERAL LABOR CREW 0.00 CH Prod: 0.0000 Lab Pcs: 2.00 Eqp Pcs: 0.003BLANKET Concrete Blankets@106% 37.50 EA 79.500 2,981 2,9813CURE Concrete Cure@106% 367.50 CY 5.300 1,948 1,948LABRA Laborer General 2.00 0.00 MH 0.000 $4,929.00 [ ] 4,929 4,929 =====> Item Totals: 3465 - REGRADE ROADWAY$397,224.00 1,705.7000 MH/LS 1,705.70 MH [ 90797.18 ] 119,880 213,206 9,699 17,690 36,750 397,224397,224.000 1 LS 119,879.54
213,205.75
9,699.00 17,689.71
36,750.00
397,224.00
Total of Above Sub-Biditems =====> Item Totals: 3450 - 15' LAKE RAISE$1,878,569.86 11,166.3700 MH/LS 11,166.37 MH [ 593654.68 ] 786,953 784,029 66,065 204,773 36,750 1,878,5701,878,569.860 1 LS 786,952.61
784,028.74
66,065.30
204,773.21
36,750.00
1,878,569.86
PARENT ITEM = 3500 Description = 20' LAKE RAISE Unit = LS Takeoff Quan: 1.000 Engr Quan: 1.000
Listing of Sub-Biditems of Parent Item 3500: BID ITEM = 3505 Description = EXISTING SPILLWAY DEMOLITION - ELEV. 350 Unit = LS Takeoff Quan: 1.000 Engr Quan: 0.000
310050 Selective Demolition Quan: 1,120.00 CY Hrs/Shft: 8.00 Cal: 508 WC: NONE
FLEX Flexifloat Barge Crew 224.00 CH Prod: 5.0000 UH Lab Pcs: 8.00 Eqp Pcs: 14.008AR185 MCM Air Compressor 185 2.00 448.00 HR 22.000 9,856 9,8568MIBOAT MCM 16' Boat W/Trailer 1.00 224.00 HR 56.000 12,544 12,5448MIFLEX Flexi-Float Barge 40'x 1.00 224.00 HR 10.000 2,240 2,2408MIHAMMER Chipping Gun 10.00 2,240.00 HR 19.000 42,560 42,560

McMillen, LLC Page 192012-12 Swan Lake Project - Dam and Power Plant 02/21/2012 9:37Curtis Neibaur Cost Report Activity Desc Quantity Unit Perm Constr Equip Sub-
Resource Pcs Unit Cost Labor Material Matl/Exp Ment Contract Total BID ITEM = 3505 Description = EXISTING SPILLWAY DEMOLITION - ELEV. 350 Unit = LS Takeoff Quan: 1.000 Engr Quan: 0.000
IWPILE Piledriver/Pilebuck 8.00 1,792.00 MH 65.703 117,741 117,741$184,941.20 1.6000 MH/CY 1,792.00 MH [ 86.752 ] 117,741 67,200 184,941 =====> Item Totals: 3505 - EXISTING SPILLWAY DEMOLITION - ELEV. 350$184,941.20 1,792.0000 MH/LS 1,792.00 MH [ 97162.24 ] 117,741 67,200 184,941184,941.200 1 LS 117,741.20 67,200.00 184,941.20 BID ITEM = 3508 Description = CONCRETE SPILLWAY RAISE - ELEV. 350 Unit = LS Takeoff Quan: 1.000 Engr Quan: 0.000
030460 Spillway Form & Strip Quan: 7,625.00 SFC Hrs/Shft: 8.00 Cal: 508 WC: NONE
C3 CONCRETE WALL FORMING CREW 0.00 CH Prod: 0.0000 Lab Pcs: 8.00 Eqp Pcs: 1.003FORMWORK Dam Crest Formwor@106 7,625.00 SFCA 3.710 28,289 28,2898CRTOWER Tower Crane 1.00 0.00 HR 0.000 CARPE Carpenter 4.00 0.00 MH 0.000 CEF Concrete Foreman 1.00 0.00 MH 0.000 LABRA Laborer General 2.00 0.00 MH 0.000 OPCRANE Operator Crane 1.00 0.00 MH 0.000 $28,288.75 [ ] 28,289 28,289 030465 Spillway Reinforcing Steel Quan:
168,000.00
LBS Hrs/Shft: 8.00 Cal: 508 WC: NONE
1120 CY x 150 lbs/CY = 168,000 lbs.
C5 REBAR CREW 0.00 CH Prod: 0.0000 Lab Pcs: 4.00 Eqp Pcs: 0.002REBAR Reinforcing Steel@106% 168,000.00 LBS 0.530 89,040 89,040IWREINF Ironworker Reinforcing Stee 2.00 0.00 MH 0.000 LABRG Laborer Gradechecker 2.00 0.00 MH 0.000 $89,040.00 [ ] 89,040 89,040 030468 Spillway Transport Concrete Quan: 1,120.00 CY Hrs/Shft: 8.00 Cal: 508 WC: NONE
COTRUK Concrete Truck - Transport 224.00 CH Prod: 5.0000 UH Lab Pcs: 3.00 Eqp Pcs: 3.008TKCONC 10 CY Concrete Mixer T 3.00 672.00 HR 90.000 60,480 60,480TDTR Truck Driver (Transport) 3.00 672.00 MH 60.687 40,782 40,782$101,262.16 0.6000 MH/CY 672.00 MH [ 32.52 ] 40,782 60,480 101,262 030470 Spillway Place & Finish Quan: 1,120.00 CY Hrs/Shft: 8.00 Cal: 508 WC: NONE
C2 CONCRETE PLACING CREW 224.00 CH Prod: 5.0000 UH Lab Pcs: 5.00 Eqp Pcs: 0.002CONCRETE Batched Concrete@106% 1,120.00 CY 212.000 237,440 237,440CEF Concrete Foreman 1.00 224.00 MH 73.855 16,544 16,544CEFIN Concrete Finisher 2.00 448.00 MH 71.385 31,981 31,981LABRA Laborer General 2.00 448.00 MH 68.014 30,471 30,471$316,434.96 1.0000 MH/CY 1,120.00 MH [ 52.058 ] 78,995 237,440 316,435 030480 Spillway Protect & Cure Quan: 1,120.00 CY Hrs/Shft: 8.00 Cal: 508 WC: NONE
LABG GENERAL LABOR CREW 200.00 CH Prod: 0.0000 Lab Pcs: 2.00 Eqp Pcs: 0.003BLANKET Concrete Blankets@106% 50.00 EA 79.500 3,975 3,9753CURE Concrete Cure@106% 1,120.00 CY 5.300 5,936 5,936LABRA Laborer General 2.00 400.00 MH 68.014 27,206 27,206$37,116.88 0.3571 MH/CY 400.00 MH [ 17.864 ] 27,206 9,911 37,117 030490 Spillway Point & Patch Quan: 7,625.00 SFC Hrs/Shft: 8.00 Cal: 508 WC: NONE

McMillen, LLC Page 202012-12 Swan Lake Project - Dam and Power Plant 02/21/2012 9:37Curtis Neibaur Cost Report Activity Desc Quantity Unit Perm Constr Equip Sub-
Resource Pcs Unit Cost Labor Material Matl/Exp Ment Contract Total BID ITEM = 3508 Description = CONCRETE SPILLWAY RAISE - ELEV. 350 Unit = LS Takeoff Quan: 1.000 Engr Quan: 0.000
LABG GENERAL LABOR CREW 60.00 CH Prod: 0.0000 Lab Pcs: 4.00 Eqp Pcs: 0.00LABRA Laborer General 4.00 240.00 MH 68.014 16,324 16,324$16,323.53 0.0314 MH/SFCA 240.00 MH [ 1.574 ] 16,324 16,324 =====> Item Totals: 3508 - CONCRETE SPILLWAY RAISE - ELEV. 350$588,466.28 2,432.0000 MH/LS 2,432.00 MH [ 126740.16 ] 163,307 326,480 38,200 60,480 588,466588,466.280 1 LS 163,306.53
326,480.00
38,199.75 60,480.00 588,466.28 BID ITEM = 3510 Description = CONCRETE SUPPORT ABUTMENT - ELEV. 350 Unit = LS Takeoff Quan: 1.000 Engr Quan: 0.000
030200 New Support Abutment Form & Strip Quan: 2,703.00 SFC Hrs/Shft: 8.00 Cal: 508 WC: NONE
C3 CONCRETE WALL FORMING CREW 76.35 CH Prod: 0.0000 Lab Pcs: 8.00 Eqp Pcs: 1.003FORMWORK Dam Crest Formwor@106 2,703.00 SFCA 4.770 12,893 12,8938CRTOWER Tower Crane 1.00 76.36 HR 300.000 22,908 22,908CARPE Carpenter 4.00 305.42 MH 75.098 22,937 22,937CEF Concrete Foreman 1.00 76.36 MH 73.855 5,640 5,640LABRA Laborer General 2.00 152.71 MH 68.014 10,387 10,387OPCRANE Operator Crane 1.00 76.36 MH 76.834 5,867 5,867$80,631.12 0.2259 MH/SFCA 610.85 MH [ 12.329 ] 44,830 12,893 22,908 80,631 030205 New Support Abutment Reinforcing Steel Quan: 73,350.00 LBS Hrs/Shft: 8.00 Cal: 508 WC: NONE
C5 REBAR CREW 312.03 CH Prod: 58.7667 UM Lab Pcs: 4.00 Eqp Pcs: 0.002REBAR Reinforcing Steel@106% 73,350.00 LBS 0.530 38,876 38,876IWREINF Ironworker Reinforcing Stee 2.00 624.08 MH 74.789 46,675 46,675LABRG Laborer Gradechecker 2.00 624.08 MH 68.014 42,447 42,447$127,996.68 0.0170 MH/LBS 1,248.16 MH [ 0.907 ] 89,121 38,876 127,997 030207 New Support Abutment Transport Concrete Quan: 489.00 CY Hrs/Shft: 8.00 Cal: 508 WC: NONE
COTRUK Concrete Truck - Transport 97.80 CH Prod: 0.0000 Lab Pcs: 3.00 Eqp Pcs: 3.008TKCONC 10 CY Concrete Mixer T 3.00 293.40 HR 90.000 26,406 26,406TDTR Truck Driver (Transport) 3.00 293.40 MH 60.687 17,806 17,806$44,211.78 0.6000 MH/CY 293.40 MH [ 32.52 ] 17,806 26,406 44,212 030210 New Support Abutment Place & Finish Quan: 489.00 CY Hrs/Shft: 8.00 Cal: 508 WC: NONE
C2 CONCRETE PLACING CREW 97.80 CH Prod: 5.0000 UH Lab Pcs: 8.00 Eqp Pcs: 9.002CONCRETE Batched Concrete@106% 489.00 CY 212.000 103,668 103,6688MIBOAT MCM 16' Boat W/Trailer 1.00 97.80 HR 56.000 5,477 5,4778MIFLEX Flexi-Float Barge 40'x 6.00 586.80 HR 10.000 5,868 5,8688MIPUMP Concrete Line Pump 2.00 195.60 HR 100.000 19,560 19,560CEF Concrete Foreman 1.00 97.80 MH 73.855 7,223 7,223CEFIN Concrete Finisher 4.00 391.20 MH 71.385 27,926 27,926LABRA Laborer General 3.00 293.40 MH 68.014 19,956 19,956$189,677.45 1.6000 MH/CY 782.40 MH [ 83.162 ] 55,105 103,668 30,905 189,677 030220 New Support Abutment Protect & Cure Quan: 489.00 CY Hrs/Shft: 8.00 Cal: 508 WC: NONE
LABG GENERAL LABOR CREW 55.47 CH Prod: 0.0000 Lab Pcs: 4.00 Eqp Pcs: 0.003BLANKET Concrete Blankets@106% 27.74 EA 79.500 2,205 2,2053CURE Concrete Cure@106% 489.00 CY 5.300 2,592 2,592LABRA Laborer General 4.00 221.89 MH 68.014 15,092 15,092$19,888.81 0.4537 MH/CY 221.89 MH [ 22.697 ] 15,092 4,797 19,889

McMillen, LLC Page 212012-12 Swan Lake Project - Dam and Power Plant 02/21/2012 9:37Curtis Neibaur Cost Report Activity Desc Quantity Unit Perm Constr Equip Sub-
Resource Pcs Unit Cost Labor Material Matl/Exp Ment Contract Total BID ITEM = 3510 Description = CONCRETE SUPPORT ABUTMENT - ELEV. 350 Unit = LS Takeoff Quan: 1.000 Engr Quan: 0.000
030230 New Support Abutment Point & Patch Quan: 2,703.00 SFC Hrs/Shft: 8.00 Cal: 508 WC: NONE
LABG GENERAL LABOR CREW 6.75 CH Prod: 100.0000 UM Lab Pcs: 4.00 Eqp Pcs: 0.002PATCH Concrete Patch@106% 2,703.00 SFCA 0.795 2,149 2,149LABRA Laborer General 4.00 27.03 MH 68.014 1,838 1,838$3,987.33 0.0100 MH/SFCA 27.03 MH [ 0.5 ] 1,838 2,149 3,987 =====> Item Totals: 3510 - CONCRETE SUPPORT ABUTMENT - ELEV. 350$466,393.17 3,183.7300 MH/LS 3,183.73 MH [ 168860.39 ] 223,792 144,692 17,690 80,219 466,393466,393.170 1 LS 223,791.64
144,692.39
17,690.34 80,218.80 466,393.17 BID ITEM = 3515 Description = CONCRETE CREST RAISE - ELEV. 350 Unit = LS Takeoff Quan: 1.000 Engr Quan: 0.000
030200 Dam Crest Form & Strip Quan: 9,520.00 SFC Hrs/Shft: 8.00 Cal: 508 WC: NONE
340 lf x 14' x 2 sides = 9520 SFCA
C3 CONCRETE WALL FORMING CREW
268.92
CH Prod: 0.0000 Lab Pcs: 7.00 Eqp Pcs: 1.003FORMWORK Dam Crest Formwor@106 9,520.00 SFCA 4.770 45,410 45,4108CRTOWER Tower Crane 1.00 268.93 HR 300.000 80,679 80,679CARPE Carpenter 4.00 1,075.71 MH 75.098 80,784 80,784CEF Concrete Foreman 1.00 268.93 MH 73.855 19,862 19,862LABRA Laborer General 2.00 537.85 MH 68.014 36,582 36,582$263,317.33 0.1977 MH/SFCA 1,882.49 MH [ 10.686 ] 137,228 45,410 80,679 263,317 030205 Dam Crest Reinforcing Steel Quan:
159,000.00
LBS Hrs/Shft: 8.00 Cal: 508 WC: NONE
1060 CY x 150 lbs/CY = 159,000 lbs.
C5 REBAR CREW 676.40 CH Prod: 58.7667 UM Lab Pcs: 4.00 Eqp Pcs: 0.002REBAR Reinforcing Steel@106% 159,000.00 LBS 0.530 84,270 84,270IWREINF Ironworker Reinforcing Stee 2.00 1,352.81 MH 74.789 101,176 101,176LABRG Laborer Gradechecker 2.00 1,352.81 MH 68.014 92,011 92,011$277,456.81 0.0170 MH/LBS 2,705.62 MH [ 0.907 ] 193,187 84,270 277,457 030207 Dam Crest Transport Concrete Quan: 1,060.00 CY Hrs/Shft: 8.00 Cal: 508 WC: NONE
COTRUK Concrete Truck - Transport 211.63 CH Prod: 0.0000 Lab Pcs: 3.00 Eqp Pcs: 3.008TKCONC 10 CY Concrete Mixer T 3.00 634.92 HR 90.000 57,143 57,143TDTR Truck Driver (Transport) 3.00 634.92 MH 60.687 38,532 38,532$95,674.66 0.5989 MH/CY 634.92 MH [ 32.465 ] 38,532 57,143 95,675 030210 Dam Crest Place & Finish Quan: 1,060.00 CY Hrs/Shft: 8.00 Cal: 508 WC: NONE
340 lf x 14' x 6' = 1060 CY
C2 CONCRETE PLACING CREW 212.00 CH Prod: 5.0000 UH Lab Pcs: 8.00 Eqp Pcs: 9.002CONCRETE Batched Concrete@106% 1,060.00 CY 212.000 224,720 224,7208MIBOAT MCM 16' Boat W/Trailer 1.00 212.00 HR 56.000 11,872 11,8728MIFLEX Flexi-Float Barge 40'x 6.00 1,272.00 HR 10.000 12,720 12,7208MIPUMP Concrete Line Pump 2.00 424.00 HR 100.000 42,400 42,400CEF Concrete Foreman 1.00 212.00 MH 73.855 15,657 15,657CEFIN Concrete Finisher 4.00 848.00 MH 71.385 60,535 60,535LABRA Laborer General 3.00 636.00 MH 68.014 43,257 43,257$411,161.74 1.6000 MH/CY 1,696.00 MH [ 83.162 ] 119,450 224,720 66,992 411,162 030220 Dam Crest Protect & Cure Quan: 1,060.00 CY Hrs/Shft: 8.00 Cal: 508 WC: NONE

McMillen, LLC Page 222012-12 Swan Lake Project - Dam and Power Plant 02/21/2012 9:37Curtis Neibaur Cost Report Activity Desc Quantity Unit Perm Constr Equip Sub-
Resource Pcs Unit Cost Labor Material Matl/Exp Ment Contract Total BID ITEM = 3515 Description = CONCRETE CREST RAISE - ELEV. 350 Unit = LS Takeoff Quan: 1.000 Engr Quan: 0.000
LABG GENERAL LABOR CREW 120.24 CH Prod: 0.0000 Lab Pcs: 4.00 Eqp Pcs: 0.003BLANKET Concrete Blankets@106% 60.12 EA 79.500 4,780 4,7803CURE Concrete Cure@106% 1,060.00 CY 5.300 5,618 5,618LABRA Laborer General 4.00 481.00 MH 68.014 32,715 32,715$43,112.61 0.4537 MH/CY 481.00 MH [ 22.698 ] 32,715 10,398 43,113 030230 Dam Crest Point & Patch Quan: 9,520.00 SFC Hrs/Shft: 8.00 Cal: 508 WC: NONE
LABG GENERAL LABOR CREW 23.80 CH Prod: 100.0000 UM Lab Pcs: 4.00 Eqp Pcs: 0.002PATCH Concrete Patch@106% 9,520.00 SFCA 0.795 7,568 7,568LABRA Laborer General 4.00 95.20 MH 68.014 6,475 6,475$14,043.40 0.0100 MH/SFCA 95.20 MH [ 0.5 ] 6,475 7,568 14,043 050150 Handrails & Railings Quan: 680.00 LF Hrs/Shft: 8.00 Cal: 508 WC: NONE
IRON Ironworker Crew 85.00 CH Prod: 0.0000 Lab Pcs: 2.00 Eqp Pcs: 1.002HANDRAIL Metal Handrail@106% 680.00 LF 68.900 46,852 46,8528FL12000 Forklift-12000 lb 1.00 85.00 HR 49.100 4,174 4,174IWSTR Ironworker Structural Steel 1.00 85.00 MH 74.789 6,357 6,357OPFL Operator Forklift 1.00 85.00 MH 68.449 5,818 5,818$63,200.82 0.2500 MH/LF 170.00 MH [ 14.124 ] 12,175 46,852 4,174 63,201 =====> Item Totals: 3515 - CONCRETE CREST RAISE - ELEV. 350$1,167,967.37 7,665.2300 MH/LS 7,665.23 MH [ 406899.64 ] 539,762 363,410 55,808 208,987 1,167,9671,167,967.370 1 LS 539,761.73
363,410.40
55,807.94
208,987.30
1,167,967.37 BID ITEM = 3520 Description = TIE TO RIGHT ABUTMENT Unit = LS Takeoff Quan: 1.000 Engr Quan: 0.000
030910 Abutment Tie-In and Infill Form & Strip Quan: 7,000.00 SFC Hrs/Shft: 8.00 Cal: 508 WC: NONE
C3 CONCRETE WALL FORMING CREW
218.75
CH Prod: 8.0000 UM Lab Pcs: 4.00 Eqp Pcs: 0.003FORMWORK Dam Crest Formwor@106 7,000.00 SFCA 2.915 20,405 20,405CARPE Carpenter 2.00 437.50 MH 75.098 32,856 32,856CEF Concrete Foreman 1.00 218.75 MH 73.855 16,156 16,156LABRA Laborer General 1.00 218.75 MH 68.014 14,878 14,878$84,294.72 0.1250 MH/SFCA 875.00 MH [ 6.766 ] 63,890 20,405 84,295 030915 Abutment Tie-In and Infill Rebar Quan:
292,949.00
LBS Hrs/Shft: 8.00 Cal: 508 WC: NONE
C5 REBAR CREW 1,166.66 CH Prod: 0.0000 Lab Pcs: 4.00 Eqp Pcs: 0.002REBAR Reinforcing Steel@106% 292,949.00 LBS 0.530 155,263 155,263IWREINF Ironworker Reinforcing Stee 2.00 2,333.33 MH 74.789 174,508 174,508LABRG Laborer Gradechecker 2.00 2,333.33 MH 68.014 158,701 158,701$488,472.06 0.0159 MH/LBS 4,666.66 MH [ 0.849 ] 333,209 155,263 488,472 030917 Abutment Tie-In and Infill Conc Transp Quan: 1,953.00 CY Hrs/Shft: 8.00 Cal: 508 WC: NONE
COTRUK Concrete Truck - Transport 130.20 CH Prod: 0.0000 Lab Pcs: 3.00 Eqp Pcs: 3.008TKCONC 10 CY Concrete Mixer T 3.00 390.60 HR 90.000 35,154 35,154TDTR Truck Driver (Transport) 3.00 390.60 MH 60.687 23,705 23,705$58,858.63 0.2000 MH/CY 390.60 MH [ 10.84 ] 23,705 35,154 58,859 030920 Abutment Tie-In and Infil Place & Finish Quan: 1,953.00 CY Hrs/Shft: 8.00 Cal: 508 WC: NONE
C2 CONCRETE PLACING CREW 130.20 CH Prod: 15.0000 UH Lab Pcs: 5.00 Eqp Pcs: 0.00

McMillen, LLC Page 232012-12 Swan Lake Project - Dam and Power Plant 02/21/2012 9:37Curtis Neibaur Cost Report Activity Desc Quantity Unit Perm Constr Equip Sub-
Resource Pcs Unit Cost Labor Material Matl/Exp Ment Contract Total BID ITEM = 3520 Description = TIE TO RIGHT ABUTMENT Unit = LS Takeoff Quan: 1.000 Engr Quan: 0.000
2CONCRETE Batched Concrete@106% 1,953.00 CY 212.000 414,036 414,036CEF Concrete Foreman 1.00 130.20 MH 73.855 9,616 9,616CEFIN Concrete Finisher 2.00 260.40 MH 71.385 18,589 18,589LABRA Laborer General 2.00 260.40 MH 68.014 17,711 17,711$459,951.83 0.3333 MH/CY 651.00 MH [ 17.353 ] 45,916 414,036 459,952 030930 Abutment Tie-In and Infil Protect & Cure Quan: 1,953.00 CY Hrs/Shft: 8.00 Cal: 508 WC: NONE
LABG GENERAL LABOR CREW 93.33 CH Prod: 0.0000 Lab Pcs: 2.00 Eqp Pcs: 0.003BLANKET Concrete Blankets@106% 46.67 CY 79.500 3,710 3,7103CURE Concrete Cure@106% 1,953.00 CY 5.300 10,351 10,351LABRA Laborer General 2.00 186.67 MH 68.014 12,696 12,696$26,757.47 0.0955 MH/CY 186.67 MH [ 4.781 ] 12,696 14,061 26,757 =====> Item Totals: 3520 - TIE TO RIGHT ABUTMENT$1,118,334.71 6,769.9300 MH/LS 6,769.93 MH [ 360445.39 ] 479,416 569,299 34,466 35,154 1,118,3351,118,334.710 1 LS 479,415.57
569,298.97
34,466.17 35,154.00 1,118,334.71 BID ITEM = 3525 Description = REGRADE ROADWAY Unit = LS Takeoff Quan: 1.000 Engr Quan: 0.000
310050 Selective Demolition Quan: 1.00 LS Hrs/Shft: 8.00 Cal: 508 WC: NONE
4DEMOLITION Demolition 245.00 CY 150.000 36,750 36,750 320380 Pit Run - Asphalt On Site Quan: 2,562.00 CY Hrs/Shft: 8.00 Cal: 508 WC: NONE
EX350 JD 350D EXCAVATOR CREW 128.10 CH Prod: 20.0000 UH Lab Pcs: 3.00 Eqp Pcs: 1.002PITRUN Pitrun Material -@106% 2,562.00 CY 79.500 203,679 203,6798LO624 MCM JD624 - 4 YD Bucke 1.00 128.10 HR 69.860 8,949 8,949LABRG Laborer Gradechecker 2.00 256.20 MH 68.014 17,425 17,425OPLO Operator Loader 1.00 128.10 MH 68.449 8,768 8,768$238,821.81 0.1500 MH/CY 384.30 MH [ 7.823 ] 26,194 203,679 8,949 238,822 320240 3/4" Road Mix - Asphalt On Site Quan: 430.50 CY Hrs/Shft: 8.00 Cal: 508 WC: NONE
EX350 JD 350D EXCAVATOR CREW 43.05 CH Prod: 10.0000 UH Lab Pcs: 3.00 Eqp Pcs: 1.002ROADMIX 3/4" Roadmix@106% 430.50 CY 100.700 43,351 43,3518LO624 MCM JD624 - 4 YD Bucke 1.00 43.05 HR 69.859 3,007 3,007LABRG Laborer Gradechecker 2.00 86.10 MH 68.014 5,856 5,856OPLO Operator Loader 1.00 43.05 MH 68.449 2,947 2,947$55,161.64 0.3000 MH/CY 129.15 MH [ 15.647 ] 8,803 43,351 3,007 55,162 030740 Slab on Grade Form & Strip Quan: 3,495.00 SFC Hrs/Shft: 8.00 Cal: 508 WC: NONE
C3 CONCRETE WALL FORMING CREW 83.88 CH Prod: 0.0000 Lab Pcs: 6.00 Eqp Pcs: 0.003FORMWORK Dam Crest Formwor@106 3,495.00 SFCA 3.180 11,114 11,114CARPE Carpenter 4.00 335.52 MH 75.098 25,197 25,197CEF Concrete Foreman 1.00 83.88 MH 73.855 6,195 6,195LABRA Laborer General 1.00 83.88 MH 68.014 5,705 5,705$48,211.24 0.1440 MH/SFCA 503.28 MH [ 7.878 ] 37,097 11,114 48,211 030742 Reinforcing Steel for Topslab Quan:
128,625.00
LBS Hrs/Shft: 8.00 Cal: 508 WC: NONE
C5 REBAR CREW 525.00 CH Prod: 0.0000 Lab Pcs: 4.00 Eqp Pcs: 0.002REBAR Reinforcing Steel@106% 128,625.00 LBS 0.530 68,171 68,171

McMillen, LLC Page 242012-12 Swan Lake Project - Dam and Power Plant 02/21/2012 9:37Curtis Neibaur Cost Report Activity Desc Quantity Unit Perm Constr Equip Sub-
Resource Pcs Unit Cost Labor Material Matl/Exp Ment Contract Total BID ITEM = 3525 Description = REGRADE ROADWAY Unit = LS Takeoff Quan: 1.000 Engr Quan: 0.000
IWREINF Ironworker Reinforcing Stee 2.00 1,050.00 MH 74.789 78,529 78,529LABRG Laborer Gradechecker 2.00 1,050.00 MH 68.014 71,415 71,415$218,115.56 0.0163 MH/LBS 2,100.00 MH [ 0.87 ] 149,944 68,171 218,116 030745 Transport Concrete Quan: 858.00 CY Hrs/Shft: 8.00 Cal: 508 WC: NONE
COTRUK Concrete Truck - Transport 110.00 CH Prod: 0.0000 Lab Pcs: 3.00 Eqp Pcs: 3.008TKCONC 10 CY Concrete Mixer T 3.00 330.00 HR 90.000 29,700 29,700TDTR Truck Driver (Transport) 3.00 330.00 MH 60.687 20,027 20,027$49,726.95 0.3846 MH/CY 330.00 MH [ 20.846 ] 20,027 29,700 49,727 030750 Slab on Grade Place & Finish Quan: 858.00 CY Hrs/Shft: 8.00 Cal: 508 WC: NONE
C2 CONCRETE PLACING CREW 107.25 CH Prod: 8.0000 UH Lab Pcs: 5.00 Eqp Pcs: 0.002CONCRETE Batched Concrete@106% 858.00 CY 212.000 181,896 181,896CEF Concrete Foreman 1.00 107.25 MH 73.855 7,921 7,921CEFIN Concrete Finisher 2.00 214.50 MH 71.385 15,312 15,312LABRA Laborer General 2.00 214.50 MH 68.014 14,589 14,589$219,718.38 0.6250 MH/CY 536.25 MH [ 32.536 ] 37,822 181,896 219,718 030760 Slab on Grade Protect & Cure Quan: 858.00 CY Hrs/Shft: 8.00 Cal: 508 WC: NONE
LABG GENERAL LABOR CREW 0.00 CH Prod: 0.0000 Lab Pcs: 2.00 Eqp Pcs: 0.003BLANKET Concrete Blankets@106% 87.56 EA 79.500 6,961 6,9613CURE Concrete Cure@106% 858.00 CY 5.300 4,547 4,547LABRA Laborer General 2.00 0.00 MH 0.000 $11,508.42 [ ] 11,508 11,508 =====> Item Totals: 3525 - REGRADE ROADWAY$878,014.00 3,982.9800 MH/LS 3,982.98 MH [ 212024.55 ] 279,887 497,098 22,623 41,657 36,750 878,014878,014.000 1 LS 279,887.35
497,097.60
22,622.52 41,656.53
36,750.00
878,014.00
Total of Above Sub-Biditems =====> Item Totals: 3500 - 20' LAKE RAISE$4,404,116.73 25,825.8700 MH/LS 25,825.87 MH [ 1372132.37 ] 1,803,904
1,900,979
168,787 493,697 36,750 4,404,1174,404,116.730 1 LS 1,803,904.02
1,900,979.36
168,786.72
493,696.63
36,750.00
4,404,116.73
BID ITEM = 4000 Description = OBERMEYER GATE INSTALLATION - 10' Unit = LS Takeoff Quan: 1.000 Engr Quan: 1.000
110060 Obermeyer Crest Gates Purchase Quan: 1.00 LS Hrs/Shft: 8.00 Cal: 508 WC: NONE
Obermeyer = 106' x 15' = 1590 SF
2OBERMEYER Obermeyer Gate@106% 1,378.00 SF 583.000 803,374 803,374 110061 Obermeyer Crest Gates Installation Quan: 1.00 LS Hrs/Shft: 8.00 Cal: 508 WC: NONE
GATE Gate Installation Crew 160.00 CH Prod: 0.0000 Lab Pcs: 7.50 Eqp Pcs: 8.508CRLBRT65 Link Belt Rough Terrai 0.50 80.00 HR 73.000 5,840 5,8408CRTOWER Tower Crane 1.00 160.00 HR 300.000 48,000 48,0008MIBOAT MCM 16' Boat W/Trailer 1.00 160.00 HR 56.000 8,960 8,960

McMillen, LLC Page 252012-12 Swan Lake Project - Dam and Power Plant 02/21/2012 9:37Curtis Neibaur Cost Report Activity Desc Quantity Unit Perm Constr Equip Sub-
Resource Pcs Unit Cost Labor Material Matl/Exp Ment Contract Total BID ITEM = 4000 Description = OBERMEYER GATE INSTALLATION - 10' Unit = LS Takeoff Quan: 1.000 Engr Quan: 1.000
8MIFLEX Flexi-Float Barge 40'x 6.00 960.00 HR 10.000 9,600 9,600IWPILE Piledriver/Pilebuck 6.00 960.00 MH 65.703 63,076 63,076OPCRANE Operator Crane 1.50 240.00 MH 76.834 18,440 18,440$153,915.91 1,200.0000 MH/LS 1,200.00 MH [ 66016.8 ] 81,516 72,400 153,916 110063 Obermeyer Crest Gates Mechanical System Quan: 1.00 LS Hrs/Shft: 8.00 Cal: 508 WC: NONE
4MECHANICAL Mechanical System 1.00 LS 80,000.000 80,000 80,000 110064 Obermeyer Crest Gates Electrical Quan: 1.00 LS Hrs/Shft: 8.00 Cal: 508 WC: NONE
4ELECTRICAL Electrical System 1.00 LS 75,000.000 75,000 75,000 110065 Obermeyer Crest Gates Testing Quan: 1.00 LS Hrs/Shft: 8.00 Cal: 508 WC: NONE
GATE Gate Installation Crew 40.00 CH Prod: 0.0000 Lab Pcs: 6.00 Eqp Pcs: 7.008MIBOAT MCM 16' Boat W/Trailer 1.00 40.00 HR 56.000 2,240 2,2408MIFLEX Flexi-Float Barge 40'x 6.00 240.00 HR 10.000 2,400 2,400IWPILE Piledriver/Pilebuck 6.00 240.00 MH 65.703 15,769 15,769$20,408.91 240.0000 MH/LS 240.00 MH [ 13012.8 ] 15,769 4,640 20,409 110066 Obermeyer Representative Quan: 1.00 LS Hrs/Shft: 8.00 Cal: 508 WC: NONE
4TECHNICIAN Gate Technician - Onsite 1.00 LS 30,000.000 30,000 30,000 =====> Item Totals: 4000 - OBERMEYER GATE INSTALLATION - 10'$1,162,698.82 1,440.0000 MH/LS 1,440.00 MH [ 79029.6 ] 97,285 803,374 77,040 185,000 1,162,6991,162,698.820 1 LS 97,284.82
803,374.00
77,040.00
185,000.00
1,162,698.82
BID ITEM = 4500 Description = OBERMEYER GATE INSTALLATION - 15' Unit = LS Takeoff Quan: 1.000 Engr Quan: 1.000
110060 Obermeyer Crest Gates Purchase Quan: 1.00 LS Hrs/Shft: 8.00 Cal: 508 WC: NONE
2OBERMEYER Obermeyer Gate@106% 1,908.00 SF 583.000 1,112,364 1,112,364 110061 Obermeyer Crest Gates Installation Quan: 1.00 LS Hrs/Shft: 8.00 Cal: 508 WC: NONE
GATE Gate Installation Crew 160.00 CH Prod: 0.0000 Lab Pcs: 7.50 Eqp Pcs: 8.508CRLBRT65 Link Belt Rough Terrai 0.50 80.00 HR 73.000 5,840 5,8408CRTOWER Tower Crane 1.00 160.00 HR 300.000 48,000 48,0008MIBOAT MCM 16' Boat W/Trailer 1.00 160.00 HR 56.000 8,960 8,9608MIFLEX Flexi-Float Barge 40'x 6.00 960.00 HR 10.000 9,600 9,600IWPILE Piledriver/Pilebuck 6.00 960.00 MH 65.703 63,076 63,076OPCRANE Operator Crane 1.50 240.00 MH 76.834 18,440 18,440$153,915.91 1,200.0000 MH/LS 1,200.00 MH [ 66016.8 ] 81,516 72,400 153,916 110063 Obermeyer Crest Gates Mechanical System Quan: 1.00 LS Hrs/Shft: 8.00 Cal: 508 WC: NONE
4MECHANICAL Mechanical System 1.00 LS 80,000.000 80,000 80,000 110064 Obermeyer Crest Gates Electrical Quan: 1.00 LS Hrs/Shft: 8.00 Cal: 508 WC: NONE
4ELECTRICAL Electrical System 1.00 LS 75,000.000 75,000 75,000 110065 Obermeyer Crest Gates Testing Quan: 1.00 LS Hrs/Shft: 8.00 Cal: 508 WC: NONE

McMillen, LLC Page 262012-12 Swan Lake Project - Dam and Power Plant 02/21/2012 9:37Curtis Neibaur Cost Report Activity Desc Quantity Unit Perm Constr Equip Sub-
Resource Pcs Unit Cost Labor Material Matl/Exp Ment Contract Total BID ITEM = 4500 Description = OBERMEYER GATE INSTALLATION - 15' Unit = LS Takeoff Quan: 1.000 Engr Quan: 1.000
GATE Gate Installation Crew 40.00 CH Prod: 0.0000 Lab Pcs: 6.00 Eqp Pcs: 7.008MIBOAT MCM 16' Boat W/Trailer 1.00 40.00 HR 56.000 2,240 2,2408MIFLEX Flexi-Float Barge 40'x 6.00 240.00 HR 10.000 2,400 2,400IWPILE Piledriver/Pilebuck 6.00 240.00 MH 65.703 15,769 15,769$20,408.91 240.0000 MH/LS 240.00 MH [ 13012.8 ] 15,769 4,640 20,409 110066 Obermeyer Representative Quan: 1.00 LS Hrs/Shft: 8.00 Cal: 508 WC: NONE
4TECHNICIAN Gate Technician - Onsite 1.00 LS 30,000.000 30,000 30,000 =====> Item Totals: 4500 - OBERMEYER GATE INSTALLATION - 15'$1,471,688.82 1,440.0000 MH/LS 1,440.00 MH [ 79029.6 ] 97,285
1,112,364
77,040 185,000 1,471,6891,471,688.820 1 LS 97,284.82
1,112,364.00
77,040.00
185,000.00
1,471,688.82
$16,187,748.99 *** Report Totals *** 58,883.72 MH 4,108,255 6,147,946 2,062,843 1,185,205
2,683,500
16,187,749
>>> indicates Non Additive Activity------Report Notes:------The estimate was prepared with TAKEOFF Quantities.This report shows TAKEOFF Quantities with the resources. Actual Unit Cost is used, which includes taxes, escalation, etc. Bid Date: Owner: Engineering Firm:
Estimator-In-Charge: DPC JOB NOTES
Estimate created on: 05/12/2011 by User#: 1 - Dean Clark
Source estimate used: H:\EST\ESTMAST
************Estimate created on: 12/21/2011 by User#: 3 - Todd Harper
Source estimate used: H:\EST\2011-MASTER
************Estimate created on: 02/16/2012 by User#: 2 - Curtis Neibaur
Source estimate used: H:\EST\2012-MASTER
* on units of MH indicate average labor unit cost was used rather than base rate.[ ] in the Unit Cost Column = Labor Unit Cost Without Labor Burdens
In equipment resources, rent % and EOE % not = 100% are represented as XXX%YYY where XXX=Rent% and YYY=EOE%
------Calendar Codes------508 40 HR WK (5 DAYS @ 8 HR/DAY) (Default Calendar)510 50 HR WK (5 DAYS@10 HR/DAY)610 60 HR WK (6 DAYS@10HRS/DAY)620 Try this one

PROJECT SCHEDULE

Activity Name Original
D ti
Start Finish
Swan Lake Dam and Power Plant - Crest Raise 299 01-Jan-13 21-Feb-14
NTP 1 01-Jan-13 01-Jan-13Preconstruction Submittals 90 02-Jan-13 07-May-13Procurement 100 13-Feb-13 02-Jul-13Early Preparatory Crew Mobilization 10 08-May-13 21-May-13Setup Mancamp 10 22-May-13 04-Jun-13Setup Batch Plant 8 22-May-13 31-May-13Calibrate and Test Batch Plant 10 03-Jun-13 14-Jun-13Full Project Crew Mobilization 15 17-Jun-13 05-Jul-13Assemble Flexi-Float Work Barge 5 08-Jul-13 12-Jul-13Install Upstream Work Platform 7 15-Jul-13 23-Jul-13Install Downstream Safety Rail 4 15-Jul-13 18-Jul-13Concrete Modifications to Dam Crest 30 19-Jul-13 29-Aug-13F/R/P Crest Raise - 1st Lift 30 16-Aug-13 26-Sep-13Reset Upstream Work Platform 10 20-Sep-13 03-Oct-13Reset Downstream Safety Rail 10 20-Sep-13 03-Oct-13F/R/P Crest Raise - 2nd Lift (If Necessary) 30 30-Sep-13 08-Nov-13Install Electrical for Obermeyer Gates 10 11-Nov-13 22-Nov-13Install Air Lines and Compressor for Obermeyer Gates 10 11-Nov-13 22-Nov-13Erect Scaffold or Work Platform at Intake Tower 10 11-Nov-13 22-Nov-13Install Metal Handrails at Dam Crest 10 11-Nov-13 22-Nov-13Install Anchor Bolts and Abutment Plates for Obermeyer Gates 10 25-Nov-13 06-Dec-13Concrete Modifications to Intake Tower 10 25-Nov-13 06-Dec-13Install Air Bladders and Steel Obermeyer Gates 15 09-Dec-13 27-Dec-13F/R/P Intake Tower - 1st Placement 15 09-Dec-13 27-Dec-13Adjust and Test Obermeyer Gates 5 30-Dec-13 03-Jan-14Reset Scaffold/Work Platform 5 30-Dec-13 03-Jan-14F/R/P Intake Tower - 2nd Placement 15 06-Jan-14 24-Jan-14Remove Flexi-Float Barges 5 27-Jan-14 31-Jan-14Disassemble Concret Batch Plant 5 03-Feb-14 07-Feb-14Disassemble Man Camp 5 03-Feb-14 07-Feb-14Equipment and Crew Demobilization 10 10-Feb-14 21-Feb-14
Jan Feb Mar Apr May Jun Jul Aug Sep Oct Nov Dec Jan Feb Mar Apr May Jun2013 2014
NTPPreconstruction Submittals
ProcurementEarly Preparatory Crew Mobilization
Setup MancampSetup Batch Plant
Calibrate and Test Batch PlantFull Project Crew Mobilization
Assemble Flexi-Float Work BargeInstall Upstream Work Platform
Install Downstream Safety RailConcrete Modifications to Dam Crest
F/R/P Crest Raise - 1st LiftReset Upstream Work PlatformReset Downstream Safety Rail
F/R/P Crest Raise - 2nd Lift (If Necessary)Install Electrical for Obermeyer GatesInstall Air Lines and Compressor for Obermeyer GatesErect Scaffold or Work Platform at Intake TowerInstall Metal Handrails at Dam Crest
Install Anchor Bolts and Abutment Plates for Obermeyer GatesConcrete Modifications to Intake Tower
Install Air Bladders and Steel Obermeyer GatesF/R/P Intake Tower - 1st Placement
Adjust and Test Obermeyer GatesReset Scaffold/Work Platform
F/R/P Intake Tower - 2nd PlacementRemove Flexi-Float Barges
Disassemble Concret Batch PlantDisassemble Man Camp
Equipment and Crew Demobilization
Actual Work
Remaining Work
Critical Remaining Work
Milestone
McMillen, LLC
Swan Lake Dam and Power Plant - Lake Raise Alternatives