Embed Size (px)
Citation preview


Southeastern Minnesota Water Analysis Laboratory MDH Lab ID:027-109-399
Page 2 of 34
Revision Record
Revision
#
Revisor Revision
Date
Description of Revision/Change Reviewed
by:
Date
Reviewed
Date
Effective
0 GKW 7/25/2005 New procedure EA 7/25/2005
1 GKW/EA 6/11/2007 MDH required corrections
2.0 GKW/EA 5/16/2009 SOP Update EA 5/26/2009 5/26/2009
2.1 EA/GW/LS 7/11/2011
3.0 EA 6/7/2012 QAM required changes CM 7/22/2012 7/24/2012
3.1 CM 9/26/2012 MDH required changes CM, TL,
EA
10/10/2012 10/10/2012
3.2 CM 8/9/2013 Annual Review CM, TL,
EK, CZ
8/9/2013 9/9/2013
4.0 EK/CZ 1/2014 Adding Nitrite Analyte CM, TL,
EK, CZ
1/2014 1/15/2014
5.0 BC 10/2014 Removed chart recorder from
procedure, changed eluent reservoir
size to 4L, Changed run preparation
order and added an IPC, Updated
Section 16.2 to include new
procedure for data transfer,
calculating QA acceptance criteria,
and importing data to the water
quality database.
CM, TL,
BC, EK,
TH
10/27/2014 10/28/2014
6.0 CM 4/2015 Added new ICS 1600
instrumentation. Updated to include
new data transfer procedure and
directions for operating the new ICS
1600 instrumentation.
CM, TL,
EK
4/2015 4/8/2015

Southeastern Minnesota Water Analysis Laboratory MDH Lab ID:027-109-399
Page 3 of 34
Table of Contents
Revision Record ..................................................................................................................................... 2 Table of Contents ................................................................................................................................... 3 1.0 Scope and Applicability ................................................................................................................... 4 2.0 Summary of Method ........................................................................................................................ 4 3.0 Definitions ....................................................................................................................................... 4 4.0 Interferences and Limitations .......................................................................................................... 6 5.0 Safety .............................................................................................................................................. 6 6.0 Equipment and Supplies ................................................................................................................. 6 7.0 Reagents and Standards ................................................................................................................. 7 8.0 Sample Collection, Preservation and Storage ................................................................................. 9 9.0 Quality Control ................................................................................................................................ 9 10.0 ICS-1600 Start-Up Procedure ..................................................................................................... 11 11.0 Sample Preparation .................................................................................................................... 14 12.0 Preparing the Run Sequence ...................................................................................................... 16 13.0 Data Processing: ICS-1600 .......................................................................................................... 21 14.0 Dilution of Samples with Off-Scale Peaks .................................................................................... 28 15.0 Post Processing & Quality Control Check of Chromeleon Data ................................................... 29 16.0 Methods for Checking Calculations and Data Transfer ................................................................ 33 17.0 Records, Retention and Retrieval ................................................................................................ 33 18.0 Pollution Prevention .................................................................................................................... 34 19.0 Waste Management .................................................................................................................... 34 20.0 Method Reference ....................................................................................................................... 34 ATTACHMENT 1: ICS-1600 Column Cleaning Procedure
Southeastern Minnesota Water Analysis Laboratory MDH Lab ID:027-109-399
Page 4 of 34
1.0 SCOPE AND APPLICABILITY
This analytical method is valid for water; including groundwater, surface water, and samples from municipal drinking water systems for the following inorganic anions: Nitrite-nitrogen, chloride, fluoride, sulfate, and nitrate-nitrogen.
2.0 SUMMARY OF METHOD
2.1 A small volume of sample, typically 2-3 mL, is introduced into an ion chromatograph. The anions of interest are separated and measured, using a system comprised of a guard column, analytical column, suppressor device and conductivity detector.
2.2 Limited performance-based method modifications may be acceptable provided they are fully documented and meet or exceed the requirements expressed in Section 9.0; Quality Control.
3.0 DEFINITIONS
3.1 Acceptance Criteria: Specified limits placed on characteristics of an item, process, or service defined in requirement documents.
3.2 Batch: Environmental samples that are prepared and/or analyzed together with the same process and personnel, using the same lot(s) of reagents. A preparation batch is composed of one (1) to twenty (20) environmental samples of the same quality systems matrix, meeting the above mentioned criteria and with a maximum time between the start of processing of the first and last sample in the batch to be twenty-four (24) hours. An analytical batch is composed of prepared environmental samples (extracts, digestates or concentrates) which are analyzed together as a group. An analytical batch can include prepared samples originating from various quality system matrices and can exceed twenty (20) samples.
3.3 Blank : A sample that has not been exposed to the analyzed sample stream in order to monitor contamination during sampling, transport, storage or analysis. The blank is subjected to the usual analytical and measurement process to establish a zero baseline or background value and is sometimes used to adjust or correct routine analytical results.
3.4 Calibration: A set of operations that establish, under specified conditions, the relationship between values of quantities indicated by a measuring instrument or measuring system, or values represented by a material measure or a reference material, and the corresponding values realized by standards. 1) In calibration of support equipment the values realized by standards are established through the use of reference standards that are traceable to the International System of Units (SI). 2) In calibration according to methods, the values realized by standards are typically established through the use of Reference Materials that are either purchased by the laboratory with a certificate of analysis or purity, or prepared by the laboratory using support equipment that has been calibrated or verified to meet specifications.
3.5 Calibration Blank (CB): A volume of reagent water fortified with the same matrix as the calibration standards, but without the analytes, internal standards, or surrogate analytes.
3.6 Calibration Curve: The mathematical relationship between the known values, such as concentrations, of a series of calibration standards and their instrument response.
3.7 Calibration Range (CR): The concentration range over which the instrument has been calibrated. 3.8 Calibration Standard (CAL): A substance or reference material used for calibration. A solution
prepared from the primary dilution standard solution or stock standard solutions and the internal standards and surrogate analytes. The CAL solutions are used to calibrate the instrument response with respect to analyte concentration.
3.9 Certified Reference Material (CRM): Reference material accompanied by a certificate, having a value, measurement uncertainty, and stated metrological traceability chain to a national metrology institute.
3.10 Chain of Custody Form: The Water Test Request form that documents the possession of the samples from the time of collection to receipt in the laboratory. This record generally includes: the number and types of containers; the mode of collection; the collector; time of collection; preservation; and requested analyses.
3.11 Holding Times: The maximum time that can elapse between two specified activities.
Southeastern Minnesota Water Analysis Laboratory MDH Lab ID:027-109-399
Page 5 of 34
3.12 Instrument Performance Check Solution/Reference Standard (IPC): A solution of one or more method analytes, surrogates, internal standards, or other test substances used to evaluate the performance of the instrument system with respect to a defined set of criteria.
3.13 Internal Standard: A known amount of standard added to a test portion of a sample as a reference for evaluating and controlling the precision and bias of the applied analytical method.
3.14 Laboratory Control Sample (however named, such as laboratory fortified blank, spiked blank, or QC check sample): A sample matrix, free from the analytes of interest, spiked with verified known amounts of analytes or a material containing known and verified concentrations of analytes and taken through all sample preparation and analytical steps of the procedure unless otherwise noted in a reference method. It is generally used to establish intra-laboratory or analyst specific precision and bias or to assess the performance of all or a portion of the measurement system.
3.15 Laboratory Fortified Blank (LFB): An aliquot of reagent water or other blank matrices to which known quantities of the method analytes are added in the laboratory. The LFB is analyzed exactly like a sample, and its purpose is to determine whether the methodology is in control, and whether the laboratory is capable of making accurate and precise measurements.
3.16 Laboratory Fortified Sample Matrix (LFM): An aliquot of an environmental sample to which known quantities of the method analytes are added in the laboratory. The LFM is analyzed exactly like a sample, and its purpose is to determine whether the sample matrix contributes bias to the analytical results. The background concentrations of the analytes in the sample matrix must be determined in a separate aliquot and the measured values in the LFM corrected for background concentrations.
3.17 Laboratory Reagent Blank (LRB): An aliquot of reagent water or other blank matrices that are treated exactly as a sample including exposure to all glassware, equipment, solvents, reagents, internal standards, and surrogates that are used with other samples. The LRB is used to determine if method analytes or other interferences are present in the laboratory environment, the reagents, or the apparatus.
3.18 Limit(s) of Detection (LOD): A laboratory's estimate of the minimum amount of an analyte in a given matrix that an analytical process can reliably detect in their facility. The LOD is referred to as the Method Detection Limit (MDL).
3.19 Limit(s) of Quantitation (LOQ): The minimum levels, concentrations, or quantities of a target analyte that can be reported with a specified degree of confidence. The LOQ is equivalent to the laboratory’s minimum Reporting Limit (RL).
3.20 Matrix: The substrate of a test sample. 3.21 Matrix Spike (spiked sample or fortified sample): An aliquot of sample spiked with a known
concentration of target analyte(s). The spiking occurs prior to sample preparation and analysis. A matrix spike is used to document the bias of a method in a given sample matrix.
3.22 Matrix Spike Duplicate (spiked sample or fortified sample duplicate): A replicate matrix spike prepared in the laboratory and analyzed to obtain a measure of the precision of the recovery for each analyte.
3.23 Method: A body of procedures and techniques for performing an activity (e.g., sampling, chemical analysis, quantification), systematically presented in the order in which they are to be executed.
3.24 Method Detection Limit (MDL): The minimum concentration of an analyte that can be identified, measured and reported with 99% confidence that the analyte concentration is greater than zero.
3.25 Preservation: Any conditions under which a sample must be kept in order to maintain chemical and/or biological integrity prior to analysis.
3.26 Procedure: A specified way to carry out an activity or process. Procedures can be documented or not.
3.27 Proficiency Testing: A means of evaluating a laboratory’s performance under controlled conditions relative to a given set of criteria through analysis of unknown samples provided by an external source.
3.28 Proficiency Testing Program: The aggregate of providing rigorously controlled and standardized environmental samples to a laboratory for analysis, reporting of results, statistical evaluation of the results and the collective demographics and results summary of all participating laboratories.

Southeastern Minnesota Water Analysis Laboratory MDH Lab ID:027-109-399
Page 6 of 34
4.0 INTERFERENCES/LIMITATIONS
4.1 Interferences can be caused by substances with retention times that are similar to and overlap those of the anion of interest. Large amounts of an anion can interfere with the peak resolution of an adjacent anion.
4.2 Method interferences may be caused by contaminants in the reagent water, reagents, glassware, and other sample processing apparatus that lead to discrete artifacts or elevated baseline in ion chromatograms.
4.3 Samples that contain particles larger than 0.45 microns and reagent solutions that contain particles larger than 0.20 microns require filtration to prevent damage to instrument columns and flow systems.
4.4 Any anion that is not retained by the column or only slightly retained will elute in the area of fluoride and interfere. Known coelution is caused by carbonate and other small organic anions. At concentrations of fluoride above 1.5 mg/L, this interference may not be significant, however, it is the responsibility of the user to generate precision and accuracy information in each sample matrix.
4.5 Large amounts of an anion can interfere with the peak resolution of an adjacent anion. 4.6 Sample dilution and/or fortification can be used to solve most interference problems described
above.
5.0 SAFETY
5.1 The toxicity or carcinogenicity of each reagent used in this method have not been fully established. Each chemical should be regarded as a potential health hazard and exposure should be as low as reasonably achievable. Cautions are included for known extremely hazardous materials or procedures.
5.2 Laboratory technicians wear protective glasses and protect skin with exam gloves and laboratory coats when handling chemicals.
5.3 The laboratory maintains a current awareness file of OSHA regulations regarding the safe handling of the chemicals specified in this method. A reference file of Material Safety Data Sheets (MSDS) is made available to all personnel involved in the chemical analysis.
5.4 The following chemicals have the potential to be highly toxic or hazardous, consult MSDS. 5.4.1 Sulfuric acid (Section 7.4)
6.0 EQUIPMENT AND SUPPLIES
6.1 Balance - Analytical, capable of accurately weighing to the nearest 0.0001 g. 6.2 Dionex IC 1600 - Analytical system complete with ion chromatograph and all required
accessories including syringes, analytical columns, compressed gasses and detectors. 6.2.1 Dionex IonPac Analytical column 6.2.2 Dionex IonPac Guard column 6.2.3 Dionex ERS 500 (anion self-regenerating suppressor) 4 mm: anion micro
membrane suppressor 6.2.4 Detector -- Conductivity cell: Approximately 1.25 μl internal volume, (Dionex, or
equivalent) capable of providing data as required in EPA Method ML300.0, Section 9.0.
6.3 Autosampler: Dionex AS-AP 6.4 Computer: DELL 6.5 Dionex CHROMELEON 7.0 - Software used to generate data 6.6 Data management software: Microsoft Excel 2007 6.7 Refrigerators 6.8 Laboratory glassware:
6.8.1 Class A volumetric flasks (10, 25, 50, 100, and 500 ml, 1 and 2 liter) 6.8.2 Class A volumetric pipettes (1,2,3,5,10,20 and 25ml)
6.9 Micropipettors: MLA 50-200,MLA 200 - 1000 6.10 Culligan water system 6.11 Polyethylene disposable plastic transfer pipettes

Southeastern Minnesota Water Analysis Laboratory MDH Lab ID:027-109-399
Page 7 of 34
6.12 Disposable 2 mL Plastic Chromtech snap seal vial (12 x 32 mm) with snap on Chromtech tops with slit (10 mL PE).
6.13 In-line filters (Reservoir filters) 6.14 200 - 1000 microliter plastic micropipette tips 6.15 Life Sciences Acrodisc Syringe Filters, 0.2 µm membrance. 6.16 50 - 200 microliter plastic pipette tips
7.0 REAGENTS AND STANDARDS
7.1 Reagent water: 7.1.1 A DI water system is installed in the laboratory to meet reagent grade water
specifications.. 7.1.2 Water should be free of the anions of interest. This is confirmed by running a
laboratory water blank with each analysis run. 7.1.3 The water should contain particles no larger than 0.2 microns. 7.1.4 The resistivity of the water must be at least 18.4 megaohm-cm and is checked with
each batch of water used for anion analysis 7.2 Eluent Concentrate Solution (Dionex A514): 3.5 mM Sodium Carbonate, 1.0 mM Sodium
Bicarbonate (053560) 7.2.1 Eluent Concentrate is purchased from Dionex
7.3 Eluent Solution: 7.3.1 Preparation schedule: Prepare fresh weekly or as needed. 7.3.2 Preparation: Pipette 20.0 mLs of Eluent Concentrate Solution (see 7.2) to a 2.0 Liter
volumetric flask; bring to volume with deionized, degassed water. 7.3.3 Pour the Eluent Solution into the 4 L pressurizable reservoir; cap; place the
reservoir on top of the ICS-1600. 7.3.4 After the weeks first run make sure there is enough eluent for the second run; make
another liter if necessary. If a group of runs have been very small, the same eluent can be used for up to two weeks.
7.4 Regeneration solution (micro membrane suppressor): Sulfuric acid (CASRN-7664-93-9) 0.025N. Dilute 2.8 mL conc. sulfuric acid (H
2SO
4) to 4 L with reagent water.
7.5 Stock standard solutions: Stock standard solutions are purchased as certified solutions. 7.5.1 Fluoride (F-) 100 mg/L 7.5.2 Chloride (Cl-) 100 mg/L 7.5.3 Nitrite (NO2
-N) 250 mg/L 7.5.4 Nitrate (NO3
-N) 1000 mg/L 7.5.5 Sulfate (SO4
-) 1000 mg/L
7.6 Autocal 1 Calibration Standard 7.6.1 Preparation schedule: Prepare every two weeks or as frequently as needed. 7.6.2 Preparation: Pipette the following into a 100 mL volumetric flask:
7.6.2.1 10.0 mL of 100 ppm fluoride stock standard (Hach 232-49) 7.6.2.2 10.0 mL of 1000 ppm chloride stock standard (Hach 183-49) 7.6.2.3 8.0 mL of 250 ppm nitrite-N stock standard (HACH 23402-49) 7.6.2.4 5.0 mL of 1000 ppm nitrate-N stock standard (Hach 12792-49) 7.6.2.5 10.0 mL of 1000 ppm sulfate stock standard (Hach 21757-49)
7.6.3 Bring to volume with reagent water and mix thoroughly. 7.6.4 Final concentrations:
7.6.4.1 10.0 ppm fluoride 7.6.4.2 100.0 ppm chloride 7.6.4.3 20.0 ppm nitrite-N 7.6.4.4 50.0 ppm nitrate-N 7.6.4.5 100.0 ppm sulfate
7.6.5 Purchase new stock standards once per year or according to manufacturer’s recommendations.
7.7 Autocal 2 Calibration Standard
Southeastern Minnesota Water Analysis Laboratory MDH Lab ID:027-109-399
Page 8 of 34
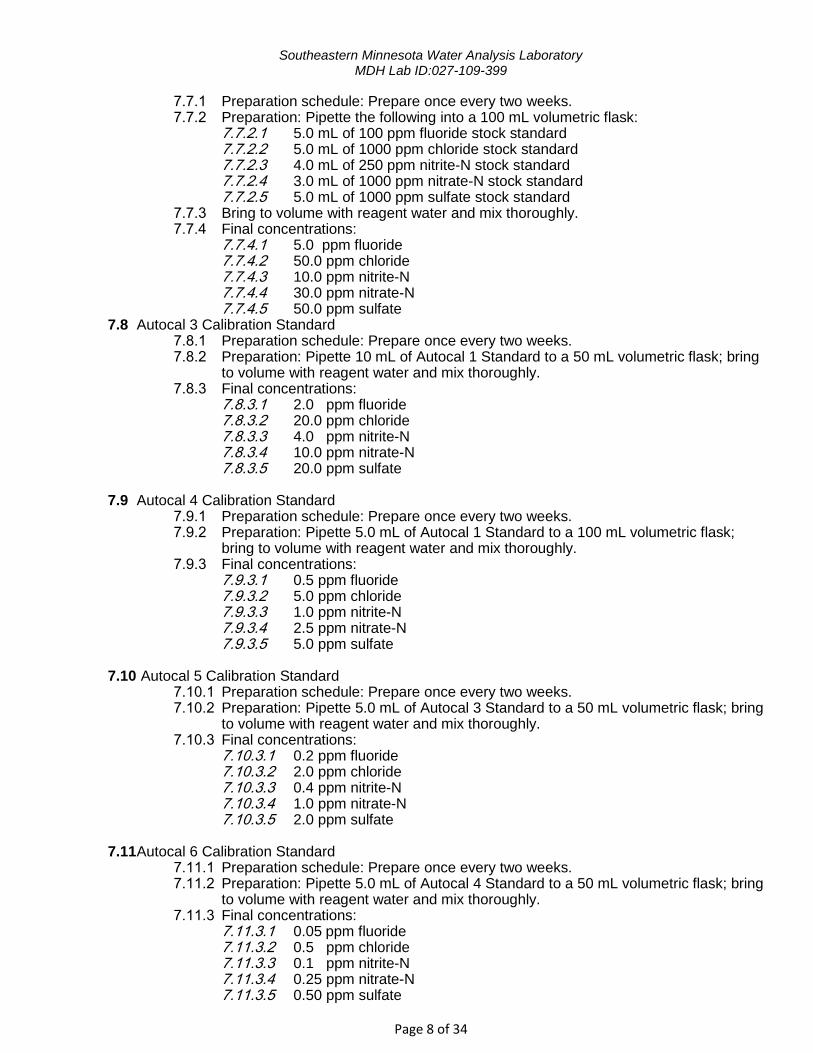
7.7.1 Preparation schedule: Prepare once every two weeks. 7.7.2 Preparation: Pipette the following into a 100 mL volumetric flask:
7.7.2.1 5.0 mL of 100 ppm fluoride stock standard 7.7.2.2 5.0 mL of 1000 ppm chloride stock standard 7.7.2.3 4.0 mL of 250 ppm nitrite-N stock standard 7.7.2.4 3.0 mL of 1000 ppm nitrate-N stock standard 7.7.2.5 5.0 mL of 1000 ppm sulfate stock standard
7.7.3 Bring to volume with reagent water and mix thoroughly. 7.7.4 Final concentrations:
7.7.4.1 5.0 ppm fluoride 7.7.4.2 50.0 ppm chloride 7.7.4.3 10.0 ppm nitrite-N 7.7.4.4 30.0 ppm nitrate-N 7.7.4.5 50.0 ppm sulfate
7.8 Autocal 3 Calibration Standard 7.8.1 Preparation schedule: Prepare once every two weeks. 7.8.2 Preparation: Pipette 10 mL of Autocal 1 Standard to a 50 mL volumetric flask; bring
to volume with reagent water and mix thoroughly. 7.8.3 Final concentrations:
7.8.3.1 2.0 ppm fluoride 7.8.3.2 20.0 ppm chloride 7.8.3.3 4.0 ppm nitrite-N 7.8.3.4 10.0 ppm nitrate-N 7.8.3.5 20.0 ppm sulfate
7.9 Autocal 4 Calibration Standard
7.9.1 Preparation schedule: Prepare once every two weeks. 7.9.2 Preparation: Pipette 5.0 mL of Autocal 1 Standard to a 100 mL volumetric flask;
bring to volume with reagent water and mix thoroughly. 7.9.3 Final concentrations:
7.9.3.1 0.5 ppm fluoride 7.9.3.2 5.0 ppm chloride 7.9.3.3 1.0 ppm nitrite-N 7.9.3.4 2.5 ppm nitrate-N 7.9.3.5 5.0 ppm sulfate
7.10 Autocal 5 Calibration Standard
7.10.1 Preparation schedule: Prepare once every two weeks. 7.10.2 Preparation: Pipette 5.0 mL of Autocal 3 Standard to a 50 mL volumetric flask; bring
to volume with reagent water and mix thoroughly. 7.10.3 Final concentrations:
7.10.3.1 0.2 ppm fluoride 7.10.3.2 2.0 ppm chloride 7.10.3.3 0.4 ppm nitrite-N 7.10.3.4 1.0 ppm nitrate-N 7.10.3.5 2.0 ppm sulfate
7.11 Autocal 6 Calibration Standard
7.11.1 Preparation schedule: Prepare once every two weeks. 7.11.2 Preparation: Pipette 5.0 mL of Autocal 4 Standard to a 50 mL volumetric flask; bring
to volume with reagent water and mix thoroughly. 7.11.3 Final concentrations:
7.11.3.1 0.05 ppm fluoride 7.11.3.2 0.5 ppm chloride 7.11.3.3 0.1 ppm nitrite-N 7.11.3.4 0.25 ppm nitrate-N 7.11.3.5 0.50 ppm sulfate

Southeastern Minnesota Water Analysis Laboratory MDH Lab ID:027-109-399
Page 9 of 34
7.12 Instrument Performance Check Solution (Inorganic Ventures) used for continuous calibration
verification. The IPC is run at the beginning, midway, and at the end of the anion run verifying instrument calibration.
7.12.1 Concentrations: 7.12.1.1 4.0 ppm fluoride 7.12.1.2 40.0 ppm chloride 7.12.1.3 8.0 ppm nitrite-N 7.12.1.4 20.0 ppm nitrate-N 7.12.1.5 40.0 ppm sulfate
8.0 SAMPLE COLLECTION, PRESERVATION AND STORAGE
8.1 Proper, full, and complete documentation must accompany the sample. This is to include sample
identification, the location, the date and time of collection, the collector’s name, and analyses being requested. If required information is missing, the laboratory will attempt to contact the client to acquire the required information. When contact with the client is not possible the sample will be logged in but will not be analyzed.
8.2 Samples must be collected in clean HDPE bottles without preservatives (such as sodium thiosulfate). Samples arriving at the lab in thiosulfate preserved bags or bottles will be rejected.
8.2.1 If the laboratory receives a sample in an inappropriate container, it will be rejected and the client notified to submit a new sample.
8.3 Water samples must arrive at the lab within 48 hours of sampling time in order to meet the holding time for nitrate-N and nitrite-N.
8.3.1 Ideally, these samples should be iced immediately after collection and delivered to the laboratory by hand.
8.4 Samples that are not analyzed within the 48 hour holding time specified in the anion methodology will have a notation to that effect made on the final report.
8.5 Samples that have signs of damage, contamination or freezing will be qualified on the final report if the analysis can still be performed. If the analysis cannot be performed, the sample will be logged-in and the client notified to resample.
8.6 If a sample does not meet SEMWAL’s Sample Acceptance Policy and the client insists on continuing with analysis, all deviations from the Sample Acceptance Policy and the clients comments are qualified on the final report.
9.0 QUALITY CONTROL
9.1 Initial Demonstration of performance 9.1.1 The initial demonstration of performance is used to characterize instrument
performance (Linear Calibration Range) and laboratory performance (determination of MDLs) prior to performing analyses by this method.
9.1.2 Determine the Linear Calibration Range (LCR) initially and verify every six months or whenever a significant change in instrument response is observed or expected. 9.1.2.1 Use a blank and three standards to verify linearity. 9.1.2.2 If any verification exceeds the initial values by ±10%, linearity must be
re-established. 9.1.2.3 If any portion of the range is shown to be nonlinear, sufficient standards
must be used to clearly define the nonlinear portion. 9.1.3 Calibration Standards are run with each batch to verify acceptable instrument
performance. 9.1.3.1 Concentrations must be within ±10% of the stated values. 9.1.3.2 If the concentrations are outside ±10% of the stated values, the sources
of the problem must be identified and corrected before continuing with analyses.
9.1.4 Establish Method Detection Limits (MDLs) for all analytes, using reagent water (blank) fortified at a concentration of two to three times the estimated instrument detection limit using the procedure outlined in SEMWAL-CHEM-SOP-003.

Southeastern Minnesota Water Analysis Laboratory MDH Lab ID:027-109-399
Page 10 of 34
9.1.4.1 Follow all steps of the SOP for ICS-1600 Anion Analysis 9.1.4.2 All sample processing steps in the analysis procedure shall be included
in the determination of the MDL 9.1.4.3 MDLs are determined every six months, when a new operator begins
work or whenever there is a significant change in the background or instrument response.
9.1.5 Reporting limits are validated each run using the excel Reporting limit spreadsheet. 9.1.5.1 Current Detection and Reporting limits can be found in SEMWAL-
CHEM-SOP-003. 9.1.5.2 Maximum detection limits used in this laboratory:
9.1.5.2.1 Fluoride: 10.0 ppm 9.1.5.2.2 Chloride: 100.0 ppm 9.1.5.2.3 Nitrite-N: 20 ppm 9.1.5.2.4 Nitrate-N: 50.0 ppm 9.1.5.2.5 Sulfate: 100.0 ppm 9.1.5.2.6 Samples exceeding the maximum will be diluted accordingly
to allow concentrations to fall within the analytical range. 9.2 Assessing Laboratory Performance
9.2.1 Laboratory analysts assess laboratory performance by running the quality control checks in section 9.2.3.1-9.2.3.3
9.2.2 Acceptance limits, non-conformances, and corrective action procedures are found in SEMWAL-CHEM-PR-001.
9.2.3 Quality Control Checks for Assessing Laboratory Performance 9.2.3.1 Laboratory Reagent Blank (LRB): analyze with each batch of samples 9.2.3.2 Laboratory Fortified Blank (LFB): analyze with each batch of samples 9.2.3.3 Instrument Performance Check Solution (IPC): analyze the IPC in the
beginning of the sample run, after every 10th sample and at the end of the sample run.
9.3 Assessing Analyte Recovery and Data Quality 9.3.1 Laboratory analysts assess analyte recovery and data quality by running the quality
control checks in section 9.3.3.1 - 9.3.3.2 9.3.2 Acceptance limits, non-conformances, and corrective action procedures are found
in SEMWAL-CHEM-PR-001. 9.3.3 Quality Control Checks for Assessing Analyte Recovery and Data Quality
9.3.3.1 Laboratory Fortified Sample Matrix (LFM): Add a known amount of analyte to a minimum of 10% of routine samples. The added analyte concentration should be the same as that used in the LFB.
9.3.3.2 At least quarterly, analyze replicates of LFBs to determine the precision of laboratory measurements.
9.4 Calibration and Standardization 9.4.1 For each analyte of interest, prepare calibration standards according to Section 7.6-
7.11. 9.4.2 Inject 0.1-1.0 mL of each calibration standard, tabulate peak height or area
responses against the concentration. Use the results to prepare a calibration curve for each analyte. 9.4.2.1 Record retention times on SEMWAL-CHEM-FR-006-2.0
9.4.3 Verify the calibration curve each working day or whenever the anion eluent is changed, and after every 19 samples. 9.4.3.1 If the response or retention times of any analyte vary from the expected
values by more than ±10%, the test must be repeated using fresh calibration standards.
9.4.3.2 If the results are still more than ±10%, a new calibration curve must be prepared for that analyte.
Southeastern Minnesota Water Analysis Laboratory MDH Lab ID:027-109-399
Page 11 of 34
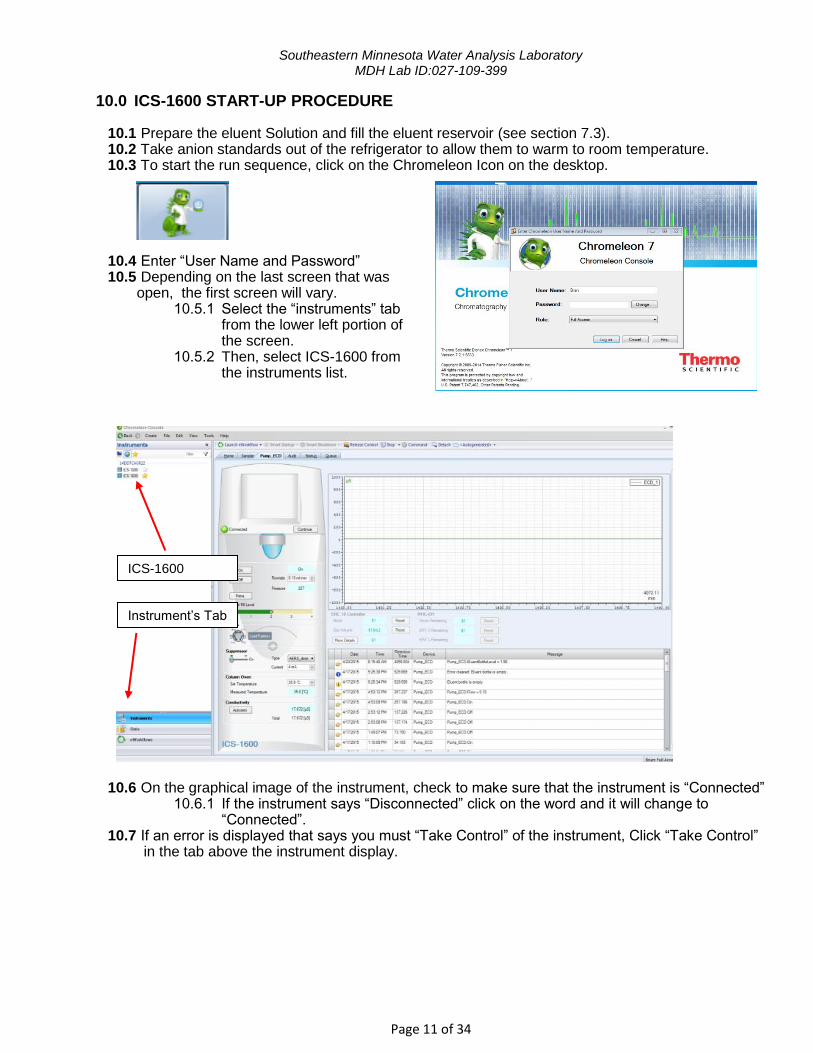
10.0 ICS-1600 START-UP PROCEDURE
10.1 Prepare the eluent Solution and fill the eluent reservoir (see section 7.3). 10.2 Take anion standards out of the refrigerator to allow them to warm to room temperature. 10.3 To start the run sequence, click on the Chromeleon Icon on the desktop.
10.4 Enter “User Name and Password” 10.5 Depending on the last screen that was
open, the first screen will vary. 10.5.1 Select the “instruments” tab
from the lower left portion of the screen.
10.5.2 Then, select ICS-1600 from the instruments list.
10.6 On the graphical image of the instrument, check to make sure that the instrument is “Connected”
10.6.1 If the instrument says “Disconnected” click on the word and it will change to “Connected”.
10.7 If an error is displayed that says you must “Take Control” of the instrument, Click “Take Control” in the tab above the instrument display.
Instrument’s Tab
ICS-1600

Southeastern Minnesota Water Analysis Laboratory MDH Lab ID:027-109-399
Page 12 of 34
10.8 Make sure the eluent reservoir is full (bottle labeled BICARB), and set the eluent level by
dragging the slider bar labeled “eluent fill level” to the proper level. 10.9 Set pump flowrate to 1.2ML/min, press enter. 10.10 Set suppressor to “ON”, press enter. 10.11 Make sure the suppressor type is set to “AERS_4mm”, and the current is “24mA”, press enter. 10.12 Set oven temperature to “35 C”, press enter.
“Connected”
“Take Control”
10.8 Eluent Fill Level
10.9 Pump Flowrate (1.2 mL/min)
10.10 Suppressor (On)
10.11 Suppressor Type “AERS_4mm” and Current “24mA”
10.12 Oven “35°C”
Southeastern Minnesota Water Analysis Laboratory MDH Lab ID:027-109-399
Page 13 of 34
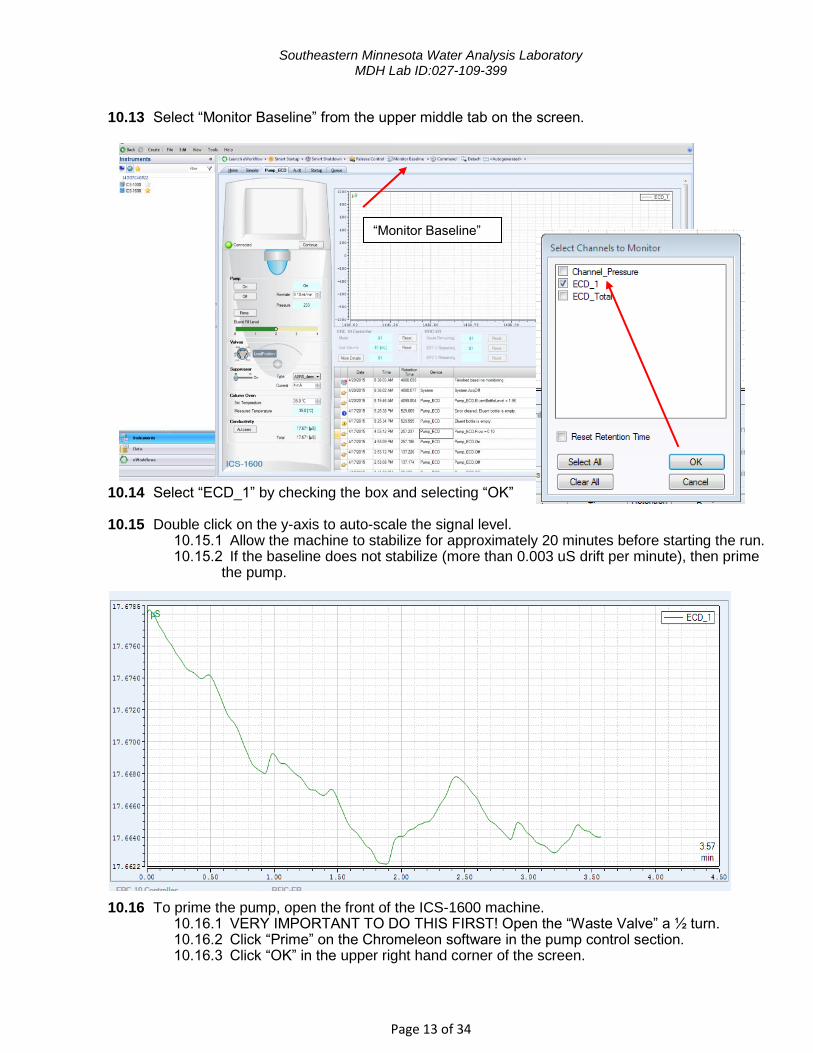
10.13 Select “Monitor Baseline” from the upper middle tab on the screen.
10.14 Select “ECD_1” by checking the box and selecting “OK”
10.15 Double click on the y-axis to auto-scale the signal level. 10.15.1 Allow the machine to stabilize for approximately 20 minutes before starting the run. 10.15.2 If the baseline does not stabilize (more than 0.003 uS drift per minute), then prime
the pump.
10.16 To prime the pump, open the front of the ICS-1600 machine. 10.16.1 VERY IMPORTANT TO DO THIS FIRST! Open the “Waste Valve” a ½ turn. 10.16.2 Click “Prime” on the Chromeleon software in the pump control section. 10.16.3 Click “OK” in the upper right hand corner of the screen.
“Monitor Baseline”

Southeastern Minnesota Water Analysis Laboratory MDH Lab ID:027-109-399
Page 14 of 34
10.17 Allow the system to pump for approximately 5 minutes 10.18 After 5 minutes of priming, press the “ON” pump control button and close the “waste valve” of
the ICS-1600. 10.18.1 Make sure to re-set the pump flow rate to 1.2 mL/min. 10.18.2 Re-set the suppressor to “ON” positon. 10.18.3 Re-set the current to 24mA.
10.19 Monitor baseline and allow the system to stabilize for approximately 20 minutes, or until the baseline is stable (~3 uS/min) drift max. Ideal stabilization is ~0.1uS.
10.20 Once the instrument set-up is complete, prepare the samples, standards and quality control checks per Section 11.0: Sample Preparation.
11.0 SAMPLE PREPARATION
11.1 Ensure analyst preparing standards is wearing gloves. 11.2 Place vial “Tray 1” and “Tray 1’” on the counter. 11.3 In Vial “Tray 1”, place 10 vials as shown in the photo below.
11.4 Fill “Tray 1” vials with standards, and label each vial. 11.4.1 Vial 1: Standard 1 11.4.2 Vial 2: Standard 2 11.4.3 Vial 3: Standard 3 11.4.4 Vial 4: Standard 4 11.4.5 Vial 5: Standard 5 11.4.6 Vial 6: Standard 6 11.4.7 Vial 7: Calibration blank (Cal Blank) 11.4.8 Vial 8: Instrument Performance Check Standard (IPC) 11.4.9 Vial 9: Laboratory Reagent Blank (LRB-Reagent Water) 11.4.10 Vial 10: Laboratory Fortified Blank (LFB)
“Prime”
“OK”
Waste Valve Position

Southeastern Minnesota Water Analysis Laboratory MDH Lab ID:027-109-399
Page 15 of 34
11.4.10.1 Use 0.500 mL of Cal Blank, and 0.500 mL of Standard #2. 11.5 “Tray 1’” will be filled with environmental samples
11.5.1 Starting with position 1, label all sample vials with their respective sample number. 11.5.2 The samples that will be spiked are circled in the vial tray.
11.5.2.1 Samples to be spiked are: 11.5.2.1.1 Sample 1 11.5.2.1.2 Sample 6 11.5.2.1.3 Sample 15 11.5.2.1.4 Sample 20 11.5.2.1.5 Sample 29, etc. See Chromeleon template for additional
spikes. 11.5.2.2 Determine the number of spikes that will be used in the sequence. 11.5.2.3 Place that number of vials in the “1’ Vial Tray” in the S1, S2, S3, S4
positions as need (see photo below).
11.5.2.4
11.6 To spike a sample, place 0.500 mL of the sample in the vial and add 0.500 mL of standard #2.

Southeastern Minnesota Water Analysis Laboratory MDH Lab ID:027-109-399
Page 16 of 34
11.7 Once the standards and quality control vials are prepared, proceed to section 12.0 to prepare the final run sequence and arrange the vials in their final location in the rack.
12.0 PREPARING THE RUN SEQUENCE
12.1 Once the instrument set-up is complete and standards/samples have been placed in vials the run sequence can be set-up and the environmental samples can be placed in the rack for analysis.
12.1.1 In Chromeleon, select the “data” tab in the lower left portion of the screen. 12.1.1.1 Depending on the last time the program was open, this screen may vary.
12.1.2 From the file tree, select “ChromeleonLocalInstrument Data ICS-1600 Start New Sequence”
12.1.3 Double click on the template that corresponds to the number of samples to be analyzed.
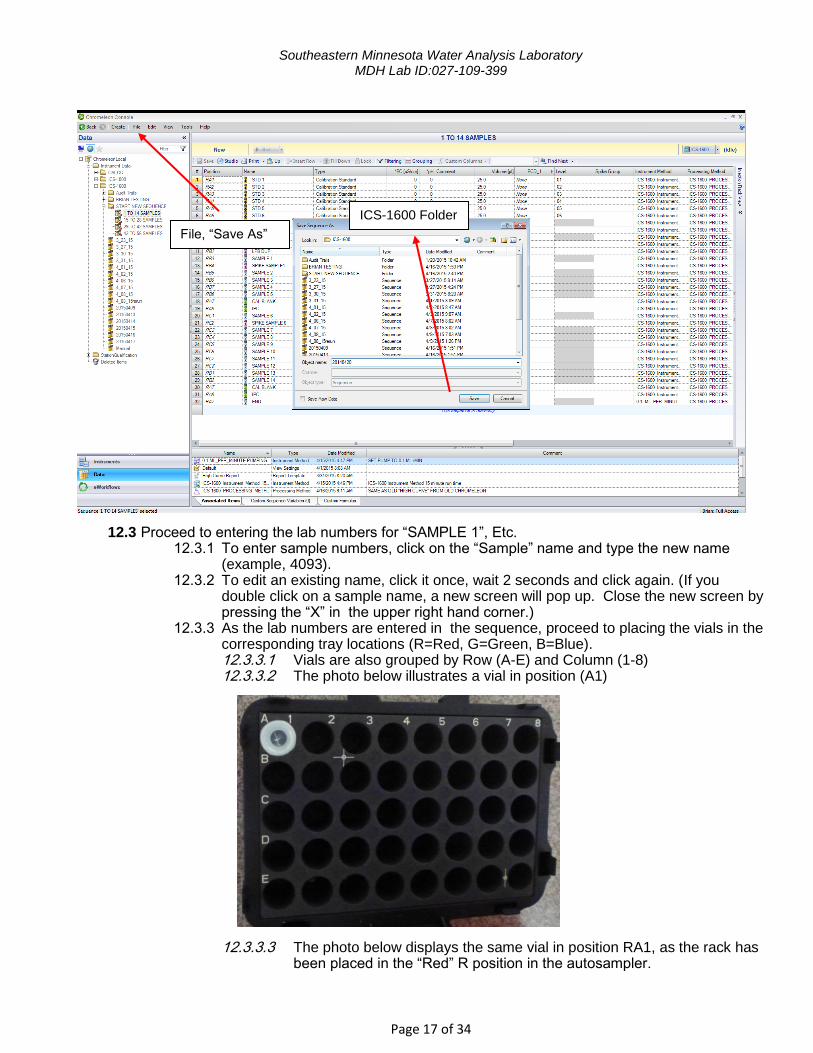
12.2 From the “file” menu select “save as” 12.2.1 Save the file in the following format (YYYYMMDD) in the ICS-1600 folder 12.2.2 Select “Save”
Select sample template by double clicking.
Start “New Sequence”
Southeastern Minnesota Water Analysis Laboratory MDH Lab ID:027-109-399
Page 17 of 34
12.3 Proceed to entering the lab numbers for “SAMPLE 1”, Etc. 12.3.1 To enter sample numbers, click on the “Sample” name and type the new name
(example, 4093). 12.3.2 To edit an existing name, click it once, wait 2 seconds and click again. (If you
double click on a sample name, a new screen will pop up. Close the new screen by pressing the “X” in the upper right hand corner.)
12.3.3 As the lab numbers are entered in the sequence, proceed to placing the vials in the corresponding tray locations (R=Red, G=Green, B=Blue). 12.3.3.1 Vials are also grouped by Row (A-E) and Column (1-8) 12.3.3.2 The photo below illustrates a vial in position (A1)
12.3.3.3 The photo below displays the same vial in position RA1, as the rack has been placed in the “Red” R position in the autosampler.
File, “Save As”
ICS-1600 Folder

Southeastern Minnesota Water Analysis Laboratory MDH Lab ID:027-109-399
Page 18 of 34
12.4 When the sample entering is complete, delete any “unused” sample lines by selecting the # field and highlighting the unused samples.
12.4.1 Press “delete” to remove the samples 12.4.2 Press “save” to save your sequence.
12.5 Place the filled sample rack into the autosampler and proceed to Section 12.6 to add the sequence to the Queue
Highlight to delete extra rows.
“Save”

Southeastern Minnesota Water Analysis Laboratory MDH Lab ID:027-109-399
Page 19 of 34
12.6 Select, “Add to Queue” from the drop down menu located next to the start button.
12.7 From the same drop down, select “View Queue
“Start Drop Down Add to Queue”
“Drop Down View Queue”
”Add to Queue”

Southeastern Minnesota Water Analysis Laboratory MDH Lab ID:027-109-399
Page 20 of 34
12.8 A new screen will pop-up. Maximize this screen. 12.9 Select “Queue” from the upper left tab block.
12.10 If there are multiple item in the queue, click “remove” and “remove all of the items”. Re-add the sequence following section 12.6-12.9.
12.11 Select “Ready Check” from the right hand side of the screen.
12.12 Any errors will be displayed on the bottom of the screen.
12.12.1 There will be an error with a yellow exclamation point for the “END (Injection”. Ignore that error.
12.12.2 If there are errors in RED, click on the error and it will explain how to fix the problem.
12.13 Ensure that sufficient eluent is in the bottle and select “start”
12.14 A warning box will ask if the warnings should be ignored and the sequence started. Select “YES”.
Select “Queue”
Select “Ready Check”
Select “Start”

Southeastern Minnesota Water Analysis Laboratory MDH Lab ID:027-109-399
Page 21 of 34
12.15 The autosampler will start making noise and the injection sequence will begin.
12.15.1 Close the current window to return to the “Main” chromeleon screen. 12.15.2 If the windows are accidently closed, just restart Chromeleon and the samples will
still be running. 12.15.3 DO NOT TURN OFF THE COMPUTER ONCE YOU HAVE STARTED THE
SEQUENCE RUNNING! 12.16 The sequence will run over night and will be ready for post processing the following day.
Follow Section 13.0 for instructions on reviewing the data and completing required QA calculations.
13.0 DATA PROCESSING - ICS-1600
13.1 Open Chromeleon and select the “Data Tab”
13.2 Select the finished sequence in the file browser on the left side of the screen. 13.2.1 Click on the “Studio” button to view the run results.
“Ignore Warning Yes”
Select “Data” Tab
Select “Data Tab”

Southeastern Minnesota Water Analysis Laboratory MDH Lab ID:027-109-399
Page 22 of 34
13.3 Depending on the previous time the studio was open, it may open to a different view.
13.3.1 From the “Studio” page, Select the “Results” icon under the “Data Processing Home” tab.
13.4 Click on the “Peak Results” tab at the bottom of the page.
13.5 Visually inspect each injection to ensure that the peak integration and identification of peaks was performed correctly.
Select Sequence to Review
Select “Studio”
Data Processing Home
Select “Results”
Select “Peak Results”

Southeastern Minnesota Water Analysis Laboratory MDH Lab ID:027-109-399
Page 23 of 34
13.6 Below are common examples and solutions when reviewing the data. If no problems are identified, skip to Section 13.7.
13.6.1 Problem 1. Peak NOT identified
13.6.1.1 First way (Preferred Way) to handle the problem is to toggle to the “Data Processing Home” tab and Select “Calib & PM” icon 13.6.1.1.1 Chromeleon will open a page that shows the chromatogram,
the calibration curve, detection settings, and component table.
13.6.1.1.2 Look at the chromatogram. The peak retention time will be labeled after the peak number, above the peak.
13.6.1.1.3 If the peak is not labeled, take this retention time and replace the retention time listed in the “component table” (In the example below, 4.310 would be typed into the “Ret time” cell for NO2 in the component table).
13.6.1.1.4 After adjusting the retention time, review the previous injections to ensure they are still detecting all of the peaks. Click “Save”.
Unidentified Peak
Processing Tab
Calib. & PM

Southeastern Minnesota Water Analysis Laboratory MDH Lab ID:027-109-399
Page 24 of 34
13.6.1.2 The second way to handle the problem is to select the “Insert Peak” icon under the “Processing” tab. 13.6.1.2.1 Drag a line across the bottom of the peak. 13.6.1.2.2 If the peak is not instantly labeled, right click inside the peak
area and select “Manual Peak Identification”
13.6.1.2.3
Processing Tab
Insert Peak Unlabeled Peak
Insert value on chromatogram (4.310) into “Ret Time” cell for that analyte.

Southeastern Minnesota Water Analysis Laboratory MDH Lab ID:027-109-399
Page 25 of 34
13.6.1.2.4 From the “Manual Peak Identification” page, select the correct componenet from the drop down menu and click “Assign Component”
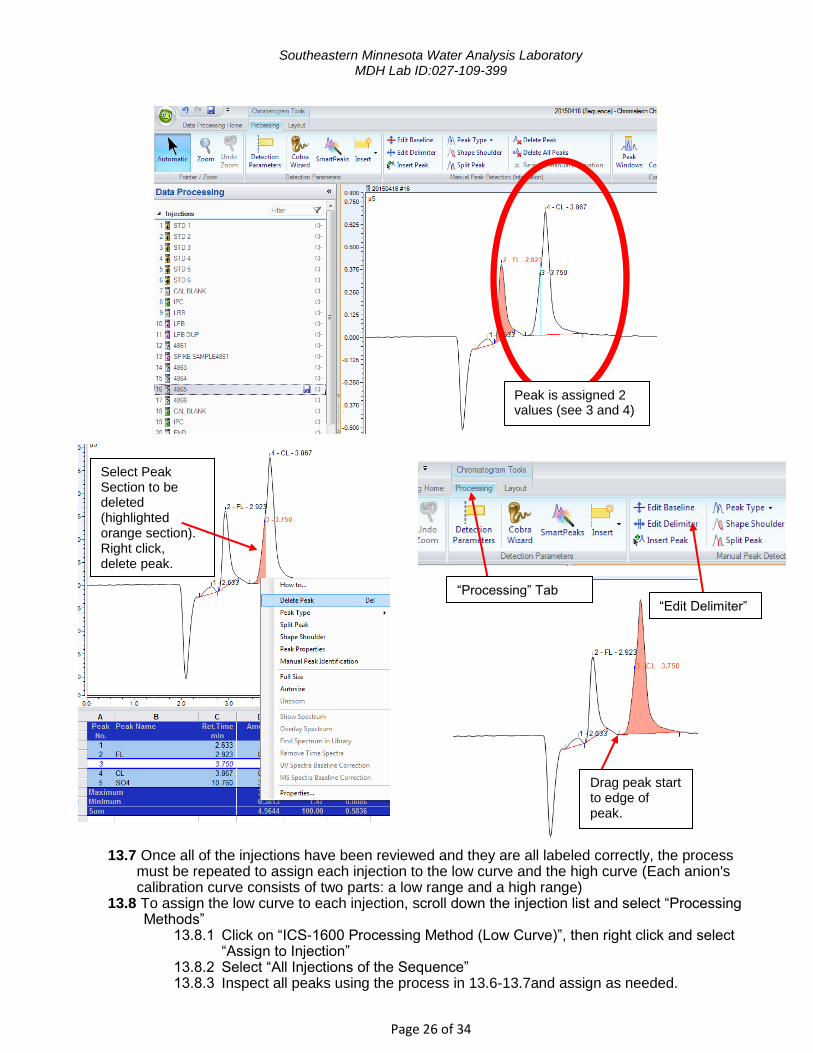
13.6.2 Problem 2: Multiple retention times are assigned to 1 peak.
13.6.2.1 In this example, variation in the peak shape caused the computer to assign 2 components (analytes) to the chloride peak. 13.6.2.1.1 Solution 1. Click on the first peak that is not labeled “Cl” and
press “Delete” (or right click and select delete peak). 13.6.2.1.2 Select the “Edit Delimiter” tool from the “Processing” tab. 13.6.2.1.3 Drag the peak start to the edge of the peak. 13.6.2.1.4 Select “Save”.
Select Component “Analyte”
“Assign Component”
Right click inside Peak Area Select “Manual Peak Identification”
Southeastern Minnesota Water Analysis Laboratory MDH Lab ID:027-109-399
Page 26 of 34
13.7 Once all of the injections have been reviewed and they are all labeled correctly, the process
must be repeated to assign each injection to the low curve and the high curve (Each anion's calibration curve consists of two parts: a low range and a high range)
13.8 To assign the low curve to each injection, scroll down the injection list and select “Processing Methods”
13.8.1 Click on “ICS-1600 Processing Method (Low Curve)”, then right click and select “Assign to Injection”
13.8.2 Select “All Injections of the Sequence” 13.8.3 Inspect all peaks using the process in 13.6-13.7and assign as needed.
Peak is assigned 2 values (see 3 and 4)
Select Peak Section to be deleted (highlighted orange section). Right click, delete peak.
“Processing” Tab
“Edit Delimiter”
Drag peak start to edge of peak.

Southeastern Minnesota Water Analysis Laboratory MDH Lab ID:027-109-399
Page 27 of 34
13.8.4 To Export a report of the data with the Low Curve Report, select “Report Designer”
from the left hand tab. 13.8.4.1 Scroll down in the injection list and select “Low Curve Report”. It contains
8 columns as displayed in the photo below.
13.8.4.2 Click on the Chromeleon face in the upper left hand corner of the screen. 13.8.4.2.1 Select “Export” 13.8.4.2.2 Ensure “Current Injection” and “excel file format” are checked
and Select “OK” 13.8.4.2.3 Data will be saved in the parent file folder created in Section
12.2.1
Scroll to “Processing Methods”, select Low-Curve, right click and “assign to injection”
Select, assign processing method to “all injections of the sequence”.
Select “Report Designer”
“Low Curve Report”

Southeastern Minnesota Water Analysis Laboratory MDH Lab ID:027-109-399
Page 28 of 34
13.9 The process from 13.8 above must be repeated to assign the High Curve to each injection. 13.9.1 Click on the “Data Processing” tab 13.9.2 Right click on “ICS-1600 Processing Method (High Curve)”, “Assign to injection”,
and “All injections of the sequence”.
13.9.3 Open “Report Designer” and select “High Curve Report”. 13.9.4 Export the high curve data as in 13.8.4
13.10 The exported data is located in a folder at: T:\ENV-RES\WaterResMgnt\Water Lab\@Laboratory\ANION RUN RESULTS\Chrom7\
13.10.1 The folder name will be the sequence name. 14.0 DILUTION OF SAMPLES WITH OFF-SCALE PEAKS
14.1 Estimate the dilution needed by comparing the off-scale peak with the corresponding peak in the
high calibration standard. 14.2 Concentrations can usually be brought under the maximum detection limits with a 1:2, 1:4, 1:5,
1:10 or 1:20 dilution. 14.3 Analyze the dilutions with the next batch of samples run.
Select “Chromeleon” start
Select Export
Select OK
Select “High Curve”
Right click, “assign to injection”
Assign to all injections of the sequence.

Southeastern Minnesota Water Analysis Laboratory MDH Lab ID:027-109-399
Page 29 of 34
15.0 POST PROCESSING & QUALITY CONTROL CHECK OF CHROMELEON DATA
15.1 After exporting the high and low curve reports from Section 13.7-13.10, navigate to the following directory: T:\ENV-RES\WaterResMgnt\Water Lab\@Laboratory\ANION RUN RESULTS\Chrom7
15.1.1 The run will be in a folder with the name of the run (date). 15.2 Copy both the “HIGH CURVE1” and “LOW CURVE1” into the Chrom7 route directory
15.2.1 Select “Copy and Replace” for both files when prompted.
15.3 Double click to open “PROCESS_HIGH_LOW_CURVES” (excel file).
15.3.1 Enable macro’s if they are blocked. 15.3.2 Click “Process”.
Open “Process_high_low_Curves” file.

Southeastern Minnesota Water Analysis Laboratory MDH Lab ID:027-109-399
Page 30 of 34
15.3.3 If a Microsoft Visual Basic error message occurs, click “END”. 15.3.4 The active cell should now contain a “1”.
15.3.4.1 Delete the cell with the number “1” in it. Scroll to the “home” of the screen, or press “CTL” + “Home”
15.3.5 The excel spreadsheet should now display rows and columns of the anion data with % recovery calculations for the quality control data in a manner similar to the photo below.
15.3.6 Move the IPC cell reference to reference the IPC sample 15.3.6.1 Repeat this step for all IPC’s, LFB’s, LFB dups and Spikes.
Select “Process”
Example Anion QA Spreadsheet

Southeastern Minnesota Water Analysis Laboratory MDH Lab ID:027-109-399
Page 31 of 34
15.3.6.2 If needed, insert additional rows to accommodate the additional spikes, IPC’s and LFB’s.
15.4 Save the file as “ANION RUN & QC MM-DD-YY” in the run directory: T:\ENV-RES\WaterResMgnt\Water Lab\@Laboratory\ANION RUN RESULTS\Chrom7\(Run date file)
15.5 Also save the run file in T:\ENV-RES\WaterResMgnt\Water Lab\@Laboratory\ANION RUN RESULTS\ANION RUNS & QC YYYY”
15.6 Print the run file for the QAQC file 15.6.1 Close the run file
15.7 The following screen will be shown (see below), Navigate to “Main” tab.
15.8 Review the data
“Main” Tab
Southeastern Minnesota Water Analysis Laboratory MDH Lab ID:027-109-399
Page 32 of 34
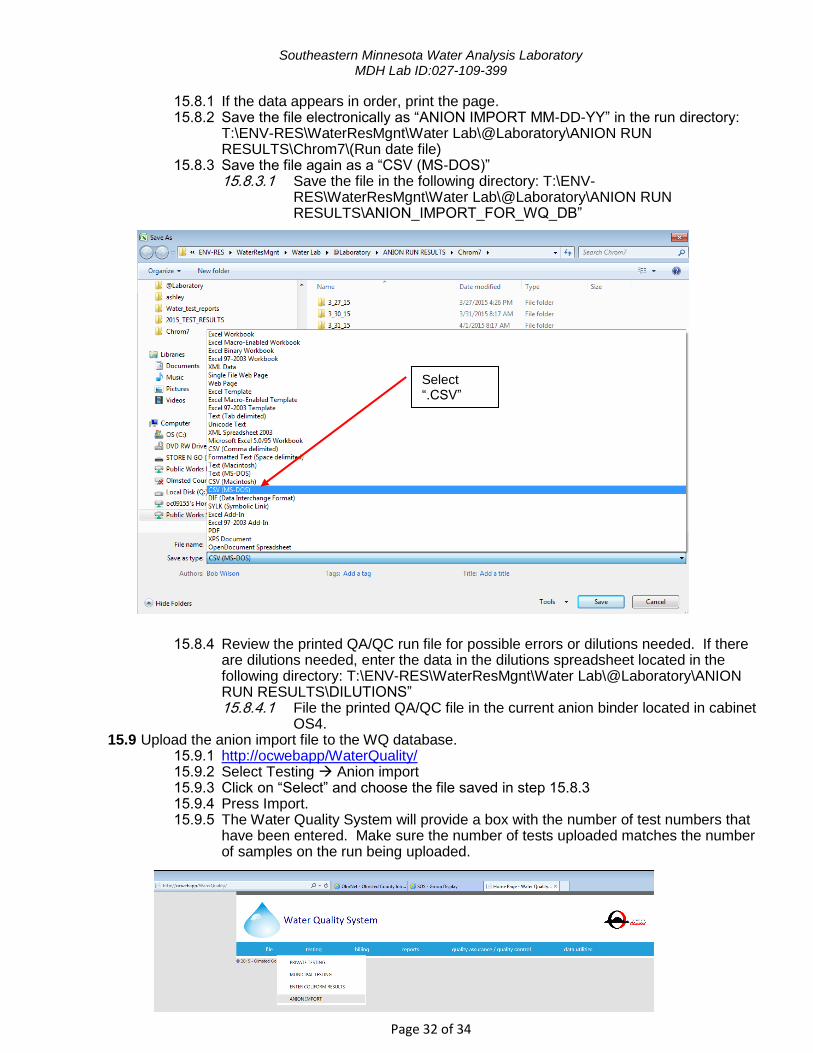
15.8.1 If the data appears in order, print the page. 15.8.2 Save the file electronically as “ANION IMPORT MM-DD-YY” in the run directory:
T:\ENV-RES\WaterResMgnt\Water Lab\@Laboratory\ANION RUN RESULTS\Chrom7\(Run date file)
15.8.3 Save the file again as a “CSV (MS-DOS)” 15.8.3.1 Save the file in the following directory: T:\ENV-
RES\WaterResMgnt\Water Lab\@Laboratory\ANION RUN RESULTS\ANION_IMPORT_FOR_WQ_DB”
15.8.4 Review the printed QA/QC run file for possible errors or dilutions needed. If there are dilutions needed, enter the data in the dilutions spreadsheet located in the following directory: T:\ENV-RES\WaterResMgnt\Water Lab\@Laboratory\ANION RUN RESULTS\DILUTIONS” 15.8.4.1 File the printed QA/QC file in the current anion binder located in cabinet
OS4. 15.9 Upload the anion import file to the WQ database.
15.9.1 http://ocwebapp/WaterQuality/ 15.9.2 Select Testing Anion import 15.9.3 Click on “Select” and choose the file saved in step 15.8.3 15.9.4 Press Import. 15.9.5 The Water Quality System will provide a box with the number of test numbers that
have been entered. Make sure the number of tests uploaded matches the number of samples on the run being uploaded.
Select “.CSV”

Southeastern Minnesota Water Analysis Laboratory MDH Lab ID:027-109-399
Page 33 of 34
15.10 Record Minimum Reporting Limits for each analyte (Fluoride value from Lo curve STD 5
and the rest from Lo curve STD 6) on the Reporting Limits Record next to the computer. Also record the retention times on the Retention Time Record next to computer.
16.0 METHODS FOR CHECKING CALCULATIONS AND DATA TRANSFER
16.1.1 Open flash drive folder (E: Drive) and locate the current Reporting Level Verification spreadsheet 16.1.1.1 Open the electronic “Anion Run Results” folder located on the
laboratory’s shared drive T:\ENV-RES\WaterResMgnt\Water Lab\@Laboratory\ANION RUN RESULTS
16.1.1.2 Open the “Reporting Level Verification” folder 16.1.1.3 Drag and drop the Reporting Level Verification spreadsheet file from the
E: Drive into the electronic folder T:\ENV-RES\WaterResMgnt\Water Lab\@Laboratory\ANION RUN RESULTS\REPORTING LEVEL VERIFICATION
16.2 Verify that all quality control analytes are within the acceptance limits outlined in SEMWAL-CHEM-PR-001-2.0
16.2.1 If the IPC standard, Matrix Spikes, Duplicate spikes, Check standards, or sample duplicates do not meet established quality assurance criteria according to the limits outlined in SEMWAL-CHEM-PR-001-2.0, the data is classified as out of control. 16.2.1.1 The analyst must initiate the corrective actions outlined in the procedure. 16.2.1.2 The run must be evaluated and the sample may need to be reprocessed.
17.0 RECORDS, RETENTION AND RETRIEVAL
17.1 All controlled paper records are kept for a minimum of 5 years. 17.2 All analytical test results are saved electronically in the laboratory’s file sharing system and is
backed up on the Olmsted County Server according to ITS specifications. 17.2.1 Results are entered into SEMWAL’s water database and linked to a unique sample
log number. 17.2.1.1 Results can be accessed using the unique lab number and/or year of
collection. 17.2.1.2 Results can also be obtained from the water database using the
address, owners name or the well unique number. 17.3 Anion quality assurance spreadsheets and run results are saved electronically on the lab’s
shared drive in the “ANION RUN RESULTS” subfolder. 17.3.1 Hard copies may be kept in a three ring binder located in Cabinet U7.

Southeastern Minnesota Water Analysis Laboratory MDH Lab ID:027-109-399
Page 34 of 34
18.0 POLLUTION PREVENTION
18.1 Whenever feasible, laboratory personnel use pollution prevention techniques to address their
waste generation. 18.2 The laboratory only purchases chemicals and standards based on their expected usage and
shelf life. Reagents are only prepared as necessary and volumes reflect the anticipated usage. 18.3 Laboratory personnel handles each chemical with caution and keeps MSDS sheets and proper
disposal information filed in the laboratory for reference. 19.0 WASTE MANAGEMENT
19.1 Excess reagents, samples and method process wastes are characterized and disposed of in an
acceptable manner and in accordance with manufacturer instructions. 20.0 METHOD REFERENCE
20.1 EPA Test Method 300.0: The Determination of Inorganic Anions in Water by Ion
Chromatography 20.2 Standard Methods, 2320B Standard Methods for the Examination of Water and Wastewater,
21st Edition, 2005 20.3 TNI Standard, Volume 1, Management and Technical Requirements for Laboratories Performing
Environmental Analysis, 2009 20.4 Minnesota Statutes, 144.97 to 144.99; Minnesota Rules, Chapter 4740


![Minnesota Water Resources Conference · Minnesota Stormwater Manual: “… [to] manage stormwater in a way that conserves, enhances, and ... St. Anthony Falls Laboratory . Minnesota](https://img.pdfslide.net/doc/110x75/5f513ddfe5f918157102ae78/minnesota-water-resources-conference-minnesota-stormwater-manual-aoe-to-manage.jpg)