Embed Size (px)
Citation preview

Southeastern Regional CenterSoutheastern Regional CenterTennessee Agricultural Experiment Tennessee Agricultural Experiment StationStation
U.S. Energy U.S. Energy Situation & Situation &
OutlookOutlook
April 3-4, 2007
Jackson, TNCookeville, TN
Dr. Kelly Tiller
UT Extension Agent TrainingBioenergy Production in Agriculture
Agricultural Policy Analysis Center - The University of Tennessee - 310 Morgan Hall - Knoxville, TN 37996-4519
www.agpolicy.org - phone: (865) 974-7407 - fax: (865) 974-7298AAPP CCAA

Southeastern Regional CenterSoutheastern Regional CenterTennessee Agricultural Experiment Tennessee Agricultural Experiment StationStation
Motivators of ChangeMotivators of Change
High and volatile energy prices– Relatively stable, but at a much
higher equilibrium– Subject to rapid spikes
Photo: iStockPhoto.com

Southeastern Regional CenterSoutheastern Regional CenterTennessee Agricultural Experiment Tennessee Agricultural Experiment StationStation
Rate of Use
FranceS. KoreaBrazilCanadaIndiaRussiaGermanyChina
U.S.Japan
Mexico
0% 10% 15% 20%5% 25%
Oil Reserves
U.S.NigeriaLibyaRussiaVenezuelaU.A.E.KuwaitIraqIranCanadaSaudi Arabia
2%2%
3%5%
6%8%8%
9%10%
14%21%
Updated July 2005. Source: International Energy Annual 2003 (EIA), Tables 1.2 and 8.1-O&GJ. Canada’s reserves include tar sands.
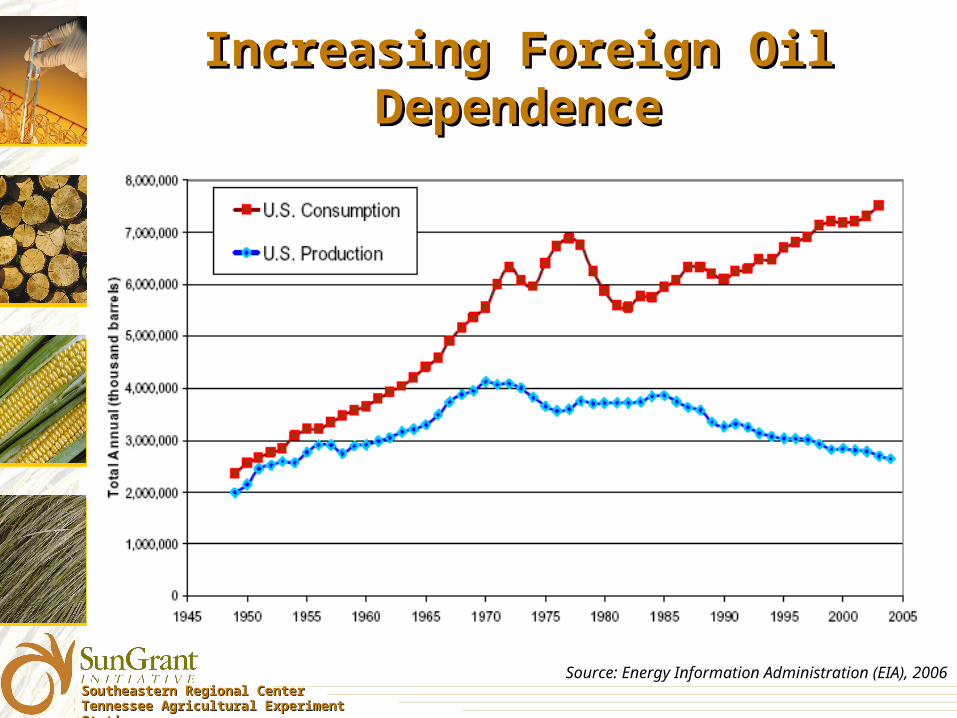
The United States uses more oil than the next five highest-consuming nations combined.3%
3%3%3%3%3%3%
7%
25%7%
3%
U.S. Dependence on Foreign OilU.S. Dependence on Foreign Oil

Southeastern Regional CenterSoutheastern Regional CenterTennessee Agricultural Experiment Tennessee Agricultural Experiment StationStation
Motivators of ChangeMotivators of Change
High and volatile energy prices– Relatively stable, but at a much higher equilibrium– Subject to rapid spikes
National security, energy independence– America accounts for 25% of global oil consumption,
holds 3% of known oil reserves– 60% of world’s oil reserves are in unstable regions
Economic well being
Environmental sustainability

Southeastern Regional CenterSoutheastern Regional CenterTennessee Agricultural Experiment Tennessee Agricultural Experiment StationStation
Energy Use ProjectionsEnergy Use Projections
Source: 25x’25 Report, 2006
Total energy production and consumption, 1980-2030 (quadrillion Btu)

Southeastern Regional CenterSoutheastern Regional CenterTennessee Agricultural Experiment Tennessee Agricultural Experiment StationStation
U.S. Energy ConsumptionU.S. Energy Consumption
Biomass Consumption Million dry tons/year
Forest products industry Wood residues Pulping liquorsUrban wood & food & other process residuesFuelwood (residential/commercial & electric utilitiesBiofuelsBioproducts
TOTAL
44 52 35 35 18 6
190
Source: Energy Information Administration (EIA), 2006
Southeastern Regional CenterSoutheastern Regional CenterTennessee Agricultural Experiment Tennessee Agricultural Experiment StationStation
Increasing Foreign Oil DependenceIncreasing Foreign Oil Dependence
Source: Energy Information Administration (EIA), 2006

Southeastern Regional CenterSoutheastern Regional CenterTennessee Agricultural Experiment Tennessee Agricultural Experiment StationStation
Transportation Fuel FocusTransportation Fuel Focus
Today, 97% of our transportation fuel
comes from petroleum sources

Southeastern Regional CenterSoutheastern Regional CenterTennessee Agricultural Experiment Tennessee Agricultural Experiment StationStation
Current Biofuels ProductionCurrent Biofuels Production
The US consumes 385 milliongallons of gasoline per day
US produced 4.9 billion gallons of ethanol in 2006– Primarily corn-based ethanol
US produced 250 million gallons of biodiesel in 2006– Primarily from soybean oil and waste greases
Other alternative transportation fuels include natural gas, propane, electric, hybrids, hydrogen

Southeastern Regional CenterSoutheastern Regional CenterTennessee Agricultural Experiment Tennessee Agricultural Experiment StationStation
U.S. Corn Ethanol ProductionU.S. Corn Ethanol Production
0
1,000
2,000
3,000
4,000
5,000
6,000
7,000
8,000
9,000
Mill
ions
of
Gal
lons
of
Eth
anol
1980 1982 1984 1986 1988 1990 1992 1994 1996 1998 2000 2002 2004 2006
Source: Renewable Fuels Association
2012 RFS: 7.5 B gallons
Total Capacity (as of 11/27/06) = existing + under construction + under expansion

Southeastern Regional CenterSoutheastern Regional CenterTennessee Agricultural Experiment Tennessee Agricultural Experiment StationStation
U.S. Ethanol ProductionU.S. Ethanol Production
Source: Renewable Fuels Association, 1/29/07
Currently: 5.6 bgy capacity at 114 biorefineries (purple dots)
Near Future: Additional 6.9 bgy capacity at 80 biorefineries under construction and 7 under expansion (yellow)
TOTAL: More than 12.5 bgy capacity

Southeastern Regional CenterSoutheastern Regional CenterTennessee Agricultural Experiment Tennessee Agricultural Experiment StationStation
The Push Toward EthanolThe Push Toward Ethanol
51¢ per gallon excise tax credit– 5.1¢ per gallon up to 10% blended gasoline– In place through 2010
Several states have banned additive MTBE
Renewable fuels standard (RFS) is 7.5 billion gallons by 2012– Included in 2005 Energy Policy Act– Some efforts to push RFS higher
Oil prices higher
Southeastern Regional CenterSoutheastern Regional CenterTennessee Agricultural Experiment Tennessee Agricultural Experiment StationStation
The (recent) Ethanol StoryThe (recent) Ethanol Story
Major oil (energy) companies stopped producing MTBE in May 2005– 3 to 3.5 billion gallons of ethanol needed to
replace MTBE as an oxygenate
54¢ per gallon tariff on imported ethanol
Summer 2006: Ethanol prices jumped sharply to $3.50 to $4.00 per gallon
Ethanol industry profit margins soared, leading to huge industry expansion

Southeastern Regional CenterSoutheastern Regional CenterTennessee Agricultural Experiment Tennessee Agricultural Experiment StationStation
Biofuels Production in TNBiofuels Production in TN
Source: TN Dept. of Environment & Conservation Presentation, 12/06

Southeastern Regional CenterSoutheastern Regional CenterTennessee Agricultural Experiment Tennessee Agricultural Experiment StationStation
Biodiesel: From 0 to 75 mgyBiodiesel: From 0 to 75 mgy
Source: TN Dept. of Environment & Conservation Presentation, 12/06

Southeastern Regional CenterSoutheastern Regional CenterTennessee Agricultural Experiment Tennessee Agricultural Experiment StationStation
Biofuel Use in TennesseeBiofuel Use in Tennessee
> 60,000 flexible fuel vehicles (FFVs) in Tennessee
Only 2 public E85 fueling stations in TN– Nashville and Clarksville– Some additional fleet supply
Significant portion of gasoline blended with 10% ethanol, widely available
Biodiesel much more widely available to the public
Significant fleet use of biofuels, especially biodiesel

Southeastern Regional CenterSoutheastern Regional CenterTennessee Agricultural Experiment Tennessee Agricultural Experiment StationStation
Proposed Biofuel CorridorProposed Biofuel Corridor
Source: TN Dept. of Environment & Conservation Presentation, 12/06

Southeastern Regional CenterSoutheastern Regional CenterTennessee Agricultural Experiment Tennessee Agricultural Experiment StationStation
Visioning the Energy FutureVisioning the Energy Future
25x’25– By 2025, America’s farms, ranches and forests will
provide 25% of the total energy consumed in the U.S.while continuing to produce safe, abundant and affordable food, feed and fiber
20 in 10– Goal in President’s 2007 State of the Union Address to replace 20% of
our transportation fuels with renewable sources by 2017
30 by ’30– DOE’s 2002 “Vision”: goal of replacing 30% of our energy use with
renewable sources in 30 years
36 bgy RFS by 2022– New legislation proposed to increase the RFS from 7.5 bgy in 2012 to
36 bgy in 10 more years, 21 bgy from advanced ethanol sources

Southeastern Regional CenterSoutheastern Regional CenterTennessee Agricultural Experiment Tennessee Agricultural Experiment StationStation
U.S. Corn Ethanol ProductionU.S. Corn Ethanol Production
0
1,000
2,000
3,000
4,000
5,000
6,000
7,000
8,000
9,000
Mill
ions
of
Gal
lons
of
Eth
anol
1980 1982 1984 1986 1988 1990 1992 1994 1996 1998 2000 2002 2004 2006
0
3,000
6,000
9,000
12,000
15,000
Mill
ions
of
Gal
lons
of
Eth
anol
1980 1983 1986 1989 1992 1995 1998 2001 2004 2007 2010 2013 2016 2019
Source: Renewable Fuels Association
2012 RFS: 7.5 B gallonsTotal Capacity (as of 11/27/06) =
existing + under construction + under expansion
There’s a limit to the amount of corn-based
ethanol we can sustainably produce
without disrupting the ag sector
Could potentially double corn-ethanol capacityTennessee crop farmers benefit from corn-ethanol, wherever plants are locatedIncreases livestock feed prices

Southeastern Regional CenterSoutheastern Regional CenterTennessee Agricultural Experiment Tennessee Agricultural Experiment StationStation
Energy In vs. Energy OutEnergy In vs. Energy Out
5.3
1.40.8
0.4
0
1
2
3
4
5
6
Fos
sil E
nerg
y R
atio
=
(En
erg
y D
eliv
ere
d to
Cu
sto
me
r / F
oss
il E
ne
rgy
Use
d)
Cellulosic EthanolBiorefinery
Corn Ethanol Gasoline Electricity
Source: J. Sheehan & M. Wang (2003)
The road to petroleumdisplacementis paved with
cellulosic biomass
* Some newer estimates of cellulosic FER >10
*

Southeastern Regional CenterSoutheastern Regional CenterTennessee Agricultural Experiment Tennessee Agricultural Experiment StationStation
A Billion Tons of BiomassA Billion Tons of BiomassSustainable annual supply of 1.3 billion dry tons
932 M dry tons from agriculture
– Crop residues (446)– Perennial crops (377)– Grains to biofuels (87)– Process residues (87)
368 M dry tons from forests (forest residue only)
– Manufacturing residue (145)– Logging debris (64)– Fuel reduction treatments (60)– Fuelwood (54)– Urban wood waste (47)
Perlack, R.D., et al. 2005. Biomass as Feedstock for a Bioenergy and BioproductsIndustry: The Technical Feasibility of a Billion-Ton Annual Supply.

Southeastern Regional CenterSoutheastern Regional CenterTennessee Agricultural Experiment Tennessee Agricultural Experiment StationStation
Complex BalanceComplex Balance
Market demands and alternative uses
Crop returns
Feed (input) prices
Impacts on land prices and rents
Global trade impacts (developing countries)
Environmental impacts
Sustainability
Risk