Embed Size (px)
Citation preview
1
African Studies Association of Australasia and the Pacific (AFSAAP)
37th Annual Conference – Dunedin – New Zealand – 25-26 November 2014
Conference Proceedings (published January 2015)
Africa: Diversity and Development
Southern Africans in the Antipodes
David Lucas and Barbara Edgar
The Australian National University
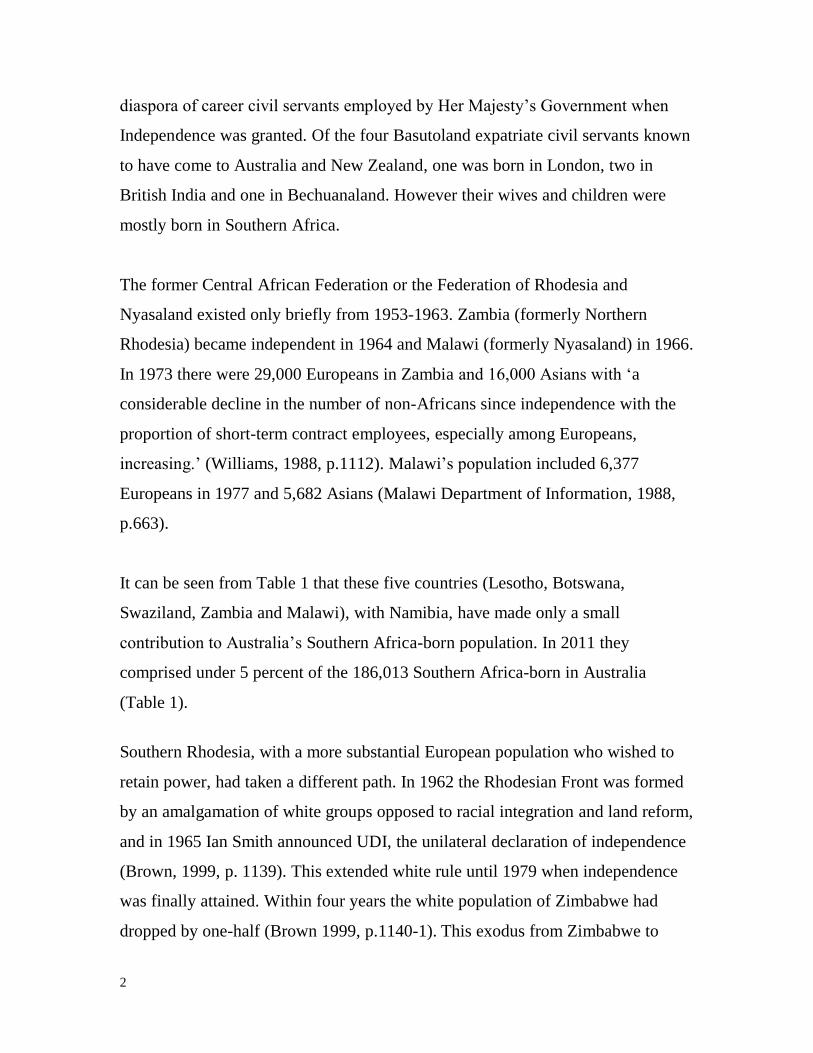
Historical introduction
The emigration of people born in Southern Africa to Australia and, to a lesser
extent, New Zealand has increased substantially in the last five decades. In 1961
the number of Africa-born in Australia (excluding those born in Egypt) was
12,272, of whom 7,896 were born in South Africa and 4,376 in ‘Other countries in
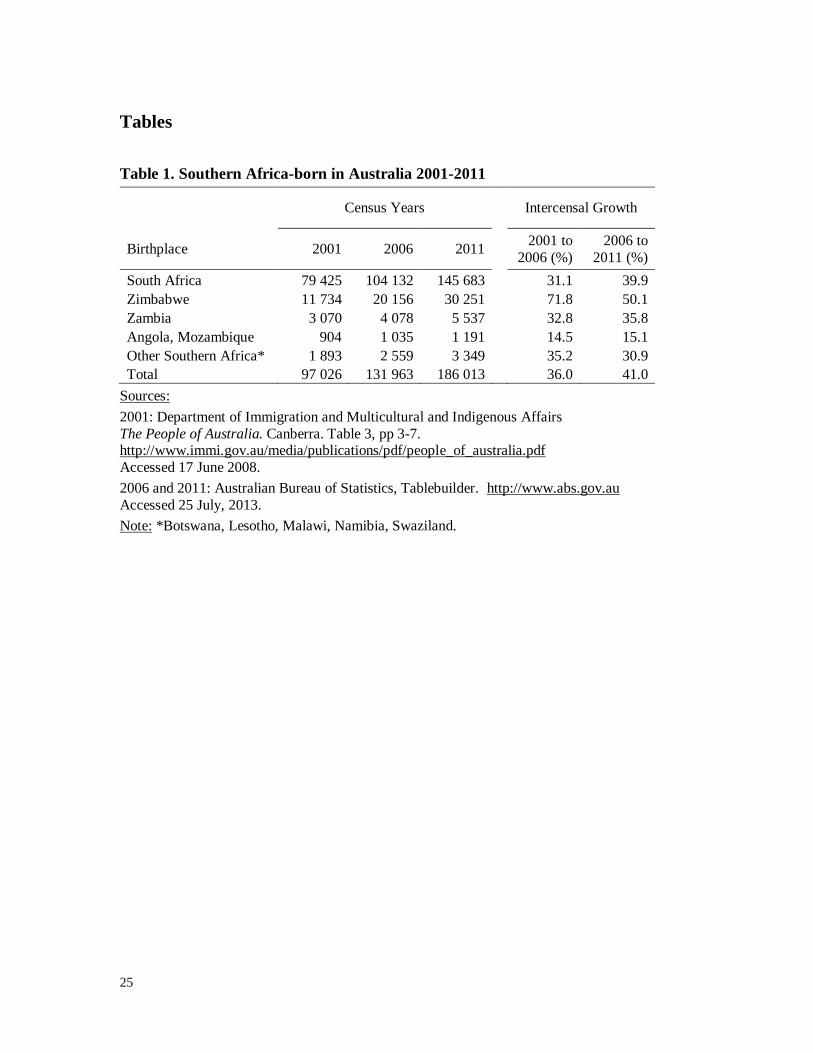
Africa’ (Australian Bureau of Statistics, 1970, p.13). In 2011 the South
Africa-born alone numbered over 145,000, with a further 40,000 from other
Southern African countries (Table 1). This paper adds to the literature on this
migration stream with selected stories of individual migrants and with analysis of
the 2011 Australian Census data.
A convenient starting point is 1960, when the White Australia policy still existed,
although its erosion had already begun (Jupp, 2001, p.865). In February, 1960,
Harold Macmillan, the British Prime Minister, made his famous ‘Wind of Change’
speech to the South African Parliament. Macmillan’s speech was followed by
Independence being granted to five Southern African nations in the 1960s. The
former South African High Commission Territories (Basutoland, Bechuanaland,
and Swaziland) became independent as Lesotho and Botswana in 1966 and
Swaziland in 1968. These countries had relatively small European populations and
Lesotho had no white settler population. Kirke-Greene (2001) referred to the
2
diaspora of career civil servants employed by Her Majesty’s Government when
Independence was granted. Of the four Basutoland expatriate civil servants known
to have come to Australia and New Zealand, one was born in London, two in
British India and one in Bechuanaland. However their wives and children were
mostly born in Southern Africa.
The former Central African Federation or the Federation of Rhodesia and
Nyasaland existed only briefly from 1953-1963. Zambia (formerly Northern
Rhodesia) became independent in 1964 and Malawi (formerly Nyasaland) in 1966.
In 1973 there were 29,000 Europeans in Zambia and 16,000 Asians with ‘a
considerable decline in the number of non-Africans since independence with the
proportion of short-term contract employees, especially among Europeans,
increasing.’ (Williams, 1988, p.1112). Malawi’s population included 6,377
Europeans in 1977 and 5,682 Asians (Malawi Department of Information, 1988,
p.663).
It can be seen from Table 1 that these five countries (Lesotho, Botswana,
Swaziland, Zambia and Malawi), with Namibia, have made only a small
contribution to Australia’s Southern Africa-born population. In 2011 they
comprised under 5 percent of the 186,013 Southern Africa-born in Australia
(Table 1).
Southern Rhodesia, with a more substantial European population who wished to
retain power, had taken a different path. In 1962 the Rhodesian Front was formed
by an amalgamation of white groups opposed to racial integration and land reform,
and in 1965 Ian Smith announced UDI, the unilateral declaration of independence
(Brown, 1999, p. 1139). This extended white rule until 1979 when independence
was finally attained. Within four years the white population of Zimbabwe had
dropped by one-half (Brown 1999, p.1140-1). This exodus from Zimbabwe to
3
Australia has been discussed elsewhere (Lucas, Jamali & Edgar, 2011; Forrest ,
Johnston & Poulsen 2013). As shown in Tables 1 and 2, this accelerated after
2001, particularly to New Zealand.
The 1974 coup in Portugal liberated Angola (1975) and Mozambique (1976). This
had little impact on Australia and New Zealand migration because large numbers
returned to Portugal. For Angola, an estimated 350,000 whites were repatriated to
Portugal (Pelissier 1988a, p.231). For Mozambique, a similar flow must be
assumed, with the white population decreasing by 80% to less than 20,000
between 1973 and the late 1980s (Pelissier 1988b, p.722).
South West Africa was formerly a German colony administered by a United
Nations Mandate since 1920. However by 1968/9 ‘Namibia was, in effect,
integrated into South Africa’ (Spray, 1988, p.745). In 1966 the South West Africa
People’s Organisation (SWAPO) had begun an armed struggle against South
Africa and this continued for over 20 years, spilling over the northern border into
Angola. However the small white population which owned most of the land lived
in the south. Namibia gained its independence in 1990.
The final country to achieve multi-racial democracy was South Africa, marked by
the 1994 elections. In 1990 President De Klerk had unbanned the ANC and the
PAC and this enabled anti-apartheid exiles to return to South Africa. These
included a small number from Australia, notably Eddie Funde who was Chief
Representative of the ANC’s Australasia and Pacific Mission (Who’s Who
Southern Africa, no date). Anecdotal evidence suggests that a few of the younger
ANC exiles were not keen to return.
4
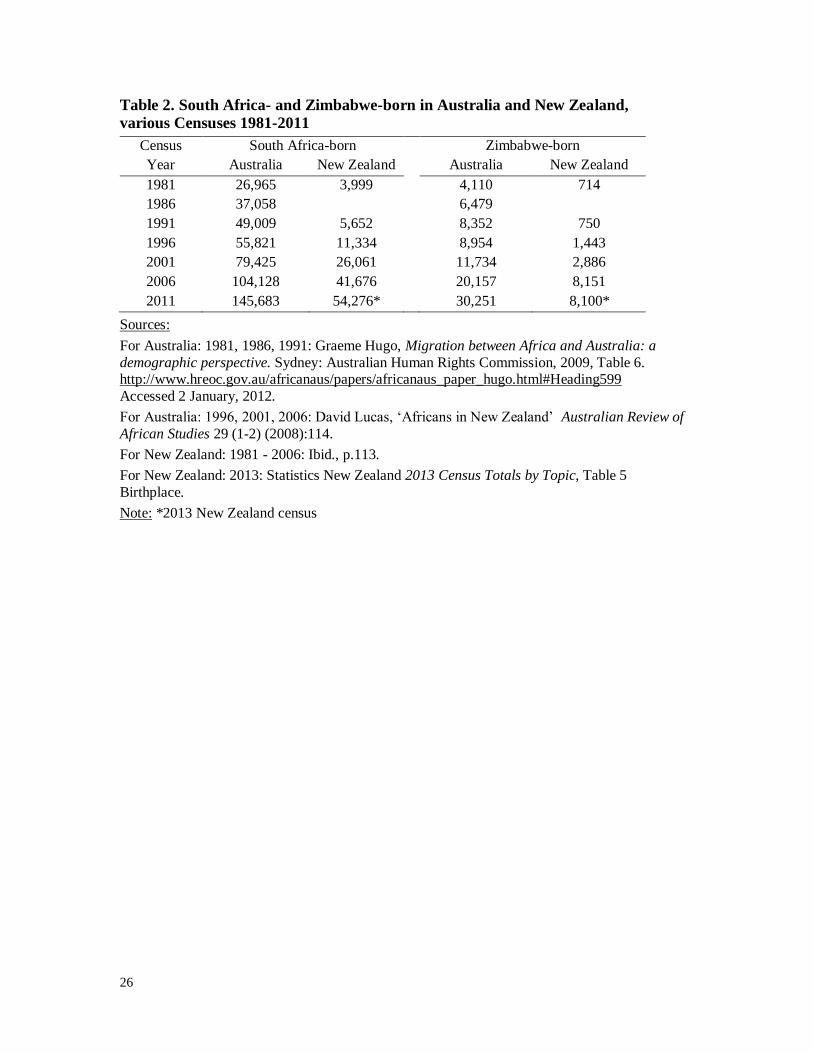
Table 2 shows the growth in the numbers of South Africa-born in Australia and
New Zealand. In the decades following independence, the population in Australia
has tripled, and the New Zealand population has seen a nearly tenfold increase.
Movement within Southern Africa
Historically there has been considerable movement within Southern Africa, with
whites predominating in permanent moves (Zinyama, 1990, p748). Below are
some examples of Southern Africans who emigrated to Australia and had
experience of more than one country within the region. Some born outside South
Africa went there for education, often to the English-speaking universities, and
also for employment.
Jaimes Leggett, appointed Chief Executive of M&C Saatchi Australia in 2013,
was born in Botswana, went to school in South Africa and moved to New Zealand
with his family when he was 13 (Crisp 2013). Pamela Angus-Leppan was born in
Zambia in 1931, educated in Johannesburg and settled in Australia in 1962. In the
Who’s Who of Australian Women (2006, p.47), she was described as being a
Management Consultant and Company Director. Launa Inman was born and
raised in Zimbabwe (Australian Institute of Company Directors 2014, p.1) and
came to Australia in 1997 to run Big W’s clothing store. Previously she had been
working in merchandising in South Africa (Who’s Who of Australian Women,
2006, p.542).
Born in Bulawayo, Judith Neilson ‘became Australia’s second-richest woman
over-night in 2007 after her husband, Kerr floated a big chunk of his company
Platinum Asset Management on the stock exchange’ (Hare, 2015). She had studied
textile and graphic design in Durban before moving to Australia with her South
Africa-born financier husband in1983 (Verghis, 2010).
5
In 2015 Gail Kelly retired as CEO of Westpac. She was born in Pretoria in 1956
and after marrying Allan Kelly, they went to Rhodesia in 1977 as he was required
to undertake compulsory military service there. They then moved to the University
of Witwatersrand for his medical studies. He subsequently became a pediatrician.
Worried about their children’s future they emigrated to Australia in 1997 (Murphy
2005).
Dr Mary White grew up in Southern Rhodesia and gained her Master’s degree in
Botany at the University of Cape Town. She and her family migrated to Australia
in 1955 and until the late 1980s she was a consultant to the Bureau of Mineral
Resources in Canberra (Sustainable Population Australia, n.d.).
Famous popular author Bryce Courtenay (1933-2012) was born in South Africa
but worked in the mines in Rhodesia. His first novel was published about thirty
years after his arrival in Australia (Steger & Dow, 2012).
Andrew Murray, a member of the Australian Senate from 1996 to 2008, was born
in Hove, England, in 1947 and sent as a Fairbridge child migrant to Zimbabwe
when aged four. He was educated at Rhodes University and was a Rhodes Scholar
at Oxford but was deported from South Africa in 1968. He migrated to Australia
in 1989 (Parliament of Australia, n.d.).
Using birthplace data understates the number of people coming from Southern
Africa to Australia. An example is John Omer-Cooper who was born in England
but moved to South Africa as a child when his father was appointed Professor of
Zoology at Rhodes University. After lecturing at the University of Lagos from
1955-1965, Omer-Cooper became Foundation Professor of History at the
6
University of Zambia, moving to New Zealand in 1974 after a ‘near miss with a
letter bomb’ (Burnett, 1998).
In the case of Zimbabwe, which was once a destination for white immigrants
(Mlambo 2010), birthplace data omits people not born in Zimbabwe who have
spent much of their working lives there. During the period 1941 to 1957 the
number of Europeans in Zimbabwe almost tripled, from 67,000, due to the
unprecedented rate of immigration (Gordon-Brown 1959, p.261). Thus many of
those who sought to leave Zimbabwe in later years had spent most of their
working lives there but were not Zimbabwe-born.
Reports of deaths in the Bundu Times, published in Western Australia by the
Rhodesian Association, indicate that several members were born in South Africa
or Britain, emigrated to Rhodesia and then to Australia. In the issue dated
August/September 1995, John Plant, a commercial pilot, and his wife Sylvia
described their move from England to Rhodesia circa 1959 with their children.
After 33 years in Africa they followed their now adult son and daughter, who had
been living respectively in South Africa and Harare, to Western Australia.
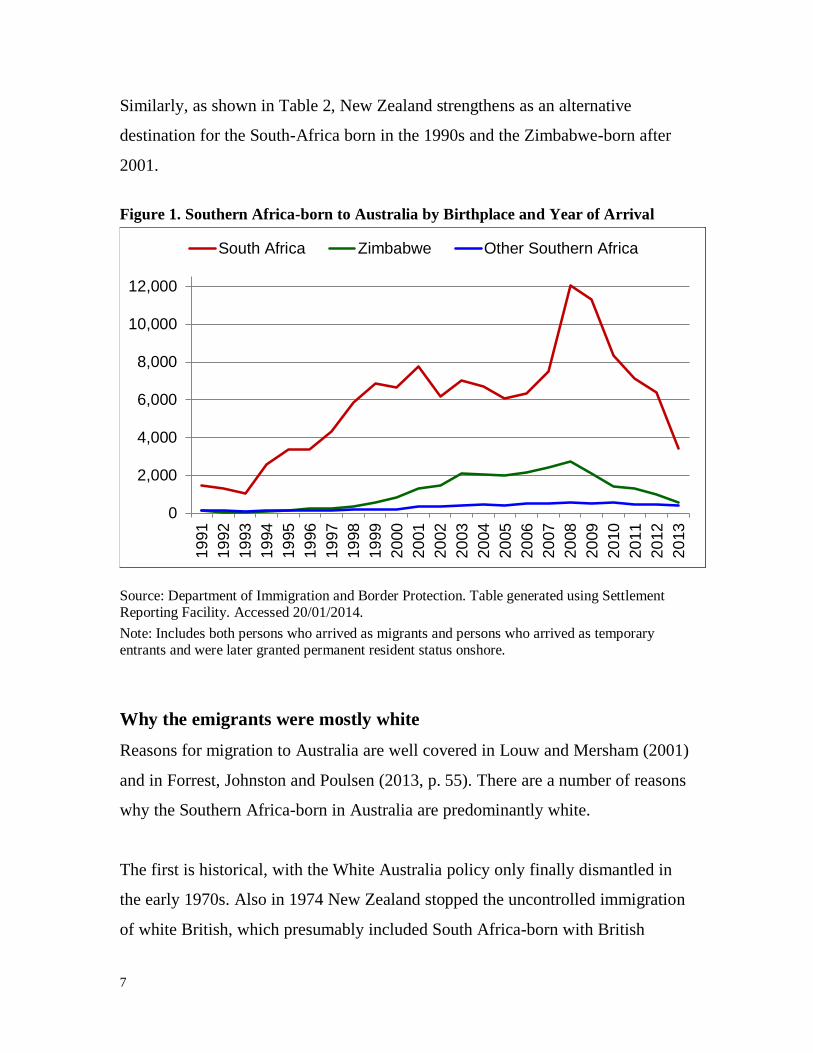
Figure 1 shows the flow of Southern Africans into Australia, with South Africa
and Zimbabwe as the most important origin countries. Significant dates
foreshadowing an increase in numbers are 1994 for South African, when the first
elections were held, and around 2000 in Zimbabwe when white farmers were
under pressure and the Australian Government was pro-active in bringing white
farmers to Australia. The declines after 2009 may be related to the Global
Financial Crisis (GFC).
7
Similarly, as shown in Table 2, New Zealand strengthens as an alternative
destination for the South-Africa born in the 1990s and the Zimbabwe-born after
2001.
Figure 1. Southern Africa-born to Australia by Birthplace and Year of Arrival
Source: Department of Immigration and Border Protection. Table generated using Settlement Reporting Facility. Accessed 20/01/2014.
Note: Includes both persons who arrived as migrants and persons who arrived as temporary entrants and were later granted permanent resident status onshore.
Why the emigrants were mostly white
Reasons for migration to Australia are well covered in Louw and Mersham (2001)
and in Forrest, Johnston and Poulsen (2013, p. 55). There are a number of reasons
why the Southern Africa-born in Australia are predominantly white.
The first is historical, with the White Australia policy only finally dismantled in
the early 1970s. Also in 1974 New Zealand stopped the uncontrolled immigration
of white British, which presumably included South Africa-born with British
0
2,000
4,000
6,000
8,000
10,000
12,000
19
91
19
92
19
93
19
94
19
95
19
96
19
97
19
98
19
99
20
00
20
01
20
02
20
03
20
04
20
05
20
06
20
07
20
08
20
09
20
10
20
11
20
12
20
13
South Africa Zimbabwe Other Southern Africa
8
passports, by requiring that all Commonwealth citizens of European ancestry
living outside Australia have an entry permit (Farmer 1985, p.66). Even so, whites
emigrating later may have had networks in Australia which non-whites did not,
and these would help sustain the chain migration flow.
Secondly the white Europeans in Southern Africa were generally well educated
under the colonial regimes and, with the exception of those in Mozambique and
Angola, were generally proficient in English. Furthermore they would have had
more opportunities to improve their human capital by gaining work experience in
the professions, management and trades. Amoateng, Kalule-Sabiti and Lucas
(2004), using 1996 South African Census data, have shown that in terms of
gaining skills and experience that would meet the minimum requirements for
emigration, South African whites and Asians would have a distinct advantage over
the black population.
Thirdly Africanisation, which involved replacing white expatriates by locals,
meant more opportunities for Africans. In South Africa, policies of black
empowerment and positive discrimination for women led to the quip that white
South African males were an endangered species. In 2000, Marisa Fick-Jordaan
said that she was a seventh generation South African to whom the concept of
living somewhere else was crazy, but she empathised with the white emigrant who
had four young boys feeling that there was ‘…not a hope in hell for a white male
in South Africa…’ (Laurie 2000).
Flows from South Africa to Australia
Louw and Mersham (2001) have identified five waves of emigrants from South
Africa, ‘each wave being bigger than the one preceding it.’ A common theme
among the emigrants’ stories is the desire to escape from violence or threatened
violence.
9
The first two waves ran from the 1950s to the late 1970s. Two significant events
were the Sharpeville Massacre of 1960 and the 1976 Soweto revolt. Mary Walters,
who arrived from South Africa in the 1950s, said that ‘We could see the writing on
the wall even then.’ (Younes 2002, p.7). Dr Sidney Sax (1920-2001) was a pioneer
in Australian health planning. ‘In 1960 he made the same decision as many of his
liberal-leaning fellow country people and left a nation that was becoming
increasingly isolated because of its apartheid policies.’ (Cooke 2001)
Neville Curtis came to Canberra in 1974 ‘having fled South Africa, where he was
a banned person for his opposition to the apartheid regime’ (O’Dwyer 2007). He
was preceded to Australia by his friend John Brink who had been imprisoned
during the State of Emergency after Sharpeville. Together with his wife Margaret
Brink he founded the Australian anti-apartheid movement (ABC Radio National
2011).
The third and fourth waves occurred from the late 1970s until 1990. This period
included the State of Emergency declared in 1985. Writing in the late 1980s,
Kennedy (1988, p.802) observed that:
‘Today most South African immigrants are white, well educated and from
the large cities… Alienation from the Nationalist regime and its policies
(including military conscription) has motivated many among English-
speaking liberals, academics and disenfranchised non-white groups such as
the Cape Coloured people to leave. Black Africans, are conspicuous by
their absence.’
South African lawyer Andrea Durbach migrated to Australia in 1989. She had
previously represented 25 black South Africans accused of the murder of a
policeman, a trial described in her 1999 book Upington. Andre Biet emigrated in
10
1986 as a result of the violence and economic uncertainty in South Africa
(Manning 2004). In 1991 he and his partners founded the property developer,
Charter Hall.
Figure 1 indicates that the fifth wave, which began with the negotiations that led to
the multi-racial 1994 elections, appears to have ended around the time of the
2007/8 GFC which preceded the end of the mining boom. The family of Clyde
Rathbone, who played rugby for the Brumbies and Wallabies, is an example of a
family reunion migrant. ‘Clyde was the first of the four Rathbone brothers to move
to Australia from South Africa in 2002. His mother Glynis and younger brothers
Dayne, Luke, 22, and Rory, now 20, followed in 2006. His father Alan commuted
between the countries for six years’ (Doherty 2013). Glynis Rathbone had been
seriously injured in a home invasion in South Africa, which confirmed the
family’s decision to migrate permanently to Australia (ABC Stateline, 2006).
In introducing their study of the five waves of emigrants from South Africa, Louw
and Mersham (2001, p. 308) commented that:
‘Our ethnographic studies of the South African community in Australia
undertaken in 1998 and 2000 confirmed that this diasporic community is
not limited to ex-South African citizens or South African-born people. It
has also come to include whites, Indians and coloreds (WICs) from other
Southern African countries like Zimbabwe, Namibia and Zambia.
Rhodesians (i.e. white Zimbabweans), in particular, form an important
subgroup within the wider South African diaspora.’
However, the experience of Zimbabweans in the 21st century means that they
should not be lumped together with South Africans as suggested. Whereas the
acceleration in South Africa-born settlers to Australia began around 1994, for the
Zimbabwe-born it began around 2000, as shown in Figure 1. Recent flows from

11
Zimbabwe include substantial numbers of black Zimbabwe-born, mostly Shona
speakers as discussed later.
Skilled flows and human capital
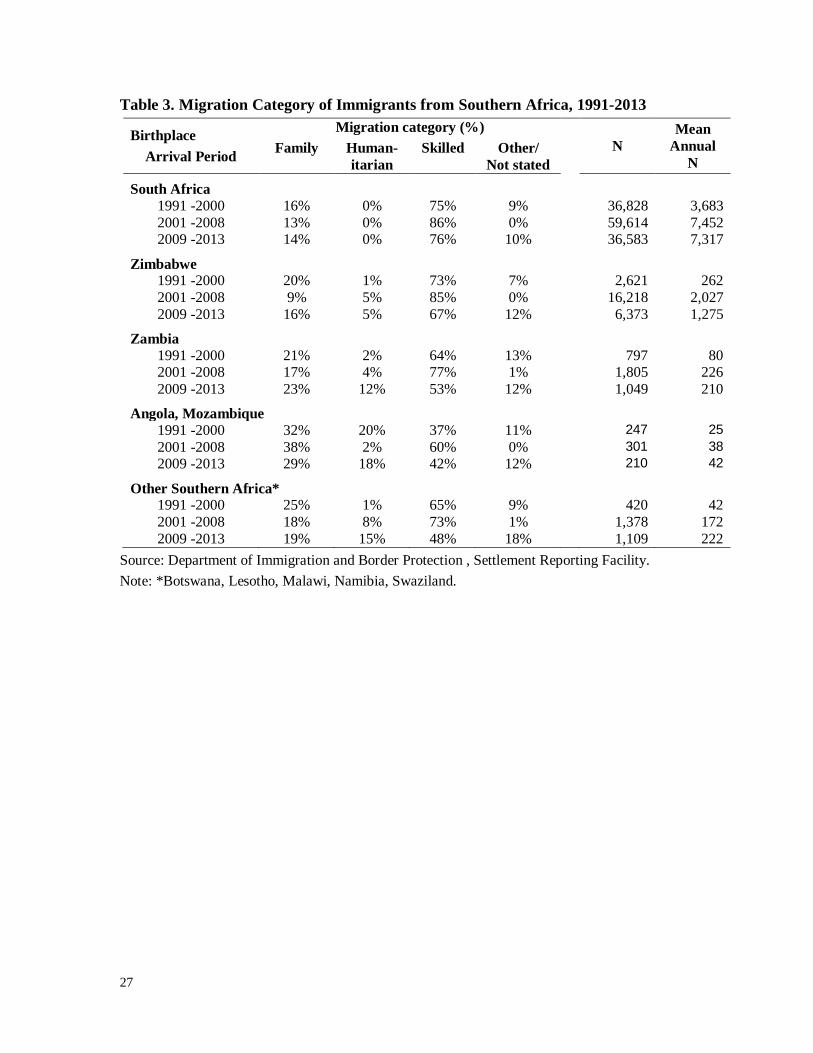
The Southern Africa-born in Australia are a relatively advantaged group. The
majority have arrived as skilled migrants, with over three-quarters of South
African migrants in this category (see Table 3). However numbers of humanitarian
entrants from Southern Africa, traditionally very low, have increased recently.
From 2009 to 2013, 18% of settlers from Angola and Mozambique arrived under
the humanitarian program, as did 15% from ‘Other Southern Africa’, mainly
Malawi, and 12% from Zambia.
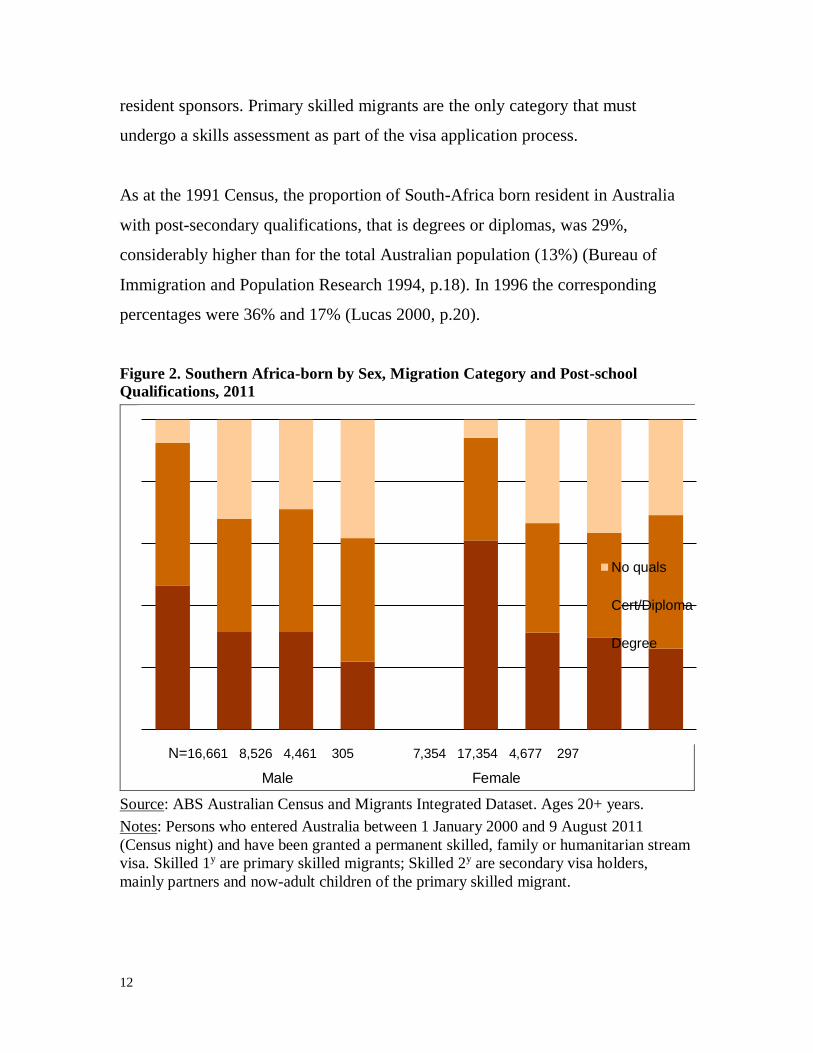
Figure 2 shows the prevalence of educational qualifications among recently-
arrived skilled, family and humanitarian migrants from southern Africa, as at the
2011 Census. The large majority, 84%, are skilled migrants, almost half of whom
have met the selection criteria for a skilled visa (1y or primary skilled migrants),
while a little over half were members of the migrating family unit (2y or secondary
skilled migrants).
As expected, primary skilled migrants are the most highly educated category, with
over 90% holding a post-school qualification and around half (47% of males and
61% of females) having a university degree. Humanitarian entrants are the least
likely to have a university degree, although 22% of males and 26% of females do
so. Secondary skilled migrants have similar education profiles to family migrants.
The former are mainly the partners and now-adult children of primary skilled
migrants; the latter are mainly partners and now-adult children of Australian
12
resident sponsors. Primary skilled migrants are the only category that must
undergo a skills assessment as part of the visa application process.
As at the 1991 Census, the proportion of South-Africa born resident in Australia
with post-secondary qualifications, that is degrees or diplomas, was 29%,
considerably higher than for the total Australian population (13%) (Bureau of
Immigration and Population Research 1994, p.18). In 1996 the corresponding
percentages were 36% and 17% (Lucas 2000, p.20).
Figure 2. Southern Africa-born by Sex, Migration Category and Post-school
Qualifications, 2011
N=16,661 8,526 4,461 305 7,354 17,354 4,677 297
Male Female
Source: ABS Australian Census and Migrants Integrated Dataset. Ages 20+ years.
Notes: Persons who entered Australia between 1 January 2000 and 9 August 2011
(Census night) and have been granted a permanent skilled, family or humanitarian stream
visa. Skilled 1y are primary skilled migrants; Skilled 2y are secondary visa holders,
mainly partners and now-adult children of the primary skilled migrant.
No quals
Cert/Diploma
Degree
13
The majority of Southern Africans in Australia are proficient in English. In the
1991 Australian Census, the percentage of the South Africa- and Zimbabwe-born
with poor English proficiency was negligible. The percentage who only spoke
English at home was over 88% for the South Africa-born (Bureau of Immigration
and Population Research 1994, p.2). In 2011 73% of Southern Africans in
Australia spoke English only at home, while a further 24% spoke English ‘very
well’. Less than 1% reported not speaking English well (2011 Census data).
Labour force participation
Skilled, well-educated migrants with a good command of English tend to do well
in the Australian labour market. A study by Forrest et al. (2013, p.55) found that
few South Africans or Zimbabweans had any difficulty finding wage or salaried
employment after 6-18 months in Australia, consistent with their pre-emigration
experience.
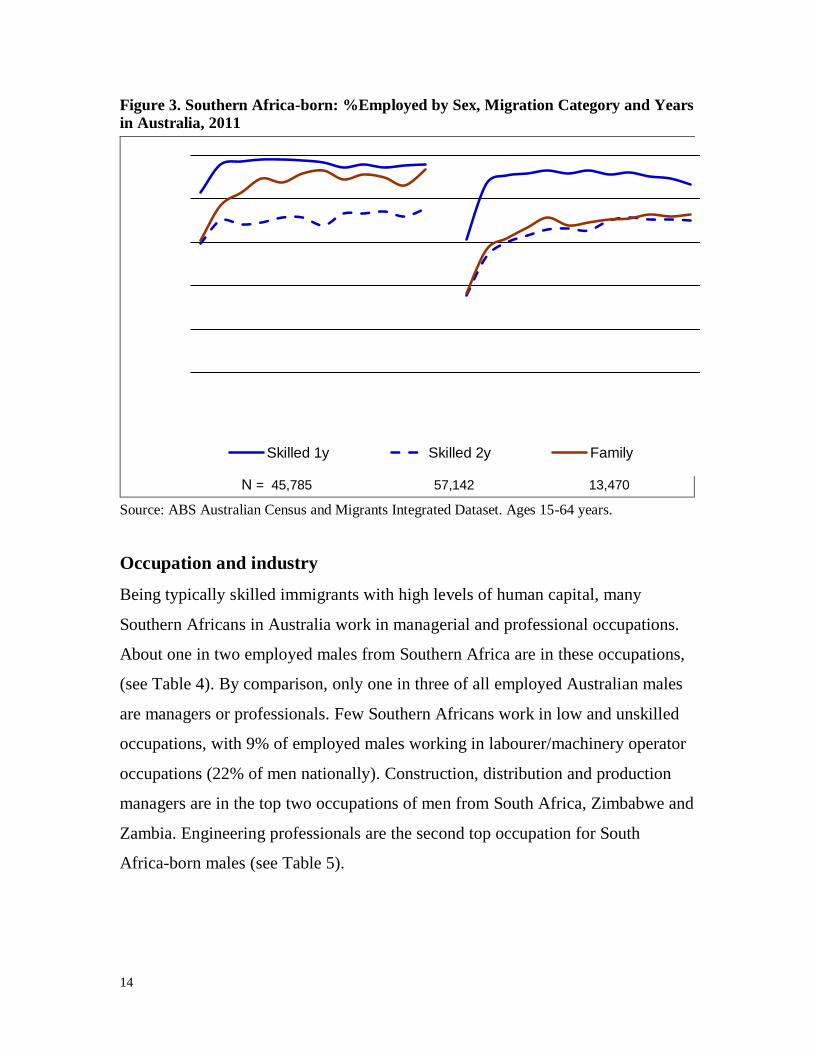
Figure 3 confirms that migrants from Southern Africa have high rates of
employment after a short settling-in period. Twelve months after arrival in
Australia, 96% of ‘primary’ skilled males are employed, as are 87% of ‘primary’
skilled females. Employment rates for ‘secondary’ skilled and family migrants are
a little lower. The gradual decline in employment among ‘primary’ skilled females
over time can be attributed to family formation.
14
Figure 3. Southern Africa-born: %Employed by Sex, Migration Category and Years
in Australia, 2011
N = 45,785 57,142 13,470
Source: ABS Australian Census and Migrants Integrated Dataset. Ages 15-64 years.
Occupation and industry
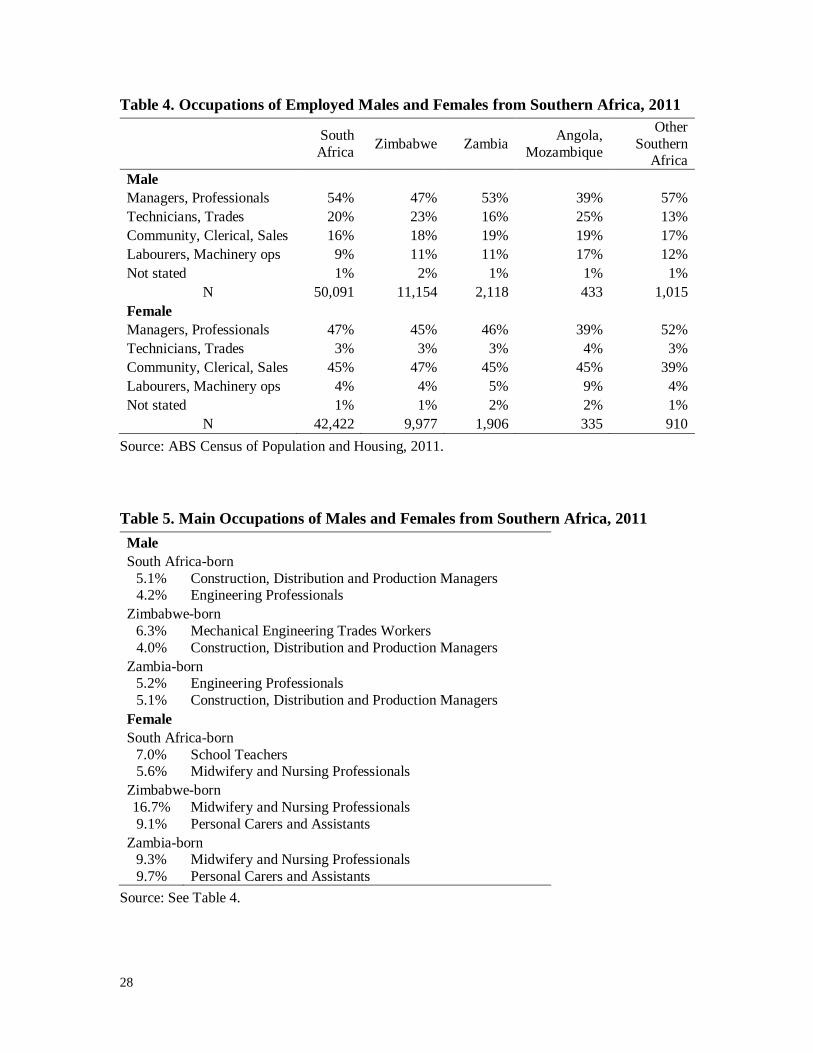
Being typically skilled immigrants with high levels of human capital, many
Southern Africans in Australia work in managerial and professional occupations.
About one in two employed males from Southern Africa are in these occupations,
(see Table 4). By comparison, only one in three of all employed Australian males
are managers or professionals. Few Southern Africans work in low and unskilled
occupations, with 9% of employed males working in labourer/machinery operator
occupations (22% of men nationally). Construction, distribution and production
managers are in the top two occupations of men from South Africa, Zimbabwe and
Zambia. Engineering professionals are the second top occupation for South
Africa-born males (see Table 5).
Skilled 1y Skilled 2y Family
15
Like their male counterparts, females from Southern Africa are more likely to be
employed in managerial/professional occupations (47%), compared with all
Australian women (34%). Only 4% work in labourer/machinery operator
occupations (9% of women nationally). Midwifery and nursing professionals are
in the top two occupations of females from South Africa, Zimbabwe and Zambia.
However, 7% of South Africa-born females work as school teachers, the top
occupation for this birthplace group (see Table 5).
South-African migrants have traditionally been a highly skilled group. In the 1991
Census, 23% of South Africa-born males and females had professional
occupations, compared with 13% of the total Australian population (Bureau of
Immigration and Population Research 1994, p.22). The corresponding percentages
for 1996 were 30% and 18% (Lucas 2000, p.20).
South-African migrants in New Zealand are highly skilled like their counterparts
in Australia. In the 2013 New Zealand Census, of 28,656 people in the ethnic
group profile ‘South Africa, Not Elsewhere Classified’, 27% of employed males
and 33% of employed females were working as professionals.
In terms of industry, 15% of employed males from Southern Africa in Australia
were working in professional, scientific and technical services in 2011. Only 5%
of employed males were working in the mining sector, but this is an area that is in
decline in Australia. One in four employed females from Southern Africa were
working in health care and social assistance, an area which is expected to grow
(2011 Census data).
16
English Speakers
Under the apartheid regime that operated in South Africa the populations were
divided into white, coloured (mixed race), Asian (mostly Indian) and black. These
groupings have persisted in the South African Census and have also been used in
other Southern African countries. As noted previously, white immigrants,
predominantly English speakers, have dominated the flow from Southern Africa to
Australia. Louw and Mersham (2001, p.53) have noted that white Anglo South
Africans were the dominant group in the ‘emerging South African diaspora’. In
Australia at the 1996 Census, 90% of South Africa-born reported speaking English
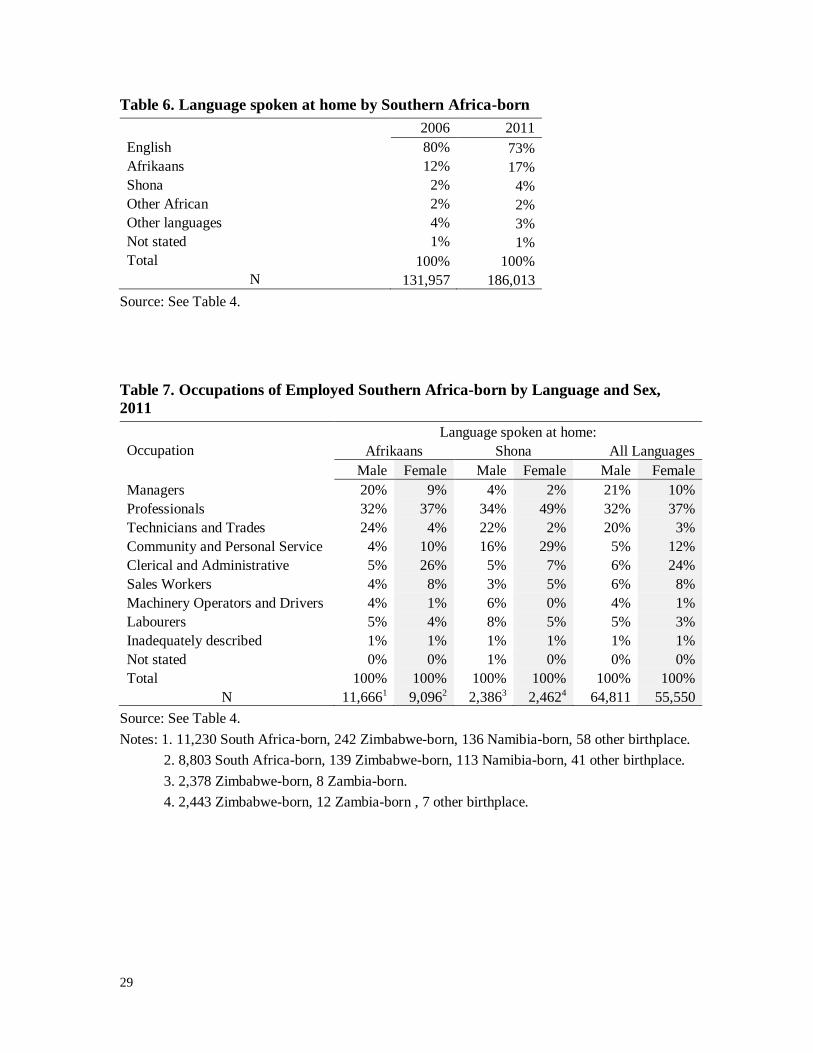
at home, and 6% Afrikaans (Lucas 2000, p.2). By 2006, 80% of migrants from all
countries in Southern Africa spoke English at home, although this had fallen to
73% in 2011 (Table 6).
English-speaking Jews have been a prominent minority amongst the South Africa-
born in Australia. In 1996 13.5% of the South Africa-born in Australia professed
Judaism (Lucas, 2002, p.2). This fell to 8.9% in 2011 (Census data).
Many South African Jews were descendants of Litvacs (Jews from historic
Lithuania) who had arrived between 1880 and 1914 (Mendelsohn and Shain, 2008,
p.34). The Jewish population in South Africa were therefore relatively recently
arrivals without the same commitment to the land as earlier groups. A Jewish
stereotype expressed by British actress Maureen Lipman is that ‘When the going
gets tough, the Jews get packing …’ (Pilditch 2015). Peter Godwin (cited in
Crwys-Williams 2008, p.5) is quoted as saying ‘A white in Africa is like a Jew
everywhere – in sufferance, watching warily, waiting for the next tidal wave of
hostility’.
17
Afrikaans Speakers
Afrikaans speakers in Australia as a percentage of migrants from Southern African
countries have increased in recent years, from 12% at the 2006 Census to 17% in
2011 (Table 6). These would largely be persons of Afrikaner or Cape Coloured
ancestry.
Some people with Afrikaner ancestry would speak English at home, one example
being J. M. Coetzee who migrated to Adelaide in 2002 and won the 2003 Nobel
Prize for Literature. According to Waldren (2005) Coetzee ‘grew up using English
as his first language.’
The Afrikaner population of Southern Africa had its origins in the Dutch East
India Company’s settlement at the Cape in the 17th century. Although Afrikaans
speakers had spread beyond South Africa, for example to South West Africa after
1920 (Spray 1998, p.745), the Australian Afrikaans speakers shown in Table 6 are
predominantly (31,484 out of 32,438 or 97%) South Africa-born. This group has
become a more significant flow in recent years. Analysis of the 2011 Australian
Census shows the percentage of South Africa-born immigrants speaking Afrikaans
at home rose from 6% for those arriving before 1996 to 38% for the 2007-11
arrivals.
Writing just over a quarter of a century ago, Kennedy (1988, p.802) felt that ‘exile
from family and vaderland was particularly painful for Afrikaners’. The
Afrikaners’ undivided loyalty to their land is reflected in the derogatory term
‘soutpiel’ implying someone with one foot in Africa and one in the UK. The
Afrikaners do not have a homeland outside of South Africa unlike the Jews who
are entitled to emigrate to Israel, or holders of UK passports who can migrate to
the European Union.
18
The Statistics New Zealand 2013 Census Ethnic Group Profiles give the following
numbers: person identifying as Afrikaner 1,197; South African Coloured 255; and
‘South African, not elsewhere classified’ 28,656. Philipp and Ho (2010, pp.83-84)
noted that ‘the political and economic turmoil’ related to the transition to
democracy in South Africa coincided with New Zealand’s adoption of a merit-
based points system, thus most of the South Africa-born came as skilled migrants.
Philipp and Ho (2010, pp.85-6) interviewed six South African women in
Hamilton, of which four were Afrikaners, one English South African, and one
Coloured. They perceived ‘an emerging transnational identity amongst some
South African migrants’ (Philipp and Ho 2010, p.81).
As shown in Table 7, over half of the male Afrikaans speakers in 2011 were
managers or professionals. Whether the managers tended to prefer workers who
were also Afrikaans speaking is a possibility. It was certainly the perception of a
disgruntled Australian gold geologist in the late 1990s who was reported as
saying, ‘You won’t get anywhere in the Australian gold mining industry unless
you learn Afrikaans.’ (McIlwraith 1999).
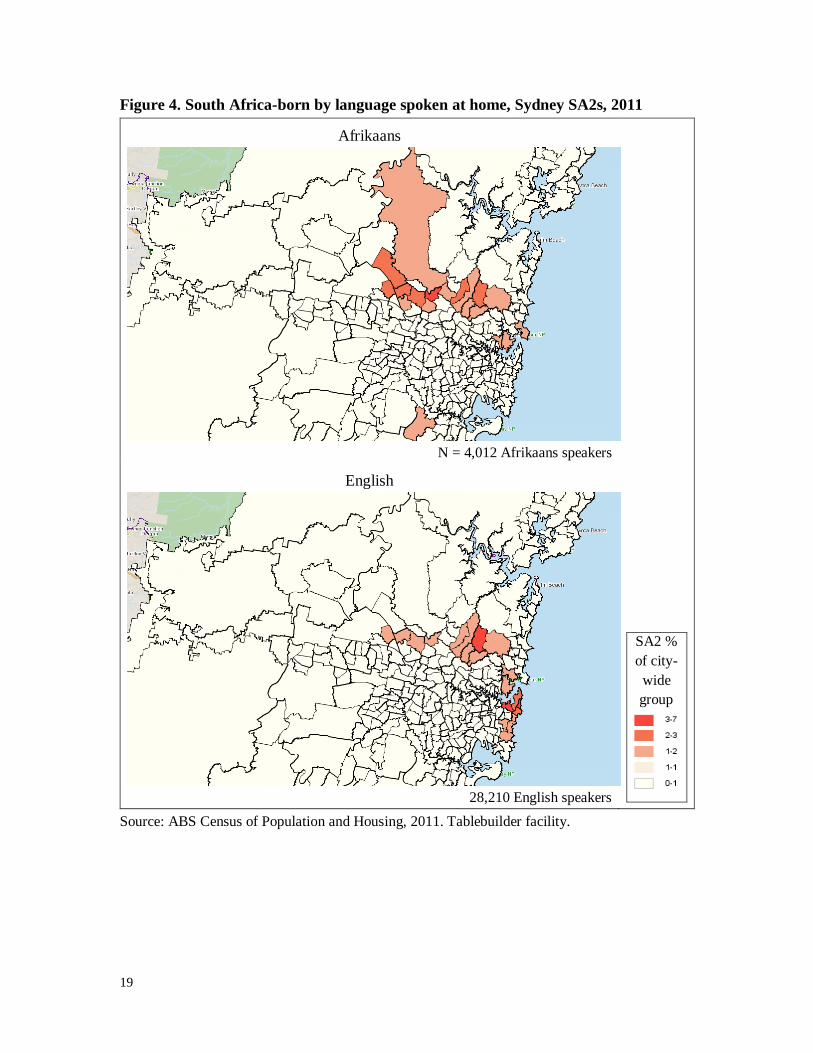
Afrikaans speakers are less spatially concentrated in Australian cities than English
speaking South Africans although both groups tend to favour socioeconomically
advantaged areas. In Sydney the Afrikaans speakers favour the northern suburbs,
as shown in Figure 4. Almost 5% of the Sydney group live in Cherrybrook and
almost 3% in St Ives, two very advantaged suburbs in the top 2 percentiles of
advantage (see the Australian Bureau of Statistics Index of Relative Socio-
economic Advantage and Disadvantage, 2011). More South Africans speak
English at home than speak Afrikaans. English speakers also favour St Ives, where
almost 7% of the Sydney group live, with another cluster centred around the
advantaged eastern suburbs of Dover Heights (4.6%) and Double Bay/Bellevue
Hill (3.1%).
19
Figure 4. South Africa-born by language spoken at home, Sydney SA2s, 2011
Afrikaans
N = 4,012 Afrikaans speakers
English
28,210 English speakers
SA2 %
of city-
wide
group
Source: ABS Census of Population and Housing, 2011. Tablebuilder facility.
20
Shona Speakers
Virtually all (99%) of Southern African Shona speakers in the 2011 Census were
born in Zimbabwe and this group has also been growing quickly. The Census
showed, for the Zimbabwe-born, that Shona speakers scarcely existed in Australia
pre-1980 but that they comprised 45% of the 2007-11 arrivals. Speakers of other
Southern African languages are relatively few in number.
As shown in Table 7 about one third of employed Shona speaking males and one
half of the females are professionals. Compared with the Afrikaans speakers and
the total, however, they are under-represented in managerial positions. Shona
speakers are more likely to be employed as community and personal service
workers, including health workers and carers, than other groups.
Conclusion
Numbers of Southern Africans in Australia will continue to increase but the rate of
increase has already begun to slow. The substantial number of skilled female
immigrants in the health and aged care sectors will continue to have good
employment prospects as the Australian population ages.
Some Southern Africa-born have been extremely successful in Australia in terms
of wealth and celebrity status. It remains to be seen whether the second generation
of Southern Africans, born and educated in Australia, will over time achieve the
educational and labour market advantages of their parents’ generation.
Furthermore language maintenance may prove difficult for speakers of African
languages since a critical mass may not exist because the populations are
geographically spread. This area for further research will be inhibited if Australia
fails to hold its 2016 Census.
21
References
ABC Radio National. (2011). Margaret Brink.
http://www.abc.net.au/radionational/programs/verbatim/margaret-
brink/3678744 .
ABC Stateline. (2006). Aussie Clyde. Report by Chris Kimball.
http://www.abc.net.au/stateline/act/2006/s2624044.htm .
Amoateng, A, Kalule-Sabiti, I. & Lucas, D. (2004). South Africa’s human capital
in the 1990s. Applied Population and Policy, 1, 123-131.
Australian Bureau of Census and Statistics. (1970). 1966 Census of Population
and Housing, Vol 1(3) Birthplace. Canberra: Australian Bureau of Census
and Statistics.
Australian Bureau of Statistics. (2011). Understanding Migrant Outcomes -
Enhancing the Value of Census Data, Australia, 2011, Cat. No. 3417.0
http://www.abs.gov.au/AUSSTATS/[email protected]/Lookup/3417.0Main+Featur
es12011 (accessed 11 March 2014).
Australian Institute of Company Directors. (2014). Q and A with Launa Inman.
http://www.companydirectors.com.au/Director-Resource-
Centre/Publications/Company-Director-magazine/2014-back-
editions/September/Interview-Q-and-A-with-Launa-Inman (accessed 9
February 2015).
Brown, R. (1999). Zimbabwe: recent history. In Africa South of the Sahara
(pp.1137-1144). London: Europa Publications.
Bureau of Immigration and Population Research. (1994). South Africa.
Community Profiles. Canberra: Bureau of Immigration and Population
Research.
Burnett, M. John Omer-Cooper http://h-net.msu.edu/cgi-
bin/logbrowse.pl?trx=vx&list=h-
africa&month=9808&week=c&msg=W5TebKNQUumaFBSBl4Mgy
(accessed 20 February 2015).
Cooke, G. (2001). National health plan pioneer. Canberra Times September,13.
Crisp, L. (2013). Jaimes Leggett. The Deal, 6(4), 6.
Crwys-Williams, J. (2008). The Penguin Dictionary of Quotations. Johannesburg:
Penguin Books.
Doherty, M. (2013). Funny how the Rathbone brothers can tackle comedy, rugby
and themselves. Canberra Times, 31 May 2013, 7.
Durba, Andrea (1999). Upington. Cape Town: David Philip.
22
Farmer, R. (1985). Internal migration. In Population of New Zealand. New York:
United Nations, Vol.1, 54-87.
Forrest , J., Johnston, R., & Poulsen, M. (2013). Middle-class diaspora: recent
immigration to Australia from South Africa and Zimbabwe. South African
Geographical Journal, 95(1), 50-69.
Gordon-Brown, A. (1959). The Year Book and Guide to Southern Africa. London:
Robert Hale.
Hare, J. (2015). $10m gift to help house the neediest. Weekend Australian 17
January 2015, 3.
Burnett, M. (1998). OBIT:John Omer-Cooper. H-Net Discussion Networks.
Jupp, J. (2001). Appendix 2: Chronology. In J. Jupp (Ed.) The Australian People
(pp.859-867). Cambridge: Cambridge University Press.
Kennedy, B. (1988). Southern Africans. In J. Jupp (Ed.) The Australian People
(pp.801-802). Sydney: Angus and Robertson.
Kirke-Greene, A. (2001). Decolonization: the ultimate diaspora. Journal of
Contemporary History, 36(1), 133-151.
Laurie, V. (2000). Weaving shanty town magic. The Australian, 1 January 2000,
13.
Louw, E. & Mersham, G. (2001). Packing for Perth: The growth of a Southern
African diaspora. Asian and Pacific Migration Journal, 10(2), 303-333.
Lucas, D. (2000). South Africa born. Community Profiles. Canberra: Department
of Immigration and Multicultural Affairs.
Lucas, D., Jamali, M. & Edgar, B. (2011). Zimbabwe's exodus to Australia. Paper
presented at the African Studies Association of Australasia and the Pacific
(AFSAAP) Conference. http://afsaap.org.au/assets/Lucas_Jamali_Edgar.pdf
(accessed 23 March 2013).
Macmillan, H. (1960). ‘Wind of change’ speech.
http://africanhistory.about.com/od/eraindependence/p/wind_of_change2.ht
m (accessed 2 February 2015).
Malawi Department of Information (1988). Statistical survey. In Africa South of
the Sahara (pp.663-668). London: Europa Publications.
Manning, P. ( 2004). Kicking new goals under Aussie rules. The Australian, 18
March 2004, 46.
McIlwraith, J. (1999). Afrikaans tells you how to do it. The Australian, 18 October
1999, 43.
Mendelsohn, R. & Shain, M. (2008). The Jews in South Africa. Johannesburg &
Cape Town: Jonathan Ball.
23
Mlambo, A. (2010). A history of Zimbabwean migration to 1990. In J. Crush and
D. Tevera (Eds.), Zimbabwe’s Exodus (pp. 52-76). Cape Town: Southern
Africa Migration Program.
Murphy, D. (2005). ‘CEO who gave birth to triplets’. The Age, 3 July 3 2005.
http://www.theage.com.au/news/business/ceo-who-gave-birth-to-
triplets/2005/07/02/1119724845747.html (accessed 16 February 2015).
O’Dwyer, B. (2007). True fighter for equality. Canberra Times, 24 February 2007,
B13.
Parliament of Australia. (n.d.). Senator Andrew Murray
http://www.aph.gov.au/Senators_and_Members/Parliamentarian?MPID=3
M6#personal (accessed 5 February 2015).
Pelissier, R. (1988a). Angola. In Africa South of the Sahara. London: Europa
Publications (pp.231-252).
Pelissier, R. (1988b). Mozambique: Physical and Social Geography. In Africa
South of the Sahara. London: Europa Publications (p.722).
Philipp, A., & Ho, E. (2010). Migration, home and belonging: South African
migrant women in Hamilton, New Zealand. New Zealand Population
Review 36, 81-101.
Pilditch, D. (2015). I could quit Britain over anti Semitism rise says Maureen.
International Express, 11 February 2015, 17.
Spray, P. (1988). Namibia: Recent history. In Africa South of the Sahara
(pp.745-751). London: Europa Publications.
Steger, J., & Dow, S. (2012). Bryce Courtenay writes his final chapter. Sydney
Morning Herald, 23 November 2012.
http://www.smh.com.au/entertainment/books/bryce-courtenay-writes-his-
final-chapter-20121123-29xes.html (accessed 21 February 2015).
Sussman, A. (2001).The émigré. The Bulletin, 119 (6291), 33-35.
Sustainable Population Australia (n.d.). Dr Mary White.
http://www.population.org.au/about/people/dr-mary-white (accessed 7
February 2015).
Younes, L. (2002). For the love of learning. Canberra Times,11 May 2002, 6-7.
Younge, G. (1999). South Africa’s skill slip away. The Guardian, 27 May 1999,
18.
Verghis, S. (2010). Private passions made public. Weekend Australian Review, 21
August 2010, 6-7.
Waldren, M. (2005). Cape crusader. Weekend Australian, 27 August 2005, 27, R9
24
Williams, G.J. (1988) Zambia: Physical and social geography. In Africa South of
the Sahara (pp.1112-1113). London: Europa Publications.
Who’s Who of Australian Women (2006), Melbourne: Crown Content.
Who’s Who Southern Africa (n.d.). ‘Sonwabo Eddie Funde’
http://whoswho.co.za/sonwabo-funde-1316
Zinyama, L. (1990) International migrations to and from Zimbabwe and the
influence of political changes on population movements 1965-1987
International Migration Review, 24(4), 748-767.
25
Tables
Table 1. Southern Africa-born in Australia 2001-2011
Census Years
Intercensal Growth
Birthplace 2001 2006 2011 2001 to
2006 (%)
2006 to
2011 (%)
South Africa 79 425 104 132 145 683 31.1 39.9
Zimbabwe 11 734 20 156 30 251 71.8 50.1
Zambia 3 070 4 078 5 537 32.8 35.8
Angola, Mozambique 904 1 035 1 191 14.5 15.1
Other Southern Africa* 1 893 2 559 3 349 35.2 30.9
Total 97 026 131 963 186 013 36.0 41.0
Sources:
2001: Department of Immigration and Multicultural and Indigenous Affairs
The People of Australia. Canberra. Table 3, pp 3-7. http://www.immi.gov.au/media/publications/pdf/people_of_australia.pdf
Accessed 17 June 2008.
2006 and 2011: Australian Bureau of Statistics, Tablebuilder. http://www.abs.gov.au
Accessed 25 July, 2013.
Note: *Botswana, Lesotho, Malawi, Namibia, Swaziland.
26
Table 2. South Africa- and Zimbabwe-born in Australia and New Zealand,
various Censuses 1981-2011
Census
Year
South Africa-born Zimbabwe-born
Australia New Zealand Australia New Zealand
1981 26,965 3,999 4,110 714
1986 37,058 6,479
1991 49,009 5,652 8,352 750
1996 55,821 11,334 8,954 1,443
2001 79,425 26,061 11,734 2,886
2006 104,128 41,676 20,157 8,151
2011 145,683 54,276* 30,251 8,100*
Sources:
For Australia: 1981, 1986, 1991: Graeme Hugo, Migration between Africa and Australia: a
demographic perspective. Sydney: Australian Human Rights Commission, 2009, Table 6. http://www.hreoc.gov.au/africanaus/papers/africanaus_paper_hugo.html#Heading599
Accessed 2 January, 2012.
For Australia: 1996, 2001, 2006: David Lucas, ‘Africans in New Zealand’ Australian Review of
African Studies 29 (1-2) (2008):114.
For New Zealand: 1981 - 2006: Ibid., p.113.
For New Zealand: 2013: Statistics New Zealand 2013 Census Totals by Topic, Table 5
Birthplace.
Note: *2013 New Zealand census
27
Table 3. Migration Category of Immigrants from Southern Africa, 1991-2013
Birthplace
Arrival Period
Migration category (%)
N
Mean
Annual
N Family Human-
itarian
Skilled Other/
Not stated
South Africa
1991 -2000 16% 0% 75% 9% 36,828 3,683
2001 -2008 13% 0% 86% 0% 59,614 7,452 2009 -2013 14% 0% 76% 10% 36,583 7,317
Zimbabwe 1991 -2000 20% 1% 73% 7% 2,621 262
2001 -2008 9% 5% 85% 0% 16,218 2,027
2009 -2013 16% 5% 67% 12% 6,373 1,275
Zambia
1991 -2000 21% 2% 64% 13% 797 80 2001 -2008 17% 4% 77% 1% 1,805 226
2009 -2013 23% 12% 53% 12% 1,049 210
Angola, Mozambique
1991 -2000 32% 20% 37% 11% 247 25
2001 -2008 38% 2% 60% 0% 301 38
2009 -2013 29% 18% 42% 12% 210 42
Other Southern Africa* 1991 -2000 25% 1% 65% 9% 420 42
2001 -2008 18% 8% 73% 1% 1,378 172
2009 -2013 19% 15% 48% 18% 1,109 222
Source: Department of Immigration and Border Protection , Settlement Reporting Facility.
Note: *Botswana, Lesotho, Malawi, Namibia, Swaziland.
28
Table 4. Occupations of Employed Males and Females from Southern Africa, 2011
South
Africa Zimbabwe Zambia
Angola,
Mozambique
Other
Southern Africa
Male
Managers, Professionals 54% 47% 53% 39% 57%
Technicians, Trades 20% 23% 16% 25% 13%
Community, Clerical, Sales 16% 18% 19% 19% 17%
Labourers, Machinery ops 9% 11% 11% 17% 12%
Not stated 1% 2% 1% 1% 1%
N 50,091 11,154 2,118 433 1,015
Female
Managers, Professionals 47% 45% 46% 39% 52%
Technicians, Trades 3% 3% 3% 4% 3%
Community, Clerical, Sales 45% 47% 45% 45% 39%
Labourers, Machinery ops 4% 4% 5% 9% 4%
Not stated 1% 1% 2% 2% 1%
N 42,422 9,977 1,906 335 910
Source: ABS Census of Population and Housing, 2011.
Table 5. Main Occupations of Males and Females from Southern Africa, 2011
Male
South Africa-born
5.1% 4.2%
Construction, Distribution and Production Managers Engineering Professionals
Zimbabwe-born
6.3%
4.0%
Mechanical Engineering Trades Workers
Construction, Distribution and Production Managers
Zambia-born 5.2%
5.1%
Engineering Professionals
Construction, Distribution and Production Managers
Female
South Africa-born
7.0% 5.6%
School Teachers Midwifery and Nursing Professionals
Zimbabwe-born
16.7%
9.1%
Midwifery and Nursing Professionals
Personal Carers and Assistants
Zambia-born 9.3%
9.7%
Midwifery and Nursing Professionals
Personal Carers and Assistants
Source: See Table 4.
29
Table 6. Language spoken at home by Southern Africa-born
2006 2011
English 80% 73%
Afrikaans 12% 17%
Shona 2% 4%
Other African 2% 2%
Other languages 4% 3%
Not stated 1% 1%
Total 100% 100%
N 131,957 186,013
Source: See Table 4.
Table 7. Occupations of Employed Southern Africa-born by Language and Sex,
2011
Occupation
Language spoken at home:
Afrikaans Shona All Languages
Male Female Male Female Male Female
Managers 20% 9% 4% 2% 21% 10%
Professionals 32% 37% 34% 49% 32% 37%
Technicians and Trades 24% 4% 22% 2% 20% 3%
Community and Personal Service 4% 10% 16% 29% 5% 12%
Clerical and Administrative 5% 26% 5% 7% 6% 24%
Sales Workers 4% 8% 3% 5% 6% 8%
Machinery Operators and Drivers 4% 1% 6% 0% 4% 1%
Labourers 5% 4% 8% 5% 5% 3%
Inadequately described 1% 1% 1% 1% 1% 1%
Not stated 0% 0% 1% 0% 0% 0%
Total 100% 100% 100% 100% 100% 100%
N 11,6661 9,0962 2,3863 2,4624 64,811 55,550
Source: See Table 4.
Notes: 1. 11,230 South Africa-born, 242 Zimbabwe-born, 136 Namibia-born, 58 other birthplace.
2. 8,803 South Africa-born, 139 Zimbabwe-born, 113 Namibia-born, 41 other birthplace.
3. 2,378 Zimbabwe-born, 8 Zambia-born.
4. 2,443 Zimbabwe-born, 12 Zambia-born , 7 other birthplace.