Embed Size (px)
Citation preview
Southwest Florida Water Management District
Sarasota Bay Surface Water Improvement and Management (SWIM) Plan December 2002
SWIM SECTION RESOURCE MANAGEMENT DEPARTMENT SOUTHWEST FLORIDA WATER MANAGEMENT DISTRICT 7601 U.S. HIGHWAY 301 NORTH TAMPA, FLORIDA 33637 (813) 985-7481
Sarasota Bay Surface Water Improvement and Management (SWIM) Plan Update
December 2002
Southwest Florida Water Management District SWIM Section
Resource Management Department 7601 U.S. Highway 301 North
Tampa, Florida 33637 (81 3) 985-7481
The Southwest Florida Water Management District (District) does not discriminate upon the basis of any individual's disability status. This nondiscrimination policy involves every aspect of the District's functions, including one's access to, participation, employment, or treatment in its programs or activities. Anyone requiring reasonable accommodation as provided for in the Americans With Disabilities Act should contact the District at 81 3-985-7481, or 1-800-423-1 476 (Florida), extension 2201 ; TDD ONLY 1-800-231 -6103 (Florida); FAX 81 3-987-6747 / SunCom FAX 577-6747. 1
TABLE OF CONTENTS
................................................................................... TABLE OF CONTENTS i
EXECUTIVE SUMMARY ...................................................................................... 1
.............................................................................................. INTRODUCTION 3 ........................................................................................ The SWIM Act 3
.............................................................. Sarasota Bay SWIM Plan Evolution 3 ........................................................................................... Background 3
.............................................................................. Historic Land Use 5 ..................................................................... Recent (1 990) Land Use 5
.............................................................. Sarasota Bay SWIM Plan Process 6 ......................................................... Sarasota Bay Management Strategies 7
..................... Linkages to Other Water Resource Management Activities 9 .................................................................. Internal Linkages 9 ................................................................ External Linkages 11
..................................................................................... PRIORITY PROJECTS 12 .......................................................... Various Habitat Restoration Projects 13
........................................................................ Seagrass Mapping Efforts 14 ............................................................ Status and Trends in Water Quality 15
................................................................... Deployment of Artificial Reefs 16 .................................................................... Construction of Oyster Reefs 1 7
....................................... Determination of Nitrogen Sources in Urban Runoff 18 ................................................... Water Quality Monitoring in Phillippi Creek 19
....................................................... Integrated Water Resource Evaluation 20 ......................... Evaluation and Implementation of Urban Stormwater Retrofits 21
....................................................... Update of the Pollutant Loading Model 22
...................... APPENDIX A . STATUS OF THE 1997 SARASOTA BAY SWIM PLAN 23 .................................................................. Develop a Reuse Master Plan 23
................................................. Promote Florida Yards and Neighborhoods 23 ............. Incorporate Water Quality Improvements Into Stormwater Master Plans 23
................................................................................ Habitat Restoration 24 ................................................................................. Seagrass Mapping 24
........................................... Further Assessment of Atmospheric Deposition 24 ........................................................... Identification of Toxic Load Sources 25
.................................................................................. Data Management 25
......... APPENDIX B . STATUS AND TRENDS IN THE HEALTH OF SARASOTA BAY 26 ........................................................... Status and Trends in Water Quality 26
....................................................... Contaminant Levels in Bay Sediments 28 ................................................................ Status and Trends in Wetlands 29 ................................................................ Status and Trends in Fisheries 30
......................... Status and Trends in Nitrogen Loads and Seagrass Coverage 31
. ............................................................ APPENDIX C LITERATURE CITED 34
............... . APPENDIX D GOVERNANCE WITHIN THE SARASOTA BAY BASIN 36
APPENDIX E . PERMITTED POINT AND NON-POINT (NPDES) ...................... DISCHARGES IN THE SARASOTA BAY BASIN 42
EXECUTIVE SUMMARY
Sarasota Bay has a surface water area of approximately 52 square miles, and a contributing watershed of approximately 150 square miles. The watershed is split between Manatee County and Sarasota County, and encompasses the City of Sarasota, as well as the island communities of Anna Maria, Holmes Beach, Bradenton Beach, and Longboat Key.
Numerous inlets allow for the exchange of water between the bay and the Gulf of Mexico, including Anna Maria Sound, Longboat Pass, New Pass, Big Pass, and Venice Inlet. Until its closure in 1983, Midnight Pass also was an area of tidal mixing.
Due in part to its remarkable natural beauty, Sarasota Bay is an often-cited reason for visitors drawn to the area. Visitors are a vital part of the local economy, as tourism is the number one source of employment in Sarasota County, and the number two source in Manatee County.
While the Sarasota Bay region has been inhabited for thousands of years, human degradation of the bay accelerated during the post-World War II years. Between 1950 and 1990, approximately 39 percent of the tidal wetlands were lost to development. Also during this time period, approximately 30 percent of Sarasota Bay's seagrass meadows were lost due to the combined impacts of direct losses due to shoreline development, and indirect losses due to degraded water quality.
However, much progress has been made to restore Sarasota Bay in the years since its designation as an "estuary of national significance" by the U.S. Environmental Protection Agency in 1987. With the formation of the Sarasota Bay National Estuary Program (Sarasota Bay NEP) in that year, much attention was focused on developing and implementing a series of projects aimed at restoring and protecting the natural resources of Sarasota Bay.
Associated with upgrades to private and public wastewater treatment plants, point-source nitrogen loads to Sarasota Bay have been reduced from 569 tons per year in 1988 to 1 10 tons per year in 1999, an 81 percent decline. In response, water clarity improved in 7 of 13 bay segments between 1983 and 1998, and only degraded in 1 of 13 bay segments. As water clarity improved, seagrass coverage increased as well, with 596 additional acres found in 1999, as opposed to 1988.
In addition to treatment plant upgrades, the Sarasota Bay region now reclaims approximately 46 percent of it wastewater treatment plant effluent for various reuse projects, and numerous stormwater treatment systems have been put in place to further reduce nutrient and toxin loads to the bay.
In combination with various local, regional, state and federal agencies, habitat restoration projects in the Sarasota Bay region have enhanced or created approximately 200 acres of fisheries habitat through wetland restoration and removal of exotic vegetation. Additional habitat has been created through the deployment of various types and sizes of artificial
1 Sarasota Bay SWIM Plan December 2002
reefs, ranging from large, complex systems such as that in place offshore of Leffis Key, to small concrete structures designed to fit at the base of various channel markers.
An accurate depiction of Sarasota Bay is that of a system that is recovering from its most degraded condition, experienced in the late 19801s, to one that is approaching a much healthier condition. A potential problem, however, is that of continued population growth and development of the bay's watershed. If future growth is not adequately planned for, recent improvements in the health of Sarasota Bay could be offset by the impacts of increased stormwater and wastewater loads, as well as direct human impacts, as more people move to the region. While much progress has been made to improve water quality in both Sarasota Bay and Tampa Bay, most of these improvements have been brought about through the successful management of point sources of pollution. It remains to be seen how effective urban communities can be when attempting to reduce non-point source pollution on a watershed level. The continued implementation of stormwater retrofits of priority tributaries, as well as continued efforts to educate homeowners on the need for creating "bay friendly" landscapes will be required. Additional measures, such as the adoption, by local governments, of more stringent stormwater regulations for new development might be worth considering.
The goal, therefore, of this update to the Sarasota Bay SWIM Plan, is to outline a series of research and/or restoration projects that will allow for the preservation and continued restoration of the health of Sarasota Bay, in spite of an increased population in the contributing watershed.
Strategies to accomplish this task focus on improving and protecting water quality through continued efforts to treat wastewater and stormwater, as well as continued efforts focusing on the restoration of wetlands and creation of artificial reefs. Additional research efforts are needed, as well, to better understand the relationship between air quality and water quality, as well as to better understand the impacts to the bay's health that may have been caused by various alterations to the patterns of freshwater inflow into the bay.
This revised Sarasota Bay SWIM Plan provides details for projects that implement the above-described strategies for protecting and improving the bay's health. This Plan will serve as the guidance document that coordinates the efforts of the District with those of the various local, regional, state and federal agencies, as well as private interests, to restore and protect Sarasota Bay.
2 Sarasota Bay SWIM Plan December 2002
The SWIM Act
In recognition of the need to place additional emphasis on the restoration, protection and management of the surface water resources of the State, the Florida Legislature, through the Surface Water Improvement and Management (SWIM) Act of 1987, directed the State's water management districts to "design and implement plans and programs for the improvement and management of surface water" (Section 373.451, Florida Statutes). The SWIM legislation requires the water management districts to protect the ecological, aesthetic, recreational, and economic value of the State's surface water bodies, keeping in mind that water quality degradation is frequently caused by point and non-point source pollution, and that degraded water quality can cause both direct and indirect losses of habitats.
Under the SWIM Act, water management districts prioritize water bodies based on their need for protection and/or restoration. This prioritization process is carried out in cooperation with the Florida Department of Environmental Protection (FDEP), the Fish and Wildlife Conservation Commission (FWCC, formerly known as the Florida Game and Freshwater Fish Commission), the Department of Agriculture and Consumer Services (DACS), the Department of Community Affairs (DCA) and local governments. Sarasota Bay was added to the list of priority water bodies by the Southwest Florida Water Management District (District) in 1995.
Following the selection of the priority water bodies and in accordance with the SWIM Act, a SWIM Plan must be drafted, reviewed and approved before State SWIM funds can be spent on restoration, protection or management activities. The purpose of this revision of the Sarasota Bay SWIM Plan is to set forth a realistic course of action, identifying the projects and the effort needed to accomplish them, consistent with the levels and trends of SWIM funding. The evolution of the SWIM Plan for Sarasota Bay is discussed in the following section.
Sarasota Bay SWIM Plan Evolution
The original Sarasota Bay SWIM Plan, approved in 1997, was focused on projects designed to meet the District's obligations, as outlined in the Sarasota Bay NEP's "Comprehensive Conservation and Management Plan" (SBNEP, 1995). The projects outlined within the 1997 SWIM Plan have either been completed or they are ongoing, as shown in Appendix A, "Status of the 1997 Sarasota Bay SWIM Plan." A detailed examination of the status and trends in pollutant loads, water quality and fish and wildlife habitat is included in Appendix 9, "Status and Trends of Sarasota Bay."
Background
In 1995, The Southwest Florida Water Management District (District) named Sarasota Bay as a SWIM priority water body. Sarasota Bay thus joined the eight other priority water bodies previously listed. These water bodies are: 1) Tampa Bay, 2) Rainbow River, 3)
3 Sarasota Bay SWIM Plan December 2002
Banana Lake, 4) Crystal River, 5) Lake Panasoffkee, 6) Charlotte Harbor, 7) Lake Tarpon, 8) Lake Thonotosassa, and 9) Winter Haven Chain of Lakes.
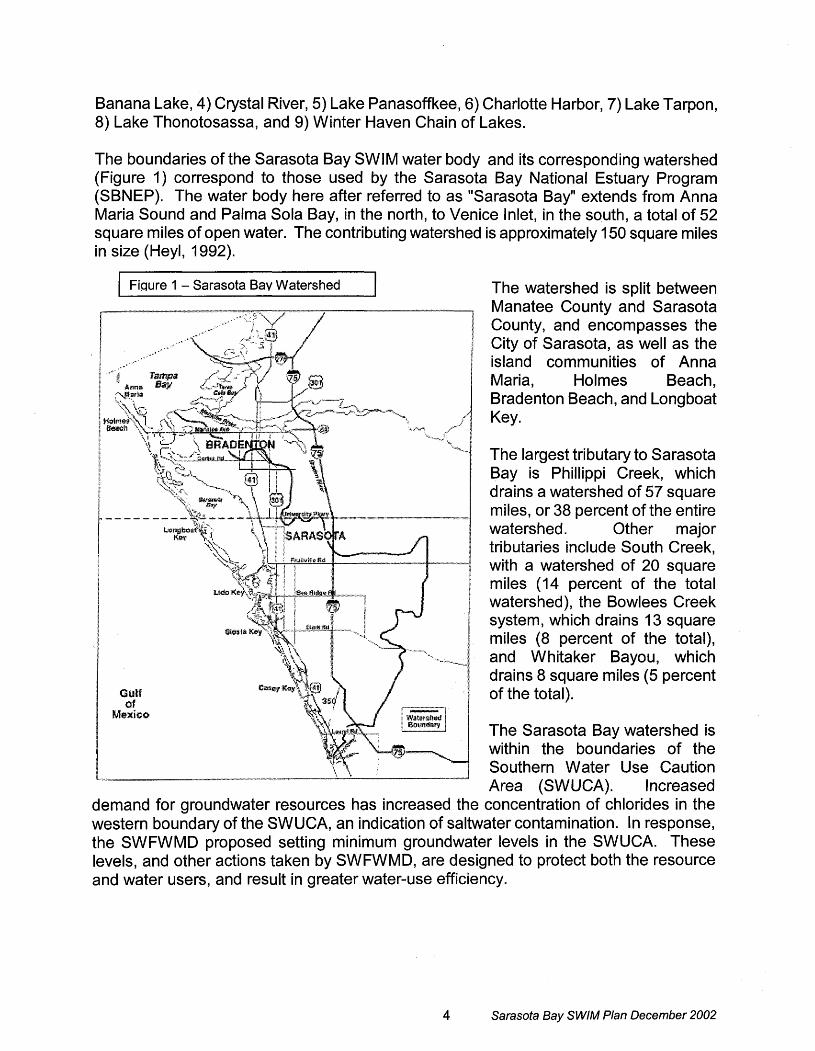
The boundaries of the Sarasota Bay SWIM water body and its corresponding watershed (Figure 1) correspond to those used by the Sarasota Bay National Estuary Program (SBNEP). The water body here after referred to as "Sarasota Bay" extends from Anna Maria Sound and Palma Sola Bay, in the north, to Venice Inlet, in the so,uth, a total of 52 square miles of open water. The contributing watershed is approximately 150 square miles in size (Heyl, 1992).
1 Fiaure 1 - Sarasota Bay Watershed 1 The watershed is split between Manatee County and Sarasota County, and encompasses the City of Sarasota, as well as the island communities of Anna Maria, Holmes Beach, Bradenton Beach, and Longboat Key.
The largest tributary to Sarasota Bay is Phillippi Creek, which drains a watershed of 57 square miles, or 38 percent of the entire watershed. Other major tributaries include South Creek, with a watershed of 20 square miles (14 percent of the total watershed), the Bowlees Creek system, which drains 13 square miles (8 percent of the total), and Whitaker Bayou, which drains 8 square miles (5 percent of the total).
The Sarasota Bay watershed is within the boundaries of the Southern Water Use Caution Area (SWUCA). Increased
demand for groundwater resources has increased the concentration of chlorides in the western boundary of the SWUCA, an indication of saltwater contamination. In response, the SWFWMD proposed setting minimum groundwater levels in the SWUCA. These levels, and other actions taken by SWFWMD, are designed to protect both the resource and water users, and result in greater water-use efficiency.
4 Sarasota Bay SWIM Plan December 2002
Historic Land Use
Sarasota Bay first took shape approximately 5,000 years ago (Estevez, 1992), as a result of the formation and development of offshore barrier islands during a period of continuing sea level rise. These barrier islands, in turn, appear to be associated with previously subtidal bars originally formed on top of elevated portions of Miocene bedrock (Kuhn, 1983).
The Sarasota Bay watershed contains a number of archeological sites, including shell middens, sand mounds, and cemeteries (Deming et al., 1990). These structures are the sole remaining artifacts of a number of prehistoric cultures, which date back to 10,000 B.C. The demise of the Native American presence in Sarasota Bay roughly coincides with initial contact with Spanish Conquistadors and settlers (Deming et al., 1990).
During the 18703, a resort hotel in Osprey was one of the first business ventures to take advantage of Sarasota Bay's wealth of natural beauty, although commercial fishing had occurred since the late 1700's (Whelan, 1992). During the period of 1895 to 1903, the first large-scale channel alteration activities took place in Sarasota Bay, as the dredge 'Suwanee" enlarged and/or created channels at Palma Sola Pass, at Longbar, and in the area between Little Sarasota Bay and Venice (W helan, 1992).
During the years 1910 and 191 1, the City Commission of Sarasota mandated the seawalling of the City waterfront, while the citizens of the City of Sarasota voted for a combination water and sewage treatment system (Whelan, 1992). Ten years later, Sarasota County was officially formed by the partitioning in two of the old Manatee County.
Population growth in the watershed has been dramatic, especially in the post-World War II years. During this period of rapid growth, much environmental damage occurred, as a result of large-scale dredge and fill projects, such as the conversion of Bird Key into a finger fill canal community, and the dredging (in the 1960's) of the Intracoastal Waterway. The dredging of the Intracoastal Waterway may have increased the hydraulic instability of Midnight Pass, the movement of which precipitated its permitted closure and subsequent failed re-opening in the winter of 1983 (Sheng and Peene, 1992; Sheng, personal communication).
Recent (1 990) Land Use
Water quality in Sarasota Bay is influenced by the amount of watershed that drains into different parts of the Bay. In northern and central portions of the bay (i.e. those areas north of Roberts Bay), 59 square miles of watershed drain into 45 square miles of open water. In the area of Roberts Bay south to Venice Inlet, 91 square miles of watershed drain into 7 square miles of open water. Thus, the watershed : open water ratio in the northern and central parts of Sarasota Bay is 1.3, while in the southern part of Sarasota Bay, this ratio climbs to 13.4, a roughly ten-fold increase.
Using results from the most recent pollutant load modeling effort for Sarasota Bay (Heyl, 1992), residential land-use accounted for approximately 42 percent of the total watershed,
5 Sarasota Bay SWIM Plan December 2002
while 36 percent is a combination of forested upland, rangeland, and openlrecreational uses. Commercial and industrial land-uses account for 10 percent of the watershed, and cropland and citrus account for 9 percent of the land. The remainder of the watershed (4 percent) is comprised of both wetlands and open water bodies (lakes and streams).
In Manatee County's portion of the watershed, approximately 64 percent of the land is urbanized, with 72 percent of the urbanized land (46 percent of the total) being residential (Heyl, 1992). In the City of Sarasota, 87 percent of the watershed is urbanized, with 70 percent of the urbanized land (61 percent of the total) being residential. Sarasota County's portion of the watershed is 42 percent urbanized, with 87 percent of the urbanized land (36 percent of the total) being residential. Consequently, residential land uses account for less than 50 percent of the watershed in the northern and southern regions, and more than 50 percent of the watershed in the central region. As residential land uses comprise 64 to 87 percent of the urban land use category, the water quality characteristics of stormwater runoff from residential land uses (e.g. elevated nitrogen and phosphorus concentrations) have the potential to have a large impact on water quality in the bay itself.
Sarasota Bay SWIM Process
Concern for the overall health of Sarasota Bay resulted in its designation by the U.S. Environmental Protection Agency as an "estuary of national significance" in 1987. In 1989, the SBNEP was formed to oversee the protection and restoration of Sarasota Bay and its natural resources. In 1992, the results of a bay-wide assessment were published in the document "Sarasota Bay Framework for Action." In this report, principal investigators for the various studies proposed various activities that would be needed to better protect and restore Sarasota Bay. After numerous public meetings and much debate, these activities were developed into "Action Plans" that were focused on issues such as stormwater, wastewater, habitat loss, and recreational use conflicts. In turn, responsibility for implementing each of the Action Plans was determined, and the collection of Action Plans, in addition to responsible parties for each item, was summarized in the document "Comprehensive Conservation and Management Plan" (SBNEP, 1995). This Plan, commonly referred to as the CCMP, was the basis for the projects outlined within the previous SWIM Plan for Sarasota Bay, which was adopted by the Governing Board in 1997.
Sarasota Bay Priority Management Issues
Both the 1995 Sarasota Bay NEP's CCMP and the 1997 Sarasota Bay SWIM identified the following as priority management issues:
Declines in sediment and water quality;
a Loss of wetlands and other coastal habitats;
Loss of seagrasses;
Declines in finfish and shellfish populations; and
6 Sarasota Bay SWIM Plan December 2002
Recreational impacts 1 overuse
Sarasota Bay SWIM Plan Goals
The goals of the Sarasota Bay SWIM Plan are consistent with the goals identified by the Sarasota Bay NEP. These goals are:
Improve water transparency in Sarasota Bay;
Decrease the quantity, and increase the quality of stormwater runoff to Sarasota Bay;
Restore shoreline habitats in Sarasota Bay;
Restore and sustain fish and other living resources in Sarasota Bay; and
Continue monitoring programs and applied research projects in Sarasota Bay
Sarasota Bay Management Strategies
The management strategies for protecting and restoring Sarasota Bay are based on the Sarasota Bay NEP's CCMP (1995). Within this document, there are numerous activities listed which require coordination between local governments and the District, or direct action by the District. These activities are intended to protect and restore Sarasota Bay, by devising action plans to achieve the above-mentioned goals. More specifically, each ''Action Plan" in the CCMP lists those cooperating organizations whose efforts are needed to carry out the identified activities. In addition, The Sarasota Bay NEP's Technical Advisory Committee (TAG) recently (Fall 2001) held a series of discussion on the value of continued and additional research and/or restoration projects. Of a total of 15 potential projects, the top 7 were widely supported by TAG members. The remaining 8 projects received marginal or no support from the TAC. The top 7 projects are summarized in Table 1, as well as ongoing projects to map seagrass coverage and continue ongoing wetlands habitat restoration. Ongoing SWIM projects, and the above-mentioned priority projects identified by the TAC, are the basis for the course of action outlined in this SWIM Plan update, by continuing the ongoing efforts to implement the Sarasota Bay NEP's CCMP.
Additionally, the SBNEP's TAG recently (August 9,2002) endorsed the concept of revising the existing nutrient loading model for Sarasota Bay and its watershed. The existing model (Heyl 1992) is based on land use data from 1990, and modifications to wastewater and stormwater treatment practices during the past decade may have significantly altered the sources and quantities of various pollutant loads. This project is also listed in both Table 1 and the section on Priority Projects.
7 Sarasota Bay SWIM Plan December 2002
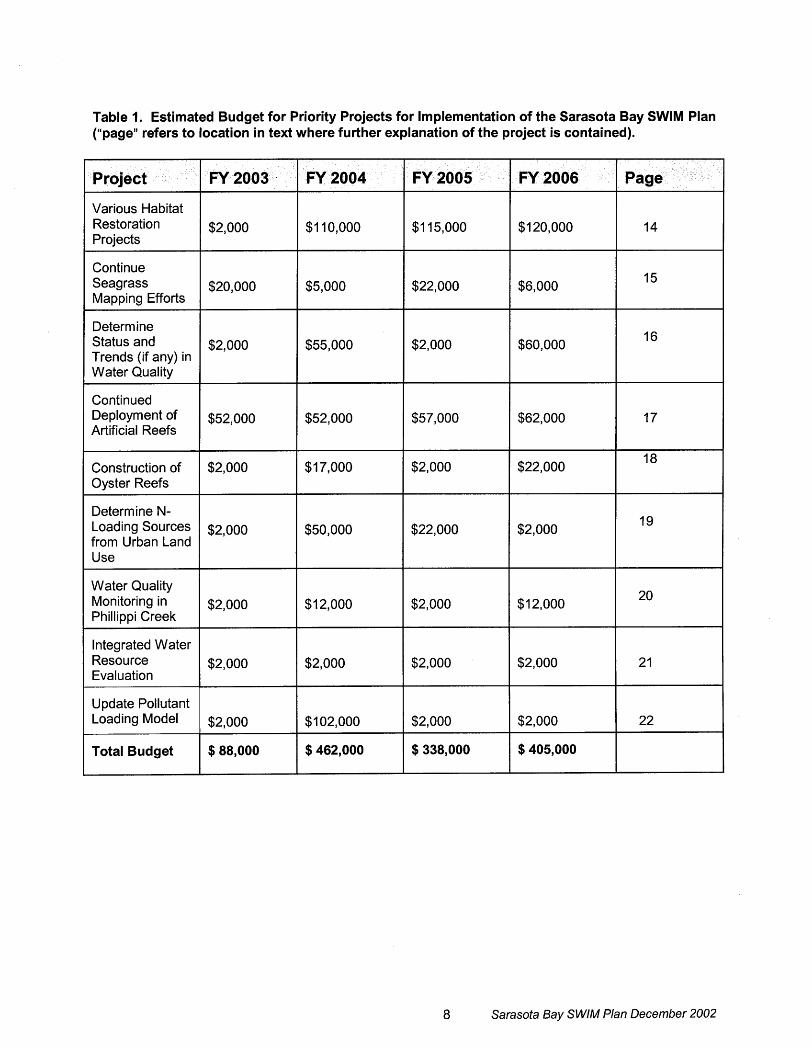
Table 1. Estimated Budget for Priority Projects for Implementation of the Sarasota Bay SWIM Plan ("page" refers to location in text where further explanation of the project is contained).
FY 2005 FY 2006 Page Project
Various Habitat Restoration Projects
Continue Seagrass Mapping Efforts
Determine Status and Trends (if any) in Water Quality
Continued Deployment of Artificial Reefs
Construction of Oyster Reefs
Determine N- Loading Sources from Urban Land Use
Water Quality Monitoring in Phillippi Creek
-
Integrated Water Resource Evaluation
Update Pollutant Loading Model
Total Budget
Sarasota Bay SWIM Plan December 2002
Linkage to Other Water Resource Management Activities
In addition to projects that are initiated by SWIM, the SWIM Program is able to accomplish its objectives more effectively and efficiently by coordinating internally with other District programs and externally through partnerships with local governments and other State and federal agencies.
Internal Linkages
The District has many tools available to implement the legislative intent of the SWIM Program, including but not limited to, integrated planning and coordination, regulatory authority, land acquisition programs and the SWIM program itself. Each of these areas provides opportunities to assist in the management of Sarasota Bay.
The SWFWMD's Water Management Plan - As required in Chapter 373, Florida Statutes, the District prepared its Water Management Plan (DWMP). Within this plan, the District organized its mission into four areas of responsibilities; water supply, flood protection, water quality management and natural systems management. The DWMP recognizes that the integration of all these areas is essential to effective planning and management of the resource. The DWMP has policies that relate to the protection, restoration, and management of Sarasota Bay
Comprehensive Watershed Management (CWM) - The District has recognized the need to take a unified approach to surface water management and has created an initiative that prioritizes resource management needs by watershed throughout the District. For Sarasota Bay, the Southern Coastal Watershed Management Initiative is the relevant entity. These management plans combine information on water quantity (i.e., flood) management with water quality and natural systems objectives, as well as water supply when applicable. Information on regulatory, land acquisition, and land-use matters is combined into a comprehensive surface water management strategy, including appropriate policies, on a watershed-specific basis. Local governments, as the parties responsible for land planning and development are key players in this integrated management approach. In the Sarasota Bay region, existing linkages between the District and the Sarasota Bay National Estuary Program make the need for CWM coordination somewhat less pressing than in other areas. Implementation of restoration projects and technical assessments will continue to be coordinated with CWM, but will continue to be implemented mainly through the joint participation and funding of the Sarasota Bay National Estuary Program and the District's SWIM Section.
Regulation
Wetlands Protection Through Regulatorv Programs - One way that the District achieves wetlands protection is through regulatory programs. Wetlands protection is addressed under Chapters 40D-2, 40D-3, 40D-4, 40D-40 and 40D-45, F.A.C. The District's surface water permitting rules (40D-4,40 and 45, F.A.C.) require that any impact to wetlands not specifically exempted must either be avoided or compensated. Compensation for impacts includes as a minimum, type-for-type mitigation at a one-to-one ratio. Other types of compensation may be required,
9 Sarasota Bay SWIM Plan December 2002
including preservation of associated upland areas, alternate types of wetland creation, protection of exempt wetlands, and restoration for previously impacted wetlands. The intent is to ensure that the habitat necessary for the survival of fish and wildlife is maintained.
Mitigation Banking - Mitigation banking allows developers to compensate for wetland losses in one place by preserving, restoring or creating wetlands in another to prevent a net loss of wetlands. The rule allows mitigation banking in some instances, although it remains a controversial issue. The SW FW MD coordinates with the Florida Department of Transportation to take advantage of mitigation bank opportunities on District lands and within SWIM priority water bodies.
Land Acquisition - Land acquisition at the District was recently guided and funded by two major statewide initiatives: The Water Management Lands Trust Fund (a.k.a. Save our Rivers Program or SOR), and Preservation 2000 (P-2000). In 2000, the P-2000 Program for land acquisition came to an end. Funds for land acquisition and management was available through Save our Rivers through 2000, however, the SORfunds may not be used for land acquisition after 2001. The Florida Forever Act, passed by the Florida Legislature in 1999, made funds available, beginning in 2001, to the water management districts for both land acquisition and restoration, including funding for SWIM projects.
The District's land acquisition programs target the protection of natural resources at the regional level. Lands of importance to water resources and water management are acquired along with lands of unique environmental values endangered by development activities. The District owns more than 200,000 acres, the majority of which were purchased through the SOR and P2000 programs. Many recent purchases have been a joint acquisition between the District and a local government or with other State agencies. Leveraging District land acquisition funds with those of local governments and other agencies can and has resulted in significant acquisitions that might not have been made otherwise. These programs have been coordinated with SWIM Plans by focusing on critical habitats, such as wetlands and their interconnected upland communities that are part of the Sarasota Bay ecosystem, and that should be acquired for preservation and/or restoration.
Basin Board Activities - The basin boards of the SWFWMD have specific functions and duties that are consistent with Chapter 373, F.S., and the programs of the Governing Board. Their purpose is to identify and evaluate key water resource management issues in order to develop and fund management strategies to address them. The basin boards are facilitators in the resolution of non-regulatory water management issues for a number of other governments. It is at the basin level that intergovernmental water resource programs are implemented, monitored and evaluated for improvement. The basin boards also provide a means of obtaining feedback from local governments and citizens. Basin boards also serve as funding partners for local governments and others in addressing mutually beneficial water resource solutions. The basin boards also provide the District's SWIM funding match for approved SWIM projects within their basins. For Sarasota Bay, the relevant basin board is the Manasota Basin Board.
1 0 Sarasota Bay SWIM Plan December 2002
The District, through the eight basin boards, has an established Cooperative Funding Program that provides financial assistance on a cost-share basis primarily to local governments for regional water resource projects. Projects can also be funded through ''basin initiatives" where a basin decides to provide the impetus for a water management solution, with or without a local partner. Many of the basin boards have in place a five-year plan which outlines the types of activities it expects to undertake in the next five years and provides an estimate of the funding required to support these projects. The basin plans were prepared in close coordination with local governments, demonstrating another opportunity for integration with local governments and ensuring the most efficient and cost- effective approach to addressing mutual water resource management goals and objectives.
External Linkages
FDEP - Total Maximum Daily Load (TMDL) Program - Section 303(d) of the Federal Clean Water Act requires states to submit lists of waters that fail to meet applicable water quality standards (i.e., "impaired waters") and to establish and implement TMDL's for these waters on a prioritized schedule. The TMDL program is part of FDEP's Watershed Approach Initiative, which provides the framework for implementing Section 303(d) of the Federal Clean Water Act, as well as the 1999 Florida Watershed Restoration Act. Listing requirements include the identification of pollutants causing impairment (e.g., nutrients, sediments, bacteria, etc.). Impaired waters are primarily those listed as having either 'poor" or "fair" water quality in the FDEP 1996 305(b) report. In response to various legal proceedings, Chapter 99-223 created 403.067 (Florida Statutes), wherein it was established that the initial list of water bodies in the 303(d) list was to be used for planning purposes only, and that FDEP would be required to adopt by rule a methodology for determining impaired waters. Also, FDEP is now required to validate the impairment of listed water bodies, and to evaluate whether proposed pollution control programs are sufficient to help impaired water bodies to meet their appropriate water quality standards. Once impairment has been verified and TMDL's have been adopted, 403.067 (F.S.) requires FDEP to allocate TMDL's, by rule, to the level of major categories of nonpoint sources. FDEP is then required to develop specific Basin Plans to implement TMDL's. In all these activities, the SWIM Plan's efforts at implementing the PLRG for Sarasota Bay will be carefully integrated with FDEP's efforts at developing and implementing TMDL's.
Local / Federal Government Coordination and Partnerinq - The District has prepared county-level Integrated Plans for the local governments within its jurisdiction, as part of the District's Water Management Plan. The purpose of the Integrated Plan is to identify and evaluate key water resource management issues with the local government's jurisdiction, and to develop and coordinate common District and local government strategies to address these issues. Greater detail is available in Appendix D, "Governance within the Sarasota Bay Basin."
1 1 Sarasota Bay SWIM Plan December 2002
PRIORITY PROJECTS
The Sarasota Bay SWIM Plan Update is focused on implementing those projects viewed as priorities by the Sarasota Bay NEP's Technical Advisory Committee. The following project summaries identify the current status of active and proposed projects, and provide project timelines and estimated budgets for implementation. Project descriptions are shown on separate pages for each effort.
Approval of the Sarasota Bay SWIM Plan does not constitute approval of any specific habitat restoration project, as the SWIM Plan is meant to serve as a general outline of the need for various types of restoration projects.
1 2 Sarasota Bay SWIM Plan December 2002
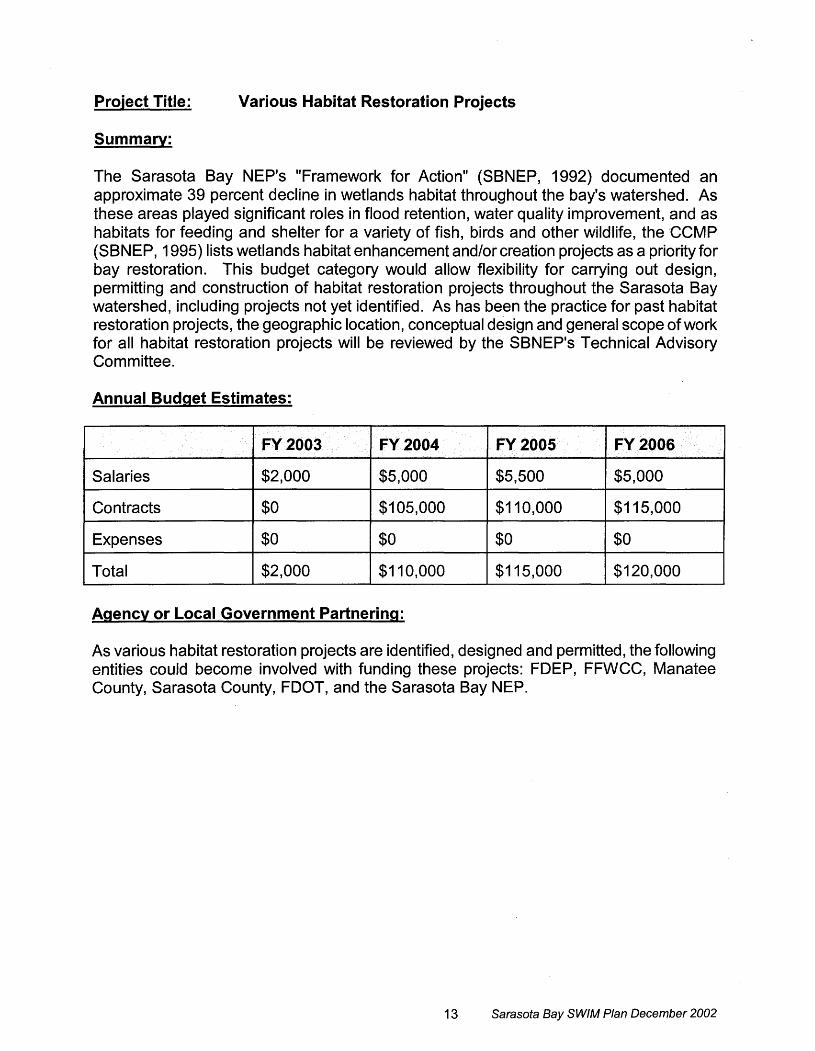
Project Title: Various Habitat Restoration Projects
Summary:
The Sarasota Bay NEP's "Framework for Action" (SBNEP, 1992) documented an approximate 39 percent decline in wetlands habitat throughout the bay's watershed. As these areas played significant roles in flood retention, water quality improvement, and as habitats for feeding and shelter for a variety of fish, birds and other wildlife, the CCMP (SBNEP, 1995) lists wetlands habitat enhancement and/or creation projects as a priority for bay restoration. This budget category would allow flexibility for carrying out design, permitting and construction of habitat restoration projects throughout the Sarasota Bay watershed, including projects not yet identified. As has been the practice for past habitat restoration projects, the geographic location, conceptual design and general scope of work for all habitat restoration projects will be reviewed by the SBNEP's Technical Advisory Committee.
Annual Budget Estimates:
1 Salaries 1 $2,000 1 $5,000 1 $5,500 1 $5,000 1 Contracts 1 $0 1 $105,000 1 $1 10,000 1 $1 15,000 1 1 Expenses 1 so 1 la 1 so 1 so 1
Agency or Local Government Partnering:
As various habitat restoration projects are identified, designed and permitted, the following entities could become involved with funding these projects: FDEP, FFWCC, Manatee County, Sarasota County, FDOT, and the Sarasota Bay NEP.
1 3 Sarasota Bay SWIM Plan December 2002
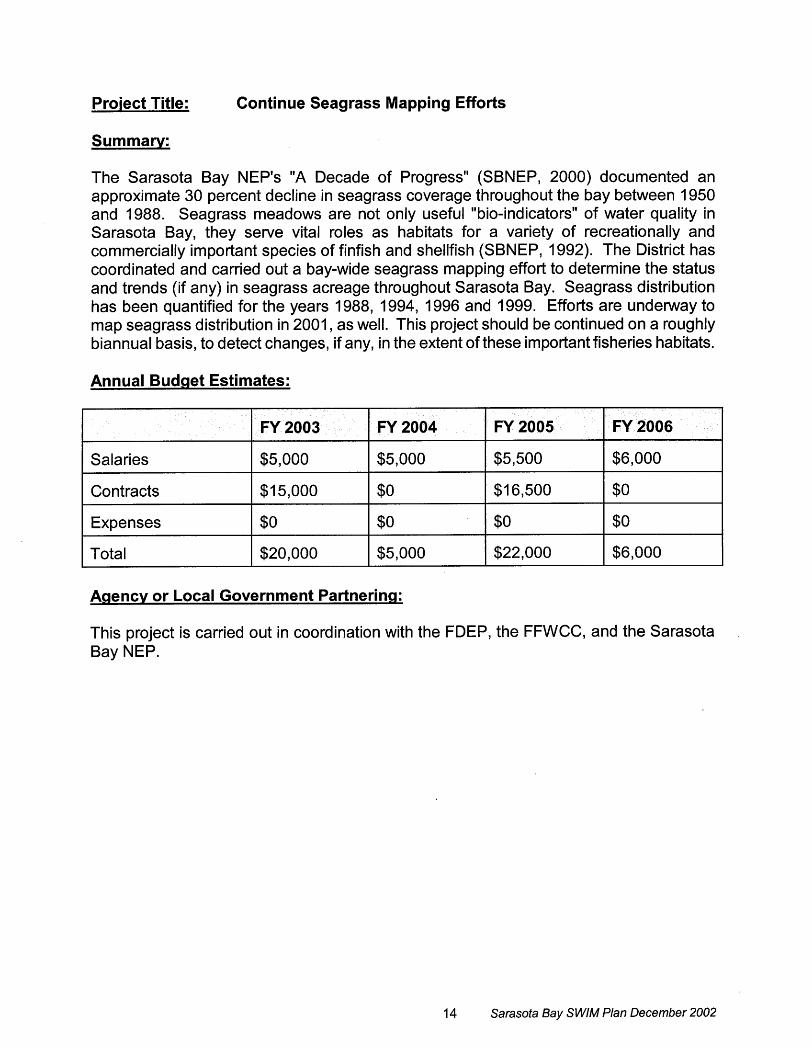
Project Title: Continue Seagrass Mapping Efforts
Summary:
The Sarasota Bay NEP's "A Decade of Progress" (SBNEP, 2000) documented an approximate 30 percent decline in seagrass coverage throughout the bay between 1950 and 1988. Seagrass meadows are not only useful "bio-indicators" of water quality in Sarasota Bay, they serve vital roles as habitats for a variety of recreationally and commercially important species of finfish and shellfish (SBNEP, 1992). The District has coordinated and carried out a bay-wide seagrass mapping effort to determine the status and trends (if any) in seagrass acreage throughout Sarasota Bay. Seagrass distribution has been quantified for the years 1988, 1994, 1996 and 1999. Efforts are underway to map seagrass distribution in 2001, as well. This project should be continued on a roughly biannual basis, to detect changes, if any, in the extent of these important fisheries habitats.
Annual Budget Estimates:
Contracts 1 $15,000 1 $0
Salaries
Expenses 1 $0 1 $0
Total 1 $20,000 1 $5,000
$5,000
Agency or Local Government Partnerina:
$5,000
This project is carried out in coordination with the FDEP, the FFWCC, and the Sarasota Bay NEP.
1 4 Sarasota Bay SWIM Plan December 2002
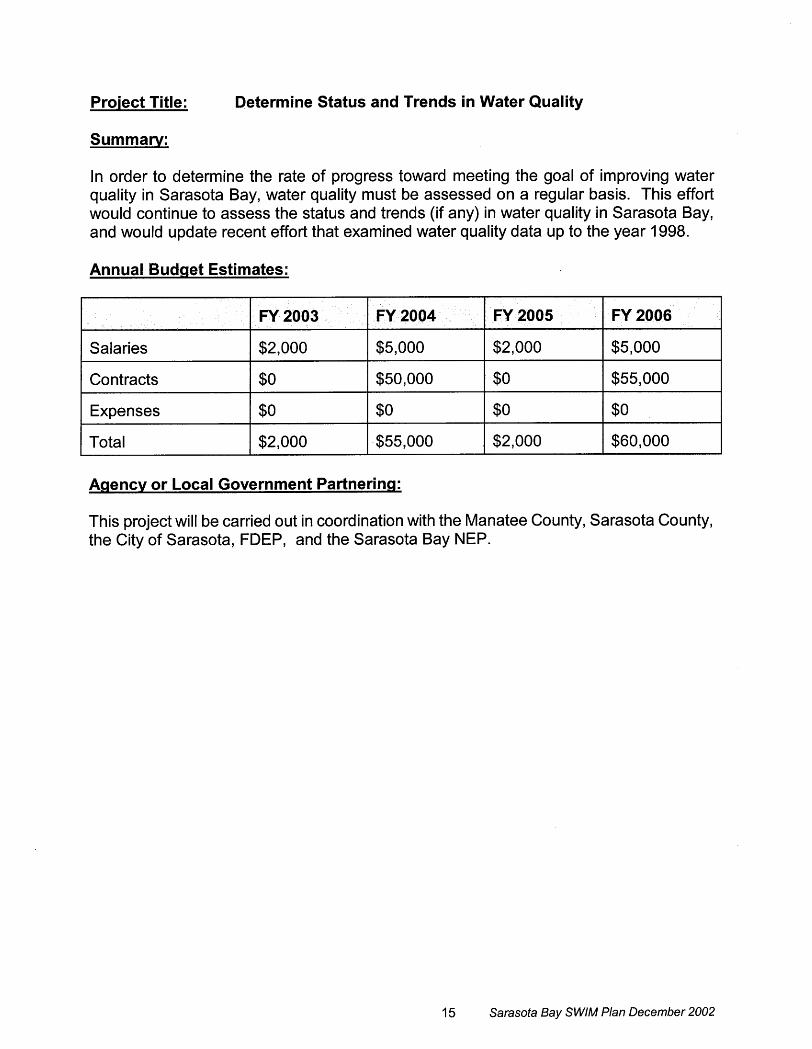
Project Title: Determine Status and Trends in Water Quality
Summary:
In order to determine the rate of progress toward meeting the goal of improving water quality in Sarasota Bay, water quality must be assessed on a regular basis. This effort would continue to assess the status and trends (if any) in water quality in Sarasota Bay, and would update recent effort that examined water quality data up to the year 1998.
Annual Budget Estimates:
1 Salaries 1 $2,000 1 $5,000 1 $2,000 1 $5,000 1 1 contracts 1 $50,000 1 $0 1 $55,000
1 Total 1 $55,000 1 $2,000 1 $60,000 1 Agency or Local Government Partnerinq:
This project will be carried out in coordination with the Manatee County, Sarasota County, the City of Sarasota, FDEP, and the Sarasota Bay NEP.
Sarasota Bay SWIM Plan December 2002
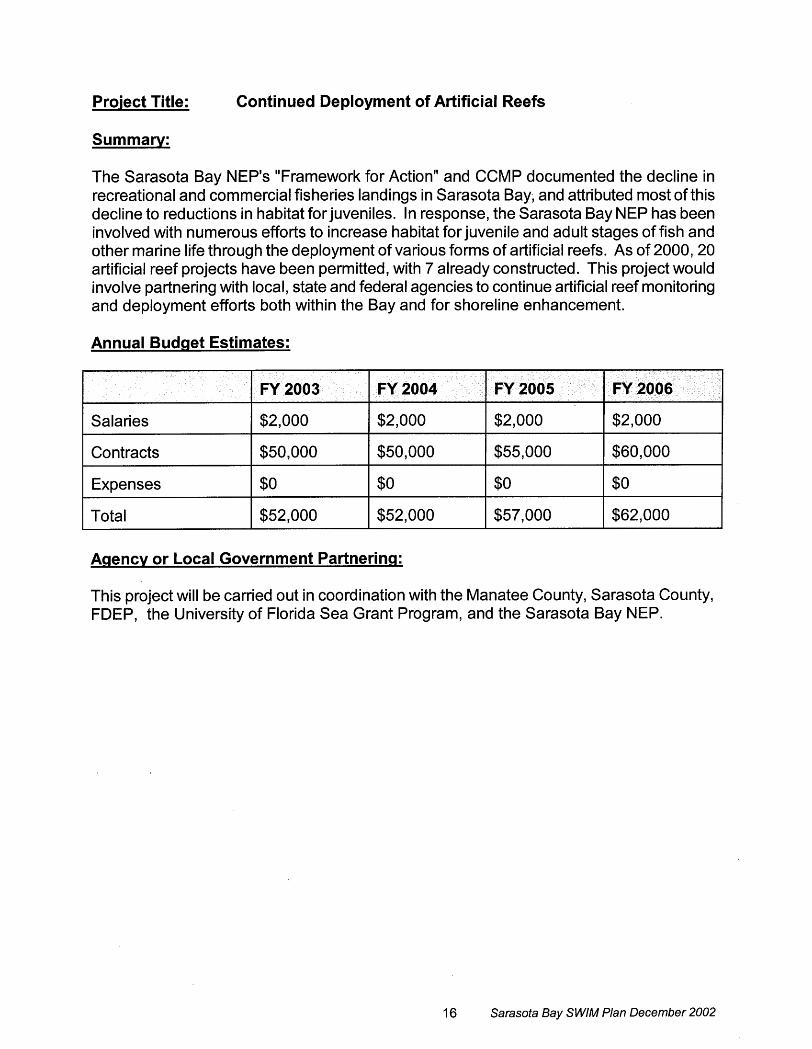
Project Title: Continued Deployment of Artificial Reefs
Summary:
The Sarasota Bay NEP's "Framework for Action" and CCMP documented the decline in recreational and commercial fisheries landings in Sarasota Bay, and attributed most of this decline to reductions in habitat forjuveniles. In response, the Sarasota Bay NEP has been involved with numerous efforts to increase habitat for juvenile and adult stages of fish and other marine life through the deployment of various forms of artificial reefs. As of 2000,20 artificial reef projects have been permitted, with 7 already constructed. This project would involve partnering with local, state and federal agencies to continue artificial reef monitoring and deployment efforts both within the Bay and for shoreline enhancement.
Annual Budaet Estimates:
1 Salaries 1 $2,000 1 $2,000 1 $2,000 1 $2,000 I 1 contracts 1 $50,000 1 $50,000 1 $55,000 1 $60,000
1 Total 1 $52,000 1 $52,000 1 $57,000 1 $62,000
Agency or Local Government Partnering:
This project will be carried out in coordination with the Manatee County, Sarasota County, FDEP, the University of Florida Sea Grant Program, and the Sarasota Bay NEP.
1 6 Sarasota Bay SWIM Plan December 2002
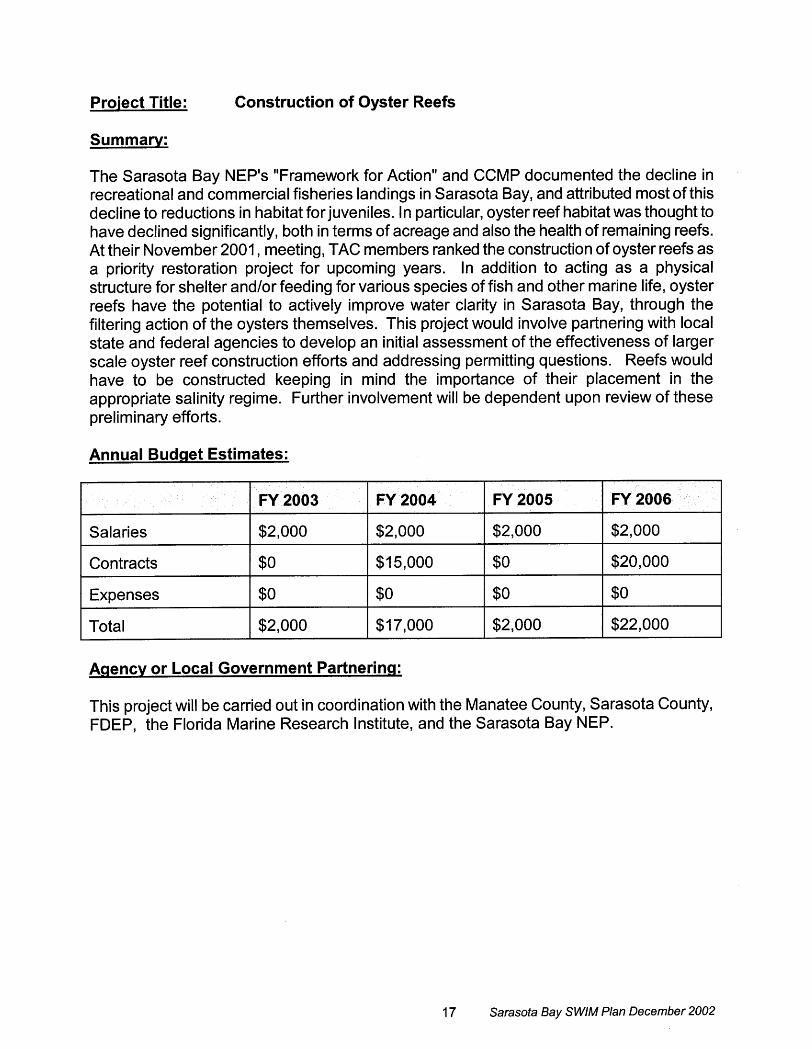
Project Title: Construction of Oyster Reefs
Summary:
The Sarasota Bay NEP's "Framework for Action" and CCMP documented the decline in recreational and commercial fisheries landings in Sarasota Bay, and attributed most of this decline to reductions in habitat for juveniles. In particular, oyster reef habitat was thought to have declined significantly, both in terms of acreage and also the health of remaining reefs. At their November 2001, meeting, TAC members ranked the construction of oyster reefs as a priority restoration project for upcoming years. In addition to acting as a physical structure for shelter and/or feeding for various species of fish and other marine life, oyster reefs have the potential to actively improve water clarity in Sarasota Bay, through the filtering action of the oysters themselves. This project would involve partnering with local state and federal agencies to develop an initial assessment of the effectiveness of larger scale oyster reef construction efforts and addressing permitting questions. Reefs would have to be constructed keeping in mind the importance of their placement in the appropriate salinity regime. Further involvement will be dependent upon review of these preliminary efforts.
Annual Budget Estimates:
Salaries
Contracts
Agency or Local Government Partnering:
-
Expenses
Total
This project will be carried out in coordination with the Manatee County, Sarasota County, FDEP, the Florida Marine Research Institute, and the Sarasota Bay NEP.
$2,000
$0
1 7 Sarasota Bay SWIM Plan December 2002
$0
$2,000
$2,000
$15,000
$0
$1 7,000
$2,000
$0
$2,000
$20,000
$0
$2,000
$0
$22,000
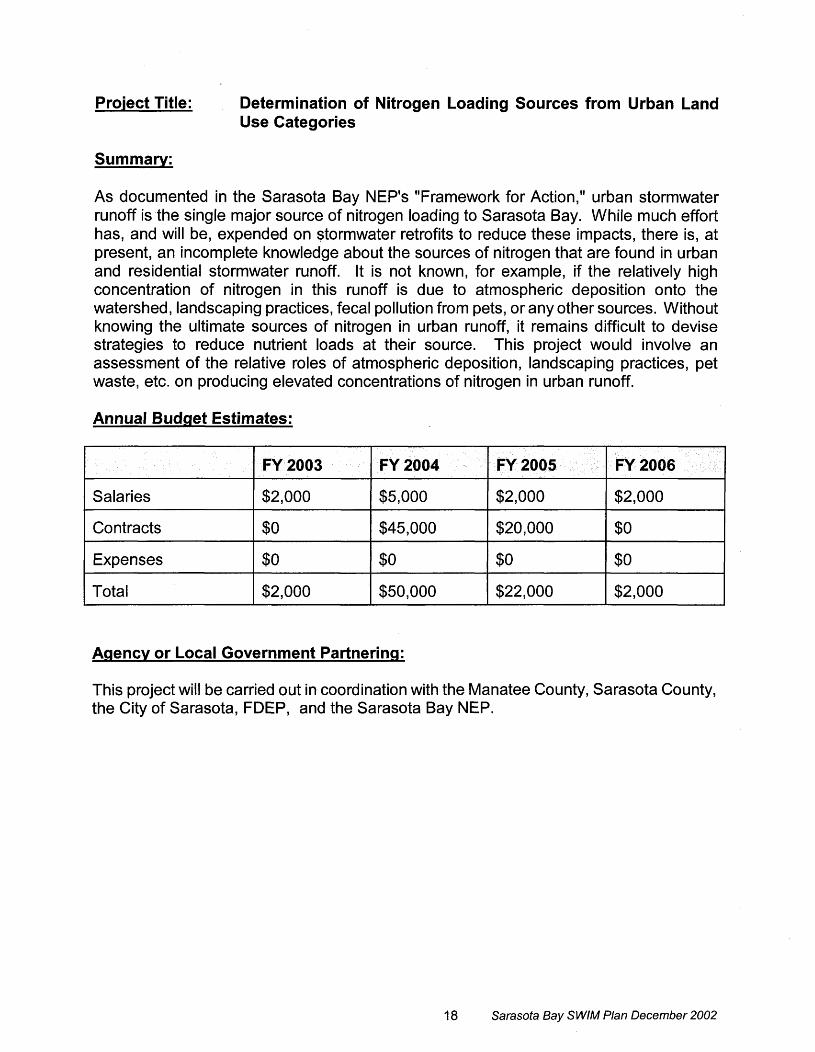
Project Title: Determination of Nitrogen Loading Sources from Urban Land Use Categories
Summary:
As documented in the Sarasota Bay NEP's "Framework for Action," urban stormwater runoff is the single major source of nitrogen loading to Sarasota Bay. While much effort has, and will be, expended on stormwater retrofits to reduce these impacts, there is, at present, an incomplete knowledge about the sources of nitrogen that are found in urban and residential stormwater runoff. It is not known, for example, if the relatively high concentration of nitrogen in this runoff is due to atmospheric deposition onto the watershed, landscaping practices, fecal pollution from pets, or any other sources. Without knowing the ultimate sources of nitrogen in urban runoff, it remains difficult to devise strategies to reduce nutrient loads at their source. This project would involve an assessment of the relative roles of atmospheric deposition, landscaping practices, pet waste, etc. on producing elevated concentrations of nitrogen in urban runoff.
Annual Budget Estimates:
1 Salaries 1 $2,000 1 $5,000 1 $2,000 1 $2,000 1
1 Total 1 $2,000 1 $50,000 1 $22,000 1 $2,000
Contracts
Expenses
Agency or Local Government Partnering:
This project will be carried out in coordination with the Manatee County, Sarasota County, the City of Sarasota, FDEP, and the Sarasota Bay NEP.
$0
$0
Sarasota Bay SWIM Plan December 2002
$45,000
$0
$20,000
$0
$0
$0
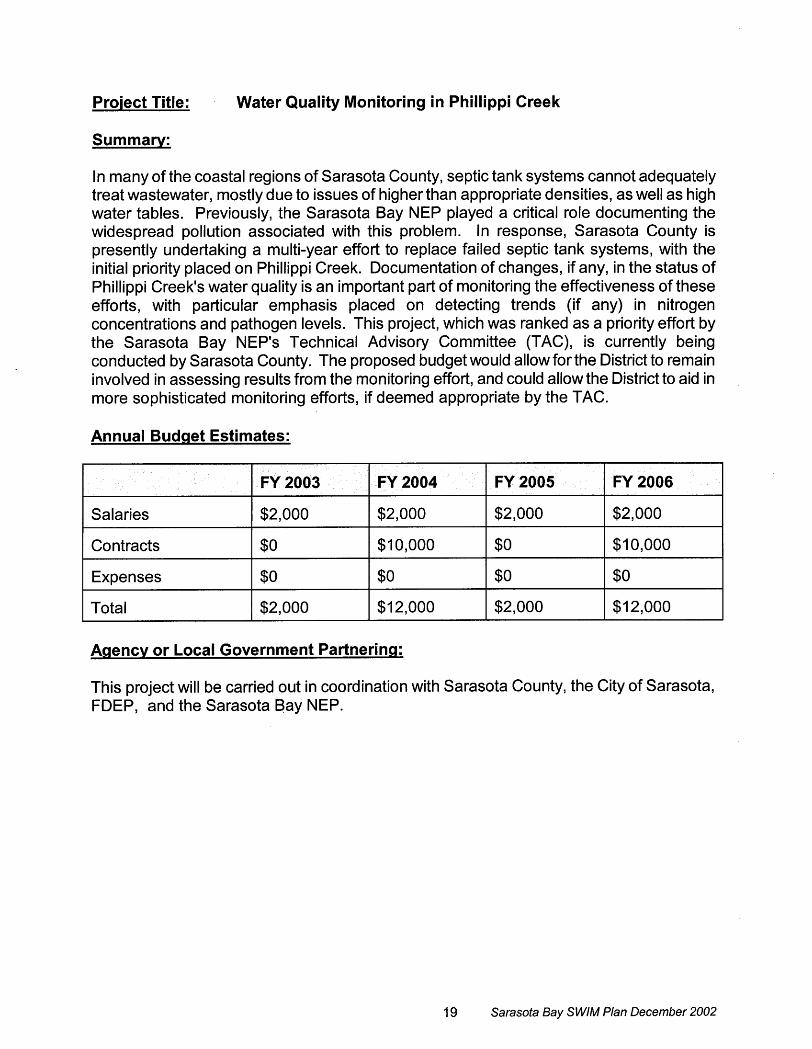
Project Title: Water Quality Monitoring in Phillippi Creek
Summary:
In many of the coastal regions of Sarasota County, septic tank systems cannot adequately treat wastewater, mostly due to issues of higher than appropriate densities, as well as high water tables. Previously, the Sarasota Bay NEP played a critical role documenting the widespread pollution associated with this problem. In response, Sarasota County is presently undertaking a multi-year effort to replace failed septic tank systems, with the initial priority placed on Phillippi Creek. Documentation of changes, if any, in the status of Phillippi Creek's water quality is an important part of monitoring the effectiveness of these efforts, with particular emphasis placed on detecting trends (if any) in nitrogen concentrations and pathogen levels. This project, which was ranked as a priority effort by the Sarasota Bay NEP's Technical Advisory Committee (TAG), is currently being conducted by Sarasota County. The proposed budget would allow for the District to remain involved in assessing results from the monitoring effort, and could allow the District to aid in more sophisticated monitoring efforts, if deemed appropriate by the TAC.
Annual Budget Estimates:
1 Salaries 1 $2,000
1 Contracts I $0
1 Expenses 1 so 1 Total 1 $2,000
Agency or Local Government Partnering:
This project will be carried out in coordination with Sarasota County, the City of Sarasota, FDEP, and the Sarasota Bay NEP.
1 9 Sarasota Bay SWIM Plan December 2002
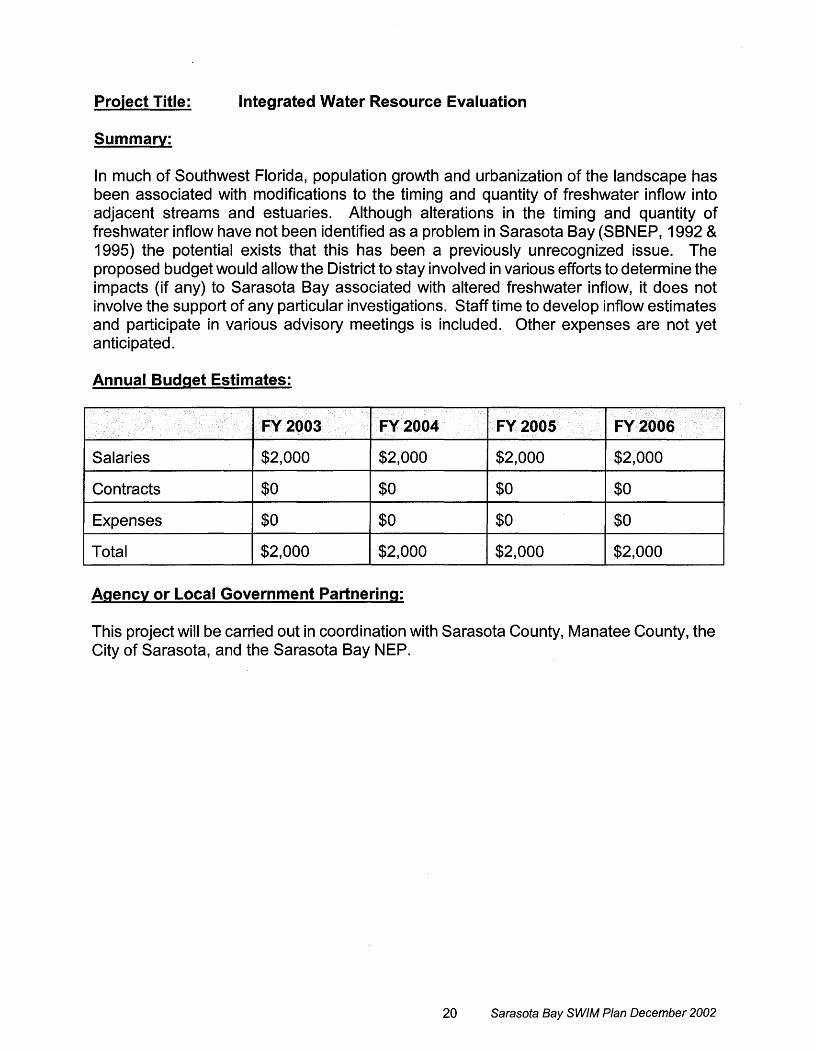
Project Title: Integrated Water Resource Evaluation
Summary:
In much of Southwest Florida, population growth and urbanization of the landscape has been associated with modifications to the timing and quantity of freshwater inflow into adjacent streams and estuaries. Although alterations in the timing and quantity of freshwater inflow have not been identified as a problem in Sarasota Bay (SBNEP, 1992 & 1995) the potential exists that this has been a previously unrecognized issue. The proposed budget would allow the District to stay involved in various efforts to determine the impacts (if any) to Sarasota Bay associated with altered freshwater inflow, it does not involve the support of any particular investigations. Staff time to develop inflow estimates and participate in various advisory meetings is included. Other expenses are not yet anticipated.
Annual Budget Estimates:
1 Salaries 1 $2,000 1 $2,000 I
1 Total 1 $2,000 1 $2,000 1 $2,000 1 Aqency or Local Government Partnering:
This project will be carried out in coordination with Sarasota County, Manatee County, the City of Sarasota, and the Sarasota Bay NEP.
20 Sarasota Bay SWIM Plan December 2002
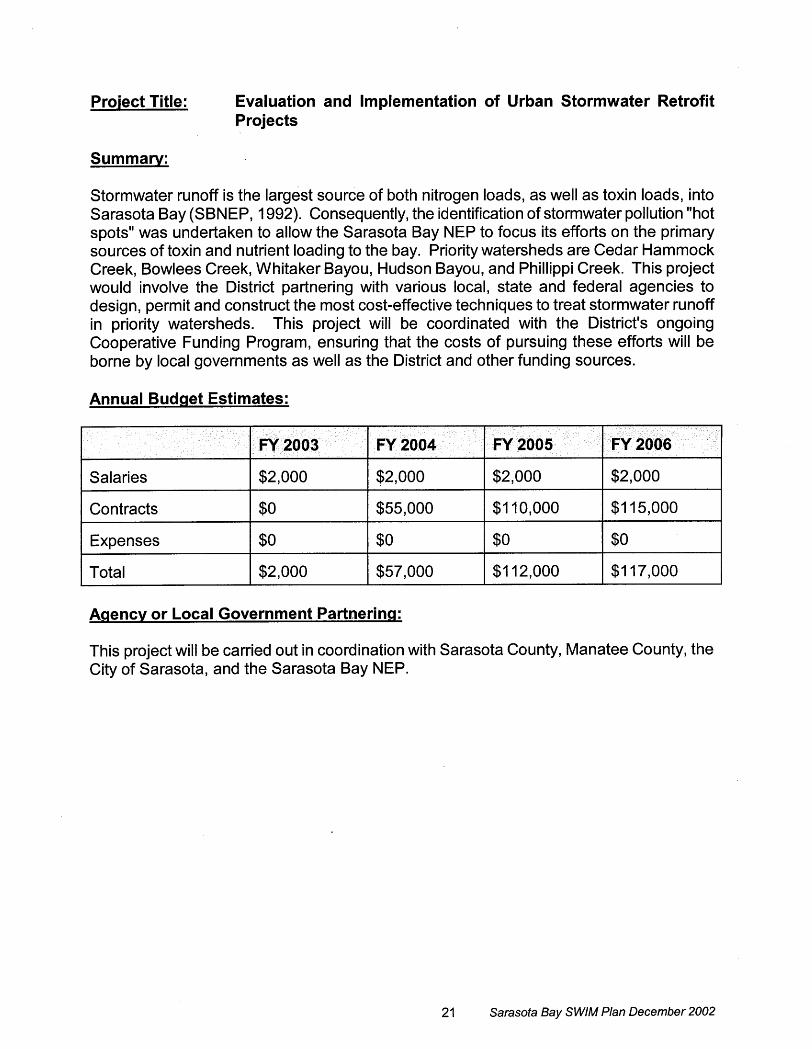
Project Title: Evaluation and Implementation of Urban Stormwater Retrofit Projects
Summary:
Stormwater runoff is the largest source of both nitrogen loads, as well as toxin loads, into Sarasota Bay (SBNEP, 1992). Consequently, the identification of stormwater pollution "hot spots" was undertaken to allow the Sarasota Bay NEP to focus its efforts on the primary sources of toxin and nutrient loading to the bay. Priority watersheds are Cedar Hammock Creek, Bowlees Creek, Whitaker Bayou, Hudson Bayou, and Phillippi Creek. This project would involve the District partnering with various local, state and federal agencies to design, permit and construct the most cost-effective techniques to treat stormwater runoff in priority watersheds. This project will be coordinated with the District's ongoing Cooperative Funding Program, ensuring that the costs of pursuing these efforts will be borne by local governments as well as the District and other funding sources.
Annual Budget Estimates:
Salaries 1 $2,000
Contracts
Expenses
Total 1 $2,000
Aqency or Local Government Partnering:
This project will be carried out in coordination with Sarasota County, Manatee County, the City of Sarasota, and the Sarasota Bay NEP.
2 1 Sarasota Bay SWIM Plan December 2002
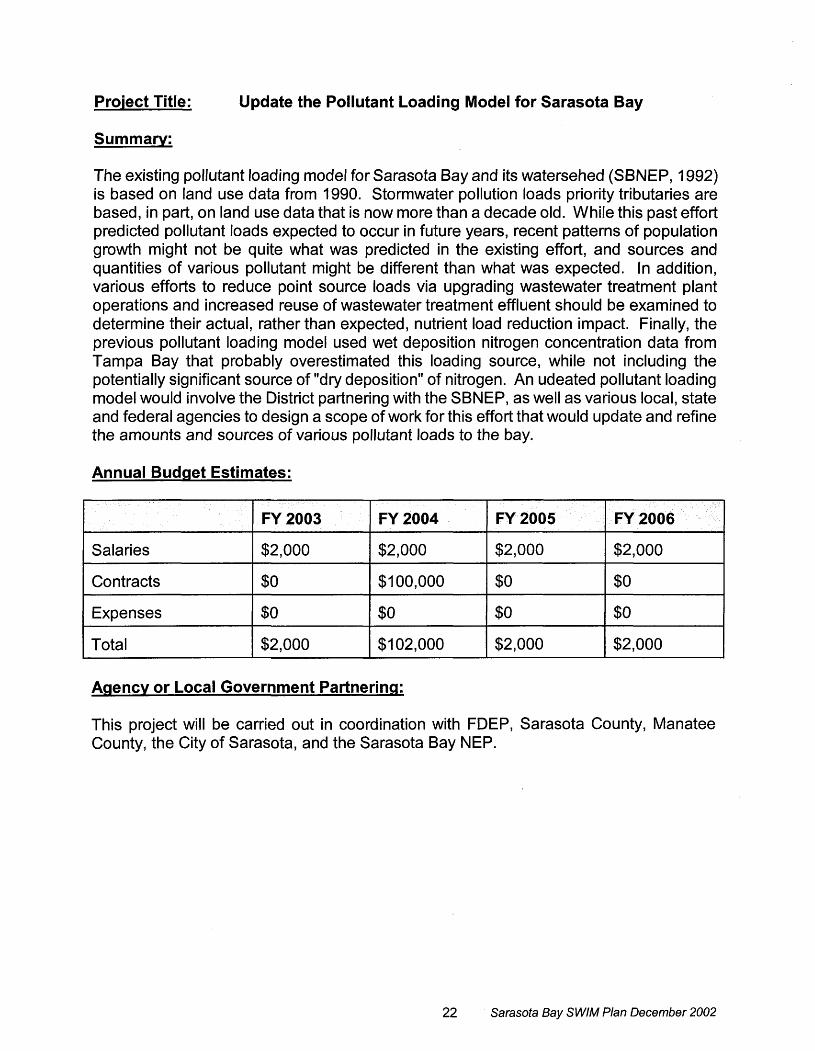
Project Title: Update the Pollutant Loading Model for Sarasota Bay
Summary:
The existing pollutant loading model for Sarasota Bay and its watersehed (SBNEP, 7 992) is based on land use data from 1990. Stormwater pollution loads priority tributaries are based, in part, on land use data that is now more than a decade old. While this past effort predicted pollutant loads expected to occur in future years, recent patterns of population growth might not be quite what was predicted in the existing effort, and sources and quantities of various pollutant might be different than what was expected. In addition, various efforts to reduce point source loads via upgrading wastewater treatment plant operations and increased reuse of wastewater treatment effluent should be examined to determine their actual, rather than expected, nutrient load reduction impact. Finally, the previous pollutant loading model used wet deposition nitrogen concentration data from Tampa Bay that probably overestimated this loading source, while not including the potentially significant source of "dry deposition" of nitrogen. An udeated pollutant loading model would involve the District partnering with the SBNEP, as well as various local, state and federal agencies to design a scope of work for this effort that would update and refine the amounts and sources of various pollutant loads to the bay.
Annual Budget Estimates:
1 Salaries 1 $2,000
1 Contracts I $0
1 Expenses 1 $0
1 Total 1 $2,000
Aqencv or Local Government Partnering:
This project will be carried out in coordination with FDEP, Sarasota County, Manatee County, the City of Sarasota, and the Sarasota Bay NEP.
22 Sarasota Bay SWIM Plan December 2002
APPENDIXA - STATUS OF THE 1997 SARASOTA BAY SWIM PLAN
Within the 1997 Sarasota Bay SWIM Plan, a number of priority projects were outlined, and the basis for undertaking these activities was described. Generally, activities involved starting a number of projects aimed at reducing pollutant loads coming from stormwater and wastewater, as well as habitat restoration projects, seagrass mapping efforts, and various other technical studies. This section discusses the results of these completed and ongoing efforts. Although considered in some detail, much more information is contained in the technical reports referenced. These reports are available from the District's SWIM Section, at (81 3) 985-7481, ext. 2206.
Project:
Status:
Project:
Status:
Proiect:
Status:
Develop a reuse master plan for Sarasota Bay's watershed.
A final report was for this project was completed in 1998. The report was a summary of efforts by local governments to reuse wastewater and stormwater, and outlined a course of action to be followed to ensure greater coordination of future efforts. At present, the Sarasota Bay region reclaims 46 percent of its wastewater treatment plant effluent, which has resulted in reduced demand for groundwater resource for non-drinking water purposes, and reduced nutrient loading from wastewater discharges.
Promote the Florida Yards and Neighborhoods program.
The District has continued to support the Florida Yards and Neighborhoods program as a resident-oriented education program designed to reduce water demand, as well as a means to potentially reduce urban non-point source nitrogen runoff. Continued support is expected to come directly from the Basin Board, at least until FY 2005.
Incorporating water quality improvements into stormwater master plans.
The SWIM program has worked with Manatee and Sarasota Counties to develop conceptual and/or detailed stormwater master plans for various tributaries to Sarasota Bay. These master plans all are designed to incorporate, to the maximum extent practical, improvement of water quality, as well as flood protection. Tributaries that have existing stormwater master plans, or that are expected to have completed master plans by FY 2005 include the following: Arlington/Euclid Canal, Phillippi Creek, Catfish Creek, and Whitaker Bayou.
23 Sarasota Bay SWIM Plan December 2002
Project: Habitat restoration.
Status: As of 2001, approximately 200 acres of wetlands and adjacent uplands have been restored in the Sarasota Bay watershed (SBNEP, 2001). This amount of habitat restoration is higher than the proposed rate of 18 acres per year agreed to in the Sarasota Bay NEP's Comprehensive Conservation and Management Plan (1 995). Completed projects include the following: City Island, Leffis Key, Sixth Street Canal, Quick Point Preserve, Caples Shoreline, Selby Gardens, Sister Keys, Durante Park, and Hog Creek. Proposed projects include: Bird Colony Islands, 191 2 Cortez Schoolhouse site, Perico Bayou, Crossley Estate, Palmer Point, and the Jim Neville Preserve.
Project: Seagrass mapping.
Status: Seagrass meadows, which have been shown to be sensitive bio-indicators of human alterations to water quality, are an important habitat for a number of recreationally and commercially important species of finfish and shellfish. As part of an effort to determine the status and trends of seagrass meadows in Sarasota Bay, the SWIM Program agreed to map seagrass distribution in Sarasota Bay on a regular basis (SBNEP, 1995). At present, seagrass coverage has been quantified for the years 1988, 1994, 1996, and 1999. Information on seagrass coverage is presented to the Sarasota Bay NEP on a regular basis, and is included in the most recent assessment of the bay (SBNEP, 2000).
Project: Further assessment of atmospheric deposition in Sarasota Bay.
Status: In the Sarasota Bay NEP's CCMP (1995), two technical projects were identified as needing further investigation. The first of these projects was to further investigate the sources and impacts of atmospheric deposition on the health of Sarasota Bay. This effort has been completed, and involved a number of tasks. Construction and maintenance of an atmospheric deposition monitoring site allows for the refinement of previous estimates of nitrogen loads. This more recent estimate suggests that nitrogen loads to the bay are lower than previously thought. The second project involved the development of a source model for atmospheric loads, which suggested that nitrogen loads from Sarasota Bay could come from areas as far away as the Cities of Tampa and Lakeland. The third project involved determining the biological impacts of atmospheric deposition of nitrogen. Results from this project suggest that direct loads of atmospherically-derived nitrogen may not beas biologically important a source of nitrogen loading as are stormwater and wastewater.
24 Sarasota Bay SWIM Plan December 2002
Project: Identification of toxic load sources in Sarasota Bay.
Status: In the Sarasota Bay NEP's CCMP (1995), two technical projects were identified as needing further investigation. The first task involved (described above) involved an assessment of the sources and impacts associated with atmospheric deposition of pollutant loads into Sarasota Bay. The second identified project was designed to further identify, on a sub-basin level, the sources of toxin loads in priority watersheds. As identified in the CCMP (1995), these priority watersheds are Cedar Hammock Creek, Bowlees Creek, Whitaker Bayou, Hudson Bayou, and Phillippi Creek. This project has been completed, and results have been communicated to both Sarasota and Manatee Counties, as well as the City of Sarasota. This information is being used to help these local governments better prioritize sub-basins within priority watersheds for stormwater treatment retrofits.
Project: Data management.
Status: This element, identified as a need in the Sarasota Bay NEP's CCMP (1 995), involved aiding the Sarasota Bay NEP in several tasks. These tasks involved the following: 1) uploading all relevant water quality data sets into STORET, 2) purchase of hardware and software to allow for various data analysis efforts, and 3) updating the status and trends of water quality previously conducted in 1992 (SBNEP, 1992). All these tasks have been accomplished, with the SBNEP's data collection efforts being fully loaded into STORET. Ongoing water quality monitoring efforts are conducted by both Sarasota and Manatee Counties, which are the responsible parties for uploading data into STORET. Additionally, Mote Marine Laboratory completed an update of water quality status and trends, with data sets that extended up to 1998.
25 Sarasota Bay SWIM Plan December 2002
APPENDIX B - STATUS AND TRENDS IN THE HEALTH OF SARASOTA BAY
Status and Trends in Water Quality
Status
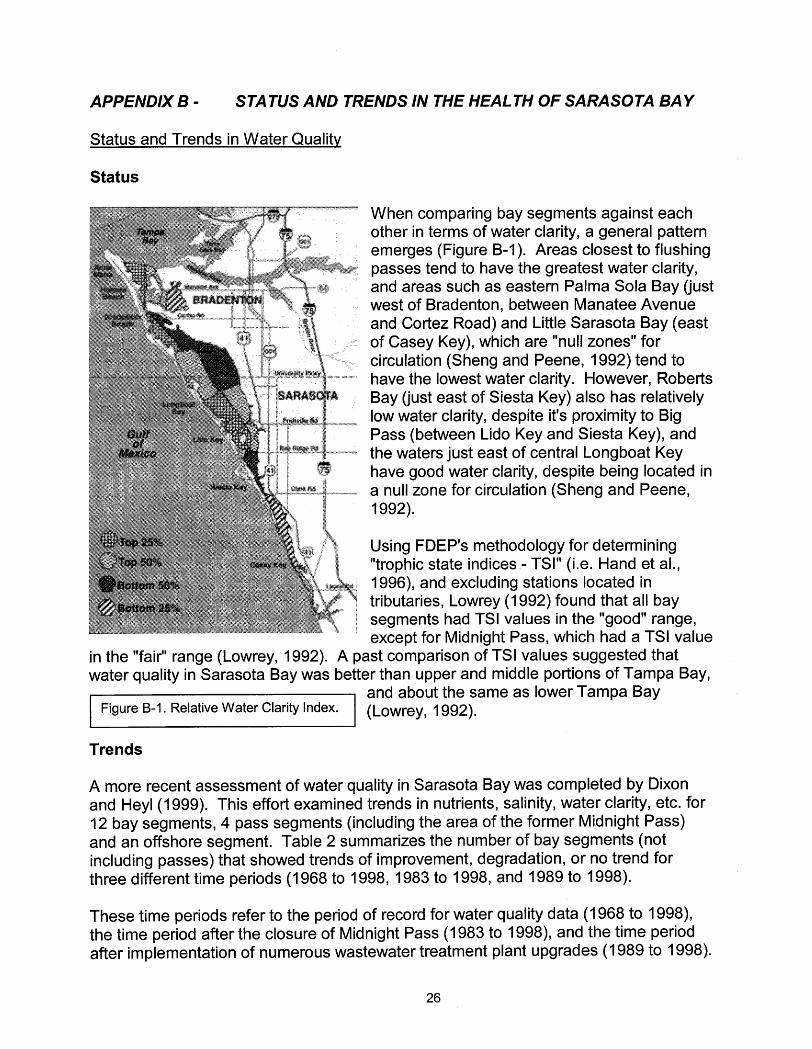
When comparing bay segments against each other in terms of water clarity, a general pattern emerges (Figure B-1). Areas closest to flushing passes tend to have the greatest water clarity, and areas such as eastern Palma Sola Bay (just west of Bradenton, between Manatee Avenue and Cortez Road) and Little Sarasota Bay (east of Casey Key), which are "null zones" for circulation (Sheng and Peene, 1992) tend to have the lowest water clarity. However, Roberts Bay (just east of Siesta Key) also has relatively low water clarity, despite it's proximity to Big Pass (between Lido Key and Siesta Key), and the waters just east of central Longboat Key have good water clarity, despite being located in a null zone for circulation (Sheng and Peene, 1 992).
Using FDEP's methodology for determining "trophic state indices - TSI" (i.e. Hand et al., 1996), and excluding stations located in tributaries, Lowrey (1992) found that all bay segments had TSI values in the "good" range, except for Midnight Pass, which had a TSI value
Trends
in the "fair" range (Lowrey, 1992). A past comparison of TSI values suggested that water quality in Sarasota Bay was better than upper and middle portions of Tampa
and about the same as lower Tampa Bay
A more recent assessment of water quality in Sarasota Bay was completed by Dixon and Heyl (1999). This effort examined trends in nutrients, salinity, water clarity, etc. for 12 bay segments, 4 pass segments (including the area of the former Midnight Pass) and an offshore segment. Table 2 summarizes the number of bay segments (not including passes) that showed trends of improvement, degradation, or no trend for three different time periods (1 968 to 1998, 1983 to 1998, and 1989 to 1998).
Figure B-1. Relative Water Clarity Index.
These time periods refer to the period of record for water quality data (1 968 to 19981, the time period after the closure of Midnight Pass (1983 to 1998), and the time period after implementation of numerous wastewater treatment plant upgrades (1 989 to 1998).
(Lowrey, 1992).

Table 2 - Trends in Water Quality. Number of bay segments (out of 12 total) with significant (p < 0.05) trends over time for total nitrogen, total phosphorus, chlorophyll A, secchi disk depth, and salinity (data summarized from Dixon and Heyl, 1999).
Chlorophyll A
Total Nitrogen
Total Phosphorus
Improve - 4 Degrade - 1 No trend - 7
Improve -10 Degrade - 0 No trend - 2 Improve -1 0 Degrade - 0 No trend - 2
Salinity
Secchi Disk Depth
Increase -2 Decrease - 5 No trend - 5
Improve -7 Degrade - 2 No trend - 3
Improve - 5 Degrade - 0 No trend - 7
1983-1 998 Improve - 10 Degrade - 0 No trend - 2 Improve - 10 Degrade - 0 No trend - 2
Improve - 0 Degrade - 1 No trend - 11
1989-1 998 Improve - 9 Degrade - 0 No trend - 3 Improve - 9 Degrade - 0 No trend - 3
Improve - 7 Degrade - 1 No trend - 4 Increase - 2 Decrease - 2 No trend - 8
Improve - 2 Degrade - 2 '
No trend - 8 Increase - 2 Decrease - 3 No trend - 7
Since 1968, 10 of 12 bay segments show a pattern of decreasing concentrations of total nitrogen and total phosphorus. During this same time period, chlorophyll A concentrations improved in 4 of 12 segments, but actually degraded in 1 bay segment (western Anna Maria Sound just east of Holmes Beach). Water clarity, as measured in secchi disk depths, improved in 7 segments, but degraded in 2 bay segments (along the barrier islands just east of Bradenton Beach and northern Longboat Key, and in Little Sarasota Bay). Salinity increased at 2 segments (eastern and western portions of Palma Sola Bay), but decreased in 5 other bay segments, including Little Sarasota Bay. In general, areas with improved water clarity were also areas with improving trends for both nutrients and chlorophyll A. Improvements in water clarity do not seem to be driven by reduced volumes of stormwater runoff due to changes in rainfall, as most bay segments that showed evidence of increased secchi disk depths did not also have trends of increasing salinity.
The greatest relevance for testing for trends in water quality from 1983 to 1998 is for Little Sarasota Bay. This time period represents conditions after the closure of Midnight Pass, which occurred in 1983. According to Sheng and Peene (1992) the closure of Midnight Pass caused circulation and flushing to decrease in Little Sarasota Bay, although flushing rates increased in Roberts Bay (just east of Siesta Key) and Blackburn Bay (just east of Casey Key). All three bay segments (Roberts Bay, Little Sarasota Bay, and Blackburn Bay) show evidence of decreased concentrations of total nitrogen and total phosphorus during this time period. In contrast, none of these three
bay segments shows a trend in chlorophyll A. Roberts Bay exhibits a trend of improved water clarity between 1983 and 1998, but no trend is evident for either Little Sarasota Bay or Blackburn Bay.
Since 1989, 9 of 12 bay segments show patterns of decreasing concentrations of both total nitrogen and total phosphorus. In contrast, no bay segments show a pattern of decreasing chlorophyll A concentrations, although one bay segment (eastern Palma Sola Bay) exhibits a pattern of increasing algal abundance. Water clarity has apparently increased during this time period in 2 bay segments (along the mainland east of Lido Key, and in Roberts Bay) but has decreased in 2 other bay segments (eastern Palma Sola Bay, and along the barrier islands just north and south of Longboat Pass). It seems unlikely that increased runoff from the 1997 to 1998 El Nino event was the basis for the increased chlorophyll A concentrations and decreased water clarity in eastern Palma Sola Bay during this time period, as there was no concurrent trend in salinity. However, the trend of decreased water clarity between 1989 and 1998 along the barrier islands just north and south of Longboat Pass is concurrent with a trend of declining salinities.
In summary, recent (1 989 to 1998) trends of declining concentrations of total nitrogen and total phosphorus (9 of 12 bay segments) do not seem to be accompanied by continued decreases in phytoplankton abundance, as no bay segments showed trends of decreasing chlorophyll A concentrations during that same time period. Also, while 2 bay segments show evidence of improved water clarity between 1989 and 1998,2 bay segments also seem to have experienced declines in water clarity during that same time period. The basis for this potential disconnect between declining nutrient concentrations and further decreases in phytoplankton abundance and improvements in water clarity (between 1989 and 1998) merits further investigation.
Finally, additional efforts are required to determine the basis for the apparent trends of decreasing water clarity in eastern Palma Sola Bay and that portion of Sarasota Bay adjacent to the barrier islands just north and south of Longboat Pass in recent years.
Contaminant Levels in Bay Sediments
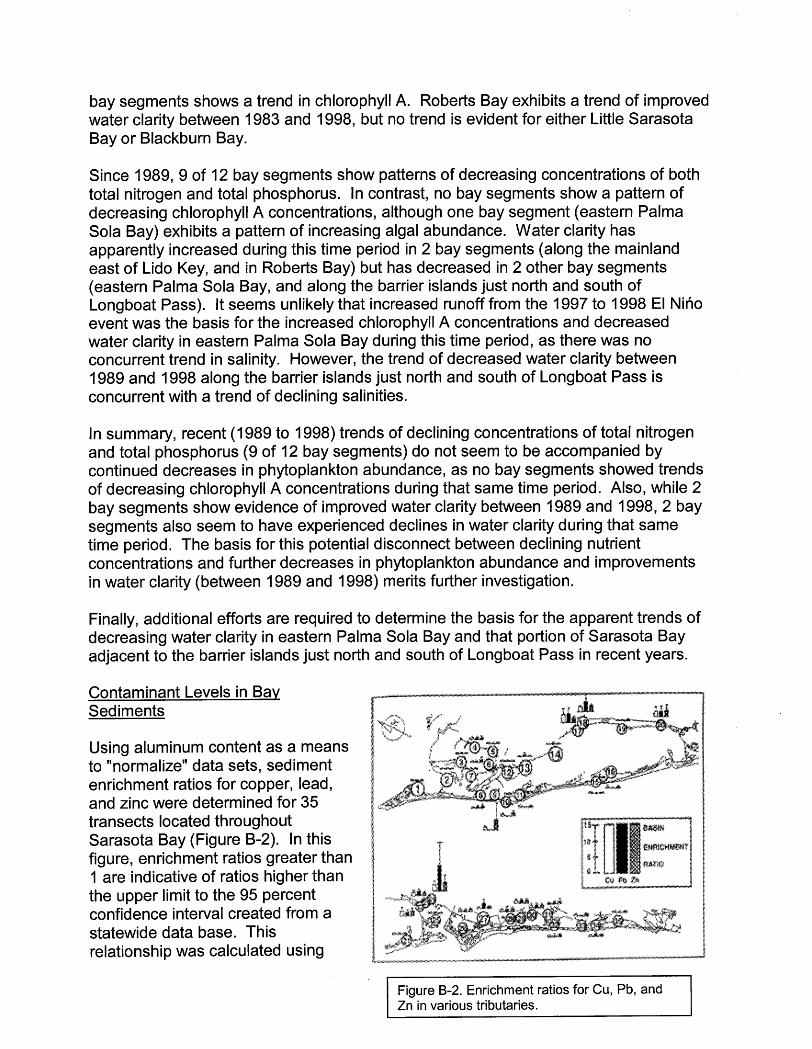
Using aluminum content as a means to "normalize" data sets, sediment enrichment ratios for copper, lead, and zinc were determined for 35 transects located throughout Sarasota Bay (Figure B-2). In this figure, enrichment ratios greater than 1 are indicative of ratios higher than the upper limit to the 95 percent confidence interval created from a statewide data base. This relationship was calculated using
ratios for Cu, Pb, and Zn in various tributaries.
data from locations throughout Florida where toxin loads are absent or minimal (Lowery, 1992). In Sarasota Bay, several "hot spots" for toxin contamination are apparent, specifically, Hudson Bayou, Bowlees Creek, Phillippi Creek, W hitaker Bayou, and Cedar Hammock Creek.
Areas with elevated enrichment ratios are indicative of anthropogenic impacts. Such areas typically show multiple contamination from metals, pesticides, and hydrocarbon residues (Lowrey, 1992). Additionally, areas with elevated levels of toxins in the sediment are typically areas with elevated levels of toxins in shellfish (Dixon, 1992).
These watersheds have been the focus of more detailed assessments in recent years, to try and determine which sub-basins, if any, contribute disproportionately high toxin loads (Dixon et al. 1999 a & b). With this information, stormwater retrofit projects can be placed for optimal benefit.
Status and Trends in Wetlands
Accompanying the post-World War I I population boom, tidal wetlands throughout the watershed decreased from approximately 4,104 acres in 1950 to 2,495 acres in 1990 (Estevez, 1992). Forested freshwater wetlands in the Sarasota Bay watershed decreased by 35 percent during the period 1975-1 991 (Beaman, 1992).
In Manatee County, much of the original tidal wetland coverage remains intact, although much of the freshwater wetlands have been lost. In Sarasota County, vast stretches of freshwater wetlands remain intact, but the mangrove shoreline has nearly disappeared in most areas (Estevez, 1992). The pattern of wetland loss appears to be related to how development occurred in different parts of the watershed, with Manatee County mostly expanding into the interior regions south of Bradenton, and with Sarasota County mostly expanding parallel to its shoreline with the Bay.
The rate of loss of tidal wetlands during the period of 1975-1990 was about 20 acres per year, which is less than one half the rate experienced during the period of 1950- 1975 (52 acres per year; Estevez, 1992). Wetlands loss in Sarasota Bay has typically involved two phenomena: the loss of areal coverage itself, and the fragmentation of remaining wetlands into smaller pieces. As fragmentation alone can have a significant negative impact on wetland processes, regardless of declines in acreage, wetland productivity, habitat value and stability are therefore dually impacted (Reid and Trexler, 1991).
For freshwater wetlands, the rate of loss from 1975-1 990 equals 1 19 acres per year, nearly six times the rate of loss for tidal wetlands. Forested wetlands account for 23 percent of the remaining 1,388 freshwater wetlands in the watershed (by number, not acreage), with marshland accounting for 39 percent and wet prairies accounting for 27 percent of all freshwater wetlands (Beaman, 1992). More than 75 percent of all freshwater wetlands have either been dredged or filled to some degree, with only 21 percent exhibiting no signs of human impact (Beaman, 1992). Additionally, up to 95 percent of freshwater wetlands, depending on location in the watershed, have some
degree of invasive species problems, with the severity of such problems being greatest in the northern and central portions of the watershed, and least in the southern portions (Seaman, 1992). Recent habitat restoration projects are estimated to have created approximately 200 acres of tidal wetlands and adjacent upland communities (SBNEP, 200 1 ).
Status and Trends in Fisheries
Sarasota Bay includes a variety of habitats that are important in sustaining larval, juvenile, and adult stages of many recreationally and commercially important species of fish. Open water habitats, hard bottom communities, and artificial reefs support large numbers of baitfish such as menhaden (Brevoortia SJ.) and thread-herring (Opisthonema oglinum), as well as occasional schools of pompano (Trachinotus carolinus), and large numbers of black sea bass (Centropristis striata) and sheepshead (Archosargus ~robatoce~halus). Seagrass meadows provide vital habitat for two of the most sought-after species, spotted seatrout (Cvnoscion nebulosus) and redfish (Sciaenops ocellatus), as well as the commercially valuable striped mullet (Mugil cephalus). Mangrove fringes support large numbers of juvenile fish, and also provide critical habitat for various species of grunts (Haemulon spp.) and snappers (Lutianus SPPJ
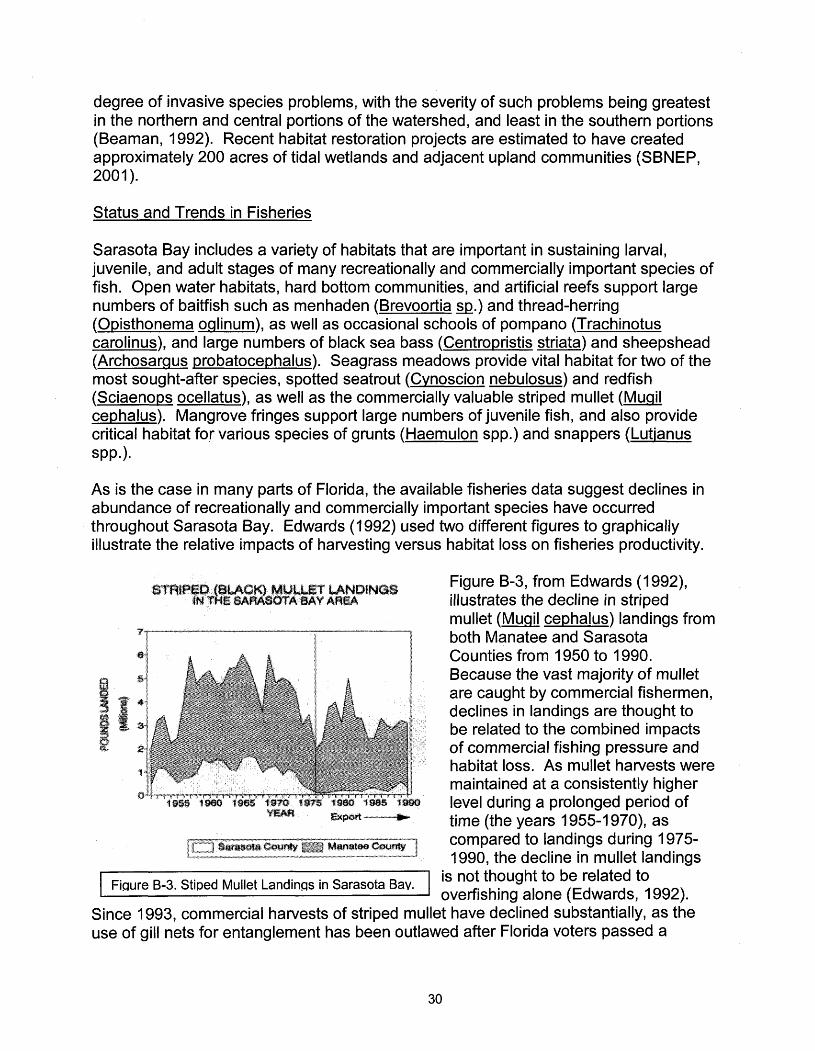
As is the case in many parts of Florida, the available fisheries data suggest declines in abundance of recreationally and commercially important species have occurred throughout Sarasota Bay. Edwards (1992) used two different figures to graphically illustrate the relative impacts of harvesting versus habitat loss on fisheries productivity.
Figure B-3, from Edwards (1992), illustrates the decline in striped mullet (Mugil cephalus) landings from both Manatee and Sarasota Counties from 1950 to 1990. Because the vast majority of mullet are caught by commercial fishermen, declines in landings are thought to be related to the combined impacts of commercial fishing pressure and habitat loss. As mullet harvests were maintained at a consistently higher level during a prolonged period of time (the years 1955-1 970), as compared to landings during 1975- 1990, the decline in mullet landings
Since 1993, commercial harvests of striped mullet have declined substantially, as the use of gill nets for entanglement has been outlawed after Florida voters passed a
Figure B-3. Stiped Mullet Landinas in Sarasota Bay. is not thought to be related to overfishing alone (Edwards, 1992).
Constitutional Amendment to prevent such gear from being used. Commercial harvesting of striped mullet now requires the use of cast nets, rather than gill nets.
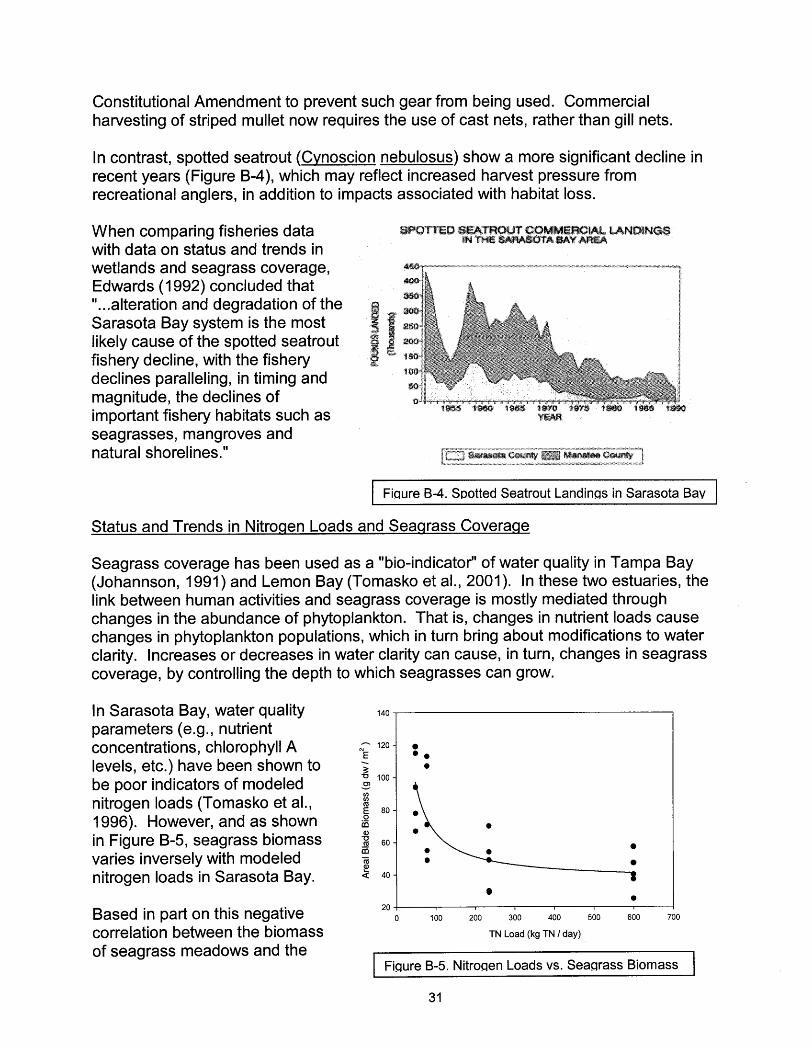
In contrast, spotted seatrout (Cynoscion nebulosus) show a more significant decline in recent years (Figure B-4), which may reflect increased harvest pressure from recreational anglers, in addition to impacts associated with habitat loss.
When comparing fisheries data with data on status and trends in wetlands and seagrass coverage, Edwards (1 992) concluded that I . . . alteration and degradation of the Sarasota Bay system is the most likely cause of the spotted seatrout fishery decline, with the fishery declines paralleling, in timing and magnitude, the declines of important fishery habitats such as seagrasses, mangroves and natural shorelines."
Fiaure B-4. Spotted Seatrout Landinqs in Sarasota Bav
Status and Trends in Nitrogen Loads and Seagrass Coverage
Seagrass coverage has been used as a "bio-indicator" of water quality in Tampa Bay (Johannson, 1991) and Lemon Bay (Tomasko et al., 2001). In these two estuaries, the link between human activities and seagrass coverage is mostly mediated through changes in the abundance of phytoplankton. That is, changes in nutrient loads cause changes in phytoplankton populations, which in turn bring about modifications to water clarity. Increases or decreases in water clarity can cause, in turn, changes in seagrass coverage, by controlling the depth to which seagrasses can grow.
Based in part on this negative 20 ! I I 0 I 1 I
0 100 200 300 400 500 600 700
In Sarasota Bay, water quality 140
correlation between the biomass TN Load (kg TN I day)
parameters (e.g., nutrient concentrations, chlorophyll A - E 120-
. levels, etc.) have been shown to 3
of seagrass meadows and the 1 Fiqure B-5. Nitroaen Loads vs. Seaarass Biomass
m e Â
be poor indicators of modeled -0 100-
nitrogen loads (Tomasko et al., 1996). However, and as shown in Figure B-5, seagrass biomass varies inversely with modeled nitrogen loads in Sarasota Bay. a 40 - 8
0 Â
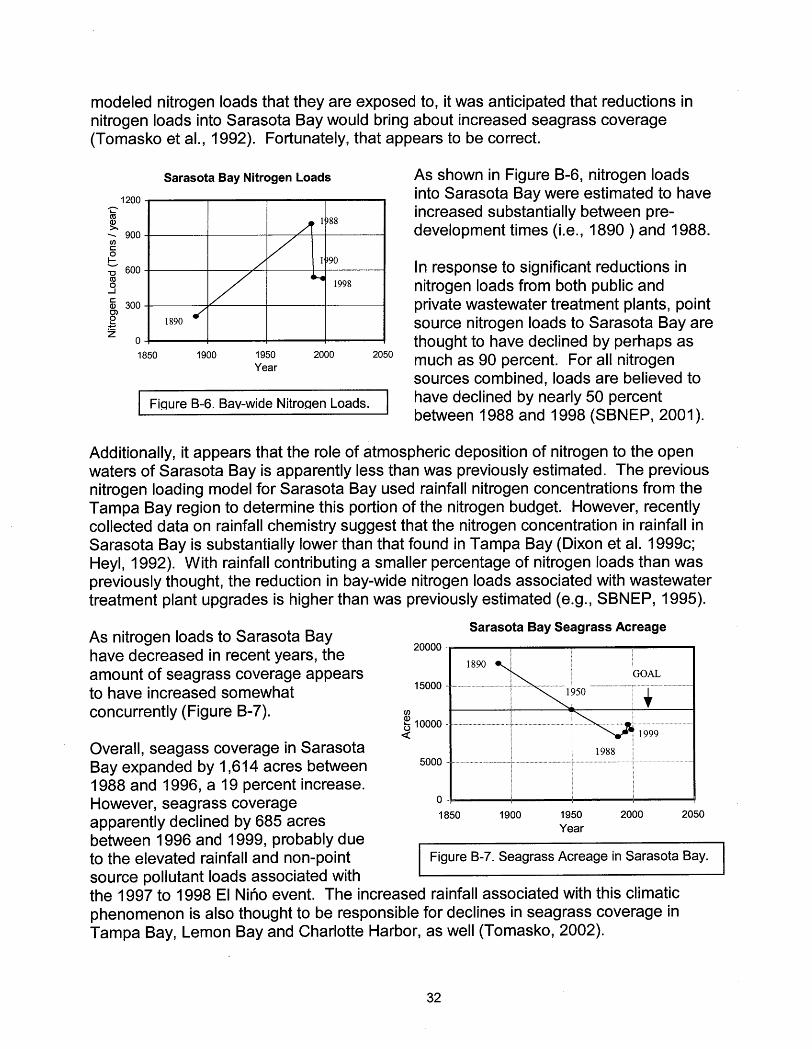
modeled nitrogen loads that they are exposed to, it was anticipated that reductions in nitrogen loads into Sarasota Bay would bring about increased seagrass coverage (Tomasko et al., 1992). Fortunately, that appears to be correct.
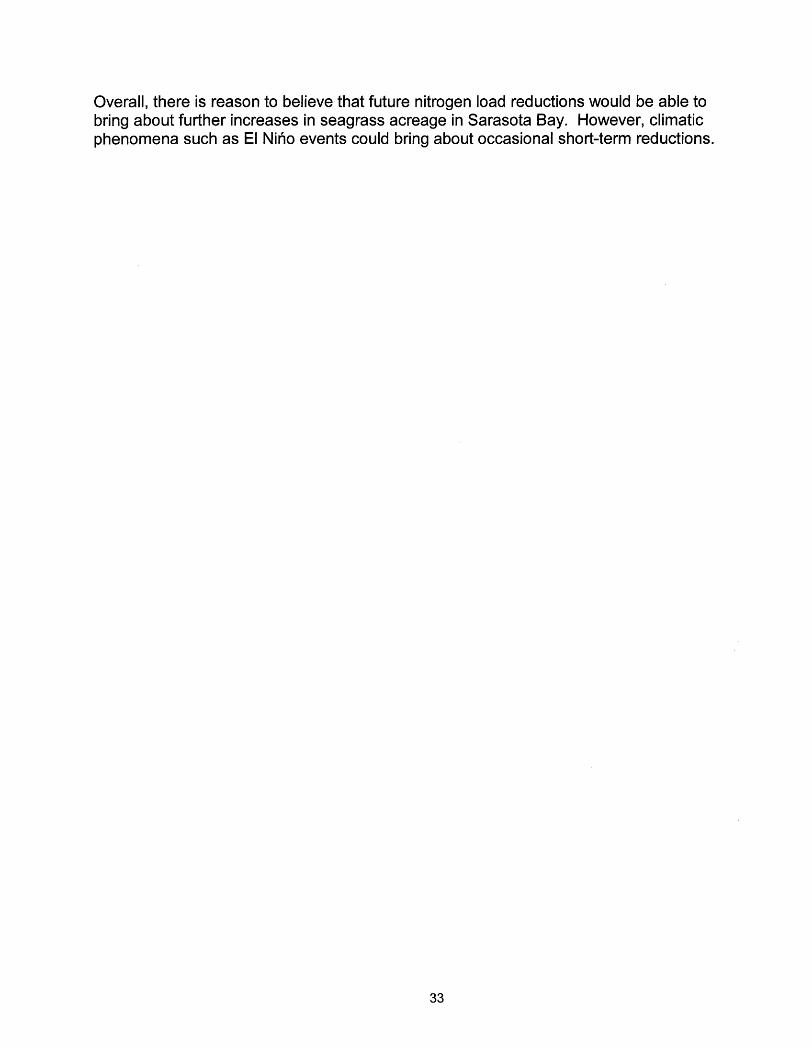
Sarasota Bay Nitrogen Loads
1850 1900 1950 2000 2050 Year
Fiaure B-6. Bay-wide Nitroaen Loads.
As shown in Figure B-6, nitrogen loads into Sarasota Bay were estimated to have increased substantially between pre- development times (i.e., 1890 ) and 1988.
In response to significant reductions in nitrogen loads from both public and private wastewater treatment plants, point source nitrogen loads to Sarasota Bay are thought to have declined by perhaps as much as 90 percent. For all nitrogen sources combined, loads are believed to have declined by nearly 50 percent between 1988 and 1998 (SBNEP, 2001).
Additionally, it appears that the role of atmospheric deposition of nitrogen to the open waters of Sarasota Bay is apparently less than was previously estimated. The previous nitrogen loading model for Sarasota Bay used rainfall nitrogen concentrations from the Tampa Bay region to determine this portion of the nitrogen budget. However, recently collected data on rainfall chemistry suggest that the nitrogen concentration in rainfall in Sarasota Bay is substantially lower than that found in Tampa Bay (Dixon et al. 1999c; Heyl, 1992). With rainfall contributing a smaller percentage of nitrogen loads than was previously thought, the reduction in bay-wide nitrogen loads associated with wastewater treatment plant upgrades is higher than was previously estimated (e.g., SBNEP, 1995).
Sarasota Bay Seagrass Acreage As nitrogen loads to Sarasota Bay have decreased in recent years, the amount of seagrass coverage appears GOAL
.......
to have increased somewhat concurrently (Figure B-7).
Overall, seagass coverage in Sarasota 1988
Bay expanded by 1,614 acres between 1988 and 1996, a 19 percent increase. However, seagrass coverage o -1 apparently declined by 685 acres 1850 1900 1950 2000 2050
Year between 1996 and 1999, probably due h I
to the elevated rainfall and non-point Figure B-7. Seagrass Acreage in Sarasota Bay.
source pollutant loads associated with the 1997 to 1998 El Nino event. The increased rainfall associated with this climatic phenomenon is also thought to be responsible for declines in seagrass coverage in Tampa Bay, Lemon Bay and Charlotte Harbor, as well (Tomasko, 2002).
Overall, there is reason to believe that future nitrogen load reductions would be able to bring about further increases in seagrass acreage in Sarasota Bay. However, climatic phenomena such as El Nino events could bring about occasional short-term reductions.
APPENDIX C - LITERATURE CITED
Beaman, R. 1992. Freshwater wetlands. Pp. 6.21-6.32. In: (P. Roat, C. Ciccolella, ~ . ~ ' m i t h , and D. Tomasko, eds.). Sarasota Bay: Framework for Action. Sarasota Bay National Estuary Program. Sarasota, FL.
Deming, J., R.S. Schwarz, P. Carender, D. Delahaye, and J.R. Williams. 1990. An historic resources survey of the coastal zone of Sarasota County, Florida. Report to the Sarasota County Board of County Commissioners, Sarasota, FL.
Dixon, L.K. 1992. Bivalved shellfish of Sarasota Bay. Pp. 11 .I-1 1.18. In: (P. Roat, C. Ciccolella, H.Smith, and D. Tomasko, eds.). Sarasota Bay: Framework for Action. Sarasota Bay National Estuary Program. Sarasota, FL.
Dixon, L.K. and M.G. Heyl. 1999. Trend analysis of water quality data for the Sarasota Bay National Estuary Program. Final Report for: Sarasota Bay National Estuary Program. Sarasota, FL.
Dixon, L.K., Kirkpatrick, G.J. and J.R. Leverone. 1999. Biological effects of atmospheric deposition on algal assemblages. Final Report for: Sarasota Bay National Estuary Program. Sarasota, FL.
Edwards, R.E. 1992. Fishery resource assessment. Pp. 10.1-10.28. In: (P. Roat, C. Ciccolella, H.Smith, and D. Tomasko, eds.). Sarasota Bay: Framework for Action. Sarasota Bay National Estuary Program. Sarasota, FL.
Estevez, E.D. 1992. Tidal wetlands. Pp. 6.1-6.20. In: (P. Roat, C. Ciccolella, H.Smith, and D. Tomasko, eds.). Sarasota Bay: Framework for Action. Sarasota Bay National Estuary Program. Sarasota, FL.
Hand, J., Col, J., and L. Lord. 1996. Southwest Florida district water quality: 1996 305(b) technical appendix. FDEP, Bureau of Surface Water Management. Tallahassee, FL.
Heyl, M.G. 1992. Point- and nonpoint-source pollutant-loading assessment. Pp. 12.1 - 12.1 9. In: (P. Roat, C. Ciccolella, H.Smith, and D. Tomasko, eds.). Sarasota Bay: Framework for Action. Sarasota Bay National Estuary Program. Sarasota, FL.
Johansson, J.O.R. 1991. Long-term trends of nitrogen loading, water quality and biological indicators in Hillsborough Bay, Florida. Pp. 157-176. In: Treat, S.F., Clark, P.A., eds. Proceedings, Tampa Bay Area Scientific Information Symposium 2. February 27-March 1, 1991 : Tampa, FL.
Lowrey, S. 1992. Physical and chemical properties - bay water and sediment quality. Pp. 4.2-4.20. In: (P. Roat, C. Ciccolella, H.Smith, and D. Tomasko, eds.). Sarasota Bay: Framework for Action. Sarasota Bay National Estuary Program. Sarasota, FL.
Reid, W.V. and M.C. Trexler. 1991. Drowning the national heritage: climate change and U.S. coastal biodiversity. World Resources Institute. Washington, D.C.
Sarasota Bay National Estuary Program. 1995. Comprehensive Conservation and Management Plan. Sarasota Bay National Estuary Program. Sarasota, FL.
Sarasota Bay National Estuary Program. 2001. Sarasota Bay 2000 - A Decade of Progress. Sarasota Bay National Estuary Program. Sarasota, FL.
Sheng, Y.P., and S. Peene. 1992. Circulation and its effect on water quality. Pp. 5.1 - 5.18. In: (P. Roat, C. Ciccolella, H.Smith, and D. Tomasko, eds.). Sarasota Bay: Framework for Action. Sarasota Bay National Estuary Program. Sarasota, FL.
Tomasko, D.A., M. Alderson, P. Clark, J. Culter, K. Dixon, R.Edwards, E. Estevez, M. Heyl, S. Lowrey, Y.P. Sheng, J. Stevely. 1992. Technical synthesis of Sarasota Bay. Pp. 14.1-14.16. In: (P. Roat, C. Ciccolella, H.Smith, and D. Tomasko, eds.). Sarasota Bay: Framework for Action. Sarasota Bay National Estuary Program. Sarasota, FL.
Tomasko, D.A., Dawes, C.J., and M.O. Hall. (1996). The effects of anthropogenic nutrient enrichment on turtle grass (Thalassia testudinum) in Sarasota Bay, Florida (USA). Estuaries 19: 448-456.
Tomasko, D.A., Bristol, D.L. and J.A. Ott. 2001. Assessment of present and future nitrogen loads, water quality, and seagrass (Thalassia testudinum) depth distribution in Lemon Bay, Florida. Estuaries 24: 926-938.
Tomasko, D.A. (2002). Status and trends in seagrass coverage in Tampa Bay, with reference to other Southwest Florida Estuaries. Pp. 11 -20. In: H.S. Greening (ed.). Seagrass Management: It's Not Just Nutrients! 2000 Aug. 22-24; St. Petersburg, FL. Tampa Bay Estuary Program. 246 p.
Whelan, J.J. 1992. Recreational access and use assessment. Pp. 13.1-13.20. In: (P. Roat, C. Ciccolella, H.Smith, and D. Tomasko, eds.). Sarasota Bay: Framework for Action. Sarasota Bay National Estuary Program. Sarasota, FL.
APPENDIX D - GOVERNANCE WITHIN THE SARASOTA BAY BASIN
A. Overview
Five levels of government are involved in resource management and regulatory activities within the Sarasota Bay Basin. These include single purpose local governments (i.e. independent taxing districts), general purpose local governments (i.e. cities and counties), regional agencies (i.e. SWFWMD and the Southwest Florida Regional Planning Council), as well as state and federal agencies.
B. Agencies
1. Local Governments
a. Sarasota County
Sarasota County, established in 1921, has an estimated (1 988) population of 257,667 and a land area of 573 square miles. It contains five general purpose local governments [the Board of County Commissioners, the City of Sarasota (population 51,442), the City of Venice (population 15,252), the City of North Port (population 9,145), and the Town of Longboat Key (population 6,595), which is shared with Manatee County]. With the exception of the City of North Port, the above-mentioned entities have jurisdiction within the Sarasota Bay SWIM Plan area. Ninety-four special districts have been formed, of which 52 are operative arms of County government.
b. Manatee County
Manatee County has an estimated (1990) population of 21 1,700 and a surface area of 747 square miles. It is served by a Board of County Commissioners and contains the city of Bradenton (population 43,779) and several smaller towns and municipalities. At this time, the city of Bradenton-proper does not appear to be located within the immediate watershed of Sarasota Bay, although out-parcels located along the Palma Sola Causeway are within the watershed of Palma Sola Bay.
2. Sub-state Agencies
Three sub-state agencies exist that would be involved in the implementation of the SWIM plan. These are the West Coast Inland Navigation District, the Southwest Florida Regional Planning Council (for Sarasota County), the Tampa Bay Regional Planning Council (for Manatee County), and the Southwest Florida Water Management District.
The West Coast Inland Navigation District includes the intracoastal waterway of Sarasota and Manatee County. It is the local sponsor for the maintenance activities of the waterways, and has been the local sponsor for inlet and pass maintenance programs for navigation purposes.
The Southwest Florida Regional Planning Council is the Regional Planning Agency designated in Section 186.505 of the Florida Statutes. It performs the responsibilities described in that section and the Regional Planning Agency roles assigned in Section 380.05, F.S. (Resource Planning Committees, DRI reviews and Ch. 163, Local Plan Reviews), for Sarasota County and its municipalities.
The Tampa Bay Regional Planning Council performs these duties for Manatee County.
The Southwest Florida Water Management District is responsible for performing duties assigned under Ch. 373, F.S., as well as duties delegated through DEP for Chs. 253 and 403, F.S., and for local plan review (Ch. 163, F.S.). It performs those duties for an area that includes Sarasota County and Manatee County, as well as those cities contained within these two counties.
3. State Agencies
Many state agencies are involved in environmental regulation and resource management in the Sarasota Bay watershed and estuary. The Florida Department of Environmental Protection (FDEP) is the leading agency in the protection and management of Sarasota Bay. Other relevant entities include the Florida Department of Community Affairs, the Florida Fish and Wildlife Conservation Commission, the Marine Fisheries Commission, Florida Department of Agriculture and Consumer Services, Florida Department of Health, Florida Sea Grant Program, and the Florida Department of Transportation.
a. Department of Agriculture and Consumer Services
This department regulates the purchase and use of restricted pesticides and assists in resource management through the activities of the Soil and Water Conservation Districts and the Division of Forestry. The Division of Aquaculture's Shellfish Environmental Assessment Section (SEAS) program classifies and determines the opening and closure of shellfish harvesting areas.
b. Department of Community Affairs
This department is responsible for reviewing local comprehensive plans and has review authority over developments of regional impact (DRI's). DRI investigations are concerned with proposed developments, which have the potential to affect the health, safety, or welfare of citizens of more than one county.
The Comprehensive Plans of both Sarasota and Manatee counties have been reviewed by the DCA. All have come into compliance with the Local Comprehensive Planning Act, either through a final review action, a stipulation agreement, or a settlement agreement.
c. Department of Environmental Protection
The Department of Environmental Protection, itself a result of the merger of the old Department of Environmental Regulation and the Department of Natural Resources, is the lead state agency involved in water quality, pollution control, and resource recovery programs. The department sets state water quality standards and has permit jurisdiction over point and nonpoint source discharges, certain dredge and fill activities, drinking water systems, power plant siting, and many construction activities conducted within waters of the state. The Office of Water Policy, Bureau of Watershed Management, and Everglades Technical Support Section are key program areas involved in waterbody restoration, in conjunction with the U.S. EPA. These offices also interact closely with other federal and state agencies on water-related matters.
The department is the primary reviewer of SWIM plans and is responsible for the disbursement of monies from the SWIM Trust Fund to the water management districts.
The Department is also highly involved in the management of estuarine resources, primarily through the Office of Coastal and Aquatic Managed Areas.
The Division of State Lands, Division of Recreation and Parks, and Office of Coastal and Aquatic Managed Areas oversee the management of state lands, including sovereign submerged lands, state parks such as Oscar Scherer, and aquatic preserves such as Lemon Ba and Terra Ceia.
The Department's Florida Geological Survey office reviews oil and gas leasing requests involving nearshore and state waters. The Bureau of Beaches and Wetland Resources oversees the Environmental Resource Permitting Program and beach renourishment activities.
d. Florida Fish and Wildlife Conservation Commission
The purpose of the Commission is to manage, protect, and conserve wild animal life and freshwater and marine aquatic life. Its efforts within the SWIM plan area primarily involve freshwater and salt water sport and commercial fishing, fisheries and habitat management, fish stocking, fisheries research, wildlife monitoring, enforcement of fisherieslwildlife regulations, listed species protection, wildlife research, development review, and regional planning.
The Commission is directed to review SWIM plans to determine if the plan has adverse effects on wild animal life and fresh water aquatic life and their habitats.
The Florida Marine Research Institute (FMRI) conducts studies throughout Sarasota Bay with respect to habitat quality (e.g. marsh and seagrass habitats), habitat utilization and value with respect to important fisheries, and fish population dynamics and stock assessment. However, at present, the Juvenile Fish Monitoring Program does not include sample sites in Sarasota Bay.
e. Marine Fisheries Commission
The Marine Fisheries Commission manages marine fish species (excluding endangered or threatened species) by regulating their harvesting. The Commission's jurisdiction covers the following areas: a) gear specifications, b) prohibited gear, c) bag limits, d) size limits, e) species that may not be sold, f) protected species, g) closed areas, h) quality control codes, i) harvesting seasons, j) special considerations related to egg- bearing females, and k) oyster and clam relaying. The MFC is required to make annual recommendations to the Governor and Cabinet regarding marine fisheries research priorities.
f. Department of Health
The Department of Health is responsible for the permitting of septic systems and other on-site disposal systems (OSDS's) through its county health departments. It also coordinates mosquito control programs.
g. Department of Transportation
The Department of Transportation's Project Development and Environmental Offices in Bartow assist in the design, review, and permitting of road and right-of-way projects in the Sarasota Bay region, and would play an important role in the enhancement of circulation in northeaster Palma Sola Bay during the reconstruction of the Palma Sola Causeway.
h. Florida Sea Grant Program
The Florida Sea Grant Program is supported by awards from the Office of Sea Grant (National Oceanic and Atmospheric Administration) under provisions of the National Sea Grant College and Programs Act of 1966. The Florida Sea Grant Program has three major components: applied marine research, education, and advisory services (through local marine extension agents).
Florida Sea Grant provides scientific research and habitat-related information that is useful in the management of Sarasota Bay's natural resources.
4. Federal Agencies
Federal jurisdiction in Sarasota Bay involves the regulatory responsibilities of the US. Army Corps of Engineers, the U.S. Environmental Protection Agency, the U.S. Coast Guard, the U.S. Fish and Wildlife Service, and the U.S. Department of Interior. Their main regulatory functions include overseeing dredge and fill activities, maintaining navigability of the waters of the United States, overseeing cleanups following pollution spills, protecting endangered species, protecting overall environmental quality, and managing offshore activities. These agencies, in conjunction with the U.S. Geological
Survey and the National Oceanic and Atmospheric Administration, also contribute to the collection of technical data concerning Sarasota Bay and its watershed.
a. U.S. Environmental Protection Agency
The U.S. Environmental Protection Agency is the primary federal agency responsible for water quality protection. The agency oversees hazardous waste cleanups, protection of public drinking water systems, all point source pollutant discharges into waters of the United States (National Pollutant Discharge Elimination System permits), and the protection and restoration of surface and groundwater. The agency also reviews Corps of Engineers permit activities, sets minimum quality standards, and sets guidelines for state environmental programs. EPA also funds sewerage facilities studies through the SWFRPC and the TBRPC, and system improvements through the Florida Department of Environmental Protection.
The EPA's greatest presence in Sarasota Bay is through its National Estuary Program, established under Section 320 of the Clean Water Act. Sarasota Bay was selected for inclusion in the National Estuary Program in July 1988. The Sarasota Bay National Estuary Program (SBNEP) officially began with the signing of a five-year agreement among local, regional, state and federal agencies on June 26, 1989.
The SBNEP has produced three documents needed for the preservation and restoration of Sarasota Bay. These documents include: State of the Bay Report (SOB - 1990), Framework for Action (FFA - 1992), and the Comprehensive Conservation and Management Plan (CCMP - 1995). The SOB was designed to be a primer on general bay problems, as well as a blueprint for establishing the research and restoration goals for the SBNEP. Upon completion of the necessary technical projects, the principle investigators and SBNEP staff produced the FFA. The FFA included preliminary management options, identified by principal investigators, that were designed to improve the quality of Sarasota Bay. After reviewing the proposed management options through a series of more than 30 public workshops and committee hearings, a course of action was finalized for the restoration and preservation of Sarasota Bay. This document, the CCMP, is the final work product specified by the original five-year agreement. At present, the SBNEP is actively involved in the process of implementing the actions called for in the CCMP, as well as fostering relationships between various governmental bodies for facilitating restoration and protection projects.
b. U.S. Army Corps of Engineers
The U.S. Army Corps of Engineers is concerned with all activities which affect navigable waters of the United States, particularly those involving construction of structures and dredging and filling in navigable waters. The Corps is also involved in permitting the placement of dredge and fill material into navigable waters and adjacent wetlands, and in funding aquatic plant control in navigable and public waters.
c. U.S. Coast Guard
The U.S. Coast Guard is the primary federal agency entrusted with marine law enforcement. The Guard's mission also includes hazardous materials cleanups, search and rescue, buoy replacement, vessel safety inspection, and right-of-way clearance on navigable waterways.
d. U.S. Department of Commerce
Within the department, the National Oceanic and Atmospheric Administration, which includes the National Weather Service and the National Hurricane Center, is a scientific and data collection agency which assimilates oceanographic and meteorological information in the form of maps, charts, interpretive reports, and other documents. The National Marine Fisheries Service administers NOAA's program to manage living marine resources for commercial and recreational use. It supports fisheries management operations, international fisheries affairs, fishery development, trade, and industry assistance activities, habitat conservation activities, and scientific and technical aspects of NOAA's marine fisheries resources programs.
f. U.S. Department of Interior
The primary water-related functions performed by this agency involve the review of proposed activities which may impact threatened or endangered species, review of U.S. Army Corps of Engineers permits for potential effects on fish and wildlife, and management of all federally-owned public lands. Within the department, the U.S. Geological Survey conducts investigations concerning hydrology, hydrogeology, water use, and ground and surface water quality. The U.S. Fish and Wildlife Service manages and restores fish and wildlife populations and conducts research on the effects of pollution on those resources. The National Park Service maintains federal parks and sanctuaries, regulating multiple uses on these lands to achieve a balance of benefits for both man and wildlife. The department also oversees those requests and offshore activities associated with exploration and development on the outer continental shelf.
APPENDIX E - POINT AND NON-POINT (NPDES) DISCHARGES WITHIN THE SARASOTA BAY BASIN
The attached spreadsheet is a list of FDEP-permitted point and non-point (NPDES) discharges within the watershed of Sarasota Bay. This list was compiled by staff of FDEP's Southwest District Office in Tampa, and special thanks are given to Mr. Charles Kovach, for coordinating this assessment.
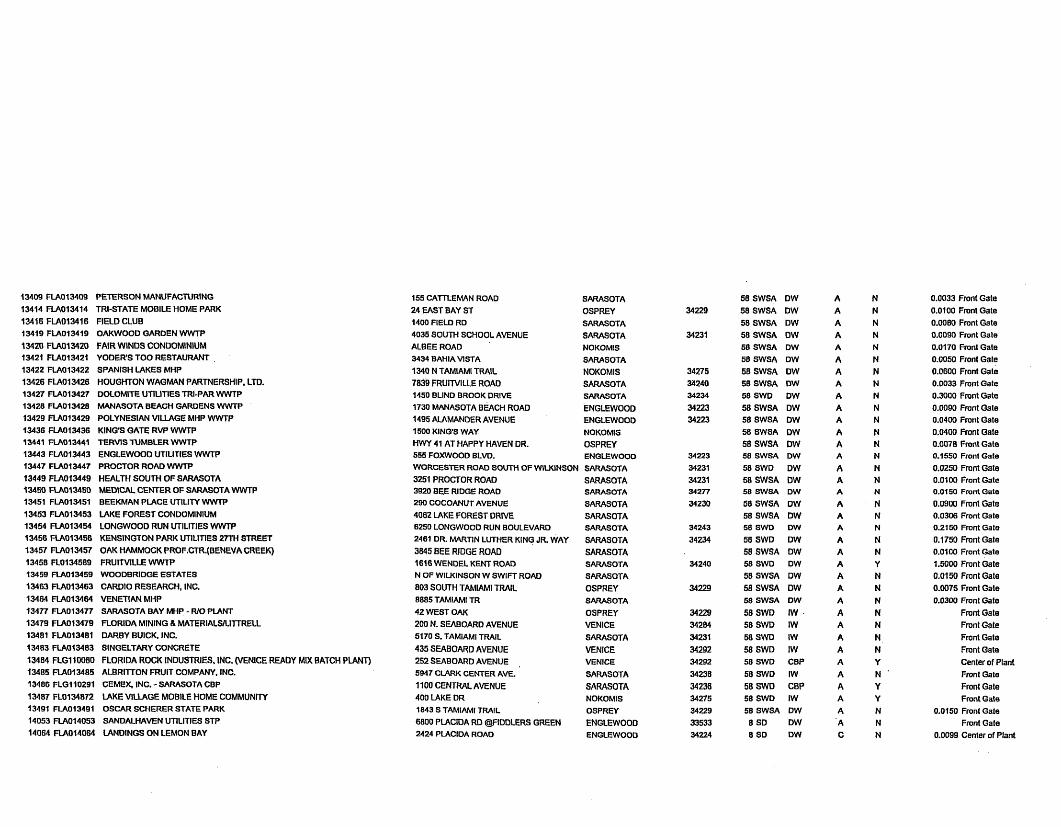
13409 FLA013409 PETERSON MANUFACTURING 13414 FLA013414 TRI-STATE MOBILE HOME PARK 13416 FLA013416 FIELD CLUB 13419 FLA013419 OAKWOOD GARDEN WWTP
13420 FLA013420 FAIR WINDS CONDOMINIUM 13421 FLA013421 YODER'S TOO RESTAURANT 13422 FLA013422 SPANISH LAKES MHP 13426 FLA013426 HOUGHTON WAGMAN PARTNERSHIP. LTD. 13427 FLA013427 DOLOMITE UTILITIES TRI-PAR WWTP 13428 FLA013428 MANASOTA BEACH GARDENS WWTP
13429 FLA013429 POLYNESIAN VILLAGE MHP WWTP 13436 FLA013436 KING'S GATE RVP WWTP 13441 FUW13441 TERVIS TUMBLER WWTP
13443 FLA013443 ENGLEWOOO UTILITIES WWTP 13447 FLA013447 PROCTOR ROAD WWTP
13449 FLA013449 HEALTH SOUTH OF SARASOTA 13450 FLA013450 MEDICAL CENTER OF SARASOTA WWTP 13451 FLA013451 BEEKMAN PLACE UTILITY WWTP
13453 FLA013453 LAKE FOREST CONDOMINIUM 13454 FLA013454 LONGWOOD RUN UTILITIES WWTP 13456 FLA013456 KENSINGTON PARK UTILITIES 27TH STREET 13457 FLA013457 OAK HAMMOCK PROF.CTR.(BENEVA CREEK) 13458 FL0134589 FRUITVILLE WWTP 13459 FLA013459 WOODBRIDGE ESTATES 13463 FlA013463 CARD10 RESEARCH, INC. 13464 M013464 VENETIAN MHP 13477 FLA013477 SARASOTA BAY MHP - R/0 PLANT
13479 FIA013479 FLORIDA MINING & MATERIALS/LITTRELL 13481 FLA013481 DARBY BUICK. INC. 13483 FLA013483 SINGELTARY CONCRETE 13484 FLG110080 FLORIDA ROCK INDUSTRIES. INC. (VENICE READY MIX BATCH PLANT) 13485 FLA013485 ALBRITTON FRUIT COMPANY, INC. 13486 FLG110291 CEMEX, INC. - SARASOTA CBP
13487 FL0134872 LAKE VILLAGE MOBILE HOME COMMUNITY 13491 FLA013491 OSCAR SCHERER STATE PARK 14053 FLA014053 SANDALHAVEN UTILITIES STP 14064 FLA014064 LANDINGS ON LEMON BAY
155 CATTLEMAN ROAD 24 EAST BAY ST 1400 FIELD RD 4035 SOUTH SCHOOL AVENUE ALBEE ROAD 3434 BAHIA VISTA 1340 N TAMIAMI TRAIL 7839 FRUITVILLE ROAD 1450 BLIND BROOK DRIVE 1730 MANASOTA BEACH ROAD 1495 ALAMANDER AVENUE 1500 KING'S WAY HWY 41 AT HAPPY HAVEN DR. 555 FOXWOOD BLVD. WORCESTER ROAD SOUTH OF
SARASOTA OSPREY SARASOTA SARASOTA NOKOMIS SARASOTA NOKOMIS SARASOTA SARASOTA ENGLEWOOD ENGLEWOOD NOKOMIS OSPREY ENGLEWOOD
W1LKlNSON SARASOTA 3251 PROCTOR ROAD 3920 BEE RIDGE ROAD 290 COCOANUT AVENUE
4062 LAKE FOREST DRIVE 6250 LONGWOOD RUN BOULEVARD 2461 DR. MARTIN LUTHER KING JR. WAY
3845 BEE RIDGE ROAD 1616 WENDEL KENT ROAD N OF WILKINSON W SWIFT ROAD 803 SOUTH TAMIAMI TRAIL 8885 TAMIAMI TR
42 WEST OAK 200 N. SEABOARD AVENUE 5170 S. TAMIAMI TRAIL
435 SEABOARD AVENUE 252 SEABOARD AVENUE . 5947 CLARK CENTER AVE.
1100 CENTUM. AVENUE 400 LAKE DR 1843 S TAMIAMI TRAIL 6800 PLACIDA RD @FIDDLERS GREEN 2424 PLACIDA ROAD
SARASOTA SARASOTA SARASOTA SARASOTA SARASOTA SARASOTA SARASOTA SARASOTA SARASOTA OSPREY SARASOTA OSPREY VENICE
SARASOTA VENICE VENICE
SARASOTA SARASOTA NOKOMIS OSPREY ENGLEWOOD ENGLEWOOD
58 SWSA DW 58 SWSA DW 58 SWSA DW 58 SWSA DW 58 SWSA DW
58 SWSA DW 58 SWSA DW 58 SWSA DW 58SWD DW 58SWSA DW 58 SWSA DW 58 SWSA DW 58 SWSA DW 58 SWSA DW
58 SWD DW 58 SWSA DW 58 SWSA DW
58 SWSA DW 58 SWSA DW 58 SWD DW
58SWD DW 58 SWSA DW 58 SWD DW 58 SWSA DW 58 SWSA DW 58 SWSA OW
58 SWD IW .
58 SWD 1W 58 SWD IW 58 SWD 1W 58 SWD CBP 58 SWD IW 58 SWD CBP 58 SWD IW 58 SWSA DW 8SD DW BSD DW
0.0033 Front Gate 0.0100 Front Gate 0.0080 Front Gate 0.0090 Front Gate 0.0170 Front Gate 0.0050 Front Gale 0.0600 Front Gate 0.0033 Front Gate 0.3000 Front Gate
0.0090 Front Gate 0.0400 Front Gate 0.0400 Front Gate 0.0078 Front Gate 0.1550 Front Gate
0.0250 Front Gale 0.0100 Front Gate 0.0150 Front Gate
0.0900 Front Gate 0.0306 Front Gate 0.2150 Front Gate 0.1750 Front Gate 0.0100 Front Gate 1.5000 Front Gate 0.0150 Front Gate 0.0075 Front Gate 0.0300 Front Gate
Front Gate Front Gate Front Gate Front Gate Center of Plant Front Gate Front Gate Front Gate
0.0150 Front Gate Front Gale
0.0099 Center of Plant
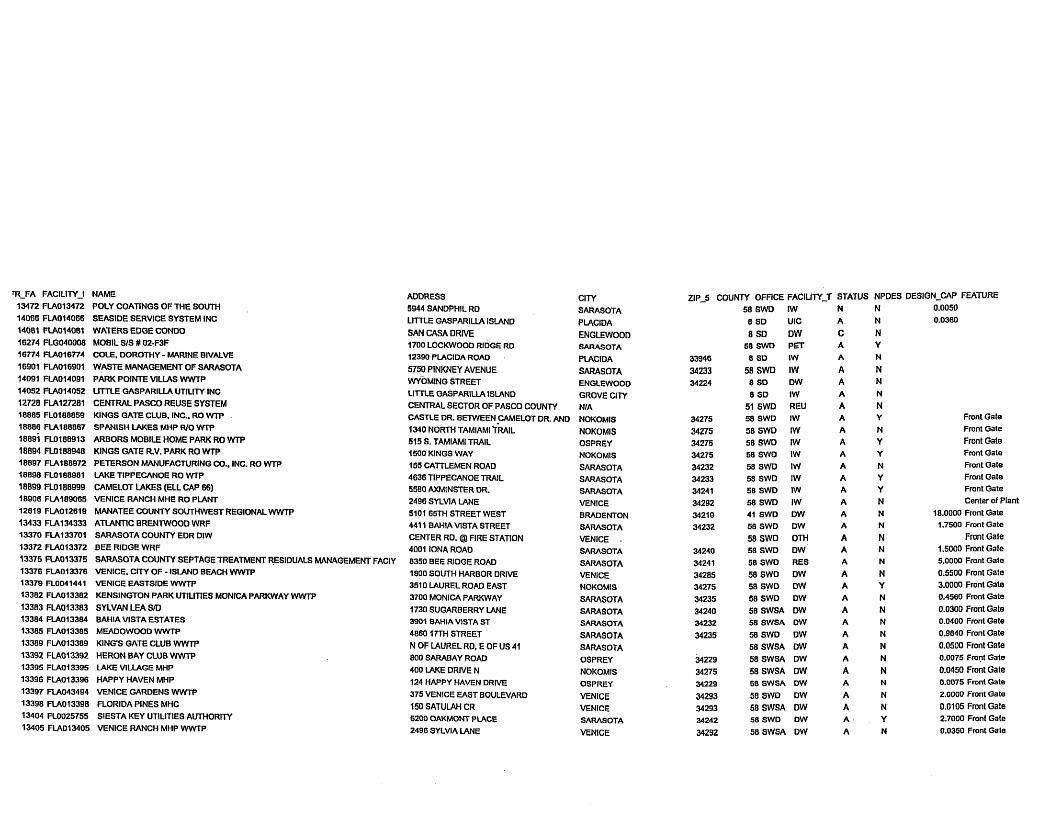
R̂JA FACILITY-I 13472 FLA013472
14066 FLA014066
14081 PLA014081
16274 FLG040008 16774 FLA016774
16901 FLA016901 14091 FLA014091
14052 FLA014052
12728 FLAl27281 18885 FL0188859 18886 FIA188867
18891 FL0188913 18894 FL0188948 18897 FIAl88972 18898 FL0188981
18899 FLOl88999 18906 FLA189065
12619 FLA012619
13433 FLA134333 13370 FLA133701
13372 FLA013372
13375 FLA013375 13376 FLA013376 13379 FL0041441 13382 FLA013382
13383 FLA013383 13384 FLA013384 13385 FLA013385
13389 FLA013389
NAME
POLY COATINGS OF THE SOUTH
SEASIDE SERVICE SYSTEM INC
WATERS EDGE CON DO MOBIL S/S # 02-F3F COLE. DOROTHY - MARINE BIVALVE
WASTE MANAGEMENT OF SARASOTA
PARK POINTE VILLAS WWTP LITTLE GASPARILLA UTILITY INC
CENTRAL PASCO REUSE SYSTEM KINGS GATE CLUB. INC.. RO WTP .
SPANISH LAKES MHP R/0 WTP
ARBORS MOBILE HOME PARK RO WTP KINGS GATE R.V. PARK RO WTP PETERSON MANUFACTURING CO.. INC. RO WTP LAKE TIPPECANOE RO WTP CAMELOT LAKES (ELL CAP 66) VENICE RANCH MHE RO PLANT
MANATEE COUNTY SOUTHWEST REGIONAL WWTP ATLANTIC BRENTWOOD WRF SARASOTA COUNTY EDR D1W
BEE RIDGE WRF SARASOTA COUNTY SEPTAGE TREATMENT RESIDUALS MANAGEMENT FACIY
VENICE. CITY OF - ISLAND BEACH WWTP VENICE EASTSIDE WWTP KENSINGTON PARK UTILITIES MONICA PARKWAY WWTP
SYLVAN LEA S/D BAHIA VISTA ESTATES MEADOWOOD WWTP
KING'S GATE CLUB WWTP 13392 FLA013392 HERON BAY CLUB WWTP 13395 FLAO-13395 LAKE VILLAGE MHP
13396 FLA013396 HAPPY HAVEN MHP
13397 FLA043494 VENICE GARDENS WWTP 13398 FLA013398 FLORIDA PINES MHC
13404 FL0025755 SIESTA KEY UTILITIES AUTHORITY 13405 FLA013405 VENICE RANCH MHP WWTP
ADDRESS 5944 SANDPHIL RD
LITTLE GASPARILLA ISLAND
SAN CASA DRIVE 1700 LOCKWOOD RIDGE RD 12390 PLACIDA ROAD
5750 PINKNEY AVENUE WYOMING STREET
LITTLE GASPARILIA ISLAND CENTRAL SECTOR OF PASCO COUNTY CASTLE DR. BETWEEN-CAMELOT DR. AND
1340 NORTH TAMIAMI TRAIL 515 S. TAMIAMI TRAIL 1500 KINGS WAY
155 CATTLEMEN ROAD 4636 TIPPECANOE TRAIL 5580 AXMINSTER DR. 2496 SYLVIA LANE
5101 65TH STREET WEST 441 1 BAHIA VISTA STREET
CENTER RD. @ FIRE STATION 4001 10NA ROAD 8350 BEE RIDGE ROAD 1800 SOUTH HARBOR DRIVE 351 0 LAUREL ROAD EAST 3700 MONICA PARKWAY
1730 SUGARBERRY LANE
CITY
SARASOTA
PLACIDA ENGLEWOOD SARASOTA
PLACIDA
SARASOTA ENGLEWOOD
GROVE CITY NIA NOKOMIS
NOKOMIS OSPREY
NOKOMIS
SARASOTA SARASOTA SARASOTA VENICE BRADENTON SARASOTA VENICE . SARASOTA
SARASOTA VENICE NOKOMIS
SARASOTA SARASOTA
Z IP5 COUNTY OFFICE FACILITYT STATUS NPDES DESIGN-MP FEATURE 58 SWD IW N N 0.0050
8 SD UIC A N 0.0360
8SD DW C N 58 SWD PET A Y
33946 8 SO IW A N
34233 58SWD 1W A N 34224 8 SD DW A N
8 SD IW A N 51 SWD REU A N
34275 58 SWD IW A Y
34275 58 SWD IW A N 34275 58 SWD IW A Y 34275 58 SWD iW A Y
34232 58SWD IW A N 34233 58 SWD IW A Y 34241 58 SWD W A Y
34292 58 SWD IW A N 34210 41 SWD DW A N 34232 58 SWD DW A N
58 SWD O m A N 34240 58 SWD DW A N
34241 58 SWD RES A N
34285 58SWD DW A N 34275 58 SWD DW A Y 34235 58 SWD DW A N 34240 58 SWSA DW A N ...
3901 BAHIA VISTA ST SARASOTA 34232 58 SWSA D w A N
4860 17TH STREET
N OF LAUREL RD, E OF US 41 800 SARABAY ROAD
400 LAKE DRIVE N
124 HAPPY HAVEN DRIVE
375 VENICE EAST BOULEVARD
150 SATULAH CR 5200 OAKMOW PLACE
2496 SYLVIA LANE
- . . - . - - . . . SARASOTA SARASOTA
OSPREY NOKOMIS
OSPREY
VENICE VENICE
SARASOTA
VENICE
58SWD DW
58 SWSA DW
58 SWSA DW 58 SWSA DW 58 SWSA D w
58SWD DW SflSWSA DW 58SWD DW
58 SWSA DW
Front Gate Front Gate
Front Gate Front Gale
Front Gate Front Gate Front Gate Center of Plant
18.0000 Front Gate 1.7500 Front Gate
Front Gale 1.5000 Front Gate 5.0000 Front Gate
0.5500 Front Gate 3.0000 Front Gate 0.4560 Front Gate
0.0300 Front Gate
0.0400 Front Gate 0.9840 Front Gate
0.0500 Front Gate 0.0075 Front Gate
0.0450 Front Gate 0.0075 Front Gate 2.0000 Front Gate
0.0105 Front Gate 2.7000 Front Gate 0.0350 Front Gate
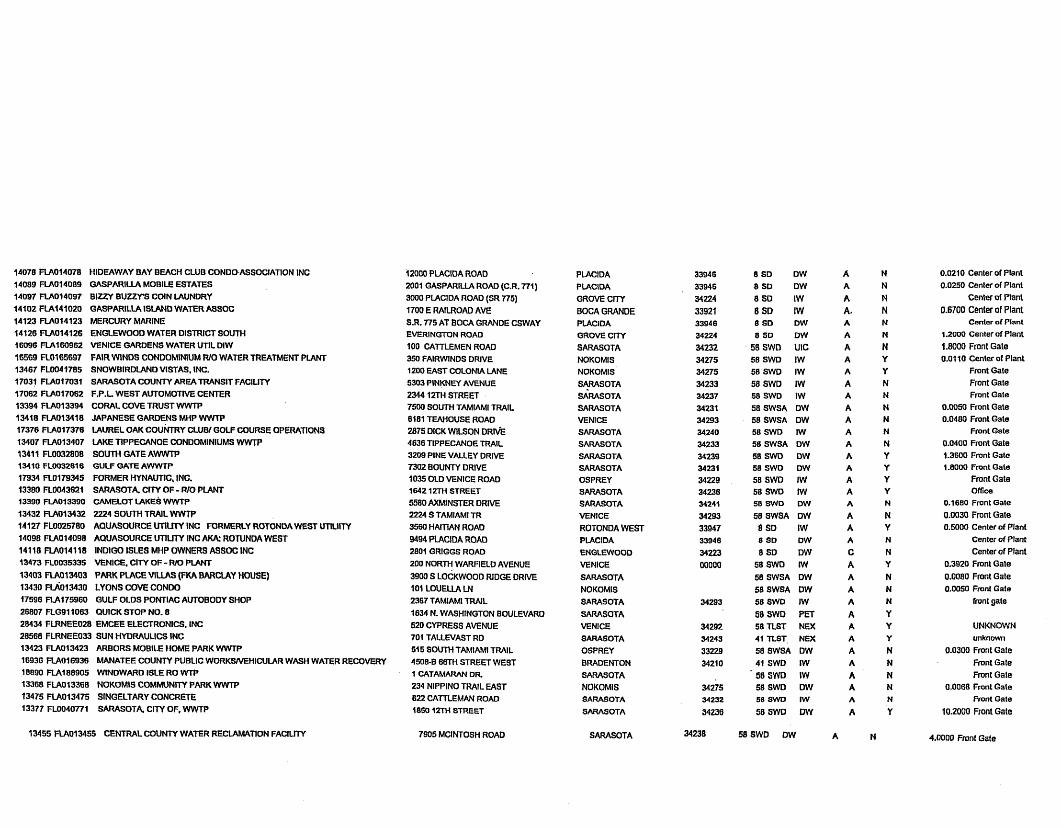
14078 FLA014078 HIDEAWAY BAY BEACH CLUB CONDOASSOCIATION INC 14089 FLA014089 GASPARILLA MOBILE ESTATES 14097 FLA014097 BIZZY BUZZrS COIN LAUNDRY 14102 FLA141020 GASPARILLA ISLAND WATER ASSOC 14123 FLA014123 MERCURY MARINE 14126 PLA014126 ENGLEWOOD WATER DISTRICT SOUTH 16096 M I 6 0 9 6 2 VENICE GARDENS WATER UTIL DIW 16569 FL0165697 FAIR WINDS CONDOMINIUM W 0 WATER TREATMENT PLANT 13467 FL0041785 SNOWBIRDLANO VISTAS. INC. 17031 FLA017031 SARASOTA COUNTY AREA TRANSIT FACILITY 17062 FLA017062 F.P.L WEST AUTOMOTIVE CENTER 13394 FLA013394 CORAL COVE TRUST WWTP 13418 FLA013418 JAPANESE GARDENS MHP WWTP 17376 FLA017376 LAUREL OAK COUNTRY CLUB/ GOLF COURSE OPERATIONS 13407 FLA013407 LAKE TIPPECANOE CONDOMINIUMS WWTP 1341 1 FL0032808 SOUTH GATE AWWTP 13410 FL0032816 GULF GATE AWWTP 17934 FL0179345 FORMER HYNAUTIC, INC. 13380 FL0043621 SARASOTA. CITY OF - R/0 PLANT 13390 FLA013390 CAMELOT LAKES WWTP
13432 M013432 2224 SOUTH TRAIL WWTP 14127 FL0025780 AQUASOURCE UTILITY ING FORMERLY ROTONDA WEST UTILIITY 14098 FLA014098 AQUASOURCE UTILITY 1NC AKA: ROTUNDA WEST 14118 FLA014118 INDIGO ISLES MHP OWNERS ASSOC INC 13473 FL0035335 VENICE. CITY OF - WO PLANT
13403 FIA013403 PARK PLACE VILLAS (FKA BARCLAY HOUSE) 13430 ~M013430 LYONS COVE CONDO 17596 M I 7 5 9 6 0 GULF OLDS PONTIAC AUTOBODY SHOP 26807 PLG911063 QUICK STOP NO. 8
28434 FIRNEE028 EMCEE ELECTRONICS. INC 28568 FLRNEE033 SUN HYDRAULICS INC 13423 FLA013423 ARBORS MOBILE HOME PARK WWTP 16936 M016936 MANATEE COUNTY PUBLIC WORKWVEHICULAR WASH WATER RECOVERY 18890 FlA188905 WINDWARD ISLE RO WTP
13368 FLA013368 NOKOMIS COMMUNKY PARK WWTP 13475 PLA013475 SINGELTARY CONCRETE 13377 FL0040771 SARASOTA, CITY OF. WWTP
13455 FLA013455 CENTRAL COUNTY WATER RECLAMATION FACILITY
12000 PLACIDA ROAD 2001 GASPARILLA ROAD (C.R. 771) 3000 PLACIDA ROAD (SR 775)
1700 E RAILROAD AVE S.R. 775 AT BOCA GRANDE CSWAY EVERINGTON ROAD 100 CATTLEMEN ROAD 350 FAIRWINDS DRIVE 1200 EAST COLONIA LANE 5303 PINKNEY AVENUE 2344 12TH STREET 7500 SOUTH TAMIAMI TRAIL 6181 TEAHOUSE ROAD 2875 DICK WILSON DRIVE 4636 TIPPECANOE TRAIL 3209 PINE VALLEY DRIVE 7302 BOUNTY DRIVE 1035 OLD VENICE ROAD 1642 12TH STREET
5580 AXMINSTER DRIVE 2224 S TAMIAMI TR
3560 HAITIAN ROAD 9494 PLACIDA ROAD 2801 GRIGGS ROAD 200 NORTH WARFIELD AVENUE
3900 S LOCKWOOD RIDGE DRIVE 101 LOUELLA LN 2367 TAMIAMI TRAIL
1634 N. WASHINGTON BOULEVARD 520 CYPRESS AVENUE 701 TALLEVAST RD 51 5 SOUTH TAMIAMI TRAIL 4508-0 66TH STREET WEST 1 CATAMARAN DR.
234 NIPPINO TRAIL EAST 622 CATTLEMAN ROAD 1850 12TH STREET
7905 MCINTOSH ROAD
PLACIDA PLACIDA GROVE CITY BOCAGRANDE PLACIDA GROVE CllY
SARASOTA NOKOMIS NOKOMIS S F S O T A SARASOTA SARASOTA VENICE SARASOTA SARASOTA SARASOTA SARASOTA OSPREY SARASOTA SARASOTA VENICE
ROTONDA WEST PLACIDA ENGLEWOOD VENICE SARASOTA NOKOMIS SARASOTA SARASOTA VENICE SARASOTA OSPREY BRADENTON SARASOTA NOKOMIS SARASOTA
SARASOTA
SARASOTA
BSD DW B S D DW 8 SO IW BSD IW 8SD DW
8 S D DW 58 SWD UIC 58SWD 1W 58 SWD IW 58SWD IW 58SWD 1W 58 SWSA DW 58 SWSA DW 58 SWD IW 58 SWSA DW 58SWD DW 58 SWD DW 58SWD IW 58SWD IW 58 SWD DW
58 SWSA DW a so iw 8SD DW 8SD DW
58SWO WU 58 SWSA DW 56 SWSA DW 58 SWD IW
58 SWD PET 58 TLST NEX 41 TLST NEX 58 SWSA DW 41 SWD IW 58 SWD IW 58SWD DW 58 SWO IW
5 8 W O DW
58 SWD DW
0.0210 Center of Plant 0.0250 Center of Plant
Center of Plant
0.6700 Center of Plant Center of Plant
1.2000 Center of Plant
1.8000 Front Gate 0.01 10 Center of Plant
Front Gate Front Gate Front Gale
0.0050 Front Gale 0.0480 Front Gate
Front Gate
0.0400 Front Gate 1.3600 Front Gate 1.8000 Front Gate
Front Gate Office
0.1680 Front Gate
0.0030 Front Gate 0.5000 Center of Plant
Center of Plant Center of Plant
0.3920 Front Gate
0.0080 Front Gale 0.0050 Front Gate
front gate
UNKNOWN unknown
0.0300 Front Gate Front Gate Front Gale
0.0068 Front Gale Front Gate
10.2000 Front Gate
4.0000 Front Gale