Embed Size (px)
Citation preview
Texas State University
INTERNATIONAL STUDENT STATISTICAL REPORT
FALL 2002
Prepared by the International Office
Academic Affairs
TABLE OF CONTENTS
I. Fall 2002 Summary………………………...……………………………… 3
II. Student Comparisons at SWT…………………………………………… 4
Percentage of International Students Percentage of International Students by Visa Status Percentage Breakdown of Undergraduate Students Percentage Breakdown of Graduate Students Comparison of Average GPA
III. Statistics by Nationality...……….…….……………………………………7
IV. Geographical Statistics…………………………………………………….9
V. Statistics Based on College/Program…...…...………………………....12
VI. Number of International Students Based on
Academic Classification………………………………..…………………13
VII. Gender Statistics ………………….……………...…. .……………...…. 14
VIII. Residence Statistics……………………………………………………….15
IX. International Student Trends 1997 – 2002…….………………………..16
Who is an International Student?
An international student is a student who enrolls in a U.S. academic program and whose status is non-immigrant. Common non-immigrant statuses are A-1, A-2, B1, B-2, E-1, E-2, F-1, F-2, H-1, H-4, J-1, J-2, L-1, L-2, M-1, R-1 and R-2. F-1 is the most common status used by international students. A student who has applied for or received permanent residency, refugee status or asylum in the U.S. is not considered to be an international student by the Immigration and Naturalization Service. Robert M. Seese, Ed. D. Director, International Office Texas State University Report compiled by Naveen Kumar Arra Graduate Instructional Assistant
2
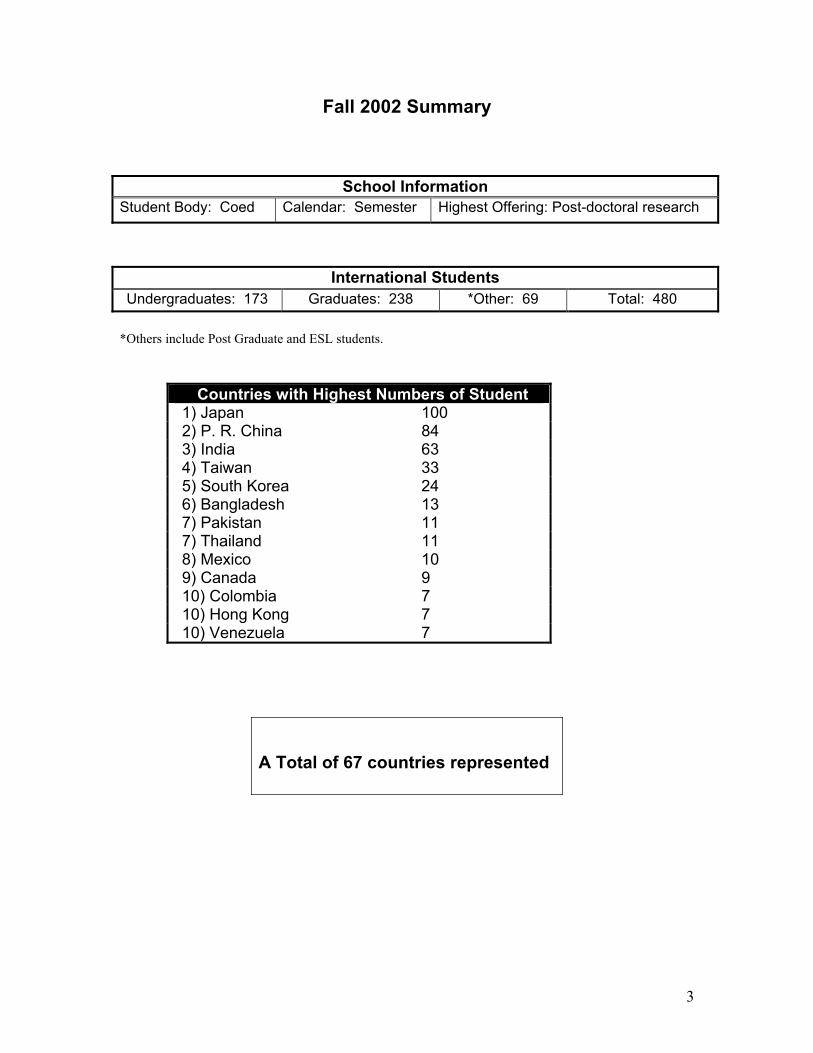
Fall 2002 Summary
School Information Student Body: Coed Calendar: Semester Highest Offering: Post-doctoral research
International Students Undergraduates: 173 Graduates: 238 *Other: 69 Total: 480
*Others include Post Graduate and ESL students.
Countries with Highest Numbers of Student 1) Japan 100 2) P. R. China 84 3) India 63 4) Taiwan 33 5) South Korea 24 6) Bangladesh 13 7) Pakistan 11 7) Thailand 11 8) Mexico 10 9) Canada 9 10) Colombia 7 10) Hong Kong 7 10) Venezuela 7
A Total of 67 countries represented
3
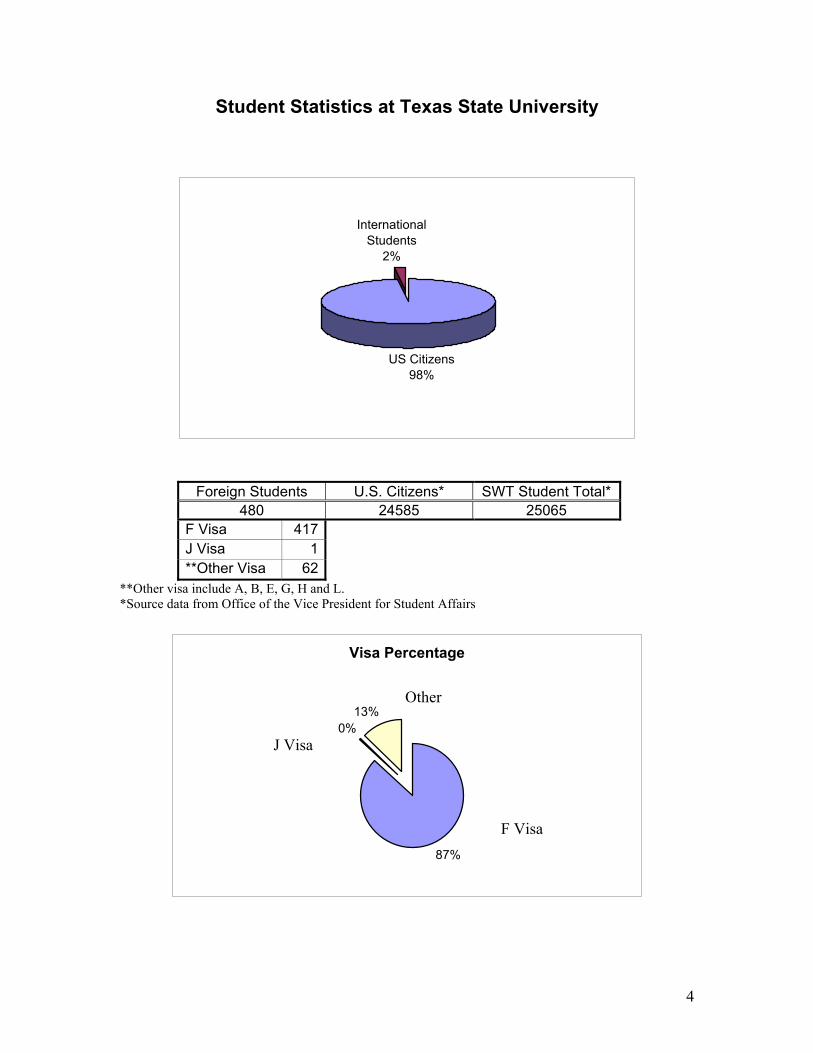
Student Statistics at Texas State University
US Citizens98%
International Students
2%
Foreign Students U.S. Citizens* SWT Student Total*
480 24585 25065 F Visa 417 J Visa 1 **Other Visa 62
**Other visa include A, B, E, G, H and L. *Source data from Office of the Vice President for Student Affairs
Visa Percentage
87%
0%13%
Other
J Visa
F Visa
4
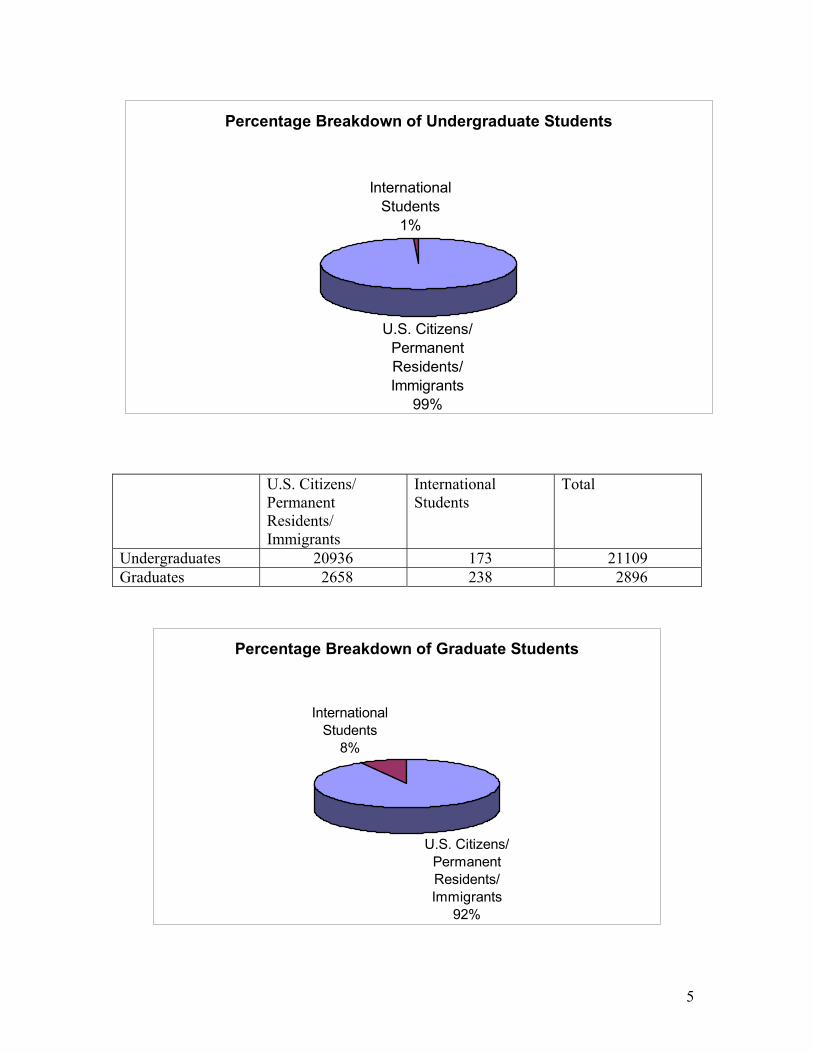
Percentage Breakdown of Undergraduate Students
International Students
1%
U.S. Citizens/ Permanent Residents/ Immigrants
99%
U.S. Citizens/
Permanent Residents/ Immigrants
International Students
Total
Undergraduates 20936 173 21109 Graduates 2658 238 2896
Percentage Breakdown of Graduate Students
International Students
8%
U.S. Citizens/ Permanent Residents/ Immigrants
92%
5
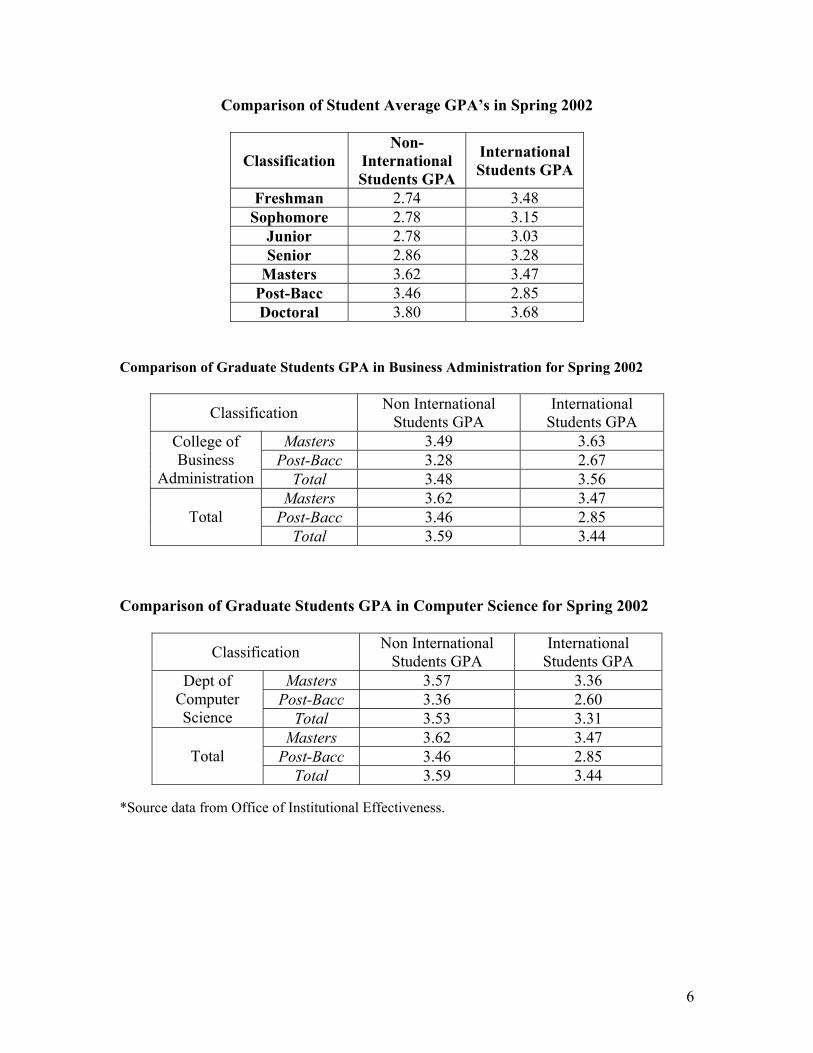
Comparison of Student Average GPA’s in Spring 2002
Classification Non-
International Students GPA
International Students GPA
Freshman 2.74 3.48 Sophomore 2.78 3.15
Junior 2.78 3.03 Senior 2.86 3.28
Masters 3.62 3.47 Post-Bacc 3.46 2.85 Doctoral 3.80 3.68
Comparison of Graduate Students GPA in Business Administration for Spring 2002
Classification Non International Students GPA
International Students GPA
Masters 3.49 3.63 Post-Bacc 3.28 2.67
College of Business
Administration Total 3.48 3.56 Masters 3.62 3.47
Post-Bacc 3.46 2.85 Total Total 3.59 3.44
Comparison of Graduate Students GPA in Computer Science for Spring 2002
Classification Non International Students GPA
International Students GPA
Masters 3.57 3.36 Post-Bacc 3.36 2.60
Dept of Computer Science Total 3.53 3.31
Masters 3.62 3.47 Post-Bacc 3.46 2.85 Total
Total 3.59 3.44 *Source data from Office of Institutional Effectiveness.
6
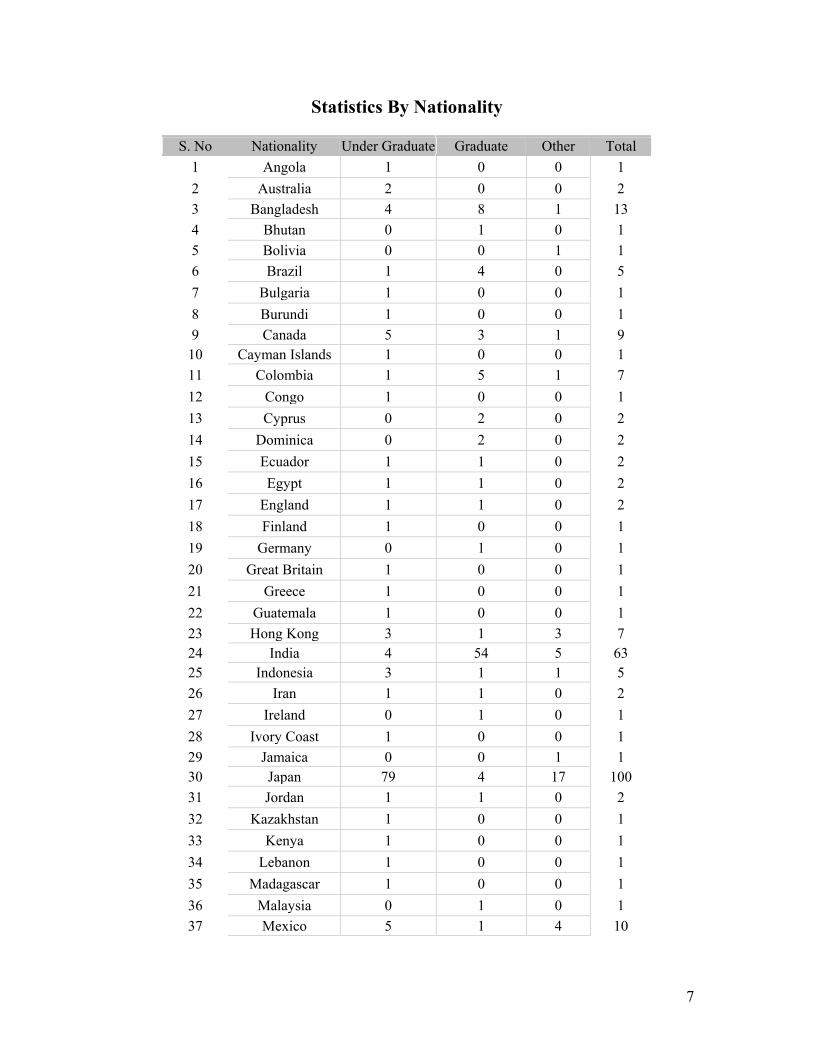
Statistics By Nationality
S. No Nationality Under Graduate Graduate Other Total 1 Angola 1 0 0 1 2 Australia 2 0 0 2 3 Bangladesh 4 8 1 13 4 Bhutan 0 1 0 1 5 Bolivia 0 0 1 1 6 Brazil 1 4 0 5 7 Bulgaria 1 0 0 1 8 Burundi 1 0 0 1 9 Canada 5 3 1 9
10 Cayman Islands 1 0 0 1 11 Colombia 1 5 1 7 12 Congo 1 0 0 1 13 Cyprus 0 2 0 2 14 Dominica 0 2 0 2 15 Ecuador 1 1 0 2 16 Egypt 1 1 0 2 17 England 1 1 0 2 18 Finland 1 0 0 1 19 Germany 0 1 0 1 20 Great Britain 1 0 0 1 21 Greece 1 0 0 1 22 Guatemala 1 0 0 1 23 Hong Kong 3 1 3 7 24 India 4 54 5 63 25 Indonesia 3 1 1 5 26 Iran 1 1 0 2 27 Ireland 0 1 0 1 28 Ivory Coast 1 0 0 1 29 Jamaica 0 0 1 1 30 Japan 79 4 17 100 31 Jordan 1 1 0 2 32 Kazakhstan 1 0 0 1 33 Kenya 1 0 0 1 34 Lebanon 1 0 0 1 35 Madagascar 1 0 0 1 36 Malaysia 0 1 0 1 37 Mexico 5 1 4 10
7
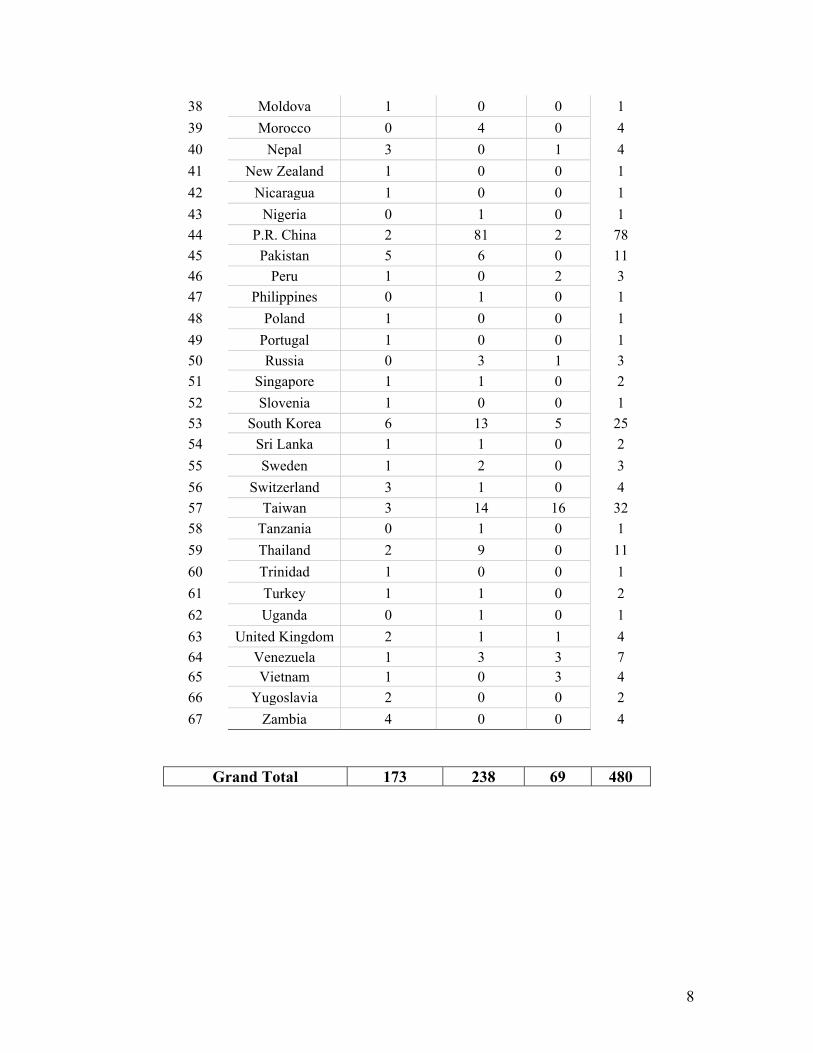
38 Moldova 1 0 0 1 39 Morocco 0 4 0 4 40 Nepal 3 0 1 4 41 New Zealand 1 0 0 1 42 Nicaragua 1 0 0 1 43 Nigeria 0 1 0 1 44 P.R. China 2 81 2 78 45 Pakistan 5 6 0 11 46 Peru 1 0 2 3 47 Philippines 0 1 0 1 48 Poland 1 0 0 1 49 Portugal 1 0 0 1 50 Russia 0 3 1 3 51 Singapore 1 1 0 2 52 Slovenia 1 0 0 1 53 South Korea 6 13 5 25 54 Sri Lanka 1 1 0 2 55 Sweden 1 2 0 3 56 Switzerland 3 1 0 4 57 Taiwan 3 14 16 32 58 Tanzania 0 1 0 1 59 Thailand 2 9 0 11 60 Trinidad 1 0 0 1 61 Turkey 1 1 0 2 62 Uganda 0 1 0 1 63 United Kingdom 2 1 1 4 64 Venezuela 1 3 3 7 65 Vietnam 1 0 3 4 66 Yugoslavia 2 0 0 2 67 Zambia 4 0 0 4
Grand Total 173 238 69 480
8
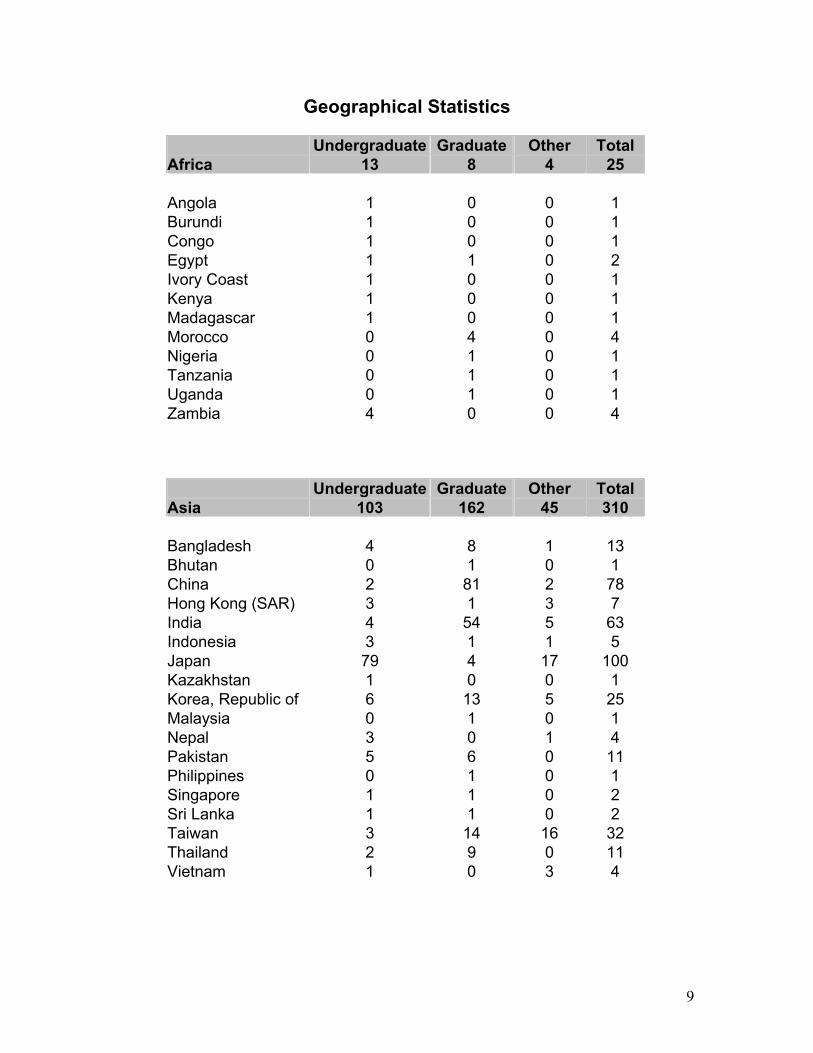
Geographical Statistics
Undergraduate Graduate Other Total Africa 13 8 4 25 Angola 1 0 0 1 Burundi 1 0 0 1 Congo 1 0 0 1 Egypt 1 1 0 2 Ivory Coast 1 0 0 1 Kenya 1 0 0 1 Madagascar 1 0 0 1 Morocco 0 4 0 4 Nigeria 0 1 0 1 Tanzania 0 1 0 1 Uganda 0 1 0 1 Zambia 4 0 0 4 Undergraduate Graduate Other Total Asia 103 162 45 310 Bangladesh 4 8 1 13 Bhutan 0 1 0 1 China 2 81 2 78 Hong Kong (SAR) 3 1 3 7 India 4 54 5 63 Indonesia 3 1 1 5 Japan 79 4 17 100 Kazakhstan 1 0 0 1 Korea, Republic of 6 13 5 25 Malaysia 0 1 0 1 Nepal 3 0 1 4 Pakistan 5 6 0 11 Philippines 0 1 0 1 Singapore 1 1 0 2 Sri Lanka 1 1 0 2 Taiwan 3 14 16 32 Thailand 2 9 0 11 Vietnam 1 0 3 4
9
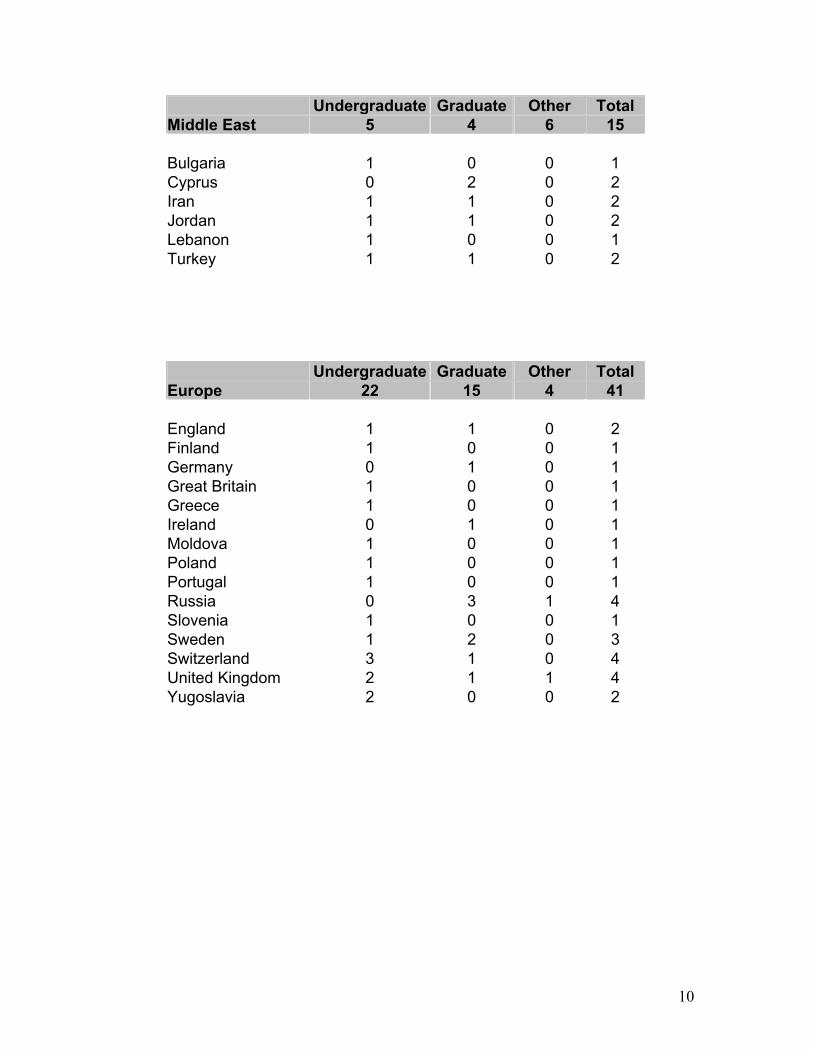
Undergraduate Graduate Other Total Middle East 5 4 6 15 Bulgaria 1 0 0 1 Cyprus 0 2 0 2 Iran 1 1 0 2 Jordan 1 1 0 2 Lebanon 1 0 0 1 Turkey 1 1 0 2 Undergraduate Graduate Other Total Europe 22 15 4 41 England 1 1 0 2 Finland 1 0 0 1 Germany 0 1 0 1 Great Britain 1 0 0 1 Greece 1 0 0 1 Ireland 0 1 0 1 Moldova 1 0 0 1 Poland 1 0 0 1 Portugal 1 0 0 1 Russia 0 3 1 4 Slovenia 1 0 0 1 Sweden 1 2 0 3 Switzerland 3 1 0 4 United Kingdom 2 1 1 4 Yugoslavia 2 0 0 2
10
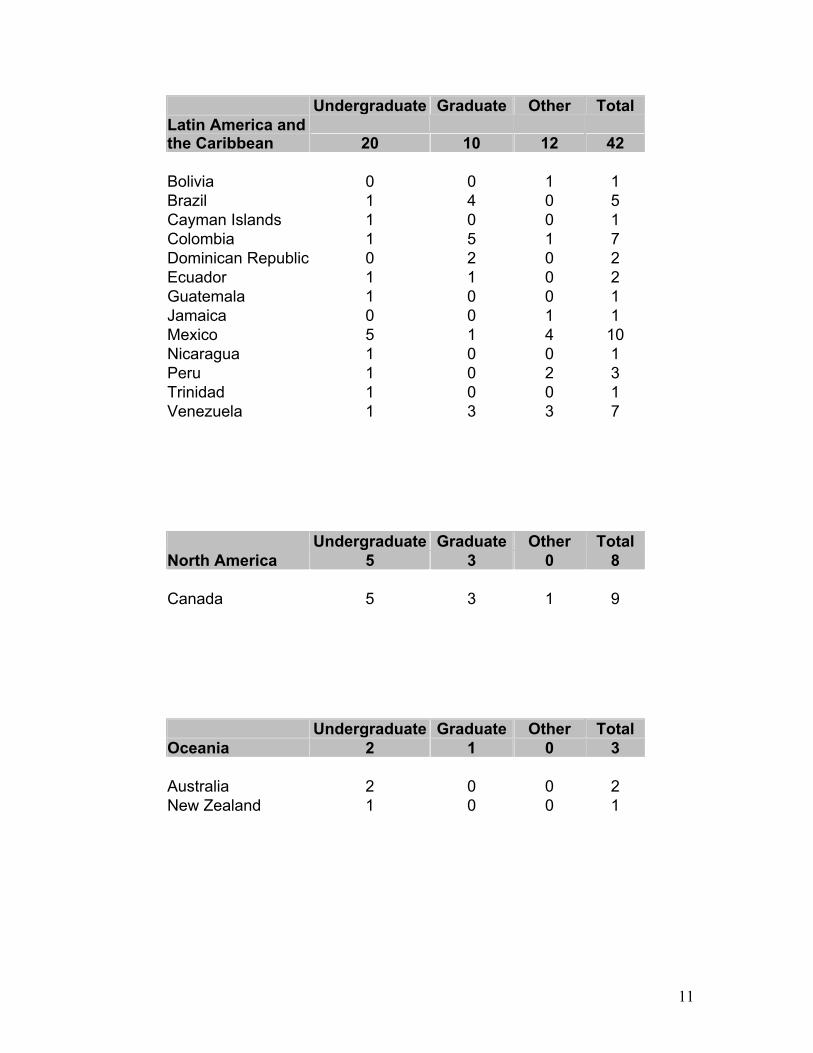
Undergraduate Graduate Other Total Latin America and the Caribbean 20 10 12 42 Bolivia 0 0 1 1 Brazil 1 4 0 5 Cayman Islands 1 0 0 1 Colombia 1 5 1 7 Dominican Republic 0 2 0 2 Ecuador 1 1 0 2 Guatemala 1 0 0 1 Jamaica 0 0 1 1 Mexico 5 1 4 10 Nicaragua 1 0 0 1 Peru 1 0 2 3 Trinidad 1 0 0 1 Venezuela 1 3 3 7
Undergraduate Graduate Other Total North America 5 3 0 8 Canada 5 3 1 9
Undergraduate Graduate Other Total Oceania 2 1 0 3 Australia 2 0 0 2 New Zealand 1 0 0 1
11
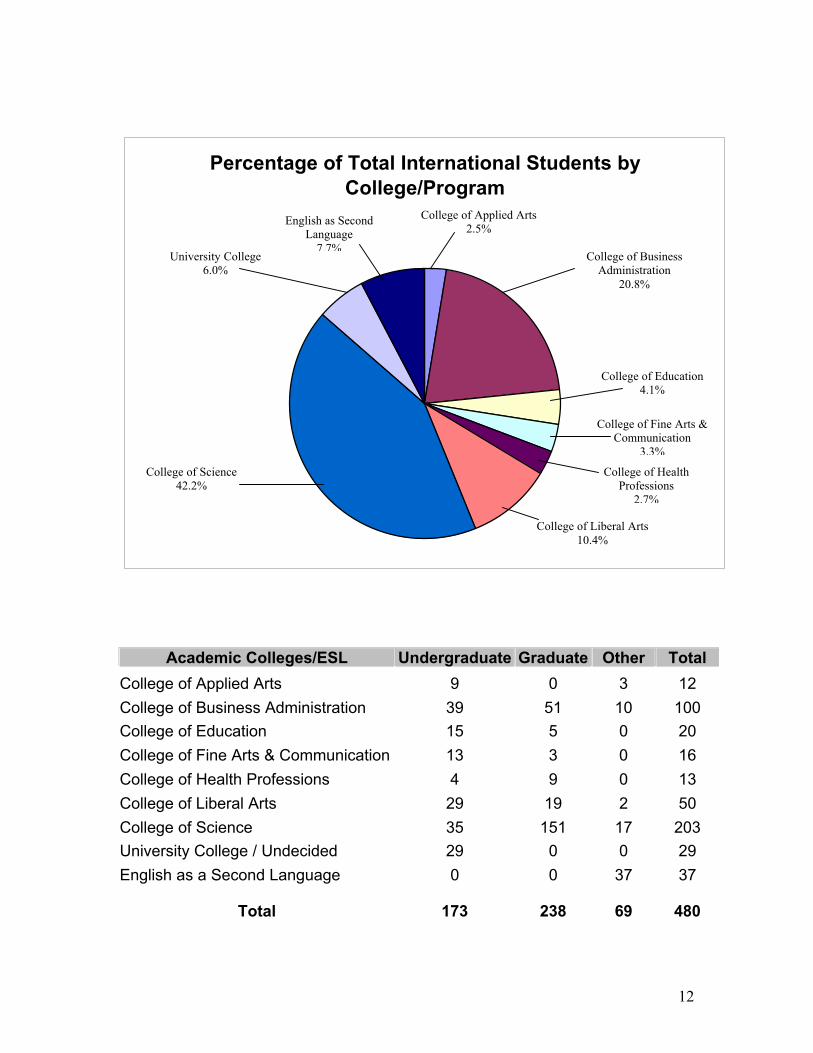
Percentage of Total International Students by College/Program
Academic Colleges/ESL UnCollege of Applied Arts College of Business Administration College of Education College of Fine Arts & CommunicationCollege of Health Professions College of Liberal Arts College of Science University College / Undecided English as a Second Language
Total
College of Applied Arts2.5%
College of Business Administration
20.8%
College of L10.4
dergraduate Graduate 9 0 39 51 15 5 13 3 4 9 29 19 35 151 29 0 0 0
173 238
College of Education4.1%
College of Fine Arts & Communication
3.3%
College of HealthProfessions2.7%
College of Science42.2%
University College6.0%
English as Second Language
7.7%
iberal Arts %
Other Total 3 12 10 100 0 20 0 16 0 13 2 50 17 203 0 29 37 37
69 480
12
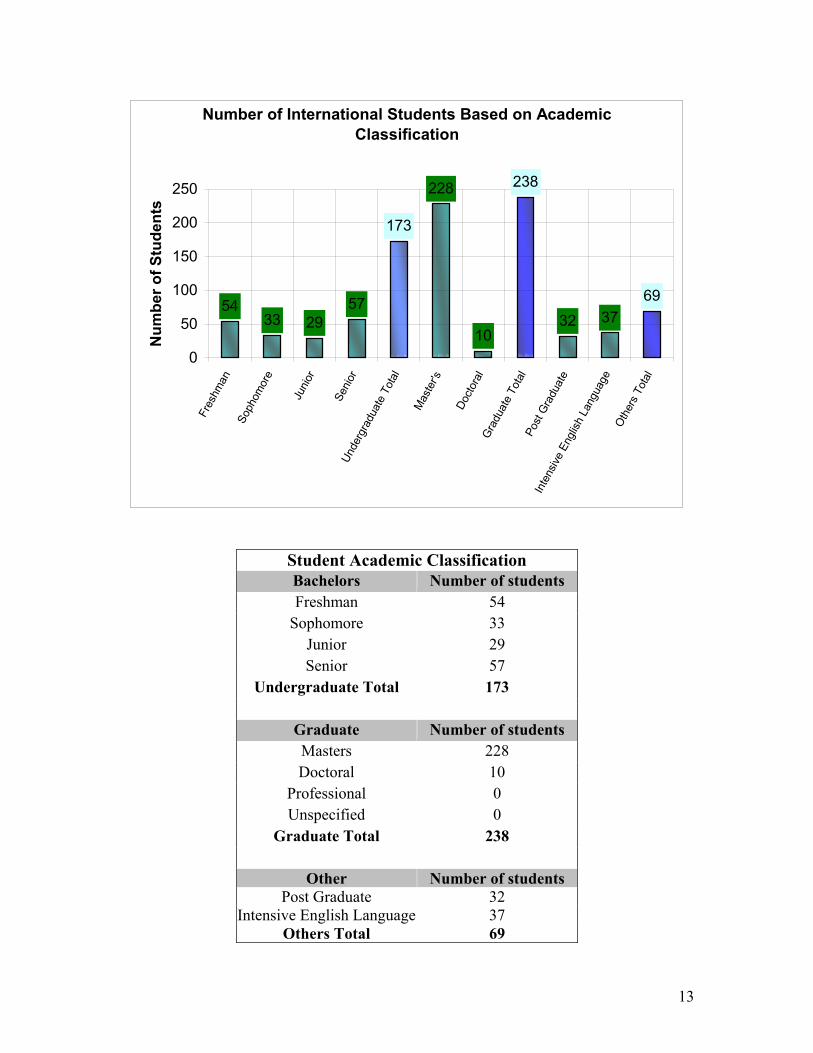
Number of International Students Based on Academic Classification
5433 29
57
228
1032 37
69
238
173
0
50
100
150
200
250Fr
eshm
anSo
phom
ore
Juni
or
Seni
orUn
derg
radu
ate
Tota
l
Mas
ter's
Doct
oral
Gra
duat
e To
tal
Post
Gra
duat
e
Inte
nsive
Eng
lish
Lang
uage
Oth
ers
Tota
l
Num
ber o
f Stu
dent
s
Student Academic Classification Bachelors Number of students Freshman 54
Sophomore 33 Junior 29 Senior 57
Undergraduate Total 173
Graduate Number of students Masters 228 Doctoral 10
Professional 0 Unspecified 0
Graduate Total 238
Other Number of students Post Graduate 32
Intensive English Language 37 Others Total 69
13
Undergraduate
GraduateOther
Total
MaleFemale
Total0
50100150200250300350400450500
Number of Students
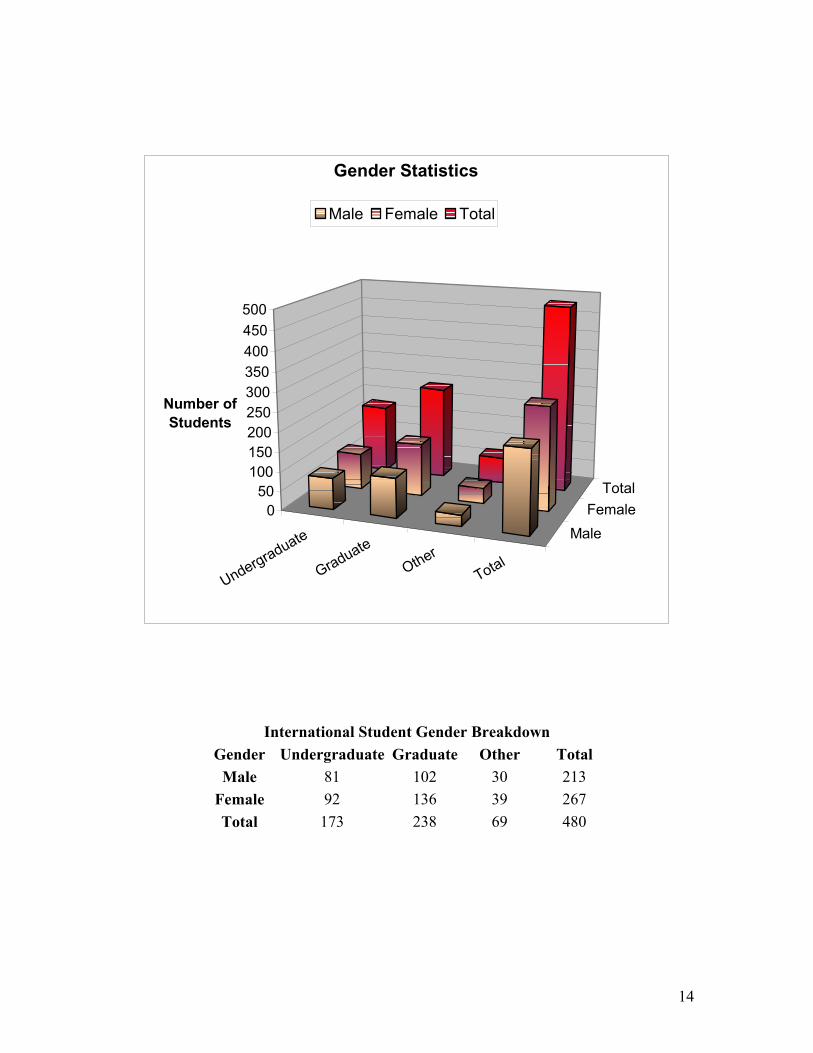
Gender Statistics
Male Female Total
International Student Gender Breakdown Gender Undergraduate Graduate Other Total
Male 81 102 30 213 Female 92 136 39 267 Total 173 238 69 480
14
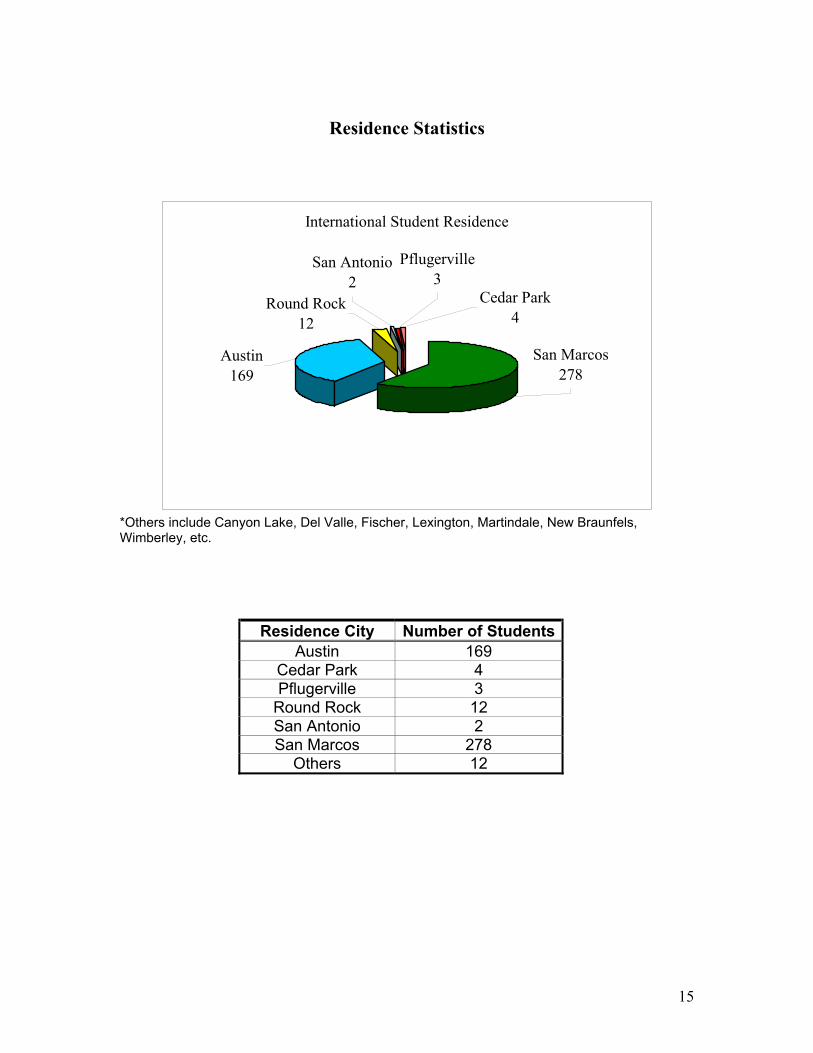
Residence Statistics
International Student Residence
San Antonio2
Pflugerville3
Cedar Park4
Round Rock12
Austin169
San Marcos278
*Others include Canyon Lake, Del Valle, Fischer, Lexington, Martindale, New Braunfels, Wimberley, etc.
Residence City Number of StudentsAustin 169
Cedar Park 4 Pflugerville 3
Round Rock 12 San Antonio 2 San Marcos 278
Others 12
15
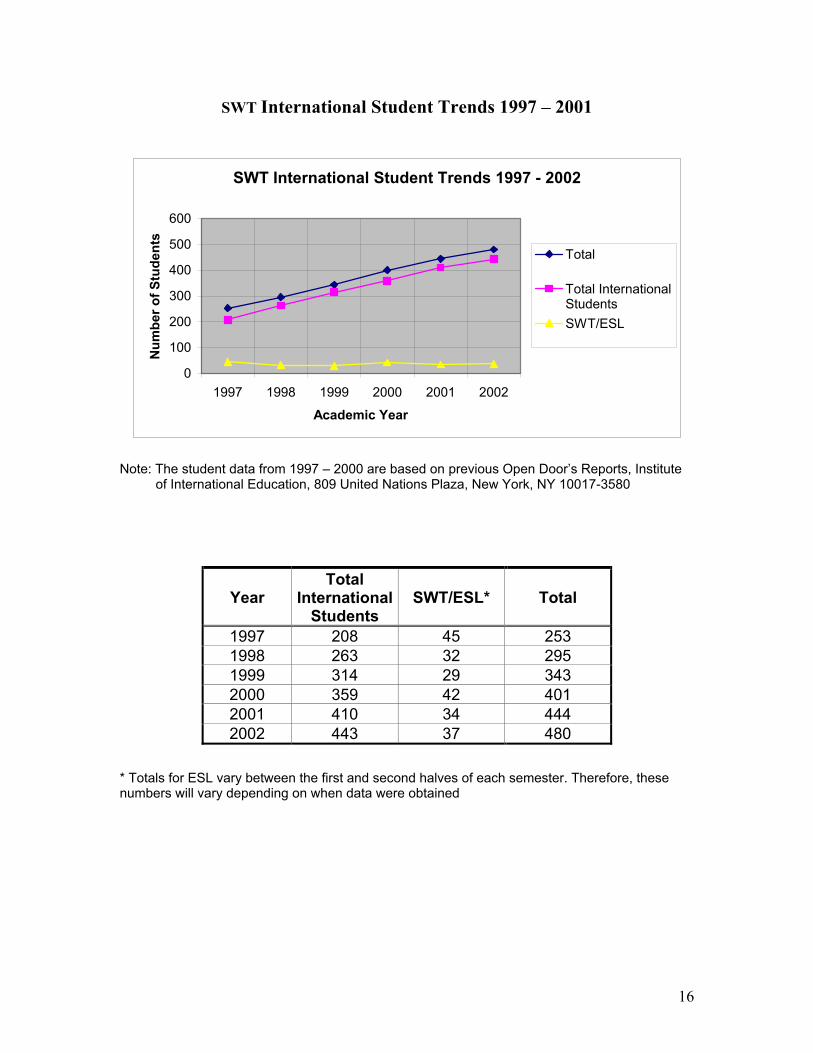
SWT International Student Trends 1997 – 2001
SWT International Student Trends 1997 - 2002
0
100
200
300
400
500
600
1997 1998 1999 2000 2001 2002
Academic Year
Num
ber o
f Stu
dent
s
Total
Total InternationalStudentsSWT/ESL
Note: The student data from 1997 – 2000 are based on previous Open Door’s Reports, Institute
of International Education, 809 United Nations Plaza, New York, NY 10017-3580
Year Total
International Students
SWT/ESL* Total
1997 208 45 253 1998 263 32 295 1999 314 29 343 2000 359 42 401 2001 410 34 444 2002 443 37 480
* Totals for ESL vary between the first and second halves of each semester. Therefore, these numbers will vary depending on when data were obtained
16