Embed Size (px)
Citation preview

Aus der II. Medizinische Klinik der Medizinischen Fakultät Mannheim
(Direktor: Prof. Dr. med. Matthias Ebert)
SOX9 in the development and chemotherapy of cholangiocarcinoma
(CCA)
Inauguraldissertation zur Erlangung des Doctor scientiarum humanarum (Dr. sc. hum.)
der Medizinischen Fakultät Mannheim
der Ruprecht-Karls-Universität zu
Heidelberg
vorgelegt von Xiaodong Yuan
aus
Anhui, China 2017

Dekan: Prof. Dr. med. Sergij Goerdt Referent: Prof. Dr. rer. nat. Steven Dooley

Für meine lieben Eltern

CONTENTS
Page
LIST OF ABRREVIATIONS ..................................................................... 1
1 INTRODUCTION ................................................................................. 4
1.1 Sex-determining region Y-box containing gene 9 (SOX9) ............................. 4
1.2 General functions of SOX9 in physiological and disease states .................... 4
1.3 SOX9 in the liver ............................................................................................ 5
1.3.1 Expression of SOX9 in embryonic and adult liver ................................ 5
1.3.2 Function of SOX9 in liver development ................................................ 5
1.3.3 SOX9 in liver homeostasis and regeneration ....................................... 6
1.3.4 SOX9 in chronic liver disease .............................................................. 7
1.3.5 SOX9 in liver cancer ............................................................................ 8
1.4 Cholangiocarcinoma ...................................................................................... 8
1.4.1 Epidemiology ....................................................................................... 9
1.4.2 Classification ....................................................................................... 9
1.4.3 Risk factors ........................................................................................ 10
1.4.4 Cellular origins ................................................................................... 11
1.4.5 Molecular pathogenesis ..................................................................... 12
1.4.6 Treatment .......................................................................................... 16
1.5 Aims of this study ........................................................................................ 18
2 MATERIALS AND METHODS ........................................................... 19
2.1 Materials ...................................................................................................... 19
2.1.1 Patients and liver tissues ................................................................... 19
2.1.2 Chemicals and reagents .................................................................... 20
2.1.3 Antibodies .......................................................................................... 21
2.1.4 Buffer preparation .............................................................................. 23
2.1.5 Cell culture material ........................................................................... 25
2.1.6 Instruments and Software .................................................................. 25
2.2 Methods ....................................................................................................... 26

2.2.1 Immunohistochemical staining ........................................................... 26
2.2.2 Immunohistochemistry evaluation...................................................... 28
2.2.3 Cell lines ............................................................................................ 29
2.2.4 Cell culture and treatment .................................................................. 29
2.2.5 RNA interference (RNAi) of SOX9 ..................................................... 30
2.2.6 Whole cell protein extraction .............................................................. 30
2.2.7 Cell Subcellular fractionation ............................................................. 31
2.2.8 Protein concentration determination .................................................. 31
2.2.9 Immunoblotting .................................................................................. 31
2.2.10 MTT assay ...................................................................................... 32
2.2.11 Cell cycle analysis .......................................................................... 32
2.2.12 Transwell migration assay .............................................................. 32
2.2.13 Caspase 3 assay ............................................................................ 33
2.2.14 Tumor sphere formation assay ....................................................... 33
2.2.15 RNA isolation and RNA concentration determination ..................... 33
2.2.16 Quantitative real-time reverse transcription polymerase chain reaction 35
2.2.17 Microarray analyses and Gene set enrichment analysis (GSEA) ... 35
2.2.18 Statistical analyses ......................................................................... 36
3 RESULTS .......................................................................................... 37
3.1 Clinical significance of SOX9 ....................................................................... 37
3.1.1 SOX9 expression in chronic liver disease .......................................... 37
3.1.2 SOX9 expression in iCCA .................................................................. 38
3.1.3 CCA patients with high SOX9 expression have poor clinical outcome 40
3.1.4 Integrated analysis of CCA patients gene expression signatures ...... 46
3.2 Investigating SOX9 function in CCA tumorigenesis and chemotherapy in vitro 50
3.2.1 SOX9 is highly expressed in CCA cell lines ....................................... 50
3.2.2 Comparative microarray analysis of parental and SOX9 depleted CC-SW-1 cells ...................................................................................................... 50
3.2.3 Depleting SOX9 suppresses CCA cell survival .................................. 53
3.2.4 SOX9 is required for cell migration .................................................... 56
3.2.5 SOX9 is required for CCA cell stemness ........................................... 58
3.2.6 SOX9 inhibition sensitizes CCA cells to gemcitabine ........................ 60

3.2.7 SOX9 is downstream of EGFR/ERK1/2 signaling .............................. 63
4 DISCUSSION .................................................................................... 66
4.1 SOX9 is a prognostic marker for iCCA ........................................................ 66
4.2 SOX9 determines the response of CCA cells to chemotherapy .................. 66
4.3 SOX9 as oncogene in CCA ......................................................................... 68
4.3.1 Survival .............................................................................................. 68
4.3.2 Migration ............................................................................................ 69
4.3.3 Cancer stem cell features .................................................................. 70
4.4 Regulation of SOX9 expression................................................................... 71
5 SUMMARY ........................................................................................ 72
6 REFERENCES .................................................................................. 74
7 LISTS OF FIGURES AND TABLES ................................................... 83
7.1 List of figures ............................................................................................... 83
7.2 List of tables ................................................................................................ 85
8 CURRICULUM VITAE ....................................................................... 86
9 ACKNOWLEDGEMENT .................................................................... 88

LIST OF ABRREVIATIONS
1
LIST OF ABRREVIATIONS
°C grad Celsius
µ
AAV
Micro (10-6)
Adeno-associated virus
APS Ammoniumpersulfate
BSA Bovine serum albumin
BECs Biliary epithelial cells
CCA Cholangiocarcinoma
CD
CLCs
Campomelic dysplasia
Cholangiolocellular carcinomas
CSC
CXCR4
Cancer stem cells
C-X-C chemokine receptor type 4
dCCA Distal cholangiocarcinoma
DRs Ductular reactions
DMEM Dulbecco´s modified eagle medium
DMSO Dimethylsulfoxide
eCCA Extrahepatic cholangiocarcinoma
ECM Extracellular matrix
EDTA Ethylene diaminetetraacetic acid
EGF Epidermal growth factor
EGFR Epidermal growth factor receptor
EMT Epithelial-to-mesenchymal transition
EpCAM Epithelial cell adhesion molecule
ERK1/2 Extracellular signal-regulated kinase1/2
FBS Fetal bovine serum
FDR False discover rate
FGFR2 Fibroblast growth factor receptor-2
GAPDH Glyceraldehyde 3-phosphate dehydrogenase
GEO Gene Expression Omnibus
GSEA Gene set enrichment analysis
HBV Hepatitis B virus
HCC Hepatocellular carcinoma
LIST OF ABRREVIATIONS
2
HCl Hydrogen chloride
HCV Hepatitis C virus
HGF
Hh
HNF4α
Hepatocyte growth factor
Hedgehog
Hepatocyte nuclear factor 4 α
HPCs Hepatic progenitor cells
HRP
HSCs
Horseradish peroxidase
Hepatic stellate cells
IBD Inflammatory bowel disease
iCCA
IDH
iNOS
Intrahepatic cholangiocarcinoma
Isocitrate dehydrogenesis
Inducible nitric oxide synthase
KEGG Kyoto Encyclopedia of Genes and Genomes
kg kilo gram
m Milli (10-3)
M molar (mol/l)
MRP4 Multidrug resistance-associated protein 4
MTT
NCAM
NSCLS
3-(4,5-Dimethylthiazol-2-yl)-2,5-Diphenyltetrazolium Bromide
Neural cell adhesion molecule
Non-small cell lung cancer
OPN Osteopotin
PAGE Polyacrylamide-Gel-electrophoresis
PBS Phosphate buffered saline
PBG Peribiliary gland
pCCA
PDAC
Perihilar chonglangiocarcinoma
Pancreatic ductal adenocarcinoma
PDC Primitive ductal structure
PDGF Platelet-derived growth factor
PI Propidium Iodide
PVDF Polyvinylidene fluoride
PSC Primary sclerosing cholangitis
Rmp
SCD
Revolutions per minute
Symmetrical cell division
SDS Sodium dodecyl sulfate

LIST OF ABRREVIATIONS
3
SOX9 Sex-determining region Y-box containing gene 9
TBS Tris buffered saline
TBS-T Tris buffered saline with Tween20
TEMED N,N,N´,N´-Tetramethylethylenediamine
TGF- β Transforming growth factor β
Tris Tris(hydroxymethyl)-aminoethane
WPC Weeks post-conception

INTRODUCTION
4
1 INTRODUCTION
1.1 Sex-determining region Y-box containing gene 9 (SOX9)
SOX9 was first identified as a critical gene associated with Campomelic dysplasia
(CD), a human haploinsufficiency disorder characterized by skeletal malformations,
male-to-female sex reversal in XY males and neonatal lethality [1]. SOX9 belongs to
SOX transcription factor family and possesses a high-mobility-group (HMG) DNA
binding domain which exhibits a high degree of homology with that of the mammalian
testis-determining factor, SRY [2].
1.2 General functions of SOX9 in physiological and disease states
During embryonic development, SOX9 is widely expressed in chondrocytes, testes,
heart, lung, pancreas, bile duct, hair follicles, retina, and the central nervous system
(CNS) [3-8]. The functions of SOX9 involve the regulation of cell proliferation,
differentiation, extracellular matrix (ECM) deposition, and epithelial-to-mesenchymal
transition (EMT) [8, 9].
In adult, SOX9 is expressed in local stem/progenitor cells of various organs with high
turnover in physiological state [10-13]. SOX9 positive cells have the capability of
differentiation into multiple mature organ cells, either in the physiological state or the
regenerative state after injury, particularly in intestine, pancreas and hair follicles [10,
11]. In some setting, SOX9 is required for the maintenance of progenitor cells in
undifferentiated status [9, 14].
In fibrosis-associated disease, SOX9 regulates ECM deposition by activating genes
encoding extracellular matrix components [15-19]. In addition, elevated SOX9
expression has been reported in a wide range of human cancers, including non-small
cell lung cancer (NSCLS), pancreatic ductal adenocarcinoma (PDAC) and melanoma
[20-25]. The role of SOX9 in carcinogenesis is unclear. High levels of SOX9
expression in cancers are linked to the malignant characters, progression, and poor
prognosis of cancer. SOX9 exhibits pro-oncogenic properties, including promoting
cell proliferation, inhibiting senescence and collaboration with other oncogenes in
neoplastic transformation [26]. On the other hand, SOX9 displays as a tumor
suppressor by inhibiting tumor cell growth and facilitating chemotherapy [26].

INTRODUCTION
5
1.3 SOX9 in the liver
1.3.1 Expression of SOX9 in embryonic and adult liver
Most knowledge on the biological functions of SOX9 in liver development is obtained
from studying animal embryonic development. In mice, SOX9 is the most specific and
earliest marker of biliary tree during liver development [27]. At E10.5, SOX9
expression is detected in the endodermal cells lining the liver diverticulum; however it
is undetectable in the hepatoblasts invading the septum transversum [27]. At E11.5,
SOX9 emerges in hepatoblasts near the portal vein [27]. At E13.5, the SOX9 positive
cells form a single-layered ductal plate around the portal vein, which gives rise to
cholangiocytes, the ductules, and the canals of Herings and periportal hepatocytes
[27, 28]. At E15.5, SOX9 is expressed on the portal side of primitive ductal structure
(PDC). From E18.5, SOX9 localizes in all biliary cells until birth [27]. After birth, SOX9
expression persists in small bile ducts but regresses from large bile ducts [27].
In human, SOX9 exhibits a similar expression pattern as in mice. During normal
human liver embryonic development, SOX9 positive cells are detected near portal
vein at 8 weeks post-conception (WPC). At 18 WPC, SOX9 expression is detected in
the ductal plate encircling the portal vein. In adult, SOX9 expresses in bile ducts but
not in hepatocytes [29]. SOX9 expression in embryonic and adult liver in mouse and
human is presented in Table 1.
1.3.2 Function of SOX9 in liver development
SOX9 plays a critical role in controlling the timing of intrahepatic bile duct
morphogenesis in liver development. Liver-specific inactivation of SOX9 leads to a
delay in the resolution of the asymmetric primary ductal structures in mice [27]. In
addition, SOX9 functions in cooperation with SOX4, another member of SOX family,
in the process of bile duct development [30]. During mice bile duct development,
SOX4 displays similar expression profiles in the PDC and developing bile duct as
SOX9. Liver-specific inactivation of SOX4 leads to delayed bile differentiation and
morphogenesis, while double mutation in SOX9 and SOX4 completely blocks biliary
development and results in dilated and truncated hilar ducts, cholestasis, liver fibrosis
and ductular reactions (DRs) [30]. In normal human fetal livers, accumulating studies
have demonstrated that SOX9 expression is detectable in PDS with asymmetrical

INTRODUCTION
6
expression, suggesting a similar bile duct morphogenesis process as in mice [27, 31,
32].
Table 1. SOX9 expression in embryonic and adult liver
Mouse Human
Embryonic day SOX9 expression
weeks
postconception
(WPC)
SOX9 expression
E10.5 Endodermal cells lining
the liver diverticulum,
undetectable in
hepatoblasts
E11.5 Hepatoblasts near
portal vein
8 WPC Hepatoblasts near
portal vein
E13.5 Single-layered ductal
plate around the portal
vein
18 WPC Ductal plate
encircling the portal
vein
E15.5 Portal side of primitive
ductal structure (PDC)
E18.5 to birth Biliary cells
After birth Small ducts Adult Bile ducts
1.3.3 SOX9 in liver homeostasis and regeneration
In normal adult liver, SOX9 expression is observed in the periportal small intrahepatic
ducts and peribiliary glands lining the large bile ducts [33]. In acute or chronic liver
disease, SOX9 expression is detected in DRs which contain putative progenitors
capable of producing cholangiocytes and hepatocytes[34]. Increasing evidence
shows that a subpopulation of SOX9 positive cells in liver express stem cell markers,
such as Epithelial cell adhesion molecule (EpCAM), neural cell adhesion molecule
(NCAM), CD133, C-X-C chemokine receptor type 4 (CXCR4) [33, 35]. Thus, these
SOX9 positive cells are thought as hepatic progenitor cells (HPCs) and are able to
differentiate into hepatocytes and cholangiocytes. This notion is supported by several
experimental evidences. Cardinale et al. showed that SOX9 positive cells isolated

INTRODUCTION
7
from the peribiliary glands of adult human extrahepatic biliary system give rise to
functional hepatocytes and cholangiocytes in vitro and in immunocompromised mice
[35]. With the SOX9IRES-CreERT2 knock-in mice, Furuyama et al. illustrated that the
adult HPCs locate in the SOX9-expressing progenitor cell zones and these SOX9
positive cells physiologically supply the hepatocytes and intrahepatic biliary cells [11].
Dorrell C and colleagues conducted lineage tracing study using SOX9CreERT2
transgenic mice and revealed that SOX9-expressing cells contribute to both
hepatocytes and bile duct cell lineages in normal and injured livers [36]. However, the
notion that SOX9 positive HPCs contribute to hepatocytes is not supported by other
experiments. Tarlow et al. used the same strain of SOX9CreERT2 transgenic mice for
lineage trancing as Dorrell’s. In contrast to Dorrell’s strategy, they adopted a lower
dosage of tamoxifen to drive specific Cre expression. They found that hepatic
progenitors of SOX9 positive ductal origin did not significantly contribute to
hepatocyte replacement in different liver injury models [37]. The conflicting results
from different studies may be attributed to two reasons. Firstly, in the SOX9IRES-
CreERT2 knockin mice, inserting IRES-CreERT2 into 3’UTR of the SOX9 gene may
lead to endogenous SOX9 expression in the liver [11]. Secondly, although the
SOX9CreERT2 transgenic mice maintain the intact genomic SOX9 locus, high dosage
of tamoxifen may induce ectopic expression of SOX9 in the hepatocytes [28, 37]. In
contrary to previous reported stem/progenitor-cell-based lineage tracing models, two
groups performed hepatocyte-specific lineage tracing studies using adeno-
associated virus (AAV) to drive hepatocyte-specific Cre expression instead of
tamoxifen. The results showed that liver homeostasis and regeneration are mediated
by self-duplication of preexisting hepatocytes, rather than differentiation from HPCs in
classic toxin-induced liver injury models [38, 39]. However, Lu and colleagues
demonstrated that SOX9 positive HPCs contribute to liver regeneration when
hepatocytes proliferation is impaired [40]. These results indicate that SOX9 positive
HPCs may provide a backup system for injury states in which the proliferative
capabilities of hepatocytes are impaired [39, 40].
1.3.4 SOX9 in chronic liver disease
In chronic liver disease, hepatic stellate cells (HSCs) are primary cell type
responsible for extracellular matrix (ECM) deposition [41]. In response to liver injury,
HSCs are activated by transforming growth factor β1 (TGFβ1) and platelet-derived
growth factor (PDGF). Subsequently, activated HSCs secrete ECM that defines

INTRODUCTION
8
fibrosis in the liver parenchyma [41]. Hanley et al. reported that activating HSCs
under influence of TGF-β1 produce ectopic expression of SOX9, which leads to
significant production of type I collagen [42]. In addition, SOX9 is responsible for the
expression of Osteopotin (OPN), which is an important component of ECM and has
been described as a biomarker for liver fibrosis [18]. As in the developmental and
adult liver, SOX9 and OPN were coexpressed in biliary ducts. Increased expressions
of both SOX9 and OPN colocalize to fibrotic region, particularly in activated HSCs. In
vitro, SOX9 and OPN are coexpressed in activated human and rat HSCs, while
abrogation of SOX9 expression results in decreased OPN expression [18]. Moreover,
it has been reported that SOX9 is a downstream target of Hedgehog (Hh) signaling,
which plays a crucial role in promoting EMT and the evolution of biliary fibrosis during
chronic cholestasis [43].
1.3.5 SOX9 in liver cancer
Elevated SOX9 expression is detected in hepatocellular carcinoma (HCC) and
cholangiocarcinoma (CCA) [44, 45]. In HCC, SOX9 expression is increased in tumor
tissue and is positively related to tumor cell differentiation, venous invasion,
advanced tumor stage and shorter overall survival [44, 46]. Functionally, SOX9
confers stemness properties to HCC cells through Frizzled-7 mediated Wnt/β-catenin
pathway [46]. In addition, Liu et al. reported that SOX9 is highly expressed in liver
cancer stem cells (CSC) and required for maintaining the proliferation, self-renewal,
and tumorigenicity of the liver CSCs [47]. SOX9 acts as a downstream regulator of
Notch signaling through inhibition of Numb, an antagonist of Notch, thereby directing
symmetrical cell division (SCD) and promoting tumorigenicity in liver CSCs [47]. In
CCA, Matsushima et al. found that SOX9 expression decreases from the normal
biliary epithelium to the biliary intraepithelial neoplasia in a stepwise pattern: SOX9
expression in intrahepatic cholangiocarcinoma (iCCA) is lower than that in normal
biliary epithelium [45]. However, elevated SOX9 expression in iCCA is associated
with the biliary infiltration and poor clinical outcome [45]. Their results implied that
SOX9 may be involved in a multi-step carcinogenesis of iCCA.
1.4 Cholangiocarcinoma
CCA is a heterogeneous carcinoma originating from bile duct system with
cholangiocyte differentiation features [48].
INTRODUCTION
9
1.4.1 Epidemiology
CCA is the second most common primary epithelial malignancy of liver following
hepatocellular carcinoma [49]. CCA accounts for approximately 3% of all
gastrointestinal cancers and 10% to 25% of primary hepatobiliary malignancies [50].
Advanced CCA has poor prognosis with a median survival of less than 24 months
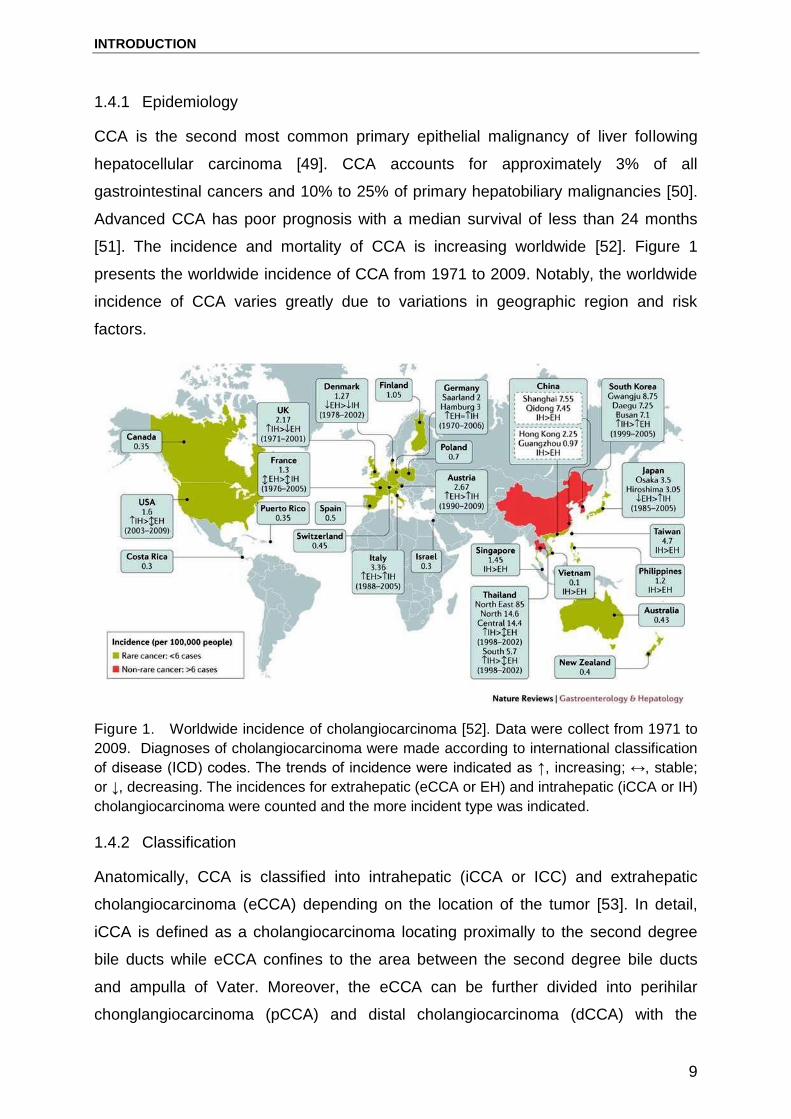
[51]. The incidence and mortality of CCA is increasing worldwide [52]. Figure 1
presents the worldwide incidence of CCA from 1971 to 2009. Notably, the worldwide
incidence of CCA varies greatly due to variations in geographic region and risk
factors.
Figure 1. Worldwide incidence of cholangiocarcinoma [52]. Data were collect from 1971 to
2009. Diagnoses of cholangiocarcinoma were made according to international classification
of disease (ICD) codes. The trends of incidence were indicated as ↑, increasing; ↔, stable;
or ↓, decreasing. The incidences for extrahepatic (eCCA or EH) and intrahepatic (iCCA or IH)
cholangiocarcinoma were counted and the more incident type was indicated.
1.4.2 Classification
Anatomically, CCA is classified into intrahepatic (iCCA or ICC) and extrahepatic
cholangiocarcinoma (eCCA) depending on the location of the tumor [53]. In detail,
iCCA is defined as a cholangiocarcinoma locating proximally to the second degree
bile ducts while eCCA confines to the area between the second degree bile ducts
and ampulla of Vater. Moreover, the eCCA can be further divided into perihilar
chonglangiocarcinoma (pCCA) and distal cholangiocarcinoma (dCCA) with the

INTRODUCTION
10
insertion of cystic duct as the separation point. pCCA localizes to the insertion of the
cystic duct into the common bile duct, whereas dCCA confines to the area between
the origin of the cystic duct and ampulla of Vater.
Based on histological diversity, iCCA is categorized into two groups: pure muc-ICC
and mixed-ICC (mucin-producing adenocarcinoma with hepatocytic differentiation
areas and/or ductular areas) [54]. Muc-ICCs have similar clinicopathological,
immunohistochemical, and gene expression profiles as hilar CCA. These tumors
have a similar profile as cylindrical, taller, mucin-producing cholangiocytes that line
hilar and intrahepatic large bile ducts [54]. However, mixed-ICC show similar
clinicopathological, immunohistochemical, and gene expression profiles as
cholangiolocellular carcinomas (CLCs) that comprise histopathological features of
both hepatocellular carcinoma and cholangiocarcinoma and thus, are thought to
originate from HPCs [54]. The proposed histological classification of CCA provides a
new sight for understanding the biological features of CCA and may serve as a more
accurate, reliable and simple approach for the diagnosis and treatment of the cancer.
1.4.3 Risk factors
Risk factors that lead to the multistep development of CCA are not well known. To
date, most CCA cases lack a recognized risk factor. Moreover, most cases appear to
develop in what is believed to be otherwise healthy livers. Approximately only 10% of
cases resulted from a chronic inflammatory process of the bile ducts that might
induce progressive changes in the biliary epithelium that culminate in cancer.
Nevertheless, several well-established risk factors associated with the development
of CCA have been reported, including parasitic infections, primary sclerosing
cholangitis (PSC), biliary-duct cysts, hepatolithiasis, and thorotrast [55]. In addition,
there are less-established or potential risk factors for CCA, including hepatitis C virus
(HCV), hepatitis B virus (HBV), inflammatory bowel disease (IBD), cirrhosis, diabetes,
obesity, alcohol, smoking, and host genetic polymorphisms [55]. Table 2 and 3
present these recognized and potential risk factors of CCA.

INTRODUCTION
11
Table 2. Established risk factors and corresponding geographic distribution for
cholangiocarcinoma [55]
Established risk factors Geographic distribution
Hepatobiliary flukes
Opisthorchis viverrini (O. viverrini) and Clonorchis sinensis (C. sinensis)
Southeast and Northeast Asia
Biliary-Tract Disorders:
Bile-duct cysts
Primary Sclerosing Cholangitis (PSC)
Hepatolithiasis
Prevalence is higher in Asian than Western countries
Most common known risk factor of CCA in Western countries Established risk factor for ICC in Asian countries
Toxins: Thorotrast
Eastern and Western countries
Table 3. Possible risk factors for cholangiocarcinoma [55]
Possible Risk Factors
Inflammatory Bowel Disease (IBD)
Choledocholithiasis and Cholangitis
Chronic Viral Hepatitis and Cirrhosis:
Hepatitis C virus (HCV)
Hepatitis B virus (HBV)
Cirrhosis regardless of etiology
Diabetes and Obesity
Alcohol Drinking
Smoking
Genetic Polymorphisms
1.4.4 Cellular origins
For decades, the cell origin of CCA has been the object of extensive investigation.
There is no doubt that mature cholangiocytes have the requisite to be targets of

INTRODUCTION
12
transformation because of their self-renewal and longevity, which would allow the
sequential accumulation of genetic or epigenetic mutations required for oncogenesis
[56, 57]. However, several histopathologic and gene expression profiling studies
have documented a group of CCA with the histopathological features of both
hepatocellular carcinoma and cholangiocarcinoma, indicating a cell origin of CCA
from HPCs localized in the canal of Hering [58-61]. Moreover, it has been proposed
that the mucin-CCAs are derived from the PBGs, which are stem cell niches of the
intrahepatic and extrahepatic biliary tree [62-64]. Thus, the cells lining the bile ducts,
biliary epithelial cells (BECs), PBGs and HPCs can give rises to CCA. In addition,
experimental studies even demonstrate that differentiated/mature hepatocytes can
convert into biliary lineage cells through the activation of Notch signaling and have
the potential to give rise to iCCA [65, 66]. Figure 2 shows the potential cells source
of iCCA.
Figure 2. Potential cells of origin in intrahepatic cholangiocarcinoma (iCCA) [53].
1.4.5 Molecular pathogenesis
CCA is a cancer with genomic heterogeneity, which is not only related to the diverse
anatomical location of the tumor but also to various risk factors and associated
pathologies [52]. To date, the most prevalent genetic alterations identified in CCA

INTRODUCTION
13
include DNA repair, the WNT-CTNNB1 pathway, tyrosine kinase signaling, protein
tyrosine phosphatase, epigenetic and chromatin remodeling factors and deregulated
Notch signaling, a critical component in cholangiocyte differentiation and biliary duct
development [52].
In the epigenetic landscape, isocitrate dehydrogenases 1 and 2 (IDH1 and IDH2) are
frequently mutated in CCA [67, 68]. Mutation in IDH1 reshapes the genomic
landscape and results in an altered differentiation state of cells [69]. In addition, IDH1
mutation causes the deregulation of hepatocyte nuclear factor 4α (HNF4α),
consequently blocks hepatocyte differentiation and promotes the development of bile
duct cancer [70].
Fibroblast growth factor receptor 2 (FGFR2) gene fusions with multiple partners have
been described in patients with CCA [71-75]. To date, seven FGFR2 fusion gene
products have been identified in CCA, including FGFR2-BICC1, FGFR2-KIAA1589,
FGFR2-TACC3, FGFR2–AHCYL1, FGFR2–MGEA5, FGFR2–KCTD1 and FGFR2–
TXLNA29 [52]. FGFR gene fusions facilitate oligomerization and FGFR kinase
activation, which results in cell morphology alteration and increased cell proliferation
[52, 74].
Several growth factor tyrosine kinases are involved in the carcinogenesis and
progression of CCAs, including the ERBB family of receptor tyrosine kinases, such as
the epidermal growth factor (EGF) receptor EGFR, and the hepatocyte growth factor
(HGF) receptor HGFR, also known as c-Met. Immunohistochemistry studies showed
EGFR overexpression in human CCA samples [76, 77]. Moreover, mutations and
amplifications in the EGFR gene occur in 15% and 5% CCAs, respectively [78, 79]. In
addition to EGFR, overexpression of c-Met is also associated with poor prognosis of
CCA patients [80]. Both EGF/EGFR and HGF/c-Met pathways are implicated in the
metastatic potential of CCA. Immunohistochemistry staining showed that cytoplasmic
localization of E-cadherin is associated with EGFR overexpression. In vitro study
further confirmed that EGF/EGFR axis triggers EMT of CCA cells [81]. Besides,
stimulation of c-Met by HGF induces invasiveness and motility of CCA cells through
activating AKT and ERK pathways [82]. These findings demonstrate the critical role
of growth factors pathway in the progression of CCA.

INTRODUCTION
14
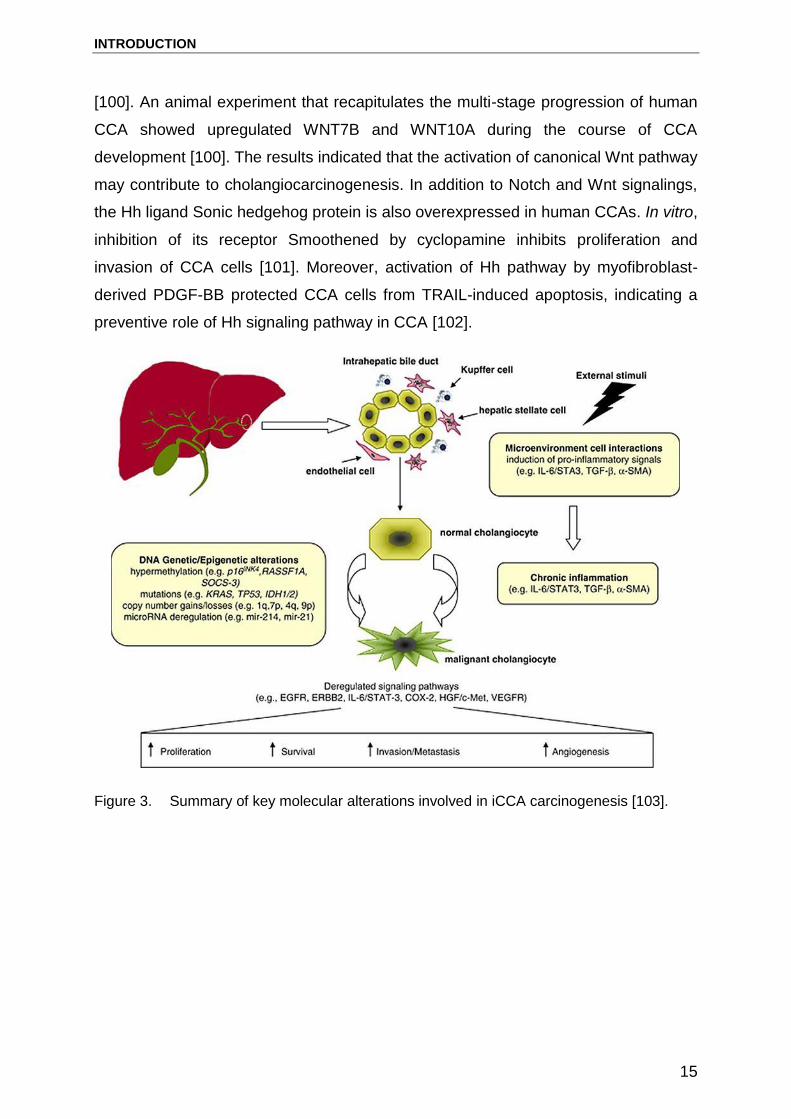
CCA often arises in the context of biliary inflammation [50]. Whole-transcriptome
analyses reveal two subclasses of iCCA with distinct molecular signatures: (1) iCCA
with predominant activation of inflammatory pathways and overexpression of different
cytokines, (2) iCCA of a proliferation class with feature of predominant activation of
oncogenes [83]. One of the key cytokines, which is constitutively secreted by CCA
cells, is IL-6 [84]. In vivo, elevated IL-6 expression is detected in the serum and tumor
stroma of CCA patients [85, 86]. In vitro, IL-6 promotes cholangiocyte growth via the
activation of the MAPK pathway and modulates the survival of CCA cells through the
induction of anti-apoptotic proteins such as myeloid leukemia cell differentiation
protein Mcl-1 (MCL1) [87]. In addition to IL-6, CCA cells also overexpress TGF-β and
TGF-β receptor II [88, 89]. TGF-β contributes to the invasion and migration of CCA
via induction of EMT of CCA cells [90]. The continuous production of inflammatory
cytokines might induce the expression of inducible nitric oxide synthase (iNOS) and
oxidative and nitrosative stress in cholangiocytes[91]. Oxidative and nitrosative stress
further induce DNA damage by producing oxidative DNA lesions and inhibit DNA
repair enzymes, thereby promoting carcinogenesis (Figure 3) [91, 92].
Notch, Wnt/ β-catenin, and Hh signaling pathways are involved in iCCA pathogenesis.
Notch signaling pathway is required for modulating cell fate decisions throughout the
development of invertebrate and vertebrate species [93]. In mammals, the canonical
Notch signaling pathway has four Notch receptors (Notch 1, 2, 3 and 4) and five
ligands belonging to the Jagged (Jagged1, 2) and Delta-like (Delta-like, Dll1, 3, and 4)
family [94]. During liver embryonic development, the Notch signaling is critical for
cholangiocyte differentiation and biliary duct morphogenesis [95]. In post-natal liver
homeostasis and liver disease, Notch pathway is implicated in HPCs mediated liver
repair and in reparative morphogenesis of the biliary tree [96]. In liver cancer,
upregulated expression of Notch1 and Notch2 are reported in 82.2% and 56.1% of
human CCAs, respectively [97]. In mice, the combined activation of Notch and AKT
leads to hepatocytes-derived iCCA [65, 66]. Inhibition of Notch and its ligand Jagged
1 almost eliminate mouse CCA development driven by transfection of activated AKT
and Ras oncogenes [98]. In vitro, activation of Notch signaling is implicated in the
induction of EMT and the migration of CCA cells [99]. Like Notch, the Wnt/β-catenin
signaling pathway is upregulated in patients with cholangiocarcinoma [100]. The
activation of Wnt pathway is often associated with overexpression of the ligands
WNT7B and WNT10A along with several Wnt pathway target genes in human CCAs
INTRODUCTION
15
[100]. An animal experiment that recapitulates the multi-stage progression of human
CCA showed upregulated WNT7B and WNT10A during the course of CCA
development [100]. The results indicated that the activation of canonical Wnt pathway
may contribute to cholangiocarcinogenesis. In addition to Notch and Wnt signalings,
the Hh ligand Sonic hedgehog protein is also overexpressed in human CCAs. In vitro,
inhibition of its receptor Smoothened by cyclopamine inhibits proliferation and
invasion of CCA cells [101]. Moreover, activation of Hh pathway by myofibroblast-
derived PDGF-BB protected CCA cells from TRAIL-induced apoptosis, indicating a
preventive role of Hh signaling pathway in CCA [102].
Figure 3. Summary of key molecular alterations involved in iCCA carcinogenesis [103].

INTRODUCTION
16
Table 4. Molecular pathogenesis of CCA [52]
Gene or molecule Type of alteration
Genetic and epigenetic factors
TP53
KRAS
IL-6/STAT3, SOCS-3
IDH1/IDH2
Loss-of-function mutations
Activating mutations in hotspots located at codon
12
Overexpression of IL-6 due to epigenetic
silencing of SOCS-3 in 27 % of CCA
Activating mutation in 10–23% of CCA
Deregulated cell signaling pathways
EGFR and ERBB2
HGF/MET
VEGF
KRAS/MAPK
Interleukin-6 (IL-6)/STAT
Notch
WNT/beta-Catenin
Hedgehog
Overexpression of the receptors occurs in 10–
32 % of iCCA
Overexpression of MET occurs in 12–58 % of
iCCA
Overexpression in 50 % of iCCA
Activation
Overexpression and activation
Upregulation of NOTCH1 and NOTCH2
Upregulated
Activation
1.4.6 Treatment
CCA is a devastating malignancy with limited treatment options. At present, surgical
resection and liver transplantation represent the potentially curative treatment
modalities for the all three types of CCA (intrahepatic, perihilar, and distal
cholangiocarcnoma) [104]. However, the median survivals for R0-resected
intrahepatic, perihilar, and distal CCAs were 80, 30, and 25 months, respectively,
while the 5-year survivals were 63%, 30%, and 27%, respectively [105]. Moreover,
curative liver transplantation is an option for selected patients with perihilar
cholangiocarcinoma, while iCCA is considered as a contraindication for liver
transplantation [53, 104]. For patients who are not suitable for surgical resection or
liver transplantation, the prognosis is even more dismal with a life expectancy around
1 year [106]. Currently, the practice standard for advanced CCA is systemic

INTRODUCTION
17
chemotherapy with gemcitabine and cisplatin, which demonstrated a median overall
survival around 11.7 months [107]. No molecular targeted therapy so far has been
proven effective for CCA [104]. During the last decade, the application of next-
generation sequencing and other new technologies has made it feasible to discovery
more potential targetable molecular alterations in CCA. Currently, clinical trials with
targetable molecular alterations in CCA are undergoing. BGJ398, a selective FGFR
inhibitor, has shown efficacy in blocking the neoplastic transformation and growth of
cell lines expressing FGFR2 fusion in vitro [108]. At present, clinical efficacy of
BGJ398 is being investigated in a phase II multicenter single-arm study in advance
CCA patient with FGFR2 alterations (ClinicalTrials.gov number. NCT02150967).
Promising preliminary data have also been reported that treatment with ponatinib, a
multikinase inhibitor, leads to reduction of tumor size in 2 iCCA patients of FGFR2–
TACC3 and FGFR2–MGEA5 gene fusions [71]. Furthermore, AG-120 and AG-221,
inhibitor of IDH1 and IDH2, are currently being investigated in phase I
(ClinicalTrials.gov number.NCT02073994) and phase I/II (ClinicalTrials.gov
number.NCT02273739) clinical trials, respectively [109]. Since that the current
existing stratification system based on the location and extent of the tumor in the
biliary tree is not predictive for resect ability or survival of CCA patients [110],
establishing a novel patient stratification system based on molecular biomarkers is
essential for the development of more personalized therapeutic approaches for the
treatment of CCA patients [109].

INTRODUCTION
18
1.5 Aims of this study
On the basis of the aforementioned state of art, I learned that SOX9 is a critical
transcription factor for liver embryogenesis, homeostasis, regeneration and HCC
development. However, the oncogenic role of SOX9 has not been investigated in
CCA. As CCA is a devastating malignancy with limited treatment options, elucidation
of its underlying mechanisms and identification of new molecular markers for the
tumorigenesis and progression of CCA is necessary for improving diagnosis and
prognosis of this cancer type. Considering that (1) SOX9 positive HPCs are required
for liver homeostasis and regeneration, (2) chronic injury increases the risk of forming
liver cancer, (3) HPCs are a potential cellular origin of CCA, I hypothesized that
SOX9 might contribute to the tumorigenesis of CCA. Thus, the aims of this study are
(i) to investigate the oncogenic role of SOX9 in cholangiocarcinoma and (ii) to
evaluate the therapeutic potential of targeting SOX9 as a treatment of CCA.

MATERIALS AND METHODS
19
2 MATERIALS AND METHODS
2.1 Materials
2.1.1 Patients and liver tissues
Resected liver tissues were obtained from two cohorts: one cohort from Germany
contains 28 iCCA patients and 5 eCCA; and the other cohort from France contains 41
iCCA patients. In addition, 21 liver tissues from patients without liver cancer were
enrolled as control. Basic characteristics of the enrolled iCCA patients are shown in
Table 5. The study protocol fulfilled national laws and regulations and was approved
by the local Ethics Committee.
Table 5. Clinicopathological features of the validating set iCCA
Clinicopathological Features
NO. of patients Value
Age (year mean±SD) 69 63.0±9.6
Gender (male:female) 69 48:21
Vascular invasion 10 (63) 15.9%
Satellite nodules 20 (63) 31.7%
Cirrhosis 22 (66) 33.3%
AJCC classification 67
I 23 34.33%
II 18 26.87%
III 10 14.93%
IV 16 23.88%
Follow up (month mean±SD) 60 28.4±26.6
Range 60 0-110.5
Death 30 50%

MATERIALS AND METHODS
20
2.1.2 Chemicals and reagents
Table 6. Chemicals and reagents
Chemicals and reagents Cat. No. Company
AC-DEVD-AFC (substrate) 13401 AAT Bioquest (USA)
Acetic acid 338826 Sigma-Aldrich (USA)
Albumin standard (BSA) 12659 Merck (Germany)
Ammonium persulfate (APS) A3678 Sigma-Aldrich (USA)
BIT 9500 09500 Stem cell (Canada)
3.3'-diaminobenzidine (DAB) D-5905 Sigma-Aldrich (USA)
DMEM BE12-709F Lonza (Germany)
DMEM/F12 12634-010 Life Technology (Canada)
Dimethyl sulfoxide (DMSO) 41639 Sigma-Aldrich (USA)
DRQ5 dye 4084 Cell SignalingTechnology
(USA)
Peroxidase Blocking Reagent S2003 Dako (Danmark)
Dulbecco’s Phosphate Buffered
Saline
D8537 Sigma Aldrich (Germany)
EDTA 324503 Calbiochem (Germany)
Epidermal growth factor (EGF) 354001 BD Biosciences (USA)
Erlotinib 5083S Cell Signaling Technology (USA)
Ethanol 100% K928.4 Carl Roth (Germany)
Fetal Bovine Serum (FBS) 10270-098 Invitrogen (Germany)
Formaldehyde F1635 Sigma-Aldrich (USA)
L-glutamine BE17-605E Lonza (Germany)
Hematoxylin HX69715174 Carl Roth (Germany)
Hydrogen peroxide (H2O2) H1009 Sigma-Aldrich (USA)
Laemmli-buffer 161-0737 BioRad (USA)
Insulin HI0210 Lilly (Germany)
Malinol mounting medium 3C-242 Waldeck (Germany)
2-β-Mercaptoethanol 516732 Sigma-Aldrich (Germany)
Mounting medium S3023 Dako
Methanol 8388 Carl Roth (Germany)
MTT reagent M5655 Sigma Aldrich (Germany)

MATERIALS AND METHODS
21
Penicillin/streptomycin A2210 Biochrom KG
Phosphatase Inhibitor Cocktail 2 P5726 Sigma-Aldrich (Germany)
Protease Inhibitor Cocktail
Tablets
S8820 Sigma-Aldrich (Germany)
Propidium Iodide (PI) P-1470 Sigma-Aldrich (Germany)
RPMI1640 31870 Thermo Fisher Scientific
(USA)
RNase A 19101 Qiagen (Germany)
Sodium dodecyl sulfate (SDS) L3771 Sigma-Aldrich (Germany)
Supersignal Ultra 34095 Thermo Fisher Scientific
(USA)
TEMED T9821 Sigma-Aldrich (Germany)
TGF-β1 100-21 Peprotech
TRIS 4855 Carl Roth (Germany)
Triton® X-100 T-9284 Sigma-Aldrich (Germany)
Trypsin/EDTA 10x T4174 Sigma-Aldrich (Germany)
Tween® 20 9127.2 Carl Roth (Germany)
2.1.3 Antibodies
Table 7. Primary antibodies used for immunoblotting
Antibody Company Cat. No. Predict molecular
weight
SOX9 Sigma Aldrich HPA001758 70kDa
Cytokeratin 19 Santa Cruz Biotechnology sc-6278 40kDa
EpCAM Abcam ab32392 39kDa
p21WAF1/Cip1 Sigma Aldrich P1484 21kDa
p27 Kip1 Cell Signaling Technology #2552 27kDa
p16 INK4A Cell Signaling Technology #4824 16kDa
p53 Cell Signaling Technology 9282S 53kDa
pERK1/2 Santa Cruz Biotechnology sc-7383 42/44kDa
ERK 1/2 Santa Cruz Biotechnology sc-135900 42/44kDa

MATERIALS AND METHODS
22
MRP4 Abcam ab15598 230kDa
pChk1(Ser345) Cell Signaling Technology 2341T 56kDa
Chk1 Cell Signaling Technology #2360 56kDa
pChk2(Thr68) Cell Signaling Technology #2661 62kDa
pEGFR Cell Signaling Technology #2234 175kDa
Bcl-xL Cell Signaling Technology 2764 30kDa
Bcl-2 Cell Signaling Technology 2870 26kDa
Cyclin D1 Cell Signaling Technology #2978 36kDa
E-Cadherin Cell Signaling Technology 3195S 135kDa
β-catenin Sigma C7207 92kDa
Vimentin Abcam ab20346 54kDa
N-cadherin Abcam ab12221 130kDa
Alpha-Tubulin Abcam ab4074 55kDa
GAPDH Santa Cruz Biotechnology sc25778 37kDa
Table 8. Primary antibodies used for immunohistochemistry
Antibody Species Company Cat. No. Dillution
SOX9 rabbit Sigma Aldrich HPA001758
1:100
Cytokeratin 19 mouse Santa Cruz Biotechnology
sc-6278 1:100
Table 9. Primary antibodies used for immunofluorescence
Antibody Species Company Cat. No. Dillution
β-catenin mouse Merck/Millipore 05-665 1:100
E-Cadherin rabbit Cell Signaling Techonogy 3195s 1:100

MATERIALS AND METHODS
23
Table 10. Secondary antibodies
Antibody Source Dilution
in WB
Dilution
in IHC
Dilution
in IF
Goat anti rabbit IgG HRP Santa Cruz 1:10000 ------ ------
Goat anti mouse IgG HRP Santa Cruz 1:10000 ------ ------
Goat anti rabbit IgG HRP DAKO ------ 1:200 ------
Goat anti mouse IgG HRP DAKO ------ 1:200 ------
Goat-anti-rabbit Rhodamine Merck/Millipore ------ ------ 1:200
Goat-anti-mouse FITC Merck/Millipore ------ ------ 1:200
2.1.4 Buffer preparation
Table 11. Buffer
Chemicals Ingredient
APS (for WB) 1g APS
add to 10ml ddH2O
Ladder (for WB) 950 µl Laemmli buffer
50 µl β-mercapto ethanol
RIPA buffer, stock 50 mM Tris-HCl pH 7.2-7.6
150 mM NaCl
2 mM EDTA
0.1 % SDS
0.5 % Sodium-Desoxycholate
1% Nonidet P-40
10% v/v Glycerol
Lysis buffer, ready to use (for WB) 90 µl RIPA buffer
1 µl Phosphatase Inhibitor
15 µl Protease Inhibitor
NL buffer 50mM Tris HCl pH 8.0
150mM NaCl,
1% NP-40
0.5% sodium deoxycholate
0.1% SDS

MATERIALS AND METHODS
24
1% glycerol
Lysis buffer (for caspase 3 activity) 50 mM HEPES
100 mM NaCl
0.1% CHAPS
1 mM DTT
0.1 mM EDTA pH 7.4
Reaction Buffer 50 mM HEPES
100 mM NaCl
0.1% CHAPS
10 mM DTT
0.1 mM EDTA
10% (w/v) glycerol pH 7.4
0.3% PBST
1% BSA
PBS, 1×
0.3 % Tween20
20mg BSA
20ml 0.3% PBST
TBS, 10× 24.23g 0.2M Tris PH7.5,
58.44g 1M NaCl,
add to 1L ddH2O
adjust pH value to 8.0
TG, 10x 30.27 g 0.2M Tris,
144g Glycine,
add to 1L ddH2O
Adjust pH value to 8.3
Transfer buffer 1×
Running buffer 1x
TBST
100ml TG 10×,
200ml methanol,
add to 1L ddH2O
100ml TG 10x
10ml 10%SDS
Add to 1L ddH2O
100ml TBS 10x
10ml 10%Tween 20
Add to 1L ddH2O
SF buffer 250mM Sucrose

MATERIALS AND METHODS
25
20mM HEPES pH7.4
1.5mM MgCl2
10mM KCl
1mM EDTA
1mM EGTA
2.1.5 Cell culture material
Table 12. Cell culture materials
Material Company
Cell culture flasks 25 cm2 / 75 cm2 / 175 cm2 Greiner Bio-one(Germany)
Cell scraper Falcon (Germany)
Conical centrifuge tubes 15 ml / 50 ml Falcon (Germany)
Cell culture plate 96 well (white) Greiner Bio-one (Germany)
Cell culture plate 96 well (flat bottom) Greiner Bio-one(Germany)
Cell culture plate 24 well Greiner Bio-one(Germany)
Cell culture plate 12 well Greiner Bio-one(Germany)
Cell culture plate 12 well (non-adherent) Greiner Bio-one(Germany)
Cell culture plate 6 well Greiner Bio-one(Germany)
0.5 or 1.5 ml tube Eppendorf, Germany
Eppendorf epT.I.P.S Eppendorf, Germany
Inserts with 8 μM pore size Falcon (Germany)
Microscope slide Carl Roth (Germany)
PCR-Tubes™ 0.2 m Life Technology (Germany)
Petri dishes Falcon (Germany)
Flow cytometry tubes Falcon (Germany)
Sterile pipette Greiner Bio-one(Germany)
2.1.6 Instruments and Software
Table 13. Instruments and Software
Instruments or softwares Company
BD FACS Canto II BD Becton Dickinson
(Germany)
Centrifugation Eppendorf (Germany)

MATERIALS AND METHODS
26
TCS SP2 Confocal microscope Leica (Germany)
FlowJo software 10.1 Tree Star (USA)
GraphPad Prism 5.0 GraphPad Software, Inc
(USA)
Immunofluoerscence optical microscopy Olympus (Germany)
Incubator for Cell culture Heraeus GmbH (Germany)
Infinite M200 Tecan
Inverted microscopy Zeiss (Germany)
Image J National institute of Health
Light microscope Leica (Germany)
Microwave oven Sharp (USA)
pH-Meter 538 Multical WTW (Germany)
Real-time PCR Biosystems
Weight balance Sartorius (Germany)
Western-Blot imaging system Chemismart 5100 PEQLAB (Germany)
2.2 Methods
2.2.1 Immunohistochemical staining
Protocol for immunohistochemistry
Tissue type: formalin-fixed, paraffin-embedded specimens
Note: Do not allow slides to dry at any time during this procedure.
Day1
Step1: Deparaffinization and rehydration
Incubate sections in 3 times xylene for 5 minutes each time (1)
Incubate sections in 1 time washes of 100% ethanol for 10 minutes (2)
Incubate sections in 1 time washes of 100% ethanol for 5 minutes (3)
Incubate sections in 1 time washes of 96% ethanol for 5 minutes (4)
Wash sections 2 times in PBS for 5 minutes each time (5)
Step2: Antigen Unmasking
Heat-induced epitope retrieval using a microwave with 1mM EDTA (Disodium salt)
solution, pH8.4
Total 10 min: 10 to15 seconds boiling
45 to 50 seconds waiting
Cool slides on bench to room temperature.

MATERIALS AND METHODS
27
Step3: Blocking
Wash sections in PBS 3x times for 10 minutes each time. (1)
Blocking: incubate sections in DAKO Blocking Peroxide for 30 minutes. (2)
Alternatively, wash the sections for 1 time with PBS, and then incubate sections in
0.3 %H2O2 for 15 minutes.
Step4: Staining primary antibody
Wash sections in PBS twice for 10 minutes each. (1)
Dilute the primary antibody to the indicated concentration (Table 8) and adds the (2)
diluted antibody to the sections.
Incubate sections overnight at 4°C. (3)
Day 2
Step5: Staining secondary antibody
Remove primary antibody and wash sections in PBS 3 times for 10 minutes each (1)
time.
Add corresponding secondary antibody diluted to the indicated concentration (2)
(Table 10) in PBS to each section and incubate for 45 minutes at room
temperature.
Remove secondary antibody and rinse sections 3 times with PBS for 10min. (3)
Step6: Staining to detect horse radish peroxidase (HRP)
Prepare DAB solution: add 10mg DAB in 15ml 50mM Tris (hydroxymethyl)-(1)
aminomethean solution (pH 7.6), and then filter the clumps.
Add 12µl H2O2 to the DAB solution to active DAB, and then add the activated (2)
DAB to each section and monitor staining under a microscope.
Note: Let the sections develop 10 minutes but do not exceed 10 minutes and
immerse slides in ddH2O.
Counterstain sections in hematoxylin for 10 to 30 seconds. (3)
Wash sections using tap water for 10 minutes. (4)
Step7: Dehydrate sections
Incubate sections in 95% ethanol 2 times for 10 seconds each time. (1)
Repeat in 100% ethanol, incubating sections two times for 10 seconds each time. (2)
Repeat in xylene, incubating sections two times for 10 seconds each time. (3)
Mounted the sections with malinol mounting medium. (4)
Step8: Record the staining results using Leica upright research microscope

MATERIALS AND METHODS
28
2.2.2 Immunohistochemistry evaluation
Immunostaining results for SOX9 were scored semi-quantitatively based on the
intensity score and proportion score of positively stained tumor cell nuclei. In detail,
the intensity score of SOX9 nuclear staining was defined as four grades: 0, negative;
1, weak with color yellow; 2, middle with color brown; 3, strong with color black. The
number of SOX9 positive cell nuclei was defined as 6 grades: 0, no positive cells; 1,
positive cells: ≤ 1%; 2, 1% < positive cells ≤ 10%; 3, 11% < positive cells ≤ 33%; 4,
34% < positive cells ≤ 66%; 5, 66% < positive cells. The final immune staining
scores were calculated as number intensity by multiplying the intensity score and
proportion score. The samples with final scores over 10 were identified as high SOX9
expression, and the others were identified as low SOX9 expression. The
representative pictures of SOX9 staining and for semi-quantitative scoring system are
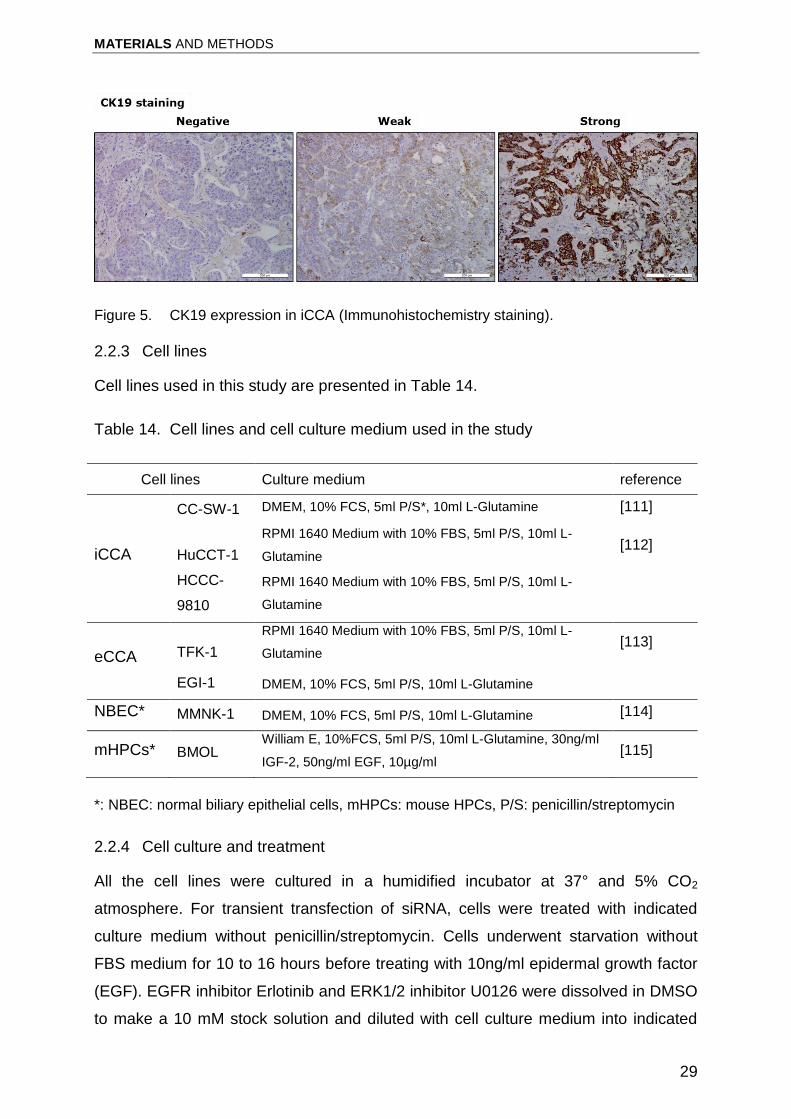
presented in Figure 4. CK19 expression was categorized into high expression and
low expression according to the immunoreactivity (Figure5).
Figure 4. A semi-quantitative scoring system for evaluation of SOX9 expression in
intrahepatic cholangiocarcinoma. Representative images show the intensity and proportion
scores of the positively stained tumor cell nuclei for the evaluation of SOX9 expression in
iCCA.
MATERIALS AND METHODS
29
Figure 5. CK19 expression in iCCA (Immunohistochemistry staining).
2.2.3 Cell lines
Cell lines used in this study are presented in Table 14.
Table 14. Cell lines and cell culture medium used in the study
Cell lines Culture medium reference
iCCA
CC-SW-1 DMEM, 10% FCS, 5ml P/S*, 10ml L-Glutamine [111]
HuCCT-1
RPMI 1640 Medium with 10% FBS, 5ml P/S, 10ml L-
Glutamine [112]
HCCC-
9810
RPMI 1640 Medium with 10% FBS, 5ml P/S, 10ml L-
Glutamine
eCCA TFK-1
RPMI 1640 Medium with 10% FBS, 5ml P/S, 10ml L-
Glutamine [113]
EGI-1 DMEM, 10% FCS, 5ml P/S, 10ml L-Glutamine
NBEC* MMNK-1 DMEM, 10% FCS, 5ml P/S, 10ml L-Glutamine [114]
mHPCs* BMOL William E, 10%FCS, 5ml P/S, 10ml L-Glutamine, 30ng/ml
IGF-2, 50ng/ml EGF, 10µg/ml [115]
*: NBEC: normal biliary epithelial cells, mHPCs: mouse HPCs, P/S: penicillin/streptomycin
2.2.4 Cell culture and treatment
All the cell lines were cultured in a humidified incubator at 37° and 5% CO2
atmosphere. For transient transfection of siRNA, cells were treated with indicated
culture medium without penicillin/streptomycin. Cells underwent starvation without
FBS medium for 10 to 16 hours before treating with 10ng/ml epidermal growth factor
(EGF). EGFR inhibitor Erlotinib and ERK1/2 inhibitor U0126 were dissolved in DMSO
to make a 10 mM stock solution and diluted with cell culture medium into indicated

MATERIALS AND METHODS
30
concentration during treatment. 0.1% DMSO was diluted in the same manner as
control. Gemcitabine was provided by Prof. Lu LG (Shanghai Jiao Tong University
School of Medicine) was dissolved in phosphate-buffered saline to make a 100mM
stock solution and diluted with cell culture medium into indicated concentration during
treatment.
2.2.5 RNA interference (RNAi) of SOX9
Pooled small interfering RNA (siRNA) targeting human and mouse SOX9 were
purchased from Dharmacon (human M-021507-00).
Protocol for SOX9 siRNA transfection
Day1: Seeding cells for transfection
Tumor cells were plated at a density of 1.5 × 10⁵ cells per well with 2ml
corresponding growth medium in a six-well cell culture vessels.
Day2:
For SOX9 siRNA transfection
Step1: Prepare RNA-lipid complexes
Dilute RNAiMAX reagent in Opti-MEM medium by adding 1.5 μl RNAiMAX into (1)
100 μl Opti-MEM medium in tube A.
Dilute siRNA in Opti-MEM medium by adding 20 pmol SOX9 siRNA into 100 μl (2)
Opti-MEM medium in tube B.
Add diluted siRNA to diluted RNAiMAX reagent with a ratio of 1 to 1. Then, (3)
incubate the mixture for 20 minutes at room temperature.
Step2: Change the culture medium to 500 µl Opti-MEM medium per well. Then, add
RNA-lipid complexes to cells. 6 hours later, change the Opti-MEM medium to 2 ml
cell culture medium. RNA and whole cell protein were extracted 48 hours and 60
hours after transfection for measuring knockdown and overexpression efficiency.
2.2.6 Whole cell protein extraction
Wash the cells twice with ice-cold PBS and immediately add 70 μl RIPA buffer to per
well of 6-well plate and put on ice. Thereafter, scrape the cells to collect lysate and
transfer to a 1.5 ml Eppendorf tube. Subsequently, centrifuge at 13000rpm at 4 °C for
5 minutes. Collect the supernatant in a fresh 1.5 ml Eppendorf tube.

MATERIALS AND METHODS
31
2.2.7 Cell Subcellular fractionation
Cell subcellular fractionation was performed following the protocol by Huang et al
[116]. The following is a modified protocol from Huang et al reported.
Protocol of cell subcellular fraction
Step1: Extraction of the whole cell protein
Wash the cells twice with ice-cold PBS. Then, immediately add 150 μl SF buffer to
per well of 6-well plate and put on ice. Thereafter, scrape the cells to collect lysate
and transfer to a 1.5 ml Eppendorf tube. Agitate cell lysates at 4 °C for 30 minutes at
50 rpm on a tube roller. Subsequently, centrifuge at 720 g at 4 °C for 5 minutes.
Collect the supernatant in a fresh 1.5 ml Eppendorf tube for next step3.
Step2: Extract the nuclear fraction
Wash the pellet from step1 with 300μl of SF buffer and disperse the pellet with a
pipette. Then, centrifuge the lysate at 720 g at 4°C for 10 minutes. Thereafter, re-
suspend the pellet in NL buffer and agitated at 4 °C for 30 minutes at 50 rpm on a
tube roller. This is the nuclear fraction including nuclear membranes.
Step3: Extract the cytosolic and membrane fraction
Centrifuge the supernatant from step1 at 10.000 x g at 4°C for 10 minutes. Carefully
transfer the supernatant to a new 1.5 ml Eppendorf tube. This is the cytosolic and
membrane fraction.
2.2.8 Protein concentration determination
Protein concentrations were assessed with a Bio-Rad protein assay. After harvesting
protein lysates, 20 µl Reagent S diluted with Reagent A (1:50) were added into a 96
well plate followed by 2 µl of each sample and mixed with 200µl reagent B. The plate
was incubated for 10 minutes at room temperature on the shaker. Then, the
concentrations of samples were quantified by Infinite M200 at 595nm. A standard
curve was produced by quantifying BSA samples of standard concentration (0.125,
0.25, 0.5, 1, 1.5, 2 mg/ml).
2.2.9 Immunoblotting
20μg of total cell protein extracts were subjected to 10% or 12% sodium dodecyl
sulfate polyacrylamide electrophoresis (SDS-PAGE) gel and transferred to
nitrocellulose membranes. 5% BSA in Tris-buffered saline with Tween 20 (TBST)
was used to block nonspecific binding. Membranes were probed with primary and

MATERIALS AND METHODS
32
secondary antibodies in TBST according to manufacturer’s instructions. HRP-linked
anti-mouse, anti-rat and anti-rabbit antibodies were used as secondary antibodies.
Alpha-tubulin and GAPDH were used as loading control. Signal was visualized by
incubating the blots in Supersignal Ultra (Pierce, Hamburg, Germany).
2.2.10 MTT assay
After knockdown of SOX9 expression, cells were treated with 0.25% trypsin to make
single cell suspension and re-plated in a 96-well plate at a density of 2.0 × 10³ cells
per well with 100µl growth medium. 2 days after the cells attachment, cells were
incubated with 5mg/ml MTT reagent for 5h. Then, the supernatant was removed
carefully and 100µl solvent solution containing 40% of 10% SDS, 40% DMSO and
20% Acetate acid solution (600µl Acetate acid/50mL PBS) was added and incubated
overnight for measurement. Absorbance was measured at 570nm with a reference to
630 nm. For proliferation assay, cells were incubated in 96-well plate for 48 hours
before incubation with MTT. For gemcitabine IC50 measurement, cells were
incubated for 6 h for attachment. Then, cells were treated with serial concentrations
of gemcitabine for 48 hours before incubating with MTT.
2.2.11 Cell cycle analysis
Cells were harvested at 48 hours after siRNA treatment and washed with cold PBS,
then fixed with 70% cold ethanol. The cells were re-suspended in solution containing
TritonX-100 (0.1%) and 100µg/ml RNase to remove RNA. The samples were stained
with propidium iodide (20μg/mL) for 30 minutes in the dark, and then subjected to
analysis for DNA content using FACS Calibur (BD Biosciences, Heidelberg,
Germany) and data analysis was performed using Flowjo version10 software.
2.2.12 Transwell migration assay
Cell culture inserts with 8μM pore size (Falcon) were used. For tumor cell migration,
2.0× 10⁵ CCA tumor cells were suspended in RPMI 1640 or DMEM medium with
0.5% FBS and plated in the upper chambers. The lower chambers were filled RPMI
1640 or DMEM with 10% FBS. After 16 h, the medium in the inserts were removed
and washed with PBS. The inserts were filled with 3.7% formaldehyde for 5 minutes.
Subsequently, incubate the inserts in methanol for 30 minutes. The filters were
stained with 10% Gimsa (Sigma, St. Louis, MO) for 15 minutes. The inner side was

MATERIALS AND METHODS
33
wiped with cotton swaps. The migrated cells were count under an inversed
microscope.
2.2.13 Caspase 3 assay
Caspase 3 assay was performed as previously described [117]. In detail, after wash
the cells with ice-cold PBS, immediately add 70 µl Caspase 3 lysis buffer to per well
of 6-well plate and put on ice. Lysates were collected by cell scraper and put into
1.5ml tube followed by centrifugation at 13000rpm for 10min at 4°C. Supernatant in
each tube was collected into a new 1.5ml tube and stored at -20°C until use. Then,
20 µl cell extracts were added to 70µl Caspase 3 reaction buffer and 10 µl AC-
DEVD-AFC caspase 3 fluorimetric substrate (Biomol, Hamburg, Germany) in a white
96-well plate. Then, the plate was incubated for 90 minutes at dark. Subsequently,
Caspase 3 activity was detected by fluorometric measurement using Tecan infinite
M200 (excitation 400 nm; emission 505 nm). Protein concentrations of the cell
extracts were measured by Bio-Rad protein assay as mention in protein
concentration determination. The caspase3 activity was normalized with the
absorbance intensity dividing the protein concentration and expressed as relative
fluorescent units (RFU) per minute per mg protein.
2.2.14 Tumor sphere formation assay
The protocol used for tumor sphere formation culture was as previously described
with modification [118]. 12 hours after SOX9 knockdown, cells were washed with
PBS and treated with 0.25% trypsin7 EDTA to make single cell suspension. Then,
cells were suspended in serum-free DMEM/F12 containing 10% BIT 9500 and 2mM
L-glutamine supplied with 10ng/ml human recombinant epidermal growth factor
(EGF), 10ng/ml human recombinant basic fibroblast growth factor (FGF-2) and 1%
penicillin-streptomycin. Thereafter, culture the cells in non-adherent 12-well plates at
a density of 1 × 10⁴/ml pre well. After 10 days incubation, tumorsphere numbers are
counted under a Leica phase-contrast microscope using the 20x magnification lens.
Tumor spheres bigger than 100 µm are considered as positive.
2.2.15 RNA isolation and RNA concentration determination
Total cell RNA was extracted using the InviTrap spin universal RNA mini kit (Stratec,
Berlin, Germany), according to the manufacturer’s instruction.

MATERIALS AND METHODS
34
Protocol for RNA isolation modified from the Instruction for the InviTrap® Spin
Universal RNA Mini Kit
Step1: Cell disruption
Wash the cells twice with ice-cold PBS. Then, immediately add 300μl β-
mercaptoethanol-containing lysis solution TR to per well of 6-well plate. Thereafter,
scrape the cells to collect lysate and transfer to a 1.5 ml Eppendorf tube and stored
at -80°C until use.
Step2: Binding of genomic DNA to the DNA-Binding Spin Filter
Pipet the lysate resulting from step1 directly onto the DNA-Binding Spin Filter placed
in a 2 ml Receiver Tube. Incubate the sample for 1 min and centrifuge at 13.000rpm
for 2 minutes. Discard the DNA-Binding Spin Filter.
Step3: Adjust RNA binding conditions
Add 250μl 70 % ethanol to the RNA containing lysate and mix thoroughly by pipetting
up and down.
Step4: Binding of the total RNA to the RNA-RTA Spin Filter
Pipet the sample from step 3 onto a RNA-RTA Spin Filter and incubate for 1 min and
centrifuge at 13.000rpm for 1 minute. Discard the flow-through.
Step5: 2 times wash of the RNA-RTA Spin Filter
Add 600μl Wash Buffer R1 onto the RNA-RTA Spin Filter and centrifuge for 1 min at
13.000rpm. Discard the flow-through. Then Add 700 μl Wash Buffer R2 onto the
RNA-RTA Spin Filter and centrifuge for 1 min at 13.000rpm. Discard the flow-
through. Drying of the RNA-RTA Spin Filter membrane to eliminate any trace of
ethanol by centrifuging for 4 min at maximum speed.
Step6: Elution of total RNA
Transfer the RNA-RTA Spin Filter into a RNase-free Elution Tube and pipet 40μl of
Elution Buffer R directly onto the membrane of the RNA-RTA Spin Filter. Incubate for
2 min and centrifuge for 1 min at 13.000rpm. Discard the RNA-RTA Spin Filter and
place the eluted total RNA immediately on ice.
Step7: RNA concentration determination
RNA concentration was photometric determined by measuring the RNA solution in a
nanocrystalline plate at 260nm with Tecan infinite M200.

MATERIALS AND METHODS
35
2.2.16 Quantitative real-time reverse transcription polymerase chain reaction
For first strand cDNA synthesis, reverse transcription of 500ng RNA was performed
with random primer (Thermo Scientific) and RevertAid H Minus M-MuLV reverse
transcriptase (Thermo Scientific) according to the manufacturer’s instructions and
subsequently diluted with nuclease-free water (Invitrogen) to 10ng/µl cDNA. For PCR
amplification, 10.4µl mixtures contained 5µl (50ng) template cDNA, 5µl SYBR Green
(4367659, Life Technologies), and 4µM forward and reverse primer PCRs were run
in triplicate and performed on a StepOnePlus Real-time PCR (Applied Biosystems).
PCR amplification cycling conditions comprised 10 min polymerase activation at 95
°C and 40 cycles at 95°C for 15s and 60°C for 1 min. A melting curve analysis was
performed for each PCR analysis. Relative quantification of target genes was
normalized against the house keeping gene PPIA. The reverse and forward primers
used for the current study are listed in Table 15.
Table 15. Primers used for qRT-PCR in this study
Primer Forward Reverse
SOX9 AGCGCCCCCACTTTTGCTCTTT CCGCGGCGAGCACTTAGGAAG
EpCAM AATCGTCAATGCCAGTGTACTT TCTCATCGCAGTCAGGATCATAA
ABCB1 AAATTGGCTTGACAAGTTGTATATGG CACCAGCATCATGAGAGGAAGTC
ABCG2 TCATCAGCCTCGATATTCCATCT GGCCCGTGGAACATAAGTCTT
ABCC6 TTGGATTCGCCCTCATAGTC GGTAGCTGGCAAGACAAAGC
PPIA AGGGTTCCTGCTTTCACAGA CAGGACCCGTATGCTTTAGG
2.2.17 Microarray analyses and Gene set enrichment analysis (GSEA)
Total RNA from cell cultures were isolated as described in RNA isolation. Total RNA
(10 μg) from samples was tested for quality using an Agilent 2100 Bioanalyzer Chip,
reverse transcribed. Gene expression profiling was performed using arrays of human
HuGene-2-0-st-type from Affymetrix. The following protocol was kindly provided by
Dr. Carolina De La Torre in Zentrum für Medizinische Forschung of Medical Faculty
of Mannheim of Heidelberg University. In detail, biotinylated antisense cDNA was
then prepared according to the Affymetrix standard labelling protocol with the
GeneChip® WT Plus Reagent Kit and the GeneChip® Hybridization, Wash and Stain

MATERIALS AND METHODS
36
Kit (both from Affymetrix, Santa Clara, USA). Afterwards, the hybridization on the
chip was performed on a GeneChip Hybridization oven 640, then dyed in the
GeneChip Fluidics Station 450 and thereafter scanned with a GeneChip Scanner
3000. All of the equipment used is from the Affymetrix-Company (Affymetrix, High
Wycombe, UK). A Custom CDF Version 21 with ENTREZ based gene definitions was
used to annotate the arrays. The Raw fluorescence intensity values were normalized
applying quantile normalization and RMA background correction. OneWay-ANOVA
was performed to identify differential expressed genes using a commercial software
package SAS JMP10 Genomics, version 6, from SAS (SAS Institute, Cary, NC,
USA). A false positive rate of a=0.05 with FDR correction was taken as the level of
significance.
Integrated analysis of gene expression signatures of CCA patients was performed on
a dataset GSE26566 from Andersen JB et al [86], which is a publicly available gene
expression dataset from Gene Expression Omnibus (GEO). GSEA was performed
using the Broad Institute platform (http://software.broadinstitute.org) [119]. Samples
were analyzed with weighted, t-test default settings. The GSE26566 dataset included
transcriptomes of 104 freshly-frozen tumor tissues and normal biliary epithelial cells
from 6 non-tumor patients. Differential expressed genes identified if the fold change
was greater than 2 (up or down) in comparison to control group. Gene sets with a
false discovery rate (FDR) value < 0.25 after performing 1000 permutations were
considered to be significantly enriched.
2.2.18 Statistical analyses
Data were analyzed using the GraphPad Prism built-in tests. Variables were
summarized as means ± standard deviation (SD) and depicted graphically as means
± SD. P values were calculated using the chi-square test or calculated using a two-
sided Student’s t test. Kaplan-Meier survival analysis was used to evaluate overall
survival rates and disease free survival rate of iCCA patients. P values were
calculated using the log-rank test. P< 0.05 was considered significant.

RESULTS
37
3 RESULTS
3.1 Clinical significance of SOX9
3.1.1 SOX9 expression in chronic liver disease
Firstly, SOX9 expression was examined in 21 patients with chronic liver disease.
Immunohistochemistry analyses reveal that in 17 specimens, SOX9 is expressed in
the nuclei of biliary cells, as located in canals of Hering, reactive ductules and bile
ducts (Patients 2, 3 and 4, Figure 6), whereas 4 patients show negative SOX9
immunoreactivity (Patient 1, Figure 6).
Figure 6. Expression of SOX9 in chronic liver disease (Immunohistochemical staining).
Patient 1 (Pat.1) shows negative SOX9 expression in biliary epithelial cells. Patient (Pat.) 2,
3 and 4 show strong expression of SOX9 in the nucleus of the canals of Hering, reactive
ductules and bile duct cells.

RESULTS
38
3.1.2 SOX9 expression in iCCA
Next, I examined expression of SOX9 and CK19, another cholangiocyte marker, in
paired liver tissue specimens of 69 iCCA patients (tumor surrounding tissue vs.
tumor) and 5 eCCA patients by immunohistochemistry. Both, SOX9 and CK19 are
markers of cholangiocytes, however localize at different cellular compartments.
SOX9 is expressed in the nuclei of cholangiocytes, while CK19 localizes in cytoplasm
and membranes. As in chronic liver disease, nuclear immunoreactivity of SOX9 is
either positive or negative in the cholangiocytes surrounding CCA tumors (Figure 7,
left panel). In contrast to such more heterogeneous pattern for SOX9, all
cholangiocytes in the CCA tumor surroundings express CK19 (Figure 7, right
panel).
In iCCA tumor tissue, 27% patients highly express SOX9, while 37% patients express
high levels of CK19. Taking into account intensity of immunoreactivity, four different
patterns of SOX9 and CK19 expression are defined in iCCA cancer cells, that is
SOX9highCK19high, SOX9highCK19low, SOX9lowCK19high and SOX9lowCK19low (Figure
8). Statistically, expression of SOX9 and CK19 in iCCA tumor cells are positively
associated (P < 0.05, Table 16). From 5 eCCA patients, 4 highly expressed SOX9
(Figure 9). In all examined tissue specimens, neither SOX9 nor CK19 are detected in
hepatocytes.
Figure 7. Expressions of SOX9 and CK19 in CCA tumor surrounding tissue
(Immunohistochemical staining).

RESULTS
39
Figure 8. Expression patterns of SOX9 and CK19 in iCCA tumor tissue
(Immunohistochemical staining). According to the immunoreaction intensity for SOX9 and
CK19, four expression patterns of SOX9 and CK19 were defined: SOX9highCK19high,
SOX9highCK19low, SOX9lowCK19high and SOX9lowCK19low.
Figure 9. Expression of SOX9 in eCCA (Immunohistochemical staining). Patient 1 (Pat.1)
is negative for SOX9 expression. Patients 2 and 3 show strong SOX9 staining in the nuclei of
tumor cells.

RESULTS
40
Table 16. Correlation of SOX9 and CK19 expression in iCCA
CK19 expression
SOX9 expression No. of
patients P value
high low
high 15 11 26 0.033
low 35 8 43
3.1.3 CCA patients with high SOX9 expression have poor clinical outcome
Then, I analyzed the relationship between SOX9 or CK19 expression and the clinical
outcome for the patients, including clinical parameters and patients’ survival time.
Table 17 shows that SOX9 expression is not associated with the indicated clinical
parameters, whereas CK19 expression is associated with lymph node involvement
and the AJCC stage of iCCA (Table 18). Kaplan-Meier analysis and log-rank test
showed that patients with high SOX9 expression had shorter overall survival (OS)
and disease free survival (DFS) rates than those with low SOX9 expression (P < 0.01
and P < 0.05, Figure 10A and B). There is no significant association between CK19
expression and the OS of the patients (P > 0.05, Figure 10C). Patients with CK19
high expression show shorter DFS rate in comparison to those with CK19 low
expression, although this is without a statistical difference (P = 0.0575, Figure 10D).
Median OS and DFS times of the patients in correlation to SOX9 and CK19
expression are presented in Tables 19 and 20. The results reveal that patients with
high SOX9 expression display shorter median OS time (22 months) than those with
high CK19 expression (26 months), whereas both presented with the same median
DFS time (9 months).
In the presented study, 9 iCCA patients received chemotherapy. SOX9 and CK19
expression, treatment approaches and clinical outcome of these patients are
presented in Table 21. Kaplan-Meier analysis and log-rank test show that SOX9 high
expression patients, who received chemotherapy, had shorter OS rates in
comparison to those with low SOX9 expression (P=0.0171, Figure 11). There is no
significant difference in OS rates between CK19 high and low expression patients
(P=0.6815, Figure 12). Median OS times of the two groups of patients, who received

RESULTS
41
chemotherapy, are 22 and 62 months, respectively (Table 22). These results suggest
that patients with low SOX9 expression are more sensitive to chemotherapy.
Table 17. Patient characteristics and tumor parameters in relation to SOX9
expression in iCCA
Clinicopathological parameters
SOX9 expression No. of the
patients per group
P value low expression
(n=50) high expression
(n=19)
Age(year) 64.08±9.24 60.42±10.29 69 0.194
<60 14 8 22 0.261
≥60 36 11 47
Gender
0.296
Male 33 15 48
Female 17 4 21
Tumor extension
0.447
T1 19 9 28
T2 19 6 25
T3 12 2 14
Lymph node involvement
0.219
Yes 12 2 14
No 36 16 52
Metastasis
0.079
Yes 7 0 7
No 39 18 57
Differentiation grade
G1 5 1 6 0.634
G2 18 9 27
G3 10 3 13
Vascular invasion
0.247
Yes 6 4 10
No 41 12 53
Satellite nodules
0.502
Yes 16 4 20
No 31 12 43
Cirrhosis
0.318
Yes 11 6 17
No 34 10 44
AJCC classification
0.135
I+II 28 13 41
II+III 22 4 26

RESULTS
42
Table 18. Patient characteristics and tumor parameters in relation to CK19
expression in iCCA
Clinicopathological parameters
CK19 expression No. of the
patients per group
P value low expression
(n=43) high expression
(n=26)
Age(year) 64.77±9.17 60.27±9.84 69 0.060
<60 11 11 22 0.149
≥60 32 15 47
Gender 0.260
Male 32 16 48
Female 11 10 21
Tumor extension
0.394
T1 20 8 28
T2 16 9 25
T3 7 7 14
Lymph node involvement
0.022
Yes 5 9 14
No 36 16 52
Metastasis
0.695
Yes 5 2 7
No 34 23 57
Differentiation grade
0.088
G1 6 0 6
G2 14 13 27
G3 7 6 13
Vascular invasion
0.722
Yes 7 3 10
No 34 19 53
Satellite nodules
0.799
Yes 16 4 20
No 31 12 43
Cirrhosis
0.929
Yes 11 6 17
No 29 15 44
AJCC classification
0.014
I+II 31 10 41
II+III 12 14 26

RESULTS
43
Figure 10. Kaplan-Meier survival curves of iCCA patients in relation to SOX9 and CK19
expression.
Table 19. Median overall survival time of iCCA patients in relation to SOX9 and
CK19 expression
Staining and
expression
Median survival time (months)
Overall survival HR (95% CI) P
SOX9 Low 52.0 0.2362 (0.085 to 0.656) 0.0056
High 22.0
CK19 Low 38.3 0.6425 (0.291 to 1.417) 0.2728
High 26.0

RESULTS
44
Table 20. Median disease free survival time of iCCA patients in relation to SOX9 and
CK19 expression
Staining and
expression
Median survival time (months)
Disease free survival HR (95% CI) P
SOX9 Low 19.3 0.3820(0.163 to 0.893) 0.0263
High 9
CK19 Low 13.9 0.4968(0.241 to 1.023) 0.0575
High 9
Table 21. SOX9 and CK19 expression and clinical outcome of iCCA patients
receiving chemotherapy
SOX9 IHC intensity
CK19 IHC intensity
Death or survival
(1=survival, 0=death)
Survival time
(months)
Treatment
low low 0 23 Gemcitabine plus
XELOX
low strong 0 62 Gemcitabine plus
Cisplatin plus XELOX
low strong 1 33 Gemcitabine
low low 1 36 Palliative chemotherapy
low strong 1 57 Cisplatin plus
Gemcitabine
low low 1 51 Palliative chemotherapy
strong strong 0 14 Erlotinib
strong strong 0 22 Gemcitabine plus
Cisplatin
strong strong 0 41 Palliative chemotherapy
XELOC: Capecitabine plus Oxaliplatin.

RESULTS
45
Figure 11. Kaplan-Meier survival curve of iCCA patients having received chemotherapy in
relation to SOX9 expression.
Figure 12. Kaplan-Meier survival curve of iCCA patients having received chemotherapy in
relation to CK19 expression.
Table 22. Median overall survival times of patients having received chemotherapy
SOX9 expression Median survival time HR (95% CI) P
SOX9 Low 62.0 0.06 (0.006 to 0.605) 0.0171
High 22.0

RESULTS
46
3.1.4 Integrated analysis of CCA patients gene expression signatures
To comprehensively elucidate the role of SOX9 in CCA patients, several approaches
were set up. First, an integrated analysis of gene expression signatures was
performed with the CCA patient dataset GSE26566, which is publicly available from
Gene Expression Omnibus (GEO) that included transcriptomes of 104 freshly-frozen
CCA tumor tissues and “normal” primary biliary epithelial cells isolated from 6 non-
tumor patients. SOX9 is significantly highly expressed in CCA tumor cells as
compared to normal biliary epithelial cells (Figure 13A and B). We next categorized
the 104 CCA patients into SOX9 high (n=66) and SOX9 (n=38) low expression
groups, based on SOX9 mRNA expression levels being above or below 2 fold of the
average SOX9 expression in normal NBEC (Figure 13B).
Subsequently, I performed GSEA to define the CCA related Kyoto Encyclopedia of
Genes and Genomes (KEGG) pathways related to SOX9 expression Tables 23 and
24 (P<0.05 and FDR<0.25). The most significantly enriched pathways in CCA with
high SOX9 expression are DNA damage repair, more specifically homologous
recombination and mismatch repair, DNA replication, base excision repair, nucleotide
excision repair and cell cycle (Figure 13C). SOX9 high expression tumors also
presented with upregulated epithelial junction genes, such as adherens, tight junction
and actin cytoskeleton. Additionally, genes associated with Notch, Wnt and mTOR
signalings are enriched in the SOX9 high expression patients group. Patients with
low SOX9 expression displayed gene signatures associated with drug metabolism
pathways, including cytochromes P450 as well as other drug metabolism enzymes
(Figure 13D). In summary, the results imply that SOX9 expression in CCA is
associated with DNA damage repair, the formation of tight junction and drug
metabolism.

RESULTS
47
Figure 13. Integrated analyses of CCA patients gene expression signatures related to SOX9
expression. A. Expression of SOX9 is higher in CCA tumor tissues as compared to normal
biliary epithelial cells (NBEC). B. CCA patients were categorized into SOX9 high (Class A)
and SOX9 low (Class B) expression groups according to the SOX9 mRNA expression in
CCA. The cutoff value for categorizing the patients was set as 2 fold of average mRNA
expression of SOX9 in NBECs. C. GSEA showing enrichment of gene signatures associated
with, among others, homologous recombination, mismatch repair, DNA replication, base
excision repair and cell cycle in CCA patients with high SOX9 expression. D. Significantly
enriched gene signatures in SOX9 low CCA patients comprise especially drug metabolism
enzymes. NES: normalized enrichment score. FDR: false discovery rate.

RESULTS
48
Table 23. GSEA of KEGG pathway ranked by a positive correlation with SOX9
expression in CCA patients (P<0.05, FDR<0.25)
Name NES NOM p-val FDR q-val
CELL_CYCLE 2.21 0.000 0.000
NOTCH_SIGNALING_PATHWAY 2.18 0.000 0.000
RIBOSOME 2.15 0.000 0.000
DNA_REPLICATION 2.12 0.000 0.000
SPLICEOSOME 2.07 0.000 0.000
VASOPRESSIN_REGULATED_WATER_REABSORPTION 2.02 0.000 0.001
HOMOLOGOUS_RECOMBINATION 1.98 0.000 0.001
ALDOSTERONE_REGULATED_SODIUM_REABSORPTION 1.95 0.000 0.001
VIBRIO_CHOLERAE_INFECTION 1.94 0.000 0.002
GLYCOSYLPHOSPHATIDYLINOSITOL_GPI_ANCHOR_BIOSYNTHESIS
1.88 0.000 0.002
PYRIMIDINE_METABOLISM 1.87 0.000 0.002
BASE_EXCISION_REPAIR 1.85 0.000 0.003
MISMATCH_REPAIR 1.83 0.014 0.003
OOCYTE_MEIOSIS 1.77 0.000 0.006
AMINOACYL_TRNA_BIOSYNTHESIS 1.66 0.000 0.025
ENDOCYTOSIS 1.61 0.000 0.040
TIGHT_JUNCTION 1.58 0.000 0.052
RNA_POLYMERASE 1.57 0.006 0.051
PHOSPHATIDYLINOSITOL_SIGNALING_SYSTEM 1.56 0.000 0.053
GLYCOSPHINGOLIPID_BIOSYNTHESIS_LACTO_AND_NEOLACTO_SERIES
1.55 0.007 0.057
NUCLEOTIDE_EXCISION_REPAIR 1.55 0.010 0.055
PURINE_METABOLISM 1.50 0.007 0.088
ADHERENS_JUNCTION 1.45 0.011 0.123
PROGESTERONE_MEDIATED_OOCYTE_MATURATION 1.44 0.004 0.127
CARDIAC_MUSCLE_CONTRACTION 1.44 0.030 0.123
PATHOGENIC_ESCHERICHIA_COLI_INFECTION 1.44 0.039 0.122
MTOR_SIGNALING_PATHWAY 1.44 0.033 0.119
ERBB_SIGNALING_PATHWAY 1.41 0.018 0.143
REGULATION_OF_ACTIN_CYTOSKELETON 1.40 0.007 0.152
UBIQUITIN_MEDIATED_PROTEOLYSIS 1.38 0.011 0.158
FC_GAMMA_R_MEDIATED_PHAGOCYTOSIS 1.38 0.000 0.154
RENAL_CELL_CARCINOMA 1.35 0.021 0.187
WNT_SIGNALING_PATHWAY 1.30 0.049 0.240

RESULTS
49
Table 24. GSEA of KEGG pathways ranked by negative correlation with SOX9
expression in CCA patients (P<0.05, FDR<0.25)
Name NES NOM p-val FDR q-val
PPAR_SIGNALING_PATHWAY 1.92 0.003 0.041
LINOLEIC_ACID_METABOLISM 1.86 0.003 0.046
RETINOL_METABOLISM 1.74 0.014 0.120
FATTY_ACID_METABOLISM 1.73 0.001 0.108
COMPLEMENT_AND_COAGULATION_CASCADES 1.68 0.007 0.141
ALANINE_ASPARTATE_AND_GLUTAMATE_METABOLISM 1.67 0.021 0.138
TRYPTOPHAN_METABOLISM 1.67 0.006 0.125
PRIMARY_BILE_ACID_BIOSYNTHESIS 1.66 0.003 0.120
STEROID_HORMONE_BIOSYNTHESIS 1.64 0.038 0.124
PEROXISOME 1.64 0.019 0.115
DRUG_METABOLISM_CYTOCHROME_P450 1.63 0.033 0.106
PENTOSE_AND_GLUCURONATE_INTERCONVERSIONS 1.62 0.027 0.109
GLYCINE_SERINE_AND_THREONINE_METABOLISM 1.62 0.008 0.102
VALINE_LEUCINE_AND_ISOLEUCINE_DEGRADATION 1.60 0.011 0.116
METABOLISM_OF_XENOBIOTICS_BY_CYTOCHROME_P450 1.56 0.046 0.150
PROPANOATE_METABOLISM 1.56 0.012 0.144
ASCORBATE_AND_ALDARATE_METABOLISM 1.55 0.014 0.146
DRUG_METABOLISM_OTHER_ENZYMES 1.51 0.047 0.187
PRION_DISEASES 1.50 0.031 0.189
STARCH_AND_SUCROSE_METABOLISM 1.50 0.033 0.179
BETA_ALANINE_METABOLISM 1.49 0.032 0.185
BUTANOATE_METABOLISM 1.49 0.047 0.178
TYROSINE_METABOLISM 1.46 0.038 0.213

RESULTS
50
3.2 Investigating SOX9 function in CCA tumorigenesis and chemotherapy in vitro
3.2.1 SOX9 is highly expressed in CCA cell lines
SOX9 and CK19 protein expression were examined in CCA cell lines CC-SW-1,
HuCCT-1, HCCC-9810, EGI-1 and TFK-1, as well as in the normal biliary epithelial
cell line MMNK-1 using immunoblotting. Both SOX9 and CK19 is highly expressed in
CCA cells in comparison to MMNK-1 (Figure 14).
Figure 14. Expression of SOX9 and CK19 in CCA cell lines and normal biliary epithelia cell
line MMNK-1 (immunoblot, Tubulin was used as loading control).
3.2.2 Comparative microarray analysis of parental and SOX9 depleted CC-SW-1 cells
In a second approach to position SOX9 in the cellular fate of CCA tumors, small
interfering RNAs were used to knock down SOX9 expression in the above CC-SW-1
cells. SOX9 mRNA depletion was confirmed by immunoblot showing a significantly
reduced signal after treating the cells with SOX9 siRNA for 48 hours (Figure 15). In
this stage, I purified the mRNA from knock down and control cells and a microarray
analysis was performed to evaluate the respective gene expression signatures.
Figure 16A shows 146 upregulated and 222 downregulated genes (Fold change > 2)
upon SOX9 depletion. GSEA revealed that upregulated genes (that is suppressed
from SOX9 in parental cells) were enriched in KEGG pathways (P < 0.05 and FDR <
0.25) relating to p53, MAPK signaling, complement and coagulation cascades
(Figure 16B). Downregulated genes (that is under the control of SOX9 in parental

RESULTS
51
cells) enriched in KEGG pathway are related to cytochrome P450 related metabolism
of xenobiotics and drugs, mTOR signaling pathway (P<0.05 and FDR<0.25). In detail,
genes dedicated for drug metabolism comprise UGT1A6, UGT1A9, ALDH1A3,
GSTA2, GSTA4, AKR1C3 and MAOB, and related to adenosine triphosphate (ATP)–
binding cassette (ABC) transporters include ABCB1 and ABCC4 (Figure 17A).
Upregulated genes that integrate into the p53 pathway are FAS, SFN and PMAIP1
(Figure 17A). In addition, SOX9 inhibition decreases expression of genes related to
the actin cytoskeleton, including PIK3R, PDGFD, FGFR2 and FGFR4. Moreover,
SOX9 silencing dysregulated genes related to cell adhesion, including upregulation
of CLDN1, CDH4, NEGR1, JUN, ITGA2, LAMB3 and LAMC2, whereas
downregulation of CDH1, HLA-DMA, NLGN1, CADM1 and EGR1 (Figure 17B).
Taken together, microarray analysis implied that SOX9 in CCA cells has impacts on
cellular fate related to drug metabolism, survival and cell adhesion.
Figure 15. SOX9 expression in CCA cells with or without SOX9 siRNA treatment for 48
hours (immunoblot, Tubulin was used as loading control).

RESULTS
52
Figure 16. Comparative microarray analysis of CC-SW-1 cells with SOX9 knockdown as
compared to control cells. A. Pie chart shows gene expression changes of more than 2 fold.
B. Bar plots for enriched KEGG pathways of the top 146 upregulated and 222 downregulated
genes (P<0.05 and FDR<0.25).
Figure 17. Heatmap illustration of the gene expression analyses in CC-SW-1 CCA cells with
or without SOX9 siRNA treatment. A, B. Heatmap graphs showing Sox9 dependent genes
relating to pathways as indicated. ABC, adenosine triphosphate (ATP)–binds cassette.

RESULTS
53
3.2.3 Depleting SOX9 suppresses CCA cell survival
Then, I investigated the function of SOX9 on CCA cell survival. The MTT assay
shows that knockdown of SOX9 expression inhibits cell viability of CCA cells (Figure
18). Then, cell cycle analyses reveal that SOX9 knockdown significantly decreases
the proportion of cells in G1 phase, whereas cell numbers in G2/M phase are
increased in both CC-SW-1 and EGI-1 cells (Figure 19). Immunoblots further show
that depleting SOX9 reduces the expression of cyclin-dependent kinase inhibitors
p27 and p16, whereas p21 expression is induced in CC-SW-1 cells (Figure 20). EGI-
1 cells, in contrast to CC-SW-1 cells, show the opposite result regarding p21 (Figure
20). Importantly, SOX9 inhibition induced cell apoptosis in both CC-SW-1 and EGI-1
cells (Figure 21). Disruption of SOX9 had no effect on the expression of anti-
apoptotic proteins Bcl-xL and Bcl-2, cell cycle regulatory proteins Cyclin D1 and p53
in the two CCA cell lines, indicating that the observed pro-proliferative SOX9 effect
does not involve these components of the cell cycle/apoptosis machinery (Figure 22).
Figure 18. Cell viability measured by MTT assay in CCA cells with or without SOX9
knockdown. **: P<0.01, **** : <0.0001.

RESULTS
54
Figure 19. SOX9 and cell cycle progression in CC-SW-1 and EGI-1 cells. A. Comparative
cell cycle analyses of CC-SW-1 and EGI-1 CCC cell lines treated with control or SOX9
targeting siRNA. B. Respective quantification of CC-SW-1 and EGI-1 cells in the different cell
cycle phases upon control or SOX9 siRNA treatment. The results are presented as mean ±
SD. *: P<0.05. **: P<0.01.

RESULTS
55
Figure 20. SOX9 and expression of cyclin-dependent kinase inhibitors in CC-SW-1 and EGI-
1 cells (immunoblot assay, Tubulin was used as loading control).
Figure 21. SOX9 and expression of cleaved caspase 3 in CC-SW-1 and EGI-1 cells
(immunoblot assay, Tubulin was used as loading control).
Figure 22. SOX9 and expression of anti-apoptotic proteins Bcl-xL and Bcl-2, cell cycle
regulatory proteins Cyclin D1 and p53 in CC-SW-1 and EGI-1 cells (immunoblot assay,
GAPDH was used as loading control).

RESULTS
56
3.2.4 SOX9 is required for cell migration
Next, I assessed the role of SOX9 on CCA cell migration. Transwell assays show that
SOX9 knockdown significantly inhibits cell migration in CC-SW-1 and HuCCT-1 cells
(Figure 23). To further investigate whether the role of SOX9 on cell migration
involves EMT, I examined epithelial and mesenchymal cell marker expression in CCA
cells as a function of SOX9 presence or depletion. SOX9 knockdown at least does
not change expression of cell adhesion marker E-Cadherin and mesenchymal cell
markers N-Cadherin and Vimentin (Figure 24). Moreover, immunoblot assays and
immunofluorescence staining show that SOX9 reduction has no effect on β-Catenin
nuclear translocation in the tested CCA cells (Figures 25 and 26). These results
suggest that the impact of SOX9 on CCA migration is not EMT-dependent.
Figure 23. SOX9 and CCA cell migration, as measured by transwell assays. A. Transwell
assays were performed in CC-SW-1 and HuCCT-1 cells transfected with control or SOX9
siRNA as indicated. B. Quantification of cell migration (red cell number) in CC-SW-1 and
HuCCT-1 treated with control or SOX9 siRNAs. Results are presented as mean ± SD. *:
P<0.05. ***: P<0.001.

RESULTS
57
Figure 24. SOX9 and expression of epithelial cell marker E-Cadherin or mesenchymal cell
markers N-Cadherin and Vimentin (immunoblot assay).
Figure 25. SOX9 and subcellular localization of β-Catenin in CC-SW-1 and HuCCT-1 cells
(immunoblot assay upon nuclear/cytoplasmic fractionation).
Figure 26. Expression of E-Cadherin and β-Catenin in HuCCT-1 cells treated with control or
SOX9 siRNA (immunofluorescence).

RESULTS
58
3.2.5 SOX9 is required for CCA cell stemness
In HCC, SOX9 is recognized as a CSC marker, participating in CSC self-renewal,
transdifferentiation and tumorigenicity. To investigate whether SOX9 is also related to
cancer stemness of CCA cells, I performed tumor sphere formation assays, a widely
used method to evaluate self-renewal and differentiation of CSC in vitro [120]. In CC-
SW-1 cells, SOX9 knockdown significantly inhibits tumor sphere formation capacity
(Figure 27). Moreover, silencing SOX9 expression reduces expression of EpCAM at
mRNA and protein levels (Figure 28). EpCAM has been known as a marker for
maintaining CSC-features in HCC.
CSC-derived tumors display an impressive capacity to resist to chemotherapy, which
is at least partially due to high level adenosine triphosphate (ATP)–binding cassette
(ABC) transporter expression [121]. In CCA cells, immunoblot assays show that
SOX9 knockdown downregulates expression of multidrug resistance protein 4
(MRP4), also known as ATP-binding cassette sub-family C member 4 (ABCC4),
which belongs to the ABCC family of multidrug resistant genes (Figure 29A). In
consistent with microarray data (Figure 17A), where CC-SW-1 cells with SOX9
knockdown have decreased ATP-binding cassette (ABC) transporters ABCB1 and
ABCC4, real-time PCR displays that SOX9 depletion reduces expression of multidrug
resistance genes ABCB1, as well as other genes including ABCG2 and ABCC6
(Figure 29B). The results implied that SOX9 may be critical to maintain the stem cell
features of CCA.

RESULTS
59
Figure 27. SOX9 and CC-SW-1 tumor sphere formation. A. Representative picture of CC-
SW-1 cells tumor sphere formation upon treatment with SOX9 or control siRNA. B.
Quantification of tumor sphere formation (Tumor spheres above 100 µm are considered as
positive) upon treatment with SOX9 or control siRNA. *: P<0.05.
Figure 28. SOX9 and CCA transdifferentiation. A. Real-Time PCR showing that SOX9
knockdown inhibits EpCAM expression at RNA level. B. Immunoblot showing that SOX9
knockdown decreases EpCAM expression at the protein level. GAPDH was used as loading
control.
Figure 29. SOX9 and multidrug resistance gene expression. A. Immunoblot showing that
SOX9 knockdown decreases expression of multidrug resistance-associated protein 4
(MRP4). GAPDH was used as loading control. B. Real-Time PCR showing that SOX9
knockdown downregulates expression of multidrug resistance genes ABCB1, ABCG2 and
ABCC6.

RESULTS
60
3.2.6 SOX9 inhibition sensitizes CCA cells to gemcitabine
To investigate SOX9 in CCA chemotherapy, I treated CCA cells with gemcitabine, an
analog of deoxycytidine widely used for treatment of multiple cancers, including CCA.
Interestingly, immunoblots revealed that SOX9 expression is increased upon
gemcitabine treatment, both in CC-SW-1 and EGI-1 cells (Figure 30). Next, I treated
CC-SW-1 and EGI-1 cells with gemcitabine for 24 hours upon control or SOX9 siRNA
transfection and comparatively measured survival using MTT assays. Depletion of
SOX9 shows significantly reduced IC50 values (Figure 31), which is in CC-SW-1
cells, gemcitabine/SOX9 siRNA = 2.0 ± 0.23nM vs control = 7.1 ± 0.15nM, and in
EGI-1, gemcitabine/SOX9 siRNA = 46.3 ± 21.9nM vs control = 380.3 ± 249.1nM.
These results demonstrate that upregulated SOX9 expression protects CCA cells to
gemcitabine induced cell apoptosis. In addition, immunoblots reveal that combination
treatment downregulated multidrug resistance-associated protein 4 expression in CC-
SW-1 cells, and inhibited the activation of Checkpoint kinase 1 (Chk1) both in CC-
SW-1 and EGI-1 cells (Figure 32). Finally, immunoblots and Caspase 3 assays
confirm that gemcitabine induces significant cell death in CC-SW-1 and EGI-1 cells
upon SOX9 knockdown as compared to control cells (Figure 33).

RESULTS
61
Figure 30. SOX9 expression in CC-SW-1 and EGI-1 cells treated with indicated
concentration of gemcitabine (immunoblot, Tubulin was used as loading control).
Figure 31. IC50 evaluation of gemcitabine using MTT method in CC-SW-1 and EGI-1 cells
treated with or without SOX9 siRNA for 24 hours.

RESULTS
62
Figure 32. SOX9 regulates expression of MRP4 and phosphorylation Chk1 in CCA cells. A.
Immunoblot of MRP4 expression in CC-SW-1 cells with the indicated treatments. B.
Immunoblot showing expression respective phosphorylation of Checkpoint kinase 1 (Chk1) in
CC-SW-1 and EGI-1 cells. GAPDH was used as loading control.
Figure 33. SOX9 and gemcitabine mediated CCA cell apoptosis. A. Immunoblot showing
Cleaved caspase 3 and 8 expression in CC-SW-1 and EGI-1 cells with the indicated
treatments. Tubulin was used as loading control. B. Caspase 3 assay as performed in CC-
SW-1 and EGI-1 cells with the indicated treatments.

RESULTS
63
3.2.7 SOX9 is downstream of EGFR/ERK1/2 signaling
EGF/EGFR signaling was described as key to govern migration and invasion of CCA
cells via an EMT process [81]. I have shown above that SOX9 facilitates cell
migration of CCA cells. To assess a potential relationship between SOX9 and
EGF/EGFR signaling, I treated CCA cells with EGF (10ng/ml) for 24 hours, and
observed that the cells became scattered with appearance of membrane protrusions
(Figure 34A). Immunoblots revealed that EGF treatment decreases expression of
epithelial marker E-Cadherin, whereas expression of the mesenchymal marker
Vimentin increases (Figure 34B), supporting a role of EGF/EGFR signaling to induce
EMT in CCA cells. Of note, SOX9 expression is also upregulated upon EGF
treatment and this is inhibited, when the cells are treated with EGFR inhibitor Erlotinib
or ERK1/2 inhibitor U0126 (Figure 35). These results indicate that EGFR/ERK1/2
signaling upregulates SOX9 expression in CCA cells. Then, I investigated if SOX9
participates in EGF/EGFR-mediated CCA cell migration. Therefore, I performed
transwell assays with CCA cells treated with EGF and control or in SOX9 siRNA.
SOX9 knockdown significantly inhibits EGF-induced CCA cell migration (Figure
36A). However, immunoblots show that SOX9 depletion has no effect on EMT
marker expression, regardless of EGF treated or not (Figure 36B). These results
suggest that SOX9 is a downstream effector of EGFR/ERK1/2 signaling pathway and
is directly involved in CCA cell motility, whereas EMT occurs independent and in
parallel to Sox9 expression induction.

RESULTS
64
Figure 34. EGF and CCA cells. A. Representative phase-contrast images of CC-SW-1
treated with 10ng/ml EGF for 24 hours and controls. B. Immunoblot of EGF impact on
expression of SOX9, E-Cadherin and Vimentin. Tubulin was used as loading control.
Figure 35. EGFR/ERK1/2 signaling and SOX9 expression. A. Immunoblot for SOX9 in CC-
SW-1 and HuCCT-1 cells treated with EGF for 24h. Erlotinib is an EGFR inhibitor. B. ERK1/2
pathway and SOX9 expression in CC-SW-1 and HuCCT-1 cells. U0126 is an ERK1/2
inhibitor. Tubulin and GAPDH were used as loading control.

RESULTS
65
Figure 36. SOX9 and EGFR/ERK1/2 signaling induced cell migration. A. Representative
images of transwell assays in CC-SW-1 cells treated with EGF (10ng/ml for 24hours) and
control or SOX9 siRNA. B. Immunoblot showing that knockdown of SOX9 does not affect
expression of E-Cadherin and Vimentin with and without EGF treatment. Tubulin was used
as loading control.

DISCUSSION
66
4 DISCUSSION
The major findings of the study are: (1) SOX9 is a more sensitive marker for the
prognosis of iCCA in comparison to CK19; (2) SOX9 determines the CCA cell
response to chemotherapy; (3) SOX9 is critical for CCA cell survival, migration, self-
renewal and differentiation.
4.1 SOX9 is a prognostic marker for iCCA
CK19 and SOX9 are classical markers for cholangiocytes. CK19 contributes to the
differentiation of iCCA from metastatic adenocarcinoma and is associated with the
histological differentiation of iCCA. Shimonishi et al. demonstrated that moderate and
extensive expression of CK19 was associated with well-differentiated iCCA, whereas
decreased expression of the protein is associated with the poorly differentiated
cancer [122]. However, Demarez et al. reported that CK19 expression in iCCA
patients does not correlate with the iCCA histological differentiation grade [123]. In
the iCCA patients of the present study, CK19 expression is associated with the tumor
differentiation grade. Moreover, CK19 expression correlates with AJCC classification
of iCCA.
In the current cohort of iCCA patients, SOX9 expression is correlated with CK19
expression, it does not associate with any analyzed clinical parameters, including
cirrhosis, vascular invasion and AJCC classification. Of note, survival analysis
revealed that patients with high SOX9 expression present with the shortest OS and
DFS times in comparison to patients with high CK19 expression or low SOX9
expression. These results indicate that currently measured clinical parameters in
clinical practice are not capable of evaluating any potential effects of SOX9 on CCA
progression. Despite this fact, SOX9 expression is more sensitive to predict the
clinical outcome of iCCA patients in comparison to CK19.
4.2 SOX9 determines the response of CCA cells to chemotherapy
To clarify the potential role of SOX9 in CCA, I investigated SOX9 expression and the
clinical outcome of 9 CCA patients who received chemotherapy. Survival analysis
showed that patients with SOX9 low expression had significantly longer OS time than
those with high SOX9 expression after chemotherapy, indicating that SOX9
expression in cancer cells may determine the survival time of CCA patients who

DISCUSSION
67
received chemotherapy and therewith suggesting a critical role of SOX9 in
chemoresistance of CCA cells.
Besides the clinical findings, several additional lines of evidence supported the link
between SOX9 expression and multidrug resistance. The integrative analysis of gene
expression signatures in 104 CCA patients showed that SOX9 expression is
positively correlated with DNA repair pathways including homologous recombination
and mismatch repair, DNA replication, base excision repair, as well as nucleotide
excision repair. It has been demonstrated that the ability of cancer cells to repair
therapeutically induced DNA damage facilitates cancer cell survival and impacts
therapeutic efficacy [124]. Hence, targeting DNA repair pathways has been proposed
as a strategy for the development of anti-cancer agents to consequently increase
sensitivity to chemotherapeutics. To date, inhibitors of DNA damage repair pathways
have entered several clinical trials, either as a monotherapy or in combination with
chemotherapeutics [124, 125]. In addition, SOX9 expression is positively correlated
with Wnt and Notch signaling pathways, both demonstrated to account for
chemoresistance of cancer cells to gemcitabine through inactivating the apoptosis
pathway, increasing the expression of drug efflux pumps or activating CSCs
formation [114]. Thus, my data suggests that SOX9 integrates in DNA repair
pathways, Wnt and Notch signaling in the context of chemoresistance for CCA
patients.
Microarray analyses from cultured CCA cells reveal that the expression of genes
related to multidrug resistance genes, including ABCB1 and ABCC4, are positively
regulated by SOX9. Treatment of CCA cells with gemcitabine, a widely used
chemotherapeutic agent in cancer, induces SOX9 expression, which further confirms
the relationship between SOX9 expression and chemoresistance. IC50 decreases
significantly and apoptosis rate is higher in gemcitabine treated CCA cells upon
SOX9 knockdown. Moreover, expression of proteins critical for multidrug resistance,
DNA stability and DNA repair, very interestingly MRP4 and pChk1, are blunted with
SOX9 expression depletion. Chk1 functions as regulator of the G2/M checkpoint and
is crucial for replication fork stability, replication origin firing and homologous
recombination, particularly in cells which are facing genotoxic stress [126]. In
gemcitabine-treated cancer cells, Chk1 inhibition rapidly results in cell death due to
destabilization of the DNA replication apparatus [127]. Therefore, targeting Chk1 has

DISCUSSION
68
become a strategy for improving chemotherapy and several inhibitors of Chk1 have
entered clinical trials either as stand-alone agents or in combination with radiotherapy
or chemotherapy [128]. The present study now suggests SOX9 as a critical
component for Chk1 phosphorylation, although the underlying mechanism requires
further investigation. Taken together, my data demonstrates that SOX9 inhibition
sensitizes CCA cells to chemotherapeutics by inducing cell apoptosis, suppressing
the efflux of chemotherapeutic drugs and reducing tumor cell DNA repair ability upon
chemotherapeutic agents induced DNA damage. Therefore, SOX9 expression levels
have potential to predict chemoresistence and efficacy of chemotherapy in CCA
patients.
4.3 SOX9 as oncogene in CCA
In 2000, Hanahan D and Weinberg RA proposed six hallmarks of cancer as follows:
(1) sustaining proliferative signaling, (2) evading growth suppressors, (3) resisting cell
death, (4) enabling replicative immortality, (5) inducing angiogenesis, and (6)
activating invasion and metastasis [129]. In 2011, four additional cancer hallmarks
were added to the list, which are (7) genome instability and mutation, (8) tumor-
promoting inflammation, (9) reprogramming energy metabolism and (10) evading
immune destruction [130]. These cancer cells hallmarks are acquired during the
multi-step process of cancer development. In the present study, in the context of the
above features, I investigated the role of SOX9 in survival, migration and cancer stem
cell features in CCA cells.
4.3.1 Survival
Previous studies assessed the role of SOX9 in cancer cell survival. SOX9 knockdown
in lung adenocarcinoma CL1-5 cells decreased the cell fraction in G1 phase and
increased that in G2/M phase, which consequently resulted in cell proliferation
inhibition [24]. The altered cell cycle distribution induced by SOX9 depletion was
attributed to increased p21 and decreased CDK4 expression. In contrast to these
data, SOX9 overexpression in melanoma cells inhibited cell proliferation due to
increased p21 expression and cell cycle arrest in G1 phase [25]. Consistent with the
former report, my results show that SOX9 knockdown results in a similar cell cycle
distribution in both CC-SW-1 and EGI-1 cells, although p21 expression is increased
in CC-SW-1 and decreased in EGI-1 as compared to the parental cells. Furthermore,

DISCUSSION
69
cell apoptosis was significantly induced by SOX9 knockdown in both CCA cell lines.
As an explanation for these contradicting data, we and others previously described
p21 as protein with context dependent functions that sometimes present with
opposite outcome [131, 132]. For instance, in mice with severe liver injury p21
deletion led to continuous hepatocyte proliferation but also facilitated rapid tumor
development, whereas in p21-deficient mice with moderate injury liver regeneration
and hepatocarcinogenesis were impaired [131]. As a negative regulator of cell cycle,
p21 is involved in cell apoptosis and cell cycle distribution. Thereby, high p21
expression in the cytoplasm facilitates apoptosis, while its accumulation in nucleus is
related to cell cycle arrest [133]. Taken together, the opposing results revealed the
function of SOX9 on p21 expression is cancer cell dependent. In addition, whether
SOX9 inhibition-induced cell cycle alteration and apoptosis is p21 dependent needs
further investigation.
SOX9 inhibition-induced cell apoptosis might be associated with p53-related
signaling. The notion was supported by a microarray analysis showing upregulation
of p53 signaling pathway-related genes in CC-SW-1 cells with SOX9 knockdown, e.g.
FAS, SFN and PMAIP1, all of which are essential mediators of cell apoptosis [134-
136]. p53, as a tumor suppressor, can be activated by DNA damage, hypoxia and
aberrant oncogene expression [137, 138]. Activated p53 functions to integrate
multiple stress signals into a series of diverse anti-proliferative responses by
activating and decreasing number of genes involved in cell death, senescence, or
cell cycle arrest [138]. In the current study, although SOX9 knockdown in CCA cells
has no effects on the p53 expression, SOX9 inhibition significantly increases cleaved
caspase 3 and 8 expression and subsequently induces cell apoptosis. Hence,
whether SOX9 inhibition induced cell apoptosis is p53 pathway dependent needs
further investigation. Nevertheless, these facts provide evidence that dysregulation of
SOX9 expression is associated with cell cycle progression and consequently affects
the proliferation and survival of CCA cells.
4.3.2 Migration
EMT is a biologic process that allows a polarized epithelial cell to acquire a
mesenchymal fate [139]. Cancer cells through EMT process acquire cell-biological
traits associated with high-grade malignancy, including resistance to apoptosis,
motility and invasiveness [140]. In the present study, I present in vitro evidence that

DISCUSSION
70
SOX9 is necessary for efficient cancer cell migration in CCA tumor cells. In short,
starting with an examination of the “usual suspects” of EMT, SOX9 knockdown
significantly inhibits cell migration while has no effects on the expression of epithelia
cell marker and mesenchymal marker in CCA cells. On one hand, migration of these
cells is significantly blunted upon SOX9 knockdown. Looking at microarray data,
SOX9 expression is associated with genes related to regulation of actin cytoskeleton,
cell-cell contacts and focal adhesion. Interestingly in this context, I further found out
that SOX9 expression is regulated by the EGF/EGFR/ERK1/2 pathway and required
for cell migration induced by EGF stimulation of CCA cells. These results are
consistent with Ling’s report describing the contribution of the EGFR/ERK1/2/SOX9
pathway to malignant transformation of stressed urothelial cells, as well as migration
and invasion of urothelial cancer cells [141]. On the other hand, in CCA, SOX9
inhibition is not involved in the route of EGF induced expression of EMT markers. In
summary, my data reveal that in vitro, SOX9 expression is regulated by the
EGF/EGFR/1/2 pathway and is an essential component of EGF-induced CCA cell
migration.
4.3.3 Cancer stem cell features
CSCs are highly tumorigenic, metastatic, chemo- and radiation therapy resistant, and
able to divide symmetrically and asymmetrically to orchestrate tumor mass and
account for tumor relapse [142]. As a marker of cholangiocytes, SOX9 is expressed
in HPCs but not in hepatocytes. In HCC, cancer cells that express SOX9 are thought
as CSC-derived, since a role of SOX9 in maintaining CSCs properties in HCC is
known. For example, SOX9 is required for acquiring stemness and chemoresistance
of HCC cells [46]. Further, SOX9 is essential for symmetric cell division and self-
renewal of CSCs in HCC [47]. So far, it is unclear whether SOX9 expression in CCA
is related with the CSC fate. In the present study, I show that SOX9 depletion inhibits
tumor sphere formation of CCA cells, suggesting its participation in self-renewal. Of
note, SOX9 silencing decreases EpCAM expression. In normal liver, EpCAM is a
differentiation marker of cholangiocytes and hepatocytes lack its expression [143]. In
HCC, EpCAM expression is essential for maintaining CSC features [144]. In CCA,
EpCAM was reported as a poor prognostic marker and subsequently dedicated as a
marker for CSCs [145]. This link between SOX9 and EpCAM provides the first
evidence that SOX9 may play a role in CCA related CSC generation. In addition,
CSCs are more resistant to chemotherapeutic agents than differentiated tumor cells,

DISCUSSION
71
due to increased expression of ATP-binding cassette transporters [121]. In vitro,
SOX9 inhibition disrupted the expression of several multidrug resistance genes and
consequently sensitized CCA cells to gemcitabine. Taken together, these facts
illustrated that SOX9 might be an essential regulator for maintaining CSC-features of
CCA.
4.4 Regulation of SOX9 expression
Gene expression profiling of publicly available CCA patient data sets revealed that
SOX9 expression is associated with the Notch pathway. In liver, Notch is critical for
activation, proliferation and differentiation of hepatoblasts/HPCs [96, 98]. SOX9 is a
well described target gene of the Notch pathway. Aberrant activity of Notch related
signaling is involved in tumorigenesis of CCA [65]. These facts implied SOX9 might
be involved in Notch pathway during the carcinogenesis of CCA. As discussed
above, I revealed that EGF/EGFR/ERK1/2 participate in the regulation of SOX9
expression in CCA cells. A relationship between EGFR/ERK1/2 and Notch pathways
exists in the context of cholangiocyte differentiation [146]. However, the network of
EGFR/ERK1/2, Notch and SOX9 in CCA has not been delineated yet. Maybe we can
learn something from HCC. There, SOX9 regulates the Notch pathway via inhibition
of Numb, a Notch signaling antagonist, which results in maintenance of CSCs-
features [47]. Also this aspect contains substance for future studies.

SUMMARY
72
5 SUMMARY
SOX9 is a critical transcription factor for liver embryogenesis, homeostasis and HCC
development. However, the oncogenic role of SOX9 has not been investigated in
CCA. As CCA is a devastating malignancy with limited treatment options, elucidation
of its underlying mechanisms and identification of new molecular markers of
tumorigenesis and progression of CCA is necessary for improving diagnosis and
prognosis of this cancer type. This study aims at investigating the effects and
underlying mechanisms of SOX9 in tumorigenesis and chemotherapy of CCA.
In this thesis, I examined SOX9 expression in CCA patients, including intrahepatic
CCA (iCCA) and extrahepatic CCA (eCCA), by immunohistochemistry. Association of
SOX9 expression and clinical outcome was evaluated. A SOX9 gene signature and
its biological functions were investigated in CCA cell lines. My results reveal that
SOX9 expression is significantly associated with overall survival of iCCA patients,
with high SOX9 expression presenting with a shorter survival time, as compared to
patients with low SOX9. Impressively, in the investigated patient cohort, CCA patients
with low SOX9 levels have 62 months of median survival time following
chemotherapy, whereas median survival time is only 22 months for patients with high
SOX9 expression. In vitro, gemcitabine treatment induces SOX9 expression in CCA
cells. When SOX9 is knocked down by small interfering RNA (siRNA), gemcitabine-
induced cell death is markedly increased. Molecularly, SOX9 silencing inhibits
gemcitabine-induced phosphorylation of checkpoint kinase 1 (CHEK1), a key cell
cycle check point regulator that coordinates the DNA damage response and
expression of multidrug resistance genes. Microarray analyses show that SOX9
knockdown in CCA cells alters the gene signature with respect to adenosine
triphosphate–binding cassette (ABC) transporters, drug metabolism enzymes and
p53 signaling. Moreover, I demonstrate that SOX9 expression is required for survival,
migration and stemness of CCA cells. Finally, I found out that EGFR/ERK signaling is
important in regulating SOX9 expression in CCA cells.
In conclusion, my thesis has revealed that (1) SOX9 is critical for CCA cell survival,
migration and CSCs-features, (2) governs the response of CCA cells to
chemotherapy through regulating activation of CHEK1and multidrug resistance
SUMMARY
73
genes. (3) My data also provides a strong rational for a clinical study to confirm SOX9
as a biomarker to predict which CCA patients are eligible for efficient chemotherapy.

REFERENCES
74
6 REFERENCES
1. Wagner, T., et al., Autosomal sex reversal and campomelic dysplasia are
caused by mutations in and around the SRY-related gene SOX9. Cell, 1994.
79(6): p. 1111-20.
2. Foster, J.W., et al., Campomelic dysplasia and autosomal sex reversal caused
by mutations in an SRY-related gene. Nature, 1994. 372(6506): p. 525-30.
3. Baker, M., Cancer stem cells tracked. Nature, 2012. 488(7409): p. 13-4.
4. Barker, N., et al., Crypt stem cells as the cells-of-origin of intestinal cancer.
Nature, 2009. 457(7229): p. 608-11.
5. Chen, J., et al., A restricted cell population propagates glioblastoma growth
after chemotherapy. Nature, 2012. 488(7412): p. 522-6.
6. Driessens, G., et al., Defining the mode of tumour growth by clonal analysis.
Nature, 2012. 488(7412): p. 527-30.
7. Schepers, A.G., et al., Lineage tracing reveals Lgr5+ stem cell activity in
mouse intestinal adenomas. Science, 2012. 337(6095): p. 730-5.
8. Kawaguchi, Y., Sox9 and programming of liver and pancreatic progenitors. J
Clin Invest, 2013. 123(5): p. 1881-6.
9. Jo, A., et al., The versatile functions of Sox9 in development, stem cells, and
human diseases. Genes Dis, 2014. 1(2): p. 149-161.
10. Cotsarelis, G., Gene expression profiling gets to the root of human hair follicle
stem cells. J Clin Invest, 2006. 116(1): p. 19-22.
11. Furuyama, K., et al., Continuous cell supply from a Sox9-expressing
progenitor zone in adult liver, exocrine pancreas and intestine. Nat Genet,
2011. 43(1): p. 34-41.
12. Passeron, T., et al., SOX9 is a key player in ultraviolet B-induced melanocyte
differentiation and pigmentation. Proc Natl Acad Sci U S A, 2007. 104(35): p.
13984-9.
13. Scott, C.E., et al., SOX9 induces and maintains neural stem cells. Nat
Neurosci, 2010. 13(10): p. 1181-9.
14. Pritchett, J., et al., Understanding the role of SOX9 in acquired diseases:
lessons from development. Trends Mol Med, 2011. 17(3): p. 166-74.
15. Peten, E.P., et al., The contribution of increased collagen synthesis to human
glomerulosclerosis: a quantitative analysis of alpha 2IV collagen mRNA
expression by competitive polymerase chain reaction. J Exp Med, 1992.
176(6): p. 1571-6.
16. Airik, R., et al., Hydroureternephrosis due to loss of Sox9-regulated smooth
muscle cell differentiation of the ureteric mesenchyme. Hum Mol Genet, 2010.
19(24): p. 4918-29.
17. Bennett, M.R., et al., Laser capture microdissection-microarray analysis of
focal segmental glomerulosclerosis glomeruli. Nephron Exp Nephrol, 2007.
107(1): p. e30-40.

REFERENCES
75
18. Pritchett, J., et al., Osteopontin is a novel downstream target of SOX9 with
diagnostic implications for progression of liver fibrosis in humans. Hepatology,
2012. 56(3): p. 1108-16.
19. Sumi, E., et al., SRY-related HMG box 9 regulates the expression of Col4a2
through transactivating its enhancer element in mesangial cells. Am J Pathol,
2007. 170(6): p. 1854-64.
20. Xia, S., et al., Clinical implication of Sox9 and activated Akt expression in
pancreatic ductal adenocarcinoma. Med Oncol, 2015. 32(1): p. 358.
21. Zhou, C.H., et al., Clinical significance of SOX9 in human non-small cell lung
cancer progression and overall patient survival. J Exp Clin Cancer Res, 2012.
31: p. 18.
22. Kopp, J.L., et al., Identification of Sox9-dependent acinar-to-ductal
reprogramming as the principal mechanism for initiation of pancreatic ductal
adenocarcinoma. Cancer Cell, 2012. 22(6): p. 737-50.
23. Vidal, V.P., N. Ortonne, and A. Schedl, SOX9 expression is a general marker
of basal cell carcinoma and adnexal-related neoplasms. J Cutan Pathol, 2008.
35(4): p. 373-9.
24. Jiang, S.S., et al., Upregulation of SOX9 in lung adenocarcinoma and its
involvement in the regulation of cell growth and tumorigenicity. Clin Cancer
Res, 2010. 16(17): p. 4363-73.
25. Passeron, T., et al., Upregulation of SOX9 inhibits the growth of human and
mouse melanomas and restores their sensitivity to retinoic acid. J Clin Invest,
2009. 119(4): p. 954-63.
26. Matheu, A., et al., Oncogenicity of the developmental transcription factor Sox9.
Cancer Res, 2012. 72(5): p. 1301-15.
27. Antoniou, A., et al., Intrahepatic bile ducts develop according to a new mode of
tubulogenesis regulated by the transcription factor SOX9. Gastroenterology,
2009. 136(7): p. 2325-33.
28. Carpentier, R., et al., Embryonic ductal plate cells give rise to cholangiocytes,
periportal hepatocytes, and adult liver progenitor cells. Gastroenterology,
2011. 141(4): p. 1432-8, 1438 e1-4.
29. Rowe, C., et al., Proteome-wide analyses of human hepatocytes during
differentiation and dedifferentiation. Hepatology, 2013. 58(2): p. 799-809.
30. Poncy, A., et al., Transcription factors SOX4 and SOX9 cooperatively control
development of bile ducts. Dev Biol, 2015. 404(2): p. 136-48.
31. Raynaud, P., et al., A classification of ductal plate malformations based on
distinct pathogenic mechanisms of biliary dysmorphogenesis. Hepatology,
2011. 53(6): p. 1959-66.
32. Vestentoft, P.S., et al., Three-dimensional reconstructions of intrahepatic bile
duct tubulogenesis in human liver. BMC Dev Biol, 2011. 11: p. 56.
33. Carpino, G., et al., Biliary tree stem/progenitor cells in glands of extrahepatic
and intraheptic bile ducts: an anatomical in situ study yielding evidence of
maturational lineages. J Anat, 2012. 220(2): p. 186-99.
34. Jors, S., et al., Lineage fate of ductular reactions in liver injury and
carcinogenesis. J Clin Invest, 2015. 125(6): p. 2445-57.

REFERENCES
76
35. Cardinale, V., et al., Multipotent stem/progenitor cells in human biliary tree
give rise to hepatocytes, cholangiocytes, and pancreatic islets. Hepatology,
2011. 54(6): p. 2159-72.
36. Dorrell, C., et al., Prospective isolation of a bipotential clonogenic liver
progenitor cell in adult mice. Genes Dev, 2011. 25(11): p. 1193-203.
37. Tarlow, B.D., M.J. Finegold, and M. Grompe, Clonal tracing of Sox9+ liver
progenitors in mouse oval cell injury. Hepatology, 2014. 60(1): p. 278-89.
38. Yanger, K., et al., Adult hepatocytes are generated by self-duplication rather
than stem cell differentiation. Cell Stem Cell, 2014. 15(3): p. 340-9.
39. Malato, Y., et al., Fate tracing of mature hepatocytes in mouse liver
homeostasis and regeneration. J Clin Invest, 2011. 121(12): p. 4850-60.
40. Lu, W.Y., et al., Hepatic progenitor cells of biliary origin with liver repopulation
capacity. Nat Cell Biol, 2015. 17(8): p. 971-83.
41. Friedman, S.L., Mechanisms of hepatic fibrogenesis. Gastroenterology, 2008.
134(6): p. 1655-69.
42. Hanley, K.P., et al., Ectopic SOX9 mediates extracellular matrix deposition
characteristic of organ fibrosis. J Biol Chem, 2008. 283(20): p. 14063-71.
43. Omenetti, A., et al., Hedgehog signaling regulates epithelial-mesenchymal
transition during biliary fibrosis in rodents and humans. J Clin Invest, 2008.
118(10): p. 3331-42.
44. Guo, X., et al., Expression features of SOX9 associate with tumor progression
and poor prognosis of hepatocellular carcinoma. Diagn Pathol, 2012. 7: p. 44.
45. Matsushima, H., et al., Sox9 expression in carcinogenesis and its clinical
significance in intrahepatic cholangiocarcinoma. Dig Liver Dis, 2015. 47(12): p.
1067-75.
46. Leung, C.O., et al., Sox9 confers stemness properties in hepatocellular
carcinoma through Frizzled-7 mediated Wnt/beta-catenin signaling.
Oncotarget, 2016. 7(20): p. 29371-86.
47. Liu, C., et al., Sox9 regulates self-renewal and tumorigenicity by promoting
symmetrical cell division of cancer stem cells in hepatocellular carcinoma.
Hepatology, 2016. 64(1): p. 117-29.
48. de Groen, P.C., et al., Biliary tract cancers. N Engl J Med, 1999. 341(18): p.
1368-78.
49. Welzel, T.M., et al., Impact of classification of hilar cholangiocarcinomas
(Klatskin tumors) on the incidence of intra- and extrahepatic
cholangiocarcinoma in the United States. J Natl Cancer Inst, 2006. 98(12): p.
873-5.
50. Rizvi, S. and G.J. Gores, Pathogenesis, diagnosis, and management of
cholangiocarcinoma. Gastroenterology, 2013. 145(6): p. 1215-29.
51. Farley, D.R., A.L. Weaver, and D.M. Nagorney, "Natural history" of unresected
cholangiocarcinoma: patient outcome after noncurative intervention. Mayo Clin
Proc, 1995. 70(5): p. 425-9.
52. Banales, J.M., et al., Expert consensus document: Cholangiocarcinoma:
current knowledge and future perspectives consensus statement from the

REFERENCES
77
European Network for the Study of Cholangiocarcinoma (ENS-CCA). Nat Rev
Gastroenterol Hepatol, 2016. 13(5): p. 261-80.
53. Razumilava, N. and G.J. Gores, Cholangiocarcinoma. Lancet, 2014.
383(9935): p. 2168-79.
54. Komuta, M., et al., Histological diversity in cholangiocellular carcinoma reflects
the different cholangiocyte phenotypes. Hepatology, 2012. 55(6): p. 1876-88.
55. Tyson, G.L. and H.B. El-Serag, Risk factors for cholangiocarcinoma.
Hepatology, 2011. 54(1): p. 173-84.
56. Fausto, N., Liver regeneration and repair: hepatocytes, progenitor cells, and
stem cells. Hepatology, 2004. 39(6): p. 1477-87.
57. Guest, R.V., et al., Cell lineage tracing reveals a biliary origin of intrahepatic
cholangiocarcinoma. Cancer Res, 2014. 74(4): p. 1005-10.
58. Komuta, M., et al., Clinicopathological study on cholangiolocellular carcinoma
suggesting hepatic progenitor cell origin. Hepatology, 2008. 47(5): p. 1544-56.
59. Zhang, F., et al., Combined hepatocellular cholangiocarcinoma originating
from hepatic progenitor cells: immunohistochemical and double-fluorescence
immunostaining evidence. Histopathology, 2008. 52(2): p. 224-32.
60. Goodman, Z.D., et al., Combined hepatocellular-cholangiocarcinoma. A
histologic and immunohistochemical study. Cancer, 1985. 55(1): p. 124-35.
61. Roskams, T., Liver stem cells and their implication in hepatocellular and
cholangiocarcinoma. Oncogene, 2006. 25(27): p. 3818-22.
62. Cardinale, V., et al., Mucin-producing cholangiocarcinoma might derive from
biliary tree stem/progenitor cells located in peribiliary glands. Hepatology,
2012. 55(6): p. 2041-2.
63. Terasaki, S., et al., Involvement of peribiliary glands in primary sclerosing
cholangitis: a histopathologic study. Intern Med, 1997. 36(11): p. 766-70.
64. Cardinale, V., et al., Multiple cells of origin in cholangiocarcinoma underlie
biological, epidemiological and clinical heterogeneity. World J Gastrointest
Oncol, 2012. 4(5): p. 94-102.
65. Sekiya, S. and A. Suzuki, Intrahepatic cholangiocarcinoma can arise from
Notch-mediated conversion of hepatocytes. J Clin Invest, 2012. 122(11): p.
3914-8.
66. Fan, B., et al., Cholangiocarcinomas can originate from hepatocytes in mice. J
Clin Invest, 2012. 122(8): p. 2911-5.
67. Borger, D.R., et al., Frequent mutation of isocitrate dehydrogenase (IDH)1 and
IDH2 in cholangiocarcinoma identified through broad-based tumor genotyping.
Oncologist, 2012. 17(1): p. 72-9.
68. Wang, P., et al., Mutations in isocitrate dehydrogenase 1 and 2 occur
frequently in intrahepatic cholangiocarcinomas and share hypermethylation
targets with glioblastomas. Oncogene, 2013. 32(25): p. 3091-100.
69. Turcan, S., et al., IDH1 mutation is sufficient to establish the glioma
hypermethylator phenotype. Nature, 2012. 483(7390): p. 479-83.
70. Saha, S.K., et al., Mutant IDH inhibits HNF-4alpha to block hepatocyte
differentiation and promote biliary cancer. Nature, 2014. 513(7516): p. 110-4.

REFERENCES
78
71. Borad, M.J., et al., Integrated genomic characterization reveals novel,
therapeutically relevant drug targets in FGFR and EGFR pathways in sporadic
intrahepatic cholangiocarcinoma. PLoS Genet, 2014. 10(2): p. e1004135.
72. Zheng, Z., et al., Anchored multiplex PCR for targeted next-generation
sequencing. Nat Med, 2014. 20(12): p. 1479-84.
73. Arai, Y., et al., Fibroblast growth factor receptor 2 tyrosine kinase fusions
define a unique molecular subtype of cholangiocarcinoma. Hepatology, 2014.
59(4): p. 1427-34.
74. Wu, Y.M., et al., Identification of targetable FGFR gene fusions in diverse
cancers. Cancer Discov, 2013. 3(6): p. 636-47.
75. Ross, J.S., et al., New routes to targeted therapy of intrahepatic
cholangiocarcinomas revealed by next-generation sequencing. Oncologist,
2014. 19(3): p. 235-42.
76. Harder, J., et al., EGFR and HER2 expression in advanced biliary tract cancer.
World J Gastroenterol, 2009. 15(36): p. 4511-7.
77. Yoshikawa, D., et al., Clinicopathological and prognostic significance of EGFR,
VEGF, and HER2 expression in cholangiocarcinoma. Br J Cancer, 2008.
98(2): p. 418-25.
78. Gwak, G.Y., et al., Detection of response-predicting mutations in the kinase
domain of the epidermal growth factor receptor gene in cholangiocarcinomas.
J Cancer Res Clin Oncol, 2005. 131(10): p. 649-52.
79. Nakazawa, K., et al., Amplification and overexpression of c-erbB-2, epidermal
growth factor receptor, and c-met in biliary tract cancers. J Pathol, 2005.
206(3): p. 356-65.
80. Miyamoto, M., et al., Prognostic significance of overexpression of c-Met
oncoprotein in cholangiocarcinoma. Br J Cancer, 2011. 105(1): p. 131-8.
81. Claperon, A., et al., EGF/EGFR axis contributes to the progression of
cholangiocarcinoma through the induction of an epithelial-mesenchymal
transition. J Hepatol, 2014. 61(2): p. 325-32.
82. Leelawat, K., et al., Involvement of c-Met/hepatocyte growth factor pathway in
cholangiocarcinoma cell invasion and its therapeutic inhibition with small
interfering RNA specific for c-Met. J Surg Res, 2006. 136(1): p. 78-84.
83. Sia, D., et al., Integrative molecular analysis of intrahepatic
cholangiocarcinoma reveals 2 classes that have different outcomes.
Gastroenterology, 2013. 144(4): p. 829-40.
84. Park, J., et al., Inhibition of interleukin 6-mediated mitogen-activated protein
kinase activation attenuates growth of a cholangiocarcinoma cell line.
Hepatology, 1999. 30(5): p. 1128-33.
85. Goydos, J.S., et al., Marked elevation of serum interleukin-6 in patients with
cholangiocarcinoma: validation of utility as a clinical marker. Ann Surg, 1998.
227(3): p. 398-404.
86. Andersen, J.B., et al., Genomic and genetic characterization of
cholangiocarcinoma identifies therapeutic targets for tyrosine kinase inhibitors.
Gastroenterology, 2012. 142(4): p. 1021-1031 e15.

REFERENCES
79
87. Kobayashi, S., et al., Interleukin-6 contributes to Mcl-1 up-regulation and
TRAIL resistance via an Akt-signaling pathway in cholangiocarcinoma cells.
Gastroenterology, 2005. 128(7): p. 2054-65.
88. Chen, Y., et al., TGF-beta1 expression is associated with invasion and
metastasis of intrahepatic cholangiocarcinoma. Biol Res, 2015. 48: p. 26.
89. Lu, J.P., et al., In situ detection of TGF betas, TGF beta receptor II mRNA and
telomerase activity in rat cholangiocarcinogenesis. World J Gastroenterol,
2003. 9(3): p. 590-4.
90. Araki, K., et al., E/N-cadherin switch mediates cancer progression via TGF-
beta-induced epithelial-to-mesenchymal transition in extrahepatic
cholangiocarcinoma. Br J Cancer, 2011. 105(12): p. 1885-93.
91. Jaiswal, M., et al., Nitric oxide-mediated inhibition of DNA repair potentiates
oxidative DNA damage in cholangiocytes. Gastroenterology, 2001. 120(1): p.
190-9.
92. Jaiswal, M., et al., Inflammatory cytokines induce DNA damage and inhibit
DNA repair in cholangiocarcinoma cells by a nitric oxide-dependent
mechanism. Cancer Res, 2000. 60(1): p. 184-90.
93. Artavanis-Tsakonas, S., M.D. Rand, and R.J. Lake, Notch signaling: cell fate
control and signal integration in development. Science, 1999. 284(5415): p.
770-6.
94. D'Souza, B., L. Meloty-Kapella, and G. Weinmaster, Canonical and non-
canonical Notch ligands. Curr Top Dev Biol, 2010. 92: p. 73-129.
95. Zong, Y., et al., Notch signaling controls liver development by regulating biliary
differentiation. Development, 2009. 136(10): p. 1727-39.
96. Geisler, F. and M. Strazzabosco, Emerging roles of Notch signaling in liver
disease. Hepatology, 2015. 61(1): p. 382-92.
97. Wu, W.R., et al., Clinicopathological significance of aberrant Notch receptors
in intrahepatic cholangiocarcinoma. Int J Clin Exp Pathol, 2014. 7(6): p. 3272-
9.
98. Huntzicker, E.G., et al., Differential effects of targeting Notch receptors in a
mouse model of liver cancer. Hepatology, 2015. 61(3): p. 942-52.
99. Zhou, Q., et al., The roles of Notch1 expression in the migration of intrahepatic
cholangiocarcinoma. BMC Cancer, 2013. 13: p. 244.
100. Boulter, L., et al., WNT signaling drives cholangiocarcinoma growth and can
be pharmacologically inhibited. J Clin Invest, 2015. 125(3): p. 1269-85.
101. El Khatib, M., et al., Inhibition of hedgehog signaling attenuates
carcinogenesis in vitro and increases necrosis of cholangiocellular carcinoma.
Hepatology, 2013. 57(3): p. 1035-45.
102. Fingas, C.D., et al., Myofibroblast-derived PDGF-BB promotes Hedgehog
survival signaling in cholangiocarcinoma cells. Hepatology, 2011. 54(6): p.
2076-88.
103. Sia, D., et al., Intrahepatic cholangiocarcinoma: pathogenesis and rationale for
molecular therapies. Oncogene, 2013. 32(41): p. 4861-70.
104. Rizvi, S. and G.J. Gores, Emerging molecular therapeutic targets for
cholangiocarcinoma. J Hepatol, 2017.

REFERENCES
80
105. DeOliveira, M.L., et al., Cholangiocarcinoma: thirty-one-year experience with
564 patients at a single institution. Ann Surg, 2007. 245(5): p. 755-62.
106. Bridgewater, J., et al., Guidelines for the diagnosis and management of
intrahepatic cholangiocarcinoma. J Hepatol, 2014. 60(6): p. 1268-89.
107. Valle, J., et al., Cisplatin plus gemcitabine versus gemcitabine for biliary tract
cancer. N Engl J Med, 2010. 362(14): p. 1273-81.
108. Sia, D., et al., Massive parallel sequencing uncovers actionable FGFR2-
PPHLN1 fusion and ARAF mutations in intrahepatic cholangiocarcinoma. Nat
Commun, 2015. 6: p. 6087.
109. Moeini, A., et al., Molecular Pathogenesis and Targeted Therapies for
Intrahepatic Cholangiocarcinoma. Clin Cancer Res, 2016. 22(2): p. 291-300.
110. Anderson, C.D., et al., Diagnosis and treatment of cholangiocarcinoma.
Oncologist, 2004. 9(1): p. 43-57.
111. Shimizu, Y., et al., Two new human cholangiocarcinoma cell lines and their
cytogenetics and responses to growth factors, hormones, cytokines or
immunologic effector cells. Int J Cancer, 1992. 52(2): p. 252-60.
112. Miyagiwa, M., et al., A new human cholangiocellular carcinoma cell line
(HuCC-T1) producing carbohydrate antigen 19/9 in serum-free medium. In
Vitro Cell Dev Biol, 1989. 25(6): p. 503-10.
113. Saijyo, S., et al., Establishment of a new extrahepatic bile duct carcinoma cell
line, TFK-1. Tohoku J Exp Med, 1995. 177(1): p. 61-71.
114. Jia, Y. and J. Xie, Promising molecular mechanisms responsible for
gemcitabine resistance in cancer. Genes & Diseases, 2015. 2(4): p. 299-306.
115. Strick-Marchand, H. and M.C. Weiss, Inducible differentiation and
morphogenesis of bipotential liver cell lines from wild-type mouse embryos.
Hepatology, 2002. 36(4 Pt 1): p. 794-804.
116. Huang, Z., et al., Tumor suppressor Alpha B-crystallin (CRYAB) associates
with the cadherin/catenin adherens junction and impairs NPC progression-
associated properties. Oncogene, 2012. 31(32): p. 3709-20.
117. Meyer, C., et al., Caveolin-1 abrogates TGF-beta mediated hepatocyte
apoptosis. Cell Death Dis, 2013. 4: p. e466.
118. Johnson, S., H. Chen, and P.K. Lo, In vitro Tumorsphere Formation Assays.
Bio Protoc, 2013. 3(3).
119. Subramanian, A., et al., Gene set enrichment analysis: a knowledge-based
approach for interpreting genome-wide expression profiles. Proc Natl Acad Sci
U S A, 2005. 102(43): p. 15545-50.
120. Pastrana, E., V. Silva-Vargas, and F. Doetsch, Eyes wide open: a critical
review of sphere-formation as an assay for stem cells. Cell Stem Cell, 2011.
8(5): p. 486-98.
121. Jordan, C.T., M.L. Guzman, and M. Noble, Cancer stem cells. N Engl J Med,
2006. 355(12): p. 1253-61.
122. Shimonishi, T., K. Miyazaki, and Y. Nakanuma, Cytokeratin profile relates to
histological subtypes and intrahepatic location of intrahepatic
cholangiocarcinoma and primary sites of metastatic adenocarcinoma of liver.
Histopathology, 2000. 37(1): p. 55-63.

REFERENCES
81
123. Demarez, C., et al., Expression of Molecular Differentiation Markers Does Not
Correlate with Histological Differentiation Grade in Intrahepatic
Cholangiocarcinoma. PLoS One, 2016. 11(6): p. e0157140.
124. Gavande, N.S., et al., DNA repair targeted therapy: The past or future of
cancer treatment? Pharmacol Ther, 2016. 160: p. 65-83.
125. Helleday, T., et al., DNA repair pathways as targets for cancer therapy. Nat
Rev Cancer, 2008. 8(3): p. 193-204.
126. Petermann, E., M. Woodcock, and T. Helleday, Chk1 promotes replication fork
progression by controlling replication initiation. Proc Natl Acad Sci U S A,
2010. 107(37): p. 16090-5.
127. Koh, S.B., et al., CHK1 Inhibition Synergizes with Gemcitabine Initially by
Destabilizing the DNA Replication Apparatus. Cancer Res, 2015. 75(17): p.
3583-95.
128. Manic, G., et al., Trial Watch: Targeting ATM-CHK2 and ATR-CHK1 pathways
for anticancer therapy. Mol Cell Oncol, 2015. 2(4): p. e1012976.
129. Hanahan, D. and R.A. Weinberg, The hallmarks of cancer. Cell, 2000. 100(1):
p. 57-70.
130. Hanahan, D. and R.A. Weinberg, Hallmarks of cancer: the next generation.
Cell, 2011. 144(5): p. 646-74.
131. Buitrago-Molina, L.E., et al., The degree of liver injury determines the role of
p21 in liver regeneration and hepatocarcinogenesis in mice. Hepatology,
2013. 58(3): p. 1143-52.
132. Marhenke, S., et al., p21 promotes sustained liver regeneration and
hepatocarcinogenesis in chronic cholestatic liver injury. Gut, 2014. 63(9): p.
1501-12.
133. Asada, M., et al., Apoptosis inhibitory activity of cytoplasmic p21(Cip1/WAF1)
in monocytic differentiation. EMBO J, 1999. 18(5): p. 1223-34.
134. Bennett, M., et al., Cell surface trafficking of Fas: a rapid mechanism of p53-
mediated apoptosis. Science, 1998. 282(5387): p. 290-3.
135. Hermeking, H., et al., 14-3-3sigma is a p53-regulated inhibitor of G2/M
progression. Mol Cell, 1997. 1(1): p. 3-11.
136. Sullivan, K.D., et al., The p53 circuit board. Biochim Biophys Acta, 2012.
1825(2): p. 229-44.
137. Brooks, C.L. and W. Gu, New insights into p53 activation. Cell Res, 2010.
20(6): p. 614-21.
138. Fridman, J.S. and S.W. Lowe, Control of apoptosis by p53. Oncogene, 2003.
22(56): p. 9030-40.
139. Kalluri, R. and R.A. Weinberg, The basics of epithelial-mesenchymal
transition. J Clin Invest, 2009. 119(6): p. 1420-8.
140. Guo, W., et al., Slug and Sox9 cooperatively determine the mammary stem
cell state. Cell, 2012. 148(5): p. 1015-28.
141. Ling, S., et al., An EGFR-ERK-SOX9 signaling cascade links urothelial
development and regeneration to cancer. Cancer Res, 2011. 71(11): p. 3812-
21.

REFERENCES
82
142. Yamashita, T. and X.W. Wang, Cancer stem cells in the development of liver
cancer. J Clin Invest, 2013. 123(5): p. 1911-8.
143. Zhang, L., et al., The stem cell niche of human livers: symmetry between
development and regeneration. Hepatology, 2008. 48(5): p. 1598-607.
144. Yamashita, T., et al., EpCAM-positive hepatocellular carcinoma cells are
tumor-initiating cells with stem/progenitor cell features. Gastroenterology,
2009. 136(3): p. 1012-24.
145. Sulpice, L., et al., Epithelial cell adhesion molecule is a prognosis marker for
intrahepatic cholangiocarcinoma. J Surg Res, 2014. 192(1): p. 117-23.
146. Kitade, M., et al., Specific fate decisions in adult hepatic progenitor cells driven
by MET and EGFR signaling. Genes Dev, 2013. 27(15): p. 1706-17.

LISTS OF FIGURES AND TABLES
83
7 LISTS OF FIGURES AND TABLES
7.1 List of figures
Figure 1. Worldwide incidence of cholangiocarcinoma.
Figure 2. Potential cells of origin in intrahepatic cholangiocarcinoma (iCCA)
Figure 3. Summary of key molecular alterations involved in iCCA carcinogenesis
Figure 4. A semi-quantitative scoring system for evaluation of SOX9 expression in
intrahepatic cholangiocarcinoma.
Figure 5. CK19 expression in iCCA.
Figure 6. Expression of SOX9 in chronic liver disease.
Figure 7. Expressions of SOX9 and CK19 in CCA tumor surrounding tissue.
Figure 8. Expression patterns of SOX9 and CK19 in iCCA tumor tissue.
Figure 9. Expression of SOX9 in eCCA.
Figure 10. Kaplan-Meier survival curves of iCCA patients in relation to SOX9 and
CK19 expression.
Figure 11. Kaplan-Meier survival curve of iCCA patients having received
chemotherapy in relation to SOX9 expression.
Figure 12. Kaplan-Meier survival curve of iCCA patients having received
chemotherapy in relation to CK19 expression.
Figure 13. Integrated analyses of CCA patients gene expression signatures related to
SOX9 expression.
Figure 14. Expression of SOX9 and CK19 in CCA cell lines and normal biliary
epithelia cell line MMNK-1.
Figure 15. SOX9 expression in CCA cells with or without SOX9 siRNA treatment for
48 hours.
Figure 16. Comparative microarray analysis of CC-SW-1 cells with SOX9 knockdown
as compared to control cells.
Figure 17. Heatmap illustration of the gene expression analyses in CC-SW-1 CCA
cells with or without SOX9 siRNA treatment.
Figure 18. Cell viability measured by MTT assay in CCA cells with or without SOX9
knockdown.
Figure 19. SOX9 and cell cycle progression in CC-SW-1 and EGI-1 cells.

LISTS OF FIGURES AND TABLES
84
Figure 20. SOX9 and expression of cyclin-dependent kinase inhibitors in CC-SW-1
and EGI-1 cells (immunoblot assay).
Figure 21. SOX9 and expression of cleaved caspase 3 in CC-SW-1 and EGI-1 cells
(immunoblot assay).
Figure 22. SOX9 and expression of anti-apoptotic proteins Bcl-xL and Bcl-2, cell
cycle regulatory proteins Cyclin D1 and p53 in CC-SW-1 and EGI-1 cells (immunoblot
assay).
Figure 23. SOX9 and CCA cell migration, as measured by transwell assays.
Figure 24. SOX9 and expression of epithelial cell marker E-Cadherin or
mesenchymal cell markers N-Cadherin and Vimentin (immunoblot assay).
Figure 25. SOX9 and subcellular localization of β-Catenin in CC-SW-1 and HuCCT-1
cells (immunoblot assay upon nuclear/cytoplasmic fractionation).
Figure 26. Expression of E-Cadherin and β-Catenin in HuCCT-1 cells treated with
control or SOX9 siRNA (immunofluorescence).
Figure 27. SOX9 and CC-SW-1 tumor sphere formation.
Figure 28. SOX9 and CCA transdifferentiation.
Figure 29. SOX9 and multidrug resistance gene expression.
Figure 30. SOX9 expression in CC-SW-1 and EGI-1 cells treated with indicated
concentration of gemcitabine (immunoblot).
Figure 31. IC50 evaluation of gemcitabine using MTT method in CC-SW-1 and EGI-1
cells treated with or without SOX9 siRNA for 24 hours.
Figure 32. SOX9 regulates expression of MRP4 and phosphorylation Chk1 in CCA
cells.
Figure 33. SOX9 and gemcitabine mediated CCA cell apoptosis.
Figure 34. EGF and CCA cells.
Figure 35. EGFR/ERK1/2 signaling and SOX9 expression.
Figure 36. SOX9 and EGFR/ERK1/2 signaling induced cell migration.

LISTS OF FIGURES AND TABLES
85
7.2 List of tables
Table 1. SOX9 expression in embryonic and adult liver
Table 2. Established risk factors and corresponding geographic distribution for
cholangiocarcinoma
Table 3. Possible risk factors for cholangiocarcinoma
Table 4. Molecular pathogenesis of CCA
Table 5. Clinicopathological features of the validating set iCCA
Table 6. Chemicals and reagents
Table 7. Primary antibodies used for immunoblotting
Table 8. Primary antibodies used for immunohistochemistry
Table 9. Primary antibodies used for immunofluorescence
Table 10. Secondary antibodies
Table 11. Buffer
Table 12. Cell culture materials
Table 13. Apparatus and Software
Table 14. Cell lines and cell culture medium used in the study
Table 15. Primers used for qRT-PCR in this study
Table 16. Correlation of SOX9 and CK19 expression in iCCA
Table 17. Patient characteristics and tumor parameters in relation to SOX9
expression in iCCA
Table 18. Patient characteristics and tumor parameters in relation to CK19
expression in iCCA
Table 19. Median overall survival time of iCCA patients in relation to SOX9 and
CK19 expression
Table 20. Median disease free survival time of iCCA patients in relation to SOX9 and
CK19 expression
Table 21. SOX9 and CK19 expression and clinical outcome of iCCA patients
receiving chemotherapy
Table 22. Median overall survival times of patients having received chemotherapy
Table 23. GSEA of KEGG pathway ranked by a positive correlation with SOX9
expression in CCA patients (P<0.05, FDR<0.25)
Table 24. GSEA of KEGG pathways ranked by negative correlation with SOX9
expression in CCA patients (P<0.05, FDR<0.25)

CURRICULUM VITAE
86
8 CURRICULUM VITAE
Personal information
Name: Xiaodong Yuan
Date of birth: Feb. 1st, 1985
Nationality: Chinese.
Marital state: Happily married
Email: [email protected]
Address: Dammstrasse 10a, 68169, Mannheim
Education Oct. 2013-present
Ph.D. student (Dr.sc.hum.)
Ruprecht-Karls-University Heidelberg
Ph.D. project: SOX9 in the development and chemotherapy of cholangiocarcinoma
Sep. 2012 – Sep. 2013
M.Sc. Medical Physics
Ruprecht-Karls-University Heidelberg
Thesis: Radioimmunotherapy with Anti-CD66 Antibody: The Antigen Quantity
Evaluation of Organs of Interest Using a Physiologically Based Pharmacokinetic
Model
Aug. 2009 - July 2012
Master of Medicine
Peking University Shenzhen Hospital
Thesis: Investigating the expression features of T memory lymphocytes surface
markers: CD45RO, CD62L and CCR7 in Hepatocelluar carcinoma (HCC) patients
Sep. 2005 - July 2009
Bachelor of Medicine
Anhui Medical University
Scholarship Ph.D. scholarship from China Scholarship Council Publications
Weng H-L, CAI X, Yuan X, et al. Two sides of one coin: massive hepatic
necrosis and progenitor cell-mediated regeneration in acute liver failure.

CURRICULUM VITAE
87
Frontiers in Physiology
F Teng, J Dzieran, X Yuan, et al. Hepatocyte-specific Smad7 deletion
accelerates DEN-induced HCC via activation of STAT3 signaling in mice.
Oncogenesis
Cai XB, Zhang WX, Zhang RL, Yuan X, et al. Safety and efficacy of a novel
plastic stent coated with stone-dissolving agents for the treatment of biliary
stones in a porcine model. Endoscopy.
Conference presentations and published abstracts
GASL Poster presentation:
Lack of Polarity in liver progenitor cell-derived hepatocytes determines poor
clinical outcome of acute-on-chronic liver failure. Yuan, X. et al. Z
Gastroenterol 2016; 54(12): 1343-1404
ESAL Poster presentation:
April 2017 (Amsterdam, Young Investigator Bursary)
Formation of bile canaliculi in liver progenitor cell-derived hepatocytes
determines clinical outcome of acute-on-chronic liver failure. Yuan, X. et al.
Journal of Hepatology (ILC 2017 abstract book-No. FRI-417), Volume 66,
Issue 1, S337 - S338
June 2017 (Oslo, Full Young Investigator Bursary)
SOX9 is a crucial transcription factor in the development of intrahepatic
cholangiocarcinoma. OSLO 2017 – ebook. P05-07.
33rd Ernst Klenk Symposium in Molecular Medicine in Cologne
Transcription factor complex TRIM33-Smad2/3 is crucial for progenitor cell-
mediated liver regeneration in liver cirrhosis. Yuan, X. et al. Poster Abstracts
book D-10. 2017

ACKNOWLEDGEMENT
88
9 ACKNOWLEDGEMENT
Firstly, I would like to express my sincere appreciation to my mentor Professor Dr.
Steven Dooley. I will never forget the days when he helped me to revise my PhD
project proposal 4 years ago. I am extremely grateful that he provided me with the
opportunity of my scientific research in liver disease. I benefit a lot from his
professional knowledge and friendly guidance during my whole PhD project.
I would like to thank Dr. Honglei Weng for the continuous support in my Ph.D
research and thesis. His invaluable comments and suggestions encourage me to
complete my PhD thesis and are very useful for my career.
Thanks to the members of the Sektion Molecular Hepatology. I appreciate that I met
Bedair, Zeribe, Teng, Simeng, Anne and Tatjana in my 4 years PhD training. They
were always helpful. Without them, I would not have finished my project.
I would like to thank Professor Cédric Coulouarn and Dr. Jun Li for providing me with
precious tissue samples.
Especially, the Chinese Scholarship Council is gratefully acknowledged for financing
my whole project in Germany.
Last but not the least, I would like to thank my family: my parents and my brother and
sisters for supporting me throughout my life. In particular, my thanks come to my wife,
Yun, who has been there for me at all times. I sincerely appreciate her assistance in
my PhD study.
I appreciate… and want to say thanks.