Embed Size (px)
Citation preview

Soybean Complex Outlook:2003/04
Dr. Matthew C. RobertsThe Ohio State University
Midwest, Great Plains, and Western Outlook Conference
Indianapolis, IN August 14-15, 2003

2002/03 Highlights: Domestic Soybean Production
Yields (-7.2% v. trend; -4.5% v. 2001) Excellent yields in WCB Poor yields in ECB Avg/Below Avg Yields in South
Acreage 73.76m Planted 1.6m Abandoned
Improved Prices Soybeans: $5.45 (+23% v. 2001)

2002/03 Highlights: World Production
World Bean Production +6.2% US Production -5.5% South American Production
+19.7% Acreage +17%
Chinese Production +7.1% World Oilseed Production +5.5%

2002/03 Highlights: Domestic Bean Use
Meal Use -2.8% Lower hog numbers Increased DDG competition
Oil Use +0.8%

2002/03 Highlights: Bean Complex Exports
Beans -3%, Meal -21%, Oil -14% Large S. Am. crop and high US
prices dampened demand.

2003 US Crop
US Plantings: -0.5m acres Abandonment vs. Corn Shift in ECB?
Currently 72.7m acres for harvest, +0.5m
Nationwide, yield prospects very good: Crop development late Crop conditions quite good.

2003 S. Am. Crop
Plantings: +6% acres Prices lower than last year, weaker $
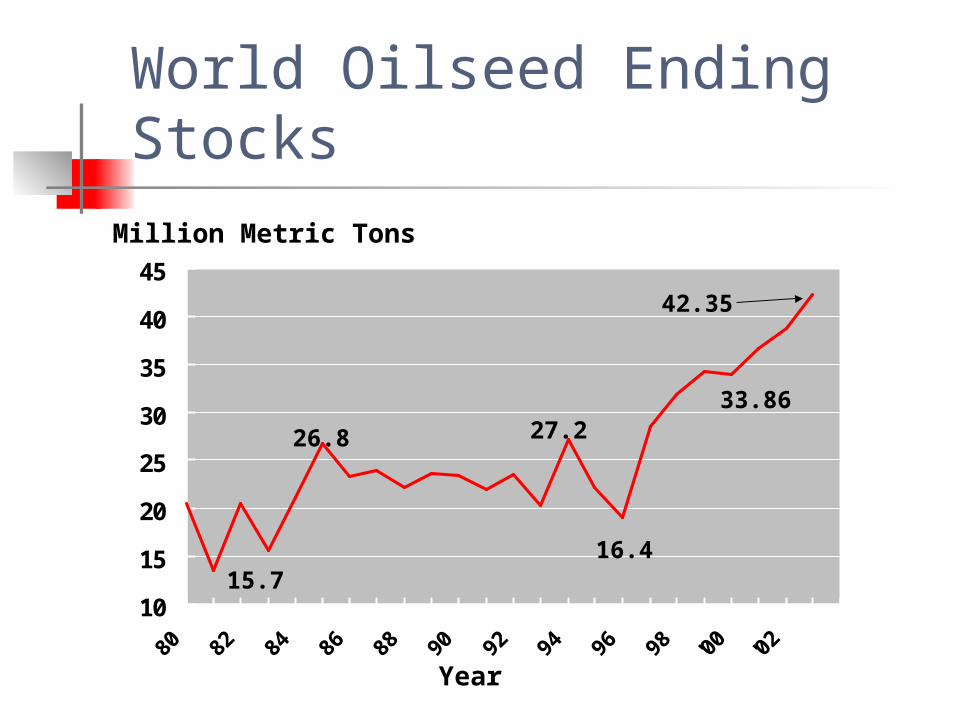
World Oilseed Ending Stocks
10
15
20
25
30
35
40
45Million Metric Tons
Year
27.2
16.4
42.35
15.7
26.8
33.86
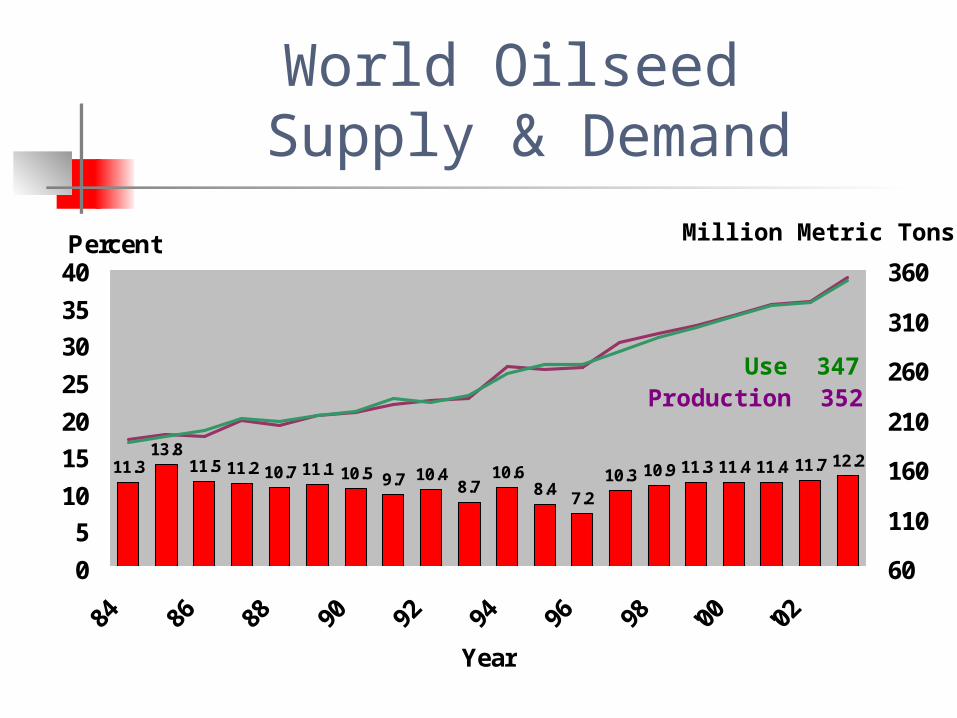
World Oilseed Supply & Demand
11.313.8
11.5 11.2 10.7 11.1 10.5 9.7 10.48.7
10.68.4
7.210.3 10.9 11.3 11.4 11.4 11.7 12.2
0
5
10
15
20
25
30
35
40
Year
Percent
60
110
160
210
260
310
360
Million Metric Tons
Production 352Use 347

World Soybean Supply & Demand
1925
19 19 18 20 19 17 1714
1813
915 16 17 18 18 18 19
0
10
20
30
40
50
60
70
Year
Percent
0
50
100
150
200
Production 207
Use 204
Million Metric Tons
Stocks-to-Use Ratio (%)
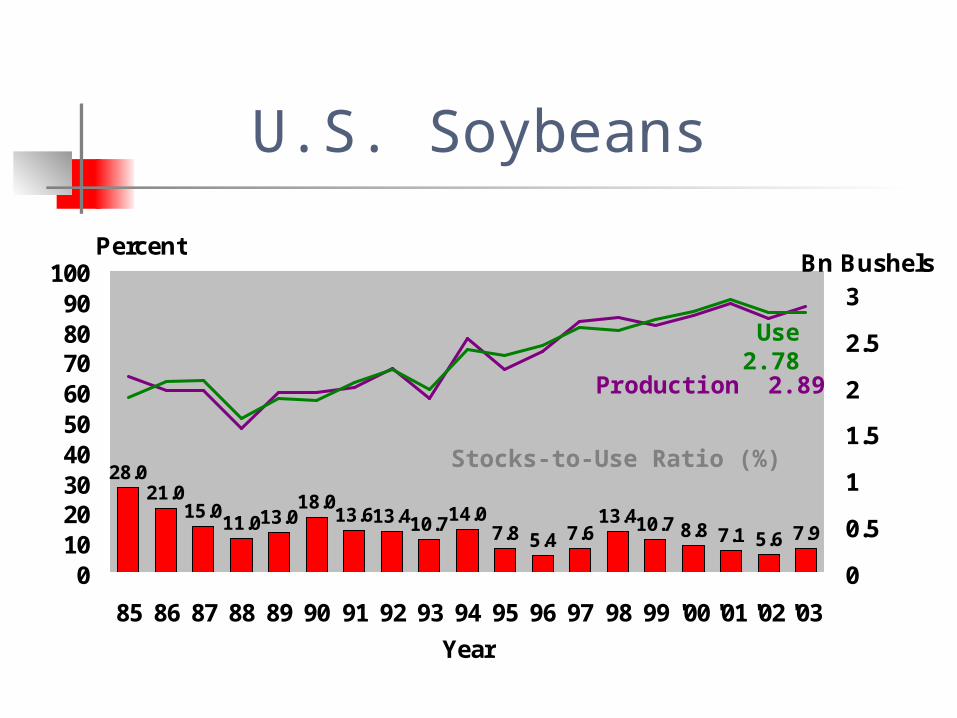
U.S. Soybeans
28.021.0
15.011.013.0
18.013.613.410.714.0
7.8 7.613.410.7 7.95.4 8.8 7.1 5.6
0102030405060708090
100
85 86 87 88 89 90 91 92 93 94 95 96 97 98 99 '00 '01 '02 '03
Year
Percent
0
0.5
1
1.5
2
2.5
3Bn Bushels
Use 2.78
Stocks-to-Use Ratio (%)
Production 2.89

U.S. Soybeans: Domestic Use
600
800
1,000
1,200
1,400
1,600
1,800
1970 1975 1980 1985 1990 1995 '00
Year
Mill
ion
Bu
she
ls
898
12041285
1820

U.S. Soybeans: Exports
300
400500
600
700800
900
1,0001,100
1,200
1970 1975 1980 1985 1990 1995 '00
Year
Million Bushels
539
929
804838
1000
589527
1070

4.004.505.005.506.006.507.007.508.008.509.00
0 5 10 15 20 25 30 35
Pri
ce:
$/b
u.
Stocks to use ratio
82
8586
87
83
84
92
88
90
8991
94
93
9596
1982-1990
1991-1997
97
9899
Soybeans: Stocks-Price Relationship
00
01
02 03
1998-2003

WAOB Projections for 2003/04
2002/03 Est 2003/04 ProjArea Planted 73.8 73.7 Harvested 72.2 72.6Yield per harvested acre (bu.) 37.8 39.4 Beginning stocks 208 145Production 2,730 2,862Imports 2 4 Supply, total 2,942 3,011Crushings 1,610 1,625Exports 1,040 1,000Seed 90 89Residual 57 77 Use, total 2,797 2,791Ending stocks 145 220Avg. farm price ($/bu) 5.50 4.55 - 5.55Stocks-to-Use Ratio 5.2% 7.9%
Million Acres
Milllion Bushels
Short-term risks/surprises Late crop development: more
uncertainty about final yields? Meal competition from ethanol by-
products Chinese demand Reduced Brazilian competition due
to USD weakness Current level of Brazilian stocks?

WAOB Projections for 2003/04
2002/03 Est 2003/04 Proj RangeArea Planted 73.8 73.7 Harvested 72.2 72.6Yield per harvested acre (bu.) 37.8 39.4 39 - 39.6 Beginning stocks 208 145Production 2,730 2,862 2.83 - 2.89Imports 2 4 Supply, total 2,942 3,011 2.98 - 3.03Crushings 1,610 1,625 (?)1650Exports 1,040 1,000 (?)1030Seed 90 89Residual 57 77 Use, total 2,797 2,791 2.79 - 2.84Ending stocks 145 220 160 - 300Avg. farm price ($/bu) 5.50 4.55 - 5.55 4.60 - 5.40Stocks-to-Use Ratio 5.2% 7.9% 5.7 - 10.7%
Million Acres
Milllion Bushels
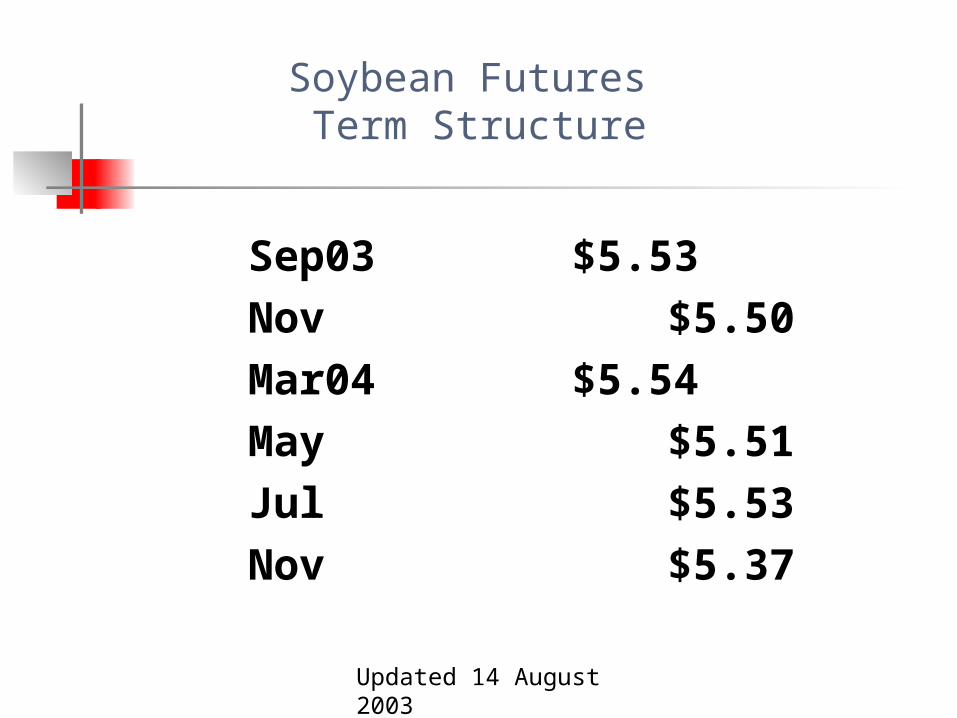
Soybean Futures Term Structure
Sep03 $5.53Nov $5.50Mar04 $5.54May $5.51Jul $5.53Nov $5.37
Updated 14 August 2003
Futures Prices
Currently imply national average price of $5.00 - $5.15
Where is the risk: Doing the right thing too late? Doing the wrong thing too early?
Marketing LDP’s are gone for now…will they
return? Volatility is very high. Small carryovers leave door open
for big moves. Look to sell at and above $5.50 @
CBOT.or….

Long-term
Brazil: how fast can they expand soybean production?
What is the price elasticity of demand?
How will China evolve? Is RR on the cusp of approval in
Brazil? If so, what does this mean for the US?