Embed Size (px)
Citation preview
SOYBEAN RESEARCH
Volume 3: 2005
Society for Soybean Research and Development
Directorate of Soybean Research Khandwa Road, Indore 452 017
Madhya Pradesh, India
ISSN 0973-1830

Society for Soybean Research and Development (Founded in 2003)
(Registration No. 03/27/03/07918/04)
EXECUTIVE COUNCIL
President : Dr. Om Prakash Joshi
Vice President : Dr. Girish Kumar Gupta
: Dr. A.N. Srivastava
General Secretary : Dr. Amar Nath Sharma
Joint Secretary : Dr. S.D. Billore
Treasurer : Dr. Mohd. Masaud Ansari
Members : Central Zone : Dr. S.B. Nahatkar and Dr. B.U. Dupare
: North Plain Zone : Dr. S.C. Saxena
: North Hill Zone : Dr. Jaidev
: North Eastern Zone : Dr. R. Lakhpale
: Southern Zone : Dr. R.H. Patil
EDITORIAL BOARD
Editor-in-Chief : Dr. O. P. Joshi
Editor (Crop Improvement) : Dr. H. N. Pandey, Head (Retd.), IARI- R S, Indore
Editor (Crop Production) : Dr. S. C. Deshmukh, Retd. Prof. (Agronomy),
College of Agriculture, Indore
Editor (Crop Protection) : Dr. H. C. Phatak, Visiting Professor (Plant Pathology),
DAVV, Indore
Editor (Processing) : Dr. A. P. Gandhi, Principal Scientist, CIAE, Bhopal
MEMBERSHIP TARIFF
Annual Subscription India Abroad Life Membership
Individual Rs. 200/- US$ 75/- Individual Rs. 2000/-
Students Rs. 100/- UD$ 60/-
Institutions Rs. 1500/- US$ 125/-
Corporate Rs. 15000/- US$ 1500/-
(Add Admission Fees Rs. 50/- or US$ 5/- to above subscription)
ADVERTISEMENT TARIFF
Back cover (outside) colour Full page Rs. 10000/-
Back cover (inside) colour Full page Rs. 5000/-
Half page Rs. 2500/-
Page facing back cover (B&W) Full page Rs. 2000/-
Half page Rs. 1000/-
Inside page (B&W) Full page Rs. 1500/-
Half page Rs. 750/-
Size Full page 20 x 14 cm
Half page 9 x 14 cm
SOYBEAN RESEARCH
ISSN 0973-1830 Volume 3: 2005
____________________________________________________________________________
CONTENTS Research papers
Induced Mutations in Soybean [Glycine max (L.) Merr.] Cv. MACS 450 D D Ahire, R J Thengane, J G Manjaya, Manju George and S V Bhide
01
Genetic Divergence in Indian Varieties of Soybean [Glycine max (L.) Merrill] B Sharma, B V Singh , Kamendra Singh, Pusphendra, A K Gupta and M K Gupta
09
Influence of Tillage Operations on Sustainable Production of Soybean Based Cropping Systems S D Billore, A Ramesh, O P Joshi and A K Vyas
17
Effect of Integrated Weed Management, Varieties and Crop Geometries on Weed Dynamics in Soybean N Pandya
23
Effect of Nutrients, pH and Temperature on the Growth and Sclerotium Formation in Sclerotium rolfsii and Amendments on Collar Rot in Soybean [Glycine max (L) Merrill] G K Gupta, MM Verma and S K Sharma
29
Effect of Pre-storage Treatments on Soybean Seed Quality Sandeep Kumar Lal, Ashok Gaur and Sushil Pandey
36
Quality Characteristics of Beverage Prepared from Milk-Soy Extract Blends D N Yadav and G S Chauhan
46
Soy Products and Its Relevance to India Nawab Ali
52
Knowledge of Women Respondents About the Health Benefits and Utility of Soybean for Food Uses B U Dupare, S S Vinayagam, S D Billore and O P Joshi
58
An official publication of Society for Soybean Research and Development, Indore
Short communications Effect of Enriched Compost in Combination with Fertilizers on Nodulation, Growth and Yield of Soybean [Glycine max (L.) Merrill] Amit Mishra , N Kumar, R Chandra and S K Singh
63
Effect of Integrated Nutrient Management and Spatial Arrangement on Growth and Yield of Hybrid Cotton and Soybean under Intercropping System P S Rathiya and R Lakpale
68
Evaluation of Compatible Combinations of Bacillus Thuringiensis, Insecticide and Fungicides for Insect Pests and Disease of Soybean (Glycine max) H R Chaudhary, V P Gupta and Mashiat Ali
73
Influence of Organic Amendments and Biorationals on Pod Borer Damage in Soybean (Glycine max (L.) Merrill) C Abhilash, R H Patil, R S Giraddi and P V Patil
76
1
Soybean Research, 3: 1-8 (2005)
Induced Mutations in Soybean [Glycine max (L.) Merr.] Cv. MACS 450
D D AHIRE1, R J THENGANE2, J G MANJAYA3, MANJU GEORGE4 AND S V BHIDE5
1 & 2Department of Botany, University of Pune- 411 007 3Nuclear Agriculture and Biotechnology Division, BARC, Trombay, Mumbai 400 085
4 & 5Department of Biochemistry University of Pune- 411 007 (Email: [email protected])
Received: 14.10.2005
ABSTRACT
Soybean variety MACS 450 was subjected to combination treatments of gamma rays and ethyl methane sulphonate (EMS) with an objective to induce variability for quantitative traits. The treatments of different combinations of gamma rays and EMS included 50Gy + 0.2 % EMS, 50Gy + 0.4 percent EMS, 100Gy + EMS (0.2 %) and 100Gy + EMS (0.4 %). The combination treatments of 50 and 100 Gy gamma rays doses with 0.4 percent EMS showed higher percentage of lethality as compared to their combinations with 0.2 percent EMS. Highest frequency of chlorophyll mutations was observed in combination treatment of 100 Gy gamma rays and 0.4 percent EMS. In M2 generation, a large number of morphological mutants with altered plant height, flower colour, sterility, leaf shape, pod number, seed size and colour and also the mutants with early or late maturity were isolated. The results indicated that 100 Gy gamma rays treatment in combination with 0.4 percent EMS was the most effective dose to induce a wide range of genetic variability in soybean.
Key words: Soybean, gamma rays, EMS, mutant
Soybean that occupies a coveted place among the oilseed crops, being cultivated all over the world, is an economically important leguminous crop for oil, feed and food products. In India, soybean attributes above 10 percent to the domestic edible oil pool, and the country earns substantial foreign exchange through export of soy-meal (Joshi, 2003). It has become a major oilseed crop of India, covering an area of about 6.46 million hectares with 6.93 million tonnes as annual production (Agrawal, 2005). Though the area and production has
increased, the national productivity is less than half as compared to the world average. The major constraints for low productivity of soybean are its poor seed viability and non-availability of early maturing, photo-insensitive, high yielding cultivars with resistance to biotic and abiotic stresses (Bhatnagar and Karmakar, 1995). Secondly the present day soybean cultivars are derived from narrow genetic base. The genetic variability present in any crop is of vital importance in the formulation of effective breed-
1,4Research Fellow; 2,5Professor; 3Scientific Officer
2
ing programme. Thus, the genetic variability generated by induced mutations can certainly help to recover the alleles for higher productivity and also for better plant type. However, mutation-breeding studies in soybean have lagged behind other economically important crops (Singh and Hymowitz, 1999). In India, so far only four varieties have been released through mutation breeding (Tara Satyavathi et al., 2003). In view of this background, the present studies were undertaken to induce mutations for earliness, improved plant architecture, moderate seed size, high number of pods and seed yield in the cultivar MACS 450 by combination treatments of gamma rays and EMS. MATERIAL AND METHODS
Dry seeds of soybean variety MACS 450 were subjected to combination treatments of gamma rays and EMS (50Gy + 0.2 % EMS, 50Gy + 0.4 % EMS, 100Gy + 0.2 % EMS and 100Gy + 0.4 % EMS). For each treatment, 800 seeds were exposed to gamma rays in gamma cell 200 with 60Co source installed at BARC and followed by the treatment with EMS prepared in phosphate buffer (pH 7.0) for 4 h. The treated seeds along with the control were sown in the experimental field at Department of Botany, University of Pune, Pune to raise the M1 generation. The data on germination were recorded at three to twelve days after sowing. The M1 plants were harvested individually and the seeds obtained were used to raise the M2 generation as plant-to-row progenies. The M2 population was carefully screened for morphological
mutations. Since, lethal chlorophyll mutants do not grow beyond the cotyledonary stage, chlorophyll mutations were scored immediately after the emergence of cotyledons. Plants appearing different from the control for one or more morphological traits were harvested separately. RESULTS AND DISCUSSION Studies on M1 generation
Studies on various parameters have been carried out extensively in soybean to understand the biological effects of mutagen. Constantin et al. (1976) observed reduction in survival, plant height and seed yield with increase in dose/rate of mutagen. Germination and plant survival in M1 generation have been extensively used in soybean to measure the mutagenic effect (Mehetre et al., 1994). The effects of physical and chemical mutagens on gene/ chromosomal mutations in the biological method could be measured quantitatively by degree of reduction in germination percentage, seedling survival, growth and fertility (Gaul, 1970). The treatments with 50 and 100 Gy gamma ray doses in combination with 0.4 percent EMS showed higher values for percent lethality as compared to the combination treatment with 0.2 percent EMS (Table 1). Perez (2000) has also observed differential response of the soybean varieties to the same dose of gamma rays for germination. In our studies high lethality was observed and may be attributed to the injuries caused by combined mutagenic treatments of gamma rays and EMS.
3
Chlorophyll mutations In the M2 population, four
different types of chlorophyll mutations namely albina, xantha, chlorina and viridis were observed (Table 2). Highest frequency of chlorophyll mutations was observed in the combined treatment of 100 Gy gamma rays and 0.4 percent EMS. The frequency of albina mutants that survived only 3-4 days after emergence was higher in the treatment with 0.4 percent EMS combined with 50 Gy or 100 Gy gamma rays. Chlorophyll mutations occur in high frequency following
mutagenic treatments of seeds. Many researchers regard them as test mutations assuming that their frequency is proportional to the rate of viable mutations. Naskida and Koduata (1980) reported high frequency of chlorophyll mutations after irradiation with 5 and 20 Kr gamma ray doses. They observed high frequency of mutations, somatic mosaicism and mitotic crossing over. Various chlorophyll mutations like albina, xantha, chlorina, virescent, maculata and striata were observed in soybean earlier also (Harb, 1990; Geetha and Vaidyanathan, 2000).
Table 1. Germination and survival percentage in M1 generation Treatments Seed
sown (No.)
Plants survived
(No.)
Germination (%)
Lethality (%)
Control (MACS-450) 200 191 95.50 4.50 50 Gy gamma rays+ EMS (0.2 %) 800 514 64.25 35.75
50 Gy gamma rays +EMS (0.4 %) 800 425 53.13 46.87 100 Gy gamma rays+ EMS (0.2%) 800 490 61.25 38.75 100 Gy gamma rays+ EMS (0.4%) 800 466 58.25 41.75
Table 2. Frequency and spectrum of induced chlorophyll mutations in the M2
generation in soybean
Treatments Plants in M2 (No.)
Chlorophyll mutants
(No.)
Frequency and spectrum of chlorophyll mutants
Albina Xantha Chlorina Viridis
50 Gy gamma rays + EMS (0.2 %)
11,168 86 - 13 (15.1) 17 (19.8) 56 (65.1)
50 Gy gamma rays + EMS (0.4 %)
5,948 120 2 (1.66) 14 (11.7) 45 (37.5) 49 (49.2)
100 Gy gamma rays + EMS (0.2 %)
12,039 56 - 9 (16) 16 (28.6) 31 (55.4)
100 Gy gamma rays + EMS (0.4%)
7,890 227 17 (7.48) 16 (15.9) 68 (29.6) 106 (46.6)
Total 37,045 489 19 (3.88) 52 (10.63) 126 (25.76) 242 (49.48) (.) – Percent frequency
4
Viable mutations
A number of viable mutations were observed in the M2 generation in all the four treatments (Table 3). The spectrum of viable mutations ranged from flower colour mutants to those with agronomically important traits. Frequency of morphological mutants ranged from 3.46 to 9.68 percent and was highest in combined treatment of 100Gy gamma rays with 0.4 percent EMS. The
frequency of viable mutations increased with increase in concentration of EMS. The frequency of viable mutations is reported to be dose dependent (Caroll et al., 1986). Mutations affecting gross morphological changes according to system suggested by Swaminathan (1965) were broadly classified as mutants for height, growth habit, foliage, flower colour, maturity, pod colour, seed characters and sterility (Table 3).
Table 3. Spectrum of induced viable mutants in the M2 generation Character of the mutant
Plants selected in M2 (No.)
50 Gy gamma rays + EMS
(0.2%)
50 Gy gamma rays + EMS
(0.4%)
100 Gy gamma rays +
EMS (0.2%)
100 Gy gamma rays + EMS
(0.4%)
M2 plant screened
11,168 5,948 12,039 7,890
Growth habit Stunted 3 20 2 30 Dwarf 89 71 36 30 Semi dwarf 30 23 16 91 Tall 1 - 4 45 Very tall - 2 - 2 Giant - - 1 6 Compactoid 9 28 4 29 Dwarf bushy - 8 1 4 Coloured branches
2 - - 13
Branched 7 6 2 11 Unbranched 31 39 39 7 Erect 12 20 9 6 Bolted 3 13 5 4 Dark green 19 48 11 18 High yielding 5 9 4 17 Flower colour White 2 42 63 - Pink - 3 - 1 Violet 1 1 1 7

5
Table 3 contd. Sterile 55 80 44 138 Maturity Early flowering 15 8 3 39 Late flowering - 1 6 3 Early maturity - 3 1 - Late maturity - - 3 33 Pod mutants Pale yellow 2 - - 17 Dark yellow 2 - - - Pinkish yellow - - - 6 Ash - 6 - - Leaf mutants Lanceolate 25 22 9 6 Elliptical 6 9 - 7 Oblong - - - 6 Linear - 5 - - Small leaflets 24 30 14 29 Broad leaflets 3 16 5 13 Round 8 12 1 9 Crinkled 17 26 27 50 Smooth leaf 3 - - - Feathery leaf 7 14 5 18 Tetrafoliate - - - 3 Pentafoliate 3 1 - 1 Total 386 (3.46) 583 (9.80) 318 (2.64) 764 (9.68) ( ) Percent frequency
Growth habit mutations
The mutations affecting height of plants were identified and classified as dwarf, semi dwarf, very tall and giant. The mutants showed remarkable variation in height as compared to that of the parent MACS 450. Mutations for other plant characteristics included bushy, compact, pigmented-branched, unbranched and erect. Similar mutants have been reported earlier for altered plant architecture in soybean (Alexieva, 1991; Mehetre et al., 1994; Wakode et al.,
2000). In the present studies high yielding mutants bearing more number of pods were also observed. Ram et al. (1982) observed high variability for plant height and pods per plant in M3 generation of soybean varieties when treated with gamma rays and EMS. High yielding mutants were also isolated by Rajput and Sarwar (1998) following gamma ray irradiation. Leaf mutations
Several leaf mutants were isolated in the present studies. These in-

6
cluded mutations with alterations in the leaflet number, size, shape and structure. Many mutants with different types of leaves like curly, thick, linear (sword shape), lanceolate, wavy, obtuse apices, small, broad, wrinkled, tetrafoliate and pentafoliate were observed. Commonly, soybeans have trifoliate leaves, rarely with five leaflets or multifoliate leaves. Wakode et al. (2000) also observed crinkle leaf mutant in the gamma ray irradiated population. Leaf mutants like narrow and dark green leaves (Naskida and Koduata, 1980), two opposite trifoliate leaves per node (Laiquing, 1986) have also been reported in soybean. Flower mutations
Different flower colour mutants including pink and white were obtained from the purple flower coloured MACS 450 in the present studies. Pink coloured soybean flower was earlier identified by Stephens and Nickell (1991). The genetic analysis revealed the unique color was
due to homozygous recessive wp alleles in the presence of W1. Pink flowered lines averaged 22 percent higher in seed weight, and 4 percent higher in protein content compared to purple flower lines from same background (Stephens et al., 1993). Bhatnagar et al. (1990) obtained white flower mutants in the M2 population. Pink flower mutant was also isolated in soybean by Smutkupt (1996). Mutations affecting maturity
The parent MACS 450 flowered in
40-45 days after sowing and crop matured in 90-95 days. Based on the days to flowering and days to maturity four distinct category of mutants were
isolated. These included early flowering mutants blooming 7-10 days earlier than control. Late flowering mutants flowered 30-60 days later than control. This type of mutant was mostly found in the combination treatment of 100Gy and 0.2 percent EMS. Early maturity was found in the treatment of 50Gy and 0.4 percent EMS. But one mutant of 58 days late maturity was found in treatment of 100 Gy and 0.2 percent EMS. Early maturing mutants have been isolated obtained by Tulman and Pieixoto (1990) in the cultivar Parana following treatment with 220 Gy gamma rays. Xue Bai et al. (2000) induced early maturity in soybean variety by gamma ray treatment and late maturity was obtained with combination treatment of gamma rays and EMS.
Mutations affecting pod and seed characters
Different pod colour mutants like pale yellow; dark yellow and ash were observed as compared to brown pods of the parent. Non-shattering pod mutants were also obtained. The seeds in parent variety are medium in size with pale yellow seed coat and black hilum. Remarkable variations in size, shape, and colour of seed coat and hilum were observed. The prominent seed coat colour mutants like white, dark yellow, black and yellow (black saddle) were identified. Pods of control plant were brown in colour but due to mutations different pod colour mutants like pale yellow, dark yellow and ash coloured were observed in M2 population. Many reports of induced mutations for seed colour (Kerketta and

7
Haque, 1986; Mehta et al., 1994), hilum colour (Bhatnagar et al., 1990) and seed size (Bhatnagar et al., 1989; Husain et al., 1998) are available in the literature.
In breeding programmes, hybridization provides unlimited possibilities of generating new combinations of characters, which can be selected in the segregating population. In contrast, by induced mutations it is possible to improve a single trait without causing extensive disruption in the genome. The use of induced mutation techniques for crop improvement over the past few decades has shown that it is an effective plant breeding method to improve yield, quality and resistance to biotic and
abiotic stresses (Nichterlein et al., 2000). In the present studies significant variations for morphological characters indicated the effectiveness of the combined treatments of physical (gamma ray) and chemical (EMS) mutagens. The results also indicated that a dose of 100Gy gamma rays in combination with 0.4 percent EMS was more effective in inducing broad genetic variability in soybean. The selected mutants could be further exploited by large-scale cultivation or breeding to combine the desirable traits in high yielding soybean genotypes. In addition, these can be used as source material for cloning of mutant genes for their further utilization in crop improvement programme.
ACKNOWLEDGEMENT
The authors gratefully acknowledge the financial assistance received from Board of Research in Nuclear Sciences (BRNS), Department of Atomic Energy, Government of India
for undertaking the present work.
REFERENCES
Agrawal E. 2005. Soybean industry scenario in India. In: Souvenir, All India Convention on Oilseeds, Oils Trade and Industry, held from 12-13 November 2005 at Indore, pp 22-25.
Aleksieva A. 1991. Dwarf soybean mutative strain with vertically arranged leaves and increased protein content. Comptes Rendus de l Academic Bulgare des Sciences 44: 93-5.
Bhatnagar P S, Tiwari S P and Sandhu, J S. 1989. Improvement of soybean variety „Bragg‟ through mutagenesis. Mutation Breeding Newsletter 33: 15
Bhatnagar P S, Tiwari S P and Prabhakar. 1990. Application of mutagenesis for the improvement of an indigenous black seeded soybean variety of India. Mutation Breeding Newsletter 36: 8.
Bhatnagar P S and Karmakar P G. 1995. Achievements and prospects of breeding researches on soybean (Glycine max) in India. Indian Journal of Agricultural Sciences 65: 1-9.
Caroll B J, Mcneil D L and Gresshoff P M. 1986. Mutagenesis of soybean (Glycine max (L.) Merr.) and isolation of non-nodulating mutants. Plant Science 47: 109.
Constantin M J, Klobe W D and Skold L M. 1976. Effect of physical and chemical mutagens on survival, growth and seed yield of soybean. Crop Science 16: 49–52.
Gaul H 1970. Mutagen effect observable in the first generation. I. Plant injury and lethality. II. Cytological effect. III. Sterility. Manual on Mutation Breeding IAEA, Vienna, Technical Report Serial Number 119: 85-99.
Geetha K and Vaidyanathan P. 2000. Studies on induction of chlorophyll mutations in soybean through physical and chemical mutagens. Agricultural Science Digest 20: 33–5.
Harb R K H. 1990. Frequency spectrum, anatomical and chemical studies on soybean chlorophyll mutations. Bulletin of Faculty of Agriculture
University of Cairo 41: 595–608.

8
Husain S M, Bhatnagar P S and Karmakar P G. 1998. Radiation induced variability for seed longevity of soybean variety NRC – 7. Soybean Genetics Newsletter 25: 83.
Joshi O P. 2003. Future perspectives of soybean in India. Soybean Research 2: 29–42.
Kerketta V and Haque Md F. 1986. Recent advances in mutation breeding in soybean in India. Soybean Genetics Newsletter 13: 84–5.
Laiquing Fu. 1986. Study of mutants with opposite trifoliate leaves and multi-leaflet leaves in soybeans. Mutation Breeding Newsletter 27:11.
Mehetre S. S, Mahajan C R, Ghatge R D and Dhumal P M. 1994. Induced genetic variability and character association in soybean. Crop Research (Hisar) 8: 348–53.
Mehta A K, Mehta S K and Tiwari A S. 1994. Improvement of genetic architecture of local cultivar kalitur of soybean by mutation. Indian Journal of Genetics and Plant Breeding. 54: 357–9.
Naskida P P and Kodua T A. 1980. Production of new chlorophyll mutation of soybean following treatment with gamma rays. Bulletin of Academic of Science Georgias SSR 99: 177–180.
Nichterlein K, Bohlman H, Niclen S and Maluszynski M. 2000. Achievements and trends of using induced mutations in crop improvement. In: Proceedings, DAE-BRNS Symposium on Use of Nuclear and Molecular Techniques in Crop Improvement, Dec 6-8, 2000, Mumbai, India, pp 27-35.
Perez T S. 2000. Influence of genotype and the interval between exposures to radiation fractions on radiosensitivity of soybean. Alimentaria 37: 69–71.
Ram H H, Pushpendra, Verma V D and Singh K 1982. Note on the effect of selection
for quantitative traits in the M3 progenies of soybean. Indian Journal of Agricultural Science 52: 404.
Rajput M. A and Sarwar G. 1998 Genetic improvement of soybean through induced mutations. Soybean Genetics Newsletter 25: 97–8.
Singh R J and Hymowitz T. 1999. Soybean genetic resources and crop improvement. Genome 42: 605–16.
Smutkupt S. 1996. Observations of unstable genes of flower and seed coat colours in soybean derived from a „Wakashima‟ mutant. Soybean Genetics Newsletter 23: 120–2.
Stephens P A and Nickell C D. 1991 A pink flower colour mutant in Soybean. Soybean Genetics Newsletter 18: 226-8.
Stephens P A, Nickell C D and Vodkin L O. 1993. Pink flower colour associated with increased protein and seed size in soybean. Crop Science 33: 1135-7.
Swaminathan M S. 1965. A comparison of mutation induction in diploid polyploids. In: The use of Induced Mutations in Plant Breeding. Radiation Botany (Supplementary) 5: 619-41.
Tara C Satyavathi, Karmarkar P G, Bharadwaj Ch and Tiwari S P 2003. Ancestral analysis of soybean varieties: An overview. Indian Journal of Genetics and Plant Breeding 63: 87-88.
Tulmann Neto A and Pieixoto T C. 1990. Early maturing and good yield mutants in soybean (Glycine max (L.) Merr.) in Brazil. Mutation Breeding Newsletter 36: 9.
Wakode M M, Nandanwar R S and Patil G P. 2000. Radiation induced mutagenesis in soybean (Glycine max L. Merill). In: Proceedings, DAE – BRNS Symposium on the use of Nuclear and Molecular Techniques in Crop Improvement, Dec 6–8, 2000, Mumbai, India, pp 113–16.
Xue Bai, Meng LiFen, Zhan XiaoNaw, Guo YuHong and Liu BinHong. 2000.
Mutagenic effect of 60Co radiation on soybean plants. Soybean Science 19: 150–3.

9
Soybean Research, 3: 9-16 (2005)
Genetic Divergence in Indian Varieties of Soybean [Glycine max (L.) Merrill]
B. SHARMA1, B.V. SINGH2, KAMENDRA SINGH3, PUSPHENDRA4, A.K. GUPTA1 and M.K. GUPTA
Department of Genetics and Plant Breeding, College of Agriculture, G.B. Pant University of Agriculture and Technology, Pantnagar – 263 145,
Uttaranchal (E-mail : [email protected])
Received: 14.12.2005
ABSTRACT
Genetic divergence using Mahalanobis D2 analysis among 62 varieties of soybean based on seventeen characters led to their grouping into fifteen clusters out of which nine were monogenotypic. PK 472 and SL 295 have been identified as the most potential parents for hybridization programme. Among the seventeen characters, protein percentage contributed maximum to the genetic divergence, followed by number of pods per plant and seed yield per plant. This indicated that these characters were mainly responsible for genetic divergence in the parent material. The highest divergence was observed between cluster XV and IX followed by cluster XV and XIV, which may serve as potential parents for hybridization programme. Based on the cluster mean values of different characters, donors for use in breeding programme for carrying out improvement in respective character were suggested.
Key words : Glycine max, genetic divergence, cluster
Soybean [Glycine max (L.) Merrill] tops the list of oilseed crops at the global level. Soybean, a major oilseed crop of India, is contributing to the extent of one tenth of domestic edible oil pool and the country earns substantial foreign exchange through the export of soy-meal. However, overall improvement in yield, oil and protein content in soybean remains a perpetual task to be accomplished by the plant breeders. This can be achieved through selection, efficiency of which mainly depends on the extent of variability existing in the available gene pool. However, in the case
of Indian soybean varieties, a narrow genetic base has been observed, whereas now-a-days in soybean breeding, maximum involvement of improved soybean cultivars is being observed in hybridization programmes to create genetic variability. The use of related wild species is at minimum bringing about a very low impact on broadening of genetic base in soybean. Hence, knowledge on genetic divergence in the available cultivars of soybean has an immense importance and in tune with immediate need in the selection of parents to be used in hybridization
1Research Scholar;
2Professor;
3 ,4Senior Research Officer

10
programme for obtaining desirable genetic recombination. The present studies were therefore, undertaken to ascertain the genetic divergence in 62 soybean cultivars, available in India. MATERIAL AND METHODS
Genetic divergence measured by Mahalanobis D2 statistics (Mahalanobis, 1936) was studied in 62 Indian varieties of soybean (Table 1) for seventeen characters namely, days to initiation of flowering, days to fifty per cent flowering, days to maturity, flowering span, reproductive phase, basal node height, basal pod height, plant height, number of primary branches per plant,
number of nodes per plant, number of pods per plant, number of seeds per pod, number of seeds per plant, grain yield per plant, hundred seed weight, total oil and protein contents. They were planted in a single row plot of three metre length with spacing of 60 cm × 10 cm in a Completely Randomized Block Design with two replications, at the Crop Research Centre of G. B. Pant University of Agriculture and Technology, Pantnagar during kharif season of 2002. The observations were recorded on five randomly selected competitive plants. The mean values of each character were subjected to analysis of variance. The criterion used by Tocher (Rao, 1952) was followed for making group constellation.
Table 1. Pedigree of Indian varieties of soybean Variety Pedigree Developed / released
Alankar D 63-6094 × D 61-4249 Pantnagar Ankur Composite of 22 crosses Pantnagar Bragg Jackson × D 49-2491 Pantnagar Birsa Soya 1 Mutant of Sepaya black Ranchi Co 1 Selection from EC 39821 Coimbatore Co 2 UGM 21 × JS 335 Coimbatore GS 1 Selection from Punjab 1 Gujarat Hardee Introduction from U.S.A. Karnataka HIMSO 1563 (Ankur × HIMSO 330) × Bragg Palampur Improved Pelican Introduction from U.S.A. Karnataka Indira Soya 9 Selection from JS 80-21 Raipur JS 2 Indigenous selection Jabalpur JS 335 JS 78-77 × JS 71-05 Jabalpur JS 71-05 Selection from exotic material Jabalpur JS 72-280 EC 14437 × Bragg Jabalpur JS 72-44 D 60-9647 × EC 7034 Jabalpur JS 75-46 Improved pelican × Seemes Jabalpur JS 76-205 Kalitur × Bragg Jabalpur JS 79-81 Bragg × Hara Soya Jabalpur JS 80-21 JS 71-1 × PK 73-94 Jabalpur JS 90-41 PS 73-7 × Hark Jabalpur
11
Table 1 Contd. Kalitur Land race Bangalore KB 79 Hardee × Monetta Bangalore KHSb 2 Manloxi × EC 39821 Karnataka Lee S100 × CMS Pune MACS 124 JS 2 × Improved Pelican Pune MACS 13 Hampton × EC 7034 Pune MACS 330 Monetta × EC 95937 Pune MACS 450 Bragg × MACS 111 Pune MACS 57 JS 2 × Improved Pelican Pune MACS 754 Bragg × JS 335 Pune MACS 58 JS 2 × Improved Pelican Pune MAUS 2 Selection from SH 81-14 Prabhani MAUS 32 Prabhani MAUS 47 Selection from MACS 308 Prabhani Monetta EC 2587 Prabhani NRC 2 Mutant of Bragg Indore NRC 12 Mutant 95-10 (parent Bragg) Indore NRC 37 Gaurav × Punjab 1 Indore NRC 7 Selection from S 69-96 Indore PS 1024 PK 308 × PK 317 Pantnagar PK 1029 PK 262 × PK 317 Pantnagar PK 262 UPSM 97 × Hardee Pantnagar PK 308 T 31 × Hardee Pantnagar PK 327 UPSM 82 × Seemes Pantnagar PK 416 UPSM 534 × S 38 Pantnagar PK 471 Hardee × Punjab 1 Pantnagar PK 472 Hardee × Punjab 1 Pantnagar PK 564 (UPSM 534 × S 38) × Bragg Pantnagar Punjab 1 Selection from Nanking variety Pantnagar PUSA 16 CMS × Lee Pusa, New Delhi PUSA 20 Bragg × Lee Pusa, New Delhi PUSA 22 Punjab × Clark 63 Pusa, New Delhi PUSA 24 Shelby × Bragg Pusa, New Delhi PUSA 37 Bragg × Java 16 Pusa, New Delhi PUSA 40 8-3 × Lee Pusa, New Delhi Samrat Local cultivar Jabalpur Shilajeet Selection from EC 9309 Pantnagar Shivalik Selection from PK 73-55 Palampur SL 295 PK 416 × PK 564 Ludhiana T 49 From local germplasm selection Kanpur VLS 47 Selection from KHSb 3-1-1 Almora
12
RESULTS AND DISCUSSION
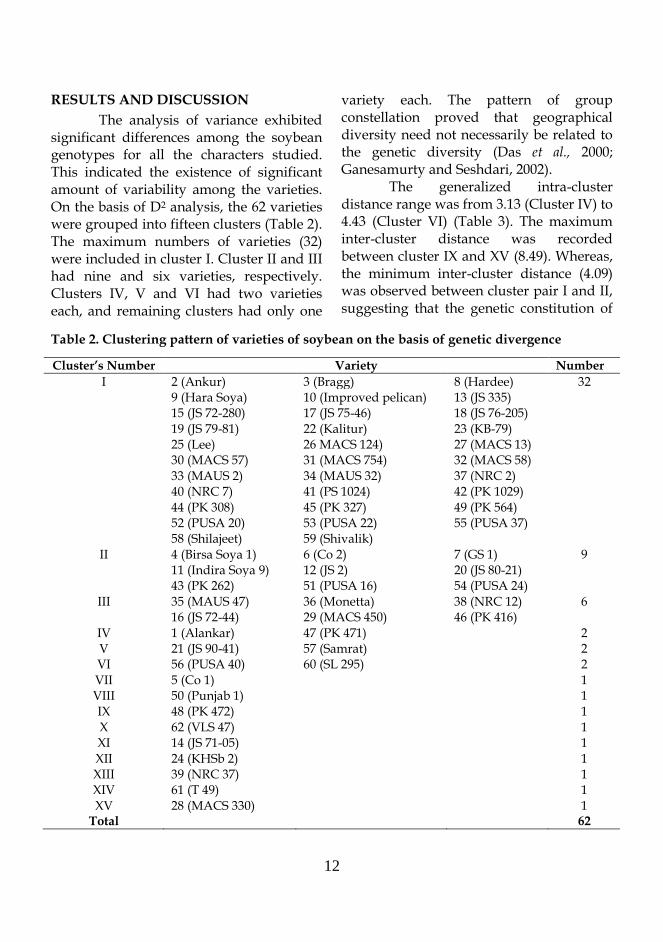
The analysis of variance exhibited significant differences among the soybean genotypes for all the characters studied. This indicated the existence of significant amount of variability among the varieties. On the basis of D2 analysis, the 62 varieties were grouped into fifteen clusters (Table 2). The maximum numbers of varieties (32) were included in cluster I. Cluster II and III had nine and six varieties, respectively. Clusters IV, V and VI had two varieties each, and remaining clusters had only one
variety each. The pattern of group constellation proved that geographical diversity need not necessarily be related to the genetic diversity (Das et al., 2000; Ganesamurty and Seshdari, 2002).
The generalized intra-cluster distance range was from 3.13 (Cluster IV) to 4.43 (Cluster VI) (Table 3). The maximum inter-cluster distance was recorded between cluster IX and XV (8.49). Whereas, the minimum inter-cluster distance (4.09) was observed between cluster pair I and II, suggesting that the genetic constitution of
Table 2. Clustering pattern of varieties of soybean on the basis of genetic divergence
Cluster’s Number Variety Number
I 2 (Ankur) 3 (Bragg) 8 (Hardee) 32 9 (Hara Soya) 10 (Improved pelican) 13 (JS 335) 15 (JS 72-280) 17 (JS 75-46) 18 (JS 76-205) 19 (JS 79-81) 22 (Kalitur) 23 (KB-79) 25 (Lee) 26 MACS 124) 27 (MACS 13) 30 (MACS 57) 31 (MACS 754) 32 (MACS 58) 33 (MAUS 2) 34 (MAUS 32) 37 (NRC 2) 40 (NRC 7) 41 (PS 1024) 42 (PK 1029) 44 (PK 308) 45 (PK 327) 49 (PK 564) 52 (PUSA 20) 53 (PUSA 22) 55 (PUSA 37) 58 (Shilajeet) 59 (Shivalik)
II 4 (Birsa Soya 1) 6 (Co 2) 7 (GS 1) 9 11 (Indira Soya 9) 12 (JS 2) 20 (JS 80-21) 43 (PK 262) 51 (PUSA 16) 54 (PUSA 24)
III 35 (MAUS 47) 36 (Monetta) 38 (NRC 12) 6 16 (JS 72-44) 29 (MACS 450) 46 (PK 416)
IV 1 (Alankar) 47 (PK 471) 2 V 21 (JS 90-41) 57 (Samrat) 2 VI 56 (PUSA 40) 60 (SL 295) 2 VII 5 (Co 1) 1 VIII 50 (Punjab 1) 1 IX 48 (PK 472) 1 X 62 (VLS 47) 1 XI 14 (JS 71-05) 1 XII 24 (KHSb 2) 1 XIII 39 (NRC 37) 1 XIV 61 (T 49) 1 XV 28 (MACS 330) 1
Total 62

13
Table 3. Average inter and intra-cluster D values
Cluster I II III IV V VI VII VIII IX X XI XII XIII XIV XV
I 3.80 4.09 4.32 4.94 5.04 4.80 4.76 4.71 4.99 4.93 5.49 4.81 4.89 5.80 7.52
II 3.85 4.55 5.04 5.35 4.95 4.90 5.23 5.35 4.81 6.18 4.34 4.76 5.90 7.46
III 3.99 5.44 5.47 5.32 5.13 4.99 5.33 5.28 6.36 5.07 5.60 6.24 7.80
IV 3.13 6.41 4.77 5.91 5.65 5.33 6.26 5.79 5.97 6.48 6.45 7.80
V 3.81 5.36 5.90 6.01 6.69 6.67 6.67 5.72 6.21 6.87 7.68
VI 4.43 5.43 5.25 5.50 5.13 6.92 5.85 5.75 6.53 8.11
VII 0.00 4.66 4.89 5.12 5.59 5.15 4.84 5.96 7.22
VIII 0.00 4.80 6.23 6.97 6.31 4.91 5.70 7.89
IX 0.00 4.72 4.92 6.45 5.72 7.31 8.49
X 0.00 6.22 6.22 5.92 6.72 8.12
XI 0.00 5.43 7.65 6.78 8.12
XII 0.00 5.72 6.40 7.55
XIII 0.00 6.97 8.30
XIV 0.00 8.40
XV 0.00
these genotypes in one cluster is in close proximity with the genotypes in other cluster of the pair. Hybridization between genotypes from highly divergent groups should result in maximum hybrid vigour and highest number of useful segregants (Shwe et al., 1972). Hybridization between genotypes from highly divergent groups could even produce new and heterotic unknown gene combinations. Hybridization between genetically distant genotypes promising breeding material has been suggested frequently (Sichkar et al., 1998).
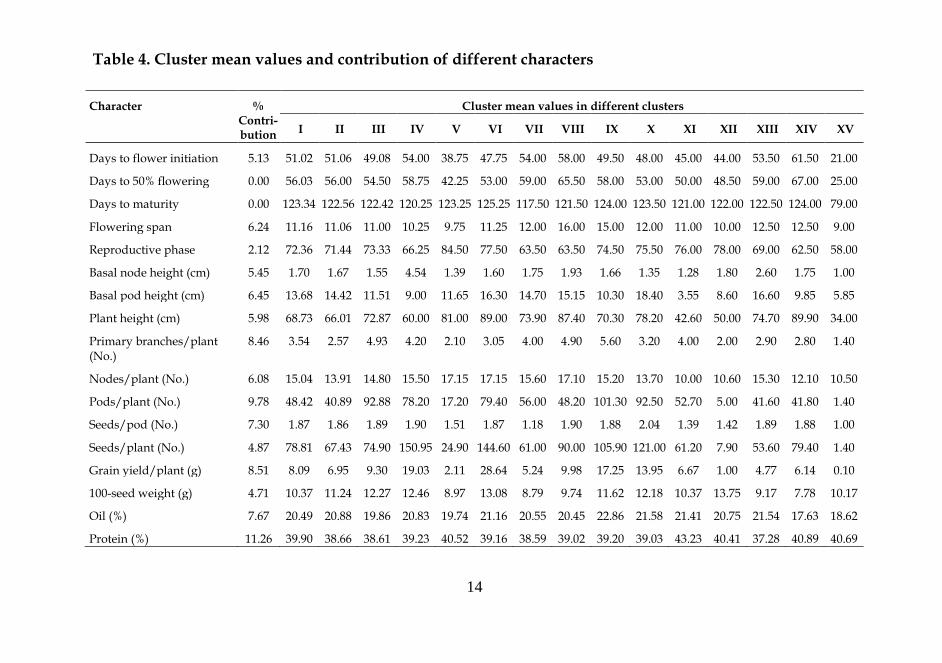
The average cluster means for different characters (Table 4) show that varieties included in clusters XV, V, XII, XI, VI and X were early flowering. The variety PK 472 forming a separate cluster (IX) had maximum mean values for number of primary branches, number of pods and oil percentage. Thus, PK 472
holds great promise as a parent to obtain promising hybrids and create further variability for these characters.
Based on the genetic divergence analysis, it would be possible to point out some potential combinations, subject to the condition that environment maintain the relative expression of characters with regard to the genotypes. The potential combinations based on the D2 statistics were found to be PK 472 × T 49, VLS 47 × T 49, KHSb 2 × PK 472, MACS 330 × PK 472, PUSA 40 × PK 472, SL 295 × PK 472, JS 90-41 × PK 472, JS 90-41 × T 49, Samrat × PK 472 and Samrat × T 49. These combinations should result in maximum hybrid vigour and highest number of useful segregants during the process of selection in the genotypes of soybean.
The various donors identified for
different characters through this study are,
14
Table 4. Cluster mean values and contribution of different characters
Character % Contri-bution
Cluster mean values in different clusters
I II III IV V VI VII VIII IX X XI XII XIII XIV XV
Days to flower initiation 5.13 51.02 51.06 49.08 54.00 38.75 47.75 54.00 58.00 49.50 48.00 45.00 44.00 53.50 61.50 21.00
Days to 50% flowering 0.00 56.03 56.00 54.50 58.75 42.25 53.00 59.00 65.50 58.00 53.00 50.00 48.50 59.00 67.00 25.00
Days to maturity 0.00 123.34 122.56 122.42 120.25 123.25 125.25 117.50 121.50 124.00 123.50 121.00 122.00 122.50 124.00 79.00
Flowering span 6.24 11.16 11.06 11.00 10.25 9.75 11.25 12.00 16.00 15.00 12.00 11.00 10.00 12.50 12.50 9.00
Reproductive phase 2.12 72.36 71.44 73.33 66.25 84.50 77.50 63.50 63.50 74.50 75.50 76.00 78.00 69.00 62.50 58.00
Basal node height (cm) 5.45 1.70 1.67 1.55 4.54 1.39 1.60 1.75 1.93 1.66 1.35 1.28 1.80 2.60 1.75 1.00
Basal pod height (cm) 6.45 13.68 14.42 11.51 9.00 11.65 16.30 14.70 15.15 10.30 18.40 3.55 8.60 16.60 9.85 5.85
Plant height (cm) 5.98 68.73 66.01 72.87 60.00 81.00 89.00 73.90 87.40 70.30 78.20 42.60 50.00 74.70 89.90 34.00
Primary branches/plant (No.)
8.46 3.54 2.57 4.93 4.20 2.10 3.05 4.00 4.90 5.60 3.20 4.00 2.00 2.90 2.80 1.40
Nodes/plant (No.) 6.08 15.04 13.91 14.80 15.50 17.15 17.15 15.60 17.10 15.20 13.70 10.00 10.60 15.30 12.10 10.50
Pods/plant (No.) 9.78 48.42 40.89 92.88 78.20 17.20 79.40 56.00 48.20 101.30 92.50 52.70 5.00 41.60 41.80 1.40
Seeds/pod (No.) 7.30 1.87 1.86 1.89 1.90 1.51 1.87 1.18 1.90 1.88 2.04 1.39 1.42 1.89 1.88 1.00
Seeds/plant (No.) 4.87 78.81 67.43 74.90 150.95 24.90 144.60 61.00 90.00 105.90 121.00 61.20 7.90 53.60 79.40 1.40
Grain yield/plant (g) 8.51 8.09 6.95 9.30 19.03 2.11 28.64 5.24 9.98 17.25 13.95 6.67 1.00 4.77 6.14 0.10
100-seed weight (g) 4.71 10.37 11.24 12.27 12.46 8.97 13.08 8.79 9.74 11.62 12.18 10.37 13.75 9.17 7.78 10.17
Oil (%) 7.67 20.49 20.88 19.86 20.83 19.74 21.16 20.55 20.45 22.86 21.58 21.41 20.75 21.54 17.63 18.62
Protein (%) 11.26 39.90 38.66 38.61 39.23 40.52 39.16 38.59 39.02 39.20 39.03 43.23 40.41 37.28 40.89 40.69
15
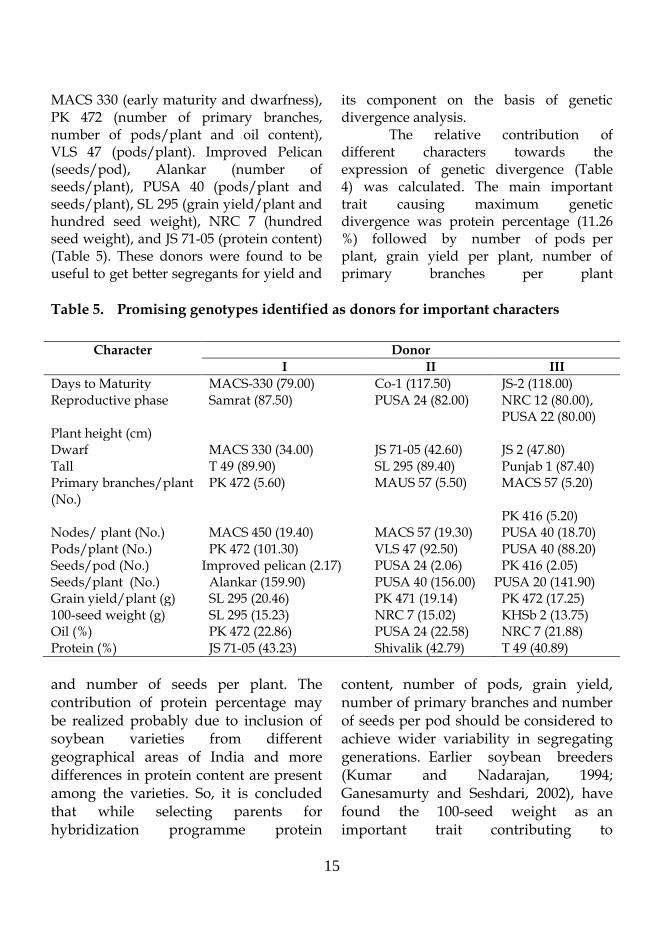
MACS 330 (early maturity and dwarfness), PK 472 (number of primary branches, number of pods/plant and oil content), VLS 47 (pods/plant). Improved Pelican (seeds/pod), Alankar (number of seeds/plant), PUSA 40 (pods/plant and seeds/plant), SL 295 (grain yield/plant and hundred seed weight), NRC 7 (hundred seed weight), and JS 71-05 (protein content) (Table 5). These donors were found to be useful to get better segregants for yield and
its component on the basis of genetic divergence analysis.
The relative contribution of different characters towards the expression of genetic divergence (Table 4) was calculated. The main important trait causing maximum genetic divergence was protein percentage (11.26 %) followed by number of pods per plant, grain yield per plant, number of primary branches per plant
Table 5. Promising genotypes identified as donors for important characters
Character Donor
I II III
Days to Maturity MACS-330 (79.00) Co-1 (117.50) JS-2 (118.00) Reproductive phase Samrat (87.50) PUSA 24 (82.00) NRC 12 (80.00), PUSA 22 (80.00) Plant height (cm) Dwarf MACS 330 (34.00) JS 71-05 (42.60) JS 2 (47.80) Tall T 49 (89.90) SL 295 (89.40) Punjab 1 (87.40) Primary branches/plant (No.)
PK 472 (5.60) MAUS 57 (5.50) MACS 57 (5.20)
PK 416 (5.20) Nodes/ plant (No.) MACS 450 (19.40) MACS 57 (19.30) PUSA 40 (18.70) Pods/plant (No.) PK 472 (101.30) VLS 47 (92.50) PUSA 40 (88.20) Seeds/pod (No.) Improved pelican (2.17) PUSA 24 (2.06) PK 416 (2.05) Seeds/plant (No.) Alankar (159.90) PUSA 40 (156.00) PUSA 20 (141.90) Grain yield/plant (g) SL 295 (20.46) PK 471 (19.14) PK 472 (17.25) 100-seed weight (g) SL 295 (15.23) NRC 7 (15.02) KHSb 2 (13.75) Oil (%) PK 472 (22.86) PUSA 24 (22.58) NRC 7 (21.88) Protein (%) JS 71-05 (43.23) Shivalik (42.79) T 49 (40.89)
and number of seeds per plant. The contribution of protein percentage may be realized probably due to inclusion of soybean varieties from different geographical areas of India and more differences in protein content are present among the varieties. So, it is concluded that while selecting parents for hybridization programme protein
content, number of pods, grain yield, number of primary branches and number of seeds per pod should be considered to achieve wider variability in segregating generations. Earlier soybean breeders (Kumar and Nadarajan, 1994; Ganesamurty and Seshdari, 2002), have found the 100-seed weight as an important trait contributing to

16
divergence, whereas the contribution of this trait was low (4.17%), because here the study in released varieties (selected genotypes) of soybean in which the aim is enhancing the seed weight.
The genotypes with high mean values of characters in any cluster as well as high D2 values between clusters can be used either for direct adaptation or for hybridization in order to breed for better genotypes of soybean.
ACKNOWLEDGEMENT
The authors thankfully acknowledge the Head, Department of Genetics and Plant Breeding; Dean, College of Agriculture, Directorate of Research, G. B. Pant University of Agriculture and Technology, Pantnagar, for their encouragement and help rendered during the course of this investigation. Senior author hereby duly acknowledges the Assistantship received during the period.
REFERENCES Das S R, Harer P N and Biradar A B. 2000.
Genetic divergence and selection of
genotypes in soybean. Journal of Maharashtra Agricultural Universities 25: 250-2.
Ganesamurty K and Seshadari P. 2002. Genetic divergence in soybean [Glycine max. (L.) Merrill]. Madras Agricultural Journal 89: 18-21.
Kumar M and Nadarajan N. 1994. . Genetic divergence studies in soybean [Glycine max. (L.) Merrill]. Indian Journal Genetics 54: 242-6.
Mahalanobis P C. 1936. On the generalized distance in statistics. Proceedings Natational Institute of Science, India., 12 : 49-55.
Rao C R. 1952. Advanced Statistical Methods in Biometric Research. Ed. II, John Wiley and Sons, Inc. New York.
Shwe U H, Murty B R, Singh H B and Rao U M B. 1972. Genetic divergence in recent elite strains of soybean and groundnut in India. Indian Journal of Genetics 32: 285-99.
Sichkar V I, Grigoryan E M and Lugovoi A P. 1988. Multivariate analysis of Mahalanobis distance parameters for economically useful characters in different groups of soybean. Isitologiya I Genetica 22: 37-43.
17
Soybean Research, 3: 17-22 (2005)
Influence of Tillage Operations on Sustainable Production of Soybean Based Cropping Systems
S D BILLORE1, A RAMESH2, O P JOSHI3 AND A K VYAS4 National Research Centre for Soybean, Indore 452 017, Madhya Pradesh
(E-mail: [email protected])
Received: 20th June 2005
ABSTRACT
A field experiment at a fixed site on vertisols was conducted for six years to study the tillage requirement of soybean based cropping systems. Results accrued over the years (1995-2001) revealed that the soybean yield was not influenced by the extent of tillage operations. The highest yield of rabi crops was recorded with minimum tillage and remained at par with conventional tillage. The sustainability of rabi crops was higher than soybean. The sustainability index indicated that the minimum tillage was found more sustainable in case of total productivity. Economic evaluation of tillage operations revealed that the minimum tillage produced significantly higher net returns and B: C ratio and also showed higher sustainable value index. The minimum tillage was found energy efficient. The highest soybean yield and sustainable yield index were recorded when soybean was grown after mustard. While the lowest soybean yield was noted when grown after linseed. The maximum soybean equivalent yield, sustainable yield index and energy efficiency was associated with soybean – wheat cropping system. Soybean – safflower as well as soybean – wheat was the most profitable systems. The sustainability of soybean was the maximum when grown after mustard.
Key words: Soybean, tillage, cropping system, energy, sustainability
Tillage is a basic component of the agricultural production technology. It plays a major role in agricultural sustainability through its effects on soil processes, properties and crop growth. The exact nature on appropriate tillage operations is said to be governed by soil and crops (Lal, 1985). Tillage contributes major portion of cost of cultivation and energy input. Tsatsarelis (1993) identified fertilizer and tillage as the most important energy concerns in crop production. Moreover, the decreased soil organic carbon content with cultivation has been documented (Cook et
al., 1992). Soybean [Glycine max (L.) Merrill] is a dominant and versatile rainy season crop that fits well in most of the traditional cropping sequences (Bhatnagar et al., 1996). In view of meager information on the subject, an attempt has been made in the present investigation to study the effect of tillage operations on productivity; sustainability and energy budgeting of soybean based cropping systems.
MATERIALS AND METHODS
A field experiment at a fixed site was conducted from 1995 to 2001 at research
1&2 Senior Scientist and 3&4 Principal Scientist
18
farm of National Research Centre for Soybean, Indore. The experimental soil belonged to Typic Haplusterts, which had pH 7.86, EC 0.14 dS/m, organic carbon 0.30%, available P 4.80 kg/ha and available K 299 kg/ha. Accordingly the soil was normal with low available nitrogen, phosphorus and potassium. The treatments followed in kharif as well as rabi comprised of three tillage operations viz., zero, minimum (2 cross harrowing) and conventional (one deep ploughing, 2 harrowing and planking) as main plots and 5 cropping systems i.e. soybean (JS 71 05) – followed by wheat (Triticum aestivum L. emend. Fiori & Paol.) cv. Sujata, chickpea (Cicer arietinum L.) cv. JG 218, mustard (Brassica Juncea L.) cv. Pusa bold, safflower (Carthamus tinctorus L.) cv. JSF 1 and linseed (Linum usitatissimum L. ) cv. R 17 as sub-plots arranged in strip plot design with three replications. The weed load in zero tillage was kept under limit using herbicides. The rabi crops were sown with pre-sowing irrigation. Wheat received two additional irrigations. The crops in the sequence were raised with the recommended package of practices 100:60:40 (wheat), 60:30:20 (mustard), 30:15:10 (linseed), 30:20:0 (safflower), 25:60:0 (chickpea) and 20:60:20 (soybean) of N:P2O5:K2O kg/ ha, respectively. The plot size for each treatment was 6 m x 3.6 m.
The economics of each treatment was calculated as per the prevailing prices of inputs and outputs. The energy budget of the treatments were determined by using the conversion factors for each and every inputs, outputs
and cultural activities as suggested by Mittal and Dhawan (1988). Energy intensiveness (EI) and energy productivity (EP) were worked out as per Burnett (1982) and Fluck (1979). Sustainability index was calculated as per Singh et al. (1990).
The total rainfall during the experimentation was 946.2, 1331.4, 1166.6, 969.5, 902.0 and 486.1 mm in 1995-96, 1996-97, 1997-98, 1998-99, 1999-2000 and 2000-01, respectively.
RESULTS AND DISCUSSION Tillage Tillage operations of varying intensities did not influence the yield of soybean (Table 1and 2). The observation is in conformity with the findings of Duseja (1998) who reported that the soybean yield in no till plots were either equal or better than those of conventional tillage. The yields of rabi crops were found to vary significantly due to tillage treatments. Minimum tillage produced highest yield, which remained at par with conventional tillage. A similar trend was noted with respect to soybean equivalent yield, sustainability index of soybean and yield of rabi crops. Similar, were the observations of Edwards et al. (1988) and Singh et al. (1996). Accounting for the yield responses due to tillage, Stibbe and Ariel (1970) further elaborated that it depended on the quantum and distribution of rainfall; under well-distributed rains yield depressed by 40% under no till whereas just reverse was true with low and ill distributed rainfall.

19
Table 1. Mean yield (1995-96 to 2000-01) of different cropping systems under various tillage operations
Cropping system Tillage operations
Zero Minimum Conventional Mean Kharif Rabi Kharif Rabi Kharif Rabi Kharif Rabi
Soybean-wheat 1359 2530 1297 2806 1239 2725 1298 2687 Soybean- chickpea 1273 705 1156 924 1261 795 1230 808 Soybean-linseed 1047 875 1121 1035 1249 1049 1139 986 Soybean-mustard 1252 766 1384 1086 1371 900 1336 917 Soybean-safflower 1217 1125 1113 1163 1081 1165 1137 1151 Mean 1230 1200 1214 1403 1240 1327 1226 1310 CD (P=0.05)
Tillage NS 206 Cropping system 30 260 Tillage x cropping system
59 517
Table 2. Effect of tillage operations on productivity, sustainable yield index and
economic traits of soybean based cropping systems (Pooled data)
Treatment Yield (kg/ha)
Soybean equi-valent yield
(kg/ha)
Sustainable yield index Net returns (Rs/ha)
B: C ratio
Sustainable value index
Kharif Rabi Kharif Rabi Soybean equivalent yield
Net returns
B: C ratio
Tillage Zero 1145 1107 2394 0.27 0.54 0.48 12497 2.04 0.23 0.45 Minimum 1127 1325 2629 0.39 0.60 0.62 14672 2.40 0.42 0.62 Conventional 1123 1254 2558 0.39 0.62 0.60 12805 2.11 0.30 0.60 CD (P=0.05) NS 206 110 0.03 0.03 0.03 1069 0.11 0.04 0.03 Cropping system Soybean – wheat 1195 2552 3012 0.33 0.54 0.58 16651 2.08 0.34 0.58 Soybean – chickpea 1126 785 2135 0.28 0.52 0.45 8659 1.75 0.09 0.44 Soybean – linseed 1053 923 2510 0.35 0.45 0.47 14473 2.40 0.27 0.47 Soybean – mustard 1213 828 2258 0.52 0.63 0.56 10865 2.03 0.31 0.57 Soybean – Safflower
1137 1152 2833 0.30 0.68 0.48 16879 2.69 0.29 0.49
CD (0.05) 30 260 138 0.04 0.04 0.04 1346 0.14 0.05 0.04
The sustainability yield index indicated that the minimum tillage was found more sustainable in case of total productivity and remained at par with
conventional tillage. The sustainability of rabi crops had a clear edge over soybean. The sustainability index value of soybean remained identical due to minimum and

20
conventional tillage. Whereas in case of rabi crops, the sustainability yield index value for the conventional tillage was marginally higher than minimum tillage.
Economic evaluation revealed that the minimum tillage produced significantly higher net returns, B: C ratio and higher sustainable value index. The differences in aforesaid economical parameters may be due to the variation in cost of cultivation and yield levels in respective treatments.
On energy analysis basis, the conventional tillage consumed the maximum energy input (22225 MJ/ha) and that was remarkably higher than minimum (16988 MJ/ha) and zero tillage (14283 MJ/ha). The highest gross energy output was with minimum tillage (38646 MJ/ha) and remained at par with conventional tillage (37603 MJ/ha), while net energy output was the maximum with minimum tillage (21658 MJ/ha) and showed non-significant differences with zero tillage (20907 MJ/ha). Similar trend was noticed in energy use efficiency. However, significantly higher energy productivity (168 g/MJ) and energy use efficiency (2.46) was associated with zero tillage followed by minimum tillage (155 g/MJ and 2.27, respectively) and conventional tillage (115 g/MJ and 1.69, respectively). The differences in energy indices might be due to variations in energy input and output.
Cropping system
The preceding rabi crops significantly influenced soybean productivity in the sequence. The highest soybean yield was recorded when soybean followed mustard whereas it remained at par with prior cultivation of wheat or safflower (Table 1 and 2). The soybean yield was lowest when grown after linseed.
Among the rabi crops, wheat out yielded rest of the crops. The maximum soybean equivalent yield was associated with soybean – wheat followed by soybean – safflower and soybean – linseed. The better yields of these rabi crops and higher prevailing market prices of these commodities led to higher soybean equivalent yield. The lowest soybean equivalent yield was noted in soybean – chickpea cropping system. These results are in agreement with the findings of Billore et al. (1996). The sustainability yield index of soybean was the maximum when grown after mustard followed by linseed. While the highest sustainable yield index was with safflower followed by mustard among the rabi crops. The sustainability index for wheat and chickpea was found more or less identical. Among the cropping systems, soybean – wheat was found to be the most sustainable which remained on par with soybean – mustard and remaining cropping systems showed non-significant differences among them selves.
The highest net returns were recorded with soybean – safflower that remained at par with soybean – wheat (Table 2). As far as the B: C ratio is concerned, significantly higher value was with soybean – safflower. The B: C ratio of soybean – wheat and soybean- mustard differed non-significantly, whereas the lowest B: C ratio was associated with soybean – chickpea. The sustainable value index indicated that the soybean –wheat was more sustainable followed by soybean – mustard. Energy budgeting (Table 3) of different cropping systems indicated that the highest energy input was with soybean – wheat (20302 MJ/ha) followed by soybean

21
Table 3. Effect of tillage operations on energy budgeting of soybean based cropping systems
Treatment Energy input
(MJ/ha)
Energy output (MJ/ha)
Energy use efficiency
Energy productivity
(g/MJ) Gross Net Tillage Zero 14283 35192 20907 2.46 168 Minimum 16988 38646 21658 2.27 155 Conventional 22225 37603 15378 1.69 115 CD (P=0.05) 1613 1718 0.14 10 Cropping system Soybean - wheat 20302 44281 23979 2.18 148 Soybean – chickpea 17660 31389 13729 1.78 121 Soybean – linseed 16390 36897 20307 2.22 151 Soybean – mustard 18034 33192 15158 1.84 125 Soybean - Safflower 16579 41650 25071 2.51 171 CD (P=0.05) 2030 2163 0.18 12
– mustard (18034 MJ/ha). The lowest energy input was required by soybean – linseed (16390 MJ/ha) cropping system. These results are in accordance with Billore et al. (1994, 1996) and Vyas et al. (1995). The maximum gross energy output was recorded in soybean – wheat (44281 MJ/ha) followed by soybean – safflower (41650 MJ/ha), whereas net energy out put was just reverse trend. Soybean – safflower was found to be the most energy efficient cropping system (2.51). The energy use efficiency of soybean – wheat (2.18) and soybean – linseed (2.22) was almost identical. The lowest energy indices were associated with soybean – chickpea (energy use efficiency –1.78 and energy productivity – 121g/MJ) cropping system. However, the maximum energy productivity was noted in soybean – safflower (171 g/MJ) followed by soybean – linseed (151 g/MJ)
and soybean – wheat (148 g/MJ) cropping systems.
The study paves the way for crop diversification thorough alternative cropping systems than the prevalent soybean followed by wheat and chickpea in the vertisols of Madhya Pradesh. Although soybean followed by safflower and mustard are feasible in this region also, the possibility of extending the experience of introducing soybean as early crop before rapeseed - mustard in the Gird/Bundelkhand region and as preceding crop to safflower which dominates in vertisols of Maharashtra. These cropping systems as have been evaluated in the presented work will generate more profit at lesser cost of cultivation but shall also strengthen sustainable production under rainfed agriculture. Reducing the extent of tillage is likely to contribute considerably in
minimizing the cost of production.
22
REFERENCES
Bhatnagar P S, Joshi O P, Bhatia V S, Billore S D and Ramesh A. 1996. Soybean based cropping systems in India- a review. Journal of Oilseeds Research 13: 1-6.
Billore S D, Singh K and Bargale M. 1994. Bioenergetics of sorghum and soybean based cropping systems. Indian Journal of Agronomy 39: 615-8.
Billore S D, Singh K and Bargale M. 1996. Bioenergetics and economic evaluation of cropping systems under Vindhyan Plateau conditions. Journal of Oilseeds Research 13: 42-6.
Burnett M. 1982. Energy analysis of three conserved agro-ecosystems. (In) Basic Techniques in Ecological Farming, pp. 183-95. Hill Stuart B (Ed.) Brikhauser Verlag, Boston.
Cook G D, So H B and Dalala R C. 1992. Structural degradation of two Vertisols under continuous cultivation. Soil and Tillage Research 24: 47-64.
Duseja D R. 1998. Zero tillage influence on soybean production, soil properties and nutrient uptake. In: Extended summaries, I. International Agronomy Congress on “Environment and Food Security for 21st Century” held at IARI, New Delhi on 23-27November, 1998 organized by Indian Society of Agronomy, New Delhi, pp. 23.
Edwards J H, Thurlow D L and Eason J T. 1988. Influence of tillage and crop rotation on yields of corn, soybean and wheat. Agronomy Journal 80: 76-80.
Fluck R C. 1979. Energy Productivity: A measure of energy utilization in
agricultural systems. Agricultural Systems 4: 29-37.
Lal R. 1985. Mechanized tillage systems effects on properties of a tropical Alfisols in watersheds cropped to maize. Soil and Tillage Research 5:149-62.
Mittal J P and Dhawan K C. 1988. Research Manual on Energy Requirements in Agricultural Sector. ICAR/AICRP/ERAS-88-1, PAU, Ludhiana, pp. 20-3.
Singh K, Billore S D and Bargale M. 1996. Effect of tillage operations on productivity and economic traits of soybean based rainfed-cropping systems. Indian Journal of Agronomy 41: 652-3.
Singh R P, Das S K, Bhaskar Rao U M and Narayana Reddy M. 1990. Towards Sustainable Dry land Agricultural Practices. Bulletin, Central Research Institute for Dry Land Agriculture, Hyderabad, pp. 5-9.
Stibbe E and Ariel D. 1970. No tillage as compared to tillage practices in dry land farming of a semiarid climate. Netherlands Journal of Agricultural Science 18: 293-307.
Tsatsarelis C A. 1993. Energy inputs and outputs for soft winter wheat production in Greece. Agriculture, Ecosystems and Environments 43: 109-18.
Vyas M D, Billore S D and Bargale M. 1995. Bioenergetics of legume based cropping systems. Crop Research (Hisar) 10: 59-62.
23
Soybean Research, 3: 23-28 (2005)
Effect of Integrated Weed Management, Varieties and Crop Geometries on Weed Dynamics in Soybean
N. PANDYA1
Rajasthan College of Agriculture, Maharana Pratap University of Agricultural and Technology, Udaipur 313 00, Rajasthan
(E-mail: [email protected])
Received 12th July 2005
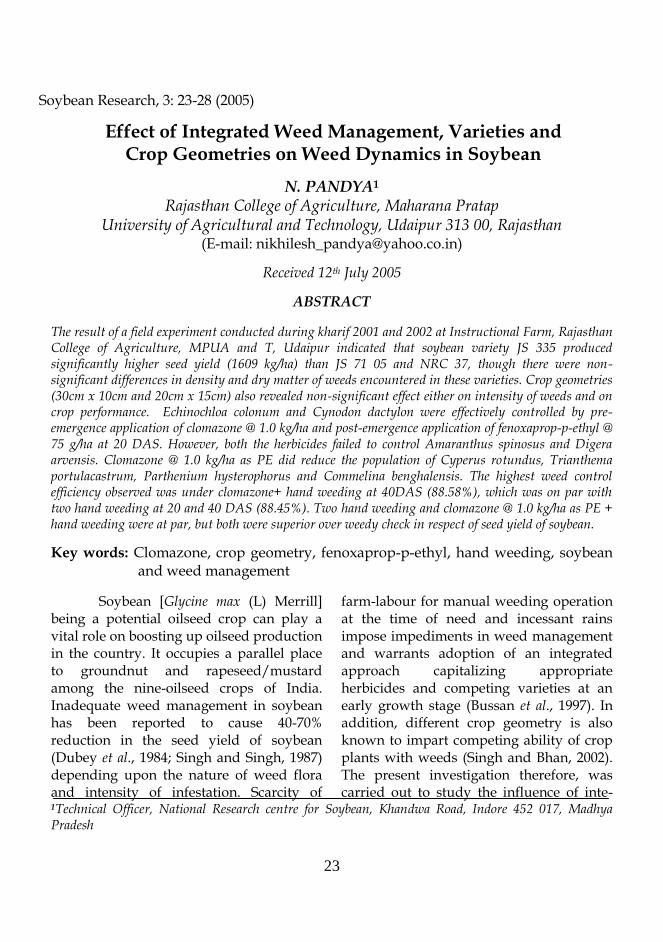
ABSTRACT
The result of a field experiment conducted during kharif 2001 and 2002 at Instructional Farm, Rajasthan College of Agriculture, MPUA and T, Udaipur indicated that soybean variety JS 335 produced significantly higher seed yield (1609 kg/ha) than JS 71 05 and NRC 37, though there were non-significant differences in density and dry matter of weeds encountered in these varieties. Crop geometries (30cm x 10cm and 20cm x 15cm) also revealed non-significant effect either on intensity of weeds and on crop performance. Echinochloa colonum and Cynodon dactylon were effectively controlled by pre-emergence application of clomazone @ 1.0 kg/ha and post-emergence application of fenoxaprop-p-ethyl @ 75 g/ha at 20 DAS. However, both the herbicides failed to control Amaranthus spinosus and Digera arvensis. Clomazone @ 1.0 kg/ha as PE did reduce the population of Cyperus rotundus, Trianthema portulacastrum, Parthenium hysterophorus and Commelina benghalensis. The highest weed control efficiency observed was under clomazone+ hand weeding at 40DAS (88.58%), which was on par with two hand weeding at 20 and 40 DAS (88.45%). Two hand weeding and clomazone @ 1.0 kg/ha as PE + hand weeding were at par, but both were superior over weedy check in respect of seed yield of soybean.
Key words: Clomazone, crop geometry, fenoxaprop-p-ethyl, hand weeding, soybean and weed management
Soybean [Glycine max (L) Merrill] being a potential oilseed crop can play a vital role on boosting up oilseed production in the country. It occupies a parallel place to groundnut and rapeseed/mustard among the nine-oilseed crops of India. Inadequate weed management in soybean has been reported to cause 40-70% reduction in the seed yield of soybean (Dubey et al., 1984; Singh and Singh, 1987) depending upon the nature of weed flora and intensity of infestation. Scarcity of
farm-labour for manual weeding operation at the time of need and incessant rains impose impediments in weed management and warrants adoption of an integrated approach capitalizing appropriate herbicides and competing varieties at an early growth stage (Bussan et al., 1997). In addition, different crop geometry is also known to impart competing ability of crop plants with weeds (Singh and Bhan, 2002). The present investigation therefore, was carried out to study the influence of inte-
1Technical Officer, National Research centre for Soybean, Khandwa Road, Indore 452 017, Madhya Pradesh
24
grated weed management approach including varieties and crop geometries on weed dynamics in soybean.
MATERIAL AND METHODS
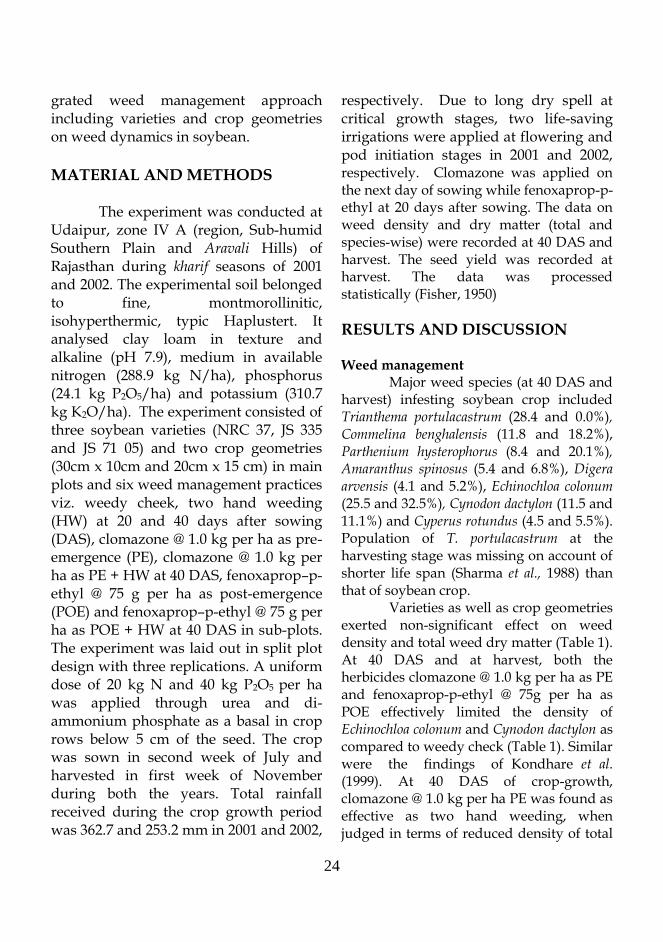
The experiment was conducted at Udaipur, zone IV A (region, Sub-humid Southern Plain and Aravali Hills) of Rajasthan during kharif seasons of 2001 and 2002. The experimental soil belonged to fine, montmorollinitic, isohyperthermic, typic Haplustert. It analysed clay loam in texture and alkaline (pH 7.9), medium in available nitrogen (288.9 kg N/ha), phosphorus (24.1 kg P2O5/ha) and potassium (310.7 kg K2O/ha). The experiment consisted of three soybean varieties (NRC 37, JS 335 and JS 71 05) and two crop geometries (30cm x 10cm and 20cm x 15 cm) in main plots and six weed management practices viz. weedy cheek, two hand weeding (HW) at 20 and 40 days after sowing (DAS), clomazone @ 1.0 kg per ha as pre-emergence (PE), clomazone @ 1.0 kg per ha as PE + HW at 40 DAS, fenoxaprop–p-ethyl @ 75 g per ha as post-emergence (POE) and fenoxaprop–p-ethyl @ 75 g per ha as POE + HW at 40 DAS in sub-plots. The experiment was laid out in split plot design with three replications. A uniform dose of 20 kg N and 40 kg P2O5 per ha was applied through urea and di-ammonium phosphate as a basal in crop rows below 5 cm of the seed. The crop was sown in second week of July and harvested in first week of November during both the years. Total rainfall received during the crop growth period was 362.7 and 253.2 mm in 2001 and 2002,
respectively. Due to long dry spell at critical growth stages, two life-saving irrigations were applied at flowering and pod initiation stages in 2001 and 2002, respectively. Clomazone was applied on the next day of sowing while fenoxaprop-p-ethyl at 20 days after sowing. The data on weed density and dry matter (total and species-wise) were recorded at 40 DAS and harvest. The seed yield was recorded at harvest. The data was processed statistically (Fisher, 1950)
RESULTS AND DISCUSSION Weed management
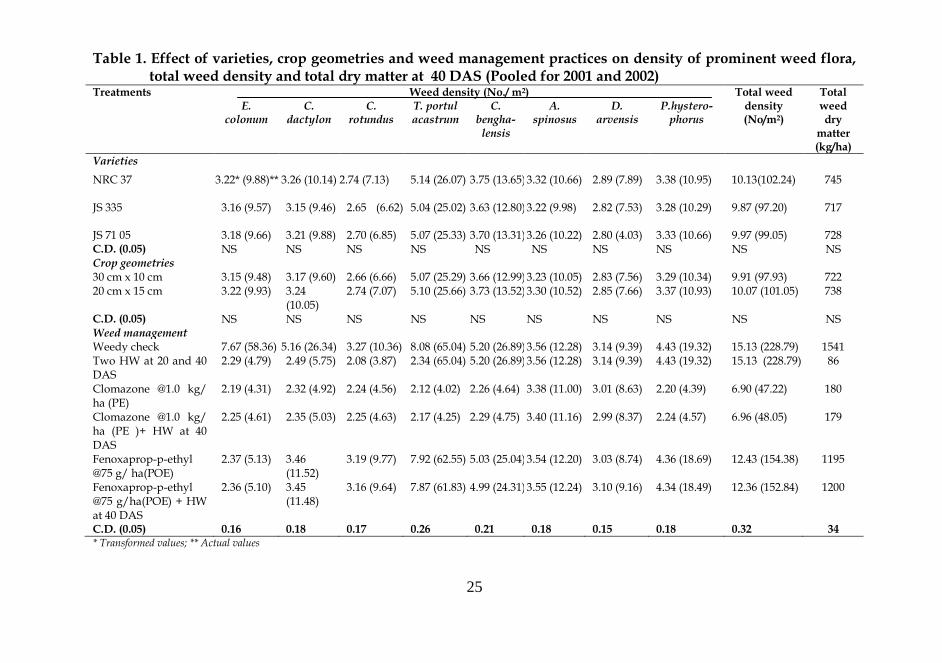
Major weed species (at 40 DAS and harvest) infesting soybean crop included Trianthema portulacastrum (28.4 and 0.0%), Commelina benghalensis (11.8 and 18.2%), Parthenium hysterophorus (8.4 and 20.1%), Amaranthus spinosus (5.4 and 6.8%), Digera arvensis (4.1 and 5.2%), Echinochloa colonum (25.5 and 32.5%), Cynodon dactylon (11.5 and 11.1%) and Cyperus rotundus (4.5 and 5.5%). Population of T. portulacastrum at the harvesting stage was missing on account of shorter life span (Sharma et al., 1988) than that of soybean crop.
Varieties as well as crop geometries exerted non-significant effect on weed density and total weed dry matter (Table 1). At 40 DAS and at harvest, both the herbicides clomazone @ 1.0 kg per ha as PE and fenoxaprop-p-ethyl @ 75g per ha as POE effectively limited the density of Echinochloa colonum and Cynodon dactylon as compared to weedy check (Table 1). Similar were the findings of Kondhare et al. (1999). At 40 DAS of crop-growth, clomazone @ 1.0 kg per ha PE was found as effective as two hand weeding, when judged in terms of reduced density of total
25
Table 1. Effect of varieties, crop geometries and weed management practices on density of prominent weed flora, total weed density and total dry matter at 40 DAS (Pooled for 2001 and 2002)
Treatments Weed density (No./ m2) Total weed density (No/m2)
Total weed dry
matter (kg/ha)
E. colonum
C. dactylon
C. rotundus
T. portul acastrum
C. bengha- lensis
A. spinosus
D. arvensis
P.hystero- phorus
Varieties
NRC 37 3.22* (9.88)** 3.26 (10.14) 2.74 (7.13) 5.14 (26.07) 3.75 (13.65) 3.32 (10.66) 2.89 (7.89) 3.38 (10.95) 10.13(102.24)
745
JS 335 3.16 (9.57) 3.15 (9.46) 2.65 (6.62)
5.04 (25.02) 3.63 (12.80) 3.22 (9.98) 2.82 (7.53) 3.28 (10.29) 9.87 (97.20) 717
JS 71 05 3.18 (9.66) 3.21 (9.88) 2.70 (6.85) 5.07 (25.33) 3.70 (13.31) 3.26 (10.22) 2.80 (4.03) 3.33 (10.66) 9.97 (99.05) 728 C.D. (0.05) NS NS NS NS NS NS NS NS NS NS Crop geometries 30 cm x 10 cm 3.15 (9.48) 3.17 (9.60) 2.66 (6.66) 5.07 (25.29) 3.66 (12.99) 3.23 (10.05) 2.83 (7.56) 3.29 (10.34) 9.91 (97.93) 722
20 cm x 15 cm 3.22 (9.93) 3.24 (10.05)
2.74 (7.07) 5.10 (25.66) 3.73 (13.52) 3.30 (10.52) 2.85 (7.66) 3.37 (10.93) 10.07 (101.05) 738
C.D. (0.05) NS NS NS NS NS NS NS NS NS NS Weed management Weedy check 7.67 (58.36) 5.16 (26.34) 3.27 (10.36) 8.08 (65.04) 5.20 (26.89) 3.56 (12.28) 3.14 (9.39) 4.43 (19.32) 15.13 (228.79) 1541
Two HW at 20 and 40 DAS
2.29 (4.79) 2.49 (5.75) 2.08 (3.87) 2.34 (65.04) 5.20 (26.89) 3.56 (12.28) 3.14 (9.39) 4.43 (19.32) 15.13 (228.79) 86
Clomazone @1.0 kg/ ha (PE)
2.19 (4.31) 2.32 (4.92) 2.24 (4.56) 2.12 (4.02) 2.26 (4.64) 3.38 (11.00) 3.01 (8.63) 2.20 (4.39) 6.90 (47.22) 180
Clomazone @1.0 kg/ ha (PE )+ HW at 40 DAS
2.25 (4.61) 2.35 (5.03) 2.25 (4.63) 2.17 (4.25) 2.29 (4.75) 3.40 (11.16) 2.99 (8.37) 2.24 (4.57) 6.96 (48.05) 179
Fenoxaprop-p-ethyl @75 g/ ha(POE)
2.37 (5.13) 3.46 (11.52)
3.19 (9.77) 7.92 (62.55) 5.03 (25.04) 3.54 (12.20) 3.03 (8.74) 4.36 (18.69) 12.43 (154.38) 1195
Fenoxaprop-p-ethyl @75 g/ha(POE) + HW at 40 DAS
2.36 (5.10) 3.45 (11.48)
3.16 (9.64) 7.87 (61.83) 4.99 (24.31) 3.55 (12.24) 3.10 (9.16) 4.34 (18.49) 12.36 (152.84) 1200
C.D. (0.05) 0.16 0.18 0.17 0.26 0.21 0.18 0.15 0.18 0.32 34 * Transformed values; ** Actual values
26
weed-flora studied, except Amaranthus spinosus and Digera arvensis. Weed density of Cyperus rotundus, Trianthema portulacastrum, Commelina benghalensis and Parthenium hysterophorus reduced significantly by two HW, clomazone @ 1.0 kg per ha as PE and clomazone + HW in comparison to weedy check. However, fenoxaprop-p-ethyl @ 75 g per ha (POE) had no effect on the population of these weeds. The results are in close conformity with the findings reported by Bhalla et al. (1998).
At harvest, it was clomazone integrated with one HW was found more useful than integration with fenoxaprop-p-ethyl. It was also found equally effective to two HW.
Total weed density and their dry matter were reduced significantly by all the evaluated weed management practices as compared to weedy check. Among treatments, two hand weeding reduced total weed density and total dry matter significantly compared to rest of the treatments at 40 DAS of crop growth. However, at harvest, only clomazone + HW was found comparable to two HW and both of these treatments reduced the total weed density and dry matter significantly as compared to the remaining treatments. Maximum weed control efficiency was recorded with clomazone + HW (88.6%) closely followed by two HW (88.5%). This superiority in weed management over remaining treatments can be explained by the fact that in pre-emergence application of clomazone + HW inhibited the emergence and early growth of weeds coupled with management of late emerging weeds by HW at 40 DAS.
Similarly, by imparting two HW at 20 and 40 DAS, the early as well as late flushes of weeds could be eradicated. These results are in agreement to those reported earlier (Veeramani et al., 2001). Effect on performance of soybean
All the three varieties differed significantly from each other in seed yield (Table 2). JS 335 recorded significantly highest seed yield (1609kg /ha) followed by JS 71 05 (1292 kg/ha) and NRC 37 (1229 kg/ha). Among these varieties NRC 37 is with longer maturity duration of 103-105 days as compared to later two (95-100 days) and likely to suffer most on account of its luxuriant plant type and water stress conditions. The water requirement of soybean varies between 500-600 mm depending on the maturity duration of the variety (Bhatnagar and Joshi, 1999). During both the years, the rainfall during crop growth period had been on lower side and imparted supplemental irrigations could extend benefit to JS 335. On the contrary, the variety JS 71 05 is with lower genetic yield potentials. The performance of evaluated varieties was the combined expression of their genetic potential and prevailing climate during crop-growth period. Variable performance based on these parameters has been reported by Billore et al. (2000). Crop geometries could not record any significant influence on seed yield of soybean. All the weed management treatments could significantly increase the seed yield of soybean over weedy cheek. Among different weed control practices, two hand weeding at 20 and 40 DAS and clomazone @ 1.0 kg per ha + HW were equally effect-

27
Table 2. Effect of varieties, crop geometries and weed management practices on density of prominent weed flora, total weed density and dry matter, WCE and soybean seed yield at harvest (Pooled for 2001 and 2002)
Treatments Weed density (No./ m2) Total weed density (No/m2)
Total weed dry
matter (kg/ha)
Weed Control Efficie-ncy (%)
Soybean seed yield
(kg/ha)
E. colonum
C. dactylon
C. rotundus
C. bengha- lensis
A. spinosus
D. arvensis
P. hystero- phorus
Varieties NRC 37 4.74* (22.04)** 3.67 (13.06) 3.07 (8.99) 4.04 (15.92) 3.57
(12.35) 3.19 (9.77) 4.27 (17.76) 10.20 (103.61) 1236 - 1229
JS 335 4.66 (21.32) 3.57 (12.39) 2.94 (8.24) 3.90 (14.79) 3.47 (11.63) 3.12 (9.25) 4.20 (17.17) 9.92 (98.00) 1186 - 1609 JS 71 05 4.71 (21.76) 3.61 (12.67) 3.00 (8.63) 3.97 (15.36) 3.53 (12.01) 3.18 (9.64) 4.25 (17.61) 10.08 (101.25) 1211 - 1292 C.D. (0.05) NS NS NS NS NS NS NS NS NS 61 Crop geometries 30cm x 10 cm 4.67 (21.40) 3.59 (12.51) 2.96 (8.36) 3.93 (15.00) 3.48 (11.73) 3.11 (9.26) 4.19 (17.12) 9.98 (99.12) 1193 - 1402 20cm x 15 cm 6.93 (22.01) 3.65 (12.91) 3.05 (8.89) 4.02 (15.71) 3.56 (12.27) 3.21 (9.85) 4.28 (17.91) 10.16 (102.78) 1230 - 1351 C.D. (0.05) NS NS NS NS NS NS NS NS NS - NS Weed management Weedy check 9.12 (82.86) 5.34 (28.17) 3.81 (14.10) 6.83 (46.33) 4.19 (17.25) 3.71 (13.32) 7.18 (51.16) 15.97 (254.85) 3046 - 848
Two HW at 20 & 40 DAS
2.86 (7.76) 2.78 (7.29) 2.48 (5.72) 2.34 (4.99) 2.68 (6.70) 2.43 (5.41) 2.60 (6.31) 6.73 (44.89) 351 88.45 1718
Clomazone @ 1.0 kg /ha (PE)
2.94 (8.19) 2.71 (6.90) 2.61 (6.40) 2.43 (5.45) 4.02 (15.89) 3.51 (11.85) 2.61 (6.35) 7.90 (61.99) 561 81.48 1718
Clomazone @ 1.0 kg /ha(PE) + HW at 40 DAS
2.88 (7.89) 2.77 (7.24) 2.56 (6.15) 2.50 (5.76) 2.84 (7.59) 2.55 (6.01) 2.62 (6.39) 6.93 (47.61) 347 88.58 1520
Fenoxaprop-p-ethyl 75@ g/ha (POE)
6.05 (36.30) 4.67 (21.50) 3.62 (12.71) 6.60 (43.36) 4.14 (16.80) 3.64 (12.79) 7.01 (48.76) 13.93 (193.65) 2297 24.57 1091
Fenoxaprop-p-ethyl @ 75 g/ha (POE) + HW at 40 DAS
4.35 (18.53) 3.46 (11.51) 2.95 (8.30) 3.13 (9.39) 3.27 (10.21) 3.16 (9.53) 3.41 (11.22) 8.93 (79.45) 665 78.07 1393
C.D. (0.05) 0.27 0.22 0.19 0.26 0.22 0.20 0.23 0.29 51 - 66
* Transformed values; ** Actual values

28
tive in enhancing seed yield of soybean and were significantly superior to remaining treatments. The increase is seed yield under these treatments may be attributed to efficient weed management leading to minimized crop-weed competition during critical crop growth period. The result affirmed the findings of Pandya et al. (2005). On the basis of two years results, it may be concluded that Echinochloa colonum and Cynodon dactylon were effectively controlled by pre-emergence application of clomazone @ 1.0 kg per ha and post-emergence application of fenoxaprop-p-ethyl @ 75 g per ha at 20 DAS. However, both the herbicides failed to control Amaranthus spinosus and Digera arvensis. Clomazone @ 1.0 kg per ha as PE did reduce the population of Cyperus rotundus, Trianthema portulacastrum, Parthenium hysterophorus and Commelina benghalensis. REFERENCES
Bhalla C S, Kurchania S P, Tiwari J P and
Paradkar N R. 1998. Bioefficiency of pre- and post-emergence herbicides for weed control in soybean. Indian Journal of Weed Science 30:149-52.
Bhatnagar P S and Joshi O P. 1999. Soybean in cropping system in India. FAO Series In Integrated Crop Management, Rome, Itly, ISSN 10204555, Pp 39.
Billore S D, Joshi O P and Ramesh A. 2000. Performance of soybean (Glycine max) genotypes on different sowing dates and row spacing in Vertisols. Indian Journal of Agricultural Sciences 70: 577-80.
Bussan A J, Burnside O C, Orf J H, Ristau E A and Puettmann K J. 1997. Field evaluation of soybean (Glycine max) genotypes for weed competitiveness. Weed Science 45: 31-7.
Dubey S K, Jain H C, Kostha L D and Raghu J S. 1984. Integrated weed management in soybean. Indian Journal of Weed Science 16: 238-43
Fisher R A. 1950. Statistical Methods for Research Workers. Oliver and Boyd, Edinburg London.
Kondhare R D, Patel B M and Karunakar A P. 1999. Effect of post-emergence herbicide alone and its combination on weeds and yield of soybean. Pestology 23: 48-55
Pandya N, Chouhan G S and Nepalia V. 2005 Influence of integrated weed management on yield and economic viability of soybean (Glycine max) varieties grown at different crop geometries. Indian Journal of Agricultural Sciences 75: 505-7
Sharma J, Singh R M and Gupta O P. 1988. Weed management in maize (Zea mays). II. Dry matter production pattern of different weeds. Himachal Journal of Agricultural Research 14: 124-8
Singh G and Singh D. 1987. Weed control efficiency of pendimethalin and methabenzthiazuron in soybean [Glycine max (L.) Merrill]. Indian Journal of Weed Science 19: 230-2.
Singh V P and Bhan V M. 2002. Effect of crop-geometry and weed control measures in weed growth and yield of soybean. Pestology 26: 25-7
Veeramani A, Palchamy A, Ramasamy S and Rangaraju G. 2001. Integrated weed management in soybean [Glycine max (L.) Merrill] under various plant densities. Madras Agricultural Journal 88: 451-6.

29
Soybean Research, 3: 29-35 (2005)
Effect of Nutrients, pH and Temperature on the Growth and Sclerotium Formation in Sclerotium rolfsii and Amendments
on Collar Rot in Soybean [Glycine max (L) Merrill]
G K GUPTA1, MM VERMA2 AND S K SHARMA3
National Research Centre for Soybean, Khandwa Road, Indore (e-mail [email protected])
Received: 18.10.2005
ABSTRACT
A study was conducted to know the influence of nutrients, pH and temperature on the growth and sclerotium formation in Sclerotium rolfsii and amendments on collar rot incidence in soybean. The growth of Sclerotium rolfsii in the medium containing sulphur, zinc, copper, iron, manganese and calcium was better. A pH of 6.5 and 350C temperature were most favourable for the growth. Formation of sclerotia was earliest and higher in number at this temperature as compared to rest of the temperatures. Overall, seed treatment with thiram + carbendazim (2:1) @ 3 g per kg and soil amendments like cotton oil cake, farmyard manure, biogas slurry and soya de-oiled cake were promising in reducing pre-and post-emergence mortality caused by Sclerotium rolfsii
Key words: Amendments, collar rot, nutrients, pH, Sclerotium rolfsii, soybean, temperature
Collar rot caused by Sclerotium rolfsii (Sacc.) is one of the important diseases of soybean [Glycine max (L) Merrill] responsible for yield losses ranging from 30 to 40 percent under congenial climate (Gupta and Chauhan, 2005). Seedling mortality ranging from 1.6 to 65 percent has been reported under Indian condition (Agrawal and Kotasthane, 1971). Sclerotium rolfsii survives from one season to another by producing sclerotia. Survival of sclerotia is influenced by factors such as temperature, moisture, proximity to a susceptible host and depth in soil. In India, meager information is available on this aspect and therefore the present investigation was undertaken to ascertain the influence of temperature, pH and
nutrients on the growth and sclerotium formation in Sclerotium rolfsii and soil amendments on the incidence of collar rot. MATERIAL AND METHODS
Four days old culture of Sclerotium rolfsii grown on PDA was cut in to 9 mm discs and used as inoculum in all the laboratory experiments. Observations were recorded on the radial growth (in mm) and on the initiation of sclerotial formation in S. rolfsii at different time intervals.
Effect of nutrients: Different
nutrients (Table 1) were utilized for the study. 100 ml stock solution of 1000 ug per ml concentration of each nutrient was pre-
1,3 Principal Scientist and Technical Officer;2 Research Scholar, Devi Ahilya Vishwa Vidyalaya, Indore
30
pared and required volume was mixed with 250 ml of PDA to achieve targeted concentration of each nutrient. After sterilization, the media was poured in 6 petriplates for each nutrient and inoculated with disc of fungal culture before incubating in BOD incubator at 27 0 C. Effect of pH: The pH levels of molten and sterilized PDA were adjusted to 5.5, 6.5, 7.0, 7.5, 8.5 and 9.5 using 0.01 M solution of HCl or KOH. For each pH level 250 ml media is used and poured in to 6 petriplates. After inoculation with disc of fungal culture, plates were incubated at 270 C. Effect of temperature: A set of five PDA plates after inoculating with disc of S. rolfsii were incubated each at 10, 20, 25, 30, 35, 40 and 450 C temperatures maintained in BOD incubators. Effect of organic amendments on collar rot incidence: About 10 days old 50,000 sclerotia and mycelium of S. rolfsii were mixed properly in 360 kg soil collected from the field of National Research Centre for Soybean, Indore to make it sick. The soil was then divided in nine equal parts to accommodate nine treatments comprised of amendments namely, (i.) FYM, (ii.) soy de-oiled cake (DOC), (iii.) mustard oil cake, (iv.) cotton oil cake, (v.) neem cake, (vi.) biogas slurry and (vii.) poultry manure @ 2.25 g per kg soil (to make it equivalent to @ 5 tones/ha) and two parts untreated (nonamended soil). The soil of each part was filled in five earthen pots of 45 cm diameter, representing five replications
for each treatment and thus each pot received about 1100 sclerotia @ 139 sclerotia per kg soil. Twenty-five seeds of the variety JS 335 were sown in each pot. Out of the 10 pots containing no amended soil, in five, seeds treated with thiram + carbendazim 2:1@ 3 g per kg were sown (treated check). In other five pots, normal seeds were sown (control check) for the comparison. After sowing, each pot was irrigated daily with equal amount of water. Seedling emergence was counted up to 5 days of germination. Seedling mortality was counted from the day of emergence till one month. Percent pre- and post-emergence mortality were calculated. RESULTS AND DISCUSSION Influence of nutrients Initially at 24 h, Cu, Mn, Mo, S, B and Zn marginally (3 to 10 %) improved the rate of growth, but K and N retarded the growth significantly (Table 1). After this period, presence of Ca, Fe, Mg, Cu boosted the growth significantly up to 48 h as compared to control. After 72 h, the growth picked up with S, Zn, Cu, Fe, Mn and Ca. The fastest growth (76 mm) was with S. However, growth was minimum and significantly low (13 %) with N followed by Mo and B (10 %) as compared to control. However, growth of the fungus after 96 h was at par (90 mm) with all the treatments. Sclerotial formation was the earliest (after 80 h) and maximum (at 96 h) in the presence of Ca and Cu. The sclerotial formation was initiated in all other treatments in between 90 to 96 h.
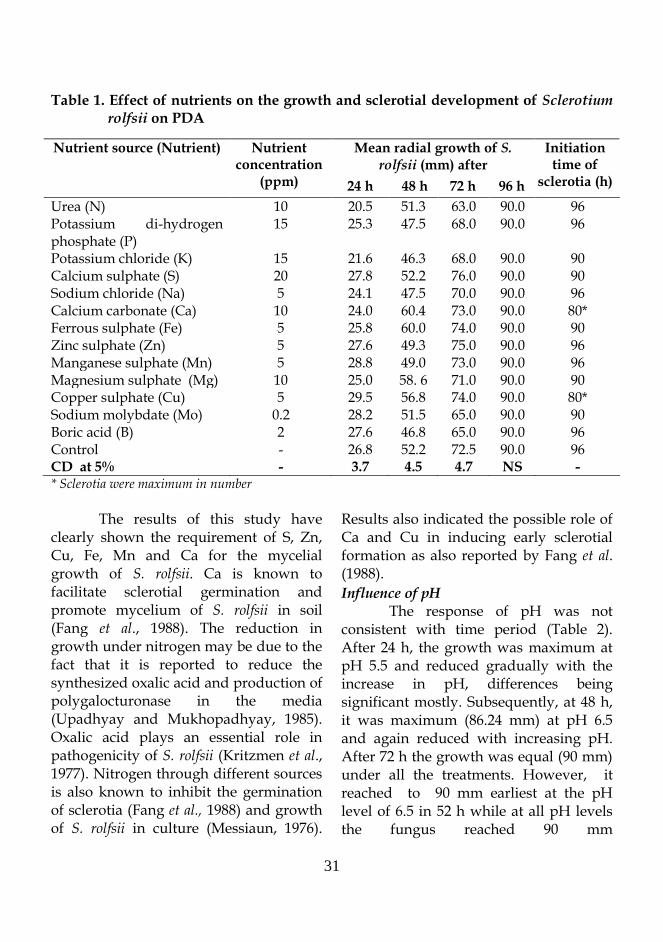
31
Table 1. Effect of nutrients on the growth and sclerotial development of Sclerotium rolfsii on PDA
Nutrient source (Nutrient) Nutrient concentration
(ppm)
Mean radial growth of S. rolfsii (mm) after
Initiation time of
sclerotia (h) 24 h 48 h 72 h 96 h
Urea (N) 10 20.5 51.3 63.0 90.0 96 Potassium di-hydrogen phosphate (P)
15 25.3 47.5 68.0 90.0 96
Potassium chloride (K) 15 21.6 46.3 68.0 90.0 90 Calcium sulphate (S) 20 27.8 52.2 76.0 90.0 90 Sodium chloride (Na) 5 24.1 47.5 70.0 90.0 96 Calcium carbonate (Ca) 10 24.0 60.4 73.0 90.0 80* Ferrous sulphate (Fe) 5 25.8 60.0 74.0 90.0 90 Zinc sulphate (Zn) 5 27.6 49.3 75.0 90.0 96 Manganese sulphate (Mn) 5 28.8 49.0 73.0 90.0 96 Magnesium sulphate (Mg) 10 25.0 58. 6 71.0 90.0 90 Copper sulphate (Cu) 5 29.5 56.8 74.0 90.0 80* Sodium molybdate (Mo) 0.2 28.2 51.5 65.0 90.0 90 Boric acid (B) 2 27.6 46.8 65.0 90.0 96 Control - 26.8 52.2 72.5 90.0 96 CD at 5% - 3.7 4.5 4.7 NS - * Sclerotia were maximum in number
The results of this study have
clearly shown the requirement of S, Zn, Cu, Fe, Mn and Ca for the mycelial growth of S. rolfsii. Ca is known to facilitate sclerotial germination and promote mycelium of S. rolfsii in soil (Fang et al., 1988). The reduction in growth under nitrogen may be due to the fact that it is reported to reduce the synthesized oxalic acid and production of polygalocturonase in the media (Upadhyay and Mukhopadhyay, 1985). Oxalic acid plays an essential role in pathogenicity of S. rolfsii (Kritzmen et al., 1977). Nitrogen through different sources is also known to inhibit the germination of sclerotia (Fang et al., 1988) and growth of S. rolfsii in culture (Messiaun, 1976).
Results also indicated the possible role of Ca and Cu in inducing early sclerotial formation as also reported by Fang et al. (1988).
Influence of pH The response of pH was not consistent with time period (Table 2). After 24 h, the growth was maximum at pH 5.5 and reduced gradually with the increase in pH, differences being significant mostly. Subsequently, at 48 h, it was maximum (86.24 mm) at pH 6.5 and again reduced with increasing pH. After 72 h the growth was equal (90 mm) under all the treatments. However, it reached to 90 mm earliest at the pH level of 6.5 in 52 h while at all pH levels the fungus reached 90 mm
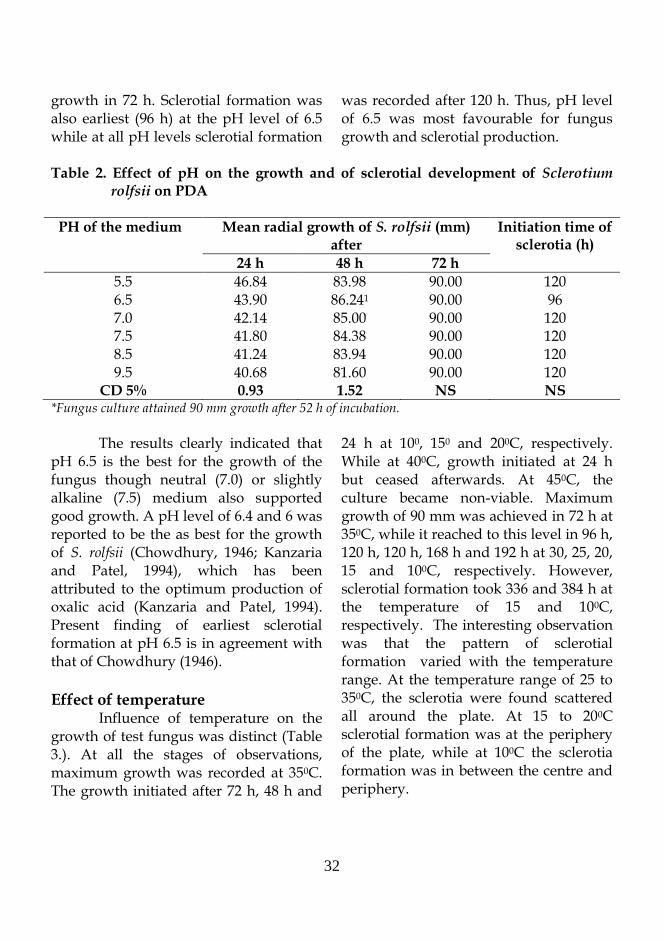
32
growth in 72 h. Sclerotial formation was also earliest (96 h) at the pH level of 6.5 while at all pH levels sclerotial formation
was recorded after 120 h. Thus, pH level of 6.5 was most favourable for fungus growth and sclerotial production.
Table 2. Effect of pH on the growth and of sclerotial development of Sclerotium
rolfsii on PDA
PH of the medium Mean radial growth of S. rolfsii (mm) after
Initiation time of sclerotia (h)
24 h 48 h 72 h
5.5 46.84 83.98 90.00 120 6.5 43.90 86.241 90.00 96 7.0 42.14 85.00 90.00 120 7.5 41.80 84.38 90.00 120 8.5 41.24 83.94 90.00 120 9.5 40.68 81.60 90.00 120
CD 5% 0.93 1.52 NS NS *Fungus culture attained 90 mm growth after 52 h of incubation.
The results clearly indicated that
pH 6.5 is the best for the growth of the fungus though neutral (7.0) or slightly alkaline (7.5) medium also supported good growth. A pH level of 6.4 and 6 was reported to be the as best for the growth of S. rolfsii (Chowdhury, 1946; Kanzaria and Patel, 1994), which has been attributed to the optimum production of oxalic acid (Kanzaria and Patel, 1994). Present finding of earliest sclerotial formation at pH 6.5 is in agreement with that of Chowdhury (1946).
Effect of temperature Influence of temperature on the growth of test fungus was distinct (Table 3.). At all the stages of observations, maximum growth was recorded at 350C. The growth initiated after 72 h, 48 h and
24 h at 100, 150 and 200C, respectively. While at 400C, growth initiated at 24 h but ceased afterwards. At 450C, the culture became non-viable. Maximum growth of 90 mm was achieved in 72 h at 350C, while it reached to this level in 96 h, 120 h, 120 h, 168 h and 192 h at 30, 25, 20, 15 and 100C, respectively. However, sclerotial formation took 336 and 384 h at the temperature of 15 and 100C, respectively. The interesting observation was that the pattern of sclerotial formation varied with the temperature range. At the temperature range of 25 to 350C, the sclerotia were found scattered all around the plate. At 15 to 200C sclerotial formation was at the periphery of the plate, while at 100C the sclerotia formation was in between the centre and periphery.
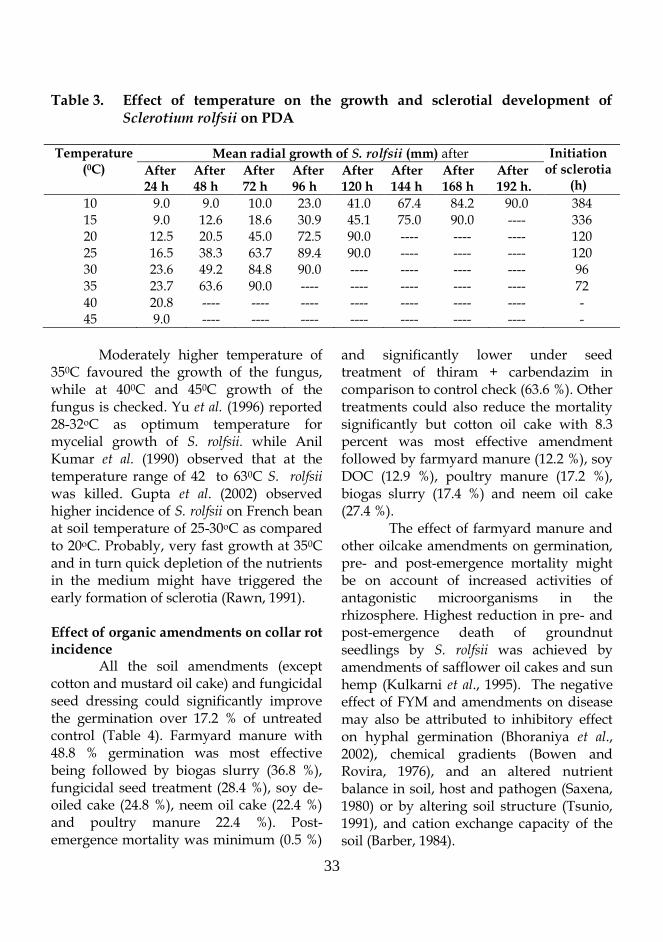
33
Table 3. Effect of temperature on the growth and sclerotial development of Sclerotium rolfsii on PDA
Temperature
(0C) Mean radial growth of S. rolfsii (mm) after Initiation
of sclerotia (h)
After 24 h
After 48 h
After 72 h
After 96 h
After 120 h
After 144 h
After 168 h
After 192 h.
10 9.0 9.0 10.0 23.0 41.0 67.4 84.2 90.0 384 15 9.0 12.6 18.6 30.9 45.1 75.0 90.0 ---- 336 20 12.5 20.5 45.0 72.5 90.0 ---- ---- ---- 120 25 16.5 38.3 63.7 89.4 90.0 ---- ---- ---- 120 30 23.6 49.2 84.8 90.0 ---- ---- ---- ---- 96 35 23.7 63.6 90.0 ---- ---- ---- ---- ---- 72 40 20.8 ---- ---- ---- ---- ---- ---- ---- - 45 9.0 ---- ---- ---- ---- ---- ---- ---- -
Moderately higher temperature of
350C favoured the growth of the fungus, while at 400C and 450C growth of the fungus is checked. Yu et al. (1996) reported 28-32oC as optimum temperature for mycelial growth of S. rolfsii. while Anil Kumar et al. (1990) observed that at the temperature range of 42 to 630C S. rolfsii was killed. Gupta et al. (2002) observed higher incidence of S. rolfsii on French bean at soil temperature of 25-30oC as compared to 20oC. Probably, very fast growth at 350C and in turn quick depletion of the nutrients in the medium might have triggered the early formation of sclerotia (Rawn, 1991). Effect of organic amendments on collar rot incidence All the soil amendments (except cotton and mustard oil cake) and fungicidal seed dressing could significantly improve the germination over 17.2 % of untreated control (Table 4). Farmyard manure with 48.8 % germination was most effective being followed by biogas slurry (36.8 %), fungicidal seed treatment (28.4 %), soy de-oiled cake (24.8 %), neem oil cake (22.4 %) and poultry manure 22.4 %). Post-emergence mortality was minimum (0.5 %)
and significantly lower under seed treatment of thiram + carbendazim in comparison to control check (63.6 %). Other treatments could also reduce the mortality significantly but cotton oil cake with 8.3 percent was most effective amendment followed by farmyard manure (12.2 %), soy DOC (12.9 %), poultry manure (17.2 %), biogas slurry (17.4 %) and neem oil cake (27.4 %).
The effect of farmyard manure and other oilcake amendments on germination, pre- and post-emergence mortality might be on account of increased activities of antagonistic microorganisms in the rhizosphere. Highest reduction in pre- and post-emergence death of groundnut seedlings by S. rolfsii was achieved by amendments of safflower oil cakes and sun hemp (Kulkarni et al., 1995). The negative effect of FYM and amendments on disease may also be attributed to inhibitory effect on hyphal germination (Bhoraniya et al., 2002), chemical gradients (Bowen and Rovira, 1976), and an altered nutrient balance in soil, host and pathogen (Saxena, 1980) or by altering soil structure (Tsunio, 1991), and cation exchange capacity of the soil (Barber, 1984).
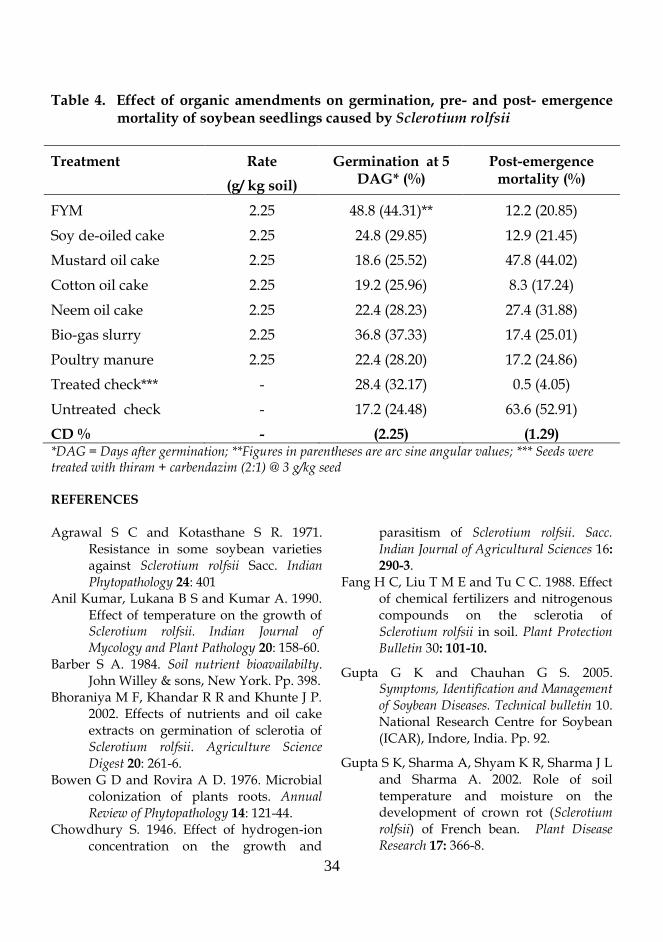
34
Table 4. Effect of organic amendments on germination, pre- and post- emergence mortality of soybean seedlings caused by Sclerotium rolfsii
Treatment Rate
(g/ kg soil)
Germination at 5 DAG* (%)
Post-emergence mortality (%)
FYM 2.25 48.8 (44.31)** 12.2 (20.85)
Soy de-oiled cake 2.25 24.8 (29.85) 12.9 (21.45)
Mustard oil cake 2.25 18.6 (25.52) 47.8 (44.02)
Cotton oil cake 2.25 19.2 (25.96) 8.3 (17.24)
Neem oil cake 2.25 22.4 (28.23) 27.4 (31.88)
Bio-gas slurry 2.25 36.8 (37.33) 17.4 (25.01)
Poultry manure 2.25 22.4 (28.20) 17.2 (24.86)
Treated check*** - 28.4 (32.17) 0.5 (4.05)
Untreated check - 17.2 (24.48) 63.6 (52.91)
CD % - (2.25) (1.29) *DAG = Days after germination; **Figures in parentheses are arc sine angular values; *** Seeds were treated with thiram + carbendazim (2:1) @ 3 g/kg seed REFERENCES
Agrawal S C and Kotasthane S R. 1971.
Resistance in some soybean varieties against Sclerotium rolfsii Sacc. Indian Phytopathology 24: 401
Anil Kumar, Lukana B S and Kumar A. 1990. Effect of temperature on the growth of Sclerotium rolfsii. Indian Journal of Mycology and Plant Pathology 20: 158-60.
Barber S A. 1984. Soil nutrient bioavailabilty. John Willey & sons, New York. Pp. 398.
Bhoraniya M F, Khandar R R and Khunte J P. 2002. Effects of nutrients and oil cake extracts on germination of sclerotia of Sclerotium rolfsii. Agriculture Science Digest 20: 261-6.
Bowen G D and Rovira A D. 1976. Microbial colonization of plants roots. Annual Review of Phytopathology 14: 121-44.
Chowdhury S. 1946. Effect of hydrogen-ion concentration on the growth and
parasitism of Sclerotium rolfsii. Sacc. Indian Journal of Agricultural Sciences 16:
290-3. Fang H C, Liu T M E and Tu C C. 1988. Effect
of chemical fertilizers and nitrogenous compounds on the sclerotia of Sclerotium rolfsii in soil. Plant Protection Bulletin 30: 101-10.
Gupta G K and Chauhan G S. 2005. Symptoms, Identification and Management of Soybean Diseases. Technical bulletin 10. National Research Centre for Soybean (ICAR), Indore, India. Pp. 92.
Gupta S K, Sharma A, Shyam K R, Sharma J L and Sharma A. 2002. Role of soil temperature and moisture on the development of crown rot (Sclerotium rolfsii) of French bean. Plant Disease Research 17: 366-8.
35
Kanzaria K K and Patel V A. 1994. Influence of environmental factor on growth and oxalic acid production by Sclerotium rolfsii. Groundnut Newsletter 6: 17.
Kritzmen G, Chet I and Henis Y. 1977. The role of oxalic acid in the pathogenic behaviour of Sclerotium rolfsii. Experimental Mycology 1: 280-5.
Kulkarni S A, Kulkarni S and Kulkarani S. 1995. Effect of organic amendments green manure on the survival of collar rot. Current Research 24: 135-6.
Messiaun C M. 1976. The effect of soluble nitrogen compounds on the mycelial growth of Sclerotium rolfsii in culture. Annals of Phytopathology 8: 17-23.
Rawn C D. 1991. Induction of sclerotia in Sclerotium rolfsii by short low temperature treatment. Journal of General Microbiology 137: 1063-6.
Saxena H K. 1980. Epidemiology of diseases caused by Rhizoctonia species. In: Proceeding of the Consultant Group Discussion on the Resistance to Soil Borne Disease of Legumes. pp. 59-73. Patancheru, India.
Tsunio N. 1991. Diversity of root fungal floras, its implications for soil borne diseases and crop growth. Japan Agricultural Research Quarterly 25: 6-11
Upadhyay J P and Mukhopadhyay A N. 1985. Effect of nitrogenous fertilizers on some physiological activities of sclerotium rolfsii. Indian Journal of Mycology and Plant Pathology 15: 172-9.
Yu R C, Chen L C, Wang C H and Young H C. 1996. Studies on the physiological characterization of Sclerotium rolfsii. Plant Pathology Bulletin 5: 91-9.

36
Soybean Research, 3: 36-45 (2005)
Effect of Pre-storage Treatments on Soybean Seed Quality
SANDEEP KUMAR LAL1, ASHOK GAUR2 AND SUSHIL PANDEY3 Division of Seed Science and Technology,
Indian Agricultural Research I, New Delhi 110012 (E-mail: [email protected])
Received: 13th September 2005
ABSTRACT
Seeds of six varieties of soybean viz., Pusa 16, Pusa 20, Pusa 22, JS 335, JS 75-46, JS 80-21 with 8 percent moisture content were given pre-storage seed treatment with thiram (tetramethylthiuram disulphide), carbendazim, a combination of thiram thiram + carbendazim (1:1) and a new systemic molecule hexaconazole separately and stored in cloth bags and 700-gauge polythene bags under ambient conditions of Delhi for 5 months. The findings revealed that seeds stored in polythene bags could maintain the germinability above the certification standards, irrespective of the chemical treatments. Statistically, there was no significant difference among the treatments, however seeds treated with thiram were found to have a better germination. Seed treatment with thiram could eliminate the associated mycoflora considerably. Nevertheless, there was no significant reduction in vigour of the seeds treated with thiram. Hexaconazole was not found suitable for pre-storage seed treatment, as there was a reduction in vigour in all the varieties during storage; though the germination was satisfactory except that in Pusa 16 where it fell below the minimum seed certification standards.
Key words: Certification standard, seed treatment, soybean, seed quality parameters, seed storage
Soybean [Glycine max (L.) Merrill], a miracle crop of the 20th century occupies an important place, next only to cereals in the country, providing the base for a wide range of fermented foods and industrial products. It is an excellent source of both protein (40%) and oil (20%) and holds a great promise in solving the malnutrition problems. In India, the crop has gained popularity as a cash crop that earns more than any of the competing crops in specified time. Soybean seeds are normally stored for a period of six months before they are sown in the next season. They show orthodox seed characteristics meaning that an increase in moisture
content and temperature results in rapid loss of viability (Justice and Bass, 1979). Delouche et al. (1973) classified soybean as a „poor storer‟ species as it loses viability very rapidly under warm and humid conditions of storage. The loss of viability in storage differs amongst the varieties within a species (Agrawal, 1977; 1978). Seed moisture content and storage temperature are the two major factors which influence the rate of loss of viability in storage (Owen, 1956, Barton, 1961, Justice and Bass, 1979). Also, the packaging material as well as the kind and level of mycoflora associated with the seeds play a vital role in ascertaining the health
1,3Scientist, 2Principal Scientist
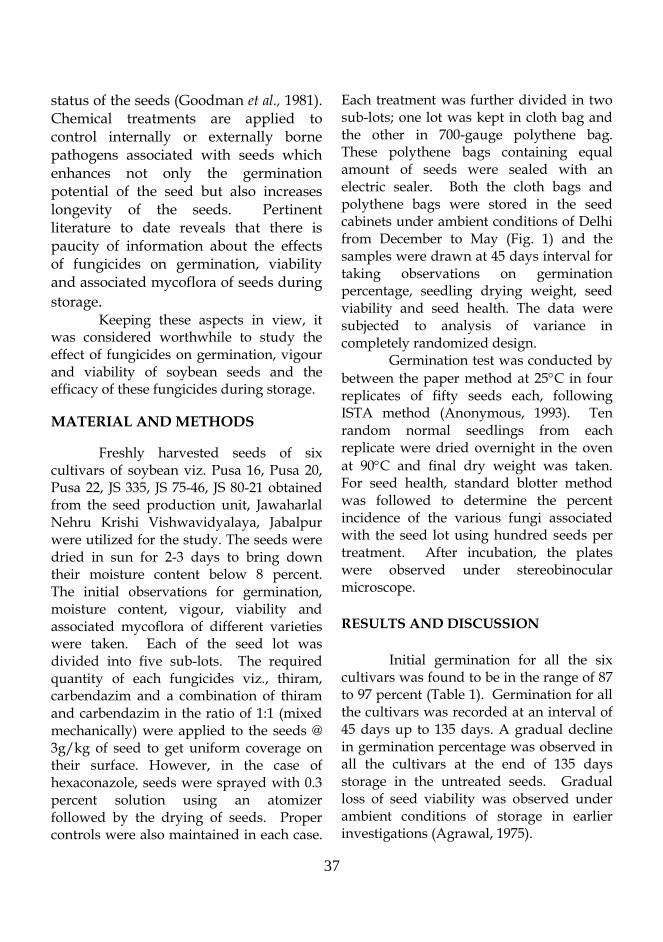
37
status of the seeds (Goodman et al., 1981). Chemical treatments are applied to control internally or externally borne pathogens associated with seeds which enhances not only the germination potential of the seed but also increases longevity of the seeds. Pertinent literature to date reveals that there is paucity of information about the effects of fungicides on germination, viability and associated mycoflora of seeds during
storage. Keeping these aspects in view, it was considered worthwhile to study the effect of fungicides on germination, vigour and viability of soybean seeds and the efficacy of these fungicides during storage.
MATERIAL AND METHODS
Freshly harvested seeds of six cultivars of soybean viz. Pusa 16, Pusa 20, Pusa 22, JS 335, JS 75-46, JS 80-21 obtained from the seed production unit, Jawaharlal Nehru Krishi Vishwavidyalaya, Jabalpur were utilized for the study. The seeds were dried in sun for 2-3 days to bring down their moisture content below 8 percent. The initial observations for germination, moisture content, vigour, viability and associated mycoflora of different varieties were taken. Each of the seed lot was divided into five sub-lots. The required quantity of each fungicides viz., thiram, carbendazim and a combination of thiram and carbendazim in the ratio of 1:1 (mixed mechanically) were applied to the seeds @ 3g/kg of seed to get uniform coverage on their surface. However, in the case of hexaconazole, seeds were sprayed with 0.3 percent solution using an atomizer followed by the drying of seeds. Proper controls were also maintained in each case.
Each treatment was further divided in two sub-lots; one lot was kept in cloth bag and the other in 700-gauge polythene bag. These polythene bags containing equal amount of seeds were sealed with an electric sealer. Both the cloth bags and polythene bags were stored in the seed cabinets under ambient conditions of Delhi from December to May (Fig. 1) and the samples were drawn at 45 days interval for taking observations on germination percentage, seedling drying weight, seed viability and seed health. The data were subjected to analysis of variance in completely randomized design.
Germination test was conducted by
between the paper method at 25C in four replicates of fifty seeds each, following ISTA method (Anonymous, 1993). Ten random normal seedlings from each replicate were dried overnight in the oven
at 90C and final dry weight was taken. For seed health, standard blotter method was followed to determine the percent incidence of the various fungi associated with the seed lot using hundred seeds per treatment. After incubation, the plates were observed under stereobinocular microscope.
RESULTS AND DISCUSSION
Initial germination for all the six
cultivars was found to be in the range of 87 to 97 percent (Table 1). Germination for all the cultivars was recorded at an interval of 45 days up to 135 days. A gradual decline in germination percentage was observed in all the cultivars at the end of 135 days storage in the untreated seeds. Gradual loss of seed viability was observed under ambient conditions of storage in earlier investigations (Agrawal, 1975).
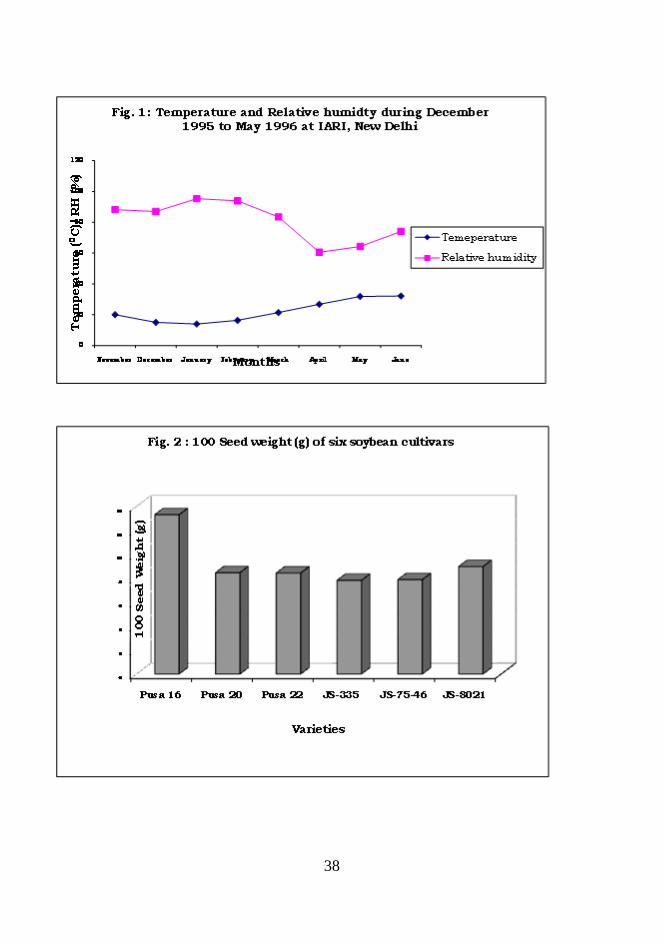
38
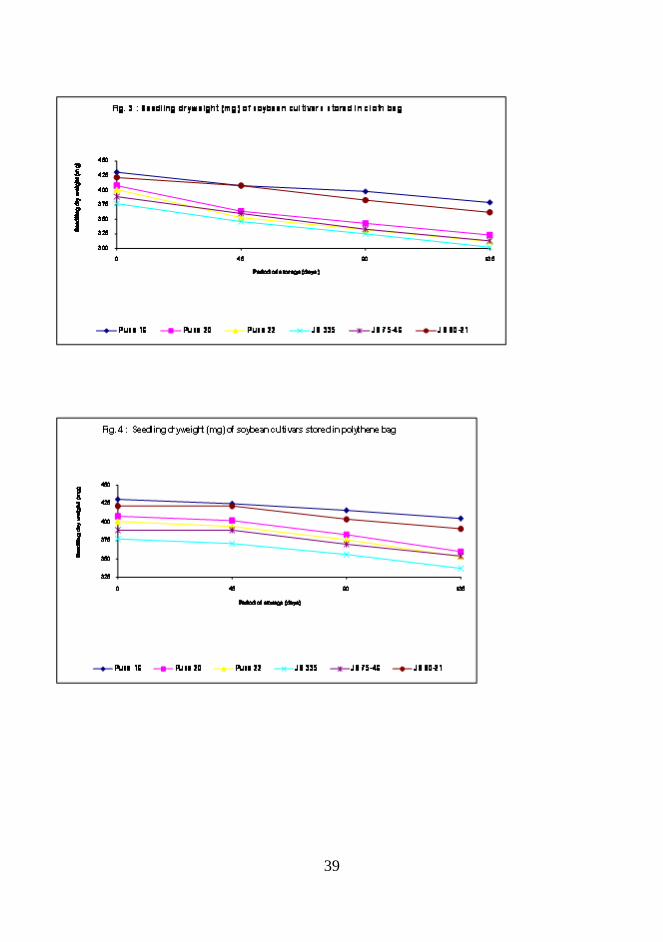
39

40
Table 1. Germination percentage of soybean seeds during storage
Cultivars/ Treatment Pusa 16 Pusa 20 Pusa 22 JS 335 JS 75-46 JS 80-21
0 135 0 135 0 135 0 135 0 135 0 135
Cloth bags Control 87 62 89 78 92 79 91 78 97 76 96 75 Thiram 63 84 82 83 83 81 Carbendazim 69 83 80 84 80 81 Thiram+Carbendazim 65 81 81 84 81 82 Hexaconazole 64 79 80 81 80 78 Polythene bags Control 87 67 89 79 92 82 91 81 97 79 96 79 Thiram 72 87 85 88 84 86 Carbendazim 71 88 83 83 82 82 Thiram+Carbendazim 71 85 84 86 83 84 Hexaconazole 67 79 82 80 80 80
C.D. (P = 0.05) A = 1.0006; B = 1.74; A x B = NS; C = 1.59; A x C = NS; B x C = NS; A x B x C = NS where, A – Storage container; B – Varieties; C – Treatments; NS – Non-significant
Germination of seeds stored in cloth bag and polythene bag
The initial germination of soybean seeds before storage in Pusa 16 was 87 percent that came down to 62 percent, a loss of 28 percent within a span of 135 days. However, seed treatment with different contact and systemic fungicides gave some boost to the germination percentage. Thiram, a di-thiocarbamate is known to improve germination, but the germination percentage was only 63 percent, even in thiram treated seeds after 135 days of storage (since Pusa 16 is a poor storer). The difference between control (62 %) and thiram treated seeds (63 %) was almost non-significant. The seed treatment with carbendazim resulted in 69 percent germination and a combination of thiram + carbendazim resulted in 65 percent germination at the end of 135 days when stored in cloth bags. In general, Pusa 16 was found to
have the lowest germination percentage among all the cultivars taken in these studies. Gaur and Sharma (1994) also reported the poor performance of Pusa 16 when stored in cloth bags.
The seeds treated with carbendazim and thiram + carbendazim when stored in 700-gauge polythene bags, the germination was at par (71 %) after 135 days of storage. Even the untreated seeds stored in polythene bags gave a better germination (67 %) as compared to treated seeds when stored in cloth bags (except in thiram + carbendazim treatment). In all the other varieties, even in case of untreated seeds stored in polythene bags, loss in germination was gradual, among the various treatments recorded after 135 days of storage. Basu (1976) also preferred sealed containers (moisture impervious) to the unsealed ones (moisture pervious) for storage.

41
Seedling vigour of the soybean seeds stored in cloth bag and polythene bag
Seedling vigour was measured as seedling dry weight of 10 normal seedlings (mg/10 seedlings), after the final count of germination was taken. Initial seedling vigour appeared to be inversely related to the seed size of different genotypes evaluated. The seedlings produced by seeds of Pusa 16 were most vigorous on account of the fact that its seeds were the boldest among all the cultivars evaluated. The range of 100 seed weight among different cultivars is presented in Fig. 2. Irrespective of the seed treatment, seeds of all the cultivars when stored in cloth bags showed gradual decline in their seedling dry weight (Fig. 3). The seedling dry weight of treated and untreated seeds stored in polythene bags did show a gradual
decline as the storage period progressed (Fig. 4), but the decline was rather slow as compared to when the seeds were stored in cloth bag e.g. in Pusa 20, a decline from 408 to 309 mg and from 408 to 334 mg when stored in cloth bag and polythene bag respectively, was observed after 135 days of storage. Similar differences were observed in other cultivars as well.
Loss in seedling vigour is reported to precede the loss of seed viability in a number of crops (Harrington, 1972; Yadav et al., 1987; Dharamalingam and Basu, 1990). In the present study also, decline in seedling dry weight was preceded with the reduction in germination. Shanmugavel (1993) established a direct relationship between decline in seedling vigour and loss in germination in soybean.
Table 2. Percent viability of soybean seeds during storage
Cultivars/ Treatment Pusa 16 Pusa 20 Pusa 22 JS 335 JS 75-46 JS 80-21
0 135 0 135 0 135 0 135 0 135 0 135
Cloth bags Control 86 67 88 73 93 78 92 78 96 77 95 74 Thiram 72 78 84 83 82 81 Carbendazim 73 78 82 80 80 80 Thiram+Carbendazim 69 78 83 80 81 79 Hexaconazole 68 73 78 78 77 74 Polythene bags Control 86 69 88 78 93 82 92 80 96 80 95 80 Thiram 72 83 87 86 86 86 Carbendazim 74 82 84 84 84 86 Thiram+Carbendazim 70 84 84 84 84 87 Hexaconazole 70 79 82 79 80 83 C.D. (p = 0.05) A =0.80; B = 1.39; A x B = 1.96; C = 1.27; A x C = NS; B x C = NS; A x
B x C = NS where, A – Storage container; B – Varieties; C – Treatments; NS – Non-significant.
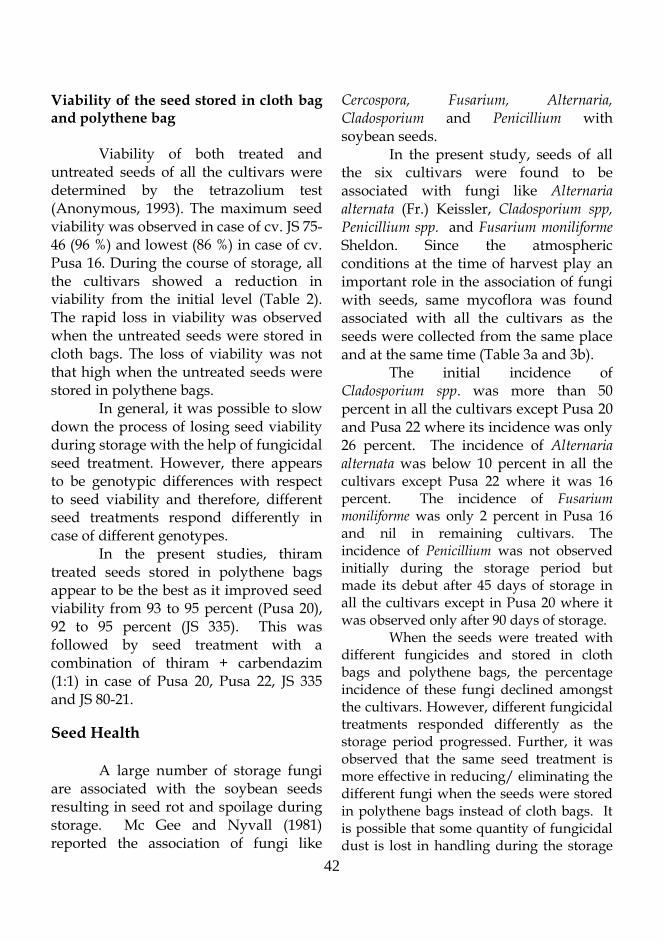
42
Viability of the seed stored in cloth bag and polythene bag
Viability of both treated and
untreated seeds of all the cultivars were determined by the tetrazolium test (Anonymous, 1993). The maximum seed viability was observed in case of cv. JS 75-46 (96 %) and lowest (86 %) in case of cv. Pusa 16. During the course of storage, all the cultivars showed a reduction in viability from the initial level (Table 2). The rapid loss in viability was observed when the untreated seeds were stored in cloth bags. The loss of viability was not that high when the untreated seeds were stored in polythene bags.
In general, it was possible to slow down the process of losing seed viability during storage with the help of fungicidal seed treatment. However, there appears to be genotypic differences with respect to seed viability and therefore, different seed treatments respond differently in case of different genotypes.
In the present studies, thiram treated seeds stored in polythene bags appear to be the best as it improved seed viability from 93 to 95 percent (Pusa 20), 92 to 95 percent (JS 335). This was followed by seed treatment with a combination of thiram + carbendazim (1:1) in case of Pusa 20, Pusa 22, JS 335 and JS 80-21.
Seed Health
A large number of storage fungi are associated with the soybean seeds resulting in seed rot and spoilage during storage. Mc Gee and Nyvall (1981) reported the association of fungi like
Cercospora, Fusarium, Alternaria, Cladosporium and Penicillium with soybean seeds.
In the present study, seeds of all the six cultivars were found to be associated with fungi like Alternaria alternata (Fr.) Keissler, Cladosporium spp, Penicillium spp. and Fusarium moniliforme Sheldon. Since the atmospheric conditions at the time of harvest play an important role in the association of fungi with seeds, same mycoflora was found associated with all the cultivars as the seeds were collected from the same place and at the same time (Table 3a and 3b).
The initial incidence of Cladosporium spp. was more than 50 percent in all the cultivars except Pusa 20 and Pusa 22 where its incidence was only 26 percent. The incidence of Alternaria alternata was below 10 percent in all the cultivars except Pusa 22 where it was 16 percent. The incidence of Fusarium moniliforme was only 2 percent in Pusa 16 and nil in remaining cultivars. The incidence of Penicillium was not observed initially during the storage period but made its debut after 45 days of storage in all the cultivars except in Pusa 20 where it was observed only after 90 days of storage.
When the seeds were treated with different fungicides and stored in cloth bags and polythene bags, the percentage incidence of these fungi declined amongst the cultivars. However, different fungicidal treatments responded differently as the storage period progressed. Further, it was observed that the same seed treatment is more effective in reducing/ eliminating the different fungi when the seeds were stored in polythene bags instead of cloth bags. It is possible that some quantity of fungicidal dust is lost in handling during the storage

43
Table 3a. Percent incidence of field fungi associated with seeds of soybean cultivars after storage
Cultivars/
Treatment
Pusa 16 Pusa 20 Pusa 22 JS 335 JS 75-46 JS 80-21
A.a. C. sp. A. a. C. sp. A. a. C. sp. A. a. C. sp. A. a. C. sp. A. a. C. sp.
0 135 0 135 0 135 0 135 0 135 0 135 0 135 0 135 0 135 0 135 0 135 0 135
Cloth bags
Control 2 4 68 16 10 18 26 2 16 - 26 - 2 5 54 14 2 4 58 28 4 14 54 24
Thiram - - - - - - - - - - - -
Carbendazim 4 10 - - - - - - - 4 - -
Thiram+
Carbendazim
- 6 - - - - - - - - - -
Hexaconazole 6 6 - - - - - - 20 10 4
Polythene bags
Control 2 2 68 2 10 4 26 1 16 - 26 - 2 3 54 32 2 6 58 12 4 1 54 9
Thiram - - - - - - - - - - - -
Carbendazim - 6 - - - - - 10 - - - -
Thiram+
Carbendazim
- - - - - - - - - -
Hexaconazole - 2 - - - - - 6 1 2 - -
Note: A.a..- Alternaria alternata; C.. sp.-: Cladosporium spp.
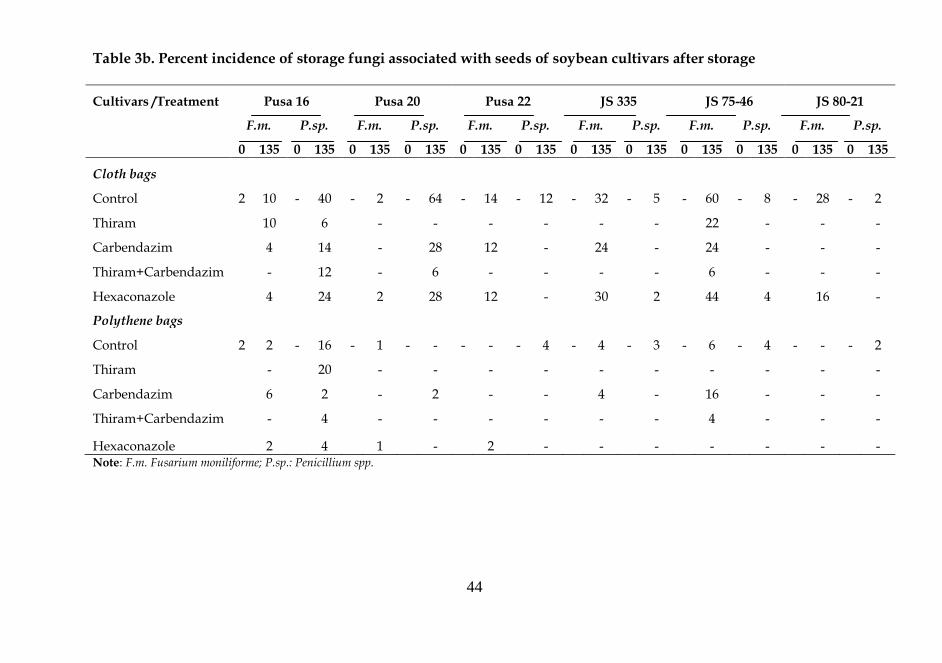
44
Table 3b. Percent incidence of storage fungi associated with seeds of soybean cultivars after storage
Cultivars /Treatment Pusa 16 Pusa 20 Pusa 22 JS 335 JS 75-46 JS 80-21
F.m. P.sp. F.m. P.sp. F.m. P.sp. F.m. P.sp. F.m. P.sp. F.m. P.sp.
0 135 0 135 0 135 0 135 0 135 0 135 0 135 0 135 0 135 0 135 0 135 0 135
Cloth bags
Control 2 10 - 40 - 2 - 64 - 14 - 12 - 32 - 5 - 60 - 8 - 28 - 2
Thiram 10 6 - - - - - - 22 - - -
Carbendazim 4 14 - 28 12 - 24 - 24 - - -
Thiram+Carbendazim - 12 - 6 - - - - 6 - - -
Hexaconazole 4 24 2 28 12 - 30 2 44 4 16 -
Polythene bags
Control 2 2 - 16 - 1 - - - - - 4 - 4 - 3 - 6 - 4 - - - 2
Thiram - 20 - - - - - - - - - -
Carbendazim 6 2 - 2 - - 4 - 16 - - -
Thiram+Carbendazim - 4 - - - - - - 4 - - -
Hexaconazole 2 4 1 - 2 - - - - - - - Note: F.m. Fusarium moniliforme; P.sp.: Penicillium spp.

45
when the seeds are kept in cloth bags. Secondly, the seeds were loosely packed in cloth bags while they were tightly packed and sealed in polythene bags and obviously there is no loss of fungicidal dust because of the impervious nature of the polythene bags. The combination of thiram + carbendazim was found to be the best in eliminating/ reducing the fungal mycoflora when the treated seeds were stored in polythene bags. This combination was followed by seed treatment with thiram and Carbendazim individually. However, hexaconazole was not very effective in controlling the associated mycoflora.
On the basis of present studies, it can be concluded that storage of soybean seeds is a problem in warm and humid conditions prevailing in our country. Genotypic differences were observed in the storage behavior of the cultivars taken in these studies. However, irrespective of the genotypic differences, the germination, vigour and viability could be maintained/improved by giving a pre-storage seed treatment with a fungicide like thiram and storing the seeds in moisture impervious containers like 700-guage polythene bags, provided the moisture content of the seed is around 8%.
REFERENCES
Agrawal P K. 1975. Problem of seed viability in
soybean during storage. Seed Tech News 5: 12-7.
Agrawal P K. 1977. Germination, fat acidity and leaching of sugars from five cultivars of paddy (Oryza sativa) seeds during storage. Seed Science and Technology 5: 489-98.
Agrawal P K. 1978. Changes in germination, moisture and carbohydrate of hexaploid triticale and wheat (Triticum aestivum)
seed stored under ambient conditions. Seed Science and Technology 6: 711-6.
Anonymous. 1993. International Rules for Seed Testing. Seed Science and Technology 21 (Supplement), 296 pp.
Barton L N. 1961. Seed Preservation and Longevity. Interscience Publishers Inc. (New York). Pp. 216
Basu R N. 1976. Physico-chemical control of seed deterioration. Seed Research 4: 15-23.
Delouche J C, Matthews R, Dougherty G M and Boyd, A H. 1973. Storage of seeds in sub-tropical and tropical regions. Seed Science and Technology 1: 671-700.
Dharmalingam C and Basu R N. 1990. Maintenance of viability and vigour in sunflower (Helianthus annus L.). Seed Research 18: 15-24.
Harrington J F. 1972. Seed storage and longevity pp. 145-245. In: Seed Biology, Vol. III (Ed. T.T. Kozlowski), Academic Press, New York.
Gaur A and Sharma O. 1994. Storage of treated seeds of soybean. Seed Tech News 24: 68.
Goodman R M, Sinclair J B and Hepperly P R. 1981. Plant Pathology and International Soybean Program (INSTOY). Plant Disease 6: 214-22.
Justice O L and Bass L N. 1979. Principles and Practices of Seed Storage. Castle House Publications, London.
Mc Gee D C and Nyvall R F. 1981. Soybean seed health. Paper, Cooperative Extension Service, Iowa State University, Ames, Iowa.
Owen E G. 1956. The storage of seeds for maintenance of viability. Commonwealth Agricultural Bureaux. Farnhan Royal Bucks, England. Pasture and Field Crops 43: 81.
Shanmugavel S. 1993. Physiological assessment of variability in seed longevity of soybean [Glycine max (L.) Merrill} cultivars. Division of Plant Physiology, M.Sc. Thesis, I.A.R.I., New Delhi.
Yadav R S, Dadalni M and Agrawal P K. 1987. Storability of seeds of two F1 pearl millet hybrids and their parents under controlled conditions. Indian Journal of Agricultural Sciences 57: 821-24.
46
Soybean Research, 3:.46-51 (2005)
Quality Characteristics of Beverage Prepared from Milk-Soy extract Blends
D N YADAV1 AND G S CHAUHAN 2
Defense food Research Laboratory, Siddarthanagar, Mysore, 570 011 (E-mail: [email protected])
Received: 17th September 2005
ABSTRACT
Effect of blending of soy extract with milk on physical, chemical and sensory attributes of flavoured beverage was studied. For this, soy extract was prepared from seeds of soybean. Milk-soy extract blends were prepared in the ratio of 100: 0, 90: 10, 80: 20, 70: 30, 60: 40, 50: 50 and 0: 100 using skimmed milk, toned milk, standardized milk and soy extract. For the preparation of flavoured beverage, sugar (6.5%) and sodium alginate (0.2%) were added in blends, boiled, cooled and flavoured with vanilla essence. On the basis of results of physical and sensory properties, it was found that the soy extract could be blended up to 30 per cent with toned milk without affecting its acceptability.
Key words: Antinutrients, flavoured beverage, milk, minerals, proximate composition,
sensory evaluation, soy-extract
Beverages are an integral part of human diet. The cycle starts with the infants‟ formulas-highly complex drink, rich in many key-nutrients. As human age and their nutritional requirements change, product designer keeps pace by developing new and innovative beverages to meet these needs. In India traditional cuisine includes drinks, which were developed primarily to provide aesthetic appeal, though they also contain certain components having nutritional and therapeutic values. In the course of time, these traditional health drinks vanished as for a long period the Indian beverage industry was dominated by aerated synthetic drinks. To improve the
flavor of the product and also to enhance the acceptability of the beverage, soymilk was blended with cow‟s milk to develop an acceptable beverage. Entrepreneurial products, where the beneficial factors of two or more ingredients can be combined to produce healthier functional foods, are gaining more interest and one such combination can be established of soymilk and cow milk to produce a range of beverages and fermented products with improved flavour profile and health attributes. Blended products may posses the nutritional and health benefits of both soybean and cow‟s milk (Karatzas et al., 1999; Sherkat et al., 1999).
1Scientist, Defense Food Research Laboratory, Siddarthnagar, Mysore; 2Director, National Research Centre for Soybean , Indore
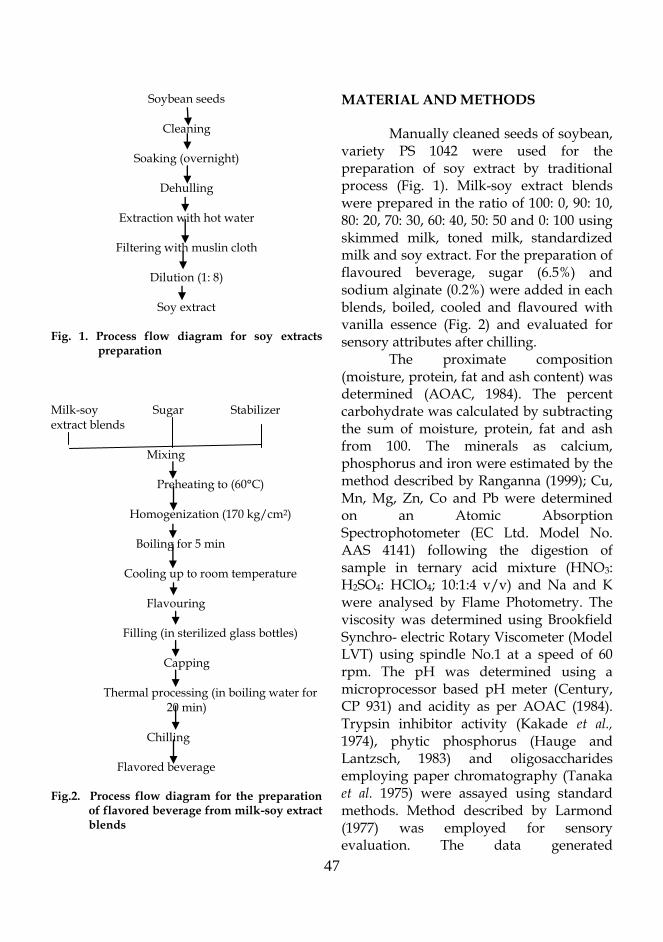
47
Soybean seeds
Cleaning
Soaking (overnight)
Dehulling
Extraction with hot water
Filtering with muslin cloth
Dilution (1: 8)
Soy extract
Fig. 1. Process flow diagram for soy extracts preparation
Milk-soy Sugar Stabilizer extract blends
Mixing
Preheating to (60°C)
Homogenization (170 kg/cm2)
Boiling for 5 min
Cooling up to room temperature
Flavouring
Filling (in sterilized glass bottles)
Capping
Thermal processing (in boiling water for
20 min)
Chilling
Flavored beverage
Fig.2. Process flow diagram for the preparation of flavored beverage from milk-soy extract blends
MATERIAL AND METHODS
Manually cleaned seeds of soybean, variety PS 1042 were used for the preparation of soy extract by traditional process (Fig. 1). Milk-soy extract blends were prepared in the ratio of 100: 0, 90: 10, 80: 20, 70: 30, 60: 40, 50: 50 and 0: 100 using skimmed milk, toned milk, standardized milk and soy extract. For the preparation of flavoured beverage, sugar (6.5%) and sodium alginate (0.2%) were added in each blends, boiled, cooled and flavoured with vanilla essence (Fig. 2) and evaluated for sensory attributes after chilling.
The proximate composition (moisture, protein, fat and ash content) was determined (AOAC, 1984). The percent carbohydrate was calculated by subtracting the sum of moisture, protein, fat and ash from 100. The minerals as calcium, phosphorus and iron were estimated by the method described by Ranganna (1999); Cu, Mn, Mg, Zn, Co and Pb were determined on an Atomic Absorption Spectrophotometer (EC Ltd. Model No. AAS 4141) following the digestion of sample in ternary acid mixture (HNO3: H2SO4: HClO4; 10:1:4 v/v) and Na and K were analysed by Flame Photometry. The viscosity was determined using Brookfield Synchro- electric Rotary Viscometer (Model LVT) using spindle No.1 at a speed of 60 rpm. The pH was determined using a microprocessor based pH meter (Century, CP 931) and acidity as per AOAC (1984). Trypsin inhibitor activity (Kakade et al., 1974), phytic phosphorus (Hauge and Lantzsch, 1983) and oligosaccharides employing paper chromatography (Tanaka et al. 1975) were assayed using standard methods. Method described by Larmond (1977) was employed for sensory evaluation. The data generated
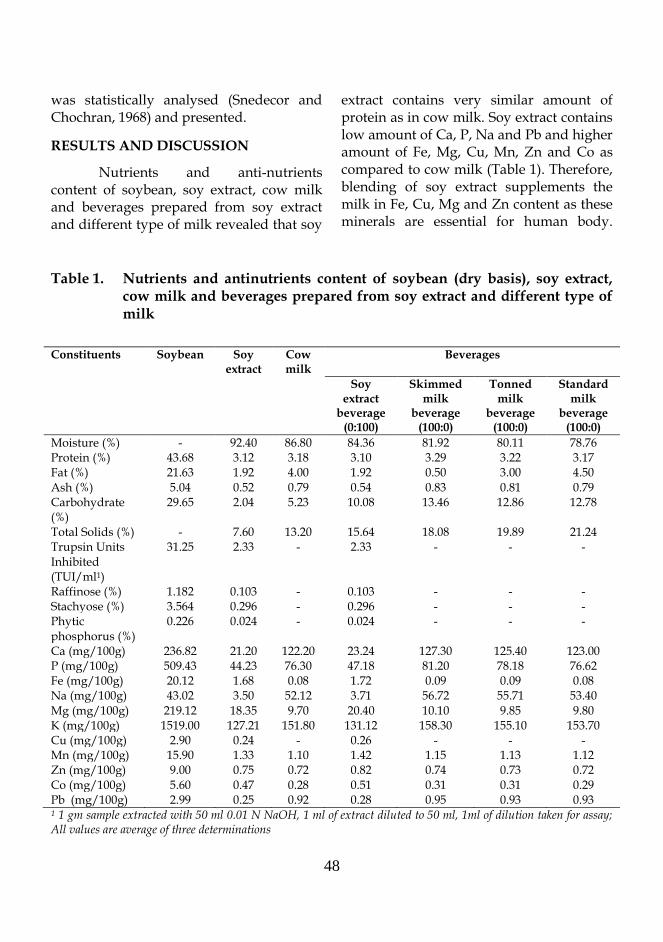
48
was statistically analysed (Snedecor and Chochran, 1968) and presented.
RESULTS AND DISCUSSION
Nutrients and anti-nutrients content of soybean, soy extract, cow milk and beverages prepared from soy extract and different type of milk revealed that soy
extract contains very similar amount of protein as in cow milk. Soy extract contains low amount of Ca, P, Na and Pb and higher amount of Fe, Mg, Cu, Mn, Zn and Co as compared to cow milk (Table 1). Therefore, blending of soy extract supplements the milk in Fe, Cu, Mg and Zn content as these minerals are essential for human body.
Table 1. Nutrients and antinutrients content of soybean (dry basis), soy extract, cow milk and beverages prepared from soy extract and different type of milk
Constituents Soybean Soy extract
Cow milk
Beverages
Soy extract
beverage (0:100)
Skimmed milk
beverage (100:0)
Tonned milk
beverage (100:0)
Standard milk
beverage (100:0)
Moisture (%) - 92.40 86.80 84.36 81.92 80.11 78.76 Protein (%) 43.68 3.12 3.18 3.10 3.29 3.22 3.17 Fat (%) 21.63 1.92 4.00 1.92 0.50 3.00 4.50 Ash (%) 5.04 0.52 0.79 0.54 0.83 0.81 0.79 Carbohydrate (%)
29.65 2.04 5.23 10.08 13.46 12.86 12.78
Total Solids (%) - 7.60 13.20 15.64 18.08 19.89 21.24 Trupsin Units Inhibited (TUI/ml1)
31.25 2.33 - 2.33 - - -
Raffinose (%) 1.182 0.103 - 0.103 - - - Stachyose (%) 3.564 0.296 - 0.296 - - - Phytic phosphorus (%)
0.226 0.024 - 0.024 - - -
Ca (mg/100g) 236.82 21.20 122.20 23.24 127.30 125.40 123.00 P (mg/100g) 509.43 44.23 76.30 47.18 81.20 78.18 76.62 Fe (mg/100g) 20.12 1.68 0.08 1.72 0.09 0.09 0.08 Na (mg/100g) 43.02 3.50 52.12 3.71 56.72 55.71 53.40 Mg (mg/100g) 219.12 18.35 9.70 20.40 10.10 9.85 9.80 K (mg/100g) 1519.00 127.21 151.80 131.12 158.30 155.10 153.70 Cu (mg/100g) 2.90 0.24 - 0.26 - - - Mn (mg/100g) 15.90 1.33 1.10 1.42 1.15 1.13 1.12 Zn (mg/100g) 9.00 0.75 0.72 0.82 0.74 0.73 0.72 Co (mg/100g) 5.60 0.47 0.28 0.51 0.31 0.31 0.29 Pb (mg/100g) 2.99 0.25 0.92 0.28 0.95 0.93 0.93 1 1 gm sample extracted with 50 ml 0.01 N NaOH, 1 ml of extract diluted to 50 ml, 1ml of dilution taken for assay; All values are average of three determinations
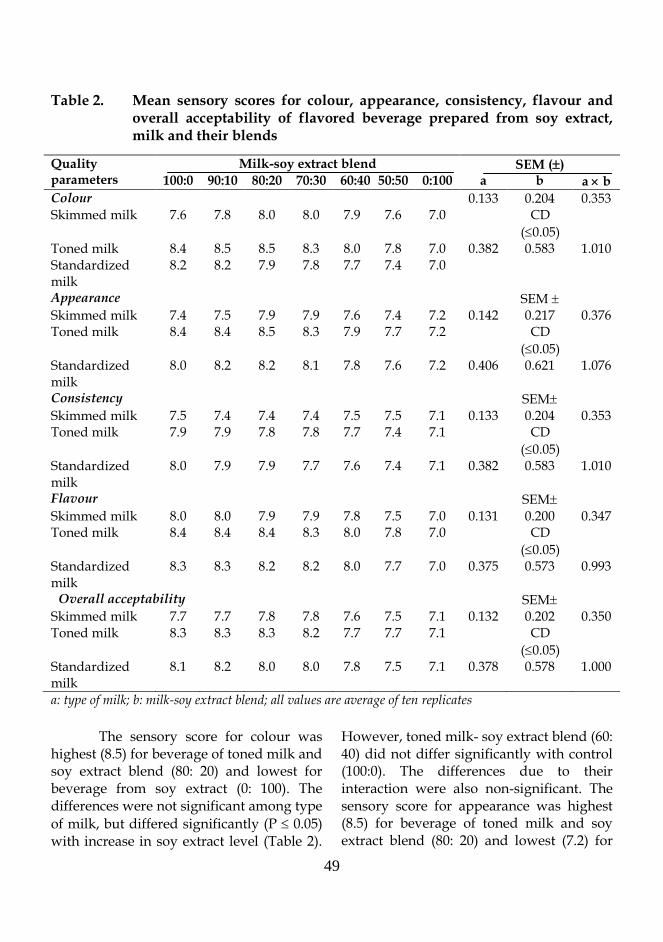
49
Table 2. Mean sensory scores for colour, appearance, consistency, flavour and overall acceptability of flavored beverage prepared from soy extract, milk and their blends
Quality parameters
Milk-soy extract blend SEM () 100:0 90:10 80:20 70:30 60:40 50:50 0:100 a b a b
Colour 0.133 0.204 0.353 Skimmed milk 7.6 7.8 8.0 8.0 7.9 7.6 7.0 CD
(0.05)
Toned milk 8.4 8.5 8.5 8.3 8.0 7.8 7.0 0.382 0.583 1.010 Standardized milk
8.2 8.2 7.9 7.8 7.7 7.4 7.0
Appearance SEM
Skimmed milk 7.4 7.5 7.9 7.9 7.6 7.4 7.2 0.142 0.217 0.376 Toned milk 8.4 8.4 8.5 8.3 7.9 7.7 7.2 CD
(0.05)
Standardized milk
8.0 8.2 8.2 8.1 7.8 7.6 7.2 0.406 0.621 1.076
Consistency SEM
Skimmed milk 7.5 7.4 7.4 7.4 7.5 7.5 7.1 0.133 0.204 0.353 Toned milk 7.9 7.9 7.8 7.8 7.7 7.4 7.1 CD
(0.05)
Standardized milk
8.0 7.9 7.9 7.7 7.6 7.4 7.1 0.382 0.583 1.010
Flavour SEM
Skimmed milk 8.0 8.0 7.9 7.9 7.8 7.5 7.0 0.131 0.200 0.347 Toned milk 8.4 8.4 8.4 8.3 8.0 7.8 7.0 CD
(0.05)
Standardized milk
8.3 8.3 8.2 8.2 8.0 7.7 7.0 0.375 0.573 0.993
Overall acceptability SEM
Skimmed milk 7.7 7.7 7.8 7.8 7.6 7.5 7.1 0.132 0.202 0.350 Toned milk 8.3 8.3 8.3 8.2 7.7 7.7 7.1 CD
(0.05)
Standardized milk
8.1 8.2 8.0 8.0 7.8 7.5 7.1 0.378 0.578 1.000
a: type of milk; b: milk-soy extract blend; all values are average of ten replicates
The sensory score for colour was
highest (8.5) for beverage of toned milk and soy extract blend (80: 20) and lowest for beverage from soy extract (0: 100). The differences were not significant among type
of milk, but differed significantly (P 0.05) with increase in soy extract level (Table 2).
However, toned milk- soy extract blend (60: 40) did not differ significantly with control (100:0). The differences due to their interaction were also non-significant. The sensory score for appearance was highest (8.5) for beverage of toned milk and soy extract blend (80: 20) and lowest (7.2) for
50
beverage from soy extract (0: 100). The differences were non-significant among type of milk used but differed
significantly (P 0.05) with increase in soy extract level. However, toned milk – soy extract (60: 40) blend did not differ significantly with control (100:0). The differences due to their interaction were also non-significant. Flavored beverage prepared from standardized milk (100: 0) had highest (8.0) and beverage from soy extract (0: 100) had lowest (7.0) score for consistency. Differences were not significant for type of milk, level of soy extract and due to their interactions.
Flavored beverage prepared from skimmed milk (100: 0) had highest (8.4) score and beverage from soy extract (0: 100) had lowest (7.0) score for flavour. From the results it was noted that sensory scores for flavour decreased significantly
(P 0.05) with the increase of soy extract level but the reduction was not significant among type of milk and due to its interaction with soy extract level. Beverage from toned milk-soy extract (70: 30) blend had score (8.3) for flavour and did not differ significantly with control (100:0). The sensory score for overall acceptability was highest (8.3) for beverage from toned milk (100: 0) and lowest (7.1) for soy extract (0: 100). The
scores were significantly (P 0.05) decreased with the increase in soy extract level, but the differences were not significant among type of milk and due to their interactions. The sensory score for overall acceptability (8.2) of toned milk-soy extract (70: 30) beverage did not differ significantly with control (100:0), hence recommended.
Physico-chemical as well as nutritional analysis of optimized flavoured beverage showed that it contained pH, 6.65; acidity, 0.125 percent; viscosity, 9.5 CP; total solids, 18.62 percent; protein, 3.18 percent; fat, 2.67 percent; ash, 0.72 percent; carbohydrate, 12.05 percent; stachyose, 0.075 percent; raffinose, 0.020 percent; phytic phosphorus, 0.005 percent; trypsin units inhibited, 0.48 TUI/ml and minerals i.e. Ca, P, Fe, Na, Mg, K, Cu, Mn, Zn, Co, Pb content were 94.60, 68.90, 0.55, 41.12, 12.97, 147.12, 0.08, 1.20, 0.75, 0.38 and 0.75 mg per 100 ml, respectively.
From the results it can be concluded that soy extract can be blended up to 30 per cent with toned milk without affecting its sensory characteristics. Blending may also supplement the milk in minerals content i.e. Cu, Fe, Mg and Zn, in which the milk is deficient.
ACKNOWLEDGEMENT
The work was carried out under the project entitled “Processing of soybean for diversified uses and its socio-economic aspects” funded by NATP-MM, (ICAR). Therefore, financial assistance rendered by NATP-MM, (ICAR) is duly acknowledged.
REFERENCES AOAC. 1984. Official methods of analysis.
14th ed. Association of Official Analytical Chemists, Inc. Arlington, U.S.A.
Hauge W and Lantzsch H J. 1983. Sensitive method for the determination of phytate in cereals and cereal products. Journal of Science of Food and Agriculture 34: 1423.
51
Karatzas B, Sherkat P and Tran HV. 1999. Application of full fat enzyme active soy-flour as food ingredient: II-The characteristics of a soy based functional product, World Soybean Research Conference VI. Chicago, Illinois, USA: 689.
Kakade M L, Rachis J J, McGhee J E and Puski G. 1974. Determination of trypsin inhibitor activity of soy products: A collaborative analysis of an improved procedure. Cereal Chemistry 51: 376-82.
Larmond E. 1977. Laboratory methods for sensory evaluation of foods. Canada Department of Agriculture Publication, Ottawa, 1637pp.
Ranganna S. 1999. Handbook of Analysis and Quality Control for Fruit and Vegetable
Products. 3rd ed. Tata Mc Graw Hill, New Delhi.
Sherkat F, Karatzas D and Razavi S K. 1999. Application of full fat enzyme active soy flour as food ingredient: I- Protein and biogenic factors recovery via hydrothermal extraction. World Soybean Research Conference IV, Chicago, Ilinois, U.S.A.: 661.
Snedecor G N and Cochran W G. 1968. Statistical Methods. 6th ed. Oxford and IBH Pub. Co. New Delhi.
Tanaka M, Thananunkul D, Lee Tung-Ching and Chichester C O. 1975. A simplified method for the quantitative determination of sucrose, raffinose and stachyose in legume seeds. Journal of Food Science 40: 1087-8.

52
Soybean Research, 3: 52-57 (2005)
Soy-Products and Their Relevance to India
NAWAB ALI1 Indian Council of Agricultural Research,
Krishi Anusandhan Bhavan-II, Pusa, New Delhi-110 012
Received: 7th October 2005
ABSTRACT
Soybean is one of the nature’s wonderful nutritional gift of plant origin. It provides a high quality protein and other nutrients along with health promoting phytochenmicals. Using soy-products in daily diet help people feel better and live longer with an enhanced quality of life. The present need is to create awareness about soy-products and its health and economic benefits. For all these to happen, there must be a commitment and missionary zeal by all those involved in soybean production and value chain.
Key words: Soybean, health benefits, phytochemicals
There are more than 1000 million people in India and majority of them (65-70%) are vegetarian and derive their proteins from pulses, cereals, milk and to some extent from oilseeds like groundnut, sesame and soybean. In general, the quality of protein eaten by such population is poor. Better quality proteins from egg, meat and aqua products are costly and only a select group of rich population has access to it. 25-30 percent of Indian population are below poverty line (BPL) and do not have
enough purchasing power for good quality dietary proteins. This calls for providing them an alternative source of dietary protein, which could be financially affordable. Soybean meets such requirements (Table 1). Hence for India, one of the options is to make use of soybean as protein source to augment its conventional protein supply at a cost/price affordable to all especially the lower income group of population. India produces about 06 million tonnes of soybean annually.
Table 1. Comparative analysis for protein content and its cost in some selected protein food sources in India (Ali, 2000)
Protein source Cost of food items (Rs./kg)
Protein content (%)
Cost of protein (Rs/kg)
Soybean (Fullfat soyflour) 20.0 40.0 50.0 Groundnut (kernel) 25.0 25.0 100.0 Pulses (splits/dal) 30.0 25.0 130.0 Egg 30.0 16.0 180.0 Milk 12.0 4.0 300.0 Fish 60.0 16.0 360.0 Meat 90.0 16.0 540.0 1Deputy Director General (Agricultural Engineering)
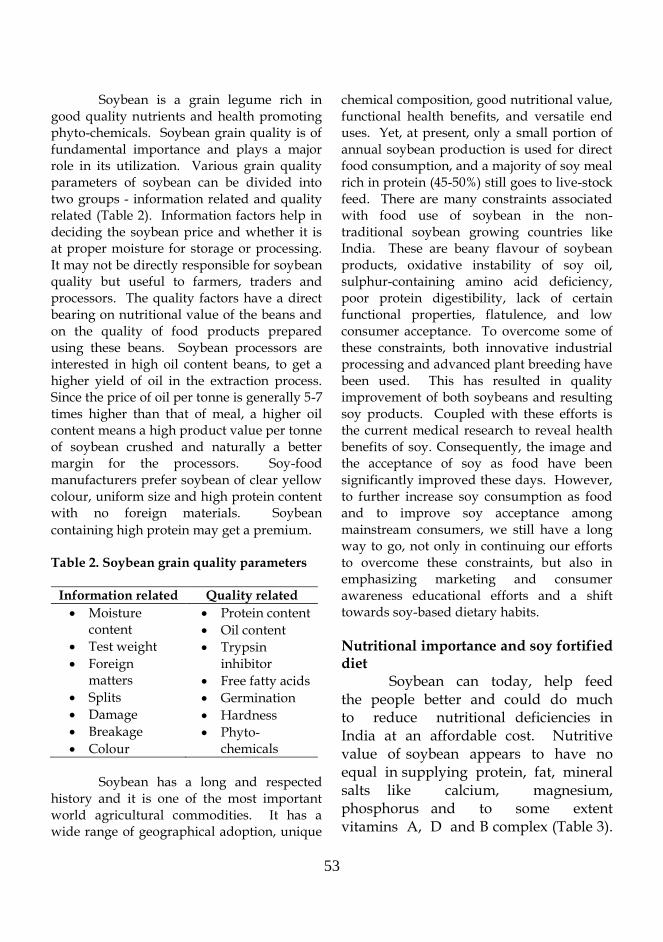
53
Soybean is a grain legume rich in good quality nutrients and health promoting phyto-chemicals. Soybean grain quality is of fundamental importance and plays a major role in its utilization. Various grain quality parameters of soybean can be divided into two groups - information related and quality related (Table 2). Information factors help in deciding the soybean price and whether it is at proper moisture for storage or processing. It may not be directly responsible for soybean quality but useful to farmers, traders and processors. The quality factors have a direct bearing on nutritional value of the beans and on the quality of food products prepared using these beans. Soybean processors are interested in high oil content beans, to get a higher yield of oil in the extraction process. Since the price of oil per tonne is generally 5-7 times higher than that of meal, a higher oil content means a high product value per tonne of soybean crushed and naturally a better margin for the processors. Soy-food manufacturers prefer soybean of clear yellow colour, uniform size and high protein content with no foreign materials. Soybean
containing high protein may get a premium. Table 2. Soybean grain quality parameters
Information related Quality related
Moisture content
Test weight
Foreign matters
Splits
Damage
Breakage
Colour
Protein content
Oil content
Trypsin inhibitor
Free fatty acids
Germination
Hardness
Phyto-chemicals
Soybean has a long and respected
history and it is one of the most important world agricultural commodities. It has a wide range of geographical adoption, unique
chemical composition, good nutritional value, functional health benefits, and versatile end uses. Yet, at present, only a small portion of annual soybean production is used for direct food consumption, and a majority of soy meal rich in protein (45-50%) still goes to live-stock feed. There are many constraints associated with food use of soybean in the non-traditional soybean growing countries like India. These are beany flavour of soybean products, oxidative instability of soy oil, sulphur-containing amino acid deficiency, poor protein digestibility, lack of certain functional properties, flatulence, and low consumer acceptance. To overcome some of these constraints, both innovative industrial processing and advanced plant breeding have been used. This has resulted in quality improvement of both soybeans and resulting soy products. Coupled with these efforts is the current medical research to reveal health benefits of soy. Consequently, the image and the acceptance of soy as food have been significantly improved these days. However, to further increase soy consumption as food and to improve soy acceptance among mainstream consumers, we still have a long way to go, not only in continuing our efforts to overcome these constraints, but also in emphasizing marketing and consumer awareness educational efforts and a shift towards soy-based dietary habits.
Nutritional importance and soy fortified diet
Soybean can today, help feed the people better and could do much to reduce nutritional deficiencies in India at an affordable cost. Nutritive value of soybean appears to have no equal in supplying protein, fat, mineral salts like calcium, magnesium, phosphorus and to some extent vitamins A, D and B complex (Table 3).
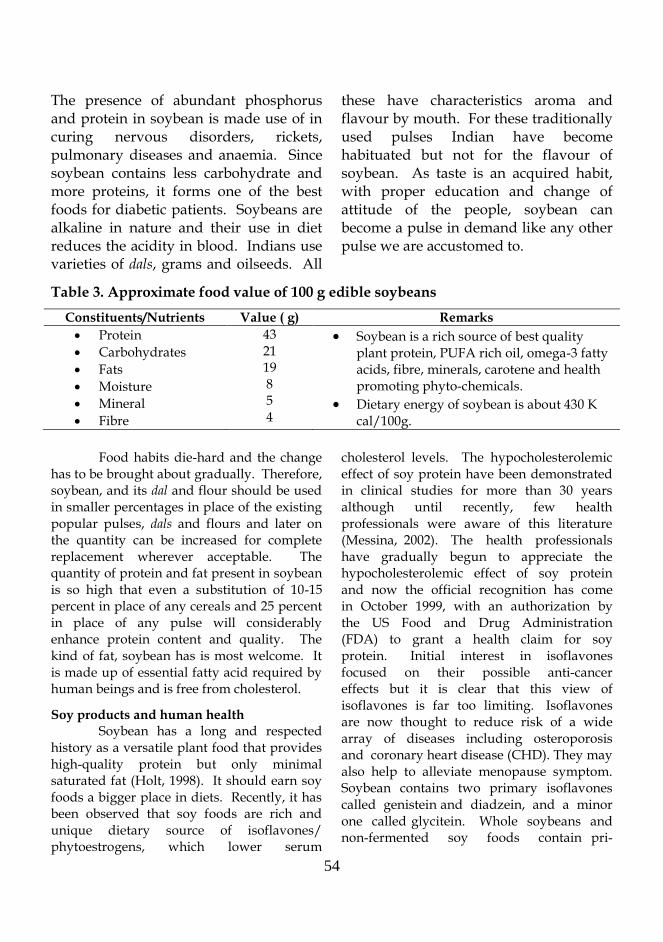
54
The presence of abundant phosphorus and protein in soybean is made use of in curing nervous disorders, rickets, pulmonary diseases and anaemia. Since soybean contains less carbohydrate and more proteins, it forms one of the best foods for diabetic patients. Soybeans are alkaline in nature and their use in diet reduces the acidity in blood. Indians use varieties of dals, grams and oilseeds. All
these have characteristics aroma and flavour by mouth. For these traditionally used pulses Indian have become habituated but not for the flavour of soybean. As taste is an acquired habit, with proper education and change of attitude of the people, soybean can become a pulse in demand like any other pulse we are accustomed to.
Table 3. Approximate food value of 100 g edible soybeans
Constituents/Nutrients Value ( g) Remarks
Protein
Carbohydrates
Fats
Moisture
Mineral
Fibre
43 21 19 8 5 4
Soybean is a rich source of best quality plant protein, PUFA rich oil, omega-3 fatty acids, fibre, minerals, carotene and health promoting phyto-chemicals.
Dietary energy of soybean is about 430 K cal/100g.
Food habits die-hard and the change
has to be brought about gradually. Therefore, soybean, and its dal and flour should be used in smaller percentages in place of the existing popular pulses, dals and flours and later on the quantity can be increased for complete replacement wherever acceptable. The quantity of protein and fat present in soybean is so high that even a substitution of 10-15 percent in place of any cereals and 25 percent in place of any pulse will considerably enhance protein content and quality. The kind of fat, soybean has is most welcome. It is made up of essential fatty acid required by human beings and is free from cholesterol.
Soy products and human health Soybean has a long and respected
history as a versatile plant food that provides high-quality protein but only minimal saturated fat (Holt, 1998). It should earn soy foods a bigger place in diets. Recently, it has been observed that soy foods are rich and unique dietary source of isoflavones/ phytoestrogens, which lower serum
cholesterol levels. The hypocholesterolemic effect of soy protein have been demonstrated in clinical studies for more than 30 years although until recently, few health professionals were aware of this literature (Messina, 2002). The health professionals have gradually begun to appreciate the hypocholesterolemic effect of soy protein and now the official recognition has come in October 1999, with an authorization by the US Food and Drug Administration (FDA) to grant a health claim for soy protein. Initial interest in isoflavones focused on their possible anti-cancer effects but it is clear that this view of isoflavones is far too limiting. Isoflavones are now thought to reduce risk of a wide array of diseases including osteroporosis and coronary heart disease (CHD). They may also help to alleviate menopause symptom. Soybean contains two primary isoflavones called genistein and diadzein, and a minor one called glycitein. Whole soybeans and non-fermented soy foods contain pri-
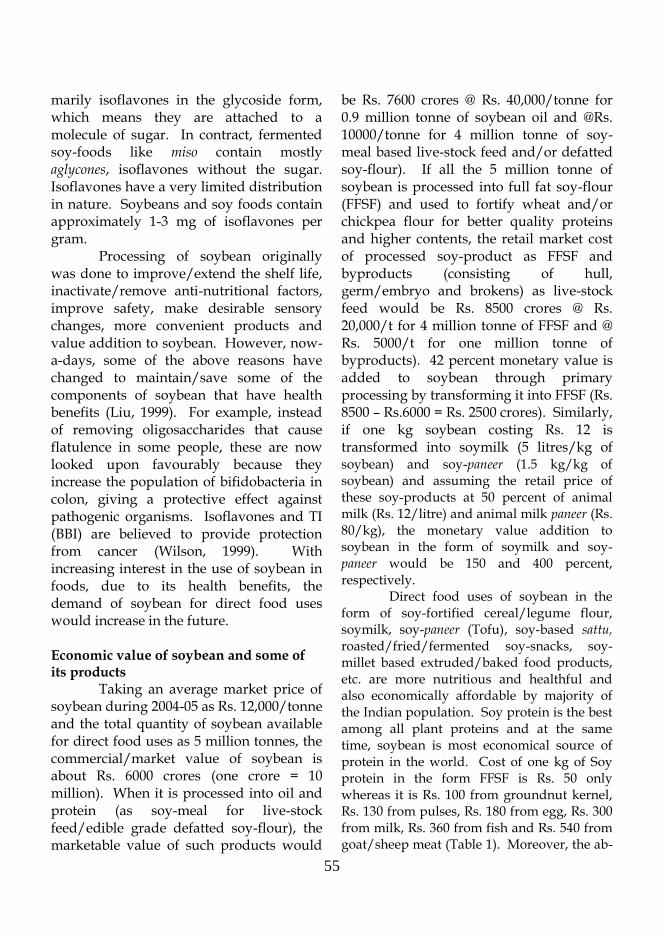
55
marily isoflavones in the glycoside form, which means they are attached to a molecule of sugar. In contract, fermented soy-foods like miso contain mostly aglycones, isoflavones without the sugar. Isoflavones have a very limited distribution in nature. Soybeans and soy foods contain approximately 1-3 mg of isoflavones per gram.
Processing of soybean originally was done to improve/extend the shelf life, inactivate/remove anti-nutritional factors, improve safety, make desirable sensory changes, more convenient products and value addition to soybean. However, now-a-days, some of the above reasons have changed to maintain/save some of the components of soybean that have health benefits (Liu, 1999). For example, instead of removing oligosaccharides that cause flatulence in some people, these are now looked upon favourably because they increase the population of bifidobacteria in colon, giving a protective effect against pathogenic organisms. Isoflavones and TI (BBI) are believed to provide protection from cancer (Wilson, 1999). With increasing interest in the use of soybean in foods, due to its health benefits, the demand of soybean for direct food uses would increase in the future.
Economic value of soybean and some of its products
Taking an average market price of soybean during 2004-05 as Rs. 12,000/tonne and the total quantity of soybean available for direct food uses as 5 million tonnes, the commercial/market value of soybean is about Rs. 6000 crores (one crore = 10 million). When it is processed into oil and protein (as soy-meal for live-stock feed/edible grade defatted soy-flour), the marketable value of such products would
be Rs. 7600 crores @ Rs. 40,000/tonne for 0.9 million tonne of soybean oil and @Rs. 10000/tonne for 4 million tonne of soy-meal based live-stock feed and/or defatted soy-flour). If all the 5 million tonne of soybean is processed into full fat soy-flour (FFSF) and used to fortify wheat and/or chickpea flour for better quality proteins and higher contents, the retail market cost of processed soy-product as FFSF and byproducts (consisting of hull, germ/embryo and brokens) as live-stock feed would be Rs. 8500 crores @ Rs. 20,000/t for 4 million tonne of FFSF and @ Rs. 5000/t for one million tonne of byproducts). 42 percent monetary value is added to soybean through primary processing by transforming it into FFSF (Rs. 8500 – Rs.6000 = Rs. 2500 crores). Similarly, if one kg soybean costing Rs. 12 is transformed into soymilk (5 litres/kg of soybean) and soy-paneer (1.5 kg/kg of soybean) and assuming the retail price of these soy-products at 50 percent of animal milk (Rs. 12/litre) and animal milk paneer (Rs. 80/kg), the monetary value addition to soybean in the form of soymilk and soy-paneer would be 150 and 400 percent, respectively.
Direct food uses of soybean in the form of soy-fortified cereal/legume flour, soymilk, soy-paneer (Tofu), soy-based sattu, roasted/fried/fermented soy-snacks, soy-millet based extruded/baked food products, etc. are more nutritious and healthful and also economically affordable by majority of the Indian population. Soy protein is the best among all plant proteins and at the same time, soybean is most economical source of protein in the world. Cost of one kg of Soy protein in the form FFSF is Rs. 50 only whereas it is Rs. 100 from groundnut kernel, Rs. 130 from pulses, Rs. 180 from egg, Rs. 300 from milk, Rs. 360 from fish and Rs. 540 from goat/sheep meat (Table 1). Moreover, the ab-

56
Fig.1. Some of the value added products from soybean
Fig. 2. Training of rural/urban women in domestic utilization of soybean
Fig. 3. Potential entrepreneurs in soymilk, soy-paneer and soy based other dairy analogs
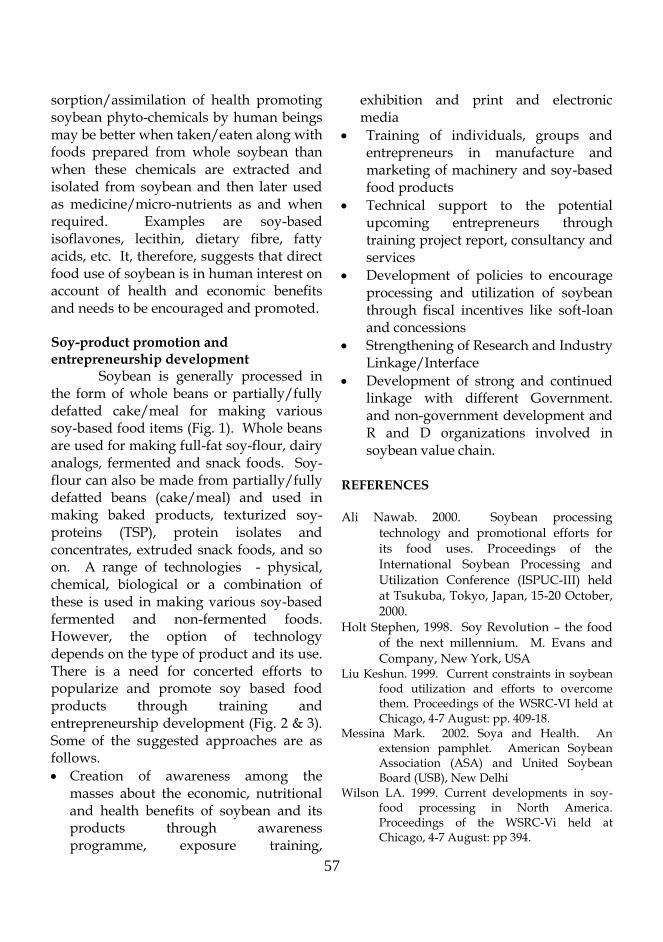
57
sorption/assimilation of health promoting soybean phyto-chemicals by human beings may be better when taken/eaten along with foods prepared from whole soybean than when these chemicals are extracted and isolated from soybean and then later used as medicine/micro-nutrients as and when required. Examples are soy-based isoflavones, lecithin, dietary fibre, fatty acids, etc. It, therefore, suggests that direct food use of soybean is in human interest on account of health and economic benefits and needs to be encouraged and promoted. Soy-product promotion and entrepreneurship development
Soybean is generally processed in the form of whole beans or partially/fully defatted cake/meal for making various soy-based food items (Fig. 1). Whole beans are used for making full-fat soy-flour, dairy analogs, fermented and snack foods. Soy-flour can also be made from partially/fully defatted beans (cake/meal) and used in making baked products, texturized soy-proteins (TSP), protein isolates and concentrates, extruded snack foods, and so on. A range of technologies - physical, chemical, biological or a combination of these is used in making various soy-based fermented and non-fermented foods. However, the option of technology depends on the type of product and its use. There is a need for concerted efforts to popularize and promote soy based food products through training and entrepreneurship development (Fig. 2 & 3). Some of the suggested approaches are as follows.
Creation of awareness among the masses about the economic, nutritional and health benefits of soybean and its products through awareness programme, exposure training,
exhibition and print and electronic media
Training of individuals, groups and entrepreneurs in manufacture and marketing of machinery and soy-based food products
Technical support to the potential upcoming entrepreneurs through training project report, consultancy and services
Development of policies to encourage processing and utilization of soybean through fiscal incentives like soft-loan and concessions
Strengthening of Research and Industry Linkage/Interface
Development of strong and continued linkage with different Government. and non-government development and R and D organizations involved in soybean value chain.
REFERENCES Ali Nawab. 2000. Soybean processing
technology and promotional efforts for its food uses. Proceedings of the International Soybean Processing and Utilization Conference (ISPUC-III) held at Tsukuba, Tokyo, Japan, 15-20 October, 2000.
Holt Stephen, 1998. Soy Revolution – the food of the next millennium. M. Evans and Company, New York, USA
Liu Keshun. 1999. Current constraints in soybean food utilization and efforts to overcome them. Proceedings of the WSRC-VI held at Chicago, 4-7 August: pp. 409-18.
Messina Mark. 2002. Soya and Health. An extension pamphlet. American Soybean Association (ASA) and United Soybean Board (USB), New Delhi
Wilson LA. 1999. Current developments in soy-food processing in North America. Proceedings of the WSRC-Vi held at Chicago, 4-7 August: pp 394.

58
Soybean Research, 3: 58-62 (2005)
Knowledge of Women Respondents About the Health Benefits and Utility of Soybean for Food Uses
B U DUPARE1, S S VINAYAGAM2, S D BILLORE3 AND O P JOSHI4 National Research Centre for Soybean, Khandwa Road, Indore 452017, India
(E-mail: [email protected])
Received: 27thOctober 2005
ABSTRACT
The use of soybean as food even thirty-five years after its introduction in late seventies as commercial crop in India is non-significant leaving aside that of soy-oil for culinary purpose. In view of rampant energy-protein mal-nutrition in the Indian populace and enlightenment on health benefits of soybean in the recent past, it is considered that awareness on this aspect will not only mitigate the problem but will also ensure good health. The efforts made by National Research Centre for Soybean, Indore while working with the rural/tribal and urban women brings out that though the people hesitant initially to give entry to soybean in their kitchen, are convinced on its value as food/functional food and are revealing their acceptance for soy-processed products; soy-pakora, soy-nuts, soy-milk and tofu (soy-paneer) in order of preference. The sustained efforts in this direction may help to mitigate mal-nutrition problem at one hand and extending health benefits on the other.
Key words: Food uses, health benefits, knowledge, soybean, women
Soybean shares nearly 32 percent of the total oilseeds produced in India. Besides contributing substantially (above 13%) to the edible oil production of the country, it fetches average export earnings worth Rs. 20, 000 million each year by way of export of soy-meal. Though soybean has established itself as an integral part of traditional cropping systems, particularly in the Malwa plateau of Central India, its food uses have been meager except that in the form of edible oil for culinary purpose. The research during recent past has surfaced the beneficial effect of soybean intake as food on providing total health and nutritional security to human beings (Riaz, 1999; Ali, 2001). Considering the
significance of the neutraceutical values of soybean and its emerging status as a functional food, National Research Centre for Soybean, Indore has successfully completed a project on “Popularization of soybean at household levels for nutritional security” with the financial support from TMOP&M. The efforts were made therein to take various soy-preparations to the kitchens of housewives by imparting training on their preparations along with knowledge on possible health benefits. The outcome from these training programmes organized in the Malwa and adjoining regions of Madhya Pradesh are stated in the following text.
1 Scientist Senior Scale, 2,3Senior Scientist, 4Principal Scientist
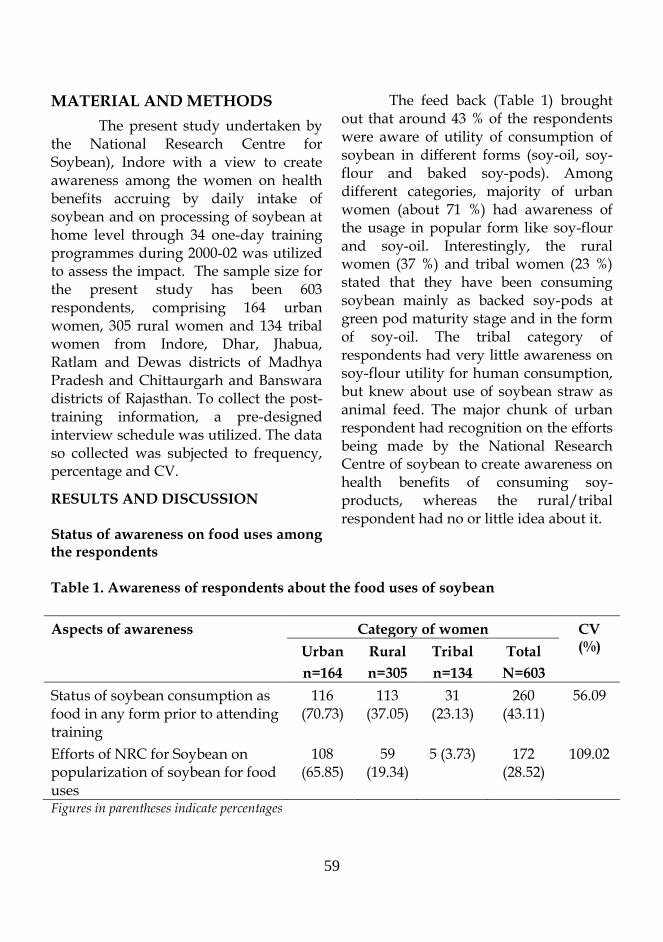
59
MATERIAL AND METHODS
The present study undertaken by the National Research Centre for Soybean), Indore with a view to create awareness among the women on health benefits accruing by daily intake of soybean and on processing of soybean at home level through 34 one-day training programmes during 2000-02 was utilized to assess the impact. The sample size for the present study has been 603 respondents, comprising 164 urban women, 305 rural women and 134 tribal women from Indore, Dhar, Jhabua, Ratlam and Dewas districts of Madhya Pradesh and Chittaurgarh and Banswara districts of Rajasthan. To collect the post-training information, a pre-designed interview schedule was utilized. The data so collected was subjected to frequency, percentage and CV.
RESULTS AND DISCUSSION Status of awareness on food uses among the respondents
The feed back (Table 1) brought out that around 43 % of the respondents were aware of utility of consumption of soybean in different forms (soy-oil, soy-flour and baked soy-pods). Among different categories, majority of urban women (about 71 %) had awareness of the usage in popular form like soy-flour and soy-oil. Interestingly, the rural women (37 %) and tribal women (23 %) stated that they have been consuming soybean mainly as backed soy-pods at green pod maturity stage and in the form of soy-oil. The tribal category of respondents had very little awareness on soy-flour utility for human consumption, but knew about use of soybean straw as animal feed. The major chunk of urban respondent had recognition on the efforts being made by the National Research Centre of soybean to create awareness on health benefits of consuming soy-products, whereas the rural/tribal respondent had no or little idea about it.
Table 1. Awareness of respondents about the food uses of soybean
Aspects of awareness Category of women CV (%) Urban
n=164
Rural
n=305
Tribal
n=134
Total
N=603
Status of soybean consumption as food in any form prior to attending training
116 (70.73)
113 (37.05)
31 (23.13)
260 (43.11)
56.09
Efforts of NRC for Soybean on popularization of soybean for food uses
108 (65.85)
59 (19.34)
5 (3.73) 172 (28.52)
109.02
Figures in parentheses indicate percentages

60
Knowledge gained by the respondents
Most of respondents irrespective of the categories developed an extremely positive attitude after training about the food and nutraceutical value of soybean, and its status as a functional food (Table 2). Almost all of them agreed that soybean being a cheapest source of high quality protein has potentials to abridge the gap of calorie-protein malnutrition
along with minimizing the chances ailing from dreaded diseases like cancer, diabetes, osteoporosis and cardiac arrest. The phyto-hormone, isoflavone, contained in the soybean is also reported to protect women from breast cancer and relives from menopausal blues. Documented literature (Khan, 2001; Wang, 1999, Messina, 1997; Browning and Niebrugge, 1999) amply supports the statements made above.
Table 2. Distribution of respondents according to their knowledge gained regarding nutritional aspects of soybean
Nutritional aspects of soybean
Category of women CV (%)
Urban n=164
Rural n=305
Tribal n=134
Total N=603
Highest protein content
149 (90.85) 291 (95.41) 134 (100) 574 (95.19) 4.79
Cheapest protein source
160 (97.56) 295 (96.74) 130 (97.01) 585 (97.01) 0.43
Beneficial in reducing the risk of cancer, diabetics, and heart diseases etc
154 (93.90) 294 (96.39) 129 (96.27) 577 (95.69) 1.47
Relief from menopausal problems in women.
162 (98.78) 295 (96.72) 134 (100) 591 (98.01) 1.68
Soybean as a Functional food
164 (100) 305 (100) 134 (100) 603 (100) 0.0
Figures in parentheses indicate percentages
Feed back on soy-preparations
An attempt was made to ascertain
the preference of respondents about different soy dishes prepared by themselves as per the directions given during the course of trainings. Among the five different ways of processing soybean for food usage, soy-pakora and soy-nuts were most preferred items on
account of ease in preparation and taste-wise liked by majority (around 50 %) of the respondents (Table 3). Soymilk and green pods boiled in salt water followed this. There has been luke-warm preference (about 17%) for tofu (soy-paneer) on the reasoning that it requires special skill and hard work in processing. All the categories of respondents reported that preparation of soy-pakora
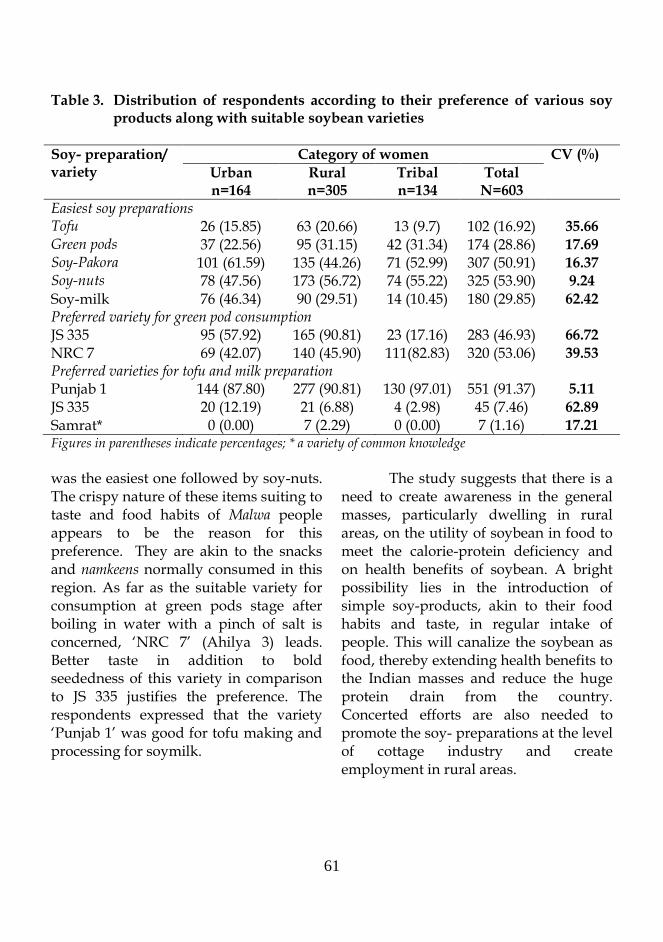
61
Table 3. Distribution of respondents according to their preference of various soy products along with suitable soybean varieties
Soy- preparation/ variety
Category of women CV (%)
Urban n=164
Rural n=305
Tribal n=134
Total N=603
Easiest soy preparations Tofu 26 (15.85) 63 (20.66) 13 (9.7) 102 (16.92) 35.66 Green pods 37 (22.56) 95 (31.15) 42 (31.34) 174 (28.86) 17.69 Soy-Pakora 101 (61.59) 135 (44.26) 71 (52.99) 307 (50.91) 16.37 Soy-nuts 78 (47.56) 173 (56.72) 74 (55.22) 325 (53.90) 9.24 Soy-milk 76 (46.34) 90 (29.51) 14 (10.45) 180 (29.85) 62.42 Preferred variety for green pod consumption JS 335 95 (57.92) 165 (90.81) 23 (17.16) 283 (46.93) 66.72 NRC 7 69 (42.07) 140 (45.90) 111(82.83) 320 (53.06) 39.53 Preferred varieties for tofu and milk preparation Punjab 1 144 (87.80) 277 (90.81) 130 (97.01) 551 (91.37) 5.11 JS 335 20 (12.19) 21 (6.88) 4 (2.98) 45 (7.46) 62.89 Samrat* 0 (0.00) 7 (2.29) 0 (0.00) 7 (1.16) 17.21 Figures in parentheses indicate percentages; * a variety of common knowledge
was the easiest one followed by soy-nuts. The crispy nature of these items suiting to taste and food habits of Malwa people appears to be the reason for this preference. They are akin to the snacks and namkeens normally consumed in this region. As far as the suitable variety for consumption at green pods stage after boiling in water with a pinch of salt is concerned, „NRC 7‟ (Ahilya 3) leads. Better taste in addition to bold seededness of this variety in comparison to JS 335 justifies the preference. The respondents expressed that the variety „Punjab 1‟ was good for tofu making and processing for soymilk.
The study suggests that there is a need to create awareness in the general masses, particularly dwelling in rural areas, on the utility of soybean in food to meet the calorie-protein deficiency and on health benefits of soybean. A bright possibility lies in the introduction of simple soy-products, akin to their food habits and taste, in regular intake of people. This will canalize the soybean as food, thereby extending health benefits to the Indian masses and reduce the huge protein drain from the country. Concerted efforts are also needed to promote the soy- preparations at the level of cottage industry and create employment in rural areas.
62
REFERENCES
Ali Nawab 2001. Constraints and the remedial measures for an accelerated utilization of soybean in India. In: Harnessing the Soy Potential for Health and Wealth. Souvenir: India Soy Forum, organized by Ministry of Agriculture, GOI, on 17-18 March 2001 at Soybean Processors Association of India Indore, pp 70-9.
Browning Valencia and Niebrugge Shelly. 1999. Potential benefits of phyto-estrogens in the prevention of breast cancer in pre- and post- menopausal women: A review and nutrition education material promoting soy based foods and products. In: Proceedings of World Soybean Research Conference VI (4-7 Aug. 1999), Ed. Harold E. Kauffman, Chicago, Illinois, USA, pp. 714.
Khan V A 2001. Soybean for health. In Harnessing the soy potential for health and wealth. Souvenir: India Soy Forum, organized by Ministry of Agriculture, GOI, on 17-18 March, 2001 at Soybean Processors Association of India, Indore, pp 80-3.
Messina Mark J. 1997. Soy food: Their role in disease prevention and treatment. In: Soybean- Chemistry, Technology and Utilization: Liu Keshun (ed) Chapman and Hall, New York, pp 442-77.
Riaz M N 1999. Soybeans as functional food. Technical Information. American Soybean Association and United Soybean Board. Pp 10.
Wang Chunyang (C.Y.). 1999. Phytochemicals in soybeans. In: Proceedings of World Soybean Research Conference VI (4-7 Aug. 1999), Ed. Harold E. Kauffman, Chicago, Illinois, USA, pp.700.

63
Soybean Research, 3: 63-67 (2005)
Effect of Enriched Compost in Combination with Fertilizers on Nodulation, Growth and Yield of Soybean
[Glycine max (L.) Merrill]
AMIT MISHRA1, N. KUMAR2, R. CHANDRA3 AND S.K. SINGH4
Department of Soil Science, College Of Agriculture G. B. Pant University of Agriculture and Technology Pantnagar, 263145, India
E –mail [email protected]
Received: 18th August 2005
Key words: Glycine max, enriched compost, fertility levels Soybean is generally grown without taking much care on balanced nutrition leading to sub-optimal performance. In India, the productivity is much lower than the potentials of popular varieties (2500 to 3000 kg/ha) and performance of crop under available production technology (above 1800 kg/ha) under real farm conditions. Therefore, there is a need to increase yield, oil and protein content of soybean with integrated approach involving judicious use of fertilizers along with other organic sources taking care of soil health. The lacunae in use of organic components, particularly slow decomposition can be over come by employing fast decomposing cellulolytic fungi (Bhardawaj and Gaur, 1985) and that of low nutrient content by enrichment with fertilizer N, rock phosphate, bone meal, feldspar, pyrite, N2 fixing bacteria and phosphate solubilizing microorganisms (Manna et al., 1997). Phosphorus enriched compost owing to addition of low-grade rock phosphates, available abundantly in
various parts of India, in association with phosphate-solubilizing fungi (Aspergillus awamori) to accelerate the process of composting as well as its quality (Singh et al., 1992 and Singh, 2000). The present study was conducted to see the impact of enriched compost alone and in combination with the levels of fertilizer NPK on nodulation, growth, yield and nutrient content of soybean crop.
The field experiment was conducted at Crop Research Centre, Pantnagar during Kharif 2004 using soybean var. PK 1042 in randomized block design involving seven treatments viz. control, recommended level of NPK, enriched compost (EC) + 75 percent NPK, EC +50 per cent NPK, EC + 25 per cent NPK, EC and farmyard manure (FYM) alone, replicated thrice in Typic Hapludoll soil having pH (7.2), EC (0.41dS/m), organic carbon (0.39 %), mineralisable N (195.62 kg /ha), Olsen‟s available P (18.16 kg/ha) and normal ammonium acetate extractable K (125.12 kg/ha). The crop was sown on 22nd July 2004 in 4 × 3 m2 plots and harvested
1Research Scholar; 2,3Senior Research Office; 4Assocoate Professor
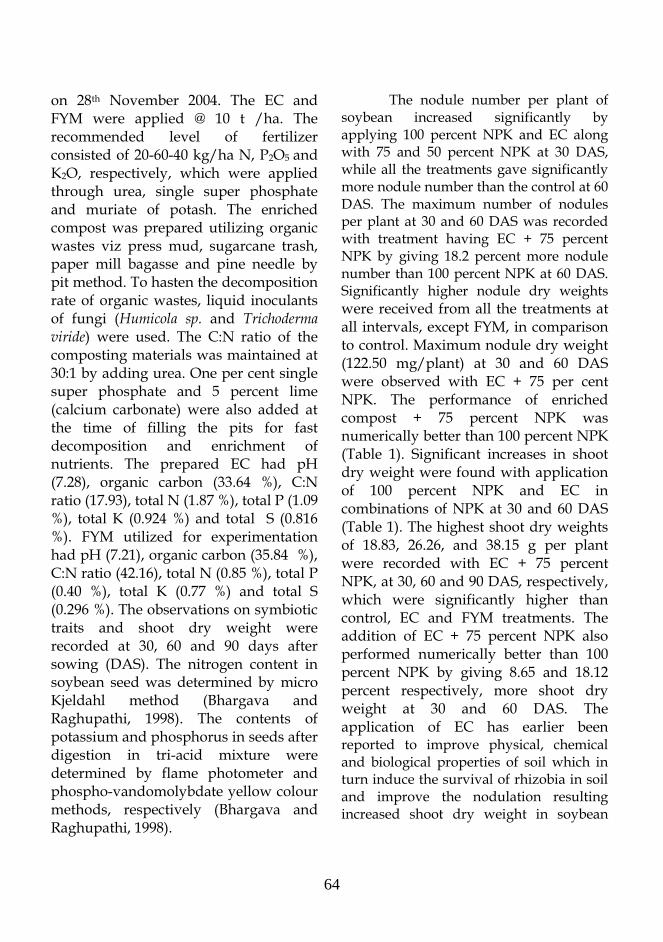
64
on 28th November 2004. The EC and FYM were applied @ 10 t /ha. The recommended level of fertilizer consisted of 20-60-40 kg/ha N, P2O5 and K2O, respectively, which were applied through urea, single super phosphate and muriate of potash. The enriched compost was prepared utilizing organic wastes viz press mud, sugarcane trash, paper mill bagasse and pine needle by pit method. To hasten the decomposition rate of organic wastes, liquid inoculants of fungi (Humicola sp. and Trichoderma viride) were used. The C:N ratio of the composting materials was maintained at 30:1 by adding urea. One per cent single super phosphate and 5 percent lime (calcium carbonate) were also added at the time of filling the pits for fast decomposition and enrichment of nutrients. The prepared EC had pH (7.28), organic carbon (33.64 %), C:N ratio (17.93), total N (1.87 %), total P (1.09 %), total K (0.924 %) and total S (0.816 %). FYM utilized for experimentation had pH (7.21), organic carbon (35.84 %), C:N ratio (42.16), total N (0.85 %), total P (0.40 %), total K (0.77 %) and total S (0.296 %). The observations on symbiotic traits and shoot dry weight were recorded at 30, 60 and 90 days after sowing (DAS). The nitrogen content in soybean seed was determined by micro Kjeldahl method (Bhargava and Raghupathi, 1998). The contents of potassium and phosphorus in seeds after digestion in tri-acid mixture were determined by flame photometer and phospho-vandomolybdate yellow colour methods, respectively (Bhargava and Raghupathi, 1998).
The nodule number per plant of soybean increased significantly by applying 100 percent NPK and EC along with 75 and 50 percent NPK at 30 DAS, while all the treatments gave significantly more nodule number than the control at 60 DAS. The maximum number of nodules per plant at 30 and 60 DAS was recorded with treatment having EC + 75 percent NPK by giving 18.2 percent more nodule number than 100 percent NPK at 60 DAS. Significantly higher nodule dry weights were received from all the treatments at all intervals, except FYM, in comparison to control. Maximum nodule dry weight (122.50 mg/plant) at 30 and 60 DAS were observed with EC + 75 per cent NPK. The performance of enriched compost + 75 percent NPK was numerically better than 100 percent NPK (Table 1). Significant increases in shoot dry weight were found with application of 100 percent NPK and EC in combinations of NPK at 30 and 60 DAS (Table 1). The highest shoot dry weights of 18.83, 26.26, and 38.15 g per plant were recorded with EC + 75 percent NPK, at 30, 60 and 90 DAS, respectively, which were significantly higher than control, EC and FYM treatments. The addition of EC + 75 percent NPK also performed numerically better than 100 percent NPK by giving 8.65 and 18.12 percent respectively, more shoot dry weight at 30 and 60 DAS. The application of EC has earlier been reported to improve physical, chemical and biological properties of soil which in turn induce the survival of rhizobia in soil and improve the nodulation resulting increased shoot dry weight in soybean
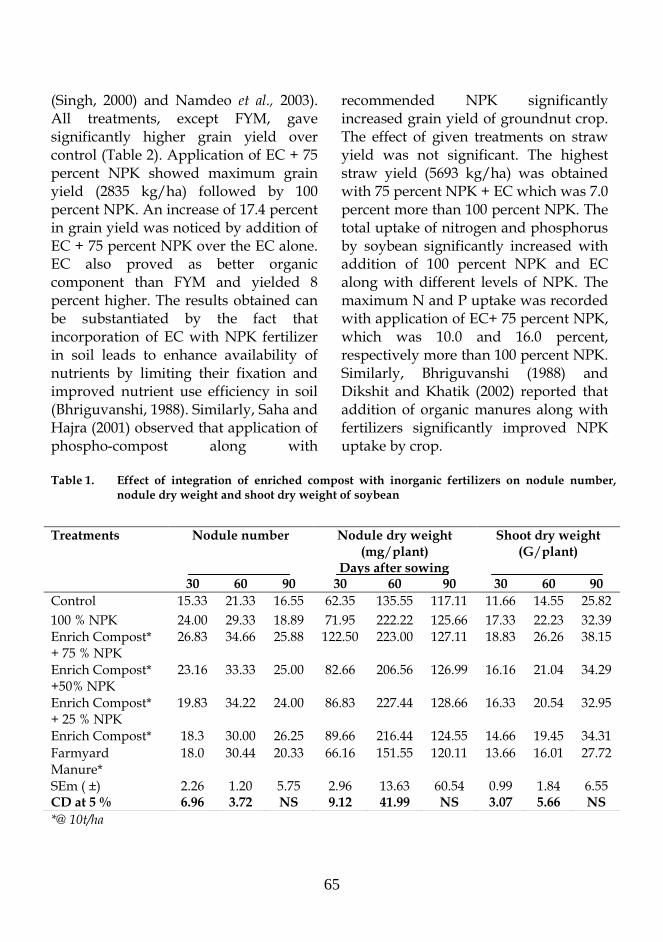
65
(Singh, 2000) and Namdeo et al., 2003). All treatments, except FYM, gave significantly higher grain yield over control (Table 2). Application of EC + 75 percent NPK showed maximum grain yield (2835 kg/ha) followed by 100 percent NPK. An increase of 17.4 percent in grain yield was noticed by addition of EC + 75 percent NPK over the EC alone. EC also proved as better organic component than FYM and yielded 8 percent higher. The results obtained can be substantiated by the fact that incorporation of EC with NPK fertilizer in soil leads to enhance availability of nutrients by limiting their fixation and improved nutrient use efficiency in soil (Bhriguvanshi, 1988). Similarly, Saha and Hajra (2001) observed that application of phospho-compost along with
recommended NPK significantly increased grain yield of groundnut crop. The effect of given treatments on straw yield was not significant. The highest straw yield (5693 kg/ha) was obtained with 75 percent NPK + EC which was 7.0 percent more than 100 percent NPK. The total uptake of nitrogen and phosphorus by soybean significantly increased with addition of 100 percent NPK and EC along with different levels of NPK. The maximum N and P uptake was recorded with application of EC+ 75 percent NPK, which was 10.0 and 16.0 percent, respectively more than 100 percent NPK. Similarly, Bhriguvanshi (1988) and Dikshit and Khatik (2002) reported that addition of organic manures along with fertilizers significantly improved NPK uptake by crop.
Table 1. Effect of integration of enriched compost with inorganic fertilizers on nodule number,
nodule dry weight and shoot dry weight of soybean
*@ 10t/ha
Treatments Nodule number
Nodule dry weight (mg/plant)
Shoot dry weight (G/plant)
Days after sowing 30 60 90 30 60 90 30 60 90
Control 15.33 21.33 16.55 62.35 135.55 117.11 11.66 14.55 25.82
100 % NPK 24.00 29.33 18.89 71.95 222.22 125.66 17.33 22.23 32.39 Enrich Compost*
+ 75 % NPK 26.83 34.66 25.88 122.50 223.00 127.11 18.83 26.26 38.15
Enrich Compost* +50% NPK
23.16 33.33 25.00 82.66 206.56 126.99 16.16 21.04 34.29
Enrich Compost* + 25 % NPK
19.83 34.22 24.00 86.83 227.44 128.66 16.33 20.54 32.95
Enrich Compost* 18.3 30.00 26.25 89.66 216.44 124.55 14.66 19.45 34.31
Farmyard Manure*
18.0 30.44 20.33 66.16 151.55 120.11 13.66 16.01 27.72
SEm ( ±) 2.26 1.20 5.75 2.96 13.63 60.54 0.99 1.84 6.55 CD at 5 % 6.96 3.72 NS 9.12 41.99 NS 3.07 5.66 NS

66
Table 2. Effect of integration of enriched compost with inorganic fertilizers on seed yield, straw yield, total nutrient uptake and B:C ratio of soybean
Treatments Seed yield
(kg/ha)
Straw yield
(kg/ha)
Total nutrient uptake (kg /ha)
B:C ratio
N P K
Control 2090 4133 118.02 11.17 32.81 3.31 100 % NPK 2819 5323 188.48 22.92 69.53 3.52 Enrich Compost* + 75 % NPK
2835 5693 207.34 26.58 68.73 3.29
Enrich Compost* + 50% NPK
2754 5200 189.36 21.53 70.16 3.30
Enrich Compost* + 25 % NPK
2512 4652 164.76 18.57 59.11 3.24
Enrich Compost* 2414 4468 148.95 17.23 49.34 3.29 Farmyard Manure* 2235 4420 140.88 15.57 46.43 3.11 SEM ± 101 418 10.93 2.23 16.33 - CD at 5 % 312 NS 33.70 6.89 NS - *@ 10t/ha
The maximum B:C ratio (3.52:1) was found with 100 percent NPK followed by 75 percent NPK + EC and minimum (3.11:1) with application of FYM alone (Table 2). Though it is apparent from the data that the use of chemical fertilizer is slightly economical than integrated of use of chemical fertilizer and EC, but this was the initial effect of one year only, in long term the combined application of chemical fertilizer and EC is likely to be more beneficial due to increase in soil fertility status and in turn more soybean yield. The application of EC was relatively more economical in comparison to FYM. Application of EC in combination with 75 or 50 percent recommended NPK was found equally good as 100 percent NPK. The treatment EC + 75 percent NPK performed better than all other treatments. The EC had an edge over FYM for all the parameters studied. Therefore, it appears that application of EC @ 10 t /ha could save chemical fertilizers to the extent of 25
to 50 percent of recommended dose in cultivation of soybean.
REFERENCES
Bhardwaj K K R and Gaur A C 1985. Recycling of organic wastes. IARI, New Delhi, Pp.1-104
Bhargava B S and Raghupati H B. 1998. Analysis of plant material for macro- and micro -nutrients. In: Methods of Analysis of Soils, Plants, Water and Fertilizers (Tandon HLS. ed), FDCO, New Delhi.
Bhriguvanshi S R. 1988. Enrichment of organic manures and their effect on yield and nutrient uptake by wheat. Journal of the Indian Society Soil Science 36: 510-4.
Dikshit P R and Khatik S K. 2002. Influence of organic manures in combination with chemical fertilizers on production, quality and economic feasibility of soybean in Typic Haplurtert of Jabalpur. Legume Research 25 (1): 53-6.
67
Manna M C, Hajra J N, Sinha N B and Ganguly T L 1997. Enrichment of compost by bio- inoculants and mineral amendments. Journal of the Indian Society Soil Science 45: 831-3.
Namdeo S L, Parmar B B and Bangar K S. 2003. Production of phospho- enriched compost and its effect on yield and phosphorus uptake by soybean (Glycine max) grown in vertisol. Indian Journal of Agriculture Science 73: 490-3.
Saha H and Hajra J N. 2001. Preparation of phospho compost from rice straw and response of groundnut. Journal of the Indian Society Soil Science 49: 44-9.
Singh M. 2000. Phospho-compost from farm wastes and its use for fertilizer economy in crops. In: Proceeding, International Conference on Managing Natural Resources for Sustainable Agricultural Production in the 21 century, Feb. 14 – 18, 2000, New Delhi, India. Pp. 196-198.
Singh S, Mishra M M, Goyal S and Kapoor K K. 1992. Preparation of nitrogen and phosphorus enriched compost and its effect on wheat (Triticum aestivum). Indian Journal of Agriculture Science 62: 810-4.
68
Soybean Research, 3: 68-72 (2005)
Effect of Integrated Nutrient Management and Spatial Arrangement on Growth and Yield of Hybrid Cotton and
Soybean under Intercropping System
P S RATHIYA1 AND R LAKPALE2 Department of Agronomy, Indira Gandhi Agricultural University,
Raipur - 492 006, Chhatishgarh (Email: [email protected])
Received: 20th December 2006 Key words: Soybean-cotton intercropping, integrated nutrient management, spatial
arrangement
Cotton is a long duration crop, cultivated in widely spaced rows. Its growth habit allows enough time and space for better utilization of natural resources and inputs leading to increased production by introduction of intercrop like soybean. Balanced nutrition is one of the major ingredients to achieve higher yields in cotton + soybean intercropping system. Considering the abundance of resource-poor farmers in the country, integrated use of organic and inorganic fertilizers is a better option to achieve enhanced fertilizer use efficiency and productivity. Therefore, a field experiment to evaluate the effect of integrated nutrient management and spatial arrangement on intercropping soybean (JS 335) in hybrid cotton (NSC 145, Bunny) was conducted during kharif 2004 at Instructional Farm, Indira Gandhi Agricultural University, Raipur. The soil of the experimental site belonged to Vertisols and neutral in reaction (pH 7.24) with low available nitrogen (217 kg/ha), medium available phosphorus (12.86 kg/ha) and high available potassium (364 kg/ha). The
experiment was laid out in a randomized block design with three replications and 14 treatments combinations (Table 1). In integrated nutrient treatments, required quantity of urea, single super phosphate and muriate of potash were thoroughly mixed with exact quantity of air dried FYM (containing 0.58, 0.19, 0.50 and 19.0 percent N, P, K and moisture, respectively) with sprinkling of light water followed by incubation for 48 hours prior to its application. For top dressing, blended urea was applied. The crops were and sown on June 27. Results showed that the plant height, number of branches per plant and dry matter accumulation at harvest recorded were highest under both the sole crops with 100 percent recommended dose of fertilizers (RDF) which was statistically at par with cotton + soybean (2:2) + 100 percent RDF and cotton + soybean (2:4) + 100 percent RDF (Table 1). The reduction in growth parameters of crops under intercropping system as compared to respective sole crops may be due to increased
1 Research Scholar; 2 Senior Scientist
69
competition. The results were in agreement with the findings of Pujari et al. (2001).
Sole cotton with 100 percent RDF recorded significantly higher number of bolls per plant as compared to other intercropping treatment. The maximum yield of seed and stalk was noted in sole cotton with 100 percent RDF followed by cotton + soybean in 2:2 and 2:4 row combination with 100 percent RDF and in 2:2 row combination with 75 percent RDF + 1 t FYM per hectare. Considerable reduction in cotton yield due to intercropping could be accounted to luxuriant growth of soybean as compared to cotton, which caused higher degree of competition for natural resources. These results are in agreement with the findings of Wankhede and Saraf (1997) and Padhi et al. (1998). Seed cotton and stalk yield increased with successive increase in the levels of nutrients reaching maximum with 100 percent RDF under sole cotton (Table 2).
Significantly highest number of pods per plant were noted under the treatment sole soybean with 100 percent RDF, which was statistically at par with cotton + soybean (1:4) with 100 percent RDF. The number of seeds per pod recorded was highest under sole soybean with 100 percent RDF. No significant differences were noticed in 100-seed weight due to various treatments. These results are in line with those reported by Panneerselvum and Lourduraj (1998). The maximum seed and straw yield of soybean was recorded under sole soybean with 100 percent RDF followed by cotton + soybean in 1:4 and 2:4 row ratio with 100 percent RDF and in 1:4 row ratio with 75 percent RDF + 1 t FYM per hectare. These treatments were at par among each other
but significantly superior to others. Under sole soybean there was less competition effect for nutrient, light and space, which could have led to higher yield. Use of 100 percent RDF in sole soybean produced significantly highest yield (Table 2). Greater nutrient availability and dry matter production might also have facilitated the enhancement in yield. These results reaffirm the findings of Mishra et al. (1996) and Tiwari et al. (1998).
The highest system productivity (4998 kg/ha) was recorded under cotton + soybean (2:4) + 100 percent RDF, which was at par with the 2:4 row combination + 1 t FYM /ha + 75 percent RDF (4842 kg/ha). The comparatively higher yield due to less competition among the crops under this treatment increased the total productivity. Giri et al. (2003) also reported similar yield advantage in cotton based intercropping system. The land equivalent ratio was the highest (1.64) under the treatment cotton + soybean (2:4) + 100 percent RDF which was significantly superior to all other treatments, except cotton + soybean (2:4) + 1 t FYM /ha + 75 percent RDF, which was found to be at par with cotton + soybean (2:4) + 100 percent RDF. The maximum monetary advantage (Rs. 12, 525 /ha) was noted under cotton + soybean (2:4) + 100 percent RDF due to higher yield of component crops and also due to less competition among component crops (Table 2).
The intercropping of cotton + soybean (2:4) + 100 percent RDF performed the best in term of yield, land equivalent ratio and monetary advantage. The comparable performance of cotton + soybean (2:4) + 1 t FYM /ha +75 percent RDF provides next suitable options to get maximum yield from cotton + soybean intercropping system.

70
Table 1. Growth of hybrid cotton and soybean as affected by different treatments
Treatment Plant height at harvest (cm)
Branches/plant at harvest (No.)
Dry matter accumulation
at harvest (g/plant)
Cotton Soybean Cotton Soybean Cotton Soybean
Sole cotton + 100% RDF* 80.7 - 17.6 - 98.7 - Sole soybean + 100% RDF** - 42.5 - 4.9 - 27.7 Cotton + soybean (2:2) + 100 % RDF
78.4 36.3 14.9 3.5 96.7 21.6
Cotton + soybean (2:2) + FYM @ 1 t / ha + 75% RDF
77.6 35.8 13.8 3.4 94.4 21.4
Cotton + soybean (2:2) + FYM @ 2 t / ha + 50% RDF
76.2 34.4 13.2 3.3 92.5 20.3
Cotton + soybean (2:2) + FYM @ 2 t /ha + 50% RDF + FYM @ 0.5 t / ha with urea (top dressing)
76.8 34.9 13.7 3.3 92.6 20.8
Cotton + soybean (2:4) + 100 % RDF
77.6 39.3 14.1 4.1 95.2 24.0
Cotton + soybean (2:4) + FYM @ 1 t /ha + 75% RDF
76.9 38.3 13.1 3.9 93.2 22.8
Cotton + soybean (2:4) + FYM @ 2 t /ha + 50% RDF
75.2 36.3 12.7 3.5 91.6 21.6
Cotton + soybean (2:4) + FYM @ 2 t /ha + 50% RDF+ FYM @ 0.5 t /ha with urea (top dressing)
75.4 36.9 12.8 3.7 91.7 21.7
Cotton + soybean (1:4) + 100 % RDF
75.0 40.3 12.3 4.3 91.5 26.0
Cotton + soybean (1:4) + FYM @ 2 t /ha + 75% RDF
74.3 39.1 12.2 3.9 89.6 24.6
Cotton + soybean (1:4) + FYM @ 2 t /ha + 50% RDF
73.6 37.3 11.1 3.7 88.5 24.0
Cotton + soybean (1:4) + FYM @ 2 t /ha + 50% RDF + FYM @ 0.5 t /ha with urea (top dressing)
73.7 37.5 11.5 3.8 88.5 24.2
SEm+ 1.13 0.40 0.25 0.09 0.38 0.26 CD (P=0.05) 3.31 1.19 0.74 0.27 1.13 0.77 *(100:60:40 kg N: P2O5: K2O /ha); **(30:60:40 kg N:P2O5: K2O /ha)

71
Table 2. Yield attributes, yield, total productivity of hybrid cotton and soybean and LER as affected by different treatments Treatment Cotton Soybean Total
Produc-tivity *** (kg/ha)
LER Monetary advantage
(Rs/ha) Bolls/
plant at harvest
(No.)
Seed cotton yield
(kg/ha)
Stalk yield
(kg/ha)
Pods/ plant (No.)
Seeds/ pod
(No.)
100-seed
weight (g)
Seed yield
(kg/ha)
Stover yield
(kg/ha)
Sole cotton + 100% RDF* 29.7 1007 1563 - - - - - 1772 1.00 - Sole soybean + 100% RDF** - - - 32.2 2.54 12.97 2094 2627 4188 1.00 - Cotton + soybean (2:2) + 100 % RDF 27.9 814 1356 25.2 203 12.21 1530 2121 4493 1.54 10363 Cotton + soybean (2:2) + FYM @ 1 t / ha + 75% RDF
26.9 780 1312 24.2 2.01 12.13 1487 2080 4346 1.48 9327
Cotton + soybean (2:2) + FYM @ 2 t / ha + 50% RDF
25.3 687 1219 23.4 1.82 12.07 1376 1972 3961 1.34 6544
Cotton + soybean (2:2) + FYM @ 2 t /ha + 50% RDF + FYM @ 0.5 t / ha with urea (top dressing)
25.9 708 1222 23.8 1.95 12.11 1398 1988 4043 1.37 7140
Cotton + soybean (2:4) + 100 % RDF 26.9 790 1326 28.6 2.35 12.51 1804 2415 4998 1.65 12525 Cotton + soybean (2:4) + FYM @ 1 t /ha + 75% RDF
25.9 762 1299 27.2 2.23 12.31 1750 2388 4842 1.59 11482
Cotton + soybean (2:4) + FYM @ 2 t /ha + 50% RDF
24.3 668 1198 25.5 2.06 12.23 1614 2238 4404 1.43 8429
Cotton + soybean (2:4) + FYM @ 2 t /ha + 50% RDF+ FYM @ 0.5 t /ha with urea (top dressing)
24.4 692 1210 25.6 2.10 12.27 1638 2260 4394 1.47 9117
Cotton + soybean (1:4) + 100 % RDF 24.1 508 1050 30.9 2.43 12.57 1834 2435 4562 1.38 7497 Cotton + soybean (1:4) + FYM @ 2 t /ha + 75% RDF
23.6 484 1014 28.3 2.30 12.35 1783 1391 4418 1.33 6552
Cotton + soybean (1:4) + FYM @ 2 t /ha + 50% RDF
22.2 397 946 26.1 2.08 12.31 1653 2266 4004 1.18 3637
Cotton + soybean (1:4) + FYM @ 2 t /ha + 50% RDF + FYM @ 0.5 t /ha with urea (top dressing)
22.5 416 969 26.8 2.15 12.33 1680 2285 4090 1.22 4268
SEm+ 2.0 1.5 06.3 0.53 0.28 0.18 02.5 2.7 6.4 0.02 CD (P=0.05) 5.9 4.5 18.5 1.57 NS NS 07.3 7.9 18.8 0.06 Price of produce - Cotton Seed @ Rs. 17.60/kg,;Cotton stalk @ Rs. 0.50/kg; Soybean seed @ Rs. 10.0/kg; Soybean stalk @ Rs. 0.50/kg; *(100:60:40 kg N: P2O5: K2O /ha);
**(30:60:40 kg N:P2O5: K2O /ha; ***Total Productivity (cotton yield + cotton equivalent yield of soybean)
72
REFERENCES Giri A N, Kote G M and Gore S B. 2003. Effect
of intercrops and fertilizer levels on yield and monetary returns of different cotton (Gossypium hirsutum) genotypes under rainfed conditions. In: Extended Summary of National. Symposium on Resources Conservation and Agricultural Productivity. Nov. 22-25, 2004, Ludhiana, Punjab, pp 345-7.
Mishra O R, Rajput A M, Wani P K and Thakur H S. 1996. Study on planting patterns, nutrient management and economics in sorghum-soybean intercropping. Crop Research, Hisar 19: 138-41.
Padhi A K, Sahoo B K and Das K C. 1998. Production potential, economics and energetics of upland cotton (Gossypium hirsutum) based intercropping systems under upland, rainfed situation. Indian Journal of Agricultural Sciences 63: 160-65.
Panneerselvum S and Lourduraj A C. 1998. Effect of organic manures
inorganic fertilizers and weed management practices on the yield attributes and yield on soybean (Glycine max L.). Legume Research 21: 154-64.
Pujari B J, Sheelavantar M N and Chett M B. 2001. Yield and yield component of green gram as influenced by pigeonpea based intercropping system. Journal of Maharashtra Agricultural University 24: 178-81.
Tiwari P N, Sharma R K. and Devakant. 1998. Performance of hybrid cotton (Gossypium hirusutum L.) intercropped with legume. Indian Farming System Research and Development 3 and 4: 66-8.
Wankhede N P and Saraf C S. 1997. Effect of paired row planting and intercropping pulses on the yield of seed cotton. Indian Journal of Genetics 35: 262-63.
73
Soybean Research, 3: 73-75 (2005)
Evaluation of Compatible Combinations of Bacillus Thuringiensis, Insecticide and Fungicides for Green
Semilooper and Pod Blight of Soybean (Glycine max)
H R CHAUDHARY1, V P GUPTA2 AND MASHIAT ALI3
Agricultural Research Station, Maharana Pratap University of Agriculture and Technology, Kota 324 001, Rajasthan
E-mail: [email protected]
Received: 19. 10. 2005
Key words: Bacillus thuringiensis var. kurstaki, Chrysodeixis acuta, Colletotrichum truncatum, compatibility, soybean
Soybean [Glycine max (L.) Merrill] is infested by many defoliators as well as foliar diseases during 30 to 40 days after sowing (DAS). Infestation of stem boring, girdle beetle also occurs during this period. Green semilooper and pod blight have also become perpetual problems in some areas of humid south eastern plain zone V of Rajasthan at post-flowering stage, which requires proper control measures so that loss can be minimized. However, sole dependence on chemical pesticides leads to numerous problems related to agriculture and human health. As an alternative microbial pesticide, Bacillus thuringiensis (Bt) has been tested and found to be highly effective against various insect-pests (Ansari and Sharma, 2000).
Present practice of insect and disease control is to spray insecticides and fungicides separately, which is not only time consuming and expensive but also labour intensive. To overcome these problems and to reduce the number of sprays and cost of application, experiments were conducted to find out the
compatibility between microbial insecticides, synthetic insecticide and fungicides, so that tank mixture of either of these can be sprayed for effective management of insect pests and diseases.
The field experiments were conducted in a randomized block design with 3 replications during kharif 2001 and 2003 at Agricultural Research Station, Kota to evaluate the effect of compatible combination of Bacillus thuringiensis, insecticide and fungicides for the management of major defoliator (Chrysodeixis acuta) and anthracnose and pod blight disease caused by Colletotrichum truncatum. The plot size consisted of seven rows of 5-meter length with row-to-row distance of 30 cm. All the agronomical
practices were followed as per the zonal recommendations. The first spraying was done at 30-35 DAS and second after 15 days. The population of Chrysodeixis acuta was recorded one day before and 7 days after spraying. Observation on anthracnose and pod blight was taken on 10 plants per plot after 7 days of spraying. The data
1 Entomologist; 2 Plant Pathologists; 3 Breeder
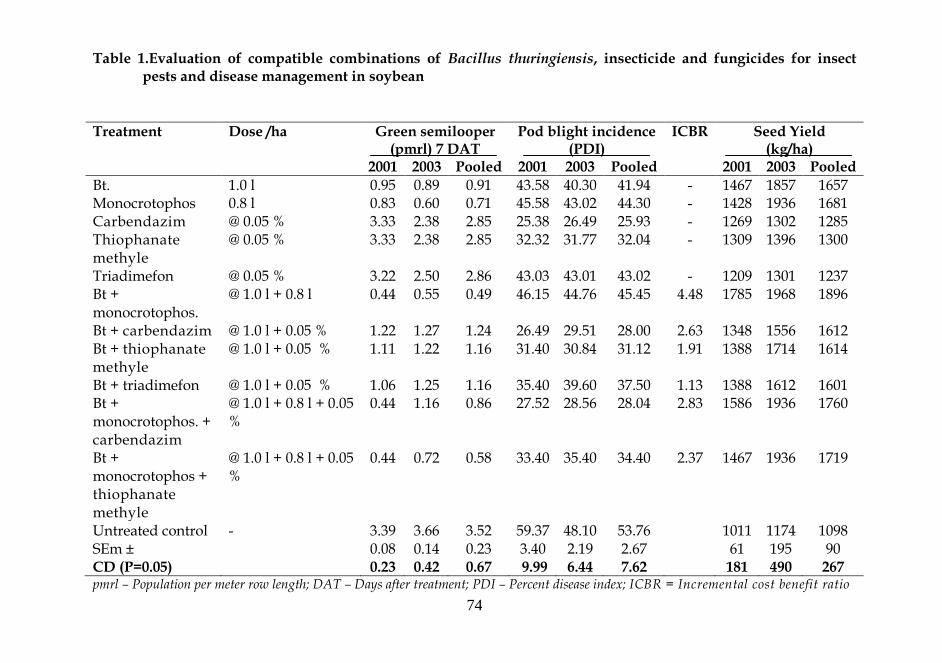
74
Table 1.Evaluation of compatible combinations of Bacillus thuringiensis, insecticide and fungicides for insect pests and disease management in soybean
Treatment Dose /ha Green semilooper
(pmrl) 7 DAT Pod blight incidence
(PDI) ICBR Seed Yield
(kg/ha) 2001 2003 Pooled 2001 2003 Pooled 2001 2003 Pooled
Bt. 1.0 l 0.95 0.89 0.91 43.58 40.30 41.94 - 1467 1857 1657 Monocrotophos 0.8 l 0.83 0.60 0.71 45.58 43.02 44.30 - 1428 1936 1681 Carbendazim @ 0.05 % 3.33 2.38 2.85 25.38 26.49 25.93 - 1269 1302 1285 Thiophanate methyle
@ 0.05 % 3.33 2.38 2.85 32.32 31.77 32.04 - 1309 1396 1300
Triadimefon @ 0.05 % 3.22 2.50 2.86 43.03 43.01 43.02 - 1209 1301 1237 Bt + monocrotophos.
@ 1.0 l + 0.8 l 0.44 0.55 0.49 46.15 44.76 45.45 4.48 1785 1968 1896
Bt + carbendazim @ 1.0 l + 0.05 % 1.22 1.27 1.24 26.49 29.51 28.00 2.63 1348 1556 1612 Bt + thiophanate methyle
@ 1.0 l + 0.05 % 1.11 1.22 1.16 31.40 30.84 31.12 1.91 1388 1714 1614
Bt + triadimefon @ 1.0 l + 0.05 % 1.06 1.25 1.16 35.40 39.60 37.50 1.13 1388 1612 1601 Bt + monocrotophos. + carbendazim
@ 1.0 l + 0.8 l + 0.05 %
0.44 1.16 0.86 27.52 28.56 28.04 2.83 1586 1936 1760
Bt + monocrotophos + thiophanate methyle
@ 1.0 l + 0.8 l + 0.05 %
0.44 0.72 0.58 33.40 35.40 34.40 2.37 1467 1936 1719
Untreated control - 3.39 3.66 3.52 59.37 48.10 53.76 1011 1174 1098 SEm ± 0.08 0.14 0.23 3.40 2.19 2.67 61 195 90 CD (P=0.05) 0.23 0.42 0.67 9.99 6.44 7.62 181 490 267 pmrl – Population per meter row length; DAT – Days after treatment; PDI – Percent disease index; ICBR = Incremental cost benefit ratio
75
thus obtained of both the sprays were averaged and subjected to statistical analysis. The pest disease index PDI was calculated by using the method described by Mayee and Datar (1986) and categorized on 0-9 scale. The yield data were taken plot--wise at harvest and expressed on per hectare basis. The incremental cost benefit ratio due to particular combination was also worked out The data presented in table 1 revealed that the minimum population of green semilooper, Chrysodeixis acuta was observed in combination of Bt (@ 1.0 l/ha) + monocrotophos (@ 0.8 l/ha) after 7 days of spraying which gave the highest seed yield (1896 kg/ha) with maximum ICBR (4.48) followed by combination of Bt (@ 1.0 l/ha) + monocrotophos (0.8 l/ha) + carbendazim (0.05 %) per ha, and Bt (@ 1.0 lit/ha) + monocrotophos (@ 0.8 l/ha) + thiophanate methyle (0.05 %) with 1760 and 1719 kg per ha seed yield and 2.83 and 2.37 (ICBR) respectively. However, in seed yield and controlling the major defoliator Chrysideixis acuta, these three combinations were statistically at par, while in controlling the anthracnose and pod blight, combination of Bt (@ 1.0 l/ha) + monocrotophos (0.8 l/ha) + carbendazim (0.05 %) per ha, and Bt (@ 1.0 l/ha) + monocrotophos (0.8 l/ha) + thiophanate methyle (0.05 %) were also statistically at par. Similar results were also obtained by Ansari and Sharma (1999 and 2000), who reported that monocrotophos was found compatible with Bt and carbendazim .
The increase in the efficiency of biological component (Bt) in the tank-mix formulations with chemical pesticides has
earlier been reported by Jaques (1988) This practice not only helps to reduce usage of synthetic chemical with proven hazardous consequences but also saves the time and energy.
The study suggests that for the management of insect pests and diseases of soybean Bt (1.0 l/ha) + monocrotophos (0.8 l/ha) was found most remunerative with higher seed yield (1896 kg/ha) and ICBR (4.48) followed by Bt (1.0 l/ha) + monocrotophos (0.8 l./ha) + carbendazim (0.05 %) and Bt. (1.0 l/ha) + monocrotophos (0.8 l/ha) + thiophanate methyle (0.05 %). Both the combinations are statistically at par with combinations of Bt. (1.0 l./ha) + monocrotophos (0.8 l/ha). These compatible combinations are equally good in controlling the green semilooper (Chrysodeixis acuta) population and incidence of anthracnose and pod blight caused by Colletotrichum truncatum. REFERENCES Ansari M M and Sharma A N. 1999.
Compatibility of Bacillus thuringiensis with chemical insecticides used for insect control in soybean. Indian Journal of Agricultural Sciences 70 (1): 48-9.
Ansari M M and Sharma A N. 2000. Congreguance of Bacillus thuringiensis with various insecticides and fungicides. Pestology 24 (4): 16-9.
Jaques R P. 1988. Field tests on control of the imported cabbage-worm (Lepidoptera-pienidae) and cabbage looper by mixtures of microbial and chemical insecticides. Canadian Entomologist 120: 575-80.
Mayee C L and Datar V V. 1986. Phytopathometry Technical Bulletin-1 (Special Bulletin-3). Marathawada Agricultural University, Parbhani, India Pp. 218.
76
Soybean Research, 3: 76-80 (2005)
Influence of Organic Amendments and Biorationals on Pod Borer Damage in Soybean (Glycine max (L.) Merrill)
C ABHILASH1, R H PATIL2, R S GIRADDI3 AND P V PATIL4 AICRP on Soybean, Main Agricultural Research Station, University of Agricultural Sciences, Dharwad – 580 005
(E-mail: [email protected])
Received: 21.11.2005
Key words: Biotic factors, eco-friendly components, spinosad and management Soybean [Glycine max (L.) Merrill] is an important oilseed crop, containing about 40-43 per cent protein and about 20 per cent oil. Soybean protein is rich in amino acids like lysine, methionine and cystine. The area under this crop in India has spectacularly increased from merely 0.03 million ha in 1970-71 to 7.2 million in 2004-05 (Anonymous, 2005). In spite of this spectacular increase in area, the national productivity in India (1 tonne/ha) is only about half of the world average productivity (2.2 tonnes/ha). Among other constraints, biotic as well as abiotic factors are considered to be responsible for this lower productivity. Among the biotic
factors, the ravages caused by insect pests are of paramount importance in reducing the soybean yield. At present 270 insect pests, one mite, two millipedes, ten vertebrate pests and one snail are associated with soybean in India Among the insect pests, those that attack during flowering and post flowering stages are causing huge yield losses. The major post-flowering pests are the pod borers that cause considerable yield loss to soybean (Singh, 2001).
As in any other crop, to tackle the pest problem, indiscriminate use of synthetic chemical insecticides was undertaken in soybean also. This led to many serious problems like environmental contamination by way of pesticide residues, development of resistance in pests to pesticides, pest resurgence, etc. In this context present investigation was carried out to evaluate the eco-friendly and environmentally safe components like organic amendments, biorationals, etc.
A field experiment was laid out during the kharif 2004 at Main Agricultural Research Station, Dharwad, using the soybean cultivar JS 335. Split plot design was adopted with 5 treatments in the main plots (recommended dose of fertilizers + organic amendments) and 4 treatments (biorationals) in the sub-plots, along with two checks (Table 1) replicated thrice. The crop was sown at a spacing of 30 cm x 10 cm in a plot size of 12 m². The organic amendments were applied in the respective plots as basal application, i.e. at the time of sowing itself. Three sprays of biorationals were given during the morning hours at 45, 60 and 75 days after sowing (DAS).
1Research Scholar; 2.3Associate Professor (Entomology); 4Plant Pathologist

77
For preparing the extracts, fresh plant material was collected from the campus of Main Agricultural Research Station, Dharwad. To prepare neem seed kernel extract (NSKE) 5 percent, 50 g of smashed seeds of neem were soaked overnight in one litre of water, squeezed through muslin cloth and the extract was collected and used for spraying.
Fresh leaves of the respective plants (Vitex negundo and Pongamia pinnata) were collected, washed thoroughly 3-4 times with tap water and chopped into small pieces. Fifty g of the chopped material was soaked over-night in enough water, squeezed through muslin cloth and residue was smashed in mortar and pestle, again extracted and filtered through muslin cloth and the volume was made up to one litre to get 5 per cent leaf extract for spraying. Vermiwash collected from the vermicompost trays, was diluted with water in the ratio 1:2 and used for spraying.
Observations were made on pod damage and seed yield at harvest. For percent pod damage, 10 plants were selected at random from each plot and total number of pods and damaged pods from each plant was counted and mean was calculated. The percent pod damage was calculated (Percent pods damaged = number of damaged pods/total number of pods x 100) and the data was transformed to arcsine values for reliable analysis. On maturity, the yield data from each plot was recorded and expressed as kg per ha. Yield data and percent pod damage data were statistically analysed using ANOVA technique and the mean values were subjected to Duncan‟s Multiple Range Test (DMRT).
Efficacy of organic amendments and biorationals on pod damage
Among the organic amendments, the percent pod damage ranged from 25.80 percent in recommended dose of fertilizer (RDF) + FYM @ 5 t per ha + neem cake @ 500 kg per ha to 38.48 per cent in RDF + vermicompost @ 2.5 t per ha (Table 1). Least percent pod damage (25.80%) was on par with RDF + FYM + neem cake @ 250 kg per ha (26.77 %). Highest percent pod damage (38.48%) was observed to be on par with RDF + vermicompost + neem cake @ 250 kg per ha (34.10%). Among the biorationals, NSKE (5 %) recorded least percent pod damage (29.74 %) followed by 5 percent Vitex negundo leaf extract (31.65 %), 5 percent Pongamia pinnata leaf extract (32.40 %) and vermiwash (at par31.65 %), all later being.
The interaction effect between organic amendments and biorationals (23.67 to 40.14 % damaged pods) was significantly superior over untreated control (47.59 %). The recommended insecticide (quinalphos 25 EC @ 2 ml/l) employed for treated control recorded the least percent pod damage (21.21%), which was significantly superior over all other treatments. Among other interactions, lower percent pod damage was noticed in RDF + FYM @ 5 t/ha) + neem cake @ 250 kg per ha x NSKE (5%), RDF + FYM @ 5 t per ha + neem cake @ 500 kg per ha x NSKE (5 %), RDF + FYM @ 5 t per ha+ neem cake @ 500 kg per ha x Vitex negundo leaf extract (5 %), RDF + FYM @ 5 t per ha + neem cake @ 500 kg per ha x Pongamia pinnata leaf extract (5 %), RDF + FYM @ 5 t per ha + neem cake @ 500 kg per ha x vermiwash

78
and RDF + FYM @ 5 t per ha + neem cake @ 250 kg per ha x vermiwash recording a per cent pod damage of 23.67, 25.51, 25.51, 26.77, 25.51 and 26.00 percent, respectively. All these treatments did not differ significantly among themselves.
Effect of organic amendments and biorationals on the grain yield of soybean
Among the organic amendments, RDF + vermicompost @ 2.5 t per ha + neem cake @ 500 kg per ha and RDF + FYM @ 5 t per ha + neem cake @ 500 kg per ha recorded the highest yield of 1308.4 kg per ha and 1302.3 kg per ha, respectively (Table 2). These treatments were on par with RDF + vermicompost @ 2.5 t per ha + neem cake @ 250 kg per ha (1244.5 kg/ha) and RDF + FYM @ 5 t per ha + neem cake @ 250 kg per ha (1205.5 kg/ha). Lowest seed yield (1104.9 kg/ha) was associated with RDF + vermicompost @ 2.5 t per ha, which was on par with above two treatments. In case of the biorationals, highest yield (1300.3 kg/ha) was recorded in NSKE (5 %), which was on par with Vitex negundo leaf extract (5%) and Pongamia pinnata leaf extract (5 %) which recorded, 1225.5 and 1225.2 kg/ha respectively. Lowest yield was recorded in vermiwash (1181.4 kg/ha), which was at par with above two treatments.
The interaction effect between organic amendments and biorationals (1055.5 to 1405.8 kg/ha) was significantly superior over untreated control (613.8 kg/ha), but were significantly lower than standard check (1541.5 kg/ha). RDF + vermicompost @ 2.5 t per ha + neem cake
@ 500 kg per ha x NSKE recorded highest seed yield of 1405.8 kg per ha, which was on par with RDF + vermicompost @ 2.5 t per ha + neem cake @ 250 kg per ha x NSKE (5 %), RDF + FYM @ 5 t per ha + neem cake @ 250 kg per ha x NSKE (5 %), RDF + FYM @ 5 t per ha + neem cake @ 500 kg per ha x NSKE (5 %), RDF + FYM @ 5 t per ha + neem cake @ 500 kg per ha x Vitex negundo leaf extract (5%,) RDF + vermicompost @ 2.5 t per ha + neem cake @ 500 kg per ha x Vitex negundo leaf extract (5 %), RDF + FYM @ 5 t per ha + neem cake @ 500 kg per ha x Pongamia pinnata leaf extract (5 %) and RDF + vermicompost @ 2.5 t per ha + neem cake @ 500 kg per ha x Pongamia pinnata leaf extract (5 %), which recorded seed yield of 1347.8, 1299.1, 1329.4, 1317.2, 1306.6, 1310.5 and 1274.4 kg per ha, respectively. In general, RDF + vermicompost x vermiwash sprays recorded relatively lesser yield.
The results of this investigation gains support from earlier work on utility of integrating nutrition with insecticide in managing pod borers (Maruca testulalis Geyer and Lampides boeticus Linn.) in green gram (Gatoria and Singh, 1988), of integrating nutrient supplementation with cultural and plant protection measures for management of pod borer complex of pigeonpea (Badaya et al., 1990) and of integrated use of fertilizers, manures and biorationals for managing the Spodoptera litura Fabricius and Helicoverpa armigera Hubner in groundnut (Rao, 2003). The present findings are in conformity with the report of Bhat et al. (1988) who reported that neem seed extract
(5 %) was the next best treatment to monocrotophos against M. testulalis and Cydia ptychora (Meyrick)
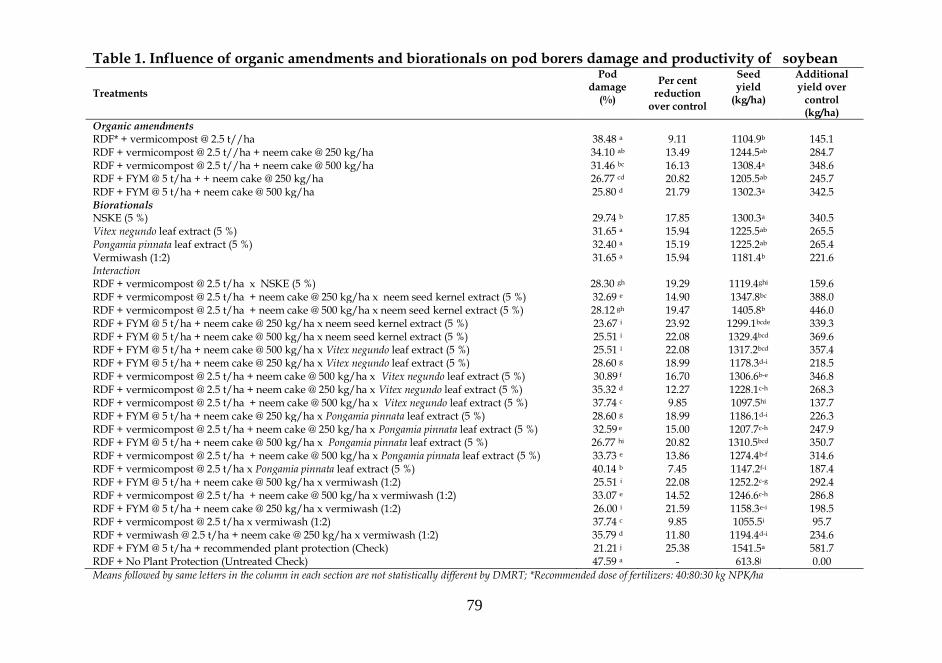
79
Table 1. Influence of organic amendments and biorationals on pod borers damage and productivity of soybean
Treatments
Pod damage
(%)
Per cent reduction
over control
Seed yield
(kg/ha)
Additional yield over
control (kg/ha)
Organic amendments RDF* + vermicompost @ 2.5 t//ha 38.48 a 9.11 1104.9b 145.1 RDF + vermicompost @ 2.5 t//ha + neem cake @ 250 kg/ha 34.10 ab 13.49 1244.5ab 284.7 RDF + vermicompost @ 2.5 t//ha + neem cake @ 500 kg/ha 31.46 bc 16.13 1308.4a 348.6 RDF + FYM @ 5 t/ha + + neem cake @ 250 kg/ha 26.77 cd 20.82 1205.5ab 245.7 RDF + FYM @ 5 t/ha + neem cake @ 500 kg/ha 25.80 d 21.79 1302.3a 342.5 Biorationals NSKE (5 %) 29.74 b 17.85 1300.3a 340.5 Vitex negundo leaf extract (5 %) 31.65 a 15.94 1225.5ab 265.5 Pongamia pinnata leaf extract (5 %) 32.40 a 15.19 1225.2ab 265.4 Vermiwash (1:2) 31.65 a 15.94 1181.4b 221.6 Interaction RDF + vermicompost @ 2.5 t/ha x NSKE (5 %) 28.30 gh 19.29 1119.4ghi 159.6 RDF + vermicompost @ 2.5 t/ha + neem cake @ 250 kg/ha x neem seed kernel extract (5 %) 32.69 e 14.90 1347.8bc 388.0 RDF + vermicompost @ 2.5 t/ha + neem cake @ 500 kg/ha x neem seed kernel extract (5 %) 28.12 gh 19.47 1405.8b 446.0 RDF + FYM @ 5 t/ha + neem cake @ 250 kg/ha x neem seed kernel extract (5 %) 23.67 i 23.92 1299.1bcde 339.3 RDF + FYM @ 5 t/ha + neem cake @ 500 kg/ha x neem seed kernel extract (5 %) 25.51 i 22.08 1329.4bcd 369.6 RDF + FYM @ 5 t/ha + neem cake @ 500 kg/ha x Vitex negundo leaf extract (5 %) 25.51 i 22.08 1317.2bcd 357.4 RDF + FYM @ 5 t/ha + neem cake @ 250 kg/ha x Vitex negundo leaf extract (5 %) 28.60 g 18.99 1178.3d-i 218.5 RDF + vermicompost @ 2.5 t/ha + neem cake @ 500 kg/ha x Vitex negundo leaf extract (5 %) 30.89 f 16.70 1306.6b-e 346.8 RDF + vermicompost @ 2.5 t/ha + neem cake @ 250 kg/ha x Vitex negundo leaf extract (5 %) 35.32 d 12.27 1228.1c-h 268.3 RDF + vermicompost @ 2.5 t/ha + neem cake @ 500 kg/ha x Vitex negundo leaf extract (5 %) 37.74 c 9.85 1097.5hi 137.7 RDF + FYM @ 5 t/ha + neem cake @ 250 kg/ha x Pongamia pinnata leaf extract (5 %) 28.60 g 18.99 1186.1d-i 226.3 RDF + vermicompost @ 2.5 t/ha + neem cake @ 250 kg/ha x Pongamia pinnata leaf extract (5 %) 32.59 e 15.00 1207.7c-h 247.9 RDF + FYM @ 5 t/ha + neem cake @ 500 kg/ha x Pongamia pinnata leaf extract (5 %) 26.77 hi 20.82 1310.5bcd 350.7 RDF + vermicompost @ 2.5 t/ha + neem cake @ 500 kg/ha x Pongamia pinnata leaf extract (5 %) 33.73 e 13.86 1274.4b-f 314.6 RDF + vermicompost @ 2.5 t/ha x Pongamia pinnata leaf extract (5 %) 40.14 b 7.45 1147.2f-i 187.4 RDF + FYM @ 5 t/ha + neem cake @ 500 kg/ha x vermiwash (1:2) 25.51 i 22.08 1252.2c-g 292.4 RDF + vermicompost @ 2.5 t/ha + neem cake @ 500 kg/ha x vermiwash (1:2) 33.07 e 14.52 1246.6c-h 286.8 RDF + FYM @ 5 t/ha + neem cake @ 250 kg/ha x vermiwash (1:2) 26.00 i 21.59 1158.3e-i 198.5 RDF + vermicompost @ 2.5 t/ha x vermiwash (1:2) 37.74 c 9.85 1055.5i 95.7 RDF + vermiwash @ 2.5 t/ha + neem cake @ 250 kg/ha x vermiwash (1:2) 35.79 d 11.80 1194.4d-i 234.6 RDF + FYM @ 5 t/ha + recommended plant protection (Check) 21.21 j 25.38 1541.5a 581.7 RDF + No Plant Protection (Untreated Check) 47.59 a - 613.8j 0.00
Means followed by same letters in the column in each section are not statistically different by DMRT; *Recommended dose of fertilizers: 40:80:30 kg NPK/ha
80
in cowpea. Rabindra et al. (1991) reported that combined use of NPV and V. negundo leaf extract can reduce the pod damage in chickpea by H. armigera. Sharanabasappa (2002) observed that pod damage by C. ptychora in greengram was lowest in NSKE 5 percent treated plots. Ladaji (2004) observed pongamia leaf extract + NSKE 5 percent + aloe + cowurine recorded highest percent mortality of H. armigera in chickpea. The study brings out that although the use of recommended dose of fertilizers in combination with farm yard manure and neem cake along with biorationals are not comparable to that of chemical control in reducing pod borer damage and increasing the seed yield of soybean, their integrated use can moderate damage by the pest and enhances productivity and emeritus adoption on account of eco-friendly nature which can lead to safer environment.
REFERENCES Anonymous, 2005, Revised crop estimation
for kharif 2004. Soya Update II: 11. Badaya A K, Das S B, Thakur N S, Shaw S S
and Bhalla P L. 1990. Effect of intercultural operations, fertilizer application and plant protection measures on the incidence of borer complex on pigeonpea. Indian Journal of Plant Protection 18: 27-30.
Bhat N S, Raju G T T, Manjunatha M, Nagabhushana G G and Deshpande V P. 1988. Chemical control of cowpea pod borer. Indian Journal of Plant Protection 16: 197-200.
Gatoria G S and Singh H. 1988. Effect of insecticidal and fertilizer applications on chewing insect pests of greengram. Journal of Research, Punjab Agricultural University 25: 225-232.
Ladaji R. 2004. Management of chickpea pod borer, Helicoverpa armigera (Hubner) using indigenous materials and newer insecticides. M. Sc. (Agri.) Thesis, University of Agricultural Sciences, Dharwad.
Rabindra R J, Balasaraswathi S and Jayaraj S. 1991. Combined use of nuclear polyhedrosis virus with certain botanicals for the control of Helicoverpa armigera on chickpea. Journal of Biological Control 5: 85-87.
Rao K R. 2003. Influence of host plant nutrition on the incidence of Spodoptera litura and Helicoverpa armigera on groundnut. Indian Journal of Entomology 65: 386-392.
Sharanabasappa. 2002. Studies on pod borer complex of green gram with special reference to Apion amplum (Faust) (Coleoptera : Apionidae). M. Sc. (Agri.) Thesis, University of Agricultural Sciences, Dharwad.
Singh O P. 2001. Integrated insect management practices. Souvenir “Indian Soy Forum 2001”. Ministry of Agriculture, Government of India and Government of Madhya Pradesh, Indore, Pp .222.

81
Society for Soybean Research and Development is thankful to following persons who helped as referees to review the research articles submitted to Soybean Research for their suitability and better presentation
Ali Nawab Dr; Deputy Director General (Agricultural Engineering), Indian Council of Agricultural Research, PUSA, New Delhi 110 012 Ansari MM Dr; Senior Scientist (Plant Pathology), National Research Centre for Soybean, Indore 452 017, Madhya Pradesh Billore SD Dr; Senior Scientist (Agronomy), National Research Centre for Soybean, Indore 452 017, Madhya Pradesh Bhatnagar PS Dr; Retired Director, National Research Centre for Soybean, Indore 452 017, Madhya Pradesh Gupta HCL Dr; Dean, Rajasthan College of Agriculture, Maharana Pratap University of Agriculture and Technology, Udaipur 313 001, Rajasthan Husain SM Dr; Senior Scientist (Plant Breeding), National Research Centre for Soybean, Indore 452 017, Madhya Pradesh Iyer RD Dr; Ex-Professor and Head (Plant Breeding), Central Plantation Crops Research Institute, Kasaragod 671 124, Kerala Joshi OP Dr; Principal Scientist (Soil Science), National Research Centre for Soybean, Indore 452 017, Madhya Pradesh Kumar NG Dr; Professor (Entomology), University of Agricultural Sciences (UAS), GKVK Campus, Bangalore, Karnataka
Kulkarni SD Dr; Project Director, Soybean Processing and Utilization Centre, Central Institute of Agricultural Engineering (ICAR), Bhopal 462 038, Madhya Pradesh Mishra Anupam Dr; Zonal Coordinator, Zone VII, TOT Project, Jawaharlal Nehru Krishi Vishwavidyalaya, Jabalpur 482 004, Madhya Pradesh Raghu JS Dr; Dean, College of Agriculture (Jawaharlal Nehru Krishi Vishwavidyalaya), Indore 452 001, Madhya Pradesh Rao SK Dr; Professor and Head, Department of Plant Breeding and Genetics, Jawaharlal Nehru Krishi Vishwavidyalaya, Jabalpur 482 004, Madhya Pradesh Reddy BN Dr; Principal Scientist (Agronomy), Directorate of Oilseeds Research, Rajendranagar, Hyderabad 500 030, Andhra Pradesh Sachan GC Dr; Retired Professor of Entomology (GB Pant University of Agriculture and Technology, Pantnagar), Guest Faculty, KVK, Dhanauri, Haridwar, Uttaranchal Sharma AN Dr; Senior Scientist (Entomology), National Research Centre for Soybean, Indore 452 017, Madhya Pradesh Sharma OP Dr; Dean, College of Agriculture (Jawaharlal Nehru Krishi Vishwavidyalaya), Tikamgarh 472 001, Madhya Pradesh Sharma Sanjay Dr; Senior Scientist, Dryland Project, College of Agriculture (Jawaharlal Nehru Krishi Vishwavidyalaya), Indore 452 001, Madhya Pradesh Singh RL Dr; Associate Professor, Department of Extension, College of Agriculture (Jawaharlal Nehru Krishi Vishwavidyalaya), Indore 452 001, Madhya Pradesh Singh US Dr; Ex-Professor, Department of Plant pathology, College of Agriculture, GB Pant University of Agriculture and Technology, Pantnagar 263 145, Uttaranchal Srivastava SK Dr; Dean, College of Agriculture (Jawaharlal Nehru Krishi Vishvidyalaya), Sehore 466 001, Madhya Pradesh. Tomar VS Dr; Director of Research, Jawarharlal Nehru Krishi Vishwa Vidyalaya, Jabalpur 482 004, Madhya Pradesh Vyas AK Dr; Principal Scientist (Agronomy), National Research Centre for Soybean, Indore 452 017, Madhya Pradesh
82
SOYBEAN RESEARCH
GUIDE LINES FOR SUBMISSION OF MANUSCRIPT
Where to submit
The Society of Soybean Research and Development publishes full paper, short communications, and review articles related to soybean research and development in its official journal “SOYBEAN RESEARCH”. The journal is published once in a calendar year. All submissions should be addressed to: The Editor-in-Chief, Society of Soybean Research and Development (SSRD), National Research Centre for Soybean, Khandwa Road, Indore 452 017, India (E-mail: [email protected]). Editorial Policy
All authors in a manuscript (MS) for publication in Soybean Research should be member of the society.
(a) Annual member Subscription Indian
Foreign Rs.150.00
US $ 75.00 (b) Student member Indian
Foreign Rs. 75.00
US $ 60.00 (c) Institution member Indian
Foreign Rs.1, 000.00 US $ 125.00
(d) Life member Indian
Foreign
Rs.1, 500.00 (1 or in 3 equal installments. in a year)
US $ 700.00 (e) Corporate member Indian
Foreign Rs.15, 000.00 US $ 1,500.00
An admission fee of Rs.50/- for Indian citizen and US $ 5.00 for Foreign National shall be paid at the time of enrollment.
MS must be original and contribute substantially to the advancement of knowledge in soybean research and development.
MS should have unpublished data and not submitted elsewhere (wholly or in part) for publication.
MSs are subjected to „peer review‟ by two experts in the relevant field and by the members of Editorial Board. The decision of Editor-in Chief in accepting the MS with major/minor revision or rejecting the paper would be final. MSs sent for revision to authors, should be returned within four weeks.
All submission must accompany a self-addressed appropriately stamped envelop for sending the MS for revision/change if any or the proof for corrections.
83
Manuscript Format
Manuscript should be initially submitted in triplicate and it should also carry the E-mail address of the corresponding author in addition to the postal address. MS should be printed in double space on A-4 size paper in Times New Roman with font size 12 with a 4 cm margin at top bottom and left. All pages including text, references, tables and legends to figures should be numbered. MS should be concise and devoid of repetition between Materials and Methods and Results or Results and Discussion. Revised and corrected MS should be submitted with a soft copy in a floppy diskette.
Full Paper
A full paper should not exceed 4000 words (up to 15 typed pages, including references, tables etc.) Its contents should be organized as: Title, Author(s), Address, Abstract, Key words, Introduction, Materials and Methods, Results and Discussion, Acknowledgements and References.
Title: It should be short, concise and informative, typed in first letter capital, Latin
name italicized. Authors: Name of the authors may be typed in all capitals. Abstract: This should not exceed 150 words and should indicate main findings of the
paper, without presenting experimental details. Key words: There should be 4-5 key words indicating the contents of the MS and
should follow the abstract. Invariably the name of host and pest should be included in key words.
Results: Data should be presented in text, tables or figures. Repetition of data in two
or three forms should be avoided. All quantitative data should be in standard/metric units. Each table, figure or illustration must have a self-contained legend. Use prefixes to avoid citing units as decimals or as large numbers, thus, 14 mg, not 0.014 g or 14000 µg. The following abbreviations should be used: yr, wk, h, min, sec., RH, g, ml, g/l, temp., kg/ha, a.i., 2:1(v/v), 1:2 (w/w), 0:20: 10 (N:P:K), mm, cm, nm, cv. (cvs., for plural), % etc.

84
References: References should be cited by authors and year: Ansari (2000) or Ansari and Sharma (2000) in the text. References should be arranged in alphabetical order and listed at the end of the paper as follows:
Ansari M M and Sharma A N. 2000. Compatibility of Bacillus thuringiensis with
chemical insecticides used for insect control in soybean (Glycine max). Indian Journal of Agricultural Sciences 70: 48-9. (Journal)
Joshi O P, Billore S D, Ramesh A and Bhardwaj ch . 2002. Soybean-A remunerative crop for rainfed forming. (in) Agro technology for dry land forming, pp 543-68. Dhopte AM (Eds.). Scientific Publishers (India), Jodhpur. ( Book chapter)
Ansari M M and Gupta G K. 1999. Epidemiological studies of foliar diseases of soybean in Malwa plateau of India. Proceedings, World Soybean Research Conference VI, Aug 4-7, 1999, Chicago, Illinois, USA, 611p. (Symposium/ Conf./Workshop)
Pansae V G and Sukhatme P V. 1978. Statistical Methods for agricultural workers. Indian Council of Agricultural Research, New Delhi. pp.186. (Book)
Table: Each table should be typed on separate page and numbered sequentially.
Tables should have descriptive heading. Authors are advised to avoid large table with complex columns. Data are restricted to only one or two decimal figures only. Transformed values should be included if these are discussed in the text.
Illustrations: Number all illustrations consecutively in the text. Line drawing should
be made in undiluted black ink on smooth white card or tracing paper. Original and two Photostat copies should be drawn approximately twice the size of reproduction. Original should not be labeled and should also not be numbered. Line diagrams of plants, fungi etc. should indicate the scale.
Photographs: Photographs should be on glossy paper and have good contrast. Trim
unnecessary areas. Three copies of the photographs should be provided. On the back of the photographs write names of authors, figures numbers and indicate top of the photographs with an arrow using a soft pencil. Show magnification with a bar scale. Coloured photographs can be printed on
payment of full printing cost by the authors. Legends for figures should be typed separately and numbered consequently.
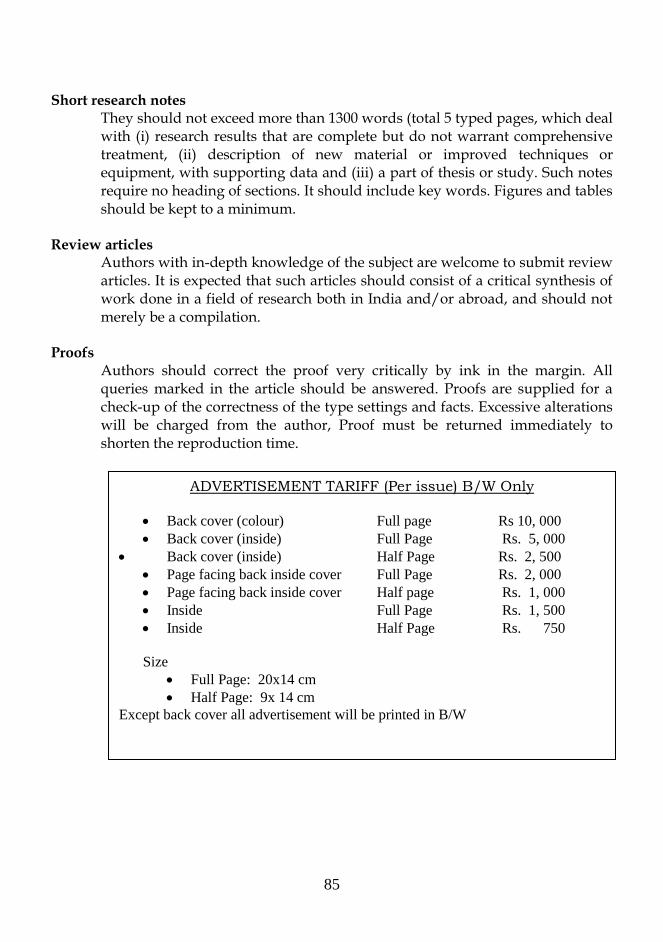
85
Short research notes They should not exceed more than 1300 words (total 5 typed pages, which deal with (i) research results that are complete but do not warrant comprehensive treatment, (ii) description of new material or improved techniques or equipment, with supporting data and (iii) a part of thesis or study. Such notes require no heading of sections. It should include key words. Figures and tables should be kept to a minimum.
Review articles
Authors with in-depth knowledge of the subject are welcome to submit review articles. It is expected that such articles should consist of a critical synthesis of work done in a field of research both in India and/or abroad, and should not merely be a compilation.
Proofs
Authors should correct the proof very critically by ink in the margin. All queries marked in the article should be answered. Proofs are supplied for a check-up of the correctness of the type settings and facts. Excessive alterations will be charged from the author, Proof must be returned immediately to shorten the reproduction time.
ADVERTISEMENT TARIFF (Per issue) B/W Only
Back cover (colour) Full page Rs 10, 000
Back cover (inside) Full Page Rs. 5, 000
Back cover (inside) Half Page Rs. 2, 500
Page facing back inside cover Full Page Rs. 2, 000
Page facing back inside cover Half page Rs. 1, 000
Inside Full Page Rs. 1, 500
Inside Half Page Rs. 750
Size
Full Page: 20x14 cm
Half Page: 9x 14 cm
Except back cover all advertisement will be printed in B/W
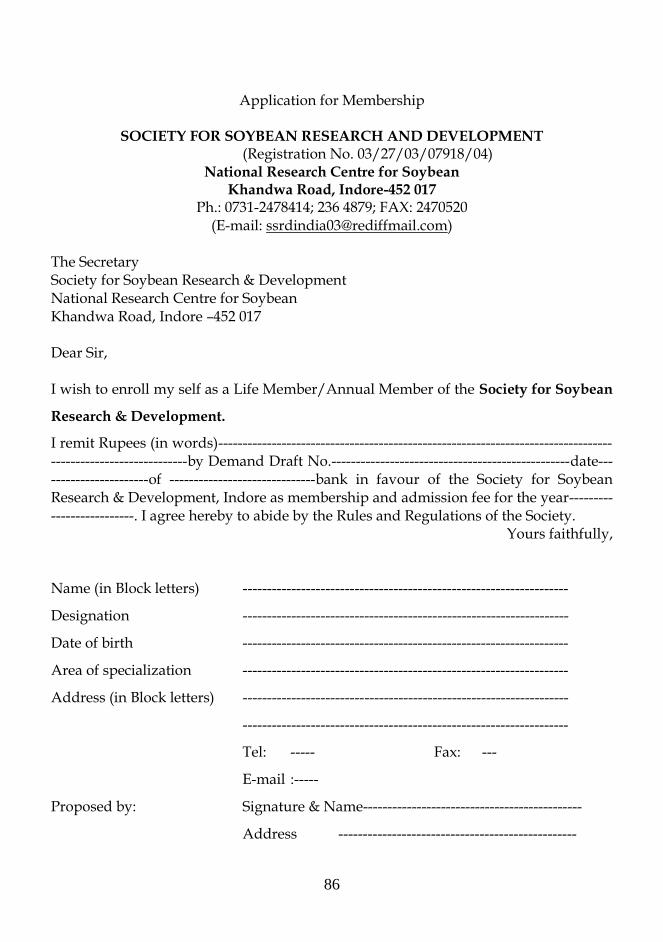
86
Application for Membership
SOCIETY FOR SOYBEAN RESEARCH AND DEVELOPMENT (Registration No. 03/27/03/07918/04)
National Research Centre for Soybean Khandwa Road, Indore-452 017
Ph.: 0731-2478414; 236 4879; FAX: 2470520 (E-mail: [email protected])
The Secretary Society for Soybean Research & Development National Research Centre for Soybean Khandwa Road, Indore –452 017 Dear Sir, I wish to enroll my self as a Life Member/Annual Member of the Society for Soybean
Research & Development.
I remit Rupees (in words)-------------------------------------------------------------------------------------------------------------by Demand Draft No.-------------------------------------------------date-----------------------of ------------------------------bank in favour of the Society for Soybean Research & Development, Indore as membership and admission fee for the year--------------------------. I agree hereby to abide by the Rules and Regulations of the Society.
Yours faithfully,
Name (in Block letters) -------------------------------------------------------------------
Designation -------------------------------------------------------------------
Date of birth -------------------------------------------------------------------
Area of specialization -------------------------------------------------------------------
Address (in Block letters) -------------------------------------------------------------------
-------------------------------------------------------------------
Tel: ----- Fax: ---
E-mail :-----
Proposed by: Signature & Name---------------------------------------------
Address -------------------------------------------------