Embed Size (px)
Citation preview
Soybean seed quality response among maturity groups to planting dates in the Midsouth
Larry C. Purcell & Montserrat SalmeronMidSouth Soybean Board Meeting,
9 February 2015, Savannah
• Results
• Yield
• Seed no. & seed wt.
• Light interception
• Decision support tool
• Calibrating model
• Simulating long-term responses
• Demonstration
Outline
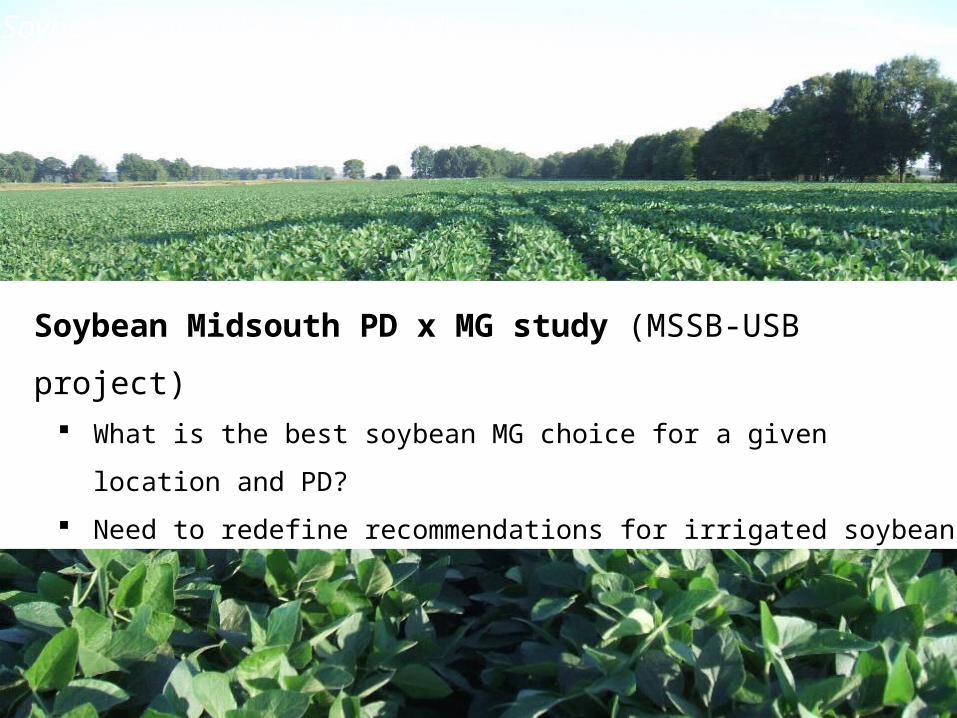
Soybean Midsouth PD x MG study (MSSB-USB project) What is the best soybean MG choice for a given location and PD?
Need to redefine recommendations for irrigated soybean
Soybean regional PD x MG study
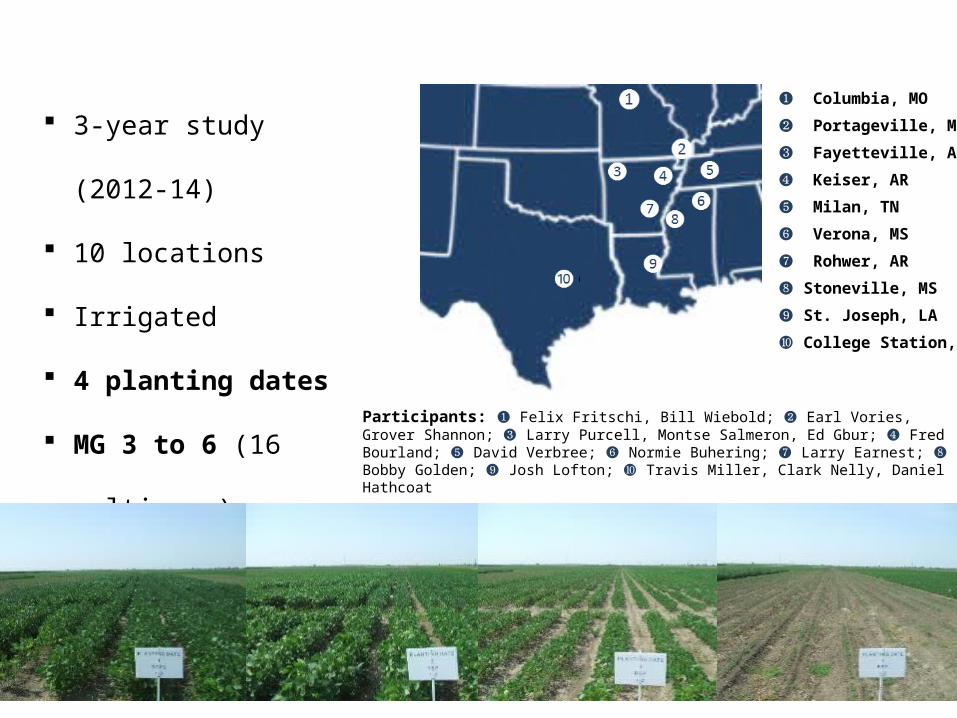
3-year study (2012-14)
10 locations
Irrigated
4 planting dates
MG 3 to 6 (16 cultivars)
( > 6000 plots)
Soybean regional PD x MG study
❶ Columbia, MO
❷ Portageville, MO
❸ Fayetteville, AR
❹ Keiser, AR
❺ Milan, TN
❻ Verona, MS
❼ Rohwer, AR
❽ Stoneville, MS
❾ St. Joseph, LA
❿ College Station, TX
Participants: ❶ Felix Fritschi, Bill Wiebold; ❷ Earl Vories, Grover Shannon; ❸ Larry Purcell, Montse Salmeron, Ed Gbur; ❹ Fred Bourland; ❺ David Verbree; ❻ Normie Buhering; ❼ Larry Earnest; ❽ Bobby Golden; ❾ Josh Lofton; ❿ Travis Miller, Clark Nelly, Daniel Hathcoat
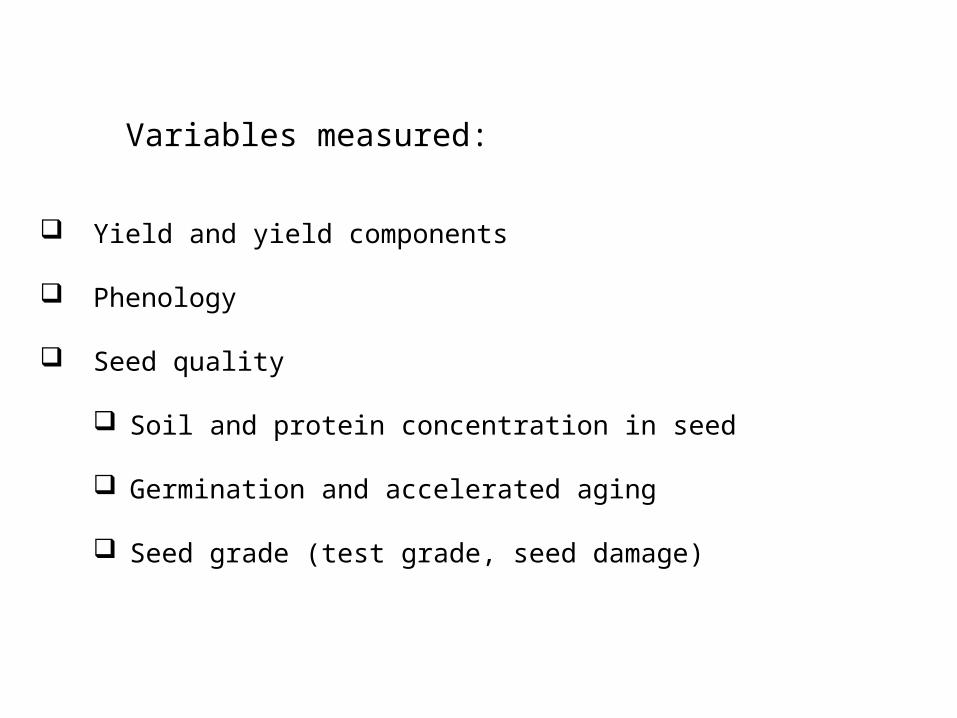
Variables measured:
Yield and yield components
Phenology
Seed quality
Soil and protein concentration in seed
Germination and accelerated aging
Seed grade (test grade, seed damage)
Soybean regional PD x MG study
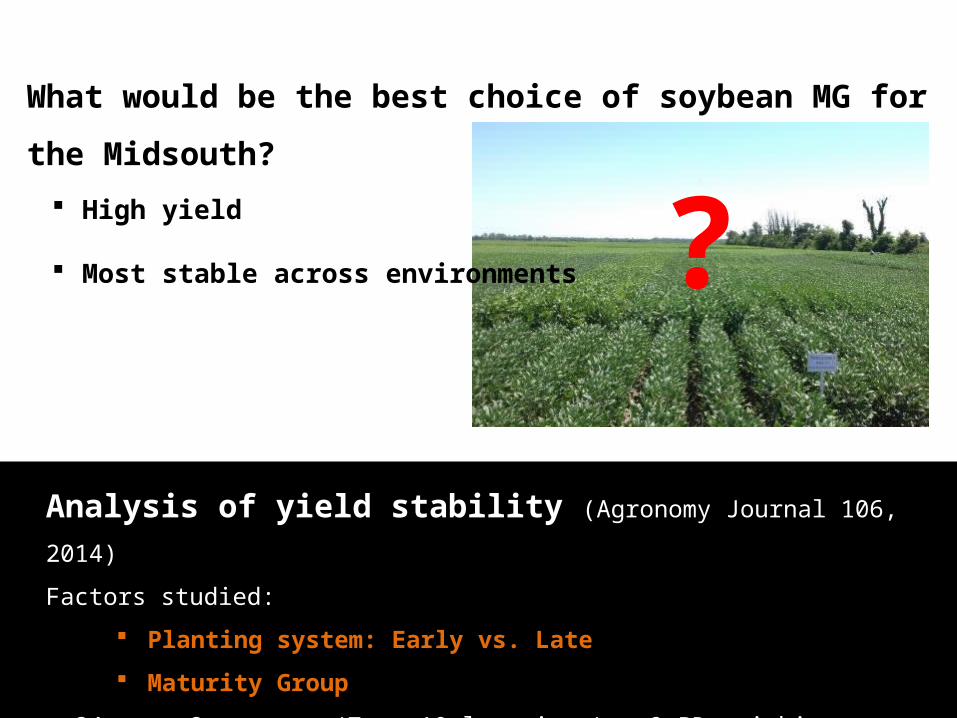
What would be the best choice of soybean MG for the Midsouth?
High yield
Most stable across environments
Soybean regional PD x MG study
Analysis of yield stability (Agronomy Journal 106, 2014)
Factors studied:
Planting system: Early vs. Late
Maturity Group
n=34 env: 2 years x (7 to 10 locations) x 2 PDs within planting system
?
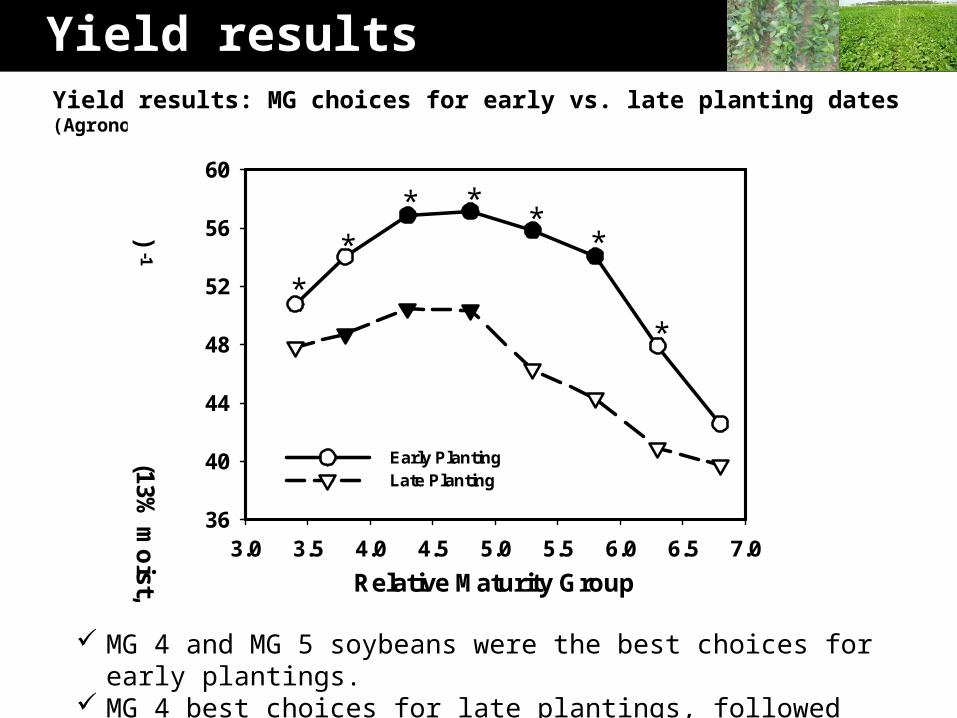
Yield resultsYield results: MG choices for early vs. late planting dates (Agronomy Journal 106, 2014)
MG 4 and MG 5 soybeans were the best choices for early plantings. MG 4 best choices for late plantings, followed by MG 3 soybeans.
Relative Maturity Group
3.0 3.5 4.0 4.5 5.0 5.5 6.0 6.5 7.0
Gro
up
effect at EI=
0(13%
mo
ist, bu
ac-1
)
36
40
44
48
52
56
60
Early PlantingLate Planting
Relative maturity group
3.0 3.5 4.0 4.5 5.0 5.5 6.0 6.5 7.0
En
viron
men
ts in
top
of ran
king
(%)
0
20
40
60
80
100
120EarlyPlantingLate Planting*
*
* **
*
*
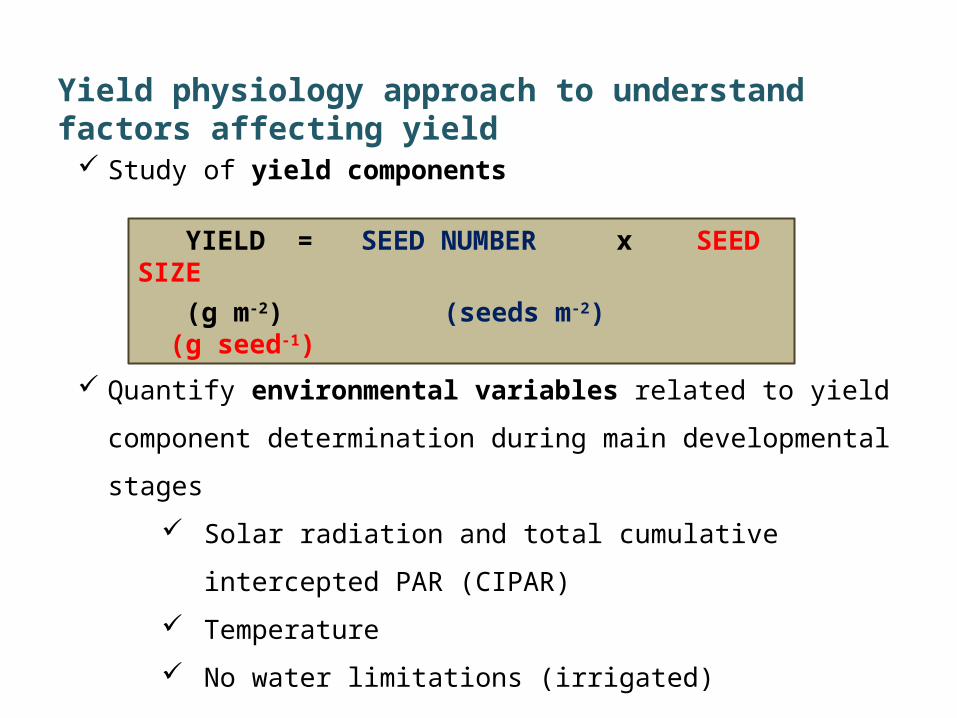
Yield physiology approach to understand factors affecting yield
Study of yield components
Quantify environmental variables related to yield component
determination during main developmental stages
Solar radiation and total cumulative intercepted PAR (CIPAR)
Temperature
No water limitations (irrigated)
Soybean regional PD x MG study
YIELD = SEED NUMBER x SEED SIZE (g m-2) (seeds m-2) (g seed-1)
Relative Maturity Group
3.0 3.5 4.0 4.5 5.0 5.5 6.0 6.5
Days after p
lantin
g
20
25
30
35
40
45
50
55
Early PDLate PD
Relative Maturity Group
3.0 3.5 4.0 4.5 5.0 5.5 6.0 6.5
Early PDLate PD
Relative Maturity Group
3.0 3.5 4.0 4.5 5.0 5.5 6.0 6.5
Early PDLate PD
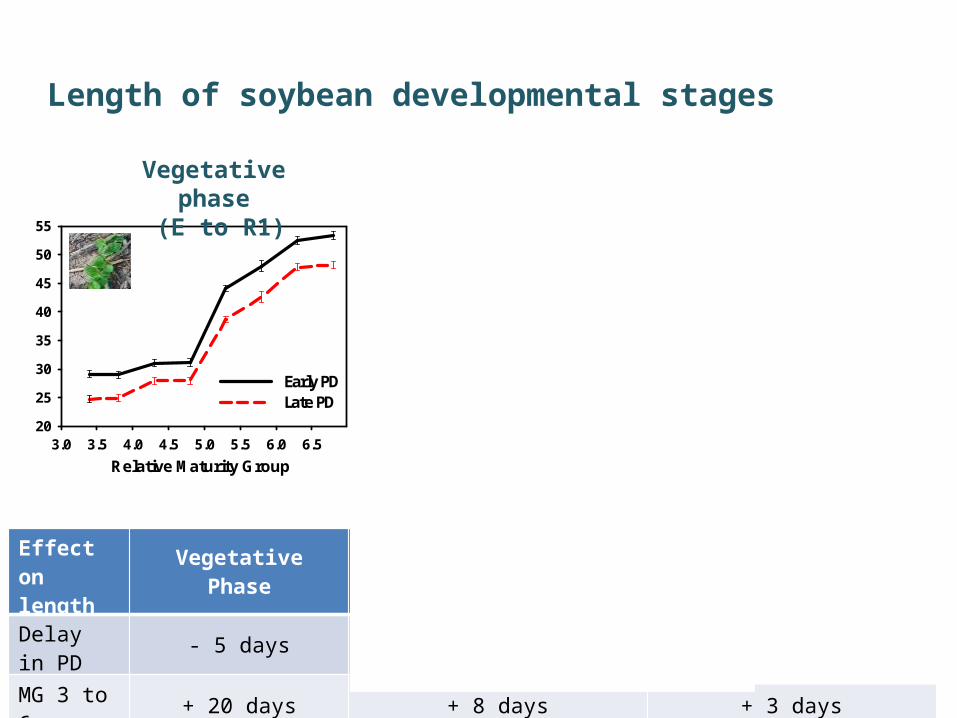
Length of soybean developmental stages
Soybean regional PD x MG study
Effect on length Vegetative Phase Flowering phase Seed filling phase
Delay in PD - 5 days - 5 days - 7 days
MG 3 to 6 + 20 days + 8 days + 3 days
Vegetative phase (E to R1)
Flowering phase (R1 to R5)
Seed-fill phase (R5 to R7)
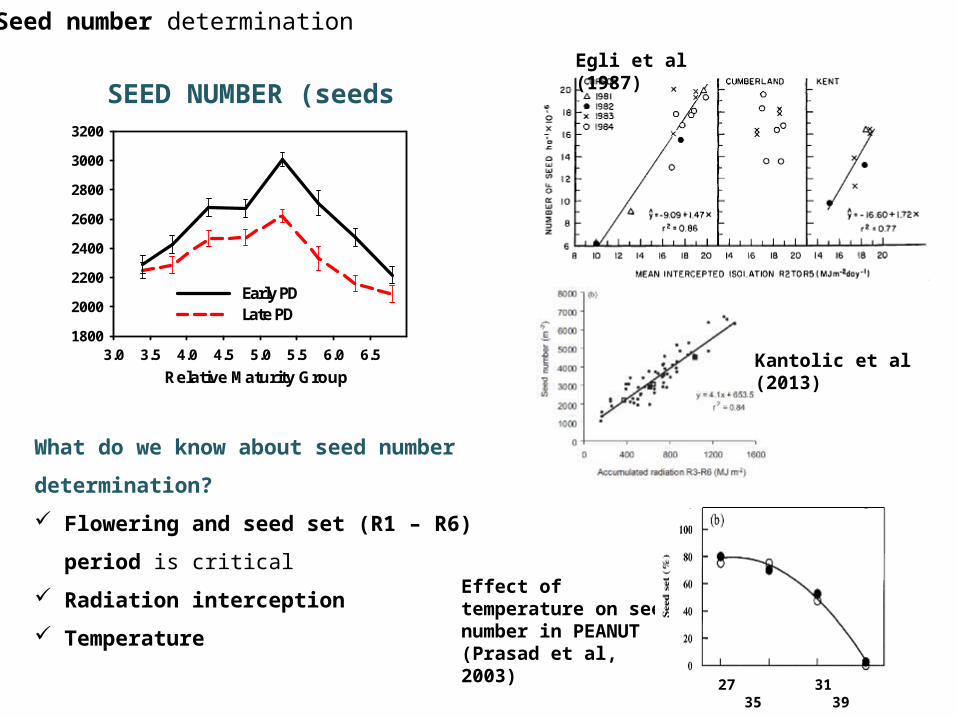
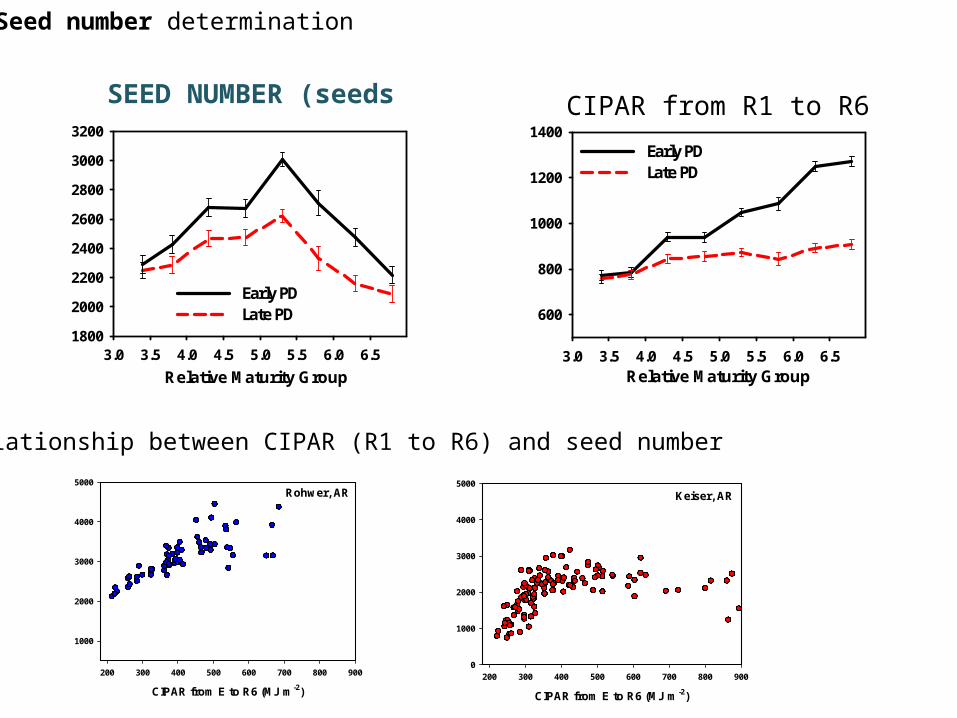
What do we know about seed number determination?
Flowering and seed set (R1 – R6) period is critical
Radiation interception
Temperature
Seed number determination
SEED NUMBER (seeds m-2)Egli et al (1987)
Kantolic et al (2013)Relative Maturity Group
3.0 3.5 4.0 4.5 5.0 5.5 6.0 6.5
Seed
nu
mb
er (seeds m
-2)
1800
2000
2200
2400
2600
2800
3000
3200
Early PDLate PD
Effect of temperature on seed number in PEANUT (Prasad et al, 2003)
27 31 35 39
Seed number determination
SEED NUMBER (seeds m-2)
Relative Maturity Group
3.0 3.5 4.0 4.5 5.0 5.5 6.0 6.5
Seed
nu
mb
er (seeds m
-2)
1800
2000
2200
2400
2600
2800
3000
3200
Early PDLate PD
Rohwer, AR
CIPAR from E to R6 (MJ m-2)
200 300 400 500 600 700 800 900
Seed
nu
mb
er (seeds m
-2)
1000
2000
3000
4000
5000
Relative Maturity Group3.0 3.5 4.0 4.5 5.0 5.5 6.0 6.5
CIP
AR
(MJ m
-2)
600
800
1000
1200
1400Early PDLate PD
CIPAR from R1 to R6
Keiser, AR
CIPAR from E to R6 (MJ m-2)
200 300 400 500 600 700 800 900
Seed
nu
mb
er (seeds m
-2)
0
1000
2000
3000
4000
5000
Relationship between CIPAR (R1 to R6) and seed number
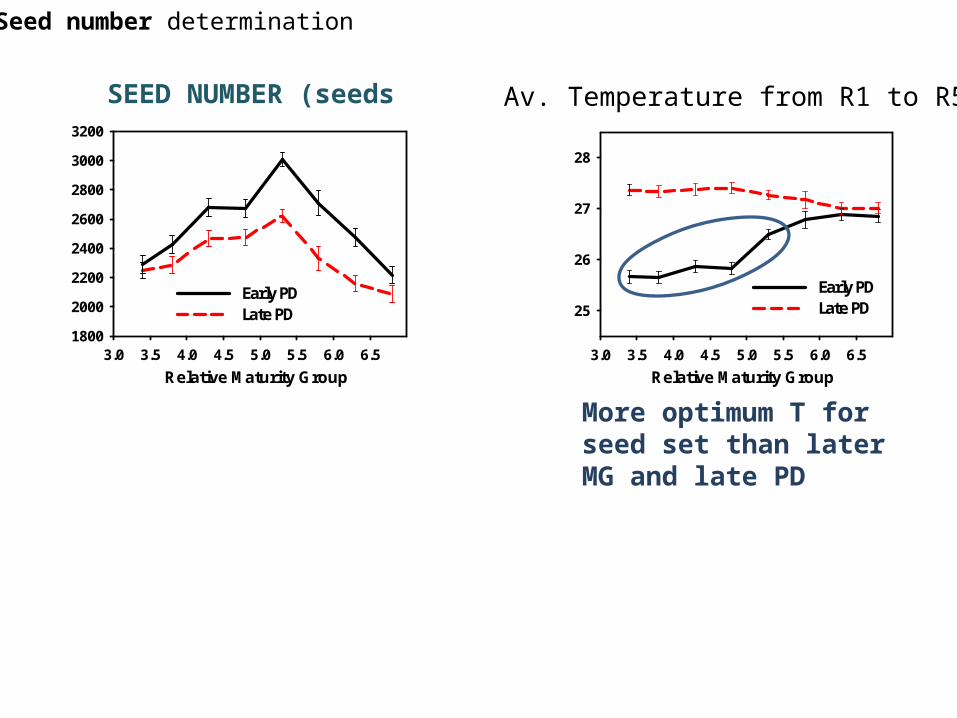
Seed number determination
SEED NUMBER (seeds m-2)
Relative Maturity Group
3.0 3.5 4.0 4.5 5.0 5.5 6.0 6.5
Seed
nu
mb
er (seeds m
-2)
1800
2000
2200
2400
2600
2800
3000
3200
Early PDLate PD
Av. Temperature from R1 to R5
Relative Maturity Group
3.0 3.5 4.0 4.5 5.0 5.5 6.0 6.5
T fro
m R
1 to R
5 (°C)
25
26
27
28
Early PDLate PD
More optimum T for seed set than later MG and late PD
Relative Maturity Group
3.0 3.5 4.0 4.5 5.0 5.5 6.0 6.5
Seed
weig
ht (g
100 seeds
-1)
0.11
0.12
0.13
0.14
0.15
0.16
Early PDLate PD
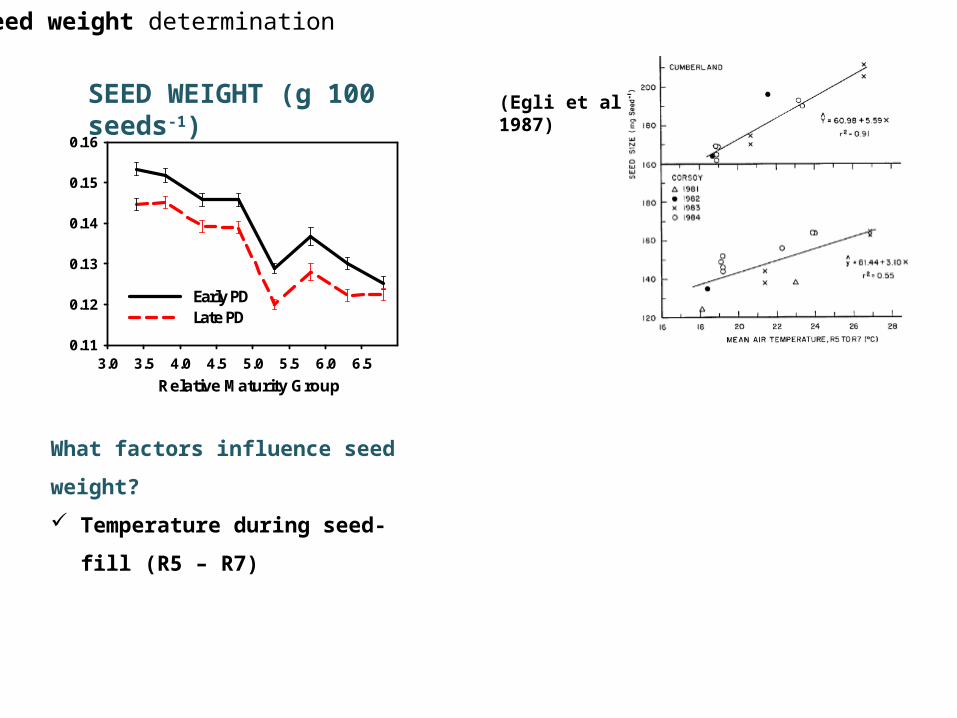
Seed weight determination
(Egli et al, 1987)SEED WEIGHT (g 100 seeds-1)
What factors influence seed weight?
Temperature during seed-fill (R5 – R7)
Relative Maturity Group
3.0 3.5 4.0 4.5 5.0 5.5 6.0 6.5
Seed
weig
ht (g
100 seeds
-1)
0.11
0.12
0.13
0.14
0.15
0.16
Early PDLate PD
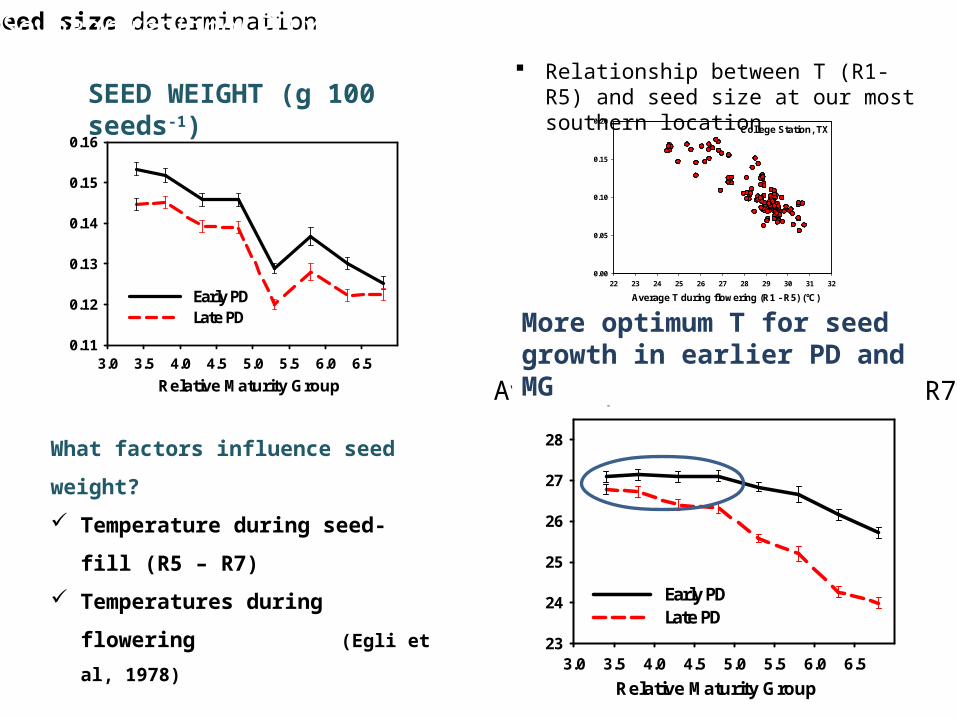
Seed size determination
(Egli et al, 1987)
Soybean regional PD x MG study
SEED WEIGHT (g 100 seeds-1)
What factors influence seed weight?
Temperature during seed-fill (R5 – R7)
Temperatures during flowering
(Egli et al, 1978)
Relative Maturity Group
3.0 3.5 4.0 4.5 5.0 5.5 6.0 6.5
T fro
m R
5 to R
7 (°C)
23
24
25
26
27
28
Early PDLate PD
Av. Temperature from R5 to R7
More optimum T for seed growth in earlier PD and MG
College Station, TX
Average T during flowering (R1 - R5) (°C)
22 23 24 25 26 27 28 29 30 31 32
Seed
weig
ht (g
100 seeds
-1)
0.00
0.05
0.10
0.15
0.20
Relationship between T (R1- R5) and seed size at our most southern location
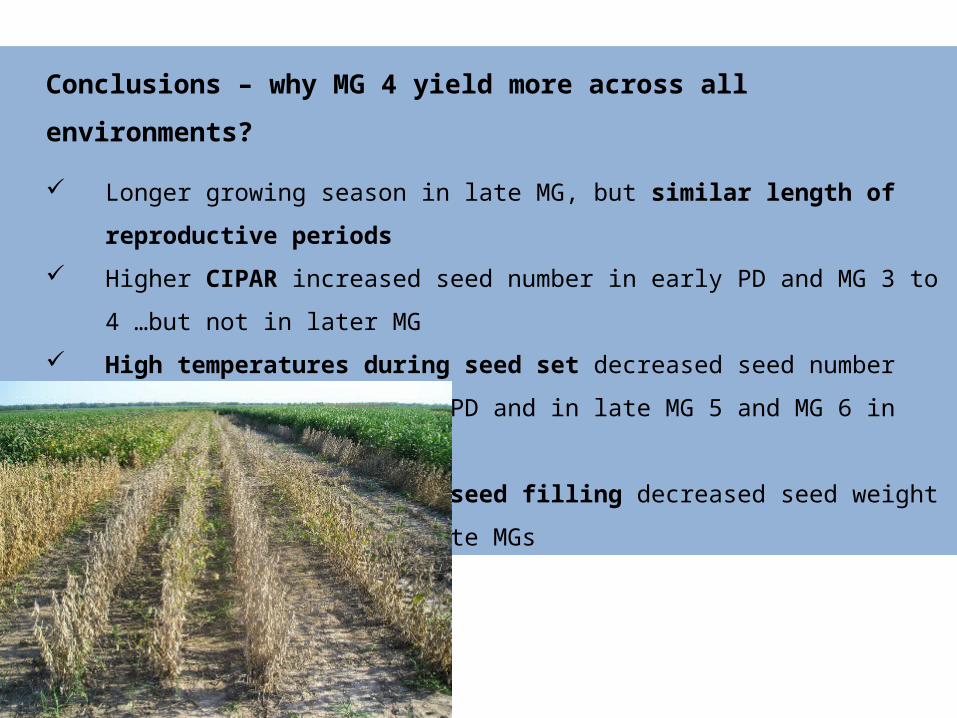
Conclusions – why MG 4 yield more across all environments?
Longer growing season in late MG, but similar length of reproductive periods
Higher CIPAR increased seed number in early PD and MG 3 to 4 …but not in later MG
High temperatures during seed set decreased seed number (and seed size) in late PD
and in late MG 5 and MG 6 in early PD
Low temperatures during seed filling decreased seed weight in late plantings and late
MGs
Soybean regional PD x MG study
Developing a decision-support tool
How does CropGro predict phenology and yield?
• Equations describe how a crop develops in response to temperature, light intensity, photoperiod, soil type, and soil moisture.
• Cultivars (or MG) have different coefficients that change the rate of development and duration of growth stages.
• When the model has not been used in particular locations or conditions, the coefficients may need to be ‘calibrated’.
• We are using the first two years of data to calibrate the model and the last year to validate, or confirm, that the model is working well.
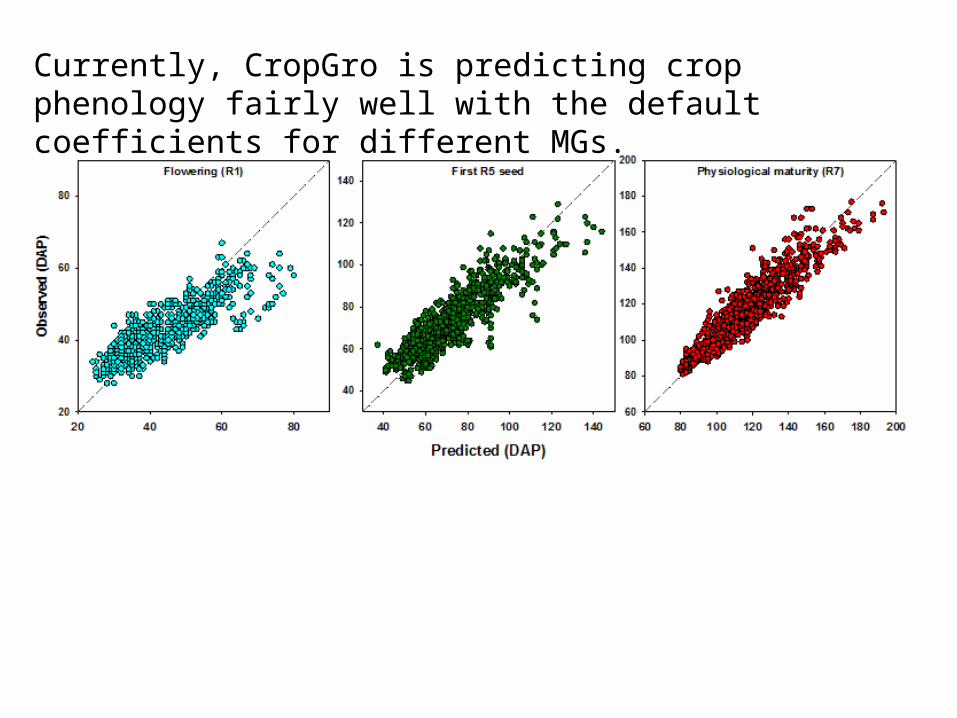
Currently, CropGro is predicting crop phenology fairly well with the default coefficients for different MGs.
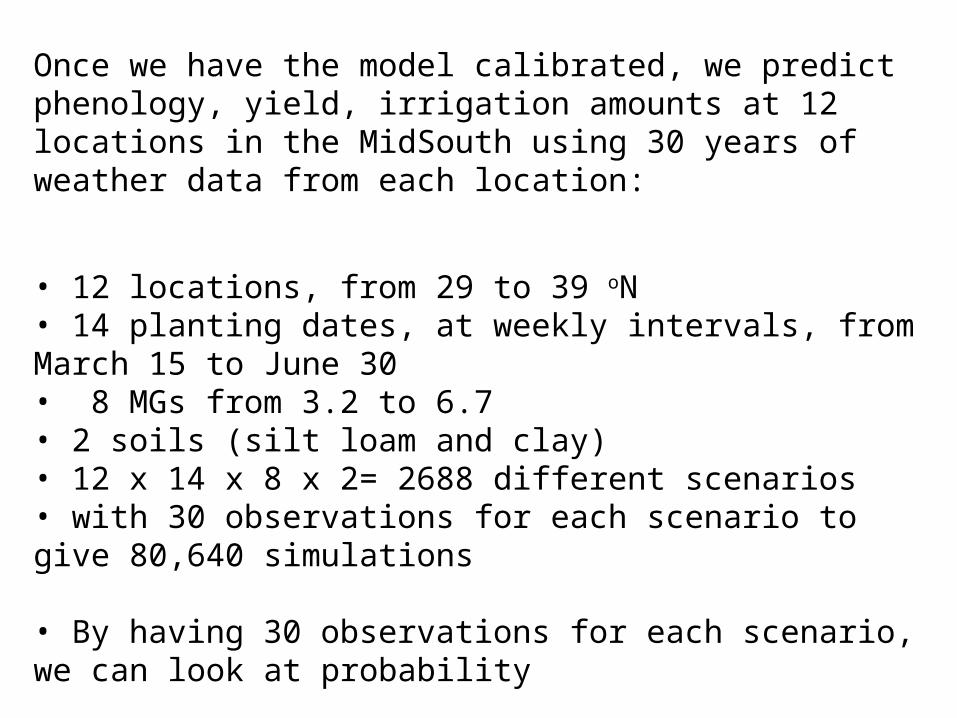
Once we have the model calibrated, we predict phenology, yield, irrigation amounts at 12 locations in the MidSouth using 30 years of weather data from each location:
• 12 locations, from 29 to 39 oN• 14 planting dates, at weekly intervals, from March 15 to June 30• 8 MGs from 3.2 to 6.7• 2 soils (silt loam and clay)• 12 x 14 x 8 x 2= 2688 different scenarios • with 30 observations for each scenario to give 80,640 simulations
• By having 30 observations for each scenario, we can look at probability